AnnualReport - Q-Free
90
20 10 AnnualReport We are a leading global supplier of solutions and products for Road User Charging and Traffic Management.
-
Upload
khangminh22 -
Category
Documents
-
view
0 -
download
0
Transcript of AnnualReport - Q-Free

2010AnnualReport
We are a leading global supplier of solutions and products for Road User Charging and Traffic Management.

w
Part 1. Introduction 4Q-Free worldwide / 5Key figures / 6History / 7The CEO’s corner / 8Management team / 9
Part 2. Business review 111. Market drivers and trends / 122. RUC technologies and their deployment / 123. Strategy and positioning going forward / 134. Q-Free’s offering / 145. Market development during 2010 / 156. Outlook / 16
Part 3. Governance 17Corporate governance / 18Presentation of The Board of Directors / 22
Part 4.Reporting 28The Board of Directors Report / 29The Board of Directors / 33Statement from the Directors and the CEO / 35Annual accounts / 36Auditor’s report / 87Abbreviations / 89
/ Content2Q-Free Annual Report 2010

2010we
deliver high quality
solutions and products
3we offer solutions and products based on state of the art technology.

IntroductIon
we contributed to Europe’s
first nationwide
tolling system
4Q-Free Annual Report 2010

w
5Q-Free Annual Report 2010 Introduction
/ Q-Free worldwide
Norway
Sweden Thailand
Slovakia
Chile
Brazil
United States
Portugal
The Netherlands
Spain
South Africa
France
Greece Turkey
Indonesia
Australia
Malaysia

Profit & Loss Account
2006 2007 2008 2009 2010
Operating revenues 386 942 410 854 509 246 804 403 568 044
Cost of goods sold 154 104 160 981 219 978 303 249 268 233
Operating expenses 186 450 212 021 224 034 365 769 329 231
EBITDA 46 387 37 852 65 233 135 205 -29 420
EBIT 29 373 20 875 44 283 102 743 -90 373
PROFIT BEFORE TAX 45 024 14 555 50 915 109 698 -79 593
PROFIT AFTER TAX 33 868 5 015 36 287 78 150 -56 848
Gross margin % 60.2% 60.8% 56.8% 62.3% 52.8%
EBITDA % 12.0% 9.2% 12.8% 16.8% -5.2%
EBIT % 7.6% 5.1% 8.7% 12.8% -15.9%
Selected Balance Sheet Items
Intangible fixed assets 23 288 40 320 128 017 155 860 186 897
Tangible fixed assets 45 274 53 406 63 938 71 874 63 261
Cash 162 174 124 283 119 617 274 615 85 724
Total assets 426 395 393 055 514 425 767 534 687 715
Equity (incl minority ) 295 505 300 596 351 663 548 601 499 418
Interest bearing debts 3 392 2 992 2 202 1 412 622
Key Figures per Share
Earnings per share. ordinary 0.65 0.03 0.60 1.41 -0.94
Earnings per share. diluted 0.62 0.03 0.60 1.39 -0.93
Cashflow 0.35 -0.24 1.47 2.01 -2.01
Book equity 5.71 5.75 6.52 9.88 8.29
Average no of shares 51 779 52 274 53 976 55 536 61 640
Other Key Figures
Order backlog 293 573 371 356 338 868 713 039 575 132
Return on Invested Capital (ROIC) in % 7.9 1.3 7.1 10.2 -8.3
Net interest bearing debts 3 392 2 992 2 202 1 412 622
Cash flow from operations 18 354 -12 718 79 172 111 852 -123 309
Operational investments 14 951 25 164 78 398 71 075 66 996
Equity ratio 69% 76% 68% 71% 73%
Gearing 0.8% 0.8% 0.4% 0.2% 0.1%
Number of employees 188 198 232 282 282
/ Key Figures– as at 31 December 2010 –
Figures in tnOK
6Q-Free Annual Report 2010 Introduction

The history of Q-Free is a history of customer oriented innovation. From the start of the company, focus has been on developing advanced technology optimising our customers’ profitability. The world’s first implementation of a full-speed non-stop electronic toll collection system was deployed at Ranheim (Trondheim, Norway) as a result of a R&D program car-ried out from 1986 to 1988. When the Ranheim Toll station opened in 1988, the technology was groundbreaking, offering the motorist to pass and pay at up to 160 km per hour using OBUs with expected lifespan of 45 years. No technology at that time could offer performance match-ing the Q-Free system and the cost of the equipment was 25 to 50 % of the cost presented by other systems existing at that time.
The early success of the Q-Free sys-tem at Ranheim Toll Station was further expanded to the large toll collection systems deployed in Oslo in 1990 and Trondheim in 1991. Both these projects turned out to become great commer-cial successes for the owner of the sys-tem, creating a financial basis for a rapid road development and public transport improvement in the two cities.
In 1991, the first international project also appeared at the scene when Brisa (Portu-gal) ordered the first electronic toll collec-tion system at Carcavelos toll plaza, later to be expanded to include also the other toll plazas surrounding Lisbon, Loures, Sacavem and 25th of April Bridge.
With the systems operational in Oslo, Trondheim and Lisbon, Q-Free had proven its ability to design, implement and oper-ate complex and large scale information systems for the purpose of fee collection.
Thus, when Brisa chose their technology partner for the deployment of Europe’s first nationwide toll collection system based on the new standardised frequency 5.8 GHz in 1994, Q-Free became their choice. The system was set into operation early 1995, and the same system is still in operation.
In 1997, The European Committee for Standardisation (CEN) decided on the so-called TC278 family of standards for Dedicated Short Range Communication (DSRC). Q-Free followed suit and in Jan-uary 1998, the World’s first commercial system based on this standard was deliv-ered by Q-Free to the Austrian Ökopunkte system and later on to Switzerland’s LSVA truck tolling system.
1999 became the year of commercial boost. The TC278 standards had facili-tated a rapid growth in system designs for road toll collection and in the autumn of 1999, Q-Free won the contract for the development and implementation of large scale toll collection systems in Brazil, Aus-tralia and Norway. Q-Free also confirmed its leading position through winning the Dutch Rekeningrijden contract in a tough technology contest. This project was the most advanced study of a MLFF system at that time.
In 2002, Q-Free was listed on the Oslo Stock Exchange. Transforming from a technology company owned by a few founding partners, Q-Free is today still a publicly listed company with more than a thousand shareholders.
2004 became yet another milestone for Q-Free. Through winning the contract for the roadside system and OBUs to the Stockholm Congestion Tax System, Q-Free reconfirmed the company’s lead-
ing role, not only in DSRC but also in Auto-matic License Plate Recognition (ALPR). Due to the local legislation, ALPR became eventually the only technology used for identification. The ALPR system delivered by Q-Free probably offers the best per-formance of any such system currently in operation worldwide. The Stockholm Congestion Tax System is the world’s only ALPR solution where the clients’ accounts are charged automatically solely on the basis of machine read images.
In 2005 the business of automatic fare collection (ticketing) was demerged from Q-Free forming a new public listed com-pany– Fara ASA. Q-Free held shares in this company ASA until 2007.
In 2008, Q-Free confirmed its intention to be a technology neutral solution provider. The acquisition of the companies Dacolian (ALPR SW engines) and Building Capital (GNSS based toll collection solutions) rep-resent important steps in this direction.
In 2009, Q-Free achieved record high order intake and revenues. Through the award of the two biggest contracts in the industry since 2005, the Slovakia truck tolling project and the AENOR MultiLane Free Flow project in Portugal, Q-Free has further strengthened its market position.
7 / History– FrOm 1984 tO 2010 –
Q-Free Annual Report 2010 Introduction

My ambition is to establish
Q-Free as the indisputable world
leading supplier of Intelligent
Transport Systems for Road User
Charging (RUC) and Traffic
Management.
CEO’s Corner
8
Q-Free is one of very few players in the Road User Charging (RUC) market who can deliver high quality solutions and products. Q-Free is one of the few com-panies who can back up this statement with references. Macro drivers, like the need for financing to build and maintain road infrastructure and need for conges-tion management are becoming more and more visible in all parts of the world. The RUC market is clearly set for consider-able growth for many decades to come. The industry is still in the early days, and it is all about positioning Q-Free for long term growth.
From the financial numbers it is obvious that 2010 was a challenging year. As previ-ously communicated 2010 was set to be a transition year, and as such a great finan-cial result was never expected. Having said that, the situation in Slovakia turned out to be more challenging than anticipated and thus causing major impact on the numbers for 2010. Changes in the contract were enforced by the client after the system went into to operation January 1st 2010, implying that the company was not paid according to the contract. The system we deployed is still in operation, and did col-lect 140M€ during 2010 without Q-Free maintaining the system.
This aside, we also have had some great achievement in 2010.
– We did start the truck tolling system in Slovakia as planned January 1st after a record short implementation time and under extreme conditions, we successfully implemented two new tolling systems in Portugal as planned, we signed our big-gest product contract ever in Brazil, we had a break through in Chile and for the last months of 2010 and the start of 2011 we have received orders and frame agree-ments worth more than 600 MNOK.
For obvious reasons, and despite of the long term growth plans, we initiated actions in the last quarters of 2010 to reduce the cost base in the company and hence reduce the financial risk in the near future. We have put on hold some of the planned development activity, scaled down some operational activities in selected countries and generally improved cost efficiency in the company. Depending on how things develop in 2011 we may reconsider some of the above actions, but first and fore-most the goal for 2011 is to re-establish acceptable financial results and cash flow. It is however important to emphasize that the company still has many important on-going activities, both when it comes to new portfolio under development and targeted market activities, which will strengthen our market position during 2011.
Taken into consideration the global market trends, Q-Free’s position and not at least
the spirit in the company, I am convinced that we will experience a long term posi-tive development. During 2011 we will be “back on track”, – the awards in Portugal and South Africa represent an important start in this respect.
The vision of Q-Free is to be a globally preferred partner in the area of Intelligent Transport Systems, having world-wide leadership in Road User Charging and Traffic Management. This is a bold vision, but achievable if we do the right things long enough. Short term challenges do not stop us believing, in and working hard, towards achieving this goal.
Thanks to all clients, employees and partners for your strong commitment to Q-Free.
Dr. Øyvind Isaksen
President & CEO(sign.)
Q-Free Annual Report 2010Introduction
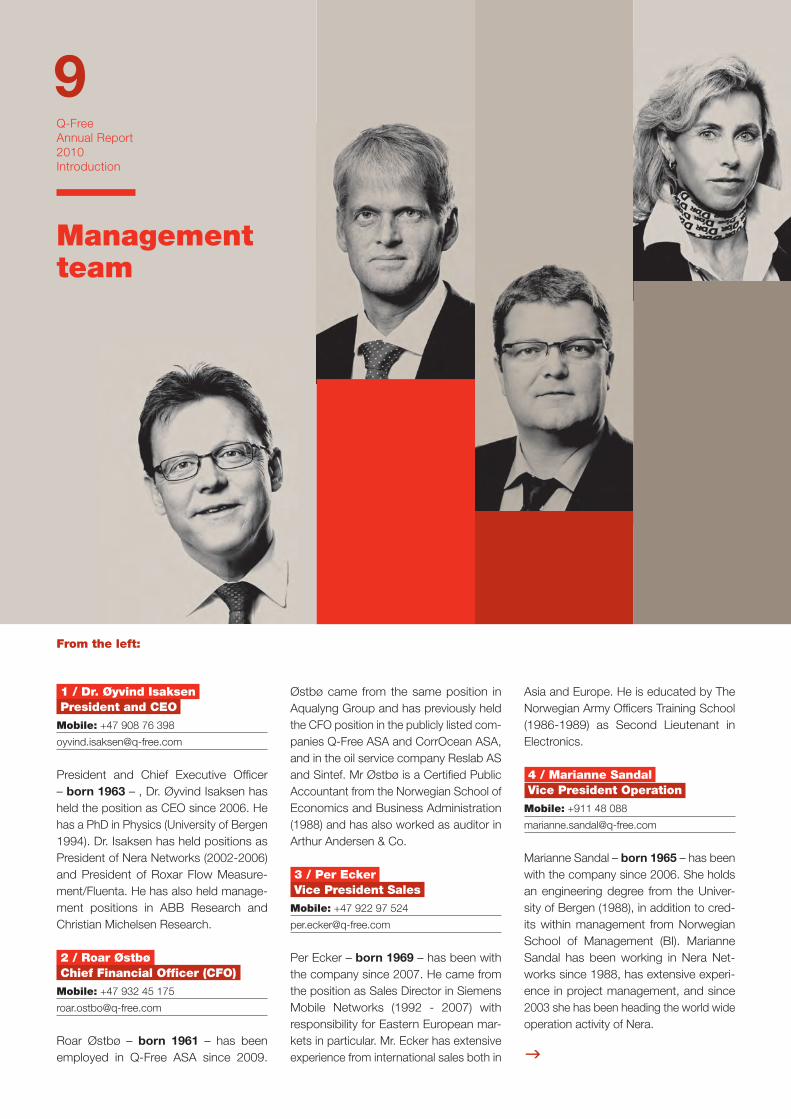
1 / Dr. Øyvind Isaksen
President and CEO
Mobile: +47 908 76 398
President and Chief Executive Officer – born 1963 – , Dr. Øyvind Isaksen has held the position as CEO since 2006. He has a PhD in Physics (University of Bergen 1994). Dr. Isaksen has held positions as President of Nera Networks (2002-2006) and President of Roxar Flow Measure-ment/Fluenta. He has also held manage-ment positions in ABB Research and Christian Michelsen Research.
2 / Roar Østbø
Chief Financial Officer (CFO)
Mobile: +47 932 45 175
Roar Østbø – born 1961 – has been employed in Q-Free ASA since 2009.
Østbø came from the same position in Aqualyng Group and has previously held the CFO position in the publicly listed com-panies Q-Free ASA and CorrOcean ASA, and in the oil service company Reslab AS and Sintef. Mr Østbø is a Certified Public Accountant from the Norwegian School of Economics and Business Administration (1988) and has also worked as auditor in Arthur Andersen & Co.
3 / Per Ecker
Vice President Sales
Mobile: +47 922 97 524
Per Ecker – born 1969 – has been with the company since 2007. He came from the position as Sales Director in Siemens Mobile Networks (1992 - 2007) with responsibility for Eastern European mar-kets in particular. Mr. Ecker has extensive experience from international sales both in
Asia and Europe. He is educated by The Norwegian Army Officers Training School (1986-1989) as Second Lieutenant in Electronics.
4 / Marianne Sandal
Vice President Operation
Mobile: +911 48 088
Marianne Sandal – born 1965 – has been with the company since 2006. She holds an engineering degree from the Univer-sity of Bergen (1988), in addition to cred-its within management from Norwegian School of Management (BI). Marianne Sandal has been working in Nera Net-works since 1988, has extensive experi-ence in project management, and since 2003 she has been heading the world wide operation activity of Nera.
Management team
From the left:
9Q-Free Annual Report 2010Introduction

5 / Dr. Jos A.G. Nijhuis
Vice President R&D
Mobile: 31 (0) 629038031
Dr. Jos Nijhuis – born 1965 – has been employed since 2008. Nijhuis holds a M.Sc. (with honors) in Electrical Engineer-ing 1987; and a Ph.D. in Natural Sciences from Nijmegen University in 1992. Nijhuis has extensive experience in ITS software development from various positions within academia and industry. Nijhuis is also the CEO and co-founder of Dacolian B.V.
6 / Henrik F. Stoltenberg
Vice President BD and M&A
Mobile: +45 28 98 89 95
Vice President Business Development & M&A Henrik F. Stoltenberg – born 1960 – came from the position as Group Executive
Vice President, responsible for the daily operation of JAI Group (Denmark), and with focus on implementing the corporate strategy. Mr. Henrik F. Stoltenberg holds a HD Degree from Business School Copen-hagen. He has been Chief Financial Officer and member of the management team in JAI since 2006.
Henrik F. Stoltenberg has previously also been finance director at Merkantildata A/S in Denmark and Bruhn A/S.
7 / Stein-Tore Nybrodahl
Human Resource Manager
Mobile: +47 906 94 689
Stein-Tore Nybrodahl – born 1965 – is Q-Free’s Human Resource Manager and started with the company in 2006. He holds a Master’s degree in Business (Copenhagen Business School, Denmark,
1992) and successfully completed the sen-ior executive program INSEAD in France (1993). He has extensive HR and strategy experience having held various senior management roles at Telenor (Norway), where he became director of strategy and HR development. At Q-Free, Mr. Nybro-dahl is responsible for the management and development of human resources.
8 / Steinar Furan
Advisor to CEO
Mobile: +47 905 59 403
Steinar Furan – born 1963 – has been employed since 1990 and holds an engi-neering degree in electronics (Trondheim Ingeniørhøyskole 1984 and University of Tromsø 1987). He has extensive experi-ence in various senior positions within the company.
From the left:
10Q-Free Annual Report 2010Introduction

we can back up our
promises with
references
BusInesss revIews 11
Q-Free Annual Report 2010

1 / Market drivers and trends
Q-Free operates mainly in the market of Road User Charging (RUC). Through acqui-sitions the last couple of years the group has intensified its activity within Traffic Man-agement, delivering software components for law enforcement, parking/access control and travel time systems through selected partners.
The market for RUC solutions is still at an early stage and it is expected that more countries will implement RUC systems for various applications and that the penetra-tion in existing markets will increase.
When a market has adopted a RUC tech-nology, the growth phase is expected to last for many years. Throughout 2010 the sales pipeline has developed positively and many important contracts have been awarded.
The most important market drivers for RUC solutions can be segmented as:
1. Financing of Infrastructure
2. Truck Tolling
3. Efficiency of existing RUC Solutions
4. Congestion Charging
5. Other RUC Solutions
6. Traffic Management
1. Financing of Infrastructure
Financing of infrastructure is a strong driver since private equity through govern-
ment concession or private public partner-ship contracts are increasingly involved to finance, build and operate roads, bridges and other major infrastructure. Private equity gets return on investments through RUC projects. There is not sufficient public funds available to implement all needed infrastructure.
2. Truck Tolling
Truck Tolling has been extensively used in Germany for a number of years, and truck tolling schemes have also been rolled out in the Austria, Czech Republic and Slova-kia. All these truck tolling systems have proven to be viable and it is expected that the truck tolling market will constitute a considerable share of the market for road user charging in Europe going forward.
3. Efficiency of existing RUC Solutions
There is a large efficiency potential to convert existing manual operated tolling schemes to fully electronic (automated) RUC systems. This process has already started and operators both in Europe, Asia and the Americas are in the process of upgrading their existing solutions to mod-ern electronic solutions, – often called MultiLane Free Flow or Open Road Toll-ing. This conversion will take time, but the trend is clear.
4. Congestion Charging
Stockholm is still the outstanding refer-ence for congestion charging, clearly demonstrating the concept’s capacity to change travellers’ behaviour and thereby contribute to a significant improvement of the city’s environment and the citizens’ quality of life. Stockholm has reduced traffic in the city centre by 20-25%, and travel time during rush hours is reduced by 30-50% (www.stockholmsforsoket.se).
The congestion charging market potential is huge, but will take longer time to mate-rialise compared to the above mentioned application areas. Several initiatives to implement congestion charging are on-going. It is expected that this segment will develop somewhat slowly due to the politi-cal sensitivity, but no doubt it will represent a huge market for Q-Free.
5. Other RUC Solutions
In addition to the above mentioned market drivers, 2010 has shown that new markets are starting to be visible in the area of road taxation, - namely Electronic Registration
and Identification (ERI). A new regulation has been formalised for European coun-tries and will probably set the standard in this market segment. Regulators in several countries are now in the starting phase of developing projects to implement electronic number plates to regulate and enforce annual taxation and security on the roads in a better way. This represents a huge market potential since it implies that all cars will be equipped with a tag identification, in addition to the need for road side infrastructure and central sys-tems.
6. Traffic Management
Traffic Management in general is a growing market. Technologies like measurement of travel time to give data for traffic plan-ning and average speed measurement are examples of applications that seem to become increasingly popular. Q-Free has for many years supplied technology for applications such as travel time meas-urements and traffic planning based on DSRC technology. With the acquisition of Dacolian, thereby being able to offer also automatic license plate recognition technology (ALPR), Q-Free takes a more firm grip on the market segment of Traffic Management.
2 / Road User Charging (RUC) technologies and their deployment
The RUC market is segmented globally by its use of RUC technology. The main tech-nologies employed are DSRC, RFID, GNSS, ALPR and MTC. The following offers an overall description of the different technolo-gies and their spread geographically.
1) DSRC
Dedicated Short Range Communication
DSRC is a technology that follows Euro-pean CEN and ETSI standards dedicated for RUC purposes. The cars communicate with the charging point through an OBU installed on the windshield of the vehicle. The CEN DSRC is a microwave commu-nication link and the OBU has process-ing capabilities for communication and security. DSRC based systems are widely used and successfully implemented in large scale in Europe, Australia, and Latin America.
2) RFID
Radio Frequency Identification
RFID is similar to the CEN DSRC solution
Businessreview
12Q-Free Annual Report 2010 Business review

Q-Free has taken a leading role in defin-ing the CALM standards. However com-mercial products based on CALM are still some years ahead.
3 / Strategy and positioning going forward
The vision of Q-Free is to be a globally preferred partner in the area of Intelligent Transport Systems having world-wide leadership in Road User Charging and Traffic Management.
Our objectives related to ITS, and Traffic Management in specific, are based on the belief that the Traffic Management and the RUC market will converge. One important driver for this to happen is the development of standards and technology enabling car-to-car communication and car-to-infrastructure for enhanced road safety and environmental friendly transport. This convergence may imply that instead of building autonomous tolling and/or traf-fic management system, common infra-structure will be deployed and whether it is used for tolling, congestion charging, electronic licence plate enforcement, traf-fic management etc. will be determined on an application level. There is no doubt that this transition will take some time, but it
ally collection of the charge from the road user. Manually means that there are personnel in a toll booth that collects the charge, and semi manually means that the manual collection is supported by some technologies like classification equipment, coin machines and enforce-ments cameras. MTC has been in use for decades and is widely in use in markets that introduced RUC a long time ago as well as in emerging markets. MTC is cur-rently deployed in large scale in North and South America, Asia Pacific and East and South Europe.
The above described technologies are industrialised, and technology innovations are expected to be limited to improve-ments of price/ performance ratio.
The technology that Q-Free expects to become a universal RUC solution in the long term is the CALM (Communi-cation Access for Land Mobiles) stand-ard. CALM is the standardisation of ITS telematics protocols, procedures and management processes. Q-Free is one of the initiators of CALM. CALM will enable vehicle-to-vehicle communication and vehicle-to-roadside communication enabling safer and more environmental friendly transport as well as forming the basis for future RUC applications.
except that OBUs usually do not have pro-cessing power. Popularly said the DSRC OBU has active components and the RFID OBU has only passive components mean-ing that a RFID based OBU does not need an internal energy source such as a bat-tery. In some markets the RFID OBU is called a sticker tag. RFID is mainly used in some RUC systems in North America and in some countries in Latin America. Also RFID may seem as an attractive alterna-tive to DSRC for electronic licence plate applications.
3) GNSS
Global Navigation Satellite System
All systems based on GPS are classi-fied as GNSS. RUC systems based on GNSS require an OBU in the vehicle that positions the vehicle and by some other means (DSRC, GPRS) reports its position and movement to the RUC operator. The RUC market where the GNSS based sys-tem is being used is the RUC system for heavy goods vehicles, more specifically the German HGV system and in the Slo-vakia SkyToll system.
4) ALPR
Automatic License Plate Recognition
ALPR technology is based on digital video images of the vehicle’s number plate and software that automatically reads the vehi-cle’s licence number. ALPR based systems are used in some congestion charging sys-tems such as in Stockholm and London. ALPR is also used as enforcement meas-ures in RUC systems based on the above described technologies. As all electronic, fully automated tolling systems are being implemented, video based enforcement will be increasingly important.
5) MTC
Manual Toll Collection Systems
MTC is basically manually or semi manu-
Technolgy independent + Portfolio covering most wanted solutions (Tag – Camera – GPS)
Flexible with resepct to role + From product supplier to turn key provider+ Not compete with our customer such as operators and major
system integrators
Migrate to an its player + Q-Free will over time expand offering to include new ITS area+ E.G. Parking Access & Control Systems and ERI
Vision and strategic positioning
Q-FreeSegm
ent
Operators ConcessionarieTechnology providers
System integrators
A leading supplier of Intelligent Transport systems for Road User Charging and Traffic Management
13Q-Free Annual Report 2010 Business review

4 / Q-Free’s offering From product supply to turnkeysolutions
As mentioned above Q-Free will take responsibility for the supply of products/technology to deliver turn-key systems.
1) System/Turnkey solutions
Q-Free’s engineers have twenty-six years of experience in the design, build and operation of complex road user charg-ing systems. During this time, Q-Free has developed, built and maintained a broad range of different schemes, ranging from barrier controlled lanes to MultiLane Free Flow systems. The solutions designed by Q-Free’s engineers have also been utilis-ing all different types of vehicle classifica-tion known and a vast range of different payment methods. This means that our engineering staff is able to choose the right product mix for each implementa-tion, always keeping focus on the highest return on investment.
2) Back Office systems
A road user charging system can be seen as a system where the peripheral sensors and the control stations collect informa-tion and where the processing of the data collected takes place in a centrally con-trolled environment, often referred to as the back office system. Q-Free has since the early ‘90s delivered a large number of such systems to customers world-wide. Q-Free’s current base of back office sys-tems are found in Portugal, Slovakia, Nor-way, Australia, Thailand and Iceland. These solutions offer custom designed payment arrangements and support all known vari-eties of subscription schemes, such as prepaid, post-paid and different discount schemes. The back office systems of Q-Free currently handle approximately 3 million payment transactions every day.
3) Dedicated Short Range Communication (DSRC)
Q-Free was among the leading partners for the development of the CEN DSRC standards, securing common product interfaces for in vehicle equipment and roadside communications equipment. Q-Free has today a range of products supporting the CEN DSRC standards. During 2010, a new product family of CEN DSRC compatible OBUs and road-side communication equipment has been released. Q-Free offers complete system solutions based on DSRC.
is important for the company to be posi-tioned. This transition represents an major opportunity for Q-Free to take big steps from being a RUC company to become a broad ITS company supplying solu-tion platforms, and applications, both for advanced traffic management and road user charging. The company will continue to participate in the standardisation forums in this area and also carry out technology and demonstration/pilot activities to pre-pare ourselves for this transition.
However, the growth potential for Q-Free in the medium term is clearly dictated by the development of the RUC mar-ket, and hence the main focus in short and medium term will be to continuously strengthen Q-Free position in this area. This will be done by having world best and most cost efficient offering within all technologies normally deployed for RUC, by having global reach and by continu-ing to build an international organisation with the aim to achieve high customer satisfaction. Not many years ago Q-Free was mainly known for its excellence in the DSRC area, but has now step by step moved a long way towards being a technology independent supplier of RUC solution in a global market. This work will continue, both when it comes to expanding our offering and market reach, by means of organic development and through acquisitions.
The role of Q-Free in a supply contract may vary from being a product supplier to deliver a turn-key system to an operator/government. Q-Free will not explore an operator role, as we see these players as our potential clients. Having this strategy we will over time establish a healthy mix of recurring business, represented by prod-uct sales and service activity, and deploy-ment of infrastructure projects.
1
2
3a
3b
14Q-Free Annual Report 2010 Business review

respect to positioning the company for several important contract wins in 2011. The last months in 2010 and the start of 2011 have given us clear signs of this by being awarded in a few months, contracts and frame agreement worth more than 600 MNOK after Q3 2010. The market activity has been high in several coun-tries throughout the whole of 2010 and the market drivers mentioned in Section 1 has clearly become more visible dur-ing the year. The need for financing to maintain and deploy new infrastructure and means to control pollution/time ineffi-ciency caused by increasing traffic density are all macro drivers becoming increas-ingly visible. These are factors which will drive the RUC market for many decades, and 2010 has confirmed this by seeing an increased number of cases under devel-opment. Below follows a detailed look into the various regions;
Regional Market Updates
Europe/Middle East
In 2010, Europe represented 55% of Q-Free’s revenues as well as 54% of the Group’s order backlog at the end of the year, making it the Company’s largest market by far. The Group has during the year mainly focused on Portugal, France, Turkey, Sweden, Norway and parts of Central Europe.
Two contracts have been announced in the region during the year; - these are; - a 17 MNOK tag contract from Via Verde (Portugal) and a 29 MNOK contract related to service and changes of the congestion charging infrastructure in Stockholm.
The activity in Portugal has been high and has, early 2011, lead to important contract awards both with respect to infrastructure and tag supply. Also the new tolling system deployed during 2009/2010 was success-fully put in to operation mid October 2010.
For France the company has been posi-tioning itself for a nationwide truck toll-ing scheme and as a DSRC tag supplier. The nationwide truck tolling scheme is in the process of being awarded to a con-sortium led by Autostrade, and Q-Free will continue to explore opportunities as a sub-contractor to stakeholders in this consortium. For the tag supply in France Q-Free has been active in getting approved the new tag, OBU 610, in this market and this is expected to show result in 2011 and onwards.
4) Global Navigation Satellite Systems (GNSS)
Motivated on basis of growth in the truck tolling market, Q-Free has developed a new compact GNSS OBU technology plat-form. The test carried out is promising and Q-Free will seek to find a customer project to enable commercialisation of the product. Q-Free already have available enforcement solutions and operational back office solu-tions for GNSS applications.
5) Video Tolling and Enforcement
Video tolling, where the system relies on video images of cars only, is expected to be more widespread in the coming years, in particular where the system predomi-nantly observes local vehicles. The Stock-holm Congestion Tax System, where all users are charged on the basis of auto-matically reading of number plates, is an example of such a system. Q-Free offers a complete and turn-key system solution for video tolling, from cameras with ALPR software to roadside infrastructure and operational back office solutions. Video based enforcement will become increas-ingly important as MultiLane Free Flow / Open Road Tolling systems, i.e. no barriers used and traffic flows without stopping, are being implemented. Q-Free offers the most advanced systems enabling cost efficient and reliable enforcement.
6) Traffic Management
Through the company’s DSRC and ALPR products Q-Free delivers solutions for parking, access control, speed and red light enforcement. This market is normally explored through partners.
5 / Market development during 2010
As foreseen in the annual report for 2009, 2010 became an important year with
4
5
6
15Q-Free Annual Report 2010 Business review

de facto leading supplier of high per-formance ALPR software. With the increased use of open road tolling in the US, ALPR based enforcement solution, and ALPR based tolling, is expected to grow. Also the company’s position in this specific market segment may represent and attractive starting point for further organic growth, and may also represent an attractive “currency” when exploring M&A possibilities.
6 / Outlook The vision of Q-Free is to be a globally preferred partner in the area of Intelligent Transport Systems having world-wide leadership in Road User Charging and Traffic Management. Q-Free’s ultimate and long term goal is to be the preferred provider independent of technology and solution the customers are looking for. The global ITS market is expected to grow considerably over the next years and Q-Free’s market position is continu-ously strengthening. Our strategic posi-tioning has been well received by existing and new customers and partners.
The most important application areas in the RUC segment are currently:
1. Fully Automated Free Flow Electronic Toll Collection
2. Truck Tolling
3. Congestion Charging
Q-Free has relatively recently executed the most significant and advanced projects in all these three application areas through the execution of:
The Portugal projects
Skytoll/Slovakia project
Stockholm project
This forms a strong basis for exploring similar cases going forward and com-bined with continuous focus on improv-ing both offering and execution, this will secure long term positive development of the company.
jects and tags. Q-Free has, in addition to the tag opportunity mentioned above, also explored infrastructure projects which may implement fully automated tolling systems (MLFF) in the years to come.
Asia/AustraliaIn 2010, Asia Pacific represented 18% of Q-Free’s revenues as well as 7% of the Group’s order backlog at the end of the year. The Group has during the year mainly focused its market activity on Thailand, Australia, Indonesia, Malaysia and Taiwan. Four contracts have been announced during the year, – all from RTA (Australia) and comprises 48 MNOK in tag supply and 11 MNOK in services. In Thailand the main activity has been related to finalising on-going infrastruc-ture, but the company has also started to explore the tag demand which is expected to grow in the years to come. The first tags have already been distrib-uted but it will take some years before any significant roll out of tags will hap-pen, reason being that manual operated lanes are still used extensively and that users need to get used to the new “all electronic system”. Australia continues to represent an important market for Q-Free, specifically related to the supply of tags. The company has been explor-ing some new infrastructure projects, but has in 2010 not resulted in any major contracts. New market opportunities in Indonesia, Taiwan and Malaysia are start-ing to be visible, and may materialise in the next few years.
North and Latin AmericaNorth and Latin America represented in 2010 27% of Q-Free’s revenues as well as 39% of the Group’s order backlog at the end of the year. The Group has during the year mainly focused on Bra-zil and Chile and the distribution of the company’s ALPR solution to all major system integrators in the US as such. The company has achieved great results in Brazil and Chile, and the company has announced four contracts in 2010. These are a 205 MNOK frame agreement for delivering tags and infrastructure to Cen-tro Gestão Meios de Pagto (CGMP) in Brazil, minimum guaranteed 51 MNOK, a tag contract from Autopista Central and Vespucio Norte Express in Chile valued at 57 MNOK, and two frame agreement call-offs (24 MNOK and 26 MNOK) from CGMP for the supply of tags. In North America the company has become the
For Turkey the main addressable market has been related to supply of tags, and the company has received orders for delivery of the new tag (OBU 610).
In Sweden the market activity has been related to both service and maintenance activity of the existing congestion charg-ing infrastructure built by Q-Free and to position the company for delivery of simi-lar infrastructure in Gothenburg. Sweden is expected to be an important market for Q-Free in the coming year as road user charging will increasingly be used for financing infrastructure.
In Norway the company is regularly bidding for the supply of smaller infra-structure projects, tags, services and back-office solutions. There are all rea-sons to believe that Norway will continue to deploy smaller and medium sized AutoPASS solutions, and Q-Free intend to maintain its strong position in this market.
The main market activity in Central Europe has been related to various truck-tolling opportunities in countries like Poland, Slo-venia and Hungary. Q-Free did success-fully put a truck tolling system in Slovakia into operation 1.1.2010, although there has been some commercial challenges. This represents an important reference for similar cases.
AfricaIn Africa Q-Free has during the year partic-ipated in a tag tender in South Africa. The estimated demand over a 2-3 years period is approximately 3 million tags. Q-Free has been selected as one of two suppli-ers, and was awarded an initial supply of tags worth 28 MNOK in Q1 2011. The electronic tolling market in South Africa will increase over the years to come, both when it comes to new infrastructure pro-
16Q-Free Annual Report 2010 Business review
It’s all about
positioning Q-Free for long term
growth
Governances 17Q-Free Annual Report 2010

18Q-Free Annual Report 2010 Governance
Q-Free aims to protect and enhance shareholders’ investments through profitable, sustainable business activities.
Good corporate governance is intended to maximise added value and decrease business risks, at the same time as the Group’s resources are to be utilised in an efficient, sustainable manner. The value added should benefit shareholders, employees and the community. Q-Free is listed on the Oslo Stock Exchange and is subject to Norwegian securities legislation and stock exchange regulations.
Stock exchange regulations require listed companies to publish a report on their principles for Corporate Governance in the Annual Report, in accordance with Section 1 of the Norwegian Code of Prac-tice for Corporate Governance, version dated 21st of October 2010. Q-Free ASA endeavours to comply with these recom-mendations. Where the Company differs from the Code of Practice, an explanation or comment is given.
The description is structured in accord-ance with the Code of Practice. As rec-ommended, a greater degree of detail is provided on certain points.
1 / Implementation of and reporting on Corporate governance
Q-Free ASA considers Corporate Governance to be the principles and guidelines that determine how the Company is managed and defines the relationship between the shareholders, the Board of Directors and the executive management of the Company. These principles and guidelines are established to protect the interests of sharehold-ers, as well as other stakeholders such as employees, customers and suppliers. The topic of Corporate Governance is subject to annual reviews and discussions by the corporate Board of Directors. The Group’s governance documents are reviewed and revised annually and the text for this chapter of the annual report is reviewed in detail.
Code of Conduct
Q-Free is a world leading supplier of Road User Charging (RUC) and Traffic Manage-ment products and systems having applications mainly within electronic toll collection for road financing, congestion charging, truck-tolling, law enforcement and parking/access control. Q-Free operates worldwide and its operations are characterised by high ethical standards. The Company plans to be the market leader by having a customer oriented offering, through excellence in execution and by trustworthy behaviour.
Q-Free has a Code of Conduct (COC) which is approved by the Board of Directors. The COC gives guidelines on how to behave both internally and externally. COC stimulates ethical awareness and is a guideline for everyday actions.
The Board of directors will in 2011 have a review of the COC inclusive guidelines for corporate social responsibility.
The COC applies to all members of the Board of Directors, managers, and all other employees and representatives of Q-Free (“employees”). The Company endeavours to make these guidelines known to its customers, suppliers and partners. All managers are responsible for the COC being known, followed, and that actions are taken if codes are broken. Each employee has a responsibility to read and follow the COC.
Violation of the COC will be subject to disciplinary action including possible termination as well as potential criminal prosecution.
In situations where the employee is aware of any infringement of the COC he/she shall raise the issue with his/her manager. If this is difficult, the employee shall report the
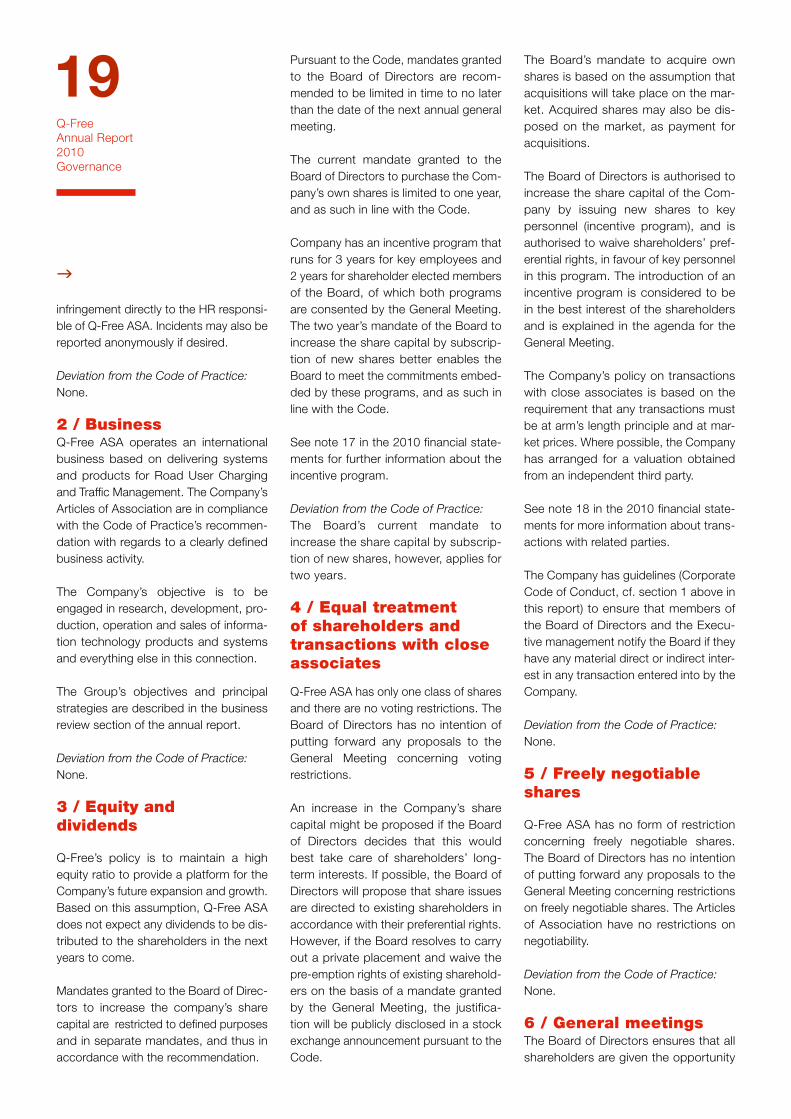
Corporate governance
Corporate governance at Q-Free
Owners Board Executive mangement
Shareholders Board CEO
6 9 6
General Meeting Compensation Commitee Nomination Committee
6 9
Nomination Committee Audit Committee
The General Meeting elects 3–8 shareholders’ representatives to the Board based on nominations from the Nominating Committee. Two-year terms of office.
Ultimate resonsibility for strategy and management of the com-pany. Advice regarding and over-sight of routine management.
Executive management.
The Board’s mandate to acquire own shares is based on the assumption that acquisitions will take place on the mar-ket. Acquired shares may also be dis-posed on the market, as payment for acquisitions.
The Board of Directors is authorised to increase the share capital of the Com-pany by issuing new shares to key personnel (incentive program), and is authorised to waive shareholders’ pref-erential rights, in favour of key personnel in this program. The introduction of an incentive program is considered to be in the best interest of the shareholders and is explained in the agenda for the General Meeting.
The Company’s policy on transactions with close associates is based on the requirement that any transactions must be at arm’s length principle and at mar-ket prices. Where possible, the Company has arranged for a valuation obtained from an independent third party.
See note 18 in the 2010 financial state-ments for more information about trans-actions with related parties.
The Company has guidelines (Corporate Code of Conduct, cf. section 1 above in this report) to ensure that members of the Board of Directors and the Execu-tive management notify the Board if they have any material direct or indirect inter-est in any transaction entered into by the Company.
Deviation from the Code of Practice:None.
5 / Freely negotiable shares
Q-Free ASA has no form of restriction concerning freely negotiable shares. The Board of Directors has no intention of putting forward any proposals to the General Meeting concerning restrictions on freely negotiable shares. The Articles of Association have no restrictions on negotiability.
Deviation from the Code of Practice:None.
6 / General meetingsThe Board of Directors ensures that all shareholders are given the opportunity
Pursuant to the Code, mandates granted to the Board of Directors are recom-mended to be limited in time to no later than the date of the next annual general meeting.
The current mandate granted to the Board of Directors to purchase the Com-pany’s own shares is limited to one year, and as such in line with the Code.
Company has an incentive program that runs for 3 years for key employees and 2 years for shareholder elected members of the Board, of which both programs are consented by the General Meeting. The two year’s mandate of the Board to increase the share capital by subscrip-tion of new shares better enables the Board to meet the commitments embed-ded by these programs, and as such in line with the Code.
See note 17 in the 2010 financial state-ments for further information about the incentive program.
Deviation from the Code of Practice: The Board’s current mandate to increase the share capital by subscrip-tion of new shares, however, applies for two years.
4 / Equal treatment of shareholders and transactions with close associates
Q-Free ASA has only one class of shares and there are no voting restrictions. The Board of Directors has no intention of putting forward any proposals to the General Meeting concerning voting restrictions.
An increase in the Company’s share capital might be proposed if the Board of Directors decides that this would best take care of shareholders’ long-term interests. If possible, the Board of Directors will propose that share issues are directed to existing shareholders in accordance with their preferential rights. However, if the Board resolves to carry out a private placement and waive the pre-emption rights of existing sharehold-ers on the basis of a mandate granted by the General Meeting, the justifica-tion will be publicly disclosed in a stock exchange announcement pursuant to the Code.
infringement directly to the HR responsi-ble of Q-Free ASA. Incidents may also be reported anonymously if desired.
Deviation from the Code of Practice:None.
2 / BusinessQ-Free ASA operates an international business based on delivering systems and products for Road User Charging and Traffic Management. The Company’s Articles of Association are in compliance with the Code of Practice’s recommen-dation with regards to a clearly defined business activity.
The Company’s objective is to be engaged in research, development, pro-duction, operation and sales of informa-tion technology products and systems and everything else in this connection.
The Group’s objectives and principal strategies are described in the business review section of the annual report.
Deviation from the Code of Practice:None.
3 / Equity and dividends
Q-Free’s policy is to maintain a high equity ratio to provide a platform for the Company’s future expansion and growth. Based on this assumption, Q-Free ASA does not expect any dividends to be dis-tributed to the shareholders in the next years to come.
Mandates granted to the Board of Direc-tors to increase the company’s share capital are restricted to defined purposes and in separate mandates, and thus in accordance with the recommendation.
19Q-Free Annual Report 2010 Governance

shall also apply for documents which, according to legislation, shall be a part of or attached to the notice of the meeting. A shareholder may nevertheless, by applica-tion to the company, demand to be sent the documents which relate to the agenda of the General Meeting.
Shareholders themselves, or represented by legal representative, planning to partici-pate at the General Meeting, shall notify the Company within a deadline set by the Board of Directors in the notice. The deadline cannot expire earlier than five days before the date of the General meeting.
To register for the General Meeting a shareholder must submit a confirmation in writing via letter post, fax, or e-mail (provided the registration form is a scanned document with signature).
The agenda for the General Meeting includes detailed information on the resolutions to be considered and the recommendation from the Nomination Committee.
The agenda at the AGM ensures that the shareholders attending may vote for the chairman of the General Meeting.
Shareholders are entitled to request specific matters to the agenda of a General Meeting, provided a written notice is given to the Board within seven days before the statutory deadline for the notice of the General Meeting. If the notice of the General Meeting is already distributed, a new notice shall be issued.
Shareholders who cannot attend the meeting are given the opportunity to vote. The right to attend to and vote in General Meetings may only be exercised for shares which are registered in the shareholders’ register at the latest the fifth workday before the date of the General Meeting (the registration date). Instructions are given in the call for AGM. To vote at the General Meeting, a shareholder must attend or give power of attorney to someone who is attending. A power of attorney will only be accepted if submitted by post, fax, or e-mail (provided the power of attorney is a scanned document with signature). It is not possible to vote via the Internet or any other way.
The company nominates a person who will be available to vote on behalf of share-holders as their proxy.
Deviation from the Code of Practice: The Code recommends that all Directors and members of the Nomination Committee are present at the AGM.
The entire Board and all members of the Nomination Committee have normally not attended the AGM. The Chairman of the Board, however, is always present to respond to any questions and queries. The Chairman of the Board and the Chairman of the Nomination Committee assess on a case by case basis, based on the agenda of the AGM, whether all members should participate.
7 / Nomination committeeThe Company has a Nomination Committee, and the General Meeting elects the Chair-person and members of the Nomination Committee and determines the committee’s remuneration.
The Nomination Committee is defined in the Company’s articles of association.
The Nomination Committee consists of three members who are shareholders or rep-resentatives acting on behalf of shareholders. Members of the Nomination Committee are elected for a period of two years.
The Board’s proposal for instruction for the Nomination Committee was unanimously approved at the AGM in 2008.
to exercise their rights by participating in Annual General Meetings of the Com-pany. By virtue of the AGM the share-holders are guaranteed participation in the Company’s supreme governing body. The AGM adopts the Articles of Association and elects the Board of Directors and the Chairman of the Board, among other things. Sharehold-ers representing at least 5 % of the shares can call for Extraordinary Gen-eral Meetings.
An AGM will ordinarily be held before 1st of June each year, at the latest 30th of June according to law. The 2011 AGM is scheduled for the 19th of May.
The Board of Directors and the man-agement of the Company seek to facili-tate the largest possible attendance at the Annual General Meeting. In 2010, the Annual General Meeting was held on the 20th of May and shareholders representing 37.64% of the share capi-tal attended in person or by power of attorney. The Board of Directors has no intention of putting forward any pro-posals to the Annual General Meeting concerning changes in the voting pro-cedures.
The Company’s Articles of Association regulates the notice period, right to attend and proposals for agenda.
Notice of the General Meeting is to be sent with at least a 21 days writ-ten notice to all shareholders with an address known to the company.
The Board may decide that relevant doc-uments to be discussed in the General Meeting shall not be distributed by letter post if the documents are made avail-able on the Company’s website. This
20Q-Free Annual Report 2010 Governance

The tasks of the Nomination Committee are:
A) to submit a recommendation to the General Meeting regarding shareholder elected members of the Board, including the Chairman of the Board, when these are up for elec-tion or in case of a by election. The Board of Directors elects its own deputy chairman from and amongst the elected Board members;
B) to ensure that the Board of Directors makes an annual self evaluation of their work and competence;
C) to propose Directors’ remuneration, including remuneration of sub-committees of the Board;
D) to submit its recommendation to the General Meeting regarding election of members to the Nomination Committee, including the Chairman of the Nomination Committee.
Q-Free is not aware of the existence of any agreements or business partnerships between the Company and any third parties in which members of its Nomination Committee have direct or indirect interests. The composition of the Nomination Committee is such as to maintain its independence from the Company’s Executive management.
The Nomination Committee emphasises industry and business experience as well as an equal gender balance when proposing the composition of the Board of Directors. Deadline for promoting proposals to the Nomination Committee is available at the Group’s website www.q-free.com. This deadline is set to allow for necessary reviews, reference checks etc. prior to the deadline for submitting the notice for the General Meeting to the shareholders. The Nomination Committee is not prevented from evaluating other candidates than proposed.
Prior to the AGM a meeting is held with the Chairman of the Board to review the Board’s evaluation of its own work. Three of the Board members and two of the Nomination Committee members are up for election in 2011.
8 / General meeting and Board of Directors: Composition and independence
The Company is not required to have a corporate assembly, according to Norwe-gian law.
The members of the Board are elected for a period of two years, and the Board cur-rently has seven members. Two directors are elected directly by and amongst the Group’s employees. Directors are elected for two-year terms and can be re-elected. The Chairman of the Board is elected by the General Meeting. The Deputy Chair-man is elected by the Board of Directors for a period of one year. In the event that the Chairman is absent or legally incom-petent to chair, the meeting will be chaired by the Deputy Chairman. The Company’s executive management is not represented in the Board of Directors.
Q-Free is not aware of the existence of any agreements or business partnerships between the Company and any third par-ties in which its directors have direct or indirect interests. The composition of the Board is such as to maintain its independ-ence from the Company’s management.
The share option agreement for Board members regulates an obliged share pur-chase of a minimum of 25 % of the net income from the exercised share options.
The gender diversity requirement pursuant to Norwegian legislation is met, as there are currently 3 male and 2 female share-holder Directors at the Board.
Deviation from the Code of Practice: None.
Deviation from the Code of Practice: None.
Nomination Committee as at 31st of December 2010
Name Company Shares Share optionsFor
election
Cecilie Johnsen Redback AS /Harburg AS 40,000 0 2012
Harald Arnet Datum AS/ Wega AS 0 0 2011
Petter FjellstadPartner and investor in Grand Haven Capital 400,000 0 2011
21Q-Free Annual Report 2010 Governance

The Board of Directors as at 31st of December 2010:
Name Position, biographical data and competence Service since Elected untilShareholding
in Q-Free ASA
Ole Jørgen Fredriksen(born 1950)
Ole Jørgen Fredriksen has over 25 years experience in the computer hard-ware and software industry. He was one of the co-founders and the President and CEO of ASK, subsequently Proxima and InFocus, the leading global projector Company.
2002 2011 Shares: 168,884Options: 200,000
Christian Albech (born 1947)
Christian Albech has substantial experience in the information and media industries, and is the CEO of Telenor Pakistan. He has served as Executive Vice President and Vice Managing Director of Telenor Broadcast’s operational activities. Albech has previously headed Telenor’s cable TV activities, and was hired as Head of Canal Digital’s forerunner CTV. Mr Albech has widespread experience of board management.
2003 2011 Shares: 0Options: 100,000
Mimi Kristine Berdal(born 1959)
Mimi K. Berdal has a law degree from the University of Oslo, and runs her own law and consultancy firm, focusing on the areas of contract law, company/com-mercial law, transactions and securities trading. From 1991-2005, Berdal was a partner at the law firm Arntzen de Besche. Berdal has extensive experience from work as a Board Member.
2007 2011 Shares: 50,000Options: 100,000
Torild Skogsholm(born 1959)
Torild Skogsholm is the General secretary of Care Norway. Skogsholm has a post master degree of economics from the Uni. of Oslo. From 2006-2011, Mrs Skogsholm held the position as Managing Director of Oslo Sporvogns-drift AS. From 2001-2005, Mrs Skogsholm was the Minister for Transport and Communications. She has also held position as State Secretary (Junior Minister) at the same ministry. She has experience from NetCom, as well as a civil servant at the Ministry of Transport and Communicatons and at the Ministry of Environment.
2006 2012 Shares: 0Options: 100,000
Jan Pihl Grimnes(born 1961)
Jan Pihl Grimnes is through his Company Redback AS investing in the IT, petroleum and mining industries. He holds 2.56% of the shares in Q-Free ASA private and through Redback AS. Grimnes founded Technoguide AS, and holds several board positions both in listed and non-listed companies. Grimnes holds an MBA from the Norwegian School of Economics and Busi-ness Administration and a MSc from the Norwegian University of Science and Technology.
2008 2012 Shares: 1,545,000Options: 100,000
Frank Aune (born 1978)
Frank Aune holds a MSc in Electronics and Telecommunications and holds the position as Head of R&D Security. Mr. Aune has been working in Q-Free ASA since 2006.
2006 2012 Shares: 0Options: 0
Sissel Lillevik Larsen(born 1961)
Mrs Lillevik Larsen has been working in Q-Free ASA since 2000 and holds the position as Technical project manager.
2008 2012 Shares: 0Options: 0
22Q-Free Annual Report 2010 Governance

9 / The work of The Board of Directors
The Board of Directors produces an annual plan for its work, with particular emphasis on objectives, strategy and implementation.
This includes reviewing the overall strat-egy at least once a year, preparing the budget for the next year, evaluating man-agement and competence needed, mak-ing continuous financial reviews and risk assessments based on budgets and prog-noses, as well as evaluating the work of the Board of Directors. The Board held 9 meetings in 2010.
The Board of Directors is elected by the shareholders to oversee the execu-tive management and to assure that the long-term interests of the shareholders and other stakeholders are being served. The Board of Directors has the ultimate responsibility for the management of the Company and for supervising its day-to-day business and activities in general. The main responsibility is to determine the Company’s overall vision, goal and strat-egy. The Board of Directors also ensures that the activities are soundly organised and keeps itself informed about the finan-cial situation of the Company, and ensure that the management handles risks faced by the Company in an appropriate way.
The Group’s activities are varied, depend-ing on each unit’s position in the value chain, and consequently require differen-tiated ways of management and follow-up. Internal management systems that are well functioning are essential, but these must be continuously developed in order to accommodate changes in financial conditions. The Group’s structure with independent units, also in respect of short term reporting, facilitates good control and
powerful focusing. The internal control is based on monthly reports specified on regions, units and divisions, while at the same time providing satisfactory reporting on group level.
The Group also has a separate accounting and finance department responsible for preparing guidelines for internal control, risk management and financial reporting. The Group’s accounting and finance department ensures that the Company adheres to applicable rules and that the Board’s strategy, fiscal restrictions and ethical principles, is followed.
The Board of Directors has issued instructions for its own work as well as for the execu-tive management with particular emphasis on clear internal allocation of responsibilities and duties.
The guidelines for the Board of Directors are described in the Company’s “Instructions for the Board of Q-Free ASA”. The purpose of the instruction is to describe the role and functions of the Board and the interaction with the executive management of the Com-pany. The instructions for the Board of Directors also include detailed requirements on which information and timing of the information from the executive management.
In order to ensure a more independent consideration of matters of a material character in which the Chairman of the Board is, or has been, personally involved, upon the Board’s consideration of such matters, the meeting is chaired by the deputy chairman. The deputy chairman is elected by the Board of Directors annually according to the instructions.
The Board’s proceedings and minutes are in principle confidential unless the Board decides otherwise or there is obviously no need for such treatment. This is pursuant to the instructions to the Board.
The Board of Directors evaluates its performance and expertise annually directly to the Nomination Committee.
Compensation committee
Three out of seven members of the Board act as the company’s Compensation Committee, and are elected by the Board of Directors for a period of two years.
The Board approved an instruction for the Compensation Committee in 2006 (revised in 2008).
The Compensation Committee makes proposals to the Board regarding employment terms and conditions and total remuneration of the CEO and other senior management employ-ees. These proposals are also relevant for other employees entitled to variable salaries. Evaluation of senior management’s achievements is based on input from the CEO. The Board makes comparisons with other companies when deciding the terms and conditions and remuneration of the CEO. The Board also delimits the scope of the remuneration of the executive management team.
Board member participation in meetings in 2010
Participation in meetings in 2010 Board meetingsCompensation
Committee Audit Committee
Ole Jørgen Fredriksen 9 1 5
Christian Albech 8 1
Mimi Kristine Berdal 9 5
Torild Skogsholm 6 5
Jan Pihl Grimnes 8
Anders Hagen (served until GM 2010) 3
Sissel Lillevik Larsen 9 1
Frank Aune (served from GM 2010) 6
23Q-Free Annual Report 2010 Governance

With effect from 17th of June 2010, the Compensation Committee is composed as follows:
Ole Jørgen Fredriksen (Chairman)
Christian Albech
Frank Aune
Audit committeeThe Public Companies Act stipulates that large companies must have an Audit Committee. Three out of seven members of the Board act as the company’s Audit Committee, and are elected by the Board of Directors for a period of two years.
The Board approved an instruction for the Audit Committee in 2006 (revised in 2008).
The Audit Committee’s main responsibili-ties are to supervise the Company’s inter-nal control systems and to ensure that the auditor is independent and that the annual accounts and quarterly reporting give a fair view of the Company’s financial results and financial condition in accord-ance with generally accepted accounting principles.
The Audit Committee reviews the proce-dures for risk management and financial controls in the major areas of the Com-pany’s business activities. The Audit Committee receives reports on the work of the external auditor and the results of the audit. In addition, the committee reviews the Company’s work on Corpo-rate Governance.
With effect from 17th of June 2010, the audit committee is composed as follows:
Mimi Kristine Berdal (Chairman)
Ole Jørgen Fredriksen
Torild Skogsholm
Deviation from the Code of Practice: None.
10 / Risk management and internal control
Q-Free’s customers are public authorities, private companies operating under public licences and system integrators. The Com-pany’s main risk factors are political risk, project risk and financial risk. The Board presents an in-depth review of the Compa-ny’s financial status in the Directors’ Report. It also describes the main elements related to HSE and related risks.
Q-Free has developed an effective Quality Management (QM) system and is certified in accordance with the NS-EN ISO-9001 Quality System. The Company’s ISO 9001 Certificate covers all areas of the normal operations. Q-Free is also certified accord-ing to the ISO-14001/2004 standard, which means that the Company has set up systems for monitoring and improving its impact on the external environment.
The strategy is to combine estimated future sales, based on signed contracts or frame agreements, and purchase and hedge the net cash flow in the foreign cur-rency by using forward/ future contracts. The risk factors which Q-Free are subject to, are closely monitored by the Execu-tive management. The Board receives quarterly The management’s review of the quality management system and the environmental management system. Man-agement draws up monthly performance reports that are sent to and reviewed by the directors.
Deviation from the Code of Practice:The Board of Directors does not carry out an annual review of the Company’s most important areas of exposure to risk and its internal control arrangements. The Audit Committee has requested a presentation from management of an overall risk man-agement and internal control procedure, to be reviewed by the Board and updated annually. Such risk management docu-ment shall describe the most important overall risk factors for the Company, its operations and financial reports, and how these are handled. The Board of directors
will in 2011 have a review of the Code of Conduct inclusive guidelines for corporate social responsibility.
11 / Remuneration of The Board of Directors
The Annual General Meeting approves the Board’s remuneration each year.
The Chairman of the Board of Directors receives a fixed salary of NOK 250,000 and each shareholder elected member receives a fixed salary of NOK 150,000. The Chair-man of sub-committees receives a fixed salary of NOK 10,000 and members NOK 7,500 for each full-day meeting. The Board currently consists of five elected non-exec-utive members and two employee elected members. The employee elected members receive a fixed salary of 50% of the remu-neration for the shareholder elected mem-bers, NOK 75,000. Beyond the scope of Board responsibility, Board members could from time to time take on certain consul-tancy projects for the Company. Such projects are defined by the Board of Direc-tors and occur on a limited basis. Board members are compensated for such work according to separate agreements.
The Directors’ fees are not linked to per-formance.
For further information about remuneration of the Board of Directors see note 15 in the 2010 financial statements.
Remuneration of the Nomination committee
The chairman of the Nomination Commit-tee receives a fixed salary of NOK 25,000 and each elected member receives NOK 15,000.
Deviation from the Code of Practice:The Chairman of the Board, Ole Jørgen Fredriksen, has performed some con-sultancy services for the Company, The assignment, however, and remuneration of these services are fully disclosed and approved by the Board. The administra-tion is given the authority to consider the need for assignment of Fredriksen at a price of NOK 950 per hour. It is the Com-pany’s opinion that this assignment is to the benefit of the Company in relation to the Company’s strategic processes.
The other deviation is that the Company grants share options to members of its
24Q-Free Annual Report 2010 Governance

share options (see under equity and dividends for more information about the incentive program, and note 17 to the 2010 financial statements).
In order to meet the Company’s goals, all employees, including senior management completes an annual performance evaluation. The Board of Directors also conducts performance evaluation of the senior management in the Company, and if necessary with external help. Through these processes, the Board seeks to ensure that the senior management is focused on developing the Company according to approved strategies.
For further information about remuneration of the CEO and other members of the execu-tive management, see note 15 in the 2010 financial statements.
Shares and share options held by the Company’s executive management as at 30th of March 2011:
For information about the running option schemes see note 17 in the 2010 financial statements:
Deviation from the Code of Practice: None.
13 / Information and communicationQ-Free wants to maintain an open dialogue with the capital market, and participates in regular open presentations for investors, analysts and others. Regular information will be published through the Annual Report and the quarterly reports and presentations. The Company aims at publishing these reports within six weeks of the end of the relevant period, in at least three out of four quarters. In 2010 the Company complied accord-ingly. The quarterly results are also made available through webcast. Q-Free distributes all information relevant to the share price to the Oslo Stock Exchange. Such information is distributed without delay and simultaneously to the capital market, the media and on the Company’s website.
The Company publishes all information concerning Annual General Meetings, publica-tion of quarterly reports and presentations on the Company’s website, as soon as they are decided.
It is a primary goal for the Company to maximise the shareholders’ values, in such a way that the return on investment measured as the dividends and rise in the share price, will be at least at the same level as alternative investments involving similar risk. Through the Annual Report and the quarterly reports and presentations, the Company will provide information on its major value drivers and risk factors. This will secure information for investors and make it possible to evaluate the Company’s risk and performance.
The CEO and CFO are responsible for the investor relations of the Company and all communication with the capital market, if necessary together with the Chairman of the Board or appointed members of the Board. Communication with the capital market outside regular presentations is handled by the CEO and CFO. All information is com-municated within the framework established by securities and accounting legislation and the rules and regulations of the stock exchange.
board. It has been the Nomination Com-mittee’s and the Shareholder Meeting’s opinion that using share options as part of the Board remuneration is a good alterna-tive to a high fixed remuneration.
12 / Remuneration of the Executive management
The Board has approved special guide-lines for the stipulation of salary and other remuneration to executive management. The structure of the incentive system for CEO and the other members of executive management is determined by the Board, and presented to the AGM for information purposes.
The Company has a remuneration of the executive management through a share option program, and a performance based bonus scheme.
The CEO’s terms of employment are set by the Board. Each year, the Board under-takes a detailed review of salary and other remuneration of the CEO. The review is based on performance and comparable market conditions of similar positions.
The Board of Directors adopted a perfor-mance related bonus scheme in 2009 for all employees. The scheme for the exec-utive management includes purchase of shares as part of the bonus payment.
Q-Free’s remuneration policy has always been to offer salaries meeting to market conditions to attract the competence needed. Senior management personnel receive a basic salary and are members of the Company’s pension scheme. The General Meeting has authorised an incen-tive program for the executive manage-ment in the Company, and by the end of 2010, 9 employees had been granted
Name Position Shares Share optionsØyvind Isaksen CEO 91,989 675,000
Roar Østbø CFO 47,000 150,000
Jos Nijhuis VP R&D 517,552 100,000
Steinar Furan Advisor to CEO 22,500 150,000
Marianne Sandal VP Operations 17,000 150,000
Stein-Tore Nybrodahl HR Manager 7,500 45,000
Per Fredrik Ecker VP Sales 6,500 150,000
Henrik Stoltenberg VP BD and M&A 0 150,000
25Q-Free Annual Report 2010 Governance

qualifications, and to propose candidates for external audit of the Company to the General Meeting.
Ernst & Young has been the external auditor for Q-Free ASA for the last eight years and carries out no other assignments for the Company which could give rise to conflict of inter-est. The auditor attends the General Meeting and informs about the auditor’s report and remuneration for the year. This year’s auditor’s report follows the notes in the annual report.
The Board of Directors had initiated a bid process on external auditing services during the spring of 2010. This has been carried through and was concluded during the Annual General Meeting through election of auditor.
For further information about remuneration of the auditor see note 27 in the 2010 financial statements.
Deviation from the Code of Practice: None.
All information about Q-Free ASA is avail-able on the Company’s website:
www.q-free.com
Deviation from the Code of Practice: None.
14 / Takeovers The Company has no regulations in the articles of associations which limit trade in the Q-Free shares.
Deviation from the Code of Practice:The Board has not established regulations in the Board’s instructions on how to react to takeover bids, but will consider estab-lishing such a regulation.
15 / AuditorThe Company’s external auditor is elected by the General Meeting and is responsible for the financial audit of the parent Com-pany and Group accounts. Independent external auditors have also been elected for all subsidiaries of Q-Free ASA, including those outside Norway.
The external auditor for Q-Free ASA sub-mits an engagement letter to the Board each year. The engagement letter is a plan for the audit of the Q-Free Group and other information to the Board about next year’s audit. The auditor attends at least two audit committee meetings and Board meetings every year to present and comment on its management letter and other reports related to the audit they have carried out. The reports contain identification of weak-nesses and any proposals for improve-ment. At least once a year, a meeting will be held between the auditor and the Board without the presence of the CEO or other members of executive management. The audit committee has a specific obligation to survey the auditor’s independence and
Articles of associaton
Paragraph 1 / The Company’s name is Q-Free
ASA. The Company shall be a public limited
Company.
Paragraph 2 / The Company’s registered office
is in Trondheim, Norway.
Paragraph 3 / The Company’s objective is to
be engaged in research, development, produc-
tion, operation and sales of information technology
products and systems and everything else in this
connection.
Paragraph 4 / The share capital of the company is
NOK 22,893,863.80, distributed between 60,247,010
stocks, each with a par value of NOK 0.38.
The Company’s shares shall be registered in Verdipa-
pirsentralen (The Norwegian Registry of Securities).
Paragraph 5 / The Board of Directors shall have
3-8 members subject to the General Meeting’s
decision.
The Board of Directors represents the Company,
and has the right to sign the Company. In addition,
the Chairman of the Board and one member of the
Board jointly have the right to sign the Company.
The Board of Directors may grant powers of
procuration.
Paragraph 6 / An Ordinary General Meeting will
be held prior June 30th. The General meeting is to
take place either in Trondheim Municipal or Oslo
Municipal.
Notice of the General Meeting is to be sent with at
least a 21 days written notice to all shareholders
with an address known to the company.
The Board may decide that relevant documents
to be discussed in the General Meeting shall not
be distributed by mail if the documents are made
available on the Company’s website. This shall also
apply for documents which, according to legisla-
tion, shall be a part of or attached to the notice.
A shareholder may nevertheless, by application to
the company, demand to be sent the documents
which relate to the agenda of the General Meeting.
The right to attend to, and vote in General Meeting
may only be exercised for shares which are registe-
red in the shareholders’ register (VPS) at the latest
Q-Free Share PriceQ-Free Volume
Mai 10Mar 10 Nov 10Sep 10Jul 10 Mar 11Jan 11
Share Price
Share price development from March 2010 to March 2011
Volume (1000)
24
22
20
18
16
14
12 0
1 200
800
1 000
600
400
200
26Q-Free Annual Report 2010 Governance

the fifth workday before the date of the General
Meeting (the registration date).
Shareholders themselves, or represented by
legal representative, planning to participate at the
General meeting, shall notify the company within a
deadline set by the Board of Directors in the notice.
The deadline cannot expire earlier than five days
before the date of the General meeting.
The Ordinary General Meeting shall handle:
1. Pass resolution of result and balance.
2. Allocation of profit or covering of loss in accor-
dance with the stipulated balance and distribution
of dividends.
3. Election of members to the Board of Directors
and Chairman of the Board of Directors.
4. Pass resolution of remuneration for the mem-
bers of the board.
5. Elect members to the Nomination committee.
6. Pass resolution of remuneration for the mem-
bers of the Nomination committee.
7. Pass resolution of the auditor’s remuneration.
8. Other matters which the Board includes to the
agenda, or which is proposed by a shareholder,
provided the proposed issue is sent to the Board
in writing within seven days before the deadline
for the notice of the General Meeting, together
with a proposed resolution or the background of
the issue to be set on the agenda. If the notice of
the General Meeting is already distributed, a new
notice shall be distributed, if the deadline for the
notice has not expired.
9. Other cases that according to Law falls within
the powers of the General Meeting.
Paragraph 7 / The Company shall have a Nomi-
nation Committee. The Nomination Committee’s
task is to submit nomination to the General
Meeting for the election of shareholder-elected
members to the Board, and to suggest remune-
ration to the Board.
The Nomination Committee consists of three
members who shall be shareholders or represen-
Overview of historical development in share capital
Date Type of change
Face value per share (NOK)
Change in share capital (NOK)
Share capital after change ( NOK)
Number of shares issued
Number of shares after change
03/12/2002 Status at IPO 0.05 684,713.40 2,279,163.40 13,694,268 45,583,26802/05/2004 Exercise of options key personnell 0.05 4,833.35 2,283,996.75 96,667 45,679,93503/10/2004 Exercise of options key personnell 0.05 2,500.00 2,286,496.75 50,000 45,729,93504/20/2004 Share issue 0.05 227,500.00 2,513,996.75 4,550,000 50,279,93505/10/2004 Exercise of options key personnell 0.05 4,583.30 2,518,580.05 91,666 50,371,60106/08/2004 Exercise of options key personnell 0.05 5,966.65 2,524,546.70 119,333 50,490,93407/26/2004 Exercise of options key personnell 0.05 833.35 2,525,380.05 16,667 50,507,60109/22/2004 Exercise of options key personnell 0.05 833.35 2,526,213.40 16,667 50,524,26810/19/2004 Exercise of options key personnell 0.05 6,000.05 2,532,213.45 120,001 50,644,26901/13/2005 Exercise of options key personnell 0.05 2,666.70 2,534,880.15 53,334 50,697,60303/17/2005 Exercise of options key personnell 0.05 2,500.00 2,537,380.15 50,000 50,747,60306/02/2005 Exercise of options key personnell 0.05 500.00 2,537,880.15 10,000 50,757,60306/23/2005 Exercise of options key personnell 0.05 3,000.00 2,540,880.15 60,000 50,817,60307/04/2005 Exercise of options key personnell 0.05 1,250.00 2,542,130.15 25,000 50,842,60307/27/2005 Exercise of options key personnell 0.05 1,250.00 2,543,380.15 25,000 50,867,60307/29/2005 Exercise of options key personnell 0.05 833.30 2,544,213.45 16,666 50,884,26909/04/2005 Exercise of options key personnell 0.05 1,250.00 2,545,463.45 25,000 50,909,26912/15/2005 Share issue 0.40 17,818,244.15 20,363,707.60 50,909,26912/15/2005 Reduction of share capital (demerger FARA) 0.38 -1,018,185.38 19,345,522.22 50,909,26903/30/2006 Exercise of options key personnell 0.38 3,800.00 19,349,322.22 10,000 50,919,26905/02/2006 Exercise of options key personnell 0.38 258,780.00 19,608,102.22 681,000 51,600,26905/11/2006 Exercise of options key personnell 0.38 195,953.46 19,804,055.68 515,667 52,115,93605/12/2006 Exercise of options key personnell 0.38 60,166.54 19,864,222.22 158,333 52,274,26929/08/2008 Share issue 0.38 646,738.72 20,510,960.94 1,701,944 53,976,21318/05/2009 Exercise of options key personnell 0.38 332,500 20,843,460.94 875,000 54,851,213
29/06/2009 Share issue 0.38 31,646.40 20,875,107.34 83,280 54,934,493
06/07/2009 Share issue 0.38 7,447.62 20,882,554.96 19,599 54,954,092
22/10/2009 Share issue 0.38 1,938,000 22,820,554.96 5,100,100 60,054,092
28/04/2010 Share issue 0.38 73,308.94 22,893,863.80 192,918 60,247,010
tatives for the shareholders. The General Meeting
elects the members. The Nomination Committee
members are elected for two years at a time. The
General Meeting can pass regulations governing
the Nomination Committee.
Paragraph 8 / Furthermore, the Company legis-
lation at any given time shall be applicable.
Last revised 20th of May 2010.
Technical information
At 31.12.10, Q-Free ASA had 60,247,010 shares,
each with a face value of NOK 0.38.
The Company had 1,387 shareholders as at
31.12.10.
The Company’s register of shareholders, cp. S.
4-4 of the Public Limited Companies Act (Nor-
way), was registered with the Norwegian Central
Securities Depository (Verdipapirsentralen –VPS)
at 03.04.2002 and carries the VPS registration
number ISIN NO 0003103103.
DnBNOR Bank ASA, Oslo, is the account mana-
ger. The share’s Ticker Code on the Oslo Stock
Exchange’s main list is QFR.
The Company’s enterprise number in the Register
of Business Enterprises is NO 935 487 242.
27Q-Free Annual Report 2010 Governance

FIGURES IN TNOK
157
167
251
Products
Service & Maintenance
Projects
387411
509
804
568
2010200920082007200620102009200820072006
8
5
9
13
-16
294
371339
713
575
RevenuesRevenues MNOK
EBIT Margin %
Order BacklogComposition
Business Areas MNOK
Order BacklogMNOK
Consolidated Financial Statements 2010
The Board of Directors Report / 29
The Board of Directors / 33
Statement from the Directors and the CEO / 35
Consolidated Income Statement / 36
Consolidated statement of comprehensive income / 37
Consolidated statement of fi nancial position / 38
Consolidated statement of changes in equity / 40
Consolidated statement of cash fl ow / 41
Notes to the consolidated fi nancial statements / 42
Auditor’s report / 87
REPORTING
Q-Free Annual Report 2010
28

Q-Free Annual Report 2010Reporting
29vakia project. Q-Free ASA and SkyToll S.A. have after the end of 2011 signed a settlement agreement with a final payment within the end of June 2011.
The Group’s equity has decreased by 49.2 MNOK to 499.4 MNOK and as at 31 December 2010 it totaled 72.6% of total assets. The Group capitalises costs on product development activities. Capital-ised costs for 2010 consist mainly of the last phase of the development of a new generation DSRC tag and reader in addi-tion to development of a new MultiLane Free Flow system including a new camera technology.
In the Board of Director’s view, no sig-nificant events have occurred after the year end.
At year-end 2010, the parent company had no free equity. The Board of Directors’ recommendation is that no dividends will be paid for the fiscal year 2010.
Cash fl ow and working capital
The Group’s cash funds at the end of 2010 amounted to 85.7 MNOK, com-pared to cash funds of 274.6 MNOK the year before. The difference between operating profit before depreciation, amortisation and impairment (EBITDA) and cash flow from operations is due to working capital increase (increase in inventories, increase of accounts receiv-able, decrease in work in progress, decrease in accounts payables and increase of other short term liabilities).
The Group has the financial strength to develop technology and undertake upcoming projects. During 2010 the Group has invested a total of 56.3 MNOK in new technology to improve future profitability. The Group’s current assets amounted to 429.3 MNOK and short term debt amounts to 183.7 MNOK which gives a liquidity ratio of 2.3. The Group has cash funds of 85.7 MNOK, which gives a satisfactory working capital situation at the balance sheet date.
Going concern
The Board confirms that the financial statements are prepared based on the principle of going concern. It is the Board’s opinion that the Profit and Loss Account and Balance Sheet with notes provide accurate information on the operations and the financial position at the year-end.
Orders received and
order backlog
At year-end 2010, Q-Free Group had an order backlog of 575 MNOK, which is 138 MNOK less than at year-end 2009 and represents a 19% decrease. The order backlog is distributed as follows: Europe 54%, Asia/Australia 7% and Latin and North America 39%. Orders received in 2010 amounted to 602 MNOK, of which 36% came from European countries, 15% from Asia/Australia and 49% from Latin-/North America.
Report on the fi nancial
statements for 2010
In 2010 the Q-Free Group revenues amounted to 568.0 MNOK, compared to 804.4 MNOK in 2010. This represents a decrease of 29% from 2009.
The Group’s gross margin for the year was 52.8%, which represents 9.5% decrease compared to 2009 when the gross margin was 62.3%. The operating profit (EBIT) for 2010 totaled -90.4 MNOK, compared to 102.7 MNOK in 2009. This is a decrease of 193.1 MNOK, mainly due to the decrease in project revenues, lower gross margin and higher cost related to the Slovakia project compared to 2009.
Net financial income amounted to 10.8 MNOK in 2010, compared to 7.0 MNOK in 2009. The Group’s profit before tax was -79.6 MNOK, compared to 109.7 MNOK the previous year. Tax expenses amounted to +22.7 MNOK, compared to -31.5 MNOK in 2009. Tax payable at the year end is 3.3 MNOK, compared to 5.0 MNOK in 2009. The annual profit for the Group after minority interest amounted to -56.8 MNOK, compared to 78.2 MNOK in 2009. Earn-ings per share amounted to NOK -0.94, compared to NOK 1.41 in 2009.
The Q-Free Group had total assets of 687.7 MNOK at year-end 2010, compared to 767.5 MNOK the year before. Work in progress, accounts receivables and other short term assets, have increased mainly as a result of lack of payment on the Slovakia project. Intangible assets have increased as a result of significant invest-ments in new technology mostly within the group’s DSRC product portfolio and deferred tax assets. Working capital has increased during 2010 relative to last 12 months revenues, mostly due to the Slo-
IntroductionThe Q-Free Group had an operating result of -90.3 MNOK (102.7) in 2010, out of revenues of 568.0 MNOK (804.4). The results are influenced by reversed rev-enues and increased cost related to the completion of the Slovakia project.
Q-Free has taken actions to strengthen its position in a growing market through the last couple of years. The group has been investing in improving and broadening its product portfolio through acquisitions and organic development and profession-alized its organization in general. Based on Q-Free’s current position and strategy going forward, the Board is optimistic about the future.
Q-Free is a leading global supplier of solu-tions and products for Road User Charging (RUC) and Traffic Management having appli-cations mainly within electronic toll collec-tion for road financing, congestion charging, truck-tolling, law enforcement and parking/ access control. Q-Free offers solutions and products based on state of the art tech-nology, and is the leading supplier within DSRC, ALPR (Automatic License Plate Recognition) and GNSS (Global Naviga-tion Satellite System) based solutions, with deliveries in Europe, Asia Pacific, Middle East and North and South America.
Q-Free is listed on the Oslo Stock Exchange with the ticker QFR.
The Board of DirectorsReport

Q-Free Annual Report 2010Reporting
30External environment
The use of Q-Frees products and services contribute to reduced traffic congestion and consequently give less pollution. The Group’s activities have no negative impacton the external environment. The Group’s environmental program, which is certified in accordance with NS-EN ISO 14001:2004, has shown positive results. All products introduced after 2005 are pro-duced without the use of lead and other hazardous environmental substances as defined in the EU’s RoHS of WEEE direc-tives. Q-Free has formulated an environ-mental policy that is published on the Group web site. Furthermore, the Group is working actively to influence subcon-tractors to choose the most environmen-tal friendly alternatives whenever possible. The Group thus fulfils all the environmental requirements imposed by the Norwegian authorities and the EU.
Risk situationAn international technology Group such as Q-Free is destined to be exposed to a number of different risks. Political risk related to the time involved from a sales lead is identified to a contract is awarded, and implementation of projects are partic-ularly significant to Q-Free’s operations as RUC projects are usually always directly or indirectly subject to a governmental con-cession. The fact that road concessions are being privatised in the most developed RUC markets may reduce the political risk in the long term.
Other risks:
Currency risk
Q-Free has considerable foreign currency exposure since the Group earns between 70-85 % of its revenues abroad. Q-Free also buys a substantial share of its needed equipment and services abroad and runs businesses outside Norway. This mitigates the Group’s net foreign currency exposure by 30-50 %. The Group’s most important trading currencies except for NOK are USD and EUR. Q-Free’s policy is to limit currency risk while actively assessing various curren-cies’ importance as competitive param-eters. The Group strategy is to combine estimated future sales and purchases and hedge the net cash flow in the foreign cur-rency by using forward / future contracts.
Credit risk
The Group is only conducting business with parties with an acceptable credit
Group’s employees to be an important strategic effort to position the Group.
Working environment
and personnel
The Board considers the working environ-ment in the Group to be good, and would like to take this opportunity to thank the employees for their contributions in a year with challenging projects and heavy workload. Sick leave in 2010 amounted to 2.2%. Even though this an increase from 1.4 %, it is regarded a satisfactory level given the activity level in 2010. No serious occupational incidents or injuries were reported during the year.
The Group operates a policy of complete gender equality between male and female workers.
By tradition, the Group’s recruitment is from a variety of engineering environ-ments, and currently the Group has 23% female and 77% male employees. Q-Free seeks to employ female engineers and will have a priority to a female employee to a male employee, if the rest of the qualifica-tions are similar. The group aims to have similar remuneration between male and female. The parent Company fulfils the Norwegian legal requirement of a mini-mum of 40% Board members from both male and female.
The Group employs, and has historically employed personnel of various nation-alities and from various cultures both in the parent company in Norway and in the subsidiaries abroad. The group has a long tradition of handling a mix of nation-alities and has built an international atti-tude over the years. The official language is English. Based on the importance of these representatives from different cul-tures, the group has implemented a policy to avoid discrimination between people, and groups of people. There have been no reports on discrimination incidents in the group in the last years.
Ethics
The Board emphasises on the impor-tance that the employees represent the Group and the Group’s ideals in a posi-tive way on all arenas of our global busi-ness. The Board has therefore adopted a set of guidelines for ethical conduct for Q-Free’s personnel and Board of Directors (Q-Free’s Code of Conduct), applicable to both internal and external business.
Organisation, working
conditions and external
environment
Q-Free is headquartered in the city of Trondheim, Norway, and is present in 18 countries on five continents. Outside Nor-way the Company is represented directly in The Netherlands, Sweden, United King-dom, Portugal, Slovakia, France, Spain, Australia, Malaysia, Thailand, Indonesia, South Africa and Brazil. The Company is also represented in Turkey, Greece, India, Chile and USA through partners. In addi-tion to the core business, Q-Free owns 53.5% of Noca AS, a contract electronics manufacturer.
At year-end 2010, the Group had 282 employees, whereof 147 are employed in the parent company in Trondheim and Oslo, 44 in Noca AS in Trondheim and 91 in companies outside Norway. A total of 88 % of the employees in the parent com-pany hold a university degree or similar, mainly technical degrees.
Improvement measures
In order to enable continued growth for Q-Free and to ensure that the Group is prepared to meet the demands of a grow-ing RUC market, it is important to have an ongoing process to professionalise the organisation. This has also been a focus area for the Group in 2010. Increased interest for the company, both in Norway and internationally, have lead to a growing number of highly skilled applicants asking for a Q-Free job.
The Group considers the workforce to be well prepared to meet the coming chal-lenges in the future RUC market. The turnover rate in 2010 has been very low, similar to the previous years. The Board considers further development of the

Q-Free Annual Report 2010Reporting
31operations and investments over the next three years as required in the company’s strategy plan for the same period. Surplus liquidity is either deposited in banks or invested in money market funds, with the purpose of obtaining an acceptable return on invested capital combined with a low risk.
Technology risk
The Group is exposed to quality problems both due to the quality of own work and the quality of deliveries from subcontractors. Furthermore, continuous technology advances can affect the competitive situation of Q-Free. Q-Free mitigates this risk by systematic qual-ity control of subcontractors, own technology and product development, by continuously seeking competence needed to integrate various technologies into our solutions, and finally by making provisions for possible faulty deliveries.
Project risk
Q-Free’s revenues normally include a substantial element of large-scale project deliveries that place significant demands on implementation know-how. Q-Free is in possession of skilled competence in this field, and the development of plans to handle project risks that may arise is an important element of the Group’s know-how in this respect.
Corporate governance The Stock exchange regulations require that companies listed on the Oslo Stock Exchange must publish a report on their principles for Corporate Governance once a year, in accordance with the Norwegian Code of Practice for Corporate Governance.
The Board of Q-Free adopted the Group’s principles for Corporate Governance in 2008 and these were updated in 2010. Further details are provided under the section ”Corpo-rate Governance” in the official version of the Company’s Annual Report.
Shareholder situation, share developmentThe price for Q-Free shares in 2010 fluctuated from NOK 21.60 (January) to NOK 17.30 (December). With a total number of 60,247,010 shares, this implies a market value of 1,042 MNOK at the end of the year.
Shareholder situation
At year-end 2010, Q-Free ASA had 1,387 shareholders compared to 1,654 in 2009. The ownership structure consists of investment companies and institutional shareholders in Norway and abroad.
The 20 largest shareholders in Q-Free ASA as at March 30th 2011:
record. To the extent the credit rate is questionable, payment guarantees, let-ter of credit or advance payments will be considered. The Group has no significant credit risk linked to an individual contract-ing party or several other contracting par-ties that can be regarded as a group due to similarities in the credit risk. The Group has guidelines for ensuring that sales are only made to customers that have not experienced any significant credit prob-lems, and that outstanding amounts do not exceed given credit limits. The Group will always be exposed to risk involved in customers not having the ability to fulfill their financial obligations. However, this risk is considered to be low since the Group’s customers are major IT com-panies, public authorities, larger foreign road operators and key road Conces-sionaires in Norway and abroad. This is documented by a historically low bad debt ratio on accounts receivables. When Q-Free enters a new market, the credit risk will be assessed in each individual case and appropriate actions like utilising letter of credits and other similar tools, will be used in order to reduce credit risk. The Group has not provided any guarantees for third parties’ liabilities.
Interest rate risk
Since the Group has no significant amount of interest bearing debt the interest risk is immaterial. However if the Group will enter any significant interest bearing debt con-tracts, the group emphasises predictability at all times when changes in the interest level have a significant influence on the consolidated profit and will take actions to hedge this risk.
Liquidity risk
The Q-Free ASA Group’s strategy is to have sufficient cash funds or credit facili-ties at any time to be able to finance its
Name Holding Percentage
Erste Bank Der Oeste Sparkassen Ag 9,933,000 16,49
Odin Norge 5,348,568 8,88
Skagen Vekst 2,900,000 4,81
DnB NOR SMB VPF 2,273,602 3,77
JP Morgan Chase Bank Special Treaty Lendi 1,974,500 3,28
Kikut AS 1,654,000 2,75
Holberg Norge v/Holberg Fondsforvaltning 1,648,329 2,74
Andresen Lars Oddgeir 1,633,600 2,71
Redback AS 1,495,000 2,48
Vital Forsikring ASA 1,395,146 2,32
Bank Austria Credita Dept. 8811/Mrs. Aimu 1,187,017 1,97
Sabaro Investments L John Casely 1,119,772 1,86
VPF Nordea Kapital C/O JP Morgan Europe 1,079,695 1,79
Mons Holding AS 1,040,000 1,73
Sandnes Investering 860,700 1,43
VPF Nordea Avkastnin C/O JP Morgan Europe 775,932 1,29
Deutsche Bank Intern Client Account 750,000 1,24
DnB NOR Norge (IV) VPF 742,833 1,23
Warrenwicklund Norge 734,442 1,22
VPF Nordea SMB C/O JP Morgan Europe 602,800 1,00
TOTAL 39,148,936 64,99

Q-Free Annual Report 2010Reporting
32The global ITS market is expected to grow considerably over the next years and Q-Free’s market position is continu-ously strengthening. Our strategic posi-tioning has been well received by existing and new customers and partners. From the market report it is clear that 2011 will be an important year – the awards in Q4 2010 followed up by the 154 MNOK award in Portugal in January 2011 is a good indication in this respect. Further we see a promising pipeline building up for 2012 and onwards, and as such con-firming that the road user charging market represents a long term growth market for which Q-Free will be well positioned.
During 2011 the company will continue to further develop and proffesionalise the company.
Q-Free has communicated that the organ-isation is being prepared for international growth. To achieve this we have been investing in all parts of the value chain, such as expanding the sales organisation, strengthening the R&D activity, broadening the portfolio and implementing a world-class operation capability. All these initia-tives will be continued going forward, but will be phased in time to ensure compat-ibility with business level and capacity to absorb changes in the organisation.
The Board of Directors emphasises that there is normally considerable uncertainty associated with assessment of future outlook.
Distribution of lossThe Board proposes that the loss for the year in the parent company of -37,965,000 NOK is distributed from other equity.
Trondheim 31st of December 2010 / 30th of March 2011:
Ole Jørgen Fredriksen (Chairman of the Board)
Mimi Kristine Berdal (Boardmember)
Christian Albech (Boardmember)
Torild Skogsholm (Boardmember)
Jan Pihl Grimnes (Boardmember)
Sissel Lillevik Larsen (Employee elected member)
Frank Aune (Employee elected member)
Øyvind Isaksen (CEO)
nies act sections 10-4 and 10-5, and to determine that non-cash share deposits shall be made or the right to subject the company to special obligations pursu-ant to section 10-2 of the Public Limited Companies act, and mergers according to the Public Limited Companies act section 13-5. The Board of Directors is authorised to determine the terms and conditions for the subscription of shares, and to amend the company’s Articles of Association in compliance with the increase of the share capital at all times. The authorisation shall be valid for two years from the resolution is approved by the General Meeting.
Authorisation to increase the
share capital – incentive program
As part of the work of giving key person-nel, management and shareholder elected Board members an incentive program, through the possibility to subscribe shares in the company, the General Meeting held 18th of May 2009 authorised the Board of Directors to increase the share capital with as much as NOK 1,026,000 which corre-sponds to 2,700,000 shares (5%), at a par value of NOK 0.38, through one or more private placements with cash deposits towards key personnel, management and shareholder elected board members in Q-Free ASA. The existing shareholders preferential rights according to the Public Limited Companies Act sections 10-4 and 10-5 is disregarded. The authorisation is valid for 2 years from the date of this reso-lution approved by the General Meeting, but no longer than 18th of May 2011.
The authorisation regards the imple-mentation of a share options program in Q-Free ASA, which runs over a period of 3 years for key personnel and manage-ment, and 2 years for shareholder elected board members. As much as 600,000 shares shall be reserved for shareholder elected board members, and the remain-ing 2,100,000 shares shall be reserved the share options program for key per-sonnel and management.
Further details regarding the share option program are provided in note 17 of the financial statement in the Annual Report.
OutlookThe vision of Q-Free is to be a globally preferred partner in the area of Intelligent Transport Systems having world-wide leadership in Road User Charging and Traffic Management.
The Company has one share class and the par value per share is NOK 0.38.
Authorisation to acquire the
company’s own shares
On 20th of May 2010, The General Meet-ing authorised the Board of Directors of Q-Free ASA to permit the Company to acquire shares in Q-Free ASA with a nominal value of up to NOK 1,141,027.52, equivalent to 3,002,704 shares, each with a par value of NOK 0.38, provided that the Company’s shareholding of own shares shall not exceed 5 % of shares outstand-ing at any given time. The minimum and maximum amount that can be paid per share will be NOK 1 and NOK 100 respec-tively. The Board of Directors shall have full discretion with respect to methods of acquisition and possible disposal of the Company’s own shares. The authorisa-tion shall be valid until the next Annual General Meeting, but no longer than 30 June 2011.
Authorisation to increase the
share capital
Based on the need to secure necessary transactions like possible acquisitions, share offerings, mergers or other actions within the ITS (Intelligent Traffic Systems) sector, the Board of Directors was given an authorisation from the General Meeting to increase the share capital by the issu-ance of new shares.
In the General Meeting on 20th of May 2010, The Board of Directors was given an authorisation to increase the share capital with as much as NOK 2,282,055.42 by the issue of as much as 6,005,409 shares, equivalent to approximately 10 % of the issued shares, each with a par value of NOK 0.38, with a right to disregard the existing shareholders preferential rights according to the Public Limited Compa-

4 / Torild Skogsholm
Board member
Torild Skogsholm is the General secretary of Care Norway. Skogsholm has a post master degree of economics from the Uni. of Oslo. From 2006-2011, Mrs Skogsholm held the position as Managing Director of Oslo Sporvognsdrift AS. From 2001-2005, Mrs Skogsholm was the Minister for Trans-port and Communications. She has also held position as State Secretary (Junior Min-ister) at the same ministry. She has experi-ence from NetCom, as well as a civil servant at the Ministry of Transport and Communi-catons and at the Ministry of Environment.
The Board of Directors
1 / Ole Jørgen Fredriksen
Chairman of the Board
Ole Jørgen Fredriksen has over 25 years experience in the computer hardware and software industry. He was one of the co-founders and the President and CEO of ASK, subsequently Proxima and InFocus, the leading global projector Company.
2 / Christian Albech
Board member
Christian Albech has substantial experi-ence in the information and media indus-tries, and is the CEO of Telenor Pakistan. He has served as Executive Vice Presi-dent and Vice Managing Director of Tel-enor Broadcast’s operational activities.
Albech has previously headed Telenor’s cable TV activities, and was hired as Head of Canal Digital’s forerunner CTV. Mr Albech has widespread experience of board management.
3 / Mimi Kristine Berdal
Board member
Mimi K. Berdal has a law degree from the University of Oslo, and runs her own law and consultancy firm, focusing on the areas of contract law, Company/com-mercial law, transactions and securities trading. From 1991-2005, Berdal was a partner at the law firm Arntzen de Besche. Berdal has extensive experience from work as a Board Member.
From the left:
Q-Free Annual Report 2010Reporting
33

5 / Jan Pihl Grimnes
Board member
Jan Pihl Grimnes is through his Company Redback AS investing in the IT, petro-leum and mining industries. He holds 2.56% of the shares in Q-Free ASA through Redback AS. Grimnes founded Technoguide AS, and holds several board positions both in listed and non-listed companies. Grimnes holds an MBA from the Norwegian School of Economics and Business Administration and a MSc from the Norwegian University of Science and Technology.
6 / Frank Aune
Employee elected member of
the Board
Frank Aune holds a MSc in Electronics and Telecommunications and holds the position as Head of R&D Security. Mr. Aune has been working in Q-Free ASA since 2006.
7 / Sissel Lillevik Larsen
Employee elected member of
the Board
Mrs Lillevik Larsen has been with Q-Free ASA since 2000 and holds the position of Technical project manager.
From the left:
Q-Free Annual Report 2010Reporting
34

We confirm that, to the best of our knowledge, the financial statements for the period from 1 January to 31 December 2010 have been prepared in compliance with applicable financial reporting standards and that the disclosures in the accounts give a true and fair view of the Company’s and the Group’s assets, liabilities, financial position and results of operations as a whole, and that the Directors’ Report gives a fair review of the development, profit/loss and position of the Company and the Group, along with a description of the main risk and uncertainty factors facing the Company.
Trondheim 31st of December 2010 / 30th of March 2011:
Ole Jørgen Fredriksen (Chairman of the Board)
Mimi Kristine Berdal (Boardmember)
Christian Albech (Boardmember)
Torild Skogsholm (Boardmember)
Jan Pihl Grimnes (Boardmember)
Sissel Lillevik Larsen (Employee elected member)
Frank Aune (Employee elected member)
Øyvind Isaksen (CEO)
/ Statement from the Directors and the CEO
Q-Free Annual Report 2010Reporting
35

FIGURES IN TNOK
Parent Company Group
2009 2010 Note 2010 2009
Operating revenues
601,168 293,447 Revenues 5, 7 557,894 798,276
6,127 10,150 Other operating income 8 10,150 6,127
607,295 303,597 TOTAL OPERATING REVENUES 568,044 804,403
Operating expenses
242,228 103,559 Cost of goods sold 14 268,233 303,429
103,010 100,967 Personnel expenses 15,16, 17 166,766 153,712
176,922 160,780 Other operating expenses 27, 29 162,465 212,057
522,160 365,306 TOTAL OPERATING EXPENSES 597,463 669,198
85,135 -61,710 Earnings before interest, taxes, depreciation and amortisation (EBITDA) -29,419 135,205
20,780 47,027 Depreciation, amortisation and impairment 9, 10, 11 60,954 32,461
64,355 -108,737 Earnings before interest and taxes (EBIT) -90,373 102,743
Financial Items
30,166 16,883 Financial income 24 22,667 33,330
217 42,290 Financial income Group companies 0 0
-23,860 -9,578 Financial expenses 24 -11,887 -26,375
0 -7,031 Financial expenses Group companies 0 0
6,524 42,563 TOTAL FINANCIAL ITEMS 10,780 6,955
70,878 -66,173 Profi t before tax -79,593 109,698
-18,679 28,208 Taxes 23 22,744 -31,549
52,199 -37,965 Profi t / (-) loss for the year -56,849 78,150
Attributal to:
Non-controlling interests 255 -160
Equity holders of the parent -57,104 78,310
Distribution of Profi t / (-) loss for theYear
0 0 Share premium reserve
52,199 -37,965 Other equity52,199 -37,965 TOTAL DISTRIBUTED
Earnings per share 12 -0.94 1.41
Diluted earnings per share 12 -0.93 1.39
Q-Free Annual Report 2010Reporting
36 – AS AT 31 DECEMBER 2010 –
/ Consolidated Income Statement

FIGURES IN TNOK
Parent Company Group
2009 2010 2010 2009
52,199 -37,965 Profi t for the period -56,849 78,150
0 0 Exchange differences on translation of foreign operations 916 1,393
52,199 -37,965 TOTAL COMPREHENSIVE INCOME FOR THE PERIOD -55,933 79,543
Attributal to:
Non-controlling interests 255 -160
Equity holders of the parent -56,188 79,703TOTAL COMPREHENSIVE INCOME FOR THE PERIOD -55,933 79,543
– AS AT 31 DECEMBER 2010 –
37 / Consolidated Statement of Comprehensive Income
Q-Free Annual Report 2010Reporting

FIGURES IN TNOK
Parent Company Group
2009 2010 Assets Note 2010 2009
Non – current assets
0 12,079 Deferred tax assets 23 13,779 0
79,811 100,919 Product development assets 10 143,574 121,572
0 0 Goodwill 10, 11 29,544 34,288
56,409 44,588 Machinery, fi xtures and fi ttings, etc. 9 63,261 71,874
92,339 87,900 Investments in subsidiaries 6, 18 0 0
5,378 5,378 Loan to group companies 18 0 0
3,492 4,732 Investments in other companies 25 5,134 4,103
0 0 Other long term receivables 3,131 1,621
237,430 255,596 TOTAL NON – CURRENT ASSETS 258,422 233,459
Current assets
25,381 39,332 Inventories 14 61,154 40,328
62,552 54,551 Work in Progress 7 54,461 64,699
69,422 134,833 Accounts receivables 21 194,156 125,144
46,782 73,642 Accounts receivables on group companies 21 0 0
14,268 17,664 Other short term receivables 28 33,797 29,288
187,572 22,971 Cash and cash equivalents 19 85,724 274,615
405,977 342,993 TOTAL CURRENT ASSETS 429,292 534,074
643,407 598,589 TOTAL ASSETS 687,714 767,534
Q-Free Annual Report 2010Reporting
38– AS AT 31 DECEMBER 2010 –
/ Consolidated Statement of Financial Position

FIGURES IN TNOK
Parent Company Group
2009 2010 Equity and liabilities Note 2010 2009
Equity
22,821 22,894 Subscribed share capital 13 22,894 22,821
283,946 287,674 Share premium reserve 287,674 283,946
10,219 14,195 Other paid-in capital 14,324 10,348
149,456 111,490 Other equity 153,420 210,635
466,443 436,252 TOTAL EQUITY ATTRIBUTAL TO EQUITY HOLDERS OF THE PARENT 478,311 527,750
0 0 Non-controlling interests 21,106 20,851
466,443 436,252 TOTAL EQUITY 499,417 548,601
Liabilities
Non – current liabilities0 0 Debt to fi nancial institutions 22 622 1,412
15,847 0 Deferred tax 23 0 27,121
1,725 4,149 Pension liabilities 16 3,936 1,466
17,572 4,149 TOTAL NON – CURRENT LIABILITIES 4,558 29,999
Current liabilities80,502 34,603 Accounts payable 20 67,444 105,411
12 0 Advance payments from customers 16,601 5,415
23,358 46,584 Debt to group companies 18 0 0
0 0 Tax payable 23 3,326 4,959
7,849 17,082 Public duties payable 26,409 13,653
47,672 59,918 Other short term liabilities 26 69,959 59,496
159,393 158,188 Total current liabilities 183,739 188,934
176,965 162,337 TOTAL LIABILITIES 188,297 218,933
643,407 598,589 TOTAL EQUITY AND LIABILITIES 687,714 767,534
Trondheim, 31 December 2010 / 30 March 2011
Ole Jørgen Fredriksen Chairman of the Board sign.
Sissel Lillevik Larsen Christian Albech Mimi Kristine Berdal Employee elected sign. sign. sign.
Frank Aune Jan Pihl Grimnes Torild Skogsholm Employee elected sign. sign. sign. Øyvind Isaksen (CEO) sign.
39Q-Free Annual Report 2010Reporting
– AS AT 31 DECEMBER 2010 –
/ Consolidated Statement of Financial Position

FIGURES IN TNOK
Parent Company
Share capital
Share Premium
reserve
Other paid-in capital Other equityNote TOTAL
Equity as at 01.01.2009: 13 20,511 171,399 7,680 97,256 296,847
Total comprehensive income for the period 52,199 52,199
Share issue arising from acquisitions 6, 13 2,310 112,547 0 114,857
Cost of share-based payment 17 0 0 2,539 2,539
TOTAL EQUITY OF THE PARENT AS AT 31.12.2009 22,821 283,946 10,219 149,456 466,442
Equity as at 01.01.2010: 13 22,821 283,946 10,219 149,456 466,455
Total comprehensive income for the period -37,965 -37,965
Share issue arising from acquisitions 6, 13 73 3,727 3,800
Cost of share-based payment 17 3,976 3,976
TOTAL EQUITY OF THE PARENT AS AT 31.12.2010 22,894 287,674 14,195 111,490 436,252
Group
Equity attributal to equity holders of the parent
Non-controlling
interestsTOTAL
EQUITY
Share capital
Share Premium
reserve
Other paid-in capital
Other equity
Foreign currency
translation reserve TOTALNote
Equity as at 01.01.2009: 13 20,511 171,399 7,809 132,537 -1,604 330,652 21,011 351,663
Profi t for the period 78,310 78,310 -160 78,150
Exchange differences on translation of foreign operations 1,393 1,393 1,393
Total comprehensive income for the period 78,310 1,393 79,703 -160 79,543
Share issue arising from acquisitions 6, 13 2,310 112,547 114,857 114,857
Cost of share-based payment 17 2,539 2,539 2,539
TOTAL EQUITY OF THE GROUP AS AT 31.12.2009 22,821 283,946 10,348 210,847 -211 527,750 20,851 548,601
Equity as at 01.01.2010: 13 22,821 283,946 10,348 210,847 -211 527,975 20,851 548,601
Profi t for the period -57,104 -57,104 255 -56,849
Exchange differences on translation of foreign operations 916 916 916
Total comprehensive income for the period -57,104 916 -56,188 255 -55,933
Transferred other equity arising from subsidiaries 1,540 1,540 1,540
Currency translation differences arising from acquitions -2,567 -2,567 -2,567
Share issue 13 73 3,727 3,800 3,800
Cost of share-based payment 17 3,976 3,976 3,976
TOTAL EQUITY OF THE GROUP AS AT 31.12.2010 22,894 287,674 14,324 155,282 -1,862 478,310 21,106 499,417
Q-Free Annual Report 2010Reporting
40– AS AT 31 DECEMBER 2010 –
/ Consolidated Statement of Changes in Equity

FIGURES IN TNOK
Parent Company Group
2009 2010 Note 2010 2009
Cash fl ow from operations
70,878 -66,173 Profi t before tax -79,593 109,698
0 0 Paid taxes 23 -4,959 -11,497
15,490 23,650 Depreciation and impairment of property, plant and equipment 9 26,713 18,586
5,291 23,377 Amortisation and impairment of intangible assets 10, 11 34,240 13,876
-1,263 2,424 Pension cost without cash fl ow effect 16 2,470 -1,493
6,505 29,426 Dividends from subsidiaries 0 0
217 63 Interests from subsidiaries 0 0
-1,535 -1,240 Shares valued at fair value 25 -1,031 -1,559
2,539 3,976 Cost of share-based payment 17 3,976 2,539
Working capital adjustments
-9,458 -102,848 Changes in receivables and prepayments from customers 21 -20,826 -45,192
7,625 -13,951 Changes in inventory 14 -69,012 6,698
28,928 -45,204 Changes in accounts payables 20 -37,967 46,798
-1,535 8,001 Changes in work in progress 7 10,238 -21,529
-53,375 23,214 Changes in other short term balance sheet items 12,442 -5,073
70,307 -115,286 NET CASH FLOW FROM OPERATIONS -123,309 111,852
Cash fl ow from investments
-43,554 -56,314 Investments in tangible and intangible assets 9, 10 -69,598 -67,639
-6,360 0 Acqusition of subsidiary, net of cash acquired 5 0 6
-10,742 3,199 Other investments -2,541 -3,442
-60,656 -53,115 NET CASH FLOW FROM INVESTMENTS -72,139 -71,075
Cash fl ow from fi nancing
0 0 Down payments of debt to fi nancial institutions 22 -790 -790
114,857 3,801 Share issue 6, 13 3,801 114,857
0 0 Other fi nancial items 3,546 154
114,857 3,801 NET CASH FLOW FROM FINANCING 6,557 114,221
124,508 -164,600 Net change in cash and cash equivalents for the year -188,891 154,998
63,064 187,572 Cash and cash equivalents as at 01.01. 274,615 119,617
187,572 22,971 CASH AND CASH EQUIVALENTS AS AT 31.12. 19 85,724 274,615
41Q-Free Annual Report 2010Reporting
– AS AT 31 DECEMBER 2010 –
/ Consolidated Statement of Cash Flow
FIGURES IN TNOK
Notes to the Consolidated Financial Statements 2010
1 / Corporate information / 43
2 / Basis for preparation of the consolidated accounts / 43
3 / Summary of signifi cant accounting policies / 44
4 / Financial risk management / 53
5 / Operating segments / 54
6 / Business combinations / 56
7 / Work in progress / 57
8 / Other operating income / 58
9 / Machinery, fi xtures and fi ttings / 59
10 / Intangible assets / 61
11 / Impairment testing of goodwill / 63
12 / Earnings per share / 64
13 / Issued capital and reserves / 65
14 / Inventories and cost of goods sold / 66
15 / Salaries and personnel related expenses / 67
16 / Pension scheme / 69
17 / Share option program for employees / 71
18 / Related party disclosure / 75
19 / Cash and cash equivalents / 77
20 / Financial instruments / 77
21 / Accounts receivables and credit risk / 80
22 / Interest-bearing debts and borrowings / 81
23 / Taxes / 82
24 / Financial items / 83
25 / Shares at fair value through profi t and loss / 84
26 / Provisions for warranty accruals / 85
27 / Other operating expenses / 85
28 / Other short term receivables / 86
29 / Commitments and contingencies / 86
42Q-Free Annual Report 2010Reporting

Note 1 / Corporate information The consolidated financial statements for the year ended at 31 December 2010 were approved by the Board of Directors at its meet-ing on 30 March 2011. Q-Free ASA is a limited liability company with 282 employees in 12 locations and representatives in 8 other countries. The headquarter is based in Trondheim, Norway. Q-Free is listed on the Oslo Stock Exchange with the ticker QFR.
Q-Free is a leading global supplier of solutions and products for Road User Charging and Traffic Management having applications mainly within electronic toll collection for road financing, congestion charging, truck-tolling, law enforcement and parking/access control. Q-Free offers solutions and products based on state of the art technology, and is the leading supplier within DSRC (tag and reader) – ALPR (Automatic License Plate Recognition) and GNSS (Global Navigation Satellite System) based solutions, with deliveries in Europe, Asia-Pacific, Middle East, North and South America.
For further information, the business segments are described in Note 5.
Note 2 / Basis for preparation of the consolidated accounts
2.1: General principles
The consolidated financial statements are presented using the historical cost principle, with the exception of derivative financial instru-ments which are measured at fair value. The consolidated financial statements are presented in Norwegian kroner and all figures are rounded to the nearest thousand (TNOK) unless otherwise specified.
Statements of compliance
The consolidated financial statements of Q-Free ASA (the “Parent Company”) and all its subsidiaries (The “Group”), have been prepared in accordance with International Financial Reporting Standards (IFRS) as adopted by EU. The below listed principles are used both for the Parent company and The Group.
2.2: Signifi cant accounting judgments, estimates and assumptions considered when
preparing the fi nancial statements
The preparation of the Group’s consolidated financial statements has required management to make estimates and assumptions that effects the reported amounts of revenues, expenses, assets and liabilities, and the disclosure of contingent liabilities, at the end of the reporting period. However, uncertainty about these assumptions and estimates could result in outcome that require a material adjust-ment to the carrying amount of the asset or liability affected in future periods.
Judgments
During 2010 there was no incidents that required management to make any judgements that had any material effect on the reported consolidated financials as at 31.12.10.
Uncertainty associated with estimates and assumptions
The key assumptions concerning the future and other key sources of estimation uncertainty at the reporting date are described below. The Group based its assumptions and estimates on parameters available when the consolidated financial statements were prepared. However, existing circumstances and assumptions about future developments may change due to market changes or circumstances arising beyond the control of the Group. Such changes are reflected in the assumptions when they occur.
Revenues recognition in projects
Revenus are recognised on the contracts in coherence with the estimated progress in the projects. Progress is calculated as accrued production costs as a percentage of total expected production costs. Revenues are agreed by contract. Total expected production
/ Notes to the Consolidated Financial Statements 2010
Q-Free Annual Report 2010Reporting
43

costs are estimated based on a combination of historical figures, systematic estimation procedures, the follow up of efficiency targets and best estimates. Each project’s prognosis is evaluated on a monthly basis to verify that the accounts are based on best possible prognosis. Manhours constitute a large proportion of the total productions cost. The uncertainty of the estimation of manhours varies with duration and technical complexity of the project. Estimation of projects with long duration and high complexity has significant effect on the financial statement. The Group management is therefore actively involved in these assessments. Revenues recognition in projects is measured as a percentage calculated as accrued production costs as a percentage of total anticipated production costs. Total order’s for the Group as at 31 December 2010 is TNOK 684.601. Corresponding figures for 2009 was TNOK 648.867-. Further details are given in Note 7.
Product Development costs
Product development costs are capitalised in accordance with the accounting policy in Note 3.7 and the capitalised amount is shown in the balance sheet as “Product Development Assets”. Initial capitalisation of costs is based on management’s assumption that tech-nological and financial feasibility is confirmed, this is when a product development project has reached a defined milestone according to the project management model. In determining the amounts to be capitalised, management makes assumptions on the expected future cash generation of the project, discount rates to be applied and the expected period of benefits. As at 31 December 2010, the carrying amount of capitalised product development costs was TNOK 143.574 (2009: TNOK 121.572). Further details are given in Note 10 Intangible Assets.
Pension funds / liabilities
The cost of defined benefit pension plans and other post employment medical benefits is determined using actuarial valuations. The actuarial valuation involves a number of assumptions about discount rates, expected rates of return on assets, future salary increases, mortality rates and future pension increases. Due to the long term nature of these plans, such estimates are subject to significant uncertainty. All assumptions are reviewed at the reporting date. The net employee pension liabilities for the Group as at 31 December 2010 is TNOK 3.936,- Corresponding figures for 2009 was net liabilities on TNOK 1.466-. Further details are given in Note 16.
Warranty accruals
The Group is estimating probable warranty costs on products delivered with faults based on historical data for previous years and an evaluation of the portfolio of delivered products still under warranty. Total provisions for warranty costs as at 31 December 2010 is TNOK 7.993,- for the group. Corresponding figures for 2009 was TNOK 9.073,-. Further details are given in Note 26.
Deferred tax assets
Deferred tax assets are recognised for all unused tax losses to the extent that it is probable that taxable profit will allow the losses to be utilised. The carrying amount of deferred tax assets is reviewed at each reporting date and reduced to the extent that it is no longer probable that sufficient taxable profit will be available to allow all or part of the deferred tax asset to be utilised. Unrecognised deferred tax assets are reassessed at each reporting date and are recognised to the extent that it has become probable that future taxable profits will allow the deferred tax asset to be recovered. The carrying value of recognised deferred tax funds as at 31 December 2010 was TNOK 13.779-, for Group and TNOK 12.079,- for the Parent (2009: TNOK 27.121,- of deferred tax liabilities for Group and TNOK 15.847,- of deferred tax liabilities for Parent). Either the Parent or the Group had any unrecognised deferred tax assets as at 31 ecember 2010 or as at 31. December 2009. Further details regarding deferred taxes are given in note 23.
Note 3 / Summary of signifi cant accounting policies 3.0: Basis of consolidation
The consolidated financial statements comprise the financial statements of Q-Free ASA and its subsidiaries as at 31 December each year.
The financial statements of the subsidiaries are prepared for the same reporting period as the parent company, using consistent accounting policies.
/ Notes to the Consolidated Financial Statements 2010
Q-Free Annual Report 2010Reporting
44
Non-controlling interests represent the portion of profit or loss and net assets not held by the Group and are presented separately in the income statement and within equity in the consolidated balance sheet, separately from parent shareholders’ equity. Acquisitions of non-controlling interests are accounted for using the parent entity extension method, whereby the difference between the consideration and the book value of the share of the net assets acquired is recognised as goodwill.
Shares in subsidiaries
Investments in subsidiaries are accounted for according to the cost method in the parent company’s accounts. The investments are recognised at their fair value on the date of acquisition. Fair value is attributed to identifiable assets and liabilities. Excess value that cannot be assigned to identifiable assets is classified as goodwill.
Elimination of transactions
Intra-Group balances and unrealised gains and losses that arise between Group entities are eliminated at consolidation. Unrealised gains from transactions with associates are eliminated proportionally against the investment. Unrealised losses are eliminated corre-spondingly, unless they are related to impairment. All intra-Group transactions are eliminated in the consolidation process.
Non-controlling interests
The non-controlling interests include the minority’s share of the carrying amount of subsidiaries, including the share of identified excess value on the date when a subsidiary is acquired.
Losses in a consolidated subsidiary that can be attributed to the non-controlling interests cannot exceed the minority’s share of equity in the consolidated subsidiary. Excess losses are recognised against the equity holders of the parent in the subsidiary to the extent that the minority is not obligated and can incur its share of the loss. If the subsidiary starts making a profit, the majority’s share of the subsidiary’s equity shall be adjusted until the minority’s share of past losses are covered.
3.1: Business combinations and goodwill
Business combinations from 1 January 2010. Business combinations are accounted for using the acquisition method. The cost of an acquisition is measured as the aggregate of the consideration transferred, measured at acquisition date fair value and the amount of any non-controlling interest in the acquiree. For each business combination, the acquirer measures the non-controlling interest in the acquiree either at fair value or at the proportion-ate share of the acquiree’s identifiable net assets. Acquisition costs incurred are expensed and included in administrative expenses.
When the Group acquires a business, it assesses the financial assets and liabilities assumed for appropriate classification and des-ignation in accordance with the contractual terms, economic circumstances and pertinent conditions as at the acquisition date. This includes the separation of embedded derivatives in host contracts by the acquiree.
If the business combination is achieved in stages, the acquisition date fair value of the acquirer’s previously held equity interest in the acquiree is remeasured to fair value at the acquisition date through profit or loss.
Any contingent consideration to be transferred by the acquirer will be recognised at fair value at the acquisition date. Subsequent changes to the fair value of the contingent consideration which is deemed to be an asset or liability, will be recognised in accordance with IAS 39 either in profit or loss or as a change to other comprehensive income. If the contingent consideration is classified as equity, it should not be remeasured until it is finally settled within equity.
Goodwill is initially measured at cost being the excess of the aggregate of the consideration transferred and the amount recognised for non-controlling interest over the net identifiable assets acquired and liabilities assumed. If this consideration is lower than the fair value of the net assets of the subsidiary acquired, the difference is recognised in profit or loss.
/ Notes to the Consolidated Financial Statements 2010
Q-Free Annual Report 2010Reporting
45

After initial recognition, goodwill is measured at cost less any accumulated impairment losses. For the purpose of impairment testing, goodwill acquired in a business combination is, from the acquisition date, allocated to each of the Group’s cash-generating units that are expected to benefit from the combination, irrespective of whether other assets or liabilities of the acquiree are assigned to those units.
Where goodwill forms part of a cash-generating unit and part of the operation within that unit is disposed of, the goodwill associated with the operation disposed of is included in the carrying amount of the operation when determining the gain or loss on disposal of the operation. Goodwill disposed of in this circumstance is measured based on the relative values of the operation disposed of and the portion of the cash-generating unit retained.
3.1: Business combinations prior to 1 January 2010
In comparison to the above-mentioned requirements, the following differences applied: Business combinations were accounted for using the acquisition method. Transaction costs directly attributable to the acquisition formed part of the acquisition costs. The non-controlling interest was measured at the proportionate share of the acquiree’s identifi-able net assets.
Business combinations achieved in stages were accounted for as separate steps. Any additional acquired share of interest did not affect previously recognised goodwill.
When the Group acquired a business, embedded derivatives separated from the host contract by the acquiree were not reassessed on acquisition unless the business combination resulted in a change in the terms of the contract that significantly modified the cash flows that otherwise would have been required under the contract.
Contingent consideration was recognised if, and only if, the Group had a present obligation, the economic outflow was more likely than not and a reliable estimate was determinable. Subsequent adjustments to the contingent consideration were recognised as part of goodwill.
3.2: Recognition of revenues
Revenues are recognised when it is probable that transactions will generate future financial benefits that will accrue to the company and the size of the amount can be reliably estimated. Sales revenues are presented net of value added tax and discounts. Q-Free’s business activities are product and system deliveries as well as provision of service and maintenance and license revenues within the tolling busi-ness with a length in time from a couple of months up till two to three years. Q-Free distinguishes between system deliveries, goods/standard production, services/maintenance and license revenues. Governmental grants is classified as “Other income”.
System deliveries
Revenues relating to system deliveries are recognised in the income statement according to the stage of completion. Stage of project completion is calculated as accrued production costs as a percentage of total anticipated production costs. Total anticipated produc-tion costs are estimated on the basis of a combination of historical figures, the follow up of efficiency targets and best estimates. If the project’s results cannot be reliably estimated, only revenues equal to the accrued project costs will be recognised as revenues. Any estimated loss on a contract will be recognised in the income statement for the period when it is identified that the project will lead to a loss.
Change orders are defined as additions to existing contracts. Change orders are recognised when the probability of customer accept-ance of the change order can be ascertained with a high degree of probability. Additional contractual services and estimated additional costs are included in the original project prognosis and recognised as income with a shared profit on the contract and the same degree of completion.
/ Notes to the Consolidated Financial Statements 2010
Q-Free Annual Report 2010Reporting
46

Invoicing normally takes place when contractually agreed milestones are reached. Differences between invoicing and revenues recogni-tion are shown as “Work in Progress” in the balance sheet. Advance payments from the customers are presented under current liabilities.
Service and maintenance fees
Services delivered which are not part of a construction contract or licensed sales are recognised as revenues incrementally as the service and maintenance is provided, as described under construction contracts.
Goods/standard production
Revenues from the sale of goods are recognised in the income statement once delivery has taken place, the risk has been transferred and the company has established a receivable due by customer.
License revenues
The Group also sells licences for the use of software systems. Licence revenues are normally recognised as revenues in their entirety when the system is delivered. For a definition of when a license is considered to have been delivered, see the description under “Goods/standard production” above.
Governmental grants
Subsidies from the authorities are not recognised until it is reasonably certain that the company will meet the conditions stipulated in connection with the receipt of the subsidies and that the subsidies actual will be granted. The recognition of subsidies is postponed and amortised over the period that the costs relating to that which the subsidies are intended for are incurred. Subsidies are recognised as deductions from the cost that the subsidy is meant to cover. Subsidies received to buy non-current assets are capitalised. Government grants are accounted as other operating income when the cost are incurred or as reduction of personnel expenses if the Group has approved projects in the governmental tax relief program “Skattefunn”. Further details are given in Note 8.
3.3: Foreign currency
Functional currency and presentation currency
The consolidated financial statements are presented in NOK, which is the Company’s functional and presentation currency. Each entity in the group determines its own functional currency and items included in the financial statements of each entity are measured using that functional currency. Transactions in foreign currencies are initially recorded at the functional currency rate ruling at the date of the transaction. Monetary assets and liabilities denominated in foreign currencies are retranslated at the functional currency rate of exchange ruling at the balance sheet date. All differences regarding retranslation are included in the profit and loss account.
Group companies
The assets and liabilities of foreign operations are translated into NOK at the rate of exchange at the reporting date and their income statements are translated at the average exchange rates for the adequate financial period. The exchange differences arising on the translation are recognised in other comprehensive income. On disposal of a foreign operation, the component of other comprehensive income relating to that particular foreign operation is recognised in the income statement.
3.4: Provisions
Provisions are recognised when the Group has an obligation (legal or constructive) as a result of a past event, it is probable that an outflow of resources embodying financial benefits will be required to settle the obligation and a reliable estimate can be made of the amount of the obligation. Provisions are reviewed on each balance sheet date and reflect the best estimate of the liability. When the effect of time is insignificant, the provisions will be equal to the size of the expense required to be released of the liability. When the effect of time is significant, the provisions will be the present value of future payments to cover the liability. Further details are given in Note 26.
/ Notes to the Consolidated Financial Statements 2010
Q-Free Annual Report 2010Reporting
47

3.5: Financial instruments
Financial assets and liabilities
Financial assets and liabilities consist of derivatives, investments in shares, accounts receivables and other receivables, cash and cash equivalents, loans, accounts payable and other liabilities.
A financial instrument is recognised when the Group becomes party to the instrument’s contractual provisions. Upon initial recognition, financial assets and liabilities are measured at fair value plus directly attributable expenses. Transaction costs relating to the acquisition or incurrence of financial instruments at fair value through profit or loss are however recognised in profit or loss as they are incurred. An ordinary purchase or sale of financial assets is recognised and derecognised from the time an agreement is signed. Financial assets are derecognised when the Group’s contractual rights to receive cash flows from the assets expire, or when the Group transfers the asset to another party and does not retain control, or transfers practically all risks and rewards associated with the asset. Financial liabilities are derecognised when the Group’s contractual obligation has been satisfied, discharged or cancelled.
Classifi cation
Q-Free classifies financial assets and liabilities according to IAS 39 in the following categories: financial assets and liabilities at fair value through the profit or loss, loans and receivables, loans and borrowings and other financial liabilities.
Financial assets and liabilities through profit and loss includes financial assets held for trading and derivative financial instruments that are not designated as hedging instruments in hedge relationships as defined in IAS39. Subsequent changes in fair value are carried in the statement of financial position at fair value with changes in fair value recognised in finance income or finance expenses in the income statement.
After initial measurement loans and receivables are measured at amortised cost, less impairment for expected losses. The Group’s loans and borrowings are subsequent to initial recognition measured at amortised cost using the effective interest rate method.
Further details on financial risk management are given in note 4.
Impairment of fi nancial assets
The Group assesses at each reporting date whether there is any objective evidence that a financial asset or a group of financial assets is impaired.
A financial asset or a group of financial assets is deemed to be impaired if, and only if, there is objective evidence of impairment as a result of one or more events that has occurred after the initial recognition of the asset (an incurred loss event) and that loss event has an impact on the estimated future cash flows of the financial asset or the group of financial assets that can be reliably estimated. Evidence of impairment may include indications that the debtors or a group of debtors is experiencing significant financial difficulty, default or delinquency in interest or principal payments, the probability that they will enter bankruptcy or other financial reorganisation and where observable data indicate that there is a measurable decrease in the estimated future cash flows, such as changes in arrears or economic conditions that correlate with defaults.
If, in a subsequent period, the amount of the impairment loss decreases and the decrease can be related objectively to an event occurring after the impairment was recognised, the previously recognised impairment loss is reversed, to the extent that the carrying value of the asset does not exceed its amortised cost at the reversal date. Any subsequent reversal of an impairment loss is recognised in profit or loss.
3.6: Property, plant and equipment
Property, plant and equipment are stated at cost less accumulated depreciation and any accumulated impairment losses. Deprecia-
/ Notes to the Consolidated Financial Statements 2010
Q-Free Annual Report 2010Reporting
48

tion is calculated to reduce the cost of assets, other than land that is not depreciated, to their estimated residual value, if any, over their estimated useful lives. The cost of assets include professional fees. Depreciation commences when the assets are ready for their intended use.
Depreciation is calculated on a straight-line basis over the following periods of time:
Machinery and lab equipment 4-6 years
Offi ce and computer equipment 3-5 years
Building installations 5-7 years, distributed over the remaining rental periods.
3.7: Intangible assets
Intangible assets acquired separately are measured initially at cost. The cost of intangible assets acquired in a business combina-tion is the fair value at the date of acquisition. Following initial recognition, intangible assets are carried at cost less any accumulated amortisation and any accumulated impairment losses.
The useful lives of intangible assets are assessed as either finite or indefinite.
Intangible asset with finite lives are amortised over the useful financial lives. Useful lives and amortisation method for intangible assets with finite useful life is reviewed at least annually. The straight-line depreciation method is used for intangible assets as this best reflects the consumption of the assets.
Research and development
Expenses for research activities are recognised and expensed as they accrue.
Expenses related to product development activities are capitalised if the product development activities comply with defined criteria for capitalisation. Capitalisation assumes it is possible to identify the intangible asset to be developed and demonstrated that it is likely that the development work will be successful, and that the future financial benefits attached to the intangible asset will accrue to the enterprise. Depreciation is carried out using the straight-line method over the estimated useful lifetime. The estimated useful lifetime is continuously evaluated.
If the criteria are satisfied, expenses recognised on the balance sheet will include the cost of materials, direct payroll expenses and a percentage of the directly allocated administration expenses. Capitalised development costs are recognised on the balance sheet at acquisition cost less accumulated depreciation and impairments.
Expenses related to ongoing efforts to improve a product or enhance a product’s quality are defined as product maintenance and expensed as they are incurred.
3.8: Impairment of non-fi nancial assets
All non-financial assets, with the exception of inventories and deferred tax assets, are reviewed for each reporting period to determine whether there are indications of impairment. Where indications of impairment exist, recoverable amounts are calculated.
The recoverable amount of an asset or cash-generating unit is its value in use or fair value less costs to sell, whichever is higher. Value in use is calculated as the net present value of future cash flows. The calculation of net present value uses a discount rate that is before tax and reflects current market assessments of the time value of money and the risks specific to the asset. The recoverable amount is calculated on the basis of the estimated future cash flow based on the Group’s budget and strategic plans for the upcoming five-year planning period. The budget has been approved by Q-Free’s management and Board of Directors.
/ Notes to the Consolidated Financial Statements 2010
Q-Free Annual Report 2010Reporting
49

Impairment is recognised if the carrying amount of an asset or cash-generating unit exceeds its recoverable amount. A cash-generating unit is the smallest identifiable group that generates a cash inflow that is largely independent of other assets or groups. Impairment related to cash-generating units is intended first to reduce the carrying amount of any goodwill allocated to the unit and then to reduce the carrying amount of the other assets in the unit on a pro-rated basis. These assets will normally be property, plant and equipment, and other intangible assets.
Goodwill
Goodwill from an acquisition of a business activity (business combination) is identified if the consideration exceeds the value of identifi-able assets and liabilities. Goodwill is measured at cost less any accumulated impairment loss. Goodwill is allocated to cash-generating units that are expected to gain financial benefits from the synergies of the business combination. A cash-generating unit is the smallest identifiable group that generates a cash inflow that is largely independent from other assets or groups. Goodwill is non-depreciable, but tested for impairment annually in Q4, and whenever there are indications of impairment on the balance sheet date. Impairment of goodwill cannot be reversed.
Impairment is calculated by comparing the recoverable amount with the individual cash-generating unit’s carrying amount. The recov-erable amount is the value in use or fair value less costs to sell, whichever is higher. In estimating value in use, expected future cash flows are discounted to net present value using a discount rate before tax that reflects today’s market assessments of the time value and the specific risk attached to the asset. Goodwill is described in Note 11 “Impairment test of goodwill”.
3.9: Share based payment
The group has a share option program for key employees. To the extent share options or shares are issued to lower than market price, the difference between market price and issue price is reported as payroll expense.
The cost of equity-settled transactions with employees is measured to fair value at grant date. The cost of equity-settled transactions is recognised, together with a corresponding increase in equity, over the year in which the performance conditions are fulfilled, ending on the date on which the relevant employees become fully entitled to the award (vesting date). The market value of granted share options are measured by using Black & Sholes model which take into consideration time and conditions of the share options.
Social security tax is accrued each quarter for the difference between the market value and the exercise value of the granted but not exercised share options.
3.10: Inventories
Inventories under manufacturing are estimated to lowest of manufacturing cost and net realisable value. For finished goods, the net realisable value is calculated as the sellling price less cost to sell. For work in progress and finished products, the acquisition cost is calculated as direct and indirect costs. Inventories are assessed using the FIFO method.
3.11: Leases
The determination of whether an arrangement is, or contains, a lease is based on the substance of the arrangement at inception date: whether fulfilment of the arrangement is dependent on the use of a specific asset or assets or the arrangement conveys a right to use the asset.
Finance leases, which transfer to the Group substantially all the risks and benefits incidental to ownership of the leased item, are capi-talised at the commencement of the lease at the fair value of the leased property or, if lower, at the present value of the minimum lease payments. Lease payments are apportioned between finance charges and reduction of the lease liability so as to achieve a constant rate of interest on the remaining balance of the liability. Finance charges are recognised in the income statement.
/ Notes to the Consolidated Financial Statements 2010
Q-Free Annual Report 2010Reporting
50

Leased assets are depreciated over the useful life of the asset. However, if there is no reasonable certainty that the Group will obtain ownership by the end of the lease term, the asset is depreciated over the shorter of the estimated useful life of the asset and the lease term.
Operating lease payments are recognised as an expense in the income statement on a straight line basis over the lease term.
3.12: Investment in shares
Investments in shares is classified as financial assets at fair value through profit or loss. The fair value of investments is determined by reference to quoted market bid prices at the close of business on the balance sheet date. For investments where there is no active market, fair value is determined applying commonly used valuation techniques. For further details see note 25.
3.13: Accounts receivable and other short term receivables
Accounts receivable and other short term receivables are entered at face value after deduction for provision for impairments on receiva-bles. Provision for impairment on receivables is based on an individual assessment of each receivable and overall an assessment of the total portfolio of receivables.
A provision for impairment is made when there is objective evidence (such as the probability of insolvency or significant financial dif-ficulties of the debtor) that the Group will not be able to collect all of the amounts due under the original terms of the invoice. The carrying amount of the receivable is reduced through use of an allowance account. Impaired debts are derecognised when they are assessed as uncollectible.
3.14: Pension costs and pension assets and liabilities
Q-Free ASA has a defined benefit- and a defined contribution pension plan for the employees. Both pension plans meet the criteria for OTP. (Obligatorisk Tjeneste Pensjon) Pension cost are calculated according to IAS 19 for both plans. Net pension cost for the year include estimated pension contribution including future salary growth, estimated return on pension funds and potential effects of changes in pension plans and estimates. Net pension cost is classified as payroll expense in the profit and loss statement. Pension funds and pension liabilities are valued based on best estimates adjusted annually based on actuary reports. The accumulated effects from changes in actuarial and financial assumptions are distributed over the remaining recognition period for the portion of the change exceeding more than 10% of the largest of pension liabilities and pension funds as of 1 January. The pension liabilities is secured through an insurance company. The pension cost of the contribution plan is expensed as it accrues, see note 16 for further details.
3.15: Taxes
The tax expense consists of the tax payable and changes to deferred tax. Deferred tax/tax assets are calculated on all differences between the book value and tax value of assets and liabilities, with the exception of: + temporary differences linked to goodwill that are not tax deductible + temporary differences related to investments in subsidiaries or associates when the Group controls when the temporary differences
are to be reversed and this is not expected to take place in the foreseeable future.
Deferred tax assets are recognised when it is probable that the Group will have a sufficient profit for tax purposes in subsequent periods to utilise the tax asset. The companies recognise previously unrecognised deferred tax assets to the extent it has become probable that the company can utilise the deferred tax asset. Similarly, the company will reduce a deferred tax asset to the extent that the company no longer regards it as probable that it can utilise the deferred tax asset.
Deferred tax and deferred tax assets are measured on the basis of the expected future tax rates applicable to the companies in the Group where temporary differences have arisen.
Taxes payable and deferred taxes are recognised directly in equity to the extent that they relate to equity transactions.
/ Notes to the Consolidated Financial Statements 2010
Q-Free Annual Report 2010Reporting
51

3.16: Cash and cash equivalents
Cash includes cash in hand and at bank. Cash equivalents are short-term liquid investments that can be immediately converted into a known amount of cash and have a maximum term to maturity of three months.
3.17: Cash fl ow statement
The cash flow statement is prepared according to the indirect method. Cash is considered as a deposit at call in bank or similar finan-cial institutions. Consented, not full-drawn bank overdrafts is not considered liquid capital. All items in the cash flow statement is net effects from the continued operation unless stated otherwise.
3.18: Events after the balance sheet date
New information on the company’s positions at the balance sheet date is taken into account in the annual financial statements. Events after the balance sheet date that do not affect the company’s position at the balance sheet date, but which will affect the company’s position in the future, are stated if significant. No such significant events has occurred in 2011.
3.19: Business segments
For management purposes, the Group is organised into geographical areas based on the location of the customer. Transfer prices between operating segments are on an arm’s length basis, similar to transactions with third parties. Further details on the group operating segments are given in note 5.
3.20: Changes in accounting policy and disclosures
The accounting policies adopted are consistent with those of the previous financial years.
The below listed standards or interpretations are adopted by the Group. The adaptation of the standards and interpretations has no impact on the financial statements or performance of the Group.
IFRS 3 – Revised: Business combinations, IFRS 3(revised) introduces signifi cant changes in the accounting for business combinations occurring
after becoming effective. Changes affect the valuation of non-controlling interest, the accounting for transaction costs, the initial recog-
nition and subsequent measurement of a contingent consideration and business combinations achieved in stages. These changes will
impact the amount of goodwill recognized, the reported results in the period that an acquisition occurs and future reported results.
IAS 27 – Revised: Consolidated and Separate Financial Statements. IAS 27 (amended) requires that a change in the ownership interest of a sub-
sidiary (without a loss of control) is accounted for as a transaction with owners in their capacity as owners. Therefore, such transactions
will no longer give rise to goodwill, nor will it give rise to a gain or loss. Furthermore, the amended standard changes the accounting for
losses incurred by the subsidiary as well as the loss of control of a subsidiary.
IFRS 2 – Share-based Payment (Amendment). The amendment clarifi es the scope and the accounting for group cashsettled share-based pay-
ment transactions.
IAS 1 – (amendment), Presentation of fi nancial statements. The amendment is effective from 1 January 2010. It provides clarifi cation that the
potential settlement of a liability by the issue of equity is not relevant to its classifi cation as current or non-current.
IAS 36 – (Amendment) – Impairment of assets, effective 1 January 2010.
IFRIC 9 – Reassessment of embedded derivatives and IAS 39 – Financial instruments: decognition and measurement, effective 1 July 2009.
IFRIC 16 – Hedges of a Net Investment in a Foreign Operation. The interpretation became effective 1 October 2009. It clarifi es the accounting treat-
ment in respect of net investment hedging. This includes the fact that net investment hedging relates to differences in functional currency
and not presentation currency, and hedging instruments may be held anywhere in the Group.
IFRIC 17 – Distribution of non-cash assets to owners. The interpretation became effective on 1 July 2009. It provides guidance on accounting for
arrangements whereby an entity distributes non-cash assets to shareholders either as a distribution of reserves or as dividends.
IFRIC 18 – Transfers of assets from customers, effective for transfer of assets received on or after 1 July 2009.
/ Notes to the Consolidated Financial Statements 2010
Q-Free Annual Report 2010Reporting
52

3.22: New standards and interpretations not yet adopted
The following are new IFRS standard, amendments and interpretations not effective for the year ended 31. December 2010, and have not been applied in preparation of these consolidated financial statements.
IFRS 9 – Financial instruments.
IAS 24 (Revised) – Related party disclosure.
Classifi cation of rights issues – amendment to IAS 32.
IFRIC 19 – Extinguishing fi nancial liabilities with equity instruments.
Note 4 / Financial risk management Q-Free has centralised management of financial risk. The Board has adopted guidelines for the Group’s financial risk management, which are embodied in the corporate Financial Policy. Q-Free seeks to limit financial risk and increase predictability while exploiting finance as a competitive factor.
The Group is exposed to different financial market risks arising from our normal business activities, mainly these: A) Credit risk
B) Currency risk
C) Liquidity risk
D) Interest rate risk
A) Credit risk
The Group is only conducting business with parties with an acceptable credit record. To the extent the credit rate is questionable, pay-ment guarantees, letter of credit or advance payments will be considered. The Group has no significant credit risk linked to an individual contracting party or several other contracting parties that can be regarded as a group due to similarities in the credit risk. The Group has guidelines for ensuring that sales are only made to customers that have not experienced any significant credit problems, and that outstanding amounts do not exceed given credit limits. The Group is exposed to risk involved in customers not having the ability to fulfil their financial obligations. However, this risk is considered to be low since the Group’s customers are major IT companies, public authorities, larger foreign road operators and key road Concessionaires in Norway and abroad. This is documented by a historically low bad debt ratio on accounts receivables. When Q-Free enters a new market, the credit risk will be assessed in each individual case and appropriate actions like utilising letter of credits and other similar tools, will be used in order to reduce credit risk. The Group has not provided any guarantees for third parties’ liabilities.
An aging analysis of trade receivables as at 31. December 2010 and 2009 are given in note 21.
B) Currency risk
Q-Free has considerable foreign currency exposure since it earns between 60-75% of its revenues abroad. However, Q-Free also buys a substantial share of its needed equipment and services abroad and runs businesses outside Norway. This mitigates the Group’s net foreign currency exposure by 30-50%. The Group’s most important trading currencies except for NOK, are USD and EUR. Q-Free’s policy is to limit currency risk while actively assessing various currencies’ importance as competitive parameters.
The Group strategy is to combine estimated future sales and purchases and hedge the net cash flow in the foreign currency by using forward / future contracts.
Forward currency contracts are being used to hedge the foreign currency risk of the expected future sales. The Group holds no foreign exchange contracts as at 31 December 2010. (2009: TNOK 137). These foreign exchange contracts are classified as other financial assets measured as fair value. See note 20 for the fair value hierarchy and a specification on valuation technique applied .
/ Notes to the Consolidated Financial Statements 2010
Q-Free Annual Report 2010Reporting
53

See note 20 for a presentation of a sensitivity analysis regarding changes in EURO as at 31. December 2010 and 2009 and how this will affect the Group’s EBIT.
C) Liquidity risk
The Q-Free ASA Group’s strategy is to have sufficient cash, cash equivalents or credit facilities at any time to be able to finance its operations and investments over the next three years as required in the company’s strategy plan for the same period. Surplus liquidity is either deposited in banks or invested in money market funds, with the purpose of obtaining an acceptable return on invested capital combined with a low risk.
See note 20 for a presentation of the Group’s maturity profile of the Group’s financial liabilities as at 31 December 2010 and 2009.
D) Interest-rate risk
Since the Group has no significant amount of interest bearing debt the interest risk is immaterial. However if the Group will enter any significant interest bearing debt contracts, the group emphasises predictability at all times when changes in the interest level have a significant influence on the consolidated profit and will take actions to hedge this risk.
See note 20 for a presentation of a sensitivity analysis regarding changes in the interest rate and how this will affect the Group’s EBIT as at 31 December 2010 and 2009.
Note 5 / Operating segmentsFor management purposes, the Group is organised into geographical areas based on the location of the customer, and has three operating segments as follows:
+ Europe
+ Asia Pacifi c
+ Americas
Management monitors the operating results of its business units separately for the purpose of making decisions about resource alloca-tion and performance assessment. Segment performance is evaluated based on operating profit or loss and is measured consistently with operating profit or loss in the consolidated financial statements. However, Group financing (including finance costs and finance income) and income taxes are managed on a group basis and are not allocated to operating segments.
/ Notes to the Consolidated Financial Statements 2010
Q-Free Annual Report 2010Reporting
54

Operating Segments
2010 2009
EuropeAsia
Pacifi c Americas TOTAL EuropeAsia
Pacifi c Americas TOTAL
Profi t & Loss Account
55% 18% 27% 100% 80% 13% 7% 100%
Revenues 311,461 103,732 152,851 568,044 640,251 106,151 58,001 804,403
Cost of goods sold 96,937 59,305 111,991 268,233 209,126 56,513 37,790 303,429
Payroll expenses 143,438 15,741 8,307 167,486 132,467 16,764 4,481 153,712
Operating expenses 130,296 25,139 6,309 161,744 187,611 19,386 5,060 212,057
Total operating expenses 370,671 100,186 126,607 597,463 529,205 92,663 47,331 669,199
EBITDA -59,210 3,546 26,244 -29,418 111,046 13,488 10,670 135,205
Depreciation, amortisation and impairment 59,885 365 704 60,954 31,636 254 571 32,461
EBIT -119,095 3,181 25,540 -90,373 79,410 13,233 10,099 102,743
Balance sheet – Assets
Non current assets 236,035 17,545 4,843 258,423 217,450 12,176 3,833 233,459
Current assets 346,621 39,949 42,720 429,290 453,242 49,958 30,874 534,074
TOTAL ASSETS 582,656 57,494 47,563 687,714 670,692 62,134 34,707 767,534
Balance sheet – Liabilities
Non current liabilities 4,557 0 0 4,557 29,999 0 0 29,999
Current liabilities 118,337 47,525 17,878 183,741 123,531 47,525 17,878 188,935
TOTAL LIABILITIES 122,894 47,525 17,878 188,297 153,530 47,525 17,878 218,933
Key Figures
EBITDA – margin -19.0% 3.4% 17.2% -5.2% 17.3% 12.7% 18.4% 16.8%
EBIT – margin -38.2% 3.1% 16.7% -15.9% 12.4% 12.5% 17.4% 12.8%
Average annual man years 251 22 10 283 227 39 8 274
Average number of employees 255 25 10 290 234 40 8 282
Revenues Composition
2010 2009
Products 344,196 61% 258,068 32%
Service and maintenance 70,519 12% 77,537 10%
Projects 153,329 27% 468,798 58%
TOTAL REVENUES 568,044 100% 804,403 100%
/ Notes to the Consolidated Financial Statements 2010
Q-Free Annual Report 2010Reporting
55

Order Backlog by Operating Segments
2010 2009
Europe 310,134 53% 593,644 83%
Asia Pacifi c 40,402 8% 67,317 10%
Americas 224,596 39% 52,078 7%
TOTAL ORDER BACKLOG 575,132 100% 713,039 100%
Order Backlog by Business Areas
2010 2009
Products 251,291 44% 83,165 12%
Service and maintenance 157,388 27% 181,802 25%
Projects 166,453 29% 448,072 63%
TOTAL ORDER BACKLOG 575,132 100% 713,039 100%
Note 6 / Business combinations
Acquisitions in 2010
There was no acquisitions during 2010
Acquisitions in 2009
Acquisitions of Building Capital LtdQ-Free ASA has purchased 100 percent of the shares of Building Capital Ltd, located in London, UK. Building Capital Ltd was founded in 2002 and has attained high competence and extensive experience within the tolling industry. The company has references throughout Europe within Road User Charging in general, and GNSS (e.g. GPS) based solutions
The consideration of the shares will be a combination of cash and Q-Free shares, with a maximum remuneration equivalent to GBP 600.000, with no less than GBP 360.000 in cash. The agreement will be in force from January 1st 2009, and with final payment Janu-ary 1st 2011.
Q-Free ASA approved in a Board meeting 6th of July 2009 to increase the share capital with NOK 7,447.62. The increase in the share capital is carried out according to proxy by issuance of 19,599 new shares with a par value of NOK 0.38. The share capital increased from NOK 20,875,107.34 to NOK 20,882,554.96. The increase in the share capital was approved in relation to the completion of the acquisition of Building Captial Ltd.
The current operations in Building Capital Ltd. are defined as part of the Group`s core business, and will play a significant role in the Group looking ahead.
/ Notes to the Consolidated Financial Statements 2010
Q-Free Annual Report 2010Reporting
56

The fair value (NOK) of the identifiable assets and liabilities of Building Capital Ltd. as at the date of acquisition were:
Previous carrying value
Fair value recognised on acquisition
Intangible assets
Non-competition agreement 2,805
TOTAL INTANGIBLE ASSETS 0 2,805
Other fi xed assets 55 55
Other current assets 82 82
Cash and cash equivalents 6 6
TOTAL ASSETS 143 2,957
Equity -55
Other short term debt -88 -88
TOTAL DEBT -143 -88
Net assets 2,869
Goodwill arising on acquisition 3,491
TOTAL ACQUISITION COST 0 6,360
Cash outfl ow on acquisition
Initial pre-payment 6,360
Earn-Out payment (2009 & 2010) –
Transaction costs –
TOTAL PURCHASE PRICE 6,360
The Purchase Price Allocation-window is open for 12 months from the acquisition date for subsequent accounting if and made only when new information about the possible outcome is obtained. Total Earn-Out payments are calculated based on expected future development contribution from the acquired company.
The intangible asset identified at the time of the acquisition was a non-competition agreement. This asset explain 44 percent of the total purchase price. The remaining amount of the excess price is allocated to other assets and goodwill, with the estimated value of assembled workforce and the fact that the purchase of the Building Capital Ltd shares is an important transaction in order to position the Group as a supplier of neutral technological solutions.
As of the takeover date (January 1st 2009) Building Capital Ltd. has contributed to the year end profit equivalent of TNOK ÷ 2.278. However the organisation has contributed positively in the execution of the Truck Tolling project in Slovakia.
Note 7 / Work in progress The Group’s main business activity is to develop and manufacture products and systems as well as provision of service and maintenance based on orders received. The Group reports gross balance sheet values attached to long-term production contracts. Gross amounts due from customers for contract work (Work in progress) are recognised on the balance sheet as an asset, and gross amounts due to customers for contract work (Prepayments from customers) are recognised on the balance sheet as a liability. Work in progress are the net amount of accumulated operating revenues less accumulated invoicing for all ongoing contracts where accumulated operating revenues are higher than accumulated invoicing. Prepayments from customers are the net amount of accumulated operating revenues less accumulated invoicing for all ongoing contracts where accumulated invoicing is higher than accumulated operating revenues.
/ Notes to the Consolidated Financial Statements 2010
Q-Free Annual Report 2010Reporting
57

Each project is monitored individually and is measured against the updated project prognosis. The estimated accrued contract profit shall not exceed a proportional share of the estimated total contract profit. The proportional share of the contract is based on the degree of completion of the individual contract, which is largely determined by the costs incurred as a ratio of the expected overall cost at the time of valuation. If the profit on a contract cannot be estimated with a reasonable degree of certainty, the project will be recognised without a profit until the uncertainty is manageable. All projects are followed up on an ongoing basis with project costing. In the event a project calculation shows a loss, this loss will be expensed immediately in its entirety.
Parent Company Group
2009 2010 Balance sheet items 2010 2009
62,552 54,551 Work in progress 54,461 64,699
-13 0 Prepayments from customers -16,601 -5,415
62,539 54,551 NET PROJECTS IN PROGRESS 37,860 59,285
Summary of work in progress as at 31.12
346,762 70,018 Contract revenues included in the consolidated fi nancial statement 97,869 381,003
519,565 539,963 Total contract orders 684,601 648,867
414,127 529,661 Accumulated revenues 654,701 497,141
105,439 10,301 Remaining revenues 29,899 151,727
308,759 333,270 Accumulated operating expenses 467,717 428,083
62,658 6,482 Remaining operating expenses 2,183 96,435
-13 0 Prepayments received -16,601 -5,415
0 0 Remaining variable expenses on loss-making projects 0 6,011
Note 8 / Other operating incomeThe Group has received governmental grants of a total of TNOK 10.870,- in 2010. Corresponding figures for 2009 was TNOK 6.127,-. The Group is a partner in several projects under The Research Council of Norway and projects initiated by the EU.
Contribution
2010 2009Governmental grants:Projects with contribution from The Research Council of Norway 6,543 6,127
Contribution from EU initiated projects 3,607 0
TOTAL 10,150 6,127
There are no conditions related to the grants that have not been met.
2010 2009
Grants recognised as other income related to cost in same period 10,150 6,127
Grants accounted as reduction of payroll expenses (Skattefunn) 720 0
TOTAL 10,870 6,127
/ Notes to the Consolidated Financial Statements 2010
Q-Free Annual Report 2010Reporting
58

Note 9 / Machinery, fi xtures and fi ttings
Parent company
Machinery and fi xtures Equipment TOTAL
Acquisition cost as at 1 January 2009 49,299 73,950 123,249
Additions 6,673 6,937 13,610
Disposals 0 3,710 3,710
Acquisition cost as at 31.12.09 55,972 84,597 140,569
Accumulated depreciation and impairments as at 01.01.09 26,994 41,676 68,670
Depreciation of the year 6,606 5,174 11,780
Impairments of the year 0 3,710 3,710
Accumulated depreciation disposals 0 0 0
Accumulated depreciation and impairments as at 31.12.09 33,600 50,560 84,160
Net book value as at 01.01.09 22,306 32,273 54,579
Total changes of the year 66 1,764 1,830
As at 31 December 2009 22,372 34,037 56,409
Acquisition cost as at 1 January 2010 55,972 84,597 140,569
Additions 8,563 3,266 11,829
Disposals 0 0 0
Acquisition cost as at 31.12.10 64,535 87,863 152,398
Accumulated depreciation and impairments as at 01.01.10 33,600 50,560 84,160
Depreciation of the year 16,195 7,455 23,650
Impairments of the year 0 0 0
Accumulated depreciation disposals 0 0 0
Accumulated depreciation and impairments as at 31.12.10 49,795 58,015 107,810
Net book value as at 01.01.10 22,372 34,037 56,409
Total changes of the year -7,632 -4,189 -11,821
As at 31 December 2010 14,740 29,848 44,588
Financial lifetime 4–5 years 5–10 years
Depreciation schedule Straight line Straight line
Securities for bank guarantees and overdraft facility
As at 31.12.10 assets in the parent company valued to TNOK 44.588,- ( 2009: 56.409,-) is pledged as security for guarantee facility in Fokus Bank ASA.
/ Notes to the Consolidated Financial Statements 2010
Q-Free Annual Report 2010Reporting
59

Group
Machinery and fi xtures Equipment TOTAL
Acquisition cost as at 1 January 2009 92,689 73,950 166,639
Additions 15,875 6,937 22,812
Acquisitions of a subsidiary 0 0 0
Disposals 0 3,710 3,710
Acquisition cost as at 31.12.09 108,564 84,597 193,161
Accumulative depreciation and impairments as at 01.01.09 61,025 41,676 102,701
Depreciation of the year 9,702 5,174 14,876
Impairments of the year 0 3,710 3,710
Accumulated depreciation disposals 0 0 0
Accumulated depreciation and impairments as at 31.12.09 70,727 50,560 121,287
Net book value as at 01.01.09 31,665 32,273 63,938
Total changes of last year 6,172 1,764 7,936
As at 31 December 2009 37,837 34,037 71,874
Acquisition cost as at 1 January 2010 108,564 84,597 193,161
Additions 14,834 3,266 18,100
Acquisitions of a subsidiary 0 0 0
Disposals 0 0 0
Acquisition cost as at 31.12.10 123,398 87,863 211,261
Accumulative depreciation and impairments as at 01.01.10 70,727 50,560 121,287
Depreciation of the year 19,258 7,455 26,713
Impairments of the year 0 0 0
Accumulated depreciation disposals 0 0 0
Accumulated depreciation and impairments as at 31.12.10 89,985 58,015 148,000
Net book value as at 01.01.10 37,837 34,037 71,874
Total changes of the year -4,424 -4,189 -8,613
As at 31 December 2010 33,413 29,848 63,261
Financial lifetime 4–5 years 5–10 years
Depreciation schedule Straight line Straight line
/ Notes to the Consolidated Financial Statements 2010
Q-Free Annual Report 2010Reporting
60

Note 10 / Intangible assets
Parent company
Goodwill
ProductDevelopment
Assets TOTAL
Acquisition cost as at 1 January 2009 0 116,383 116,383
Additions 0 26,236 26,236
Disposals 0 0 0
Acquisition cost as at 31.12.09 0 142,619 142,619
Accumulated depreciation and impairments as at 01.01.09 0 57,517 57,517
Depreciation of the year 0 5,291 5,291
Impairments of the year 0 0 0
Accumulated depreciation and impairments as at 31.12.09 0 62,808 62,808
Net book value as at 01.01.09 0 58,866 58,866
Total changes of last year 0 20,945 20,945
As at 31 December 2009 0 79,811 79,811
Acquisition cost as at 1 January 2010 0 142,619 142,619
Additions 0 44,484 44,484
Disposals 0 0 0
Acquisition cost as at 31.12.10 0 187,103 187,103
Accumulated depreciation and impairments as at 01.01.10 0 62,807 62,807
Depreciation of the year 0 5,904 5,904
Impairments of the year 0 17,473 17,473
Accumulated depreciation and impairments as at 31.12.10 0 86,184 86,184
Net book value as at 01.01.10 0 79,811 79,811
Total changes of the year 0 21,108 21,108
As at 31 December 2010 0 100,919 100,919
Impairment tested annually (or when impairment
indicators exists).Financial lifetime 5–10 years
Depreciation schedule Straight line
/ Notes to the Consolidated Financial Statements 2010
Q-Free Annual Report 2010Reporting
61

Group
Goodwill
ProductDevelopment
Assets TOTAL
Acquisition cost as at 1 January 2009 26,022 163,101 189,123
Additions 4,775 30,648 35,423
Acquisitions of a subsidiary 3,491 2,805 6,296
Disposals 0 0 0
Acquisition cost as at 31.12.09 34,288 196,554 230,842
Accumulative depreciation and impairments as at 01.01.09 0 61,106 61,106
Depreciation of the year 0 13,876 13,876
Impairments of the year 0 0 0
Accumulated depreciation disposals 0 0 0
Accumulated depreciation and impairments as at 31.12.09 0 74,982 74,982
Net book value as at 01.01.09 26,022 101,995 128,017
Total changes of last year 8,266 19,577 27,843
As at 31 December 2009 34,288 121,572 155,860
Acquisition cost as at 1 January 2010 34,288 196,554 230,842
Exchange rate differences on acquisitions -1,253 52,752 51,499
Reclassifi cation * -3,491 3,491 0
Acquisition cost as at 31.12.10 29,544 252,797 282,341
Accumulative depreciation and impairments as at 01.01.10 0 74,982 74,982
Depreciation of the year 0 16,768 16,768
Impairments of the year ** 0 17,473 17,473
Accumulated depreciation and impairments as at 31.12.10 0 109,223 109,223
Net book value as at 01.01.10 34,288 121,572 155,860
Total changes of the year -4,744 22,002 17,258
As at 31 December 2010 29,544 143,574 173,118
* Acquired goodwill 2009 is reclassifi ed as Product Development Assets during 2010. See note 11 for further details.** In the third Quarter 2010 the Group impaired capitalised development cost related to operational back offi ce development used in Truck Tolling systems.
Impairment tested annually (or when impairment
indicators exists).Financial lifetime 5–10 years
Depreciation schedule Straight line
Development
The group capitalises costs regarding product development activities. Capitalised costs for 2010 consist of product development of a new generations of OBU’s and road side units that is a part of the company’s toll road systems. Furthermore, the company has capi-talised cost that prepares the company’s products for future wireless communication solutions that enables continuous communication between vehicles and the roadside infrastructure. Such cooperative vehicle-infrastructure systems will allow new traffic information-sharing services for greater safety, efficiency and a better environment.
/ Notes to the Consolidated Financial Statements 2010
Q-Free Annual Report 2010Reporting
62

For 2010 research-expenses in the P&L has been immaterial.
Capitalised costs mainly consist of personnel expenses, purchase of materials, as well as external services. Product development is depreciated over the products expected lifetime. The estimated useful lifetime is continuously evaluated.
Note 11 / Impairment testing of goodwillGoodwill obtained through business combination is allocated to the cash generating units acquired and the impairment testing is based on the discounted cash flow calculations for each cash generating unit.
Carrying amount of goodwill allocated to each of the cash-generating unit:
2010 2009
OEM software for use in video- & picture processing in ITS 29,544 30,797
Global Navigation Satellite Systems (GNSS) technology used in Road User Charging projects * 0 3,491
CARRYING AMOUNT OF GOODWILL AS AT 31. 12: 29,544 34,288
*Carrying amount of goodwill on GNSS-technology used in Road User Charging projects pr 31.12.09 is reclassifi ed as product development assets during 2010.
Impairment testing of Goodwill as at 31. December 2010
OEM software for use in video- & picture processing in ITS cash generating unitsThe Group performed its annual impairment test as at 31 December 2010. The Group considers the relationship between its market capitalisation and its book value, among other factors, when reviewing for indicators of impairment. The discounted cash flow method is used to ascertain calculated value in use. The projected cash flow is based on budgets and long-term plans, which are subject to the approval of the Board and the corporate management. Long-term plans is equivalent to the Group Strategy and covers a period of five years. Future improvements to products and new developments are not reflected in the future cash flow.
The recoverable amount of the OEM software for use in video- & piture processing in ITS cash-generating unit has been determined based on a value in use calculation using cash flow projections from financial budgets approved by the Board covering a five year period. It is generally expected that the company will manage to hold its strong market position in delivering high performance soft-ware for video and picture processing used in Intelligent Traffic Systems. Expectations about the total market development are based on external market expectations, e.g. the estimated growth rate for the ITS market world wide. Market growth is expected to be exceeding 25% per year. The backlog of orders for license revenues is high, and it has a strong position in niche markets. The pre-tax discount rate applied to cash flow projections is 12% (2009: 10.4%) and cash flow beyond the five-year period are extrapolated using a 5.0% growth rate (2009: 5.0%) that is a prudent estimate compared to the industry’s annual compounded growth rate on 30% for the next five years.
Key assumptions used in value in use calculations
The calculation of value in use for OEM software for use in video- & picture processing in ITS are most sensitive to the following assumptions:+ Gross margins;
+ Discount rates;
+ Raw materials price infl ation;
+ Market share during the budget period; and
+ Growth rate used to extrapolate cash fl ows beyond the budget period.
/ Notes to the Consolidated Financial Statements 2010
Q-Free Annual Report 2010Reporting
63

+ Gross margins – Gross margins are based on budgetary and on forecasting values that is the outcome of the Group’s managerial strategic process. The forecasting values are increased over the budget period for anticipated efficiency improvements.
+ Discount rates – Discount rates reflect the management’s estimate of the risks specific to each unit. This is the benchmark used by management to assess operating performance and to evaluate future investment proposals. In determining appropriate discount rates for each unit, regard has been given to the yield on a ten-year government bond at the beginning of the budgeted year.
+ Raw materials price inflation – Estimates are obtained from published indices for the countries from which materials are sourced, as well as data relating to specific commodities. Forecast figures are used if data is publicly available, otherwise past actual raw material price movements have been used as an indicator of future price movements.
+ Market share assumptions – These assumptions are important because, as well as using industry data for growth rates (as noted below) management assess how the unit’s position, relative to its competitors, might change over the budget period. Manage-ment expects the Group’s share of the Intelligent Traffic Systems (ITS)- market to be stable over the budget period, whereas for the reasons explained above, the Board expects the Group’s position, relative to its competitors, to strengthen following the acquisition of Dacolian BV in 2008.
+ Growth rate estimates – Rates are based on published industry research.
Sensitivity to changes in assumptions
With regards to the assessment of value-in-use of the OEM software for use in video- & picture processing in ITS, management believes that no reasonably possible change in any of the above key assumptions would cause the carrying value of the unit to materially exceed its recoverable amount.
Note 12 / Earnings per share Basic earnings per share amounts are calculated by dividing net profit for the year attributable to ordinary equity holders of the parent by the weighted average number of ordinary shares outstanding during the year.
Diluted earnings per share amounts are calculated by dividing the net profit attributable to ordinary equity holders of the parent by the weighted average number of ordinary shares outstanding during the year plus the weighted average number of ordinary shares that would be issued on the conversion of all the dilutive potential ordinary shares into ordinary shares.
2010 2009
Profi t for the year -57,104 78,310
Weighted average number of ordinary shares 60,247,010 55,536,269
Weighted average of share option (1.730.000 share options granted during 2010 calculated to 1.393.507 as weighted average) 1,393,507 840,000
Weighted average number of diluted shares 61,640,507 56,376,269
Earnings per share -0.94 1.41
Diluted earnings per share -0.93 1.39
There have been no other transactions involving ordinary shares or potential ordinary shares between the reporting date and the date of completion of these financial statements.
/ Notes to the Consolidated Financial Statements 2010
Q-Free Annual Report 2010Reporting
64

Note 13 / Issued capital and reservesValue per share is kr. 0,38. Total share capital as at 31.12.2010 was kr. 22.893.864. There were 1.387 shareholders at the end of 2010.
Ordinary shares
2010 2009
Shares issued as at 01.01 60,054,092 53,976,213
Share issue 192,918 5,745,379
Share options excercised 0 332,500
TOTAL SHARES ISSUED AS AT 31.12.10 60,247,010 60,054,092
The company’s largest shareholders as at 31.12.10
Number of shares
Percentage ownership
Erste Bank Der Oesterreichischen 9,933,000 16.49%
Odin Norge 5,335,668 8.86%
Skagen Vekst 2,900,000 4.81%
DnB NOR SMB VPF 2,325,000 3.86%
JPMorgan Chase Bank 1,974,500 3.28%
Holberg Norge 1,744,022 2.89%
Kikut AS 1,654,000 2.75%
Andresen Lars Oddgeir 1,633,600 2.71%
Redback AS 1,495,000 2.48%
Vital Forsikring ASA 1,375,667 2.28%
Bank Austria Creditanstalt AG 1,187,017 1.97%
VPF Nordea Kapital 1,065,814 1.77%
Mons Holding AS 1,040,000 1.73%
VPF Nordea Avkastning 861,932 1.43%
Sandnes Investering AS 817,196 1.36%
Sabaro Investments Ltd. 775,772 1.29%
DnB NOR Norge (Iv) VPF 772,960 1.28%
Deutsche Bank International Ltd. 750,000 1.24%
Warrenwicklund Norge 696,865 1.16%
Statoil Pensjon 605,625 1.01%
Other share holders 21,303,372 35.36%
TOTAL 60,247,010 100.0%
/ Notes to the Consolidated Financial Statements 2010
Q-Free Annual Report 2010Reporting
65

Number of shares held by the senior management, CEO and the Board of Directors as at 31.12.2010:
Name Position Shares
Jan Pihl Grimnes Board member 1,545,000
Jos Nijhuis VP R&D 517,552
Ole Jørgen Fredriksen Chairman of the Board 168,884
Øyvind Isaksen CEO 91,989
Mimi Kristine Berdal Board member 50,000
Roar Østbø CFO 47,000
Steinar Furan Advisor to CEO 22,500
Marianne Sandal VP Operations 17,000
Stein Tore Nybrodahl HR Manager 7,500
Per Fredrik Ecker VP Sales 6,500
TOTAL 2,473,925
At the end of 2010 2.320.000 shares are reserved according to the share option program descibed in note 17.
Note 14 / Inventory and cost of goods sold
Parent Company Group
2009 2010 2010 2009
Inventory
Inventory specifi cation17,020 33,206 Raw material and semi manufactured products 47,717 30,639
53 53 Stock for sub supplier 53 53
1,620 306 Stock for maintenance contracts 306 1,620
0 0 Work in progress 3,963 4,353
12,892 8,382 Finished goods 15,364 12,949
-6,204 -2,616 Obsolescence -6,250 -9,286
25,381 39,332 TOTAL 61,154 40,328
All inventories are valuated at lower of cost and net realisable value. The amount of write-down of inventories recognised as an expense is for the Parent company TNOK 2.356 in 2010 (2009: 1.819) and for the group TNOK 2.356 in 2010 ( 2009: 1.544) which is recog-nised in cost of goods sold.
Parent Company Group
2009 2010 2010 2009
Cost of goods sold
COGS specifi cation249,176 89,353 Purchase of goods 251,014 310,035
321 87 Freight, customs etc. 672 889
356 168 External services handling of COGS 168 356
-7,625 13,951 Change of inventories 16,379 -7,851
242,228 103,559 TOTAL 268,233 303,429
/ Notes to the Consolidated Financial Statements 2010
Q-Free Annual Report 2010Reporting
66

Note 15 / Salaries and personnel related expenses
Parent Company Group
2009 2010 2010 2009
93,062 106,194 Salaries 160,759 138,353
14,811 15,574 Social security costs 18,138 17,452
5,354 10,907 Pension costs 19,648 9,033
0 720 Skattefunn (governmental tax relief) 0 0
-10,167 -32,428 Other personnel related costs -31,779 -11,125
103,060 100,967 TOTAL 166,766 153,713
126 137 Average number of employees 290 282
123 135 Average number of man-years 283 274
Main principles for stipulation of salary and other remuneration to leading employees
Q-Free is a leading national Company within its area of business. To maintain and to strengthen its market position, and to reach the objectives the Board has set for the Company, Q-Free is dependent on recruiting and keeping employees, management included, with substantial competence. The Company must therefore grant competitive wages to its leading employees. The Board therefore states that the fixed monthly salary for the respective manager’s shall represent competitive wages, and that this shall reflect the respective manager’s personal responsibilities and competence.
On top of the fixed monthly salary, there should be the option to grant a bonus that will depend on the results of the company on performance of the individual employee. The Board has therefore established a bonus plan for the Company’s employees, managers included. Such bonus can for the CEO be maximum 80% of the fixed yearly salary, and for the other members of the management team maximum 40% of the fixed yearly salary. The bonus shall in general terms be linked to Q-Free’s fulfilment of further defined objectives for the period; result targets and/or other established objectives for the Company. These objectives shall each year be established by the Company’s Board, and may be linked to financial results, results within research and development, quality objectives and/or further established individual result targets or objectives for the individual manager. In extraordinary cases it can be awarded a discretionary bonus to employees in the Company, limited nominated up to 40% of the employees fixed yearly salary.
On top of the fixed monthly salary, bonus according to achieved results and adopted option plans, the agreement with the individual manager can include that he or she shall receive payment in kind, as for example receiving free newspapers/journals, free phone, free internet-subscription etc. In individual cases it can also be agreed that the manager concerned shall have a Company car at disposal according to the prevailing regulations.
Q-Free has established a collective pension scheme for its employees that also include the leading employees. On top of the pension payment that comes from such scheme, and on top of the payments offered through public pension arrangements, the members of the Company’s management team can be offered an individual pension agreement. The Board states that in individual cases further pension arrangements can also be made. Q-Free has established a group life insurance for the management team.
The Board of Q-Free further states that there shall be a mutual period of notice of six (6) months for agreements made with leading employees. For the General Manager the period of notice should be extended with two (2) months for each year he or she has been employed by the Company, however so that the maximum period of notice shall be twelve (12) months. In case of substantial changes
/ Notes to the Consolidated Financial Statements 2010
Q-Free Annual Report 2010Reporting
67

in position due to mergers and acquisitions the maximum payment period in case of termination of employment is set to 24 months including notice period. In individual cases other arrangements with regards to resignation can be agreed, hereunder agreements of payment after the termination of employment. The Board shall be empowered to depart from the principles above in individual cases.
The principles for remuneration have not been changed during the last year.
No loans or guarantees have been provided to the Chief Executive Officer, Board members, shareholders or close associates of these individuals. With regard to notice of termination of employment for the CEO, the notification period is mutually 6 months and the period is extended with 2 months for each year of employment in the company, with a maximum termination period of 12 month. In case of substantial changes in position due to mergers or acquistions, the maximum payment period in case of termination of employment is set to 24 months including notice period. The CEO has 675,000 share options in the company.
Payments to senior management and Board of Directors 2010
Salary BonusDirector's
remunerationPension
service costOther
remunerationShare
option cost TOTAL
Ole Jørgen Fredriksen, Chairman of the Board 432.5 20.9 375.8 829.2
Christian Albech, Board member 240.0 187.9 427.9
Torild Skogsholm, Board member 262.5 187.9 450.4
Jan Pihl Grimnes, Board member 225.0 187.9 412.9
Mimi Kristine Berdal, Board member 275.0 2.2 187.9 465.1
Sissel Lillevik Larsen, Employee elected Board member 120.0 120.0
Anders Hagen * , Employee elected Board member 75.0 75.0
Frank Aune ** , Employee elected Board member 37.5 37.5
Øyvind Isaksen, Chief Executive Offi cer 2,714.0 1,750.0 168.4 251.0 1,187.5 6,070.9
Marianne Sandal, Vice President Operations 1,641.1 395.1 217.3 19.4 263.9 2,536.8
Roar Østbø, Chief Financial Offi cer 1,972.7 281.6 44.2 176.0 263.9 2,738.4
Jos A.G. Nijhuis***, Vice President R&D 1,173.0 103.6 39.6 1,316.2
Per Fredrik Ecker, Vice President Sales 1,390.1 133.6 180.7 14.3 263.9 1,982.6
Stein-Tore Nybodahl, HR Manager 885.3 198.8 169.2 14.7 79.2 1,347.2
Steinar Furan, Advisor to CEO 939.0 186.5 120.9 13.5 263.9 1,523.8Henrik Stoltenberg, Vice President Business Development and M&A 1,654.0 1.7 401.0 2,056.7
Hans Christian Bolstad****, former Vice President R&D 1,163.8 146.8 174.4 19.7 263.9 1,768.6
TOTAL 13,533.0 3,092.4 1,667.5 1,178.7 533.4 4,154.2 24,159.2
* Anders Hagen served as employee elected Board member until GF May 2010.** Frank Aune served as employee elected Board member from GF May 2010.*** Jos A. G. Nijhuis entered the position as Vice President R&D 1st of November 2010**** Hans Christian Bolstad left the position as Vice President R&D 31th of October 2010
/ Notes to the Consolidated Financial Statements 2010
Q-Free Annual Report 2010Reporting
68

Payments to senior management and Board of Directors 2009
Salary BonusDirector's
remunerationPension
service costOther
remunerationShare
option cost TOTAL
Ole Jørgen Fredriksen, Chairman of the Board 175.0 21.5 307.0 503.5
Christian Albech, Board member 90.0 1.0 153.0 244.0
Torild Skogsholm, Board member 97.5 153.0 250.5
Jan Pihl Grimnes, Board member 75.0 153.0 228.0
Mimi Kristine Berdal, Board member 140.0 4.3 153.0 297.3
Sissel Lillevik Larsen, Employee elected Board member 45.0 45.0
Anders Hagen, Employee elected Board member 37.5 37.5
Øyvind Isaksen, Chief Executive Offi cer 2,752.5 750.0 136.7 568.0 4,207.2
Marianne Sandal, Vice President Operations 1,584.0 114.7 174.3 124.0 1,997.1
Roar Østbø*, Chief Financial Offi cer 1,329.4 46.8 124.0 1,500.2
Jos A.G. Nijhuis, General Manager Dacolian B.V. 1,136.0 106.8 1,242.8
Per Fredrik Ecker, Vice President Sales 1,325.1 338.8 140.3 124.0 1,928.2
Stein-Tore Nybodahl, HR Manager 833.5 78.8 142.1 38.0 1,092.5
Steinar Furan, Vice President of Business Development and Compliance 898.4 51.0 96.4 124.0 1,169.8
Hans Christian Bolstad, Vice President R&D 1,146.0 99.1 143.7 124.0 1,512.8
Bjørn Kleven**, Acting Chief Financial Offi cer 927.4 112.8 116.7 1,157.0
TOTAL 11,932.3 1,545.3 660.0 1,104.0 26.8 2,145.0 17,413.3
* Roar Østbø entered the position as CFO 1st of May 2009.** Bjørn Kleven acted as CFO until 30th of April 2009.
No loans or guarantees have been provided to the Chief Executive Offi cer, Board members, shareholders or close associates of these individuals.
Note 16 / Pension schemeQ-Free ASA (the parent company) has a defined benefit – and a defined contribution pension plan for the employees. Both pension plans meet the criteria for OTP. Pension cost are calculated according to IAS 19 for both plans. All employees in Norway are included in the pension plans which entitles them to certain benefits for pension in the future. The pension benefits are mainly dependable on numbers of years employed, level of salaries at age of retirement and size of payments. As at 31.12.2010 146 employees are included in the defined contribution pension plan and 43 employees are included in the defined benefit plan. All new employees will be a part of the defined contribution pension plan.
The pension plans for the Norwegian companies are secured in an insurance company. The liability for the Group includes 189 employ-ees in 2010, compared to 185 employees for 2009. The liability for the parent company includes 144 employees in 2010, compared to 137 employees for 2009. The acquisition of Dacolian BV in 2008 did not affect the defined benefit pension plan, as all employees in The Netherlands have a defined contribution pension plan.
/ Notes to the Consolidated Financial Statements 2010
Q-Free Annual Report 2010Reporting
69

Parent Company Group
2009 2010 2010 2009
5,300 5,599 Net present value of current year's pension earnings 6,771 6,687
1,182 1,290 Interest on accrued pension liabilities 1,753 1,556
-823 -1,269 Expected interest on pension funds -1,953 -1,477
0 258 Amortisation of past service cost 1,245 0
230 0 Amortisation of actuarial (gain) / losses -1,090 260
229 210 Administrative expenses pension scheme 347 396
830 822 Accrued social security expenses 958 984
6,947 6,910 NET PENSION EXPENSES * 8,032 8,406
Pension liabilities / (-funds)
29,429 39,976 Estimated pension liabilities 28,692 41,101
-20,117 -20,627 Estimated pension funds -8,672 -32,071
9,311 19,350 Estimated net (pension funds) / -liabilities 20,020 9,030
-7,587 -17,929 Unrecognised change in pension plan and deviation in estimates -18,755 -7,564
1,725 1,421 Net (pension funds) / -liabilities 1,264 1,466
0 2,728 Accrued social security expenses 2,672
1,725 4,149 NET (PENSION FUNDS) / -LIABILITIES IN BALANCE SHEET 3,936 1,466
21.5 20.7 Estimated remaining contribution periods 19.7 18.9
* During 2010 costs from the defi ned contribition pension plan represents TNOK 3.196,- (2009: TNOK 2.385,-) , and this is included in the above specifi cation of net pension expenses.
Pension liabilities
31,198 29,429 Liabilities as at 01.01. 41,101 41,432
5,300 5,599 Service costs 6,771 6,687
-199 -200 Benefi ts paid -566 -547
1,182 1,290 Interest cost 1,753 1,556
0 0 Past service cost 0 0
-8,052 3,858 Actuarial gains/losses 2,203 -8,027
29,429 39,977 TOTAL LIABILITIES AS AT 31.12. 51,261 41,101
Pension funds
12,251 20,117 Funds as at 01.01. 32,071 23,110
4,851 3,722 Net contribution paid 4,514 5,505
-199 -200 Benefi ts paid -526 -509
823 1,269 Estimated return on assets 1,953 1,675
2,391 -4,282 Actuarial gains/losses -5,430 2,290
0 0 Acquisition / (disposal) 0 0
20,117 20,627 TOTAL FUNDS AS AT 31.12. 32,581 32,071
-29,429 -39,977 Pension liabilities -51,261 -41,101
20,117 20,627 Pension funds 32,581 32,071
-9,311 -19,350 SURPLUS / (DEFICIT) -18,680 -9,030
The Group expects to contribute approximatly TNOK 8.520- to its pension plans in 2011, corresponding figures for 2010 was TNOK 7.500.
/ Notes to the Consolidated Financial Statements 2010
Q-Free Annual Report 2010Reporting
70

Basis and assumptions for calculations
2010 2009
Discount rate 3.20% 4.40%
Expected interest on pension funds 4.60% 5.60%
Annual growth in salaries 4.00% 4.25%
Long term infl ation 2.75% 2.75%
Increase in national insurance base rate (G) 3.75% 4.00%
Expected change in pensions 0.50% 1.30%
Social security expenses 14.10% 14.10%
Corridor 10.00% 10.00%
Table K2005 is used for defi nition of mortality rate probability. Expected voluntarily early retirement:
Before 40 years 2% 2%
After 40 years 0% 0%
The Group's pension fund is managed by Vital Forsikring Finansforvaltning, an insurance company. For 2010 the dividend yield was 6.8 percent (2009: 4.8%). The funds are distributed as follows:
2010 2009
Shares 21% 14%
Bonds 15% 23%
Money market 12% 9%
Long term bonds 32% 35%
Property 18% 17%
Other 2% 2%
TOTAL 100% 100%
Note 17 / Share option program for employeesQ-Free ASA established in May 2009 a new three year share option program. According to the Board’s proposal it was unanimously resolved that the Board, as part of the work of giving key personnel, management and Board members elected by the shareholders an incentive program, through the possibility to subscribe shares in the company, the Board of Directors was authorised to increase the share capital with as much as NOK 1.026,000, which corresponds to 2,700,000 shares (approximately 5%), each with a par value of NOK 0.38, through one or more private placements with cash deposits towards key personnel, management and Board members elected by the shareholders in Q-Free ASA. The existing shareholders’ preferential rights according to the Public Limited Companies Act sections 10-4 and 10-5 can be disregarded. The authorisation given in 2009 is valid for two years.
The authorisation regards the implementation of a share options program in Q-Free ASA, which runs over a period of 3 years for key personnel and management, and 2 years for Board Members elected by the shareholders. 600,000 shares are reserved for Board Members elected by the shareholders, and the remaining 2,100,000 shares are reserved for the share option program for key personnel and management. There will not be paid any option premium. The strike price shall be equal to the average share price for the Q-Free ASA shares on the Oslo Stock Exchange on closing time the last 14 days prior to and the first 14 days subsequent to the ordinary General Meeting in the year prior to the vesting period.
/ Notes to the Consolidated Financial Statements 2010
Q-Free Annual Report 2010Reporting
71

For key personnel and management who are awarded option rights for a period of 3 years, 1/3 of the options will be allocated annually with a vesting period of 1 year and the strike price determined as noted above. Correspondingly, ½ of the options will be allocated annually for Board Members elected by the shareholders. For newly employed key personnel, management and Board Members, the strike price will be determined on the day they are granted the options. Market value of the share options is estimated at the time they are granted and is expensed over the period the share aoptions are earned.
As at 31.12.2010, 1,730,000 options are granted for key personnel, of which 600,000 options have been granted to the Board of Directors. Exercise of the options can be done during pre-defined time periods.
Specifi cation of share option activity
2010 2009
Granted share options 01.01 840,000 2,325,000
Share options granted 890,000 840,000
Share options exercised 0 -875,000
Share options expired/terminated 0 -1,450,000
Granted share options 31.12 1,730,000 840,000
VESTED SHARE OPTIONS 31.12 840,000 0
Modifi cation of grants
Fair value of share options is calculated according to the Black & Scholes pricing model with a reduction of 15% due to illiquidity of the Q-Free share. Average fair value of granted share options in 2010 is NOK 4.60. Corresponding figure for 2009 was NOK 4.81. Strike price for the granted options was 15,57 in 2009 and 18,41 in 2010.
The company’s cost of share based payment is calculated using the Black & Scholes pricing model. For 2010 this adds up to a total cost of TNOK 3.976,-. Corresponding figures for 2009 was TNOK 2.539,-. See this specified in the Statement of changes in Equity.
Granted share options as at 31. December 2010 has the following conditions:
Outstanding Options Vested options
Exersice price
Outstanding Options as at
31.12.2010
Weighted average remaining
Contractual LifeWeighted Average
Exercise PriceVested options
31.12.2010Weighted Average
Exercise Price
0,00–5,00 – – – – –
5,00 –10,00 – – – – –
10,00–15,00 – – – – –
15,00–20,00 1,680,000 0.99 17.06 790,000 15.57
20,00– 50,000 1.35 20.50 50,000 20.50
TOTAL 1,730,000 1.00 17.16 840,000 15.86
/ Notes to the Consolidated Financial Statements 2010
Q-Free Annual Report 2010Reporting
72

The share options are split as follows between management and members of the Board as at 31.12.2010:
Name Position
Granted, not vested options
01.01.2010Granted options
Exercised options
Expired options
Vested options 31.12.2010
Granted, not vested options
31.12.2010
Ole Jørgen Fredriksen Chairman of the Board 100,000 100,000 0 0 100,000 100,000 **
Christian Albech Board member 50,000 50,000 0 0 50,000 50,000 **
Mimi Kristine Berdal Board member 50,000 50,000 0 0 50,000 50,000 **
Torild Skogsholm Board member 50,000 50,000 0 0 50,000 50,000 **
Jan Pihl Grimnes Board member 50,000 50,000 0 0 50,000 50,000 **
Øyvind Isaksen CEO 225,000 225,000 0 0 225,000 225,000 *
Marianne Sandal VP Operation 50,000 50,000 0 0 50,000 50,000 *
Steinar Furan Advisor to CEO 50,000 50,000 0 0 50,000 50,000 *
Stein Tore Nybrodahl HR Manager 15,000 15,000 0 0 15,000 15,000 *
Per Fredrik Ecker VP Sales 50,000 50,000 0 0 50,000 50,000 *
Hans Christian Bolstad Former VP R&D 50,000 50,000 0 0 50,000 50,000 *
Roar Østbø CFO 50,000 50,000 0 0 50,000 50,000 *
Henrik Stoltenberg VP BD and M&A 50,000 50,000 0 0 50,000 50,000 *
Jos A.G. Nijhuis VP R&D 0 50,000 0 0 0 50,000 *
TOTAL 840,000 890,000 0 0 840,000 890,000
* 1/3 of total share option program.** 1/2 of share option program.
The following assumptions are used in the calculation of share options granted in 2010
Exercise price for the share option
Weighted average exercise price of options granted was NOK 17.16
Volatility
Weighted average expected volatility is based on historic volatility and is calculated to be 46.44 percent.
Lifetime of the share option
All share options are expected to be exercised at expiry date of the option. The assumption is based on exercise behaviour in previ-ous programs.
Dividends
Expected dividend per share is NOK 0 each year.
Interest with no premium for risk
Interest with no premium for risk is used in the model. This equals interest on government bills and bonds, and the weighted average rate used is 2.11 percent for 2010.
/ Notes to the Consolidated Financial Statements 2010
Q-Free Annual Report 2010Reporting
73

Granted share options as at 31. December 2009 had the following conditions:
Outstanding Options Vested options
Exersice price
Outstanding Options as at
31.12.2009
Weighted average remaining
Contractual LifeWeighted Average
Exercise PriceVested options
31.12.2009Weighted Average
Exercise Price
0,00–5,00 – – – – –
5,00–10,00 – – – – –
10,00–15,00 – – – – –
15,00–20,00 790,000 1.97 15.57 – –
20,00– 50,000 2.35 20.50 – –
TOTAL 840,000 1.99 15.86 – –
The share options was split as follows between management and members of the Board as at 31. December 2009:
Name Position
Granted, not vested options
01.01.2010Granted options
Exercised options
Expired options
Vested options 31.12.2010
Granted, not vested options
31.12.2010
Ole Jørgen Fredriksen Chairman 100,000 100,000 100,000 100,000 0 100,000 * *
Christian Albech Member 50,000 50,000 50,000 50,000 0 50,000 * *
Mimi Kristine Berdal Member 50,000 50,000 50,000 50,000 0 50,000 * *
Torild Skogsholm Member 50,000 50,000 50,000 50,000 0 50,000 * *
Jan Pihl Grimnes Member 50,000 50,000 50,000 50,000 0 50,000 * *
Øyvind Isaksen CEO 675,000 225,000 225,000 450,000 0 225,000 *
Marianne Sandal VP Operation 150,000 50,000 50,000 100,000 0 50,000 *
Steinar Furan VP BD & C 150,000 50,000 50,000 100,000 0 50,000 *
Stein Tore Nybrodahl HR Manager 45,000 15,000 15,000 30,000 0 15,000 *
Per Fredrik Ecker VP Sales 150,000 50,000 50,000 100,000 0 50,000 *
Hans Christian Bolstad VP R&D 150,000 50,000 50,000 100,000 0 50,000 *
Roar Østbø CFO 0 50,000 0 0 50,000 *
Henrik Stoltenberg VP M&A 0 50,000 0 0 50,000 *
Other 405,000 0 135,000 300,000 0 0
TOTAL 2,025,000 840,000 875,0001,480,000 0 840,000
* 1/3 of total share option program.** 1/2 of total share option program.
The following assumptions are used in the calculation of share options granted in 2009:
Exercise price for the share option
Weighted average exercise price of options granted was NOK 15.86.
Volatility
Weighted average expected volatility is based on historic volatility and is calculated to be 53.93 percent.
Lifetime of the share option
All share options are expected to be exercised at expiry date of the option. The assumption is based on exercise behaviour in previ-ous programs.
/ Notes to the Consolidated Financial Statements 2010
Q-Free Annual Report 2010Reporting
74

Dividends
Expected dividend per share is NOK 0 each year.
Interest with no premium for risk
Interest with no premium for risk is used in the model. This equals interest on government bills and bonds, and the weighted average rate used is 2.34 percent for 2009.
Note 18 / Related party disclosuresThe financial statements include the financial statements of Q-Free ASA and the subsidiaries listed in the following table:
Etablished Location Country Ownership Voting shareFunctional
currency
Q-Free Portugal Lda. 1997 Lisboa Portugal 100% 100% EUR
Q-Free América Latina Ltda. 1998 Sao Paolo Brasil 100% 100% BRL
Q-Free Australia Pty. Ltd. 1999 Sydney Australia 100% 100% AUD
Q-Free Sdn. Bhd. Malaysia 1997 Kuala Lumpur Malaysia 100% 100% MYR
Noca Holding AS – Group * 2001 Trondheim Norway 100% 100% NOK
Q-Free Sverige AB 2007 Stockholm Sweden 100% 100% SEK
Q-Free Thailand Co Ltd 2007 Bangkok Thailand 100% 100% THB
Q-Free Netherlands BV 2002 Beilen The Netherlands 100% 100% EUR
Q-Free Slovakia s.r.o. 2009 Bratislava Slovakia 100% 100% EUR
Q-Free UK Ltd 2002 London United Kingdom 100% 100% GBP
Q-Free Africa Ltd 2010 Durban South Africa 76% 76% ZAR
TOTAL
* Q-Free ASA owns through Noca Holding AS indirectly 48,72% in Noca AS. Q-Free ASA owns directly 4,76% in Noca AS. Q-Free ASA’s owner share through indirectly and directly ownership in Noca Assembly AS therefore totals 53,48%.
Book value in parent company of subsidiaries companies
CostBook value
31.12.09Book value
31.12.10Result after tax last year
Companys equity as at
31.12.10
Q-Free Portugal Lda. 204 204 204 -3,009 -10,544
Q-Free América Latina Ltda. 4,853 2,407 2,407 22,568 24,065
Q-Free Australia Pty. Ltd. 0 0 0 1,870 12,422
Q-Free Sdn. Bhd. Malaysia 1,155 0 0 -116 -5,755
Noca Holding AS – Group 4,592 6,715 6,715 -1,143 41,000
Q-Free Sverige AB 0 84 84 4,096 4,534
Q-Free Thailand Co Ltd 0 1,872 1,872 -5,369 -10,530
Q-Free Netherlands BV 71,034 75,076 76,409 4,083 31,160
Q-Free Slovakia s.r.o. 0 42 0 -1,790 1,701
Q-Free UK Ltd 3,791 5,939 0 -874 -2,263
Q-Free Africa Ltd 0 0 208 -498 -484
TOTAL 85,629 92,339 87,900 19,818
/ Notes to the Consolidated Financial Statements 2010
Q-Free Annual Report 2010Reporting
75

For the year ended 31 December 2010, the Parent has impared the receivables against Q-Free Slovakia s.r.o. (4.102 TNOK) and Q-Free UK Ltd ( 197 TNOK) based on a management assessment that these amounts is not recoverable. (2009: Nil). This assessment is under-taken each financial year through examining the financial position of the related party and the market in which the related party operates.
The following exchange rates are used when consolidating the group.
CurrencyCurrency rate
01.01.10Average
currency rate
Currency rate
31.12.10
Euro EUR 8.315 8.064 7.813
Australian dollar AUD 5.192 5.576 5.961
Malaysian Ringgit MYR 1.685 1.792 1.899
Brazilian real BRL 3.320 3.425 3.529
US Dollar USD 5.777 5.817 5.856
Pounds Sterling GBP 9.317 9.193 9.068
Swedish kroner SEK 80.990 84.030 87.070
South African Rand ZAR 0.783 0.833 0.884
Thai bath THB 17.338 18.435 19.532
The following table provides the total amount of transactions, which have been entered into with related parties for the relevant financial year:
CurrencySales to
related partiesPurchases from
related parties
Amounts owed by
related parties
Amounts owed to
related parties
Q-Free Portugal Lda. 2010 728 6,458 0 18,032
2009 8,221 517 13,176
Q-Free América Latina Ltda. 2010 6,897
2009 5,118 242
Q-Free Australia Pty. Ltd. 2010 359 25,914 84 14,806
2009 28 50,376 7,169
Q-Free Sdn. Bhd. Malaysia 2010 4,923 2,532
2009 1,676 568
Noca Holding AS – Group 2010 16,173 192 15,523 503
2009 6,000 565 153 5,890
Q-Free ASA 2010 57,472 31,882 63,408 29,772
2009 69,389 29,894 50,496 16,850
Q-Free Sverige AB 2010 2,840 7,331 628 8,495
2009 1,091 5,462 4,612 5,392
Q-Free Thailand Co Ltd 2010 13,193 23,830
2009 11,816 15,469
Q-Free Netherlands BV 2010 5,666 7,314 25,285 7,713
2009 14,079 2,221 14,061 556
Q-Free Slovakia s.r.o. 2010 3,650 474 4,105
2009 98 1,829
Q-Free Africa Ltd 2010 900
2009
Q-Free UK Ltd 2010 7,370 6,818 6,596
2009 5,066 1,756 5,590
2010 99,181 99,181 114,752 114,752
TOTAL 2009 105,550 105,550 72,163 72,163
/ Notes to the Consolidated Financial Statements 2010
Q-Free Annual Report 2010Reporting
76

Terms and conditions of transactions with related parties
The sales to and purchases from related parties are made at normal market prices. Outstanding balances at the year-end are unsecured, interest free and settlement occurs in cash. There have been no guarantees provided or received for any related party receivables or payables.
Related parties
The company has for 2010 received invoices for consultancy services from Spinoza AS that totals TNOK 209 ( 2009: TNOK 627). 209 TNOK is oustanding as at 31.12.2010 and paid during January 2011. Spinoza AS is owned by the Chairman of the Board Ole Jørgen Fredriksen. All transactions between related parties are based on arm length’s principles and the invoicing is according to an agreement beetween the Q-Free ASA and the Chairman of the Board concerning consultancy services.
Associated companies
Q-Free ASA had no ownership in associated companies in 2010.
Note 19 / Cash and cash equivalents Cash at banks earns interest at floating rates based on daily bank deposit rates. Short-term deposits are made for varying periods between one day and three months, depending on the immediate cash requirements of the Group, and the interest earnings at the respective short-term deposit rates. The Group has a multiple currency account agreement in Fokus Bank, a branch of Den Danske Bank.
For the purpose of the consolidated cash flow statement, cash and cash equivalents comprise the following at 31 December:
Parent Company Group
2009 2010 2010 2009
Liquidity funds
87,189 22,971 Cash at banks and on hand 85,628 158,596
100,383 0 Money Market Funds 95 116,019
187,572 22,971 TOTAL CASH AND CASH EQUIVALENTS 85,724 274,615
As at 31 December 2010, the Group had available TNOK 100.000 (2009: TNOK 0) of undrawn bank overdraft facility and TNOK 255.298 (2009: TNOK 64.686) of undrawn guarantee facilities in which all conditions precedent had been met.
Note 20 / Financial instrumentsFor further information description on financial risk management see note 4 A) Credit risk
See description in note 4 and a customer aging analysis in note 21
/ Notes to the Consolidated Financial Statements 2010
Q-Free Annual Report 2010Reporting
77

B) Currency risk table
The following table demonstrates the sensitivity to a reasonable potential change in the EURO exchange rate, with all other variables held constant, of the Group’s EBIT (due to changes in the fair value of monetary assets and liabilities) and the Group’s equity (due to changes in the fair value of forward exchange contracts and net investment hedges) The Group’s sensitivity related to other currencies than EURO is not presented due to not having material effects.
Increase/decrease in EURO rate Effect on profi t Effect on equity
2010 + 10% + 12 457 TNOK 0 TNOK
- 10% - 12 457 TNOK 0 TNOK
2009 + 10% + 27 200 TNOK 0 TNOK
- 10% - 27 400 TNOK 0 TNOK
C) Liquidity risk
The table below summarises the maturity profile of the Group’s financial liabilities as at 31 December 2010 based on contractual undiscounted payments.
On demandLess than 3 months
3 to 6 months
6 to 12months > 1 years
TOTAL GROUP
Year ended 31 December 2010
Interest bearing loans and borrowings 0 174 174 274 622
Accounts payables and advance payments from customers 10,448 53,694 15,861 4,042 84,045
Public duties payable and taxes 26,409 3,326 29,735
Other fi nancial liabilities 16,601 24,137 20,188 9,033 69,959
TOTAL LIABILITIES (excl pension liabilities & deferred tax) 27,049 104,414 39,549 13,349 0 184,361
Year ended 31 December 2009
Interest bearing loans and borrowings 0 174 174 522 542 1,412
Accounts payables and advance payments from customers 23,266 52,864 34,696 0 0 110,826
Public duties payable and taxes 7,849 8,824 1,939 18,612
Other fi nancial liabilities 5,686 13,456 21,340 9,752 9,262 59,496
TOTAL LIABILITIES (excl pension liabilities & deferred tax) 28,952 74,343 65,034 12,213 9,804 190,346
Capital management
The primary objective of the Group’s capital management is to ensure that it maintains a strong credit rating and healthy capital ratios in order to support its business and maximise shareholder value.
The Group manages its capital structure and makes adjustments to it, in light of changes in financial conditions. In order to maintain or adjust the capital structure, the Group may adjust the amount of dividends paid to shareholders, return capital to shareholders, issue new shares or sell assets to reduce debt.
/ Notes to the Consolidated Financial Statements 2010
Q-Free Annual Report 2010Reporting
78

The Group monitors capital on the basis of its total equity ratio This ratio is calculated as book equity divided by total equity It is the Group’s policy that this ratio be 50 per cent or higher The book equity ratio is calculated as total equity divided by total assets as follows.
2010 2009
TOTAL EQUITY 499,417 548,601
TOTAL ASSETS 687,714 767,534
Book equity ratio 72.6% 71.5%
D) Interest-rate risk
Interest rate risk is the risk that the fair value or future cash flows of a financial instrument will fluctuate because of changes in market interest rates A change in interest of 100 basis points (bp) on the date of balance sheet recognition would have increased (reduced) equity and the profit or loss by the amounts shown below The analysis assumes that the other variables remain constant The analysis was performed on the same basis as in 2009.
Effect of an interest rate increase of 100 bp as at 31 December
Result 2010 2009
Investments with fl oating interest rates 1,112 1,103
Loans with variable interest rates -9 -17
CASH FLOW SENSITIVITY (NET) 1,103 1,086
Determination of fair value
As at December 31, 2010 the Group had no financial assets or liabilities where there is considered to be a difference between book value and fair value. The following financial instruments are not recognised at fair value: Cash and cash equivalents, customer receiva-bles and accounts payables.
The book value of cash and bank deposits, accounts receivable and accounts payable are approximately equal to fair value, as they have short collection cycles with low inherent risk.
2010 2009
Financial assets and liabilities Carrying amount Fair value Carrying amount Fair value
Cash and cash equivalents 85,724 85,724 274,615 274,615
Accounts receivable 194,156 194,156 125,144 125,144
Accounts payable 67,444 67,444 105,411 105,411
For terms and conditions relating to related party receivables, refer to Note 18. Trade receivables are non-interest bearing and are generally on 30-60 days’ terms.
/ Notes to the Consolidated Financial Statements 2010
Q-Free Annual Report 2010Reporting
79

Note 21 / Accounts receivables and credit risk
Parent Company Group
2009 2010 2010 2009
71,743 136,636 Accounts receivables 195,953 128,242
52,183 83,890 Accounts receivables on group companies 0 0
-8,326 -12,051 Provision for impairment on receivables -1,797 -3,098
115,600 208,475 TOTAL 194,156 125,144
456 0 Loss on receivables 0 962
-135 3,725 Changes in provisions for impairment on receivables -1,302 -612
321 3,725 TOTAL -1,302 350
For terms and conditions relating to related party receivables, refer to Note 18. Trade receivables are non-interest bearing and are generally on 30-60 days’ terms.
As at 31 December, the Group aging analysis of trade receivables is as follows:
Past due but not impaired
Aomunts as at 31.12 TotalNeither past due
nor impaired < 30 days 30–60 days 60–90 day 90–120 day > >120 days
2010 195,953 25,810 30,718 25,141 151 1,012 113,121
2009 128,242 72,971 49,529 1,940 731 126 2,945
The Group is assessing the needs for provision for doubtful debt on an indiuvidual basis per customer or per project.
Specifi cation of provisions for impairment on receivables
2010 2009
Amount as at 01.01. 3,098 2,756
This years provision for impairment on receivables 1,302 -962
Loss on receivables 0 962
Provisions utilised during the year 0 342
AMOUNT AS AT 31.12 1,797 3,098
The maximum risk exposure is represented by the carrying amount of the financial assets, including derivatives, in the balance sheet. Since the other party involved in derivative trades is normally a bank, the credit risk linked to derivatives is regarded as being insignificant. The Group therefore regards its maximum risk exposure as being the carrying amount of trade receivables as at 31 December 2010 NOK 194.2 mill ( 2009: NOK 125.1 mill).
/ Notes to the Consolidated Financial Statements 2010
Q-Free Annual Report 2010Reporting
80

Note 22 / Interest-bearing debts, borrowings and guarantees
Parent Company Group
2009 2010 Specifi cation TypeEffective
interes rate% Maturity 2010 2009
0 0 Non-current Secured Bank loan Nordea Bank ASA 5.05% 20. Feb 2012 622 1,412
0 0 TOTAL 622 1,412
Secured bank loan
The secured bank loan is a mortgage loan that is repayable within 3 years of the balance date. The loan is secured by a first charged over certain fixed assets in the Group.
Off Balance Sheet Commitment:
Parent Company Group
2009 2010 2010 2009
Specifi cation
134,307 93,695 Guarantees to customers, suppliers and lease contracts 94,702 135,314
Book value of assets securing loans and guarantees
115,600 208,475 Accounts receivable 208,475 115,600
62,552 54,551 Work in progress 54,551 62,552
25,381 39,332 Inventories 54,804 38,404
56,409 44,588 Machinery, fi xtures etc 47,984 59,977
259,942 346,946 TOTAL 365,814 276,533
/ Notes to the Consolidated Financial Statements 2010
Q-Free Annual Report 2010Reporting
81

Note 23 / Taxes
Parent Company Group
2009 2010 2010 2009
Total tax expenses for the year
324 0 Tax payable on this years profi t for Norwegian companies 362 324
0 -282 Tax payable on this years profi t for foreign companies 12,830 4,959
0 0 Adjusted allocated tax from last year – 0
18,355 -27,926 Change in deferred tax for Norwegian companies -28,134 18,223
0 0 Change in deferred tax for foreign companies -7,802 8,044
18,679 -28,208 TOTAL -22,745 31,549
26% -42% Tax rate - 28% 29%
Tax payable for the year
70,877 -66,893 Total ordinary profi t before tax -79,593 109,698
-3,067 -30,187 Permanent differences -36,178 0
-125,175 70,384 Change in temporary differences 87,939 -55,914
0 0 Utilisation of previously unrecognised tax losses 0 0
-57,365 -26,697 Basis for tax payable, Norwegian companies -27,832 53,784
0 0 Tax payable for Norwegian companies (28%) 362 0
Tax payable for foreign companies 13,113 4,959
Specifi cation of tax payable in the balance sheet
324 0 Tax payable on this years profi t, Norwegian companies * 362 0
0 0 Tax payable on this years profi t, foreign companies 13,113 4,959
-324 0 Advance tax payment, foreign companies -10,149
0 0 Governmental Tax Relief (skattefunn) 0 0
0 0 TOTAL TAX PAYABLE 3,326 4,959
Specifi cation on basis for deferred tax
Differences evaluated to be offset9,677 -1,336 Fixed assets 19,098 68,601
125,168 67,177 Current assets 72,171 122,259
-10,798 -12,178 Liabilities -11,965 -10,569
-65,194 -91,567 Tax losses carry -forward -130,389 -86,337
-2,256 -5,235 Other differences -5,235 2,905
56,597 -43,139 TOTAL -56,320 96,859
15,847 -12,079 Deferred tax (+) / tax assets (-) -13,779 27,121
Deferred tax (-) / tax assets (+) in balance sheet of 31.12.
15,847 -12,079 Tax assets (-)/ deferred tax (+) Norwegian companies -11,909 13,921
0 0 Tax assets (-)/ deferred tax (+) foreign companies -9,588 13,199
0 0 Tax assets (-)/ deferred tax (+) on group contribution 7,718 0
0 0 Deferred tax asset, off balance sheet 0 0
15,847 -12,079 TOTAL TAX ASSETS (-) / DEFERRED TAX (+) -13,779 27,121
/ Notes to the Consolidated Financial Statements 2010
Q-Free Annual Report 2010Reporting
82

Reconciling the tax cost
70,877 -66,893 Earnings before tax -79,593 109,698
19,846 -18,529 Tax on profi ts (28%) -8,827 30,716
18,679 -28,208 Tax expenses -22,734 31,549
1,167 9,679 Deviation 13,907 -834
Specifi cation
1,167 8,654 Tax result permanent differences and tax rate difference 12,882 0
0 -91 Adjusted allocated tax from last year -91 0
0 1,116 Change in deferred tax asset, off balance sheet 1,116 0
0 Effect of different tax-rate 0 -834
1,167 9,679 TOTAL 13,907 -834
* Paid withholding tax in foreign subsidiaries.
Deferred tax assets are recognised on the balance sheet based on the expectation of future taxable income. The estimate are based on Board of Directors and management’s best judgement and an assessment of future prospects. The actual outcome of future tax costs may deviate from these estimates. This years profit after tax is based on a single project result and there are no significant uncertanty regarding future prognosis and if the group can utilise the deferred tax.
Of the tax losses carried forward of TNOK 130.389,- for the Group, TNOK 91.597,- relates to the mothercompany and TNOK 38.822,- relates to foreign companies. Following a change in the tax legislation in Norway in 2005, these tax losses can be carried forward indefinitely. For 2009 TNOK 65.194,- of the tax losses carried forward for the Group, was related to the mother company and TNOK 21.143,- was related to foreign companies.
Note 24 / Financial Items
Parent Company Group
2009 2010 2010 2009
1,841 3,096 Interest income 8,880 5,004
26,573 12,547 Other fi nancial income 12,547 26,767
1,535 1,240 Net gain on shares at fair value through profi t and loss 1,240 1,559
29,949 16,883 Financial income 22,667 33,330
217 155 Financial income from group companies 0 0
42,134 Paid dividends from subsidiaries 0 0
217 42,290 Financial income from Group companies 0 0
30,166 59,172 TOTAL FINANCIAL INCOME 22,667 33,330
-1,154 -1,004 Interest expenses -3,314 -3,669
0 0 Interest on debt and borrowings -118
-22,678 -8,574 Other fi nancial expenses -8,574 -22,588
-23,832 -9,578 Financial expenses -11,887 -26,375
-27 -73 Interests from group companies 0 0
-6,958 Other Group fi nancial expenses 0 0
-27 -7,031 Financial expenses from Group companies 0 0
-23,859 -16,609 TOTAL FINANCIAL EXPENSES -11,887 -26,375
6,308 42,564 NET FINANCIAL ITEMS 10,780 6,956
/ Notes to the Consolidated Financial Statements 2010
Q-Free Annual Report 2010Reporting
83

Note 25 / Shares at fair value through profi t and loss
Parent company and the Group as at 31 December
2010Company´s
share capitalNumber of
shares OwnershipBook value in Parent **
Book value in Group
Included in the P&L
Vegamot AS 14,151 6,050 13.90% 1,967 1,967 892
Leiv Eiriksson AS 43,523 9,919 0.99% 431 431 20
Asti AS 16,760 2,900 13.81% 2,315 2,315 328
Other 20 422 0
TOTAL 4,732 5,134 1,240
2009Company´s
share capitalNumber of
shares OwnershipBook value in Parent **
Book value in Group
Included in the P&L
Vegamot AS 9,388 6,050 13.90% 1,305 1,305 1,305
Leiv Eiriksson AS 41,459 9,919 0.99% 200 200 1
Asti AS 14,388 2,900 13.81% 1,987 1,987 229
Other 0 611 24
TOTAL 3,492 4,103 1,559
** The book value of investments in shares is classifi ed as fi nancial assets at fair value. Fair value for the investments are our portion of the companys total equity.
Fair value hierarchy
The fair value of the financial assets are included at the amount at which the instrument could be exchanged in a current transaction between willing parties, other than in a forced or liquidation sale. As at 31 December 2010, the Group held the following financial instruments measured at fair value – Shares at fair value through profit and loss
The Group uses the following hierarchy for determining and disclosing the fair value of financial instruments by valuation technique:
Level 1: quoted (unadjusted) prices in active markets for identical assets or liabilities
Level 2: other techniques for which all inputs which have a signifi cant effect on the recorded fair value are observable, either directly or indirectly
Level 3: techniques which use inputs which have a signifi cant effect on the recorded fair value that are not based on observable market data.
Assets measured at fair value
31. Dec 2010 Level 1 Level 2 Level 3
Financial assets at fair value through profi t or loss
Shares at fair value through profi t and loss 5,134 5,134
31. Dec 2009 Level 1 Level 2 Level 3
Financial assets at fair value through profi t or loss
Foreign exchange contracts 137 137
Shares at fair value through profi t and loss 4,103 4,103
/ Notes to the Consolidated Financial Statements 2010
Q-Free Annual Report 2010Reporting
84

Note 26 / Provisions for warranty accruals
Warranty costs
Provision for warranty costs is calculated depending on the remaining guarantee time for various products and based on the historical effect of defects and a calculation of probability for the defect to occur for the remaining products under warranty. The calculation is made on an individual basis per product and the assumptions are varying for the different products and they also take into account the expected expenses associated with new warranty problems that are identified. Unused accruals for warranties are dissolved at the end of the guarantee-period. All provisions spesified in the table below are classified as current liabilities and is part of other short term liabilities in the consolidated statement of financial position.
Parent Group
2010Provision for
warranty costsOther
expensesTotal current
provisionsProvision for
warranty costsOther
expensesTotal current
provisions
Amount as at 01.01.10 10,077 0 10,077 10,177 0 10,177
Unused accruals reversed during 2010 0 0
Accruals utilised during 2010 -3,553 -3,553 -3,653 -3,653
Accruals deposited during 2010 1,470 1,470 1,470
AMOUNT AS AT 31.12.10 7,993 0 7,993 7,993 0 7,993
2009Provision for
warranty costsOther
expensesTotal current
provisionsProvision for
warranty costsOther
expensesTotal current
provisions
Amount as at 01.01.09 10,077 0 10,077 10,177 300 10,477
Unused accruals reversed during 2009 0 -100 -300 -400
Accruals utilised during 2009 -6,504 -6,504 -6,504 -6,504
Accruals deposited during 2009 5,500 5,500 5,500 5,500
AMOUNT AS AT 31.12.09 9,073 0 9,073 9,073 0 9,073
Note 27 / Other operating expensesSpecification:
Parent Company Group
2009 2010 2010 2009
109,281 79,750 External services 65,534 117,809
24,448 17,859 Travel expenses 22,305 28,462
20,242 19,215 Offi ces supplies 24,523 24,676
1,713 1,879 Insurance 2,687 2,690
4,293 2,587 Freight 2,858 4,549
1,570 1,297 Rent machinery & tools 5,207 4,591
5,756 3,464 Marketing / promotions 6,900 7,154
3,137 2,297 Service & Maintenance 5,017 4,704
2,248 1,539 Operating materials 2,349 3,210
320 3,759 Bad debt losses 3,814 48
3,913 27,134 Other operating expenses 21,272 14,162
176,921 160,780 TOTAL 162,465 212,057
/ Notes to the Consolidated Financial Statements 2010
Q-Free Annual Report 2010Reporting
85

Audit fees
The group has the following audit related fees, this is included in the “External services” in the above table (All figures excl. VAT).
Parent Company Group
2009 2010 2010 2009
286 250 Audit services 810 817
113 73 Other audit related services 159 145
465 150 Tax services 647 584
106 994 Other, non audit related services 1,059 407
970 1,467 TOTAL 2,676 1,953
Note 28 / Other short term receivablesSpecification:
Parent Company Group
2009 2010 2010 2009
1,570 3,124 Prepaid taxes 6,567 3,070
8,622 1,375 Outstanding public duties 2,484 11,294
2,361 1,488 Prepaid rents 10,842 10,927
725 982 Prepaid licenses 2,098 1,866
990 10,694 Miscl 11,806 2,131
14,268 17,663 TOTAL 33,797 29,288
Note 29 / Commitments and contingencies
Operating lease commitments – Group as lessee
The Group has entered into commercial leases on certain motor vehicles and items of machinery. These leases have an average life of between 3 and 5 years with no renewal option included in the contracts. There are no restrictions placed upon the Group by entering into these leases.
Future minimum rentals payable under non-cancellable operating leases as at 31 December are as follows:
Parent Company Group
2009 2010 2010 2009
Terms
7,922 9,100 Within one year 11,491 10,102
8,160 3,574 After one year but not more than fi ve years 5,966 10,400
0 0 More than fi ve years 0 0
16,082 12,674 TOTAL 17,457 20,502
During the year ended 31 December 2010 the parent company recognised expenses in the income statement in respect of operating leases of TNOK 10.343 (2009: 8.122) and TNOK 12.734 ( 2009: 10.560) for the group.
Finance lease and hire purchase commitments
The Group has no finance leases or any hired purchase contracts for various items of plant and machinery.
/ Notes to the Consolidated Financial Statements 2010
Q-Free Annual Report 2010Reporting
86
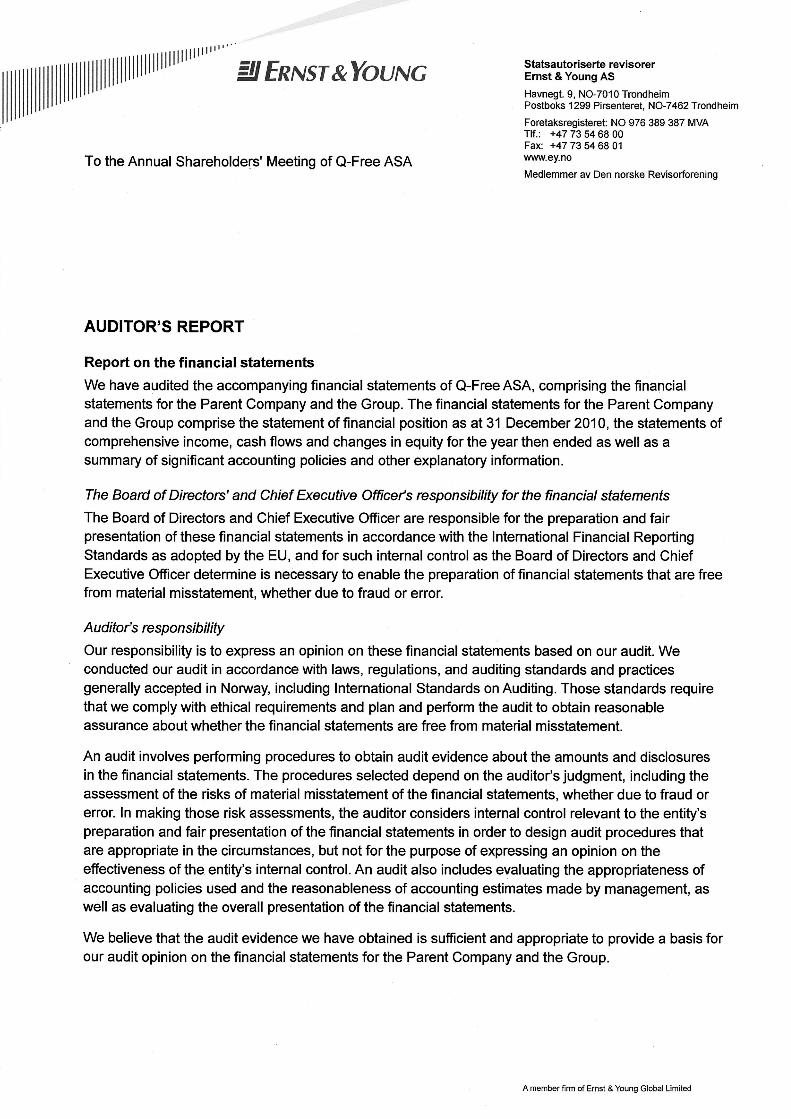
Q-Free Annual Report 2010Reporting
87 / Auditor’s Report

/ Notes to the Consolidated Financial Statements 2010
Q-Free Annual Report 2010Reporting
88

AbbreviationsDefi nitions and industry vocabulary
ALPR Automatic Lisence Plate Recognition
CC Congestion Charging
CALM Communication Access For Land Mobiles
CEN Comité Européen De Normalisation (European Committee For Standardisation)
DSRC Dedicated Short Range Communication
ERI Electronic Registration And Identifi cation
ETC Electronic Toll Collection
GNSS Global Navigation Satellite System
GPS Global Positioning System
GSM Global System For Mobile Communications
ITS Intelligent Transport Systems
MLFF Towards MultiLane Free Flow
MTC Manual Toll Collection Systems
OCR Optimal Character Recognition
OBU On Board Unit
RFID Radio Frequency Identifi cation
RFQ Request For Qualifi cation
RUC Road User Charging
Design: Itera Gazette
Photo: Ole Walter (Cover, pages 3, 4, 11, 14/1-2, 15/4-5, 17)
+ Ronny Danielsen (page 14/3a-3b)
+ Bo Mathisen (pages 8, 9, 10, 34, 35)
89Q-Free Annual Report 2010
89 / Abbreviations

Headquarter
AddressTh. Owesens gt. 35c
NO–7044 Trondheim
Norway
MailaddressP.O. Box 3974 Leangen
NO–7443 Trondheim
Norway
P: +47 73 82 65 00
F: +47 73 82 65 01
www.q-free.com
Bank: Fokus Bank ASA
ACC.NO.: 8601 30 68900
Register of business enterprises
NO 935 487 242
Q-Free ASA Oslo
Wergelandsvei 1
NO–0167 Oslo
Norway
P: +47 23 10 65 00
F: +47 22 42 12 00
Q-Free Australia Pty. Ltd.
Level 7, 107 Mount street
North Sydney NSW 2060
Australia
P: +61 2 8020 2650
F: +61 2 9901 3032
Q-Free Latin America
Al. Madeira, 53, Cj. 14
Alphaville, Barueri
CEP 06454–010 São Paulo
Brazil
P: +55 11 4191 6345
F: +55 11 4195 8585
Q-Free France
168, Avenue Charles de Gaulle
92522 Neuilly sur Seine Cedex
France
P: +33 (0)170375306
F: +33 (0)170375353
Q-Free Malaysia
19, 2-3 Jalan PJU 8/5F
Bandar Damansara Perdana
47820 Petaling Jaya
Selangor Darul Ehsan
Malaysia
P: +6 03 7722 4457
F: +6 03 7727 9448
Q-Free Portugal
Taguspark
Av.Prof.Doutor Aníbal Cavaco Silva
Bloco b1 2B
P 2740-120 Porto Salvo
Portugal
P: +351 21 422 7170
F: +351 21 422 7171
Q-Free Sverige AB
Sundbybergsvägen 1,
9.de våningen
171 73 Solna
Sverige
P: +46 706227876
F: +46 706204201
Q-Free Thailand Co. Ltd.
20/22 Moo 12
Kaset-Nawamin Rd
Lathprao
10230 Bangkok
Thailand
P: +66 255 32 025
Q-Free The Netherlands
Dacolian BV / Q-Free
Postbus 180
9410 AD Beilen
The Netherlands
P: +31(0)593 542 055
F: +31(0)593 542 098