
Measuring Matching Frictions in the Puerto Rican Labor Market
31
Measuring Matching Frictions in the Puerto Rican Labor Market Hiram Ruiz April 27, 2017 Abstract I investigate the role that matching frictions play in the Puerto Rican labor market. The search-theoretical models of the labor market which were developed in the 1980’s led to an explosion of empirical work in the search for evidence of the mechanisms that supported the theory. This paper seeks to measure the degree to which the Puerto Rican labor market is afflicted by congestion externalities. The results obtained indicate that the market has remained relatively uncongested even after a decade of economic stagnation.
-
Upload
khangminh22 -
Category
Documents
-
view
1 -
download
0
Transcript of Measuring Matching Frictions in the Puerto Rican Labor Market
Measuring Matching Frictions in the Puerto Rican
Labor Market
Hiram Ruiz
April 27, 2017
Abstract
I investigate the role that matching frictions play in the Puerto Rican
labor market. The search-theoretical models of the labor market which were
developed in the 1980’s led to an explosion of empirical work in the search
for evidence of the mechanisms that supported the theory. This paper seeks
to measure the degree to which the Puerto Rican labor market is afflicted by
congestion externalities. The results obtained indicate that the market has
remained relatively uncongested even after a decade of economic stagnation.

Contents
1 Introduction 3
2 The Theory 5
2.1 The Matching Function . . . . . . . . . . . . . . . . . . . . . . . . . . 5
2.2 Previous Empirical Work . . . . . . . . . . . . . . . . . . . . . . . . . 7
2.3 Model Specification . . . . . . . . . . . . . . . . . . . . . . . . . . . . 9
3 The Data 10
3.1 Encuesta Division de Investigacion de Destrezas Ocupacionales (DIDO) 10
3.2 Local Area Unemployment Statistics (LAUS) . . . . . . . . . . . . . . 13
3.3 Quarterly Census of Employment and Wages . . . . . . . . . . . . . . 14
3.4 Descriptive Overview of Match Dynamics . . . . . . . . . . . . . . . . 15
3.5 Summary Statistics . . . . . . . . . . . . . . . . . . . . . . . . . . . . 17
4 Methodology and Results 18
4.1 Aggregate Matching Function . . . . . . . . . . . . . . . . . . . . . . 18
4.2 Sectoral Unemployment Estimates . . . . . . . . . . . . . . . . . . . . 20
4.2.1 Constructing“Sectoral Unemployment” Time Series . . . . . . 22
4.3 Industry-Level Matching Function . . . . . . . . . . . . . . . . . . . . 24
5 Conclusion 26
6 Appendix 27
7 Data Sources 29
2
1 Introduction
Labor markets have always been of special interest to economists. Their macroe-
conomic importance has driven the development innovative ways of capturing some
of their unique dynamics. While a neoclassical approach to the labor market can
be insightful in a general sense, many important features observed across real world
labor markets simply cannot occur within such a limited framework.
Because the labor market is so complex, several key models have developed in
parallel, each capturing a specific way in which observed dynamics in labor markets
differ significantly from what standard neoclassical market theory predicts. The
models range in complexity from basic game-theoretical models of firm monopsony
power (Autor 2010) to a continuum of significantly more involved dynamic gen-
eral equilibrium models (Flinn 2006). In this paper, I deviate from the neoclassical
model in the direction of Pissarides (2000), to assess the degree to which the Puerto
Rican labor market is afflicted by search frictions. Section 2 elaborates on the key
aspects of the theory.
The Puerto Rican labor market is exceptional by almost every metric one can
find at the international level. The most telling statistic is that only 36% of the
working age population is currently employed, compared to 59% in the U.S. (World
Bank) Internationally, such low rates are only seen in war torn nations like Iraq
and Syria. Adding the underground economy would increase the rate by a couple of
points, but the magnitude of the disparity between both measures is clearly indica-
tive of a fundamental divergence in the Puerto Rican and American labor markets.
When the island’s government ran out of cash in early 2016, issues like this
took center stage. Krueger (2015) points to a long list of issues with the Puerto
Rican economy. She suggests that Puerto Rico’s labor market is dysfunctional due
primarily to supply side issues.
“Employers are disinclined to hire workers because (a) the US federal
minimum wage is very high relative to the local average (full-time em-
ployment at the minimum wage is equivalent to 77% of per capita income,
3
versus 28% on the mainland) and a more binding constraint on employ-
ment (28% of hourly workers in Puerto Rico earn $8.50 or less versus
only 3% on the mainland); and (b) local regulations pertaining to over-
time, paid vacation, and dismissal are costly and more onerous than on
the US mainland.”
Not surprisingly, these comments caused enormous uproar. Many economists
doubt the effectiveness of the type of internal devaluation measures Krueger rec-
ommends (Stiglitz & Guzman 2017). They argue that the labor market is dysfunc-
tional for many other reasons, and that eliminating the minimum wage would lead
to decreased wages without an accompanying increase in employment. The issue of
dealing with divergent members inside of currency unions is, of course, one of the
most important open questions in modern macroeconomics. (Gros 2015)
One feature used to explain why minimum wages commonly fail to generate the
unemployment effects predicted by a neoclassical model of the labor market is the
concept of search frictions. In a neoclassical framework, that the labor market in-
stantly clears at any given wage. In the real world, searching is costly and time
consuming for both firms and workers. This becomes a sunk cost once a match is
made, so wages are determined by Nash bargaining. It has been shown theoret-
ically that if a labor market suffers sufficiently from search frictions, there exists
an amount of unemployment benefits/minimum wage that will make equilibrium
outcomes better than no government intervention. (Acemoglu 2001)
This paper will not be able to settle this classic debate in itself. First, there
are other theoretical market failures that can produce similar results. These range
from simple monopsony models of the labor market to more complex ones involving
informational asymmetry and the related contract theory. All of these mechanisms
require completely different empirical approaches, so this thesis would be comple-
mented by research in those directions. The broadly unpopular policy of lowering
the minimum wage should only be undertaken if there is certainty that it will yield
the desired employment outcomes. Evidence of strong search frictions in Puerto
Rico would complicate Krueger’s policy prescription, since lowering wages might
not lead to the creation of jobs required to compensate for lower salaries.
4

2 The Theory
2.1 The Matching Function
In this section I discuss the basic frictional labor market model developed in Pis-
sarides (2000). This book is a compendium of all the developments that Pissarides,
Dale Mortensen, and Peter Diamond simultaneously worked on during the 60’s-80’s
in search-models of the labor market. Specifically, I am most concerned with the
matching function developed in the first chapter of the book.
The basic premise of the model is simple. The labor market is not as neat as neo-
classical models suggest. Searching (be it for a job, or for an employee) is costly and
time-consuming for both firms and workers. Instead of the aggregate production
function of neoclassical models (which assumes instantaneous, centralized match-
ing), Pissarides employs an undirected match function.
The matching function gives the amount of new jobs (matches, denoted as m)
formed at any moment, as a function of the amount of vacancies (v) and unemploy-
ment (u) at that same time.
mL = m(uL, vL)
We normalize each measurement as percent of the labor force (L). Pissarides
assumes the matching function (m) is increasing in both arguments, concave and
homogeneous of degree 1. The inherent complexity of modeling heterogeneity, in-
formation asymmetries, and all the other frictions that afflict the labor market
prohibit us from incorporating them individually into a single model for the market
as a whole. In the matching function, we have abstracted away all the complexities
of the job-search process by specifying a relationship between the relative stocks of
searchers on both sides of the market and the amount of matches created. It is thus
similar to a production function in that it allows us to model a production process
without delving into the underlying complexities of the actual process. (Berentsen
2009)
5
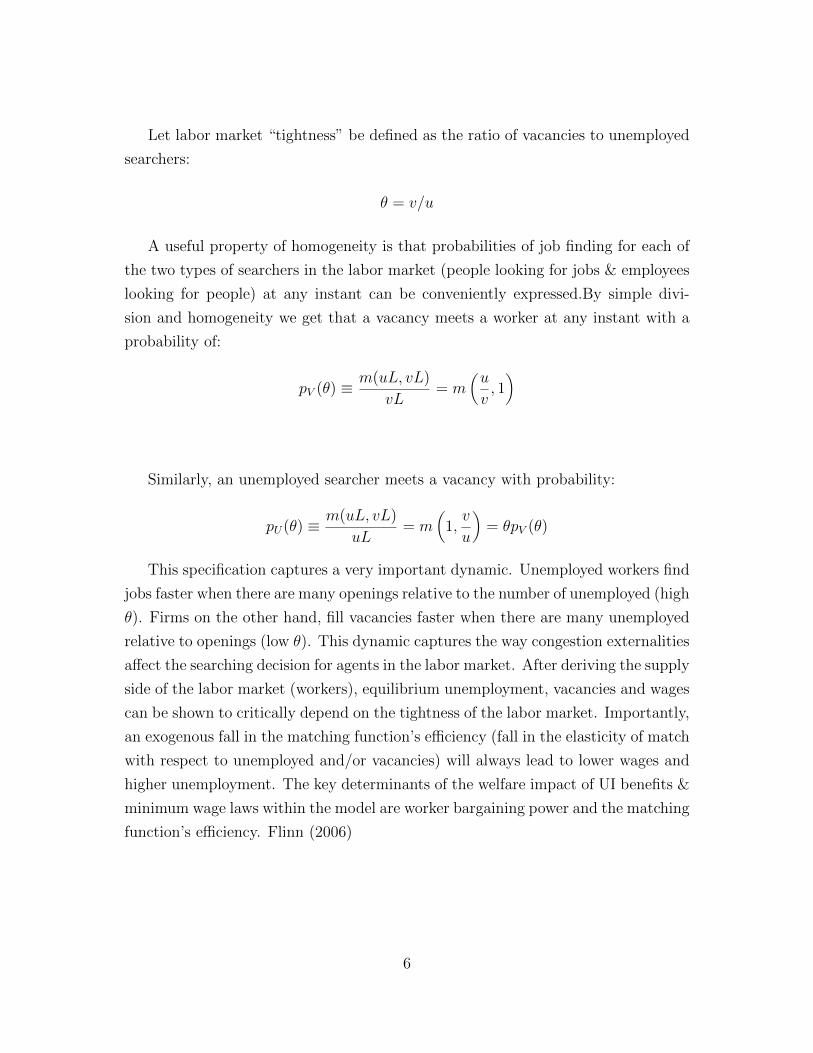
Let labor market “tightness” be defined as the ratio of vacancies to unemployed
searchers:
θ = v/u
A useful property of homogeneity is that probabilities of job finding for each of
the two types of searchers in the labor market (people looking for jobs & employees
looking for people) at any instant can be conveniently expressed.By simple divi-
sion and homogeneity we get that a vacancy meets a worker at any instant with a
probability of:
pV (θ) ≡ m(uL, vL)
vL= m
(u
v, 1)
Similarly, an unemployed searcher meets a vacancy with probability:
pU(θ) ≡ m(uL, vL)
uL= m
(1,v
u
)= θpV (θ)
This specification captures a very important dynamic. Unemployed workers find
jobs faster when there are many openings relative to the number of unemployed (high
θ). Firms on the other hand, fill vacancies faster when there are many unemployed
relative to openings (low θ). This dynamic captures the way congestion externalities
affect the searching decision for agents in the labor market. After deriving the supply
side of the labor market (workers), equilibrium unemployment, vacancies and wages
can be shown to critically depend on the tightness of the labor market. Importantly,
an exogenous fall in the matching function’s efficiency (fall in the elasticity of match
with respect to unemployed and/or vacancies) will always lead to lower wages and
higher unemployment. The key determinants of the welfare impact of UI benefits &
minimum wage laws within the model are worker bargaining power and the matching
function’s efficiency. Flinn (2006)
6

2.2 Previous Empirical Work
The consolidation of the theory into a single coherent model unleashed a great deal
of empirical research. Pissarides & Petrongolo (2001) provide a survey of the em-
pirical literature on the matching function, distinguishing between four sources of
empirical evidence. The first category are the studies which use aggregate data to
estimate the Beveridge curve , which shows the relationship between vacancies and
unemployment over time in a particular labor market. The Beveridge curve reveals
the cyclical movements in unemployment and vacancy rates.
The second is using aggregate data of stocks of unemployment, vacancies and
hires to estimate an aggregate matching function for the economy as a whole. The
third category is similar to the second, but with cross sectioning at the regional or
industry level. This paper falls within the second and third category. I discuss the
literature of these two approaches in detail below.
The fourth category takes the employment spells approach. This consists of es-
timating the transition probabilities of different groups of people within the labor
market. If one can estimate the probability that a person will transition from any
state in the labor market to any other state, a Markov Chain model of the labor
market can be constructed for heterogeneous workers. This means that individuals
with different characteristics will have their own transition probabilities, so a more
accurate picture of the labor market can be estimated. While this category is the
most revealing, the longitudinal data necessary to estimate the transition probabil-
ities is not available for Puerto Rico.
Within the literature of the second and third category, my paper’s route to es-
timation is very similar to the one taken in Burda & Wyplosz (1994). I directly
estimate the matching function for the Puerto Rican labor market by using a Cobb-
Douglass CRS constrained log-linear model, as they do for the U.K., Spain, Germany
and France. They estimate match elasticities of unemployment and vacancies at .6
& .2 for all countries except Spain, for which the estimates are .12 & .14. My anal-
ysis is different from Burda & Wyplosz’ due to the fact that I use annual frequency
data, while they used monthly data. To my knowledge, this is the first time the
7

matching function has been estimated for the Puerto Rican labor market.
Other work in the same direction is Anderson & Burgess (2000), which esti-
mates the matching function of the American labor market using state-level data at
a quarterly frequency. They estimate unemployment and vacancy elasticities at .4-
.6 and .8-1 respectively. Although their results seem to imply increasing returns to
scale for the matching process, they cannot reject CRS. Galuscak & Munich (2005)
produces the estimates for the Czech labor market, also using regional level data,
but at a monthly frequency. They estimate the elasticities at 1 and .2 respectively.
Ibourk et al. (2001) estimates the matching function for the French labor market
using monthly frequency data. They use data from different periods so their results
(.84 & .21) differ from Burda & Wyplosz. Ultimately, many of the differences in the
empirical literature come not from different competing specifications, but from the
fact that labor data varies significantly across countries.
The specification of the model is surprisingly similar throughout the literature
on aggregate matching function estimation. The next section develops the most
commonly used empirical specification. Some empirical models in the literature
employ first differencing when the frequency of observations is high enough, since
observations at a monthly frequency will suffer from endogeneity. This occurs be-
cause the matches in a given period determine the stock of unemployed for the next.
Also, weighted least squares is sometimes used to correct for heteroskedasticity. A
detailed discussion of the issues of estimation that are found in the literature and
possible solutions to them is given in the next section. A common feature of the
literature surveyed was the almost universal use of the Cobb-Douglas specification
for the matching function.
Another part of the literature concerns the possible theoretical extensions of the
model. Acemoglu (2001) creates a two sector model of the economy with homo-
geneous workers. He shows how raising unemployment benefits can make workers
patient, yielding better job matches if a labor market suffers from enough search
frictions that make workers desperate. This type of work demonstrates that the poli-
cies to be followed by a government seeking to improve its labor market outcomes
depend, among other things, on the degree to which the markets are congested.
8

2.3 Model Specification
Following the literature, I estimate the point elasticities of the matching function
for the Puerto Rican labor market. Recall the matching function is assumed to
be Cobb Douglas over the unemployment (U) and vacancy rates (V ), with CRS
(α + β = 1). Matches (m) are measured as hires during the period. See section 3
for data descriptions.
m = Uα ∗ V β
The constant returns to scale assumption fits the aggregate Puerto Rican data
well, as I show in section 4.1. Most other countries in the literature also fit the
data well with regard to this assumption, although some studies have found robust
decreasing returns to scale. Another part of the literature explores the implications
of decreasing returns to scale of the matching function, but since Puerto Rico’s
matching function exhibits CRS, it is outside the scope of this paper.
The parameters for this Cobb Douglas function can be obtained by estimating
the log-linear model:
lnm = β0 + α lnU + β lnV + ε
In Galuscak (2005) and in much of the surveyed literature, unemployment and
vacancies are lagged for a period. This might not be necessary though, because the
available data is of annual frequency, so lags are probably not appropriate at that
timescale. In high frequency data-sets (monthly), endogeneity becomes an issue
because the amount of matches in period t influences the amount of unemployed &
vacancies in period t+ 1. A year however, should be enough time so that the labor
market can be viewed as relatively independent across observations.
9
3 The Data
3.1 Encuesta Division de Investigacion de Destrezas Ocu-
pacionales (DIDO)
The DIDO is an annual survey sent out by the Bureau of Labor Statistics office in
Puerto Rico to 4000 firms across the island. The sampling frame from which the
firms are taken are the establishments listed in the Quarterly Census of Employ-
ment and Wages (QCEW). In 2013, the response rate was 75.5%. The sample is
representative of the island’s labor market as a whole, since all major sectors are
sampled (at least in the formal economy). The survey started in 2006, and the most
recent year available is 2013, so only 7 observations per cross section are possible.
Cross sectioning increases the amount of observations by a factor of 7 and 20 for
regional and industry-level estimation respectively.
The report contains a variety of statistics of interest. For the estimation con-
ducted in the rest of this paper, the relevant variables are the annual vacancy and
hiring rates. These variables represent an input (vacancies) and the output (hires)
in our Cobb-Douglas model. Both statistics are produced at the metro-area and
industry level. Precise definitions of these two variables are given in section 3.1.1 .
While it is possible to obtain more observations from industry-level cross sec-
tioning, it comes at a loss of precision. First, it requires knowledge of sector-level
unemployment rates. These are not gathered using standard NAICS reporting, so I
created a “sectoral unemployment” time series using observed monthly changes in
employment from the QCEW (see 4.2). The second concern is that unlike physi-
cal distance, industry differences do not strictly define labor markets. My analysis
depends on the assumption that the units being considered are compartmentalized,
but I know industry switching could potentially be common (unemployed searchers
in one industry could be driving the matches in another). This implies that the more
common industry switching is, the more imprecise the industry level estimates will
be. For these reasons, I estimate the regional model first, only to later attempt the
industry level estimation to see how the results compare. While a pooled log-linear
estimation with fixed effects is the most straight forward way to account for the
10
cross-sectioning, our ratio of groups to observations is simply too large to handle
fixed effects.
As mentioned above, in the survey we are most interested in the responses re-
garding questions about hiring and vacancies over a specific period. Both of these
two variables are integral parts of our model, since they appear explicitly in the
matching function. Hiring can bee seen as the number of matches, vacancies being
one of it’s determinants within the framework. (See 2). Below I give a summary of
the variables obtained from the DIDO yearly report available online.
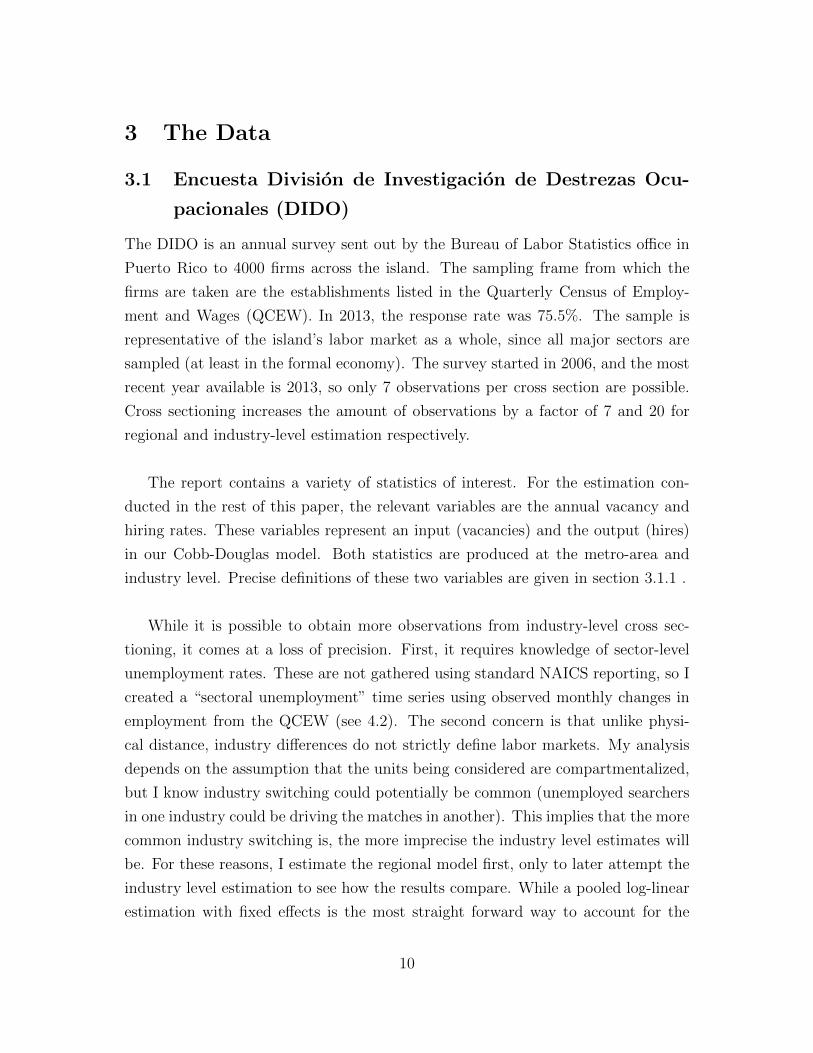
Hire Rate (as % of total employment in sector)
This is a measure of job formation or“matches”. We want to see how it is affected
by changes in the stocks of searchers (unemployed) and vacancies in a region/sector
during the given period. Here you can see the mean yearly hiring rate for all large
sectors of the Puerto Rican economy over the period of 2007-2013 at a yearly fre-
quency. Hiring rates are also published at the metropolitan area level in the DIDO.
Figure 1: Industry-level Hiring Rates
0 1 2 3 4 5
Mean Hiring Rate 2006−2013
Wholesale
Utilities
Transportation
Technical
Retail
Realestate
Publicadmin
Other
Manufacturing
Management
Information
Healthcare
Financial
Entertainment
Education
Construction
Agriculture
Administrativesupp
Accommodfood
11
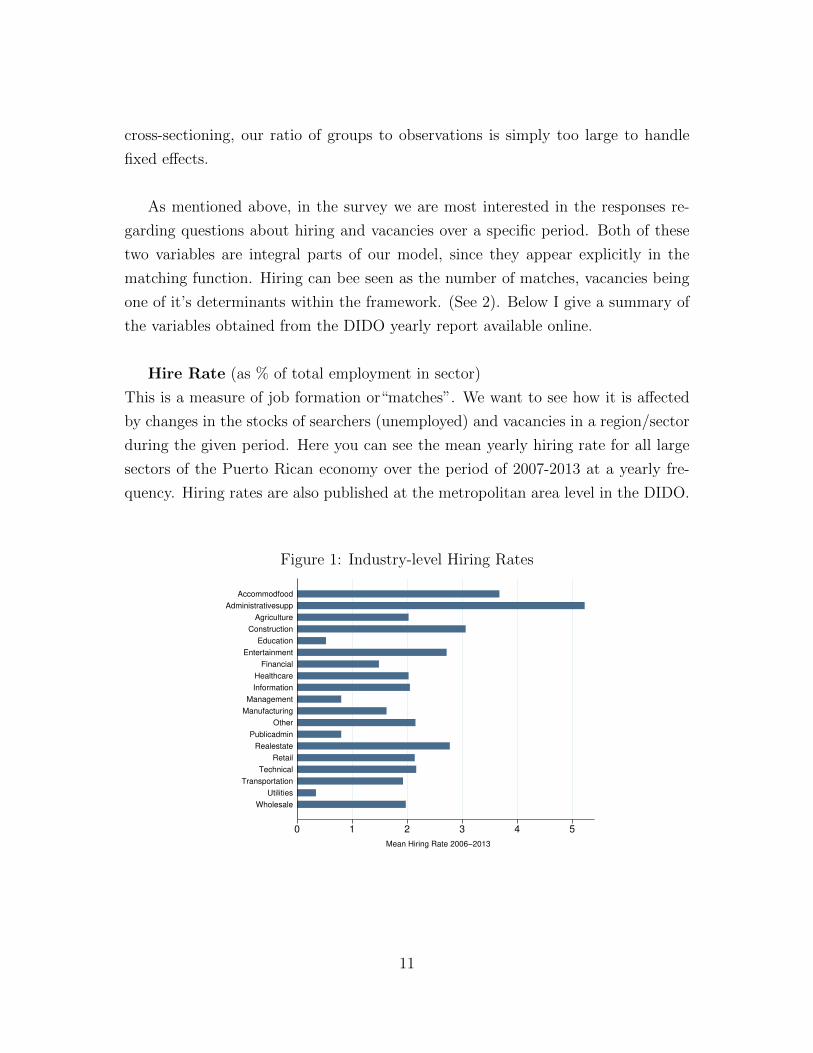
Vacancy rate (as % of total employment in sector)
This is one of the determinants of the rate of match (hires) within the model.
Following the theory, we would expect that an increase in vacancies will lead to
an increase in matches if the number of unemployed job seekers is held fixed or
increased. I am interested in measuring the degree to which that happens. Below,
figure 2 shows the averages of the rates for the period 2007-2013. The sectors shown
here include both public and private components.
Figure 2: Industry-level Vacancy Rates
0 2 4 6 8 10
Mean Vacancy Rate 2006−2013
Wholesale
Utilities
Transportation
Technical
Retail
Realestate
Publicadmin
Other
Manufacturing
Management
Information
Healthcare
Financial
Entertainment
Education
Construction
Agriculture
Administrativesupp
Accommodfood
Figure 3 gives an overview of the measures of vacancies and hires found in the
DIDO at the Metropolitan Statistical Area level over the period examined.
Figure 3: MSA-level Mean Yearly Hiring & Vacancy Rates
0
1
2
3
4
5
2006 2007 2008 2009 2010 2011 2012 2013
% o
f to
tal E
mplo
yment
Hires
Vacancies
12

3.2 Local Area Unemployment Statistics (LAUS)
This well known series published by the BLS gives monthly unemployment rates
for all large metropolitan areas. For industry level unemployment data (which is
gathered by the Puerto Rican labor statistics bureau) the sectors have not been
standardized with the current NAICS, although they go back at a yearly frequency
to 1970. I have industry level observations for the other two variables in the model.
In the matching function, we assume the unemployed are the sole searchers in the
labor market. Of course, employment to employment matches are common in the
labor market, as are out of labor force to employment matches. My analysis will
miss these more intricate flows of the labor market. Understanding how all of the
flows interact would require the employment-spells approach I discussed in section
2.2, which is extremely data intensive. The longitudinal survey data required to
estimate such flows is simply not gathered for the Puerto Rican labor market.
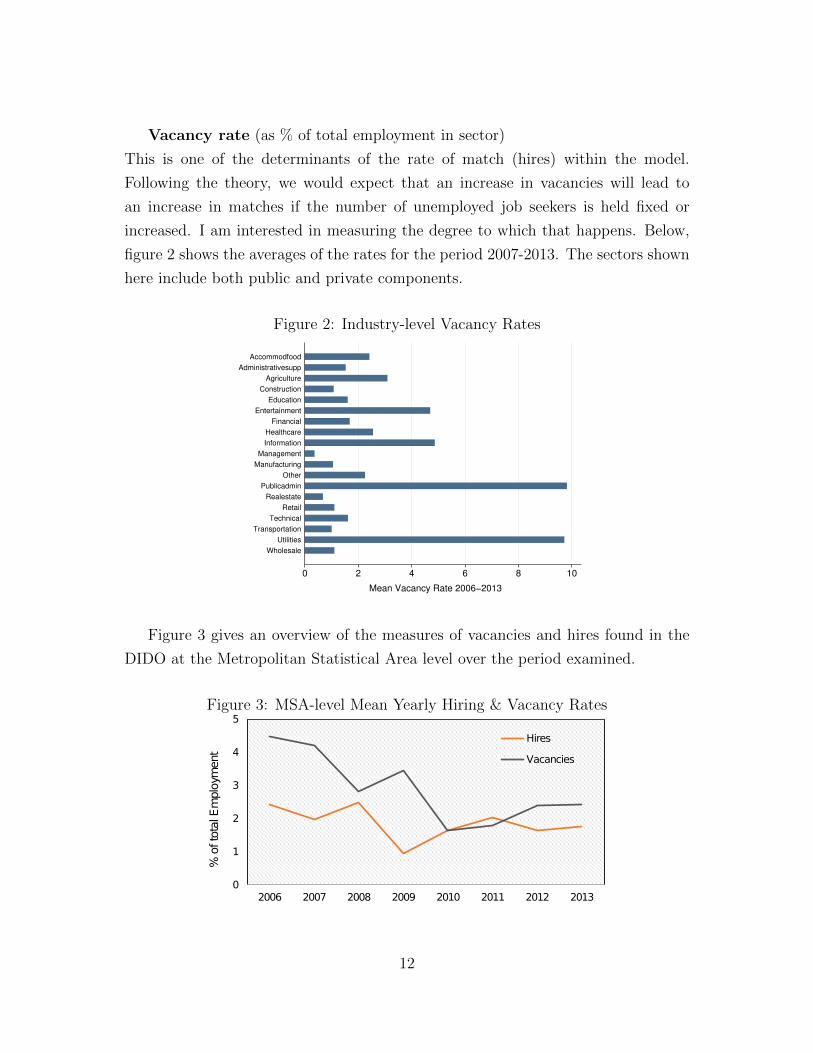
Unemployed (as % of total employment in sector)
As is common in the literature, I use unemployment as a measure of job seeking
intensity. We would expect more unemployed searchers to lead to a larger number of
matches for a fixed amount of vacancies. Note that the measure changes to percent
of labor force if we cross section across metropolitan areas instead of industries.
While the regional level unemployment rates used in section 4.1 come directly from
the LAUS, the sectoral unemployment rates shown in figure 4 come from a mixture
of LAUS and QCEW data. The exact procedure for obtaining the industry-level
unemployment figures is explained in section 4.2 .
13
Figure 4: Industry-level“Unemployment” Rates
0 5 10 15 20
Mean Annual Unemployment Rate 2006−2013
Wholesale
Utilities
Transportation
Technical
Retail
Realestate
Publicadmin
Other
Mining
Manufacturing
Management
Information
Healthcare
Financial
Entertainment
Education
Construction
Agriculture
Administrativesupp
Accommodfood
3.3 Quarterly Census of Employment and Wages
The QCEW is a BLS survey filled out by the universe of employers that report to
UI programs in Puerto Rico. Below, figure 5 shows mean monthly employment for
the period 2006-2016 for all statistical areas of Puerto Rico. Note the dominance
of the San Juan MSA, which accounts for 75 percent of employment. As is clearly
visible, the QCEW also gathers data on“Micropolitan Statistical Units” which have
very little impact on the island’s labor market as a whole. I drop the small statis-
tical areas, leaving only Aguadilla, Guayama, Mayaguez, Ponce and San Juan for
estimation purposes. Arecibo, which is relatively large, could not be used because
LAUS data was unavailable for it.
The QCEW has the advantages of being of high frequency (monthly estimates)
and high granularity. This allows me to cross section monthly employment numbers
by region and industry simultaneously. This allowed me to create estimates of
unemployment rates for each of the 20 NAICS sectors. A comprehensive explanation
of the sectoral unemployment estimation process and how the data was used can be
found in section 4.2 .
14
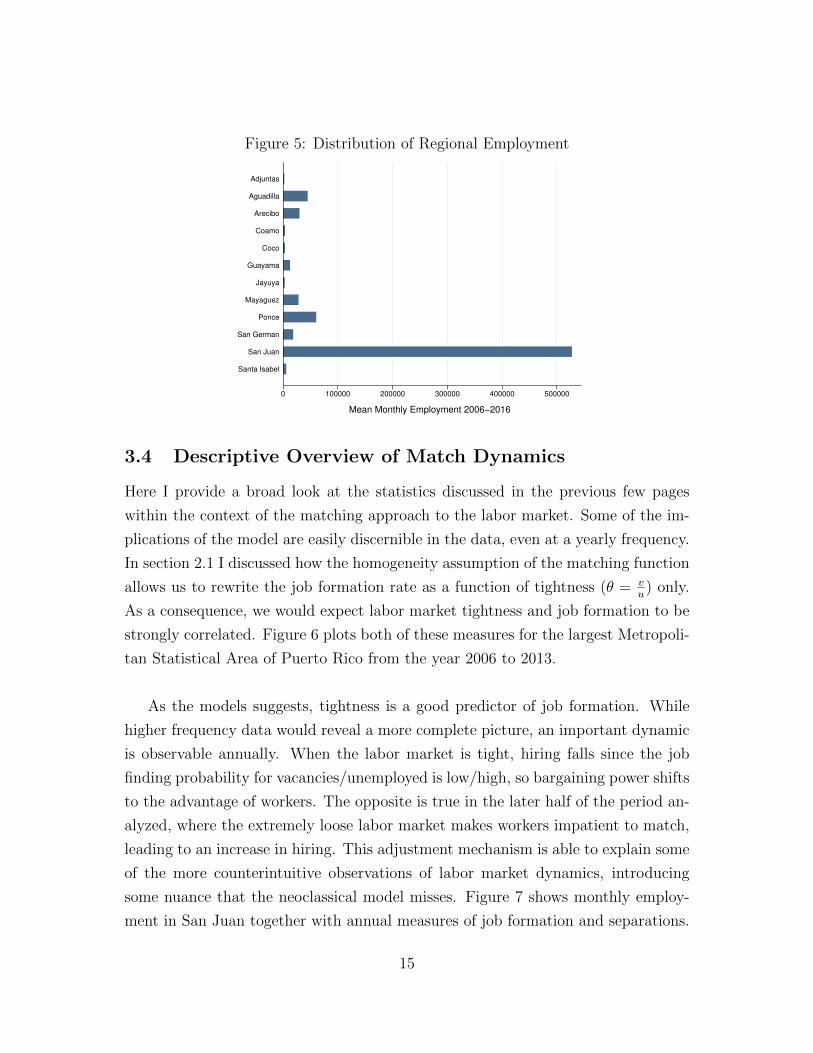
Figure 5: Distribution of Regional Employment
0 100000 200000 300000 400000 500000
Mean Monthly Employment 2006−2016
Santa Isabel
San Juan
San German
Ponce
Mayaguez
Jayuya
Guayama
Coco
Coamo
Arecibo
Aguadilla
Adjuntas
3.4 Descriptive Overview of Match Dynamics
Here I provide a broad look at the statistics discussed in the previous few pages
within the context of the matching approach to the labor market. Some of the im-
plications of the model are easily discernible in the data, even at a yearly frequency.
In section 2.1 I discussed how the homogeneity assumption of the matching function
allows us to rewrite the job formation rate as a function of tightness (θ = vu) only.
As a consequence, we would expect labor market tightness and job formation to be
strongly correlated. Figure 6 plots both of these measures for the largest Metropoli-
tan Statistical Area of Puerto Rico from the year 2006 to 2013.
As the models suggests, tightness is a good predictor of job formation. While
higher frequency data would reveal a more complete picture, an important dynamic
is observable annually. When the labor market is tight, hiring falls since the job
finding probability for vacancies/unemployed is low/high, so bargaining power shifts
to the advantage of workers. The opposite is true in the later half of the period an-
alyzed, where the extremely loose labor market makes workers impatient to match,
leading to an increase in hiring. This adjustment mechanism is able to explain some
of the more counterintuitive observations of labor market dynamics, introducing
some nuance that the neoclassical model misses. Figure 7 shows monthly employ-
ment in San Juan together with annual measures of job formation and separations.
15
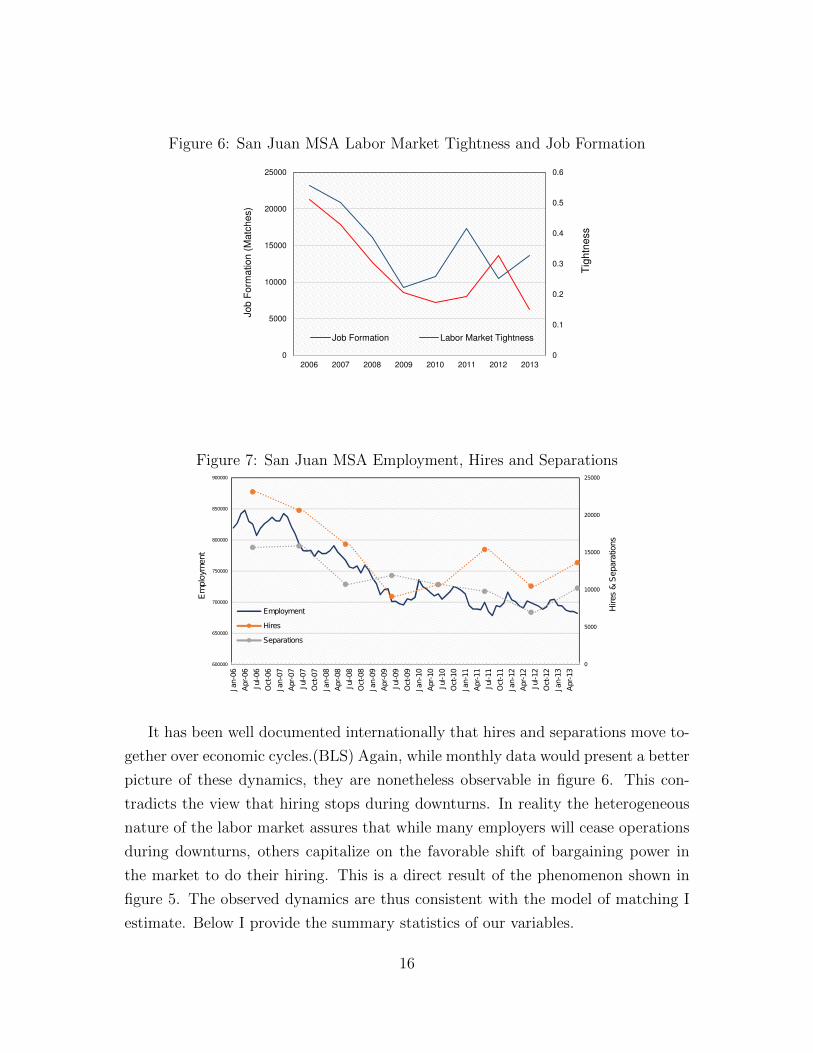
Figure 6: San Juan MSA Labor Market Tightness and Job Formation
0
0.1
0.2
0.3
0.4
0.5
0.6
0
5000
10000
15000
20000
25000
2006 2007 2008 2009 2010 2011 2012 2013
Tig
htn
ess
Job F
orm
ation (
Matc
hes)
Job Formation Labor Market Tightness
Figure 7: San Juan MSA Employment, Hires and Separations
0
5000
10000
15000
20000
25000
600000
650000
700000
750000
800000
850000
900000
Jan-0
6
Apr-
06
Jul-06
Oct-06
Jan-0
7
Apr-
07
Jul-07
Oct-07
Jan-0
8
Apr-
08
Jul-08
Oct-08
Jan-0
9
Apr-
09
Jul-09
Oct-09
Jan-1
0
Apr-
10
Jul-10
Oct-10
Jan-1
1
Apr-
11
Jul-11
Oct-11
Jan-1
2
Apr-
12
Jul-12
Oct-12
Jan-1
3
Apr-
13
Hires &
Separa
tions
Em
plo
ym
ent
Employment
Hires
Separations
It has been well documented internationally that hires and separations move to-
gether over economic cycles.(BLS) Again, while monthly data would present a better
picture of these dynamics, they are nonetheless observable in figure 6. This con-
tradicts the view that hiring stops during downturns. In reality the heterogeneous
nature of the labor market assures that while many employers will cease operations
during downturns, others capitalize on the favorable shift of bargaining power in
the market to do their hiring. This is a direct result of the phenomenon shown in
figure 5. The observed dynamics are thus consistent with the model of matching I
estimate. Below I provide the summary statistics of our variables.
16
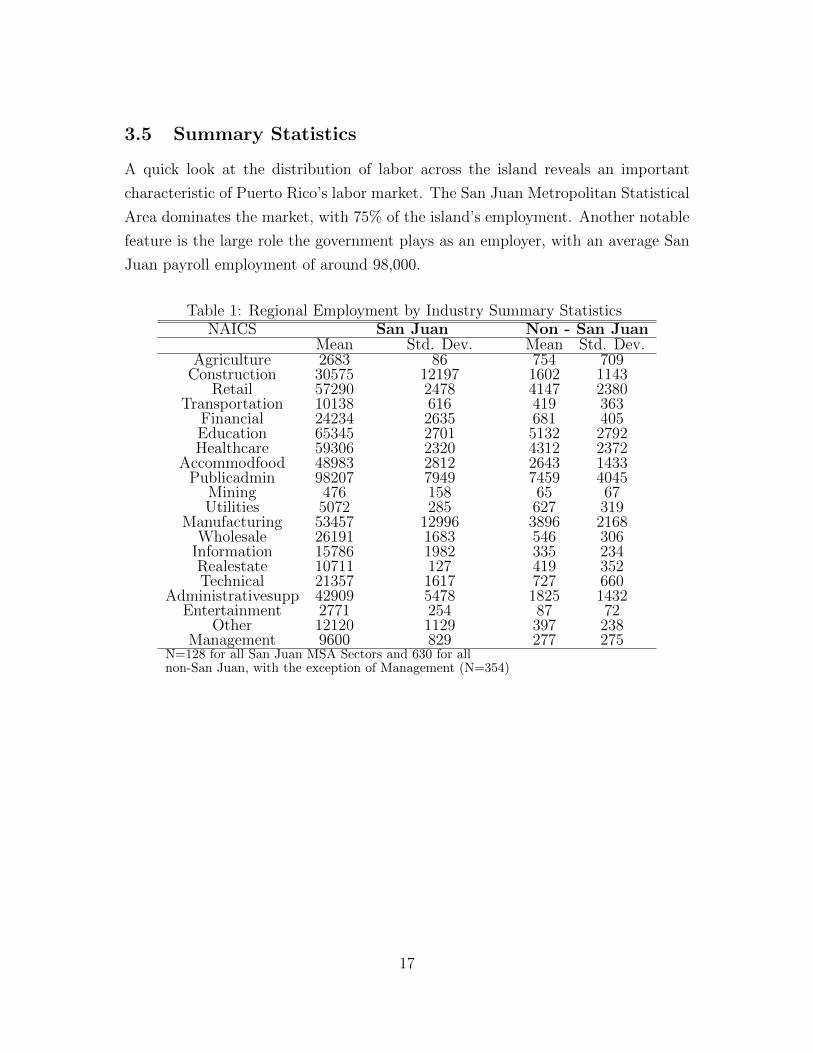
3.5 Summary Statistics
A quick look at the distribution of labor across the island reveals an important
characteristic of Puerto Rico’s labor market. The San Juan Metropolitan Statistical
Area dominates the market, with 75% of the island’s employment. Another notable
feature is the large role the government plays as an employer, with an average San
Juan payroll employment of around 98,000.
Table 1: Regional Employment by Industry Summary StatisticsNAICS San Juan Non - San Juan
Mean Std. Dev. Mean Std. Dev.Agriculture 2683 86 754 709
Construction 30575 12197 1602 1143Retail 57290 2478 4147 2380
Transportation 10138 616 419 363Financial 24234 2635 681 405Education 65345 2701 5132 2792Healthcare 59306 2320 4312 2372
Accommodfood 48983 2812 2643 1433Publicadmin 98207 7949 7459 4045
Mining 476 158 65 67Utilities 5072 285 627 319
Manufacturing 53457 12996 3896 2168Wholesale 26191 1683 546 306
Information 15786 1982 335 234Realestate 10711 127 419 352Technical 21357 1617 727 660
Administrativesupp 42909 5478 1825 1432Entertainment 2771 254 87 72
Other 12120 1129 397 238Management 9600 829 277 275
N=128 for all San Juan MSA Sectors and 630 for allnon-San Juan, with the exception of Management (N=354)
17
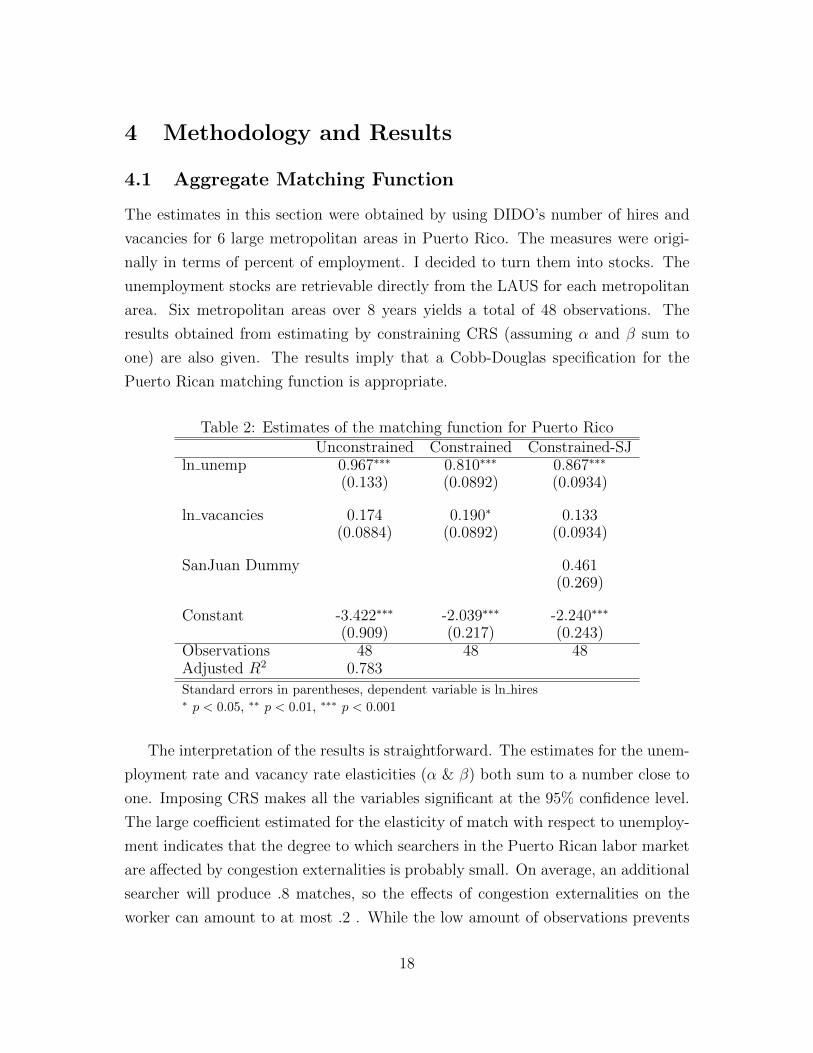
4 Methodology and Results
4.1 Aggregate Matching Function
The estimates in this section were obtained by using DIDO’s number of hires and
vacancies for 6 large metropolitan areas in Puerto Rico. The measures were origi-
nally in terms of percent of employment. I decided to turn them into stocks. The
unemployment stocks are retrievable directly from the LAUS for each metropolitan
area. Six metropolitan areas over 8 years yields a total of 48 observations. The
results obtained from estimating by constraining CRS (assuming α and β sum to
one) are also given. The results imply that a Cobb-Douglas specification for the
Puerto Rican matching function is appropriate.
Table 2: Estimates of the matching function for Puerto RicoUnconstrained Constrained Constrained-SJ
ln unemp 0.967∗∗∗ 0.810∗∗∗ 0.867∗∗∗
(0.133) (0.0892) (0.0934)
ln vacancies 0.174 0.190∗ 0.133(0.0884) (0.0892) (0.0934)
SanJuan Dummy 0.461(0.269)
Constant -3.422∗∗∗ -2.039∗∗∗ -2.240∗∗∗
(0.909) (0.217) (0.243)Observations 48 48 48Adjusted R2 0.783
Standard errors in parentheses, dependent variable is ln hires∗ p < 0.05, ∗∗ p < 0.01, ∗∗∗ p < 0.001
The interpretation of the results is straightforward. The estimates for the unem-
ployment rate and vacancy rate elasticities (α & β) both sum to a number close to
one. Imposing CRS makes all the variables significant at the 95% confidence level.
The large coefficient estimated for the elasticity of match with respect to unemploy-
ment indicates that the degree to which searchers in the Puerto Rican labor market
are affected by congestion externalities is probably small. On average, an additional
searcher will produce .8 matches, so the effects of congestion externalities on the
worker can amount to at most .2 . While the low amount of observations prevents
18
me from running fixed effects, the third model in table 2 estimates the same model
with a dummy variable for the San Juan metro area. All three estimates seem to
be somewhat high when compared to the literature, but considering the confidence
interval it might well be that the match elasticity of unemployment is somewhere in
the usual .6 to .7 range.
Internationally, these results are most comparable to countries which are asso-
ciated low unemployment rates such as the UK (Layard et al. 1991) and Germany
(Burda and Wyplosz 1994). Interestingly, van Ours (1995), which uses annual data
for regions in the Netherlands, finds a much lower match elasticity of unemploy-
ment (.48). Countries like Spain, which are most often compared to Puerto Rico
in terms of labor market outcomes, exhibit extremely low elasticities of match (.12,
Burda and Wyplosz 1994). The disparity between the estimates probably stems
from a fundamental difference in the rate of exit from the labor force between the
countries. While the recession in Spain led to unemployment in the mid twenties,
Puerto Rico’s unemployment rate has never increased beyond 16%, even in times
of sharp and persistent economic decline. Thus, the discouraged worker effect and
emigration have kept the labor market on the island relatively free of congestion on
the worker side during the period examined.
The small coefficient on vacancies indicates that the potential congestion exter-
nalities firms exert on each other while searching for workers are likely large. The
majority of the empirical literature finds this same pattern, so it has been generally
accepted that search frictions are larger on the firm side than on the worker side.
(Pissarides & Petrongolo 2001)
An important discussion related to the estimates presented in table 2 revolves
around whether aggregation introduces significant bias into the estimates. While
this issue is far from settled, the empirical literature ”does not support serious aggre-
gation problems that cannot be dealt with” (Pissarides & Petrongolo 2001). Another
important fact to keep in mind is that our estimates will depend on the cyclical
conditions on the island, so examining a later period with the same model will lead
to different estimates of the match elasticities. The aggregation question can be ex-
plored by searching for evidence of the matching function at the disaggregate level.
19
In the next section, I attempt to estimate a sectoral level matching function in order
to contribute to the discussion on the micro-foundations of the theory.
4.2 Sectoral Unemployment Estimates
Although Puerto Rico produces industry-level unemployment rate estimates, the
sectors in which the data is cross sectioned do not match the 20 NAICS sectors used
for reporting the other two key parameters of the matching function (matches and
vacancies). Here I attempt to estimate industry level unemployment rates for the
Puerto Rican economy, using what we know about flows in the labor market.
From the Quarterly Census of Employment and Wages (QCEW), I observe the
region and industry of every significant employer on the island. Importantly, I know
total employment at each one of these employers. I compute the monthly change in
employment in industry j within statistical area i from 2006-2016.
∆Eijt = Eij(t+1) − Eijt
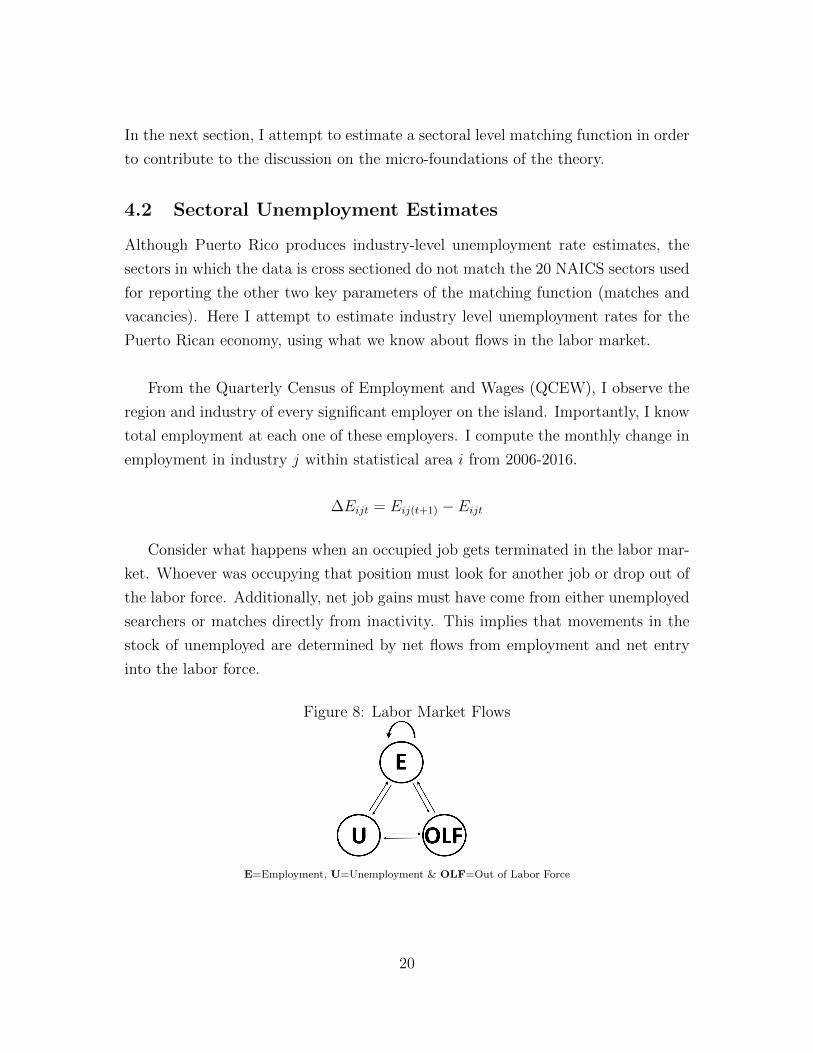
Consider what happens when an occupied job gets terminated in the labor mar-
ket. Whoever was occupying that position must look for another job or drop out of
the labor force. Additionally, net job gains must have come from either unemployed
searchers or matches directly from inactivity. This implies that movements in the
stock of unemployed are determined by net flows from employment and net entry
into the labor force.
Figure 8: Labor Market Flows
E=Employment, U=Unemployment & OLF=Out of Labor Force
20
First, I investigate the relationship of the labor flows at a regional aggregation
level. I use the total observed monthly changes in employment and net changes
in the stock of inactive population within a particular area to predict the region’s
unemployment. I employ fixed effects using the D dummies for all non-San Juan
regions. Employment and unemployment should be inversely related; I quantify this
inverse relationship in order to understand how movements in employment affect
unemployment rates in Puerto Rico. The model described above is then given by:
Uit = β1 · ∆Eit + β2 · ∆OLFit + εit
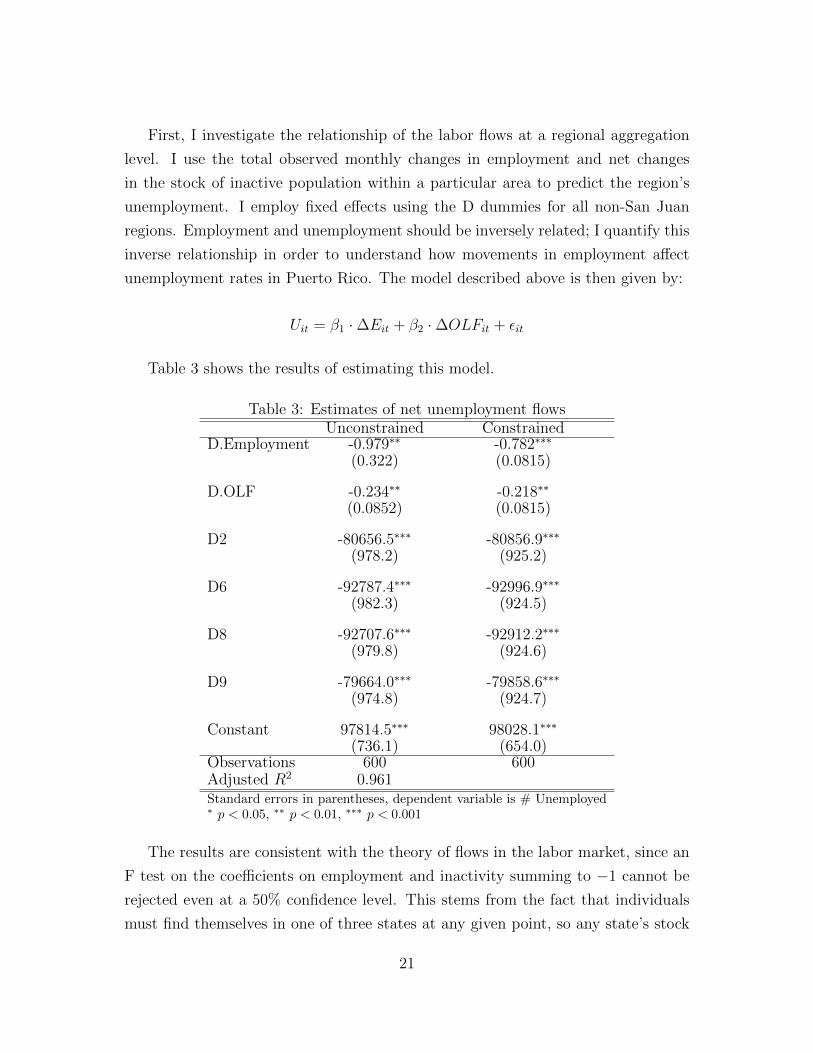
Table 3 shows the results of estimating this model.
Table 3: Estimates of net unemployment flowsUnconstrained Constrained
D.Employment -0.979∗∗ -0.782∗∗∗
(0.322) (0.0815)
D.OLF -0.234∗∗ -0.218∗∗
(0.0852) (0.0815)
D2 -80656.5∗∗∗ -80856.9∗∗∗
(978.2) (925.2)
D6 -92787.4∗∗∗ -92996.9∗∗∗
(982.3) (924.5)
D8 -92707.6∗∗∗ -92912.2∗∗∗
(979.8) (924.6)
D9 -79664.0∗∗∗ -79858.6∗∗∗
(974.8) (924.7)
Constant 97814.5∗∗∗ 98028.1∗∗∗
(736.1) (654.0)Observations 600 600Adjusted R2 0.961Standard errors in parentheses, dependent variable is # Unemployed∗ p < 0.05, ∗∗ p < 0.01, ∗∗∗ p < 0.001
The results are consistent with the theory of flows in the labor market, since an
F test on the coefficients on employment and inactivity summing to −1 cannot be
rejected even at a 50% confidence level. This stems from the fact that individuals
must find themselves in one of three states at any given point, so any state’s stock
21
of individuals must be inversely related to the stocks of the other two states by
construction. Tests for heteroskedasticity and autocorrelation were both negative.
What I learn from this regression is that for the island as a whole during the
period 2006-2016, the termination of 100 filled jobs creates on average 78 unemployed
persons and 22 inactive the following month. While this information is revealing, it
is reasonable to assume that the coefficients vary significantly by industry. In order
to explore whether this is the case, I estimate the same model, this time separating
employment by sector. The model is given by:
Uit =∑
βj · ∆Eijt + α · ∆OLFit + εit
The results of this estimation are given in table 5 of the appendix. They show
that the strong flow relationships I uncovered in the aggregate estimation break
down at the industry level. This implies that the sectors are not distinct enough
in how they send people from employment into the other states to be picked up in
our model. It is possible that a mixture of dropping sectors and regions to leave
only the largest ones can produce significant results, but there is no systematic way
of determining when the model is correctly specified. For this reason, I use the
aggregate estimates in table 3 to create unemployment estimates for all industries.
The process of creating the series is described in detail below.
4.2.1 Constructing“Sectoral Unemployment” Time Series
I want to estimate the matching function m(u, v) at the industry level for the Puerto
Rican economy. While I get m and v directly from the DIDO, the sectoral unemploy-
ment measures published by the government are not compatible with the measures
of hires and vacancies. In this section, I discuss my procedure for creating a measure
of ”sectoral unemployment”.
First, one must understand that conceptually there is no such thing as an
industry-level unemployment rate. Because unemployed searchers can browse many
sectors at the same time, there is really no way to attribute searchers to a single
22
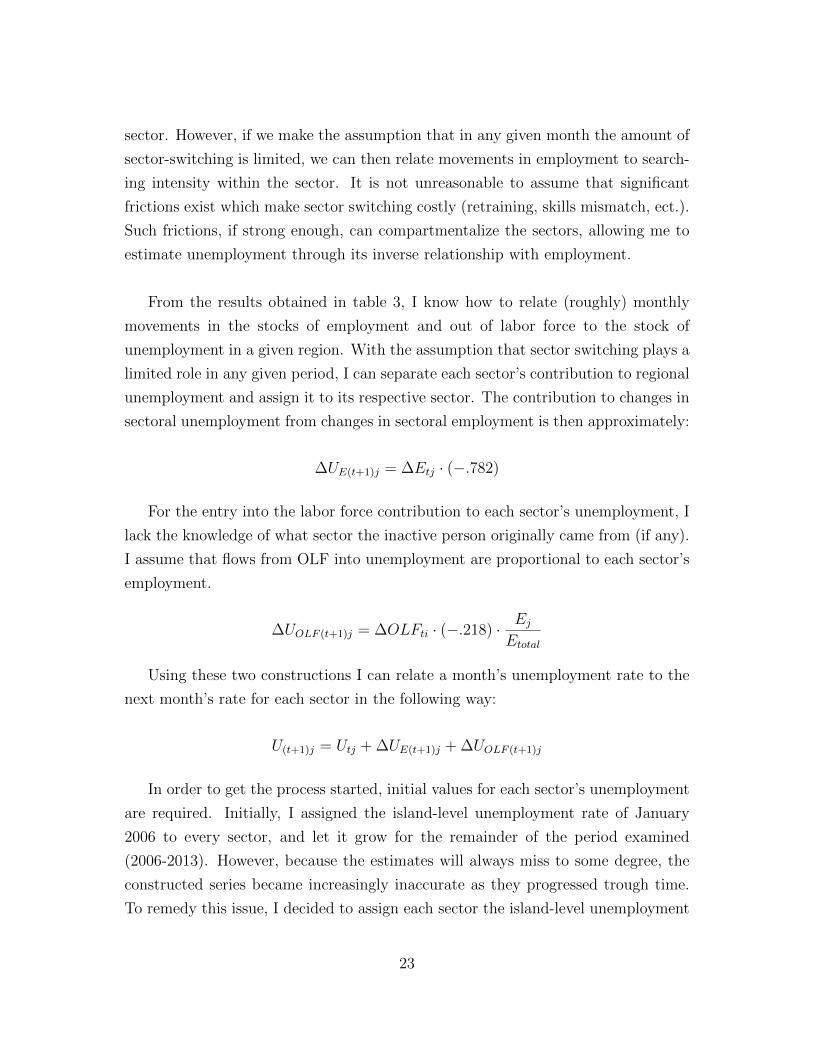
sector. However, if we make the assumption that in any given month the amount of
sector-switching is limited, we can then relate movements in employment to search-
ing intensity within the sector. It is not unreasonable to assume that significant
frictions exist which make sector switching costly (retraining, skills mismatch, ect.).
Such frictions, if strong enough, can compartmentalize the sectors, allowing me to
estimate unemployment through its inverse relationship with employment.
From the results obtained in table 3, I know how to relate (roughly) monthly
movements in the stocks of employment and out of labor force to the stock of
unemployment in a given region. With the assumption that sector switching plays a
limited role in any given period, I can separate each sector’s contribution to regional
unemployment and assign it to its respective sector. The contribution to changes in
sectoral unemployment from changes in sectoral employment is then approximately:
∆UE(t+1)j = ∆Etj · (−.782)
For the entry into the labor force contribution to each sector’s unemployment, I
lack the knowledge of what sector the inactive person originally came from (if any).
I assume that flows from OLF into unemployment are proportional to each sector’s
employment.
∆UOLF (t+1)j = ∆OLFti · (−.218) · EjEtotal
Using these two constructions I can relate a month’s unemployment rate to the
next month’s rate for each sector in the following way:
U(t+1)j = Utj + ∆UE(t+1)j + ∆UOLF (t+1)j
In order to get the process started, initial values for each sector’s unemployment
are required. Initially, I assigned the island-level unemployment rate of January
2006 to every sector, and let it grow for the remainder of the period examined
(2006-2013). However, because the estimates will always miss to some degree, the
constructed series became increasingly inaccurate as they progressed trough time.
To remedy this issue, I decided to assign each sector the island-level unemployment
23
rate the first month of every year. I then let the sectors move according to the proce-
dure outlined above for the remaining 11 months. In table 6 of the appendix, I check
this step by using June instead of January as the fixed month. While the month
to month stock of unemployment will surely be inaccurate, the averaging out of the
monthly data into annual data for estimation with the DIDO series should give the
estimates considerable strength, considering they start at the economy-wide unem-
ployment rate. Ultimately, what I am doing is letting the industries deviate from
the island-level unemployment rate according to movements in their employment
levels and movements in the economy-wide labor force. In the next section, I use
these constructed time series to estimate the matching function at the industry level.
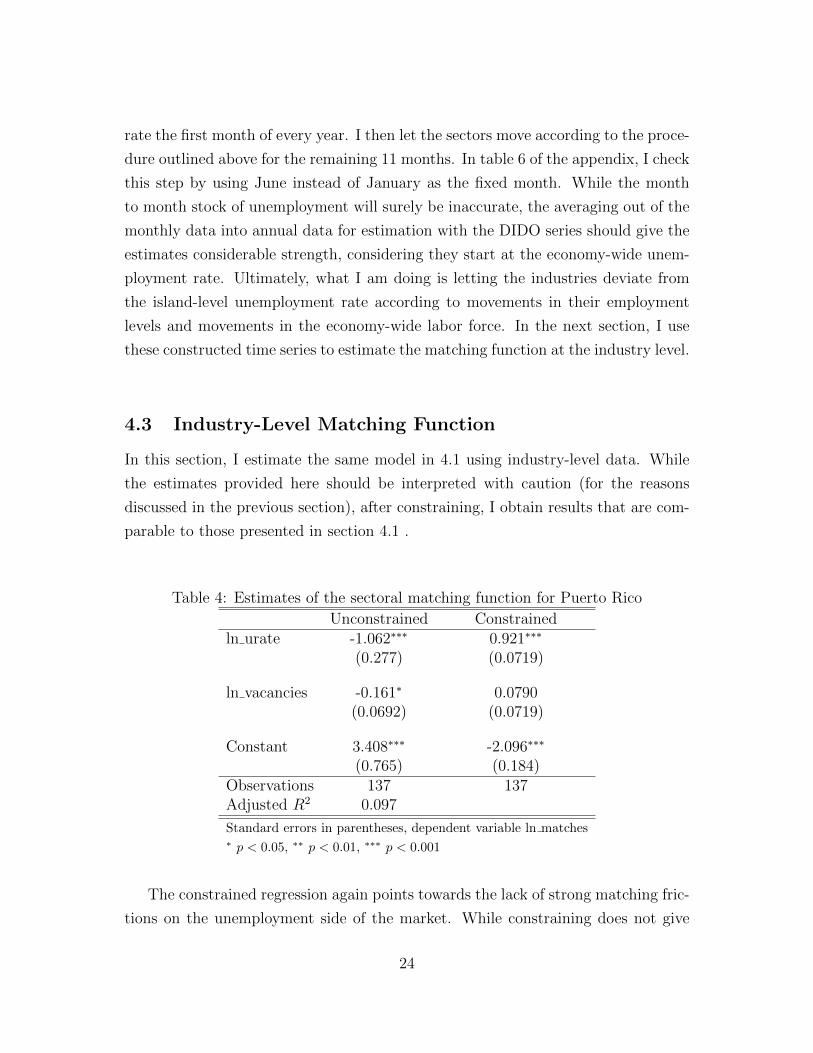
4.3 Industry-Level Matching Function
In this section, I estimate the same model in 4.1 using industry-level data. While
the estimates provided here should be interpreted with caution (for the reasons
discussed in the previous section), after constraining, I obtain results that are com-
parable to those presented in section 4.1 .
Table 4: Estimates of the sectoral matching function for Puerto Rico
Unconstrained Constrainedln urate -1.062∗∗∗ 0.921∗∗∗
(0.277) (0.0719)
ln vacancies -0.161∗ 0.0790(0.0692) (0.0719)
Constant 3.408∗∗∗ -2.096∗∗∗
(0.765) (0.184)Observations 137 137Adjusted R2 0.097
Standard errors in parentheses, dependent variable ln matches∗ p < 0.05, ∗∗ p < 0.01, ∗∗∗ p < 0.001
The constrained regression again points towards the lack of strong matching fric-
tions on the unemployment side of the market. While constraining does not give
24

vacancies significance, the large unemployment coefficient and the fact that CRS
fits the data well for PR implies that the frictions employers create while searching
are likely large. However, the large disparity between the unconstrained and con-
strained estimates imply that constraining is probably not adequate. The low R
squared of the model compared to the one in section 4.1 underscores the difficulty
of cross sectioning across industries instead of regions.
Two possibilities likely explain the contradictory results found in the uncon-
strained regression. First, it is possible that an industry level matching function
does not exist. Industry switching might potentially be common, which would in-
validate the estimates presented in table 4. Second, it is likely that industries are
distinct in the proportion of separations that they send individuals into unemploy-
ment and inactivity. This would also put into question the sectoral unemployment
measures generated in the previous section and the estimates provided in table 4.
A more careful approach is required to uncover the matching process at the in-
dustry level, since it is more complex than its regional counterpart. In the case
of Puerto Rico, such an approach is hindered by the lack of high-frequency and
high-granularity data.
25

5 Conclusion
The matching process in the Puerto Rican labor market can be modeled adequately
with a CRS Cobb-Douglass matching function. A large estimate for the elasticity of
match with respect to unemployment (.83) implies that the role matching frictions
play for workers in the market is likely small. The high elasticity of unemployment
with respect to match is not observed at the industry level in any significant way
with the available data. The regional estimates imply that the Puerto Rican labor
market is able to make a relatively large amount of matches with few unemployed
searchers. A possible explanation for the findings is the fact that the discouraged
worker effect and demographic patterns since 2006 have greatly decreased the labor
force. This would have the effect of keeping the amount of unemployed relatively
stable, avoiding congestion in the market.
In the context of policy prescriptions for the current crisis, the results in this
paper are not definitive. As was mentioned in section 1, the analysis done here
only addresses the question of matching frictions. However, it is well known that
the labor market can be afflicted by a myriad of other failures which must each be
ruled out individually. The more these type of mechanisms are ruled out, the more
confident the government can be in enacting supply side reforms.
Another important finding of this study was the unavailability of high frequency
data for Puerto Rican labor market dynamics. While policymakers will be in desper-
ate need of this type of data in the upcoming months as they try to gauge the effects
of their reforms, programs which are commonplace in the US (such as JOLTS) are
simply not gathered in Puerto Rico. This implies that any analysis will suffer from
imprecision, since estimates will be created with relatively little information.
26

6 Appendix
Table 5: Estimates of sectoral net unemployment flowsD.unemployment
D.NAICS11 8.620(9.049)
D.NAICS23 0.510(1.275)
D.NAICS44 -1.164(1.291)
D.NAICS48 -0.637(3.008)
D.NAICS52 -1.678(2.438)
D.NAICS61 0.504(0.525)
D.NAICS62 -2.901∗(1.400)
D.NAICS92 -0.146(0.515)
D.NAICS21 96.94∗∗∗(25.68)
D.NAICS22 -9.121(17.23)
D.NAICS31 -1.513(1.956)
D.NAICS42 1.581(4.433)
D.NAICS51 -7.331(6.469)
D.NAICS53 7.780(4.295)
D.NAICS54 -3.978(2.913)
D.NAICS56 -2.581∗∗(0.878)
D.NAICS71 -4.825(10.18)
D.NAICS81 4.023(5.566)
D.NAICS55 1.822(6.346)
D.OLF -0.221∗∗∗(0.0649)
Constant -384.3(877.0)
Observations 120Adjusted R2 0.232Standard errors in parentheses∗ p < 0.05, ∗∗ p < 0.01, ∗∗∗ p < 0.001
27

Below I check that the results obtained in section 4.3 do not stem from my choice
of initial month during the construction of the sectoral unemployment time series.
The results come from using June as the “anchor” month, and letting the series
move during the other 11 months of every year. As is observable, the results are
very similar to those obtained in section 4.3 .
Table 6: Estimates of the matching function for Puerto Rico (June)
Unconstrained Constrainedln urate -1.639∗∗∗ 0.947∗∗∗
(0.352) (0.0716)
ln vacancies -0.194∗∗ 0.0530(0.0688) (0.0716)
Constant 4.918∗∗∗ -2.112∗∗∗
(0.954) (0.180)Observations 137 137Adjusted R2 0.137
Standard errors in parentheses∗ p < 0.05, ∗∗ p < 0.01, ∗∗∗ p < 0.001
28
7 Data Sources
• Bureau of Labor Statistics. ”Local Area Unemployment Survey” Retrieved at:
http://www.bls.gov/lau/ on 11/21/2016
• Puerto Rican Labor Department/BLS ”Employment by NAICS Sector” Re-
trieved at: http://www.mercadolaboral.pr.gov/Publicaciones/Industrias/
Empleo_Sector_Industrial.aspx on 11/21/2016
• Puerto Rican Labor Department ”Encuesta Division de Investigacion de De-
strezas Ocupacionales (DIDO)” Retrieved at: http: // trabajo. pr. gov/
det_ estadistica. asp? cnt_ id= 453 on 11/21/2016.
References
Acemoglu, (2001) ”Good Jobs versus Bad Jobs” Journal of Labor Economics, Vol.
19, no. 1, pp. 1-22.
Anderson & Burgess. Empirical Marching Functions: Estimation and Interpreta-
tion using State-Level Data. The review of economics and statistics. 2000
Autor, D. (2010) MIT Department of Economics ”Lectures 1 and 2 - Introduction
and a First Application: The Minimum Wage Debate and Causal Inference
in Economics” Retrieved on 11/22/2016 at:https://ocw.mit.edu/courses/
economics/14-03-microeconomic-theory-and-public-policy-fall-2010/
lecture-notes/MIT14_03F10_lec01_02.pdf
Berentsen A. (2009) ”Equilibrium Unemployment Theory: The labor market”
MIT lecture slides. https: // wwz. unibas. ch/ fileadmin/ wwz/ redaktion/
witheo/ personen/ aleks/ Teaching/ Equilibrium_ Unemployment_ Theory/
01TheLaborMarket4on1. pdf
Burda M. , Wyplosz C. ”Gross worker and job flows in Europe” (1994) European
Economic Review Vol.38 pp. 1287-131
Encuesta de Vivienda (2000) Departamento de Estadisticas de Puerto Rico.
http://www.estadisticas.gobierno.pr/iepr/LinkClick.aspx?fileticket=
QUEOkgr1Yyk%3d&tabid=186
29
Flinn, C. (2006) ”Minimum Wage Effects on Labor Market Outcomes under
Search, Matching, and Endogenous Contact Rates” Econometrica, Vol. 74 Issue
4
Galuscak K. Munich D. ”Structural and Cyclical Unemployment: What Can We
Derive from the Matching Function ?” (2005) Czech National Bank Working Paper
Series, Series 2 - 20
Gross D. ”The Fate of Greece in a ‘Genuine Economic and Monetary Union’:
Lessons from a small island state” (2015)Centre for European Policy Studies, High
Level Brief http: // aei. pitt. edu/ 65087/ 1/ HLB5_ DG_ PuertoRico. pdf
Hall R., Schulhofer-Wohl S. (2015) ”Measuring Job-Finding Rates and Matching
Efficiency with Heterogeneous job seekers” NBER Working Paper No. 20939
Ibourk, A. et al. (2001) ”The Matching Efficiency of Regional Labour Mar-
kets, A Stochastic Production Frontier Estimation” Institute for the Study of La-
bor,Discussion Paper No. 339
”Job openings, hires, and separations return to pre-recession lev-
els” BLS Figure 17 https://www.bls.gov/opub/mlr/2016/article/
job-openings-hires-and-separations-return-to-prerecession-levels-in-2015.
htm
Krueger, A. et al. (2015) Puerto Rico - A way Forward http://www.bgfpr.com/
documents/PuertoRicoAWayForward.pdf
Petrongolo B., Pissarides, C. (2001) ”Looking into the Black Box: A Survey of the
Matching Function” Journal of Economic Literature, Vol. XXXIX pp.390-431
Pissarides, (2000) ”Equilibrium Unemployment Theory 2nd ed” The MIT Press
pp. 3 - 23.
Guzman M. & Stiglitz J. (2017) ”From Bad to Worse for Puerto Rico”
Project Syndicate https: // www. project-syndicate. org/ commentary/
puerto-rico-debt-plan-deep-depression-by-joseph-e--stiglitz-and-martin-guzman-2017-02
30

World Bank Data. Employment to population ratio, 15+ total (%) (mod-
eled ILO estimate) http://data.worldbank.org/indicator/SL.EMP.TOTL.SP.
ZS?locations=PR-US
31