finance
52
Unit 10: Financial Accounting and Reporting Name: Farhan Shakeel E-mail: [email protected] Task 1 (L.O 1.1) Select any two companies given below and describe different users and their need of using the financial statements: 1. Etisalat telecom 2. Emirates airline 3. ADNOC petroleum 4. Shell petroleum 5.Unilever 6. Global learning center 7. Eco-Schools , UAE 8. Dubai Charity Association 9. Dubai Foundation for Women And Children 10.Environment Protection & Development Authority, Ras Al Khaimah Answer: Global Learning Centre Users and their needs: 1. Investors, lenders and shareholders: To know whether Global Learning Centre is a right institute to invest?
-
Upload
northampton -
Category
Documents
-
view
0 -
download
0
Transcript of finance
Unit 10: Financial Accounting and Reporting Name: Farhan Shakeel
E-mail: [email protected]
Task 1 (L.O 1.1)
Select any two companies given below and describe different users and their need of using the financial statements:
1.Etisalat telecom2.Emirates airline3.ADNOC petroleum4.Shell petroleum5.Unilever6.Global learning center7.Eco-Schools , UAE8.Dubai Charity Association9.Dubai Foundation for Women And Children10.Environment Protection & Development Authority, Ras Al Khaimah
Answer:
Global Learning Centre
Users and their needs:
1.Investors, lenders and shareholders:
To know whether Global Learning Centre is a right institute to invest?

Will Global Learning Centre will be able to pay backthe interest or dividend?
To note the goodwill/financial reputation of Global Learning Centre?
2.Customers Information about the Admission Information about the course provided Information about the professors, students and the surroundings. facilities charges transportation charges
3.Suppliers/other creditors Will Global Learning Centre pay on time for their purchases? To know Past record of payment with other GlobalLearning Centre suppliers. Is Global Learning Centre safe to provide cash sales?
4.Competitors(other institutes) As to compare fees strategy To know the strengths and weakness of Global Learning Centre To compare their financial performance with Global Learning Centre
5.UAE government Will Global Learning Centre pay accurate amount of tax declared in the tax returns?
To keep a track, as to measure the economic progress
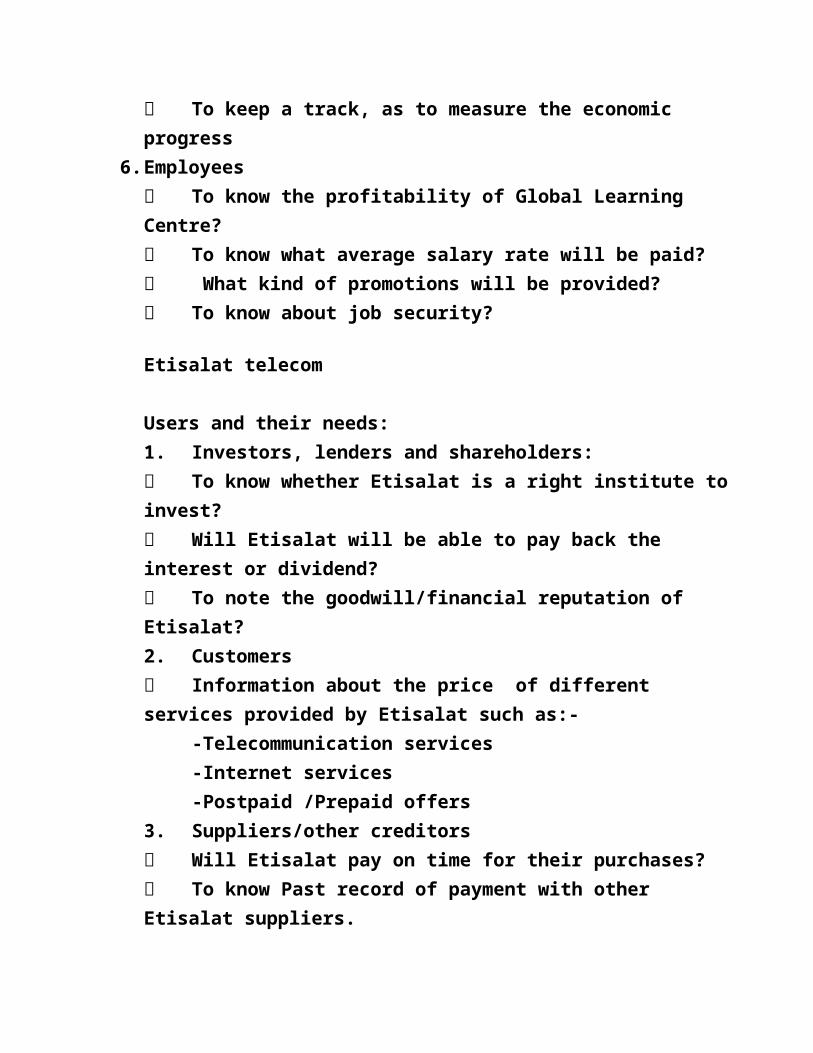
6.Employees To know the profitability of Global Learning Centre? To know what average salary rate will be paid? What kind of promotions will be provided? To know about job security? Etisalat telecom
Users and their needs:1. Investors, lenders and shareholders: To know whether Etisalat is a right institute toinvest? Will Etisalat will be able to pay back the interest or dividend? To note the goodwill/financial reputation of Etisalat?2. Customers Information about the price of different services provided by Etisalat such as:-
-Telecommunication services-Internet services-Postpaid /Prepaid offers
3. Suppliers/other creditors Will Etisalat pay on time for their purchases? To know Past record of payment with other Etisalat suppliers.

Is Etisalat safe to provide credit sales?4. Competitors(other institutes) As to compare fees strategy To know the strengths and weakness of Etisalat To compare their financial performance with Etisalat5. UAE government Will Etisalat pay accurate amount of tax declared in the tax returns? To keep a track, as to measure the economic progress.6. Employees To know the profitability of Etisalat? To know what average salary rate will be paid? What kind of promotions will be provided? To know about job security?
Scenario:
UK based multinational company wants to establish a new unit in one of the most feasible area of UAE. They are specializing in manufacturing of electronicproducts such as air conditioners, electric oven andetc. The finance director is being worry about the influences of regulatory/legal on the financial statements.

You are the unit finance controller, has been assigned to guide the finance director regarding following matters:
Describe users of Financial Statements and their needs? (L.O 1.2)Answer: (L.O 1.2)1. Investors, lenders and shareholders: To know whether it is a right organization to invest? Willit be able to pay back the interest or dividend? To note the goodwill/financial reputation of it?2. Customers Information about the price and product of the company. 3. Suppliers/other creditors Will it pay on time for their purchases? To know Past record of payment with other suppliers. Is safe to provide credit sales?4. Competitors(other institutes) As to compare fees strategy To know the strengths and weakness of it To compare their financial performance with it5. UAE government Will pay accurate amount of tax declared in the tax returns?

To keep a track, as to measure the economic progress.6. Employees To know the profitability of it? To know what average salary rate will be paid? What kind of promotions will be provided? To know about job security?
Assess the regulatory/legal implications for users of Financial Statements (L.O 1.3) Prohibition of use of certain financial statements.Financial statements which purport to give effect tothe receipt and application of any part of the proceeds from the sale of securities for cash shall not be used unless such securities are to be offeredthrough underwriters and the underwriting arrangements are such that the underwriters are or will be committed to take and pay for all of the securities, if any are taken, prior to or within a reasonable time after the commencement of the publicoffering, or if the securities are not so taken to refund to all subscribers the full amount of all subscription payments made for the securities. The caption of any such financial statement shall clearly set forth the assumptions upon which such statement is based. The caption shall be in type at least as large as that used generally in the body ofthe statement.

Task 2
Tang Company.
Trial Balance as at 31st December 2013$000
Particulars Debit Credit
Sales 412,500
Plant 350,000 -
Vehicles 190,000 -
Goodwill
20,000 -
License 150,000 -
Cash
10,000 -
Debtor
27,000 -
Inventory (1st Jan 2012)
10,000 -
Capital - 242,000
Loan - 410,000
Creditor - 120,000
Administration
25,000 -Distribution -

30,000
Salaries
53,000 -
Utilities Expenses
11,200 -
Rent
21,500 -
Interest
5,800 -
Income -
1,500 911,
500 1,18
6,000
Notes:
Tang commenced manufacturing of wheel business with some of his friends on January 2012. You are newly hired senior accountant and required to make Income statement and balance sheet. While making the financialstatements you came into know that some of the entries required to be adjusted.
• Closing stock at 31st Dec 2013 was $22,000.
• Some of the purchases have been mistakenly charged in the salaries, costing $4000.
• Sales have been incurred evenly whole year. Last month due to some catastrophic event record of lastmonth got destroyed.

• Management has decided to charge $2,000 for bad debt.
• Deprecation on the plant has also not been providedfor the year end, company policy is to charge 2% ofcost.
• Store In-charge just came to you and informed you regarding the same catastrophic event happened in last month, due to that some of the records has been lost. But on the investigation you got able toget the cost of goods produce is $308,000 on 31 December. You are required to calculate Cost of purchases.
• Goodwill impairment test has been conducted and theresult shown the decrease of $800.
• Tax has been accrued for this year and has not beenrecorded in the accounts. Total amount of accrued taxation is $1,200.
Adjust the trial Balance, prepare income statement and balance sheet.
Trial Balance After adjustment

Particulars Debit Credit
Sales 450,000
Plant 350,000 -
Vehicles 190,000 -
Goodwill
20,000 -
License 150,000 -
Cash
10,000 -
Debtor
27,000 -
Inventory (1st Jan 2012)
10,000 -
Capital - 242,000
Loan - 410,000
Creditor - 120,000
Administration
25,000 -
Purchases 324,000
Distribution
30,000 -
Salaries
49,000 -
Utilities Expenses
11,200 -

Rent
21,500 -
Interest
5,800 -
Income -
1,500 1223
500 12235
00
Income Statement
Statement of comprehensive Income for the periodended 31 December 2013
Debit (Dr) Credit (Cr)
Sales 450,000
Cost of GoodsSold:
(Opening Stock 10,000
+Purchases 324,000
-Closing Stock) (22,000) (312,000)
=Gross Profit 138,000
Add Other Income 1,500 139,500
Less Expenses:
Utility Expenses 11,200

Salaries 49,000
Rent 21,500
Distribution 30,000
Administration 25,000
Depreciation onplant (2%)
7,000
Bad Debt 2,000 (1,45,700)
=Net loss beforeinterest and tax
(6,200)
Tax 1,200
Interest 5,800
Goodwill 800 (7,800)
Net Loss (14,000)
Balance Sheet
$
Assets:
Plant(350,000-7,000)
343,000
Vehicle 190,000
Goodwill(20,000-
19,200
800)
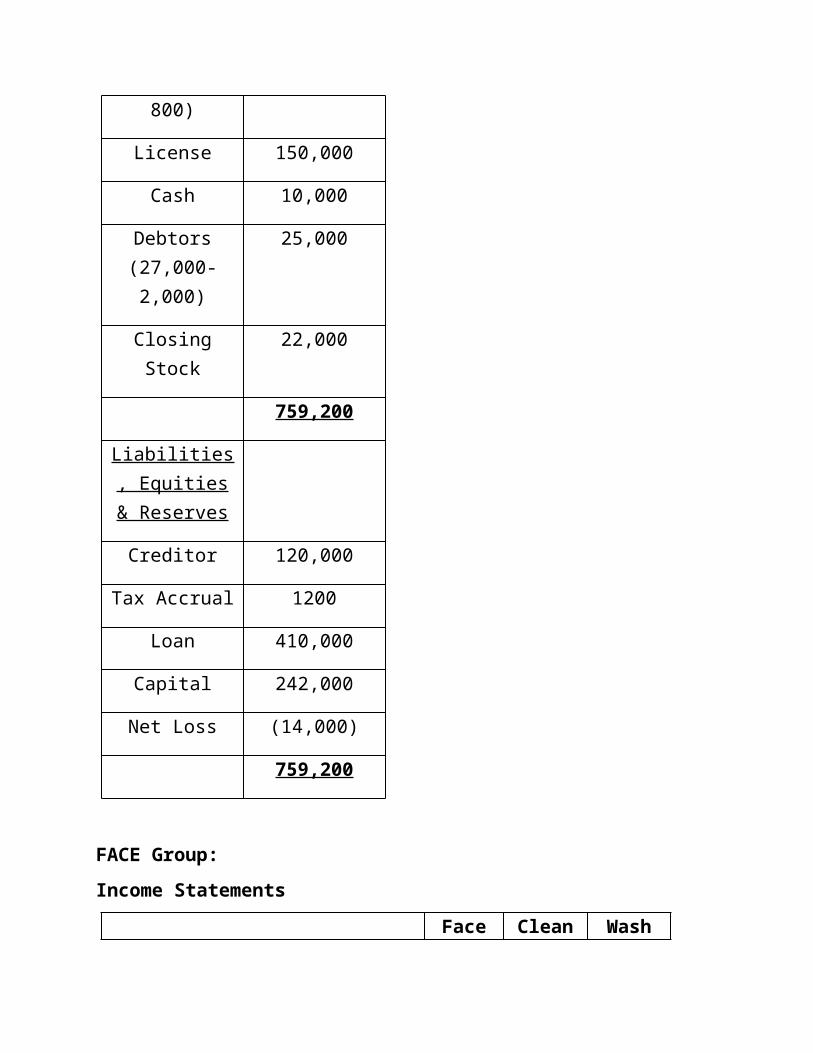
License 150,000
Cash 10,000
Debtors(27,000-2,000)
25,000
ClosingStock
22,000
759,200
Liabilities, Equities& Reserves
Creditor 120,000
Tax Accrual 1200
Loan 410,000
Capital 242,000
Net Loss (14,000)
759,200
FACE Group:Income Statements
Face Clean Wash

Sales 80,000 43,000 56,000
COGS 58,000 28,000 39,000
=Gross Profit 22,000 15,000 17,000
Add Other Income 10,000 - 3,000
Less expenses:Advertisement
(5,000)
(5,000)
(4,000)
Distribution (4,000)
(8,000)
(6,000)
Interest (2,000)
(1,500)
(1,500)
Taxation (1,000) (500) (1,500
)
Net Profit 20,000 - 7,000
Balance SheetFace Clean Wash
Plant & machinery 120,000 60,000 75,000
InvestmentIn Clean 80,000 - -In Wash 50,000 - -
license 35,000 20,000 28,000Cash 35,000 10,000 22,000Debtors 50,000 25,000 36,000Inventory 28,000 12,000 19,000
Total Assets 398,000
127,000
180,000

Share Capital150,00
0 80,000 93,000
Retained Earnings 71,000 3,000 9,000
Bank Loan 100,000 35,000 50,000
Creditors 77,000 9,000 28,000Total Equity and Liabilities
398,000
127,000
180,000
Notes:• During the year Face purchased goods from Wash on
the market value of $6,000• Dividend has been declared by Face for the last
year $700• Wash, Cash of $5,000 has been issued to face but it
is supposed to receive in 2 days.Prepare Consolidated Statement of Financial Position and Consolidated Comprehensive Income Statement for theFace Group, year ended 31st March 2014.
(L.O 2.3)
Income Statement:Statement of comprehensive consolidated Incomestatement for the year ended 31st March 2014.

sales 179,000-(6,000) 173,000
-COGS
(125,000)+(6,000-1800) -120,800
=GP 54,00052,20
0
Advertisement -14,000
-14,00
0
Interest -5,000-
5,000
Taxation -3,000-
3,000
Other Income 13,00013,00
0
Distribution -18,000
-18,00
0
Net Profit 27,00025,20
0
Balance SheetAssets:GoodwillPlant&Machinery 255,000Licence 83,000Cash 72,000Inventory 57,200

Debtors 111,000Total Assets 578,200
Reserves, Equities &LiabilitiesRetained Earnings 103,100Bank Loan 185,000Share Capital 150,000Creditors 119,700NCI 20,400Total 578,200
Working:Goodwill (Clean)
Dr CrInvestment 80,000 Capital 80,000
Retained Earnings 3,000Negative Goodwill (3,000)
Balance : 83,000 Balance : 83,000
Goodwill (Wash) 80%Dr Cr
Investment 50,000 Capital 74,400

Retained Earnings 7,200Negative Goodwill
(31,600)Balance : 81,600 Balance : 81,600
Non-Controlling Interest (NCI) 20%Dr Cr
Investment 50,000 Capital 18,600
Retained Earnings 1,800Closing Balance: 20,400
Balance : 20,400 Balance : 20,400
Consolidated Retained EarningsDr Cr
Unrealized profit 1,800 Parent 71,000Dividend 700
Goodwill 34,600
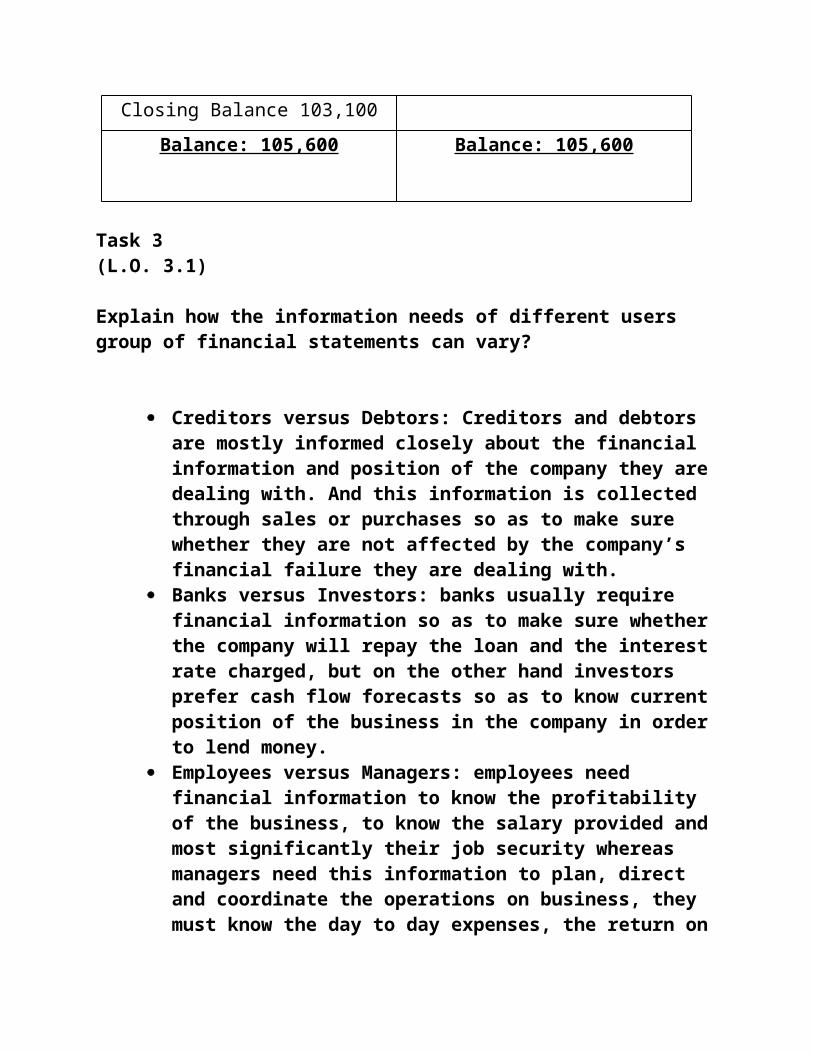
Closing Balance 103,100Balance: 105,600 Balance: 105,600
Task 3 (L.O. 3.1)
Explain how the information needs of different users group of financial statements can vary?
Creditors versus Debtors: Creditors and debtors are mostly informed closely about the financial information and position of the company they aredealing with. And this information is collected through sales or purchases so as to make sure whether they are not affected by the company’s financial failure they are dealing with.
Banks versus Investors: banks usually require financial information so as to make sure whetherthe company will repay the loan and the interestrate charged, but on the other hand investors prefer cash flow forecasts so as to know currentposition of the business in the company in orderto lend money.
Employees versus Managers: employees need financial information to know the profitability of the business, to know the salary provided andmost significantly their job security whereas managers need this information to plan, direct and coordinate the operations on business, they must know the day to day expenses, the return on

their expenses,so as to stay pro-active for any future financial problem and so on.
Capital Company• Shareholders Invested $25,000 to commence the
company and shares has been allotted to them.• For the purpose of initial marketing &
advertisement program, management did expense of $2,000 and got a good response.
• After getting the response from the market, CapitalCompany (CC) provided services to its first new customers for the exchange of cash $4,000
• Utilities expenses are payable at the end of each month, current month bill expecting to be $1,000.
• Due to tight market competition some of the services were provided on credit, which cost $8,000and the customer promised to pay it in the next month.
• The half of the utilities bill has been paid at theend of this month, the remaining will be paid with the next month bill.
• Some the debtors paid you 60 percent of their amount dues to them and rest will be soon.
• The increase market demand pushed the management increased the need for a building. CC bought a building, cost $15,000. $10,000 has been paid in cash and rest has been decided to pay after a year.
• During the year owner took out cash for to pay his son school fee $1,000.
• CC has bank overdraft of $2,000 and purchased stationary for $500 and rest of the amount spent inpurchase of goods.

Prepare income statement and balance sheet in a presentable way.
Journal Entries of Capital Company
Date Particulars Debit (Dr) $
Credit (Cr) $
1. Cash a/c……………..Dr 25000
To capital a/c
25000
2. Marketing & Advertisement a/c……..Dr
2000
To cash a/c 2000
3. Utility Expenses a/c……………….Dr
1000
To A/c Payable 1000
4. Cash a/c……………Dr 4000
To Sales a/c 4000
5. A/c receivables…………..Dr 8000
To Sales a/c 8000
6. A/c Payable.............Dr 500
To Cash a/c 500
7. Cash a/c…………….Dr 4800

To A/c receivables 4800
8. Assets: Land a/c…………….Dr 15000
To Cash a/c 10000
To Deferred Payment a/c 5000
9. Drawings a/c……………….Dr 1000
To Cash a/c 1000
10. Stationary a/c………….Dr 500
Purchases a/c……………Dr 1500
To Bank overdraft a/c
2000
Accounts:
Cash Account
Debit (Dr) $ Credit (Cr) $
Sales 4,000 Marketing &Advertisement
2,000
Cash
25,000 Assets: Land 10,000
A/creceivable
4,800 Utilityexpenses(Payable)
1,000
A/c Payable 500

Closing balance 20,300
Total: 33,800 Total: 33,800
Capital Account
Debit (Dr) $ Credit (Cr) $
Cash 25,000
ClosingBalance25,000
Total: 25,000 Total: 25,000
Marketing & Advertisement
Debit (Dr) $ Credit (Cr) $
Cash 2,000
ClosingBalance
2,000
Total: 2,000 Total: 2,000
Sales Account
Debit (Dr) $ Credit (Cr) $
Cash a/c 4,000

A/c Receivable 8,000
ClosingBalance
12,000
Total: 12,000 Total: 12,000
Utility expenses Account
Debit (Dr) $ Credit (Cr) $
A/c payable 1,000
ClosingBalance
1,000
Total: 1,000 Total: 1,000
Payable Accounts (Liability)
Debit (Dr) $ Credit (Cr) $
Cash 500 Utilityexpenses a/c
1,000
ClosingBalance
500
Total: 1,000 1,000 Total: 1,000 1,000
Receivable Account (Assets)
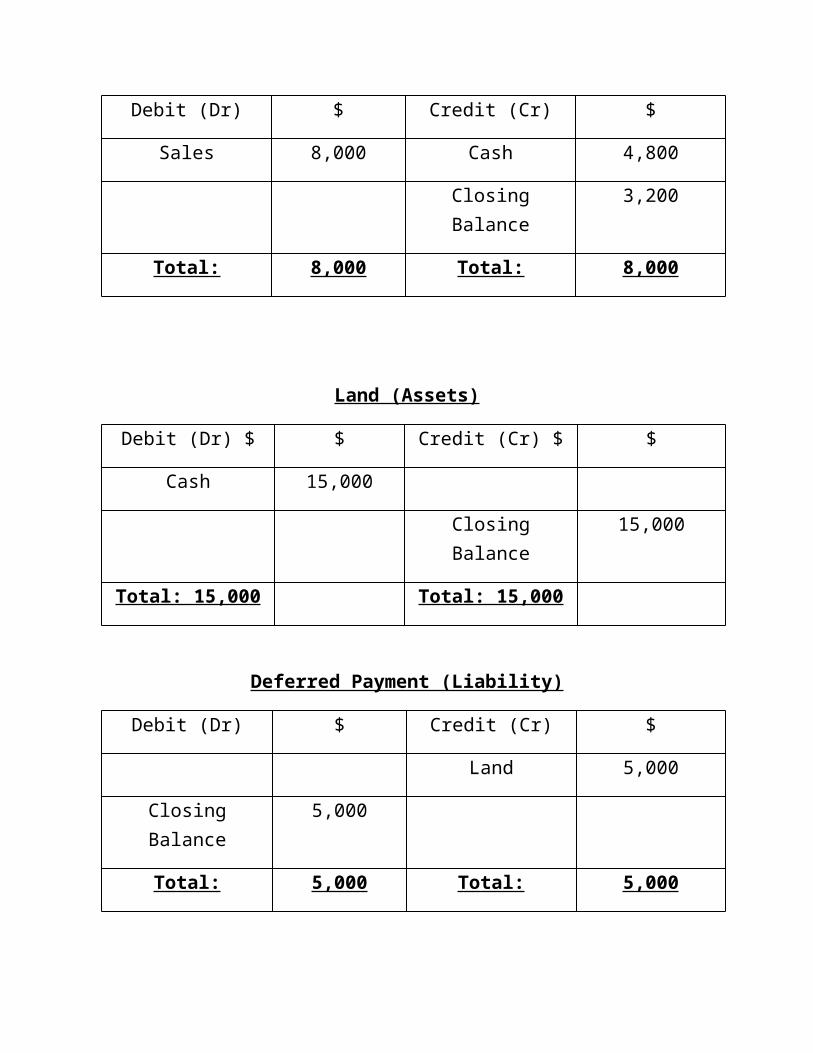
Debit (Dr) $ Credit (Cr) $
Sales 8,000 Cash 4,800
ClosingBalance
3,200
Total: 8,000 Total: 8,000
Land (Assets)
Debit (Dr) $ $ Credit (Cr) $ $
Cash 15,000
ClosingBalance
15,000
Total: 15,000 Total: 15,000
Deferred Payment (Liability)
Debit (Dr) $ Credit (Cr) $
Land 5,000
ClosingBalance
5,000
Total: 5,000 Total: 5,000
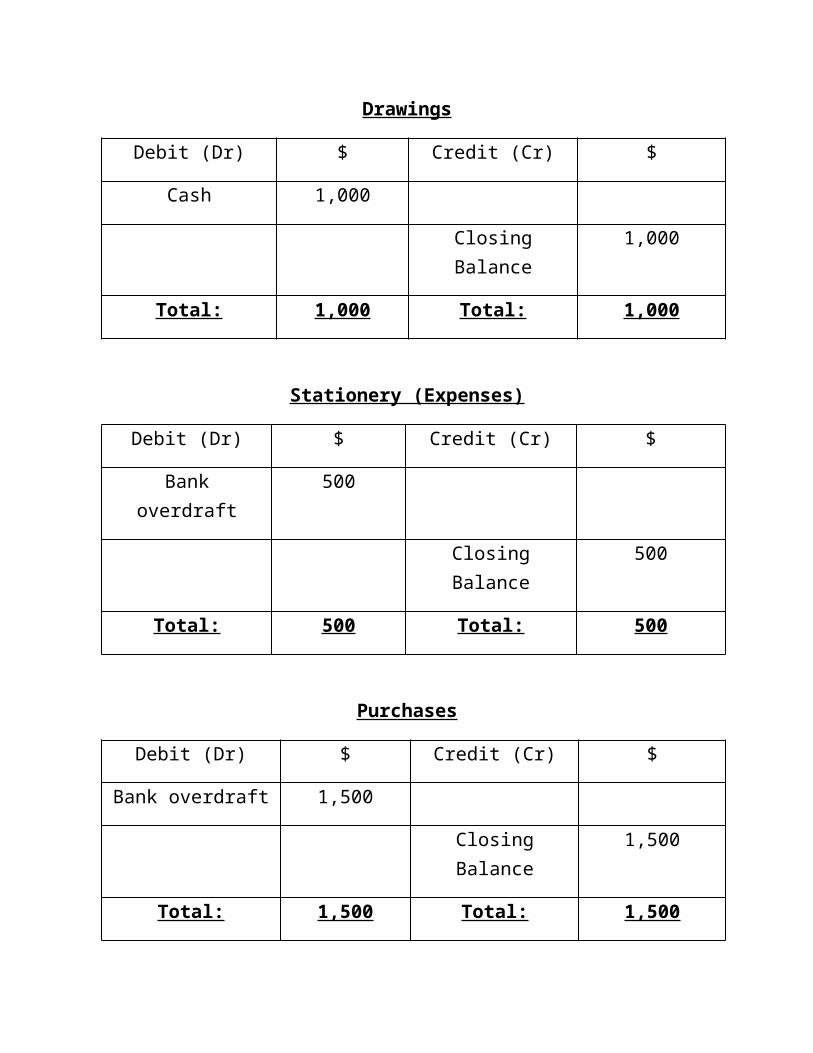
Drawings
Debit (Dr) $ Credit (Cr) $
Cash 1,000
ClosingBalance
1,000
Total: 1,000 Total: 1,000
Stationery (Expenses)
Debit (Dr) $ Credit (Cr) $
Bankoverdraft
500
ClosingBalance
500
Total: 500 Total: 500
Purchases
Debit (Dr) $ Credit (Cr) $
Bank overdraft 1,500
ClosingBalance
1,500
Total: 1,500 Total: 1,500

Bank Overdraft (Liability)
Debit (Dr) $ Credit (Cr) $
Purchases 1,500
Stationary 500
ClosingBalance
2,000
Total: 2,000 Total: 2,000
Income Statement
Statement of comprehensive Income for the periodended
$ $
Sales 12,000
Less: Expenses
Utility expenses
1,000
Marketing &Advertisement
2,000
Stationary 500 (3,500)

Net Profit 8,500
Balance Sheet
$ $
Assets:
Land 15,000
Cash 20,300
ReceivableAccounts
3,200
Stock 1,500
Total Assets 40,000
$ $
Reserves &Equity:
Net Profit 8,500
Capital 25,000

Drawings (1,000)
Total Reserves &Equity
32,500 32,500
Liabilities:
Bank Overdraft 2,000
Payable Accounts 500
Deferred Payment 5,000 7,500
TotalLiabilities:
40,000
L.O. 3.2
Doger, Billu & Ali, (DBA) are running a foodstuff wholesale shop. Three years ago the commenced the business with $85,000, $70,000 & $40,000, Doger, Billu & Ali respectively. In the Partnership, all agreed to receive 10% interest on capital and will pay 8% on drawings and also each will be entitled to receive salary $2,500, $3,000 and $1,200 respectively.
DBA company trial balance is given below.
Trial Balance $000 $000Vehicles at cost 69,000Equipment at 148,000

costAccumulated depreciation
Vehicles 19,200Equipment 25,600
Accrual for energy 4,000Prepayment for insurance 6,400Cash at bank 21,000Stock 66,000Trade creditors 20,800Trade debtors 83,600Capital accounts:
Doger 82,500Billu 70,000Ali 40,000
Current accounts:
Doger 40,600Billu 38,800Ali 25500
Sales 300,000Purchases 148,000Energy 16,000

Insurance 16,800Advertising 12,000Rent 32,000Vehicle expenses 36,000Stationery 3,200Telephone 9,000Total 667,000 667,000
Notes:
Closing Stock for the period end is $38,000.Depreciation on Equipment and vehicle will be charged at the rate of 10% and 6% respectively on cost.
Prepare income statement, appropriation account and balance sheet of ADB Company for the period ended 30 June 20Y4.
Income Statement
Statement of comprehensive Income for the periodended on 30 June 2014
$ $
Sales 300,000
Less: Cost ofGoods Sold:

(Opening Stock 66,000
+Purchases 148,000
-Closing Stock) (38,000) (176,000)
=Gross Profit 124,000
Less Expenses:
Energy 16,000
Insurance 16,800
Advertisement 12,000
Rent 32,000
Vehicle Expenses 36,000
Stationery 3,200
Telephone 9,000
Depreciation onequipment (10%)
14,800
Depreciation onVehicle (6%)
4,140 (143940)
Net Loss: (19940)
Profit and loss Appropriation Account
Debit (Dr) $ Credit (Cr) $

Net loss 19,940
Salaries: 6,700 Share on loss: 45890
Doger: (2,500) Doger:(19,667)
Billu: (3,000) Billu:(16,687)
Ali: (1,200) Ali: (9,536)
Interest onCapital:
19,250
Doger: (8,250)
Billu: (7,000)
Ali: (4,000)
Total: 45,890 Total: 45,890
Current Account (Doger)
Debit (Dr) $ Credit (Cr) $
Loss 19,667 OpeningBalance
40,600
Salary 2,500
ClosingBalance
31,683 Interest onCapital
8250
Total: 51,350 Total: 51,350

Current Account (Billu)
Debit (Dr) $ $ Credit (Cr) $ $
Loss 16,687 OpeningBalance
38,800
Salary 3,000
ClosingBalance
32,113 Interest onCapital
7,000
Total: 48,800 Total: 48,800
Current Account (Ali)
Debit (Dr) $ Credit (Cr) $
Loss 9,536 OpeningBalance
25,500
Salary 1,200
ClosingBalance
21,164 Interest onCapital
4,000
Total: 30,700 Total: 30,700
Capital Account (Doger)

Debit (Dr) $ Credit (Cr) $
OpeningBalance
82,500
ClosingBalance
82,500
Total: 82,500 82,500 Total: 82,500 82,500
Capital Account (Billu)
Debit (Dr) $ Credit (Cr) $
OpeningBalance
70,000
ClosingBalance
70,000
Total: 70,000 Total: 70,000
Capital Account (Ali)
Debit (Dr) $ Credit (Cr) $
OpeningBalance
40,000
ClosingBalance
40,000
Total: 40,000 Total: 40,000
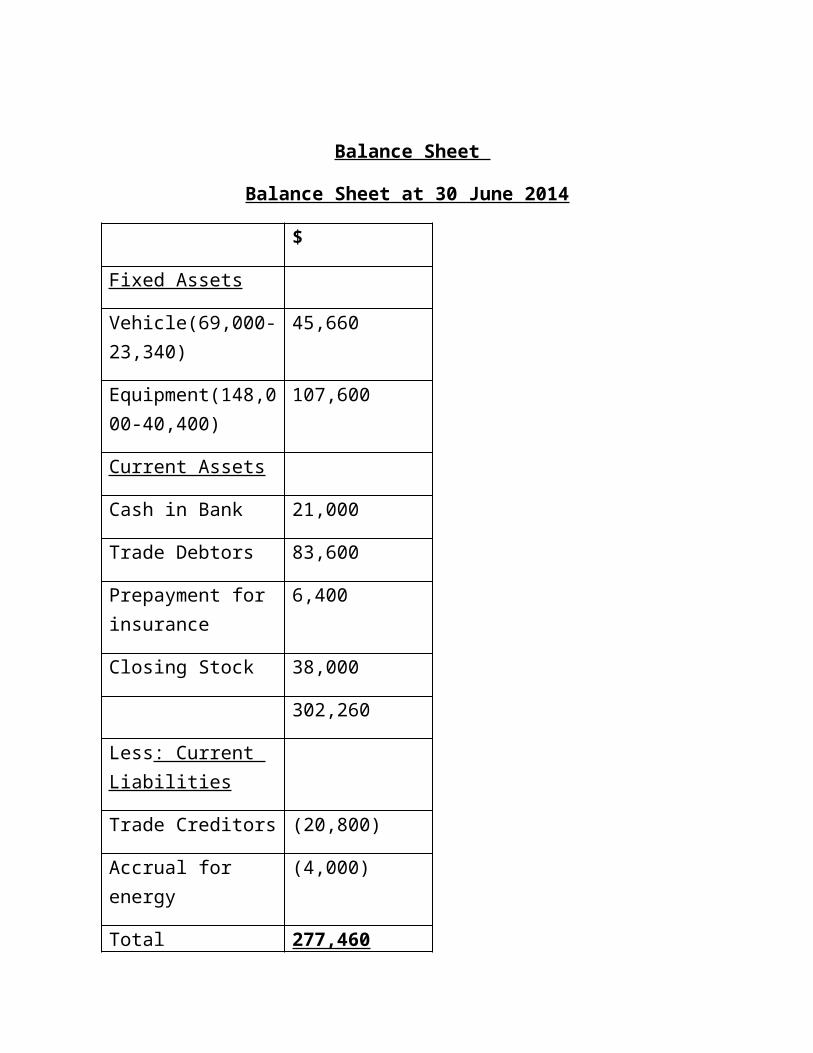
Balance Sheet
Balance Sheet at 30 June 2014
$
Fixed Assets
Vehicle(69,000-23,340)
45,660
Equipment(148,000-40,400)
107,600
Current Assets
Cash in Bank 21,000
Trade Debtors 83,600
Prepayment for insurance
6,400
Closing Stock 38,000
302,260
Less: Current Liabilities
Trade Creditors (20,800)
Accrual for energy
(4,000)
Total 277,460

Capital and Reserves:
Capital: 192,500
Doger(82,500)
Billu(70,000)
Ali(40,000)
Current A/c 84,960
Doger (31,683)
Billu(32,113)
Ali(21,164)
277,460
The following trial balance has been extracted from books of Keith LTD as the 30 June 2011
Dr. Cr.$000 $000
Advertisement 30Bank 7Creditors 69Debentures (10%) 70Debtors (all trade) 300Directors remuneration 55Electricity 28

Insurance 17Investments (quoted) 28Investment Income 4Machinery
At Cost 420Acc. Depreciation 152
Office Expenses 49Ord. Shares Capital 200Preference Shares 50Preference Shares Dividend 4Profit and Loss account (at 01-07-10) 132Provision for bad and doubtful debt 8Purchases 1240Rent and rates 75Sales 2100Stock (at 01-07-10) 134Vehicles:
At cost 80Accumulated Depreciation 40
Wages and Salaries 358Total 2825 2825
Information:
• Stock at 30th June 2011 valued at cost amounted to $155,000.
• Depreciation is to be provided on machinery and vehicles at a rate of 20% and 25% respectively on cost.
• Provision is to be made for auditor’s remuneration of $12,000.

• Insurance paid in advance at 30th June 2011 to $3,000.
• The provision for bad and doubtful debts is to be made equal to 5 % of outstanding trade debtors as at 30th June 2011.
• Corporation tax owing at 30th June 2011 is estimatedto be equal to be $60,000.
• An ordinary dividend of 10% per share is purposed on par value.
• The investment had a market value of $30,000 at 30th
June 2011.• The company has an authorized share capital of
600,000 ordinary shares of $0.50 each and of 50,000preference shares @ 8 per cent, for $1 each.
Prepare Company Income statement and balance sheet for the year ended 30th June 2011.
Income statement
Statement of Comprehensive Income statement for theyear ended 30th June 2011.
Particular $000 $000
Sales 2100
Cost of goods sold:
(Opening Stock 134
+Purchases 1240
-Closing Stock) (155) (1219)
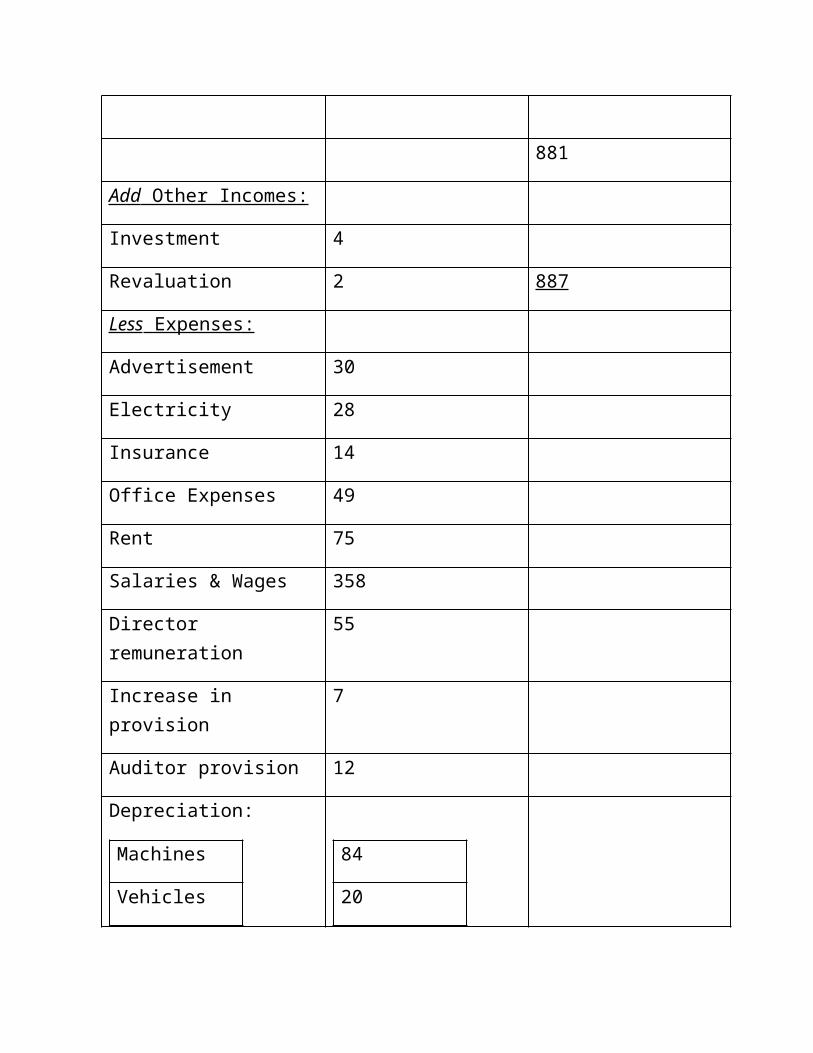
881
Add Other Incomes:
Investment 4
Revaluation 2 887
Less Expenses:
Advertisement 30
Electricity 28
Insurance 14
Office Expenses 49
Rent 75
Salaries & Wages 358
Director remuneration
55
Increase in provision
7
Auditor provision 12
Depreciation:
Machines
Vehicles
84
20

Interest on Debenture
7
Preference Dividend
4
Ordinary Dividend 20 (763)
Less: Taxes (60)
Net Profit for theyear ended 30th June 2012
64
P/L account 132
Retained earning 196
Balance Sheet
Balance Sheet at 30 June 2011
$000
Assets:
Machinery(420-152+84)
184
Vehicle(80-40+20)
20
Investment 30
Current

Assets:
Stock 155
Bank 7
Debtors 285
PrepaidInsurance
3
684
Equity &Reserves:
Capital 200
PreferenceShare
50
RetainedEarning
196
Liabilities:
Debentures 70
Creditor 69
Auditor 12
TaxCooperation
60
Dividend 20

Interest ondebenture
7
684
Task 4
Crescent Hyper-storeAll amounts
in $0002013 2012
AssetsNon-Current Assets
Intangible-Goodwill 4,027 2,336Tangibles 26,511 21,554
Current AssetsInventory 2,669 2,430Receivables 1,798 1,311Cash and Cash Equivalent 4,742 2,148
Total Assets 39,747 29,779
Equity and LiabilitiesShare Capital 395 393Reserves 12,600 11,422
Non-Current LiabilitiesLong Term Borrowings 14,170 8,602
Current LiabilitiesTrade Payables 8,522 7,277Short Term Borrowings 4,060 2,085

Total Equity and Liabilities 39,747 29,779
Income Statement2013 2012
Revenues 54,327 47,198Cost of Sales 50,109 43,968Gross Profit 4,218 3,230Commercial and Administrative Cost (1,012
)(780)
Operating profit before financing 3,206 2,450Finance Income 116 187Finance Cost (478) (250)(Loss)/Profit before Tax 2,844 2,387Income Tax Expense (780) (670)(Loss)/Profit after Tax 2,064 1,717Total Comprehensive Income for the year
2,064 1,717
You are working as an Assistant accountant, this morning you manager asked you to prepare a report to beread in the Board meeting of Crescent Hyper-store (CH).CH is situated in a porch area of Dubai, due to its infrastructure it is very famous all around the world. It shelves all kind of food, grocery; crockery, electronic and other daily need stuff. You are also known that in the meeting they are going to discuss a new project to open some shops far from the down-town so people how has trouble to come here due to traffic can save their time. The project would cost approximately $8.3million for 5 new shops.

You are required to calculate Profitability, liquidity,Efficiency and investment ratios and interpret the financial position and make conclusion based on your findings. And also include the limitations of your conclusion.
Answer: (L.O 4.1, 4.2)
Interpretation of both years 2012 and 2013 to know thecompany's performance i.e; if the business is performing well by comparing the past years and other companies, are the economic, political and social circumstances favourable for normal trade, the prospects of region in which the business is operating.
We can do this through 4 accounting ratios:
LIQUIDITY RATIOS
2013
Current assets ratios = Current assets/ current liabilities= (2669+1798+4742=9209)/(8522+4060 = 12582 )= 9209 = 0.7 12582 2012
Current assets ratios= Current assets/current liabilities =

(2430+1311+2148=5889)/(7277+2085=9362) =5889/9362 = 0.6
Current assets ratios of the company represents the ability of paying off its short term debts as we can see for both years the company is have very low ratio this is a very bad sign it tells you that the company will not have much liquid to pay back its liabilities.
Acid test / Quick ratio = current assets - closing stock Current liabilities Year 2013 = 9209 – 2669/12582= 0.5% Year 2012= 5889 – 2430/9362 = 0.3%
The company does not have enough short-term assets in both years to overcome its immediate liabilities, the firm is highly dependent on the sale of inventory as toovercome this problem.
PROFITABILITY RATIOS
Gross profit ratio = gross profit × 100 Revenue

Year 2013 = 4218 × 100 = 8% year2012 = 3230 × 100 = 7% 54327 47198
This represents the profit of the company in relation to the amount of sales that has made, there is an increase on 1% from 2012 to 2013, it also provides the company with the demand of its customers in %.
Net profit ratio = net profit × 100 Sales
Year 2013 = 2844 × 100 = 5.2% year 2012 = 2387 × 100 = 5% 54327 47198
This show the net income of the company and how the company control’s its cost. The low profit margin represents less safety if sales decline there will be increase in risk while reducing profit and turning intonet loss, there is a very less improvement in 2013 but still in order to stay at much safer side the net profit margin should be much better.
Return on capital employed = profit × 100 Capital
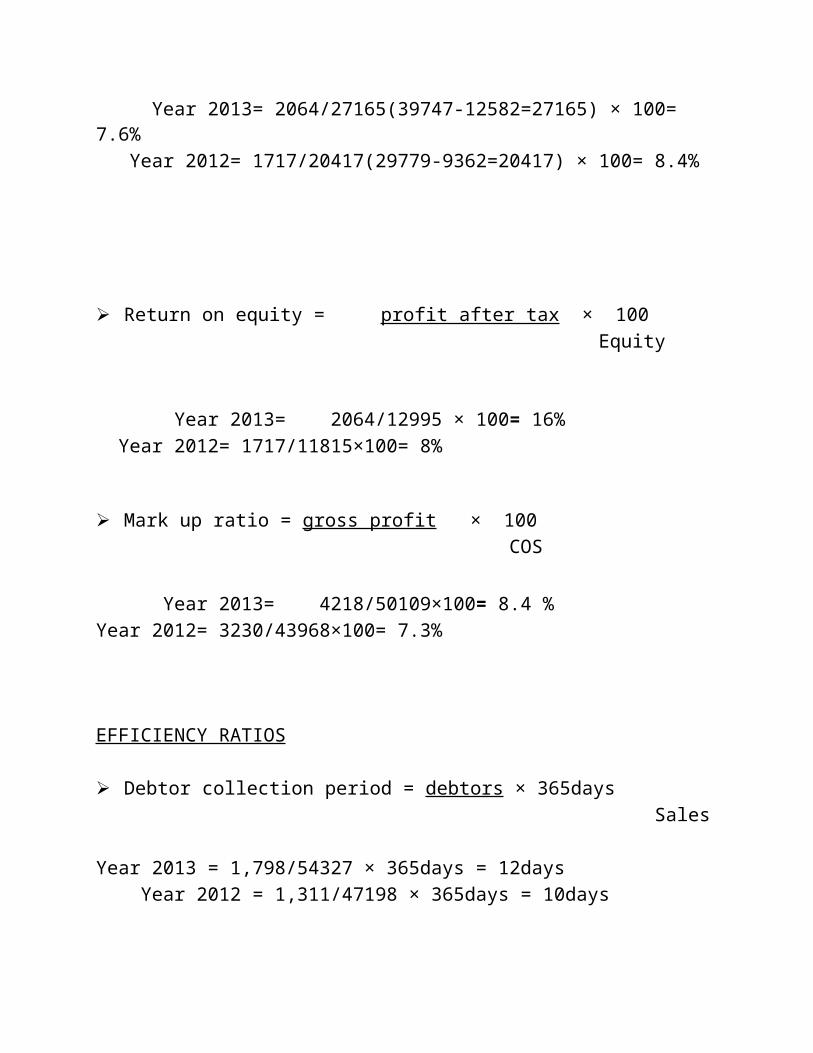
Year 2013= 2064/27165(39747-12582=27165) × 100= 7.6% Year 2012= 1717/20417(29779-9362=20417) × 100= 8.4%
Return on equity = profit after tax × 100 Equity Year 2013= 2064/12995 × 100= 16% Year 2012= 1717/11815×100= 8%
Mark up ratio = gross profit × 100 COS Year 2013= 4218/50109×100= 8.4 % Year 2012= 3230/43968×100= 7.3%
EFFICIENCY RATIOS
Debtor collection period = debtors × 365days Sales
Year 2013 = 1,798/54327 × 365days = 12days Year 2012 = 1,311/47198 × 365days = 10days

The debtor collection period represents the total time in which company will get back their receivables, in 2012 the time period was 10days which was a little efficient but there was not much difference in 2013. Ifthe funds have been received early then it can be used for other business activities such as investing in other projects or paying off business expenses etc. this will improve the business performance.
Creditor payment period = creditors × 365days COS
Year 2013 = 8522/50109× 365days = 62days Year 2012 = 7277/43968 × 365days = 60days
This let you the time taken to pay off your creditors, it also tell you bot the business efficiency and how the business is performing, the higher days company gets at one hand its good for the company but if it’s too long the firm might lose suppliers trust for early payments. Here in 2013 and 2012 do not have much differences but the result is positive as the company is not taking too long or too short time period to pay back its creditors.
Inventory turnover days = closing inventory × 365days
COS

Year 2013 = 2669 × 365days = 19days year 2012 = 2430 × 365days = 20days 50109 43968
Inventory turnover days show how effectively funds invested in inventory can turn into sales revenue. Low is not good for the business low turnover means stock can take too long to convert into sales and will be over stock, on the other hand high turnover can indicates ineffective buying or very high sales. Companies want High inventory turnover as to deduct theinventory to gain less holding cost and due to less holding cost the net income will have an increase.
Cash cycle days = debtors days - creditors days + inventory turnover days
Year 2013= 12-62+19 = (31) days year 2012 = 20-60+10= (30) days
This shows the time period of invested cash/resources returning, in other words calculating the liquidity risk with the growth. Here it is negative cash cycle days in both years by receiving the payments by debtorsbefore paying creditors.
INVESTMENT RATIOS
Dividend yield Dividend cover ratio

Earnings per share Price /Earnings ratio
(For this ratio calculation there is no required information provided)
Overall Conclusion for CHS
The company CHS is performing fine, but still have few problems with its liquidity, need to work on their cashflow, they are unable to manage their cash inflow and cash outflow, the company should pay its suppliers on time so that the business do not lose its market value in terms of paying off creditors. They should provide less debtor payable period as to get back their cash ontime or before time this will help the company to maintain its day to day expenses, invest in other activities and help to increase its net income.
LimitationsAccurate data is not available to evaluate all the ratios and get a right conclusion about problems and solutions to them, due to lack of data the company’s overall working position is unpredictable.The information was just for 2 years and there was not data about its competitors, its markets in which it operates, the economical and political position of the market due to lack of this all information, the overallinterpretation is incomplete.