
McKinsey on Finance
24
McKinsey on Finance Restating the value of capital light 1 Investors are hearing that strategies to boost capital efficiency are financial gimmickry that creates no value. That perception is wrong. Measuring alliance performance 6 Large companies often have dozens of alliances—and little idea how they are performing. Here’s how to evaluate them. The real cost of equity 11 The inflation-adjusted cost of equity has been remarkably stable for 40 years, implying a current equity risk premium of 3.5 to 4 percent. The CFO guide to better pricing 16 Cutting costs might get more attention, but improving pricing discipline can add more to the bottom line. Here’s how CFOs can lead the way. Perspectives on Corporate Finance and Strategy Number 5, Autumn 2002
-
Upload
khangminh22 -
Category
Documents
-
view
0 -
download
0
Transcript of McKinsey on Finance

McKinsey on Finance
Restating the value of capital light 1Investors are hearing that strategies to boost capital efficiency are financial gimmickry that creates no value. That perception is wrong.
Measuring alliance performance 6 Large companies often have dozens of alliances—and little idea how they are performing. Here’s how to evaluate them.
The real cost of equity 11The inflation-adjusted cost of equity has been remarkably stable for 40 years, implying a current equity risk premium of 3.5 to 4 percent.
The CFO guide to better pricing 16Cutting costs might get more attention, but improving pricing discipline can add more to the bottom line. Here’s how CFOs can lead the way.
Perspectives on Corporate Finance and Strategy
Number 5, Autumn 2002

McKinsey & Company is an international management consulting firm serving corporate and governmentinstitutions from 85 offices in 44 countries.
Editorial Board: Marc Goedhart, Bill Javetski, Timothy Koller, Michelle Soudier, Dennis SwinfordEditorial Contact: [email protected]
Editor: Dennis Swinford Managing Editor: Michelle Soudier
External Relations: Joan HorrvichEditorial Consultant: Janet BushDesign and Layout: Kim Bartko
Copyright © 2002 McKinsey & Company. All rights reserved.
Cover images, left to right: ©Rob Colvin/Artville; © Garrian Manning/Artville; © Stephanie Carter/Artville;© Todd Davidson/The Image Bank, © Jack Star/PhotoLink.
This publication is not intended to be used as the basis for trading in the shares of any company orundertaking any other complex or significant financial transaction without consulting with appropriateprofessional advisers.
No part of this publication may be copied or redistributed in any form without the prior written consent ofMcKinsey & Company.
McKinsey on Finance is a quarterly publication written by experts and practitioners in McKinsey & Company’sCorporate Finance & Strategy Practice. It offers readers insights into value-creating strategies and thetranslation of those strategies into stock market performance. This and archive issues of McKinsey onFinance are available on line at http://www.corporatefinance.mckinsey.com

To hear the media expound on thesubject, the main source of trouble for
many companies of late has been their so-called asset-light business model. Surprised bythe rapid unravelling of the recent economicboom, pundits have taken the axe to anystrategy developed by the 1990s whiz kidswhom they once lauded and now apparentlydisdain.
In the case of capital-light—or capital-efficient—models, their critique may be toohasty. It is certainly too sweeping. Acting inthe best interests of investors includesstructuring and restructuring the balance sheetto squeeze all possible earnings from everydollar of investor capital—and it always has.Focusing the investment of capital on thoseassets where a company’s expertise lets it earnthe best return for investors is simply to becapital efficient. While this strategy carries itsown risks and limitations, as does anyinnovative business approach, for manycompanies it also creates real value and maybe the only alternative to stagnation.
We researched more than a dozen top-performing companies from a wide variety ofasset-intensive industries1 to see how they raiseand deploy capital for growth in capital-constrained conditions. We found that manyof these purposefully reshape their assetportfolio to support their growth aspirations,
refinancing assets as their role in thecompany’s business changes.
Tried-and-true strategies
Companies that look to their balance sheetsfor the capital to pursue growth and improvereturns are using strategies that are neitherparticularly new nor surprising.
First, the companies we analyzed focuscarefully on the parts of each business wherethey create the most value, divesting noncorerisks, assets, and cash flows to others that canbetter manage them. The capital so generatedcan then be reinvested back into the corebusiness and grown organically or throughacquisitions.
Consider as illustration the familiar projectfinance case of Tampa Bay Water Authority.Instead of undertaking the risk of constructinga new water treatment facility, Tampa Bayawarded a turnkey construction contract to abest-in-class construction company. Inaddition, instead of managing and operatingthe facility, the authority awarded a 30-year,$600 million performance-based contract towater systems operator Poseidon. As a result,the cities of Tampa Bay and St. Petersburgwere able to develop their new watertreatment facility without levying new taxesand actually lowered the cost of water,
Restating the value of capital lightInvestors are hearing that strategies to boost capital efficiency are financial gimmickry that creates no value. That perception is wrong.
Jiri Maly and Robert N. Palter
Restating the value of capital light | 1

2 | McKinsey on Finance Autumn 2002
returning nearly $300 million to consumersover the life of the agreement.
Second, we found that capital-efficientcompanies adopt tax-advantaged corporateforms like limited partnerships and sale lease-backs to capture cost-of-capital savings and tomatch investors with tailored risk/returnoffers. Such tools for transferring risks, assets,and cash flows are much more efficient thantraditional leasing contracts and limit theamount of value lost either to taxation or tofinancial intermediaries.
Finally, they employ tools like contingentcapital or hybrid securities to match the form of financing to the specific economiccharacteristics of the business. Full disclosureof residual liabilities, of course, is critical toprotect the interests of all investors.
We also found that although capital-efficientbusiness models do utilize sophisticatedfinancing tools, they are not a form offinancial engineering. Unlike financialengineering, capital efficiency creates realvalue through improved operations, increasing
margins by linking strategy with the optimalasset/risk position, supporting that positionwith the most efficient capital structure, andusing liberated capital to build the corebusiness. This can be done—and is routinelydone by many successful companies—transparently and in the best interest ofinvestors.
Case example: Rogers Sugar
In 1997, Canadian buyout firm Onex and aprivate investor jointly acquired BC Sugar forCdn$407 million. With more than 60 percentmarket share, BC Sugar was the country’slargest refiner of sugar in a protected industrywith steady and predictable economic charac-teristics and a good operating track record.
The new owners quickly made a number ofmanagement and board changes, followed bya $40 million capital investment into onebusiness unit, Rogers Sugar, to expand itscapacity and reduce operating costs. Onexthen effectively divested itself of Rogers Sugar by transferring it to Rogers SugarIncome Fund (RSIF), a special-purpose
• RSIF is an open-ended, limited-purpose trust owning 100% of common sharesand $278.3 million in subordinated notes of Rogers Sugar
• RSIF’s IPO was accomplished through sale of unsubordinated debentures, allof which have since been redeemed for trust units
• IPO net proceeds of $382 million used to purchase 41.5 million commonshares and $278.3 million in notes of Rogers Sugar, effectively acquiringownership of Rogers Sugar
• Lantic Capital retains ownership of Class C shares of Rogers Sugar, allowing itto elect 3 of 5 directors of the company
• Onex/Balaclava, through ownership in Lantic, has an indirect interest in RogersSugar through management services contract
• Under terms of the agreement, Lantic is responsible for management of thefund for a fee of $300,000 per year
• In 2000, $32 million was distributed to unit holders on sales of $180 million
Onex/Balaclava
Common Shares (100%)
CommonShares(100%)
Notes(100%)Class C
shares (100%)
Trust units
Governance andadministrativeagreements
Governancemanagement andoutsourcing agreements
Unit holders
Rogers Sugar Income fund
Rogers Sugar Limited
Lantic Sugar Limited/Lantic Capital Inc.
Exhibit 1. Ownership structure of Rogers Sugar Income Fund
Source: Annual reports, press releases
Restating the value of capital light | 3
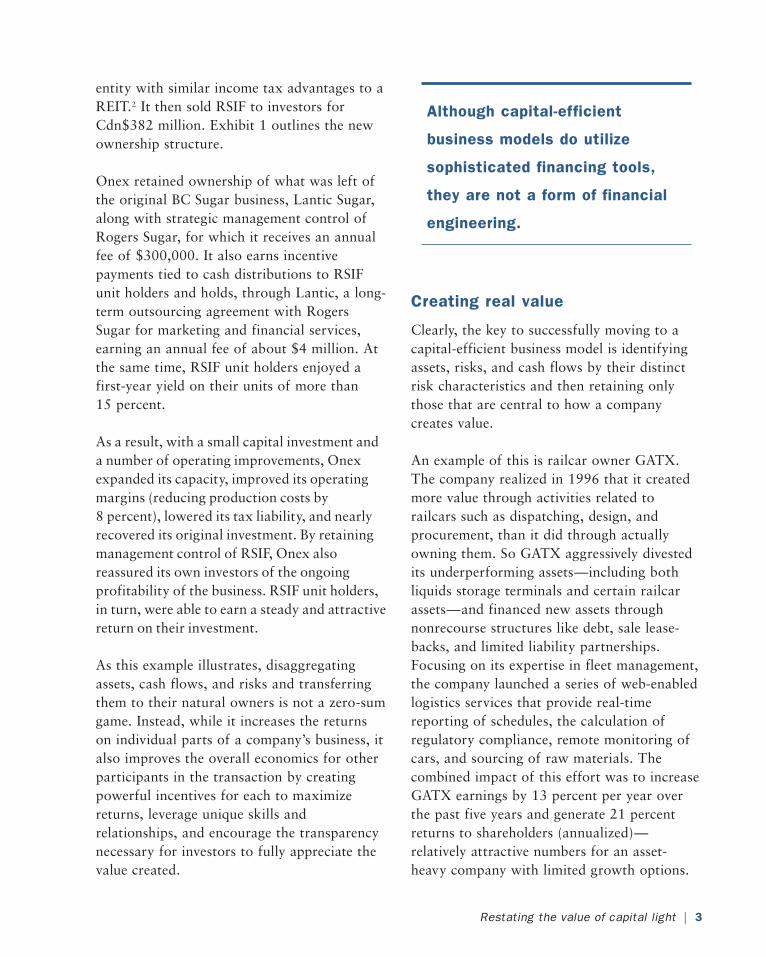
entity with similar income tax advantages to aREIT.2 It then sold RSIF to investors forCdn$382 million. Exhibit 1 outlines the newownership structure.
Onex retained ownership of what was left ofthe original BC Sugar business, Lantic Sugar,along with strategic management control ofRogers Sugar, for which it receives an annualfee of $300,000. It also earns incentivepayments tied to cash distributions to RSIFunit holders and holds, through Lantic, a long-term outsourcing agreement with RogersSugar for marketing and financial services,earning an annual fee of about $4 million. Atthe same time, RSIF unit holders enjoyed afirst-year yield on their units of more than15 percent.
As a result, with a small capital investment anda number of operating improvements, Onexexpanded its capacity, improved its operatingmargins (reducing production costs by8 percent), lowered its tax liability, and nearlyrecovered its original investment. By retainingmanagement control of RSIF, Onex alsoreassured its own investors of the ongoingprofitability of the business. RSIF unit holders,in turn, were able to earn a steady and attractivereturn on their investment.
As this example illustrates, disaggregatingassets, cash flows, and risks and transferringthem to their natural owners is not a zero-sumgame. Instead, while it increases the returnson individual parts of a company’s business, italso improves the overall economics for otherparticipants in the transaction by creatingpowerful incentives for each to maximizereturns, leverage unique skills andrelationships, and encourage the transparencynecessary for investors to fully appreciate thevalue created.
Creating real value
Clearly, the key to successfully moving to acapital-efficient business model is identifyingassets, risks, and cash flows by their distinctrisk characteristics and then retaining onlythose that are central to how a companycreates value.
An example of this is railcar owner GATX.The company realized in 1996 that it createdmore value through activities related torailcars such as dispatching, design, andprocurement, than it did through actuallyowning them. So GATX aggressively divestedits underperforming assets—including bothliquids storage terminals and certain railcarassets—and financed new assets throughnonrecourse structures like debt, sale lease-backs, and limited liability partnerships.Focusing on its expertise in fleet management,the company launched a series of web-enabledlogistics services that provide real-timereporting of schedules, the calculation ofregulatory compliance, remote monitoring ofcars, and sourcing of raw materials. Thecombined impact of this effort was to increaseGATX earnings by 13 percent per year overthe past five years and generate 21 percentreturns to shareholders (annualized)—relatively attractive numbers for an asset-heavy company with limited growth options.
Although capital-efficient
business models do utilize
sophisticated financing tools,
they are not a form of financial
engineering.

Like GATX, companies that disaggregateassets, risks, and cash flows can create value ina number of ways:
Improving operating margins. When acompany narrows the number of assets andrisks in its portfolio to the handful where itreally creates value, its management team isable to focus its energies and develop deepinsight into and expertise in managing corerisks. As a result, the team can extract morevalue from those risks and the economic gaincreated is significantly greater. For instance,after transferring the ownership of its physicalproperties to private investors, Four SeasonsManagement has been able to focus on thecritical value drivers for the business,including yield management and the quality of the customer experience. Clearly, Four Seasons also faces certain limitations. Fifty-year contracts with facilities owners restrict its ability to reshape its portfolio ofproperties over a short period of time. But this may be easily outweighed by the fact that the company, undistracted by many ofthe ownership issues and problems oftraditional hotel chains, is able to earn
$100 more per room than its closestcompetitor (Exhibit 2).
Capturing tax advantages. Most countrieshave tax-advantaged corporate forms likeincome trusts or limited liability partnershipsthat enable companies to transfer risk to itsnatural owners. These corporate formstypically allow companies to remunerateinvestors and finance capital investments usingbefore-tax revenues, ultimately lowering acompany’s taxable income and increasing thepool from which investments are made andinvestors paid. For example, Marriottrestructured its business portfolio in 1993 bytransferring its properties into a REIT, puttingphysical property into a trust while retainingthe hotel management and operations services.The announcement resulted in a 20 percentappreciation of Marriott’s share price.
Reducing cost of capital. When companiestransfer risks to more natural owners, their cashflows can become significantly less volatile.Less volatility combined with an optimalcapital structure can reduce the cost offinancing highly capital-intensive assets. For
4 | McKinsey on Finance Autumn 2002
19901990
Hotelmanagement
100%
100%90%80%70%60%50%40%30%20%10%
0%1990 1992 1994 1996 1998 2000 2002 1997
212
Four Seasons US CORE Hotels
Ritz Carlton
146
223
154
287
170
260
187
1998 1999 2000
Hotelownership
1995 2000 2001
17.3 51.8 103.1 95.3
5978
91
41 22 9
100
Exhibit 2. Four Seasons focus on management earns superior returns
Source: McKinsey analysis
Four Seasons relinquished ownership for greater control . . .
Earnings before operating itemsCdn$ Millions
. . . increasing its share price . . .
Share priceCdn$
. . . and producing superior hotel operating results
Revenues per available room: Four Seasons vs.Ritz-Carlton

Restating the value of capital light | 5
example, overall investment risk associatedwith power plant development has beensignificantly reduced by securing long-term fuelcontracts and power purchase agreements.Using this approach, power plant developerCalpine used forward contracting of itsproduction to reduce market volatility and hasbeen able to raise a $1 billion revolving creditfacility at rates comparable to its balance sheetdebt in order to finance additional powerprojects. Typical project financing costs are 200to 350 basis points above balance sheet debt.
Realizing fuller asset valuations. Credit andequity analysts have long argued thatconglomerates are discounted by 20 to30 percent relative to net asset value becauseinvestors are unable to truly identify thesources of value creation and because investorscan assemble a more diversified and efficientportfolio at a lower cost than the managementteam of a conglomerate can. The reverse is alsotrue. Disaggregating assets and risks intounique packages increases visibility into thetrue sources of value and risk and allowscompanies to enjoy a fuller equity valuation.
Today, capital constraints and inadequatemanagement resources limit the growth ofmany companies. Capital that is liberated fromthe balance sheet can be used to pursue newopportunities without repeatedly turning tothe capital markets for funds. This not onlyenhances the company’s credibility withinvestors but also allows the company toreduce transaction costs and to move morequickly to capture opportunities. Reducing thecomplexity and scope of the business alsofrees up management resources to look fornew opportunities that might not be pursuedunder a more traditional managementapproach.
Companies must often adopt a new mind-setto make capital efficiency a key part of theirbusiness model. Capital-efficient companiestypically involve a narrower portfolio of assetsand risks that is better aligned with theirdistinctive capabilities, value creationapproach, and strategy. They tend to shapecarefully the role that they play relative to theassets that they choose to hold and focus theirfunctional capabilities on narrowly-definedrisks where they excel at value creation. Thattypically means owning (raising capital andshaping portfolios of investments), managing(deploying assets optimally into themarketplace), or operating physical assets—not all three, as is the case in most verticallyintegrated companies.
This model naturally involves somecomplications, chief among them the need tomanage multiple partnerships with the naturalowners to which assets and risks have beentransferred. That often includes ongoingnegotiations and the uncertainty around whatto do when a contract or partnership expires.But, when the strategy is pursued intelligentlyand competently, the advantages of strongermargins, enhanced brand equity, andprivileged access to low cost capital faroutweigh such difficulties.
Jiri Maly ([email protected]) is an associate
principal and Rob Palter (Robert_Palter@McKinsey
.com) is a principal in McKinsey’s Toronto office.
Copyright © 2002 McKinsey & Company. All rights
reserved.
1 Including electricity, transportation, oil and gas, real estate,
hospitality, infrastructure, utility, and packaged goods.
2 Real Estate Investment Trust
MoF

As corporations have evolved fromcommand-and-control structures with
sharply defined boundaries into loosely-knitorganizations, corporate alliances1 havebecome central to many business models.Most large companies now have at least30 alliances, and many have more than 100.
Yet despite the ubiquity of alliances—and theconsiderable assets and revenues they ofteninvolve—very few companies systematicallytrack their performance, creating a substantialrisk of negative surprises. We believe thatevery corporate manager, including CFOs,should be well tuned into the performance oftheir alliances. In our work with more than500 companies around the world, we havefound that fewer than one in four allianceshave adequate performance metrics in place.2
As a result, alliances tend to be run byintuition and with incomplete information.Partners may not agree about the progress oftheir ventures and senior management can’tintervene quickly enough to correct problems.In many companies, 30 to 60 percent ofalliances are underperforming—and three tofive major deals are in desperate need ofrestructuring. Unfortunately, managementdoes not really know where the problems lieor how it should best invest its time. To get abetter grip on performance, companies mustdevelop a more structured approach toevaluating the health of their alliances. Doingso is not a straightforward task.
The challengeWhy is alliance performance so hard tomeasure? The answer can be traced to threecharacteristics. First, alliances are bydefinition arrangements between separatecompanies, each employing its own reportingprocesses and systems and each pursuing itsown goals for the alliance. This makes it hardto agree on a single measure of performanceand creates incentives to conceal benefits andinflate costs.
A second critical characteristic is anoperational interdependence that makesbenefits and costs difficult to track. Mostalliances receive some inputs from their parentcompanies (including raw materials, customerdata, and administrative services) and in turnprovide outputs to them, creating complicatedtransfer-pricing issues. Before Airbus Industriewas revamped in 2001, for instance, the fourconsortium members made aircraft sectionsand “sold” them to the joint venture, whichthen assembled and marketed the airplanes.Setting transfer prices was a challenge becauseof the partners’ sensitivity to sharing detailedcost data. In another case, two globaltechnology companies agreed to jointly marketa new product. This alliance involved morethan 30 working teams whose 300-oddmembers spent between 20 percent and60 percent of their time on the alliance. Oneexecutive admitted that he had no real ideahow much the company had spent on the
Measuring alliance performanceLarge companies often have dozens of alliances—and little idea how they are performing. Here’s how to evaluate them.
Jim Bamford and David Ernst
6 | McKinsey on Finance Autumn 2002

Measuring alliance per formance | 7
venture, so large were its hidden costs.Measuring benefits is no easier. Alliancesoften generate sales of related products forparent companies, which should also be takeninto account in assessing performance andvalue. So should longer term benefits likeopportunities for learning, access to newtechnologies and markets, and improvedcompetitive positioning.
The third characteristic is the noncore positionof alliances within the corporate portfolio.Because they are inside the corporation, nottotally outside, they often do not receive thesame level of management scrutiny as businessunits and internal initiatives; nor are theysubject to the same level of market forces asstandard customer or supplier relationships.
Measuring performance
To overcome these difficulties, companiesmust assess the performance of their alliances
on three levels, each focusing on differentaspects of the problem and prompting distinctmanagerial responses.
At the first level, every alliance should beindividually assessed to establish how it isperforming and whether the parent companyneeds to intervene. At the second level, acompany should periodically search forperformance patterns across the portfolio—aprocess that often leads to adjustments in thetypes of deals a company pursues andsometimes to additional investments in a driveto build alliance-related skills. At the thirdlevel, once a company better understands howits portfolio is performing, it can conduct atop-down review of overall strategy to ensurenot only that its alliance portfolio is config-ured for optimal performance, but also that ithas ranked new opportunities in a clear orderof priority. The following excerpt focuses onthe performance of individual alliances.3
Developing a detailed view of the economicsof an alliance is indispensable to measuring itsperformance. This measurement should gowell beyond the usual cash flow metrics toinclude transfer-pricing benefits, benefitsoutside the scope of the deal (for instance,sales of related products), the value of optionscreated by the alliance, as well as start-up andongoing management costs (Exhibit 1). Thisinformation is vital for managers to evaluatedeals up front and to monitor their continuingperformance.
For example, one company in the powerindustry calculated the embedded option valueof a potential alliance to commercialize acritical new technology, evaluating the odds ofdifferent possible outcomes and the associatedpayoffs for each. Its calculation showed thatfor the given alliance the firm had a
Cash flow from earningsof joint venture1
Other cash f lowsto parent
Total value of cash flows
Contribution fromparent company2
Direct value creationfrom joint venture
1Includes terminal value2Includes management costs
Value of additionalstrategy options created
Total value created
Transfer pricing, royalties, and fees
Net present value to parent company (disguised example) $ million
80
30
30
140
80
60
30
90
Exhibit 1. Get to know your alliance
Source: McKinsey analysis

10 percent chance of creating $1 billion inannual income within three years, a 20percent chance of creating a modestlysuccessful business producing $10 million to$30 million in annual income, a 60 percentchance of losing $10 million to $30 million,and a 10 percent chance of losing more than$200 million. This profile of potential optionvalue was extremely sensitive to assumptionsregarding technology and construction costs,leading the company to closely monitor thealliance’s early performance, while reservingthe right to cut off funding in the event thattechnical progress slowed.
Likewise, one biotechnology companydeveloped explicit values for the potentiallearning benefits from a planned developmentand marketing alliance with a largepharmaceutical company. This exerciseprovided the information that ultimatelypushed the firm to choose one partner overanother and led it to closely monitor thebenefits of the alliance, eventually allowingthe firm to “migrate” into new capabilities.
Having formed an alliance with a clear andintegrated view of the economics in mind, acompany must develop, within 30 days of thelaunch, a scorecard to track the venture’sperformance. Partners must decide whether toshare a single scorecard, to run separatescorecards, or to use a combination of thetwo. For a joint venture with its own P&L, asingle scorecard is often possible. For mostother alliances, the combination approachworks best. Each partner can supplement ashared scorecard with additional metrics thattrack progress against goals that aren’t sharedby the other partners. This approach alsoenables each partner to devise internal metricsthat allow it to compare the performance ofan alliance with the performance of business
activities outside the alliance or to other,similar alliances.
It is essential, both at the alliance and theparent level, to take a balanced view ofperformance. To achieve such a balance, wehave found it useful to include fourdimensions of performance fitness: financial,strategic, operational, and relationship.Financial and strategic metrics show how thealliance is performing and whether it ismeeting its goals—but may not provideenough insight into exactly what, if anything,isn’t going well. Operational and relationshipmetrics can help uncover the first signs oftrouble and reveal the causes of problems.Together, the four dimensions of performancecreate an integrated picture that has provedinvaluable to the relatively few companies,such as Siebel Systems, that have used them tomeasure the health of alliances (Exhibit 2).
1. Financial fitness: Metrics such as salesrevenues, cash flow, net income, return oninvestment, and the expected net present valueof an alliance measure its financial fitness.Most alliances should also monitor progress inreducing overlapping costs, achievingpurchasing discounts, or increasing revenues.In addition, financial fitness can includepartner-specific metrics such as transfer-pricing revenues and sales of related productsby the parent companies. At one internationaloil industry joint venture, the partners trackednot only revenues and consolidation synergieson a quarterly basis, but also the costs ofgoods sold to and from the parents, as well asestimates of profitability on those parent-related transactions.
2. Strategic fitness: Nonfinancial metrics suchas market share, new-product launches, andcustomer loyalty can help executives measure
8 | McKinsey on Finance Autumn 2002

Measuring alliance per formance | 9
the strategic fitness of a deal; other metricscould, for example, track the competitivepositioning and access to new customers ortechnologies resulting from it. Devisingstrategic metrics can take imagination. Theinternational semiconductor researchconsortium SEMATECH, for instance, tracksthe number of employees from membercompanies who are working on its researchinitiatives in order to assess whether it istransferring knowledge to its partners.
3. Operational fitness: The number ofcustomers visited and staff members recruited, the quality of products andmanufacturing throughput are examples ofoperational fitness metrics that call for explicitgoals linked to the performance reviews andcompensation of individuals. For example,executives at one health care company defineoperationally-fit alliances as those hitting60 to 80 percent of their key operatingmilestones. Any figure higher than 80 percent
Financial fitness Strategic fitness
Operational fitness Relationship fitness
Revenues
Goal Performance
Overall alliance revenue index 100 110• Partner-led revenues 40 45• Siebel-led revenues 50 50• Joint revenues 10 15
• Revenues from new business 20 18
Note: revenue goals vary across par tner categories
Customer satisfaction
Customer loyalty index 9.5 out of 10Performance dimension Positive responses
• Satisfaction with product performance 94%• Satisfaction with integration of 3rd-party systems 93%• Satisfaction with implementation effectiveness 97%
Note: based on biannual ~ 100-question customer survey that contains~ 5 alliance questions
Management by objectives
Goal Performance
• Marketing investment 50% 65%(percent of annual goal)
• Number of partner’s staff trained 42% 55%• Number of joint sales calls 25% 21%• Number of marketing events to 10% 12%
generate demand• Number of weekly pipeline calls 5% 7%
Note: based on quar terly plan developed jointly by Siebel and par tner;includes financial objectives, such as key revenue metrics shown above in“financial fitness”
1 Siebel uses this information to calculate gap score (importance of dimension to partner � Siebel performance � gap score); gaps of 2.0 or higher require action planby alliance manager; performance in applying this plan is monitored by Siebel and senior executives of partner’s company.
Source: Siebel Systems; McKinsey analysis
Partner satisfaction
Partner allegiance index 8.5 out of 10• Overall partner satisfaction High• Change in partner investment Dramatic increase• Likelihood to continue High
Performance dimension Score (0–10)1
• Alliance management 8.1• Sales engagement 8.6• Alliance marketing 6.7• Product marketing 9.0• Integration, validation 9.7• Training 7.4• Global services 9.6
Note: based on quar terly >80 -question par tner-satisfaction survey
Exhibit 2. Siebel Systems’ alliance scorecard

indicates that the goals weren’t sufficientlyambitious.
4. Relationship fitness: Questions about thecultural fit and trust between partners, thespeed and clarity of their decision making, theeffectiveness of their interventions whenproblems arise, and the adequacy with whichthey define and deliver their contributions allfall under the heading of relationship fitness.To measure it, Siebel Systems developed asophisticated partner-satisfaction survey, senteach quarter to key managers of alliancepartners, that contains more than 80 questionsabout issues such as alliance management andpartners’ loyalty to Siebel. The company usesthis information to spot problems and todevelop detailed action plans to address them.
The weight placed on each type of metric andthe amount of detail it includes depend on thesize and aims of the alliance. A consolidationjoint venture whose main goal is to reducecosts, for instance, should focus heavily onfinancial and operational metrics. Butmanagers of an alliance entering a new marketexpect negative financial returns in the earlystages and should give more weight tostrategic goals such as increasing market shareand penetrating distribution channels. Smaller,short-term alliances might have simplescorecards with only four or five metrics;larger ventures with substantial assets orrevenues deserve something more detailed.
Scorecard results provide important clues towhat might be going wrong with an alliance,but uncovering the true problem often requiresfurther investigation. For example, a largemedia company found that the hundreds ofmillions of dollars it had invested in allianceswere at risk when close scrutiny revealed thatfive of its ten most important deals were losing
10 | McKinsey on Finance Autumn 2002
money. In addition, two joint ventures with aninternational media company were found tohave been troubled by flawed deal structuresfrom the start. Further probing found thatthree unprofitable alliances could berenegotiated, saving $23 million a year, andthat redefining each joint venture partner’scontributions and responsibilities could saveanother $45 million a year. Subsequently, thecompany established a corporate-level allianceunit to keep a critical eye on all of its ventures.
At a time when alliances are increasinglyimportant, continuing to ignore theirperformance is simply not an option. Instead,managers should systematically measure theperformance of each individual alliance toensure that the maximum value is derived andmanagement is able to intervene when a dealveers off track. Experience has proved that theeffort pays substantial dividends.
Jim Bamford ([email protected]) is a
consultant and David Ernst (David_Ernst@McKinsey
.com) is a principal in McKinsey’s Washington, D.C.
office. Copyright © 2002, McKinsey & Company. All
rights reserved.
The authors would like to thank David Dorton, Tammy
Halevy, C. Brent Hastie, and Eric A. Kutcher for their
contribution to this article.
1 We define alliances as a broad range of collaborativearrangements involving shared objectives; shared risk,reward, or both; and a significant degree of coordination orintegration. Alliances involve more shared decision-makingthan do arm’s-length contracts and lack the full control andintegration of mergers and acquisitions.
2 One study found that 51 percent of the alliances reviewedhad essentially no performance metrics at all and that only11 percent had sufficient metrics. See Jeffrey H. Dyer,Prashant Kale, and Harbir Singh, “How to make strategicalliances work,” Sloan Management Review, Summer 2001,Volume 42, Number 4.
3 For the complete discussion of alliance portfolio andstrategic alliance performance, see “Managing an allianceportfolio.” The McKinsey Quarterly, 2002, No. 3.
MoF

The real cost of equity | 11
As central as it is to every decision atthe heart of corporate finance, there has
never been a consensus on how to estimate thecost of equity and the equity risk premium.1
Conflicting approaches to calculating risk haveled to varying estimates of the equity riskpremium from 0 percent to 8 percent—although most practitioners use a narrowerrange of 3.5 percent to 6 percent. Withexpected returns from long-term governmentbonds currently about 5 percent in the US andUK capital markets, the narrower rangeimplies a cost of equity for the typicalcompany of between 8.5 and 11.0 percent.This can change the estimated value of acompany by more than 40 percent and haveprofound implications for financial decisionmaking.
Discussions about the cost of equity are oftenintertwined with debates about where thestock market is heading and whether it is over-or undervalued. For example, the run-up instock prices in the late 1990s prompted twocontradictory points of view. On the onehand, as prices soared ever higher, someinvestors expected a new era of higher equityreturns driven by increased future productivityand economic growth. On the other hand,some analysts and academics suggested thatthe rising stock prices meant that the riskpremium was declining. Pushed to theextreme, a few analysts even argued that the
premium would fall to zero, that the DowJones industrial average would reach 36,000and that stocks would earn the same returnsas government bonds. While these views wereat the extreme end of the spectrum, it is stilleasy to get seduced by complex logic and data.
We examined many published analyses anddeveloped a relatively simple methodology thatis both stable over time and overcomes theshortcomings of other models. We estimatethat the real, inflation-adjusted cost of equityhas been remarkably stable at about 7 percentin the US and 6 percent in the UK since the1960s. Given current, real long-term bondyields of 3 percent in the US and 2.5 percentin the UK, the implied equity risk premium isaround 3.5 percent to 4 percent for bothmarkets.
The debate
There are two broad approaches to estimatingthe cost of equity and market risk premium.The first is historical, based on what equityinvestors have earned in the past. The secondis forward-looking, based on projectionsimplied by current stock prices relative toearnings, cash flows, and expected futuregrowth.
The latter is conceptually preferable. After all,the cost of equity should reflect the returnexpected (required) by investors. But forward-
The real cost of equityThe inflation-adjusted cost of equity has been remarkably stable for 40 years, implying a current equity risk premium of 3.5 to 4 percent
Marc H. Goedhart, Timothy M. Koller, and Zane D. Williams
12 | McKinsey on Finance Autumn 2002
looking estimates are fraught with problems,the most intractable of which is the difficultyof estimating future dividends or earningsgrowth. Some theorists have attempted tomeet that challenge by surveying equityanalysts, but since we know that analystprojections almost always overstate the long-term growth of earnings or dividends,2 analystobjectivity is hardly beyond question. Othershave built elaborate models of forward-looking returns, but such models are typicallyso complex that it is hard to draw conclusionsor generate anything but highly unstableresults. Depending on the modelingassumptions, recently published researchsuggests market risk premiums between 0 and4 percent.3
Unfortunately, the historical approach is just astricky because of the subjectivity of itsassumptions. For example, over what timeperiod should returns be measured—theprevious 5, 10, 20, or 80 years or more? Shouldaverage returns be reported as arithmetic orgeometric means? How frequently shouldaverage returns be sampled? Depending on theanswers, the market risk premium based onhistorical returns can be estimated to be ashigh as 8 percent.4 It is clear that bothhistorical and forward-looking approaches, aspracticed, have been inconclusive.
Overcoming the typical failings ofeconomic models
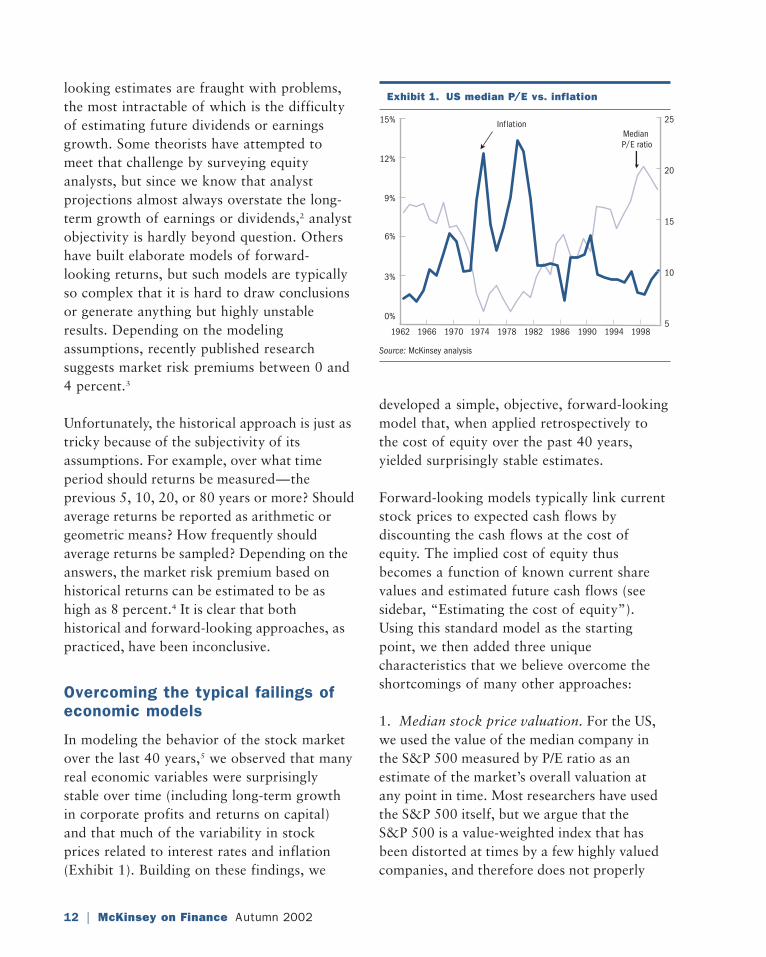
In modeling the behavior of the stock marketover the last 40 years,5 we observed that manyreal economic variables were surprisinglystable over time (including long-term growthin corporate profits and returns on capital)and that much of the variability in stockprices related to interest rates and inflation(Exhibit 1). Building on these findings, we
developed a simple, objective, forward-lookingmodel that, when applied retrospectively tothe cost of equity over the past 40 years,yielded surprisingly stable estimates.
Forward-looking models typically link currentstock prices to expected cash flows bydiscounting the cash flows at the cost ofequity. The implied cost of equity thusbecomes a function of known current sharevalues and estimated future cash flows (seesidebar, “Estimating the cost of equity”).Using this standard model as the startingpoint, we then added three uniquecharacteristics that we believe overcome theshortcomings of many other approaches:
1. Median stock price valuation. For the US,we used the value of the median company inthe S&P 500 measured by P/E ratio as anestimate of the market’s overall valuation atany point in time. Most researchers have usedthe S&P 500 itself, but we argue that the S&P 500 is a value-weighted index that hasbeen distorted at times by a few highly valuedcompanies, and therefore does not properly
5
10
15
20
25
0%
3%
6%
9%
1962 1966 1970 1974 1978 1982 1986 1990 1994 1998
12%
15% Inf lat ionMedian P/E ratio
Source: McKinsey analysis
Exhibit 1. US median P/E vs. inflation

0%1962 1966 1970 1974
US real cost of equity
UK real cost of equity
1978 1982 1986 1990 1994 1998 2002
1%
2%
3%
4%
5%
6%
7%
8%
9%
10%
11%
12%
13%
14%
15%
The real cost of equity | 13
reflect the market value of typical companies inthe US economy. During the 1990s, the medianand aggregate P/E levels diverged sharply.Indeed by the end of 1999, nearly 70 percent of the companies in the S&P 500 had P/E ratiosbelow that of the index as a whole. By usingthe median P/E ratio, we believe we generateestimates that are more representative for theeconomy as a whole. Since UK indices have notbeen similarly distorted, our estimates for theUK market are based instead on aggregate UKmarket P/E levels.
2. Dividendable cash flows. Most models usethe current level of dividends as a startingpoint for projecting cash flows to equity.However, many corporations have moved frompaying cash dividends to buying back sharesand finding other ways to return cash toshareholders, so estimates based on ordinarydividends will miss a substantial portion ofwhat is paid out. We avoid this by discountingnot the dividends paid but the cash flowsavailable to shareholders after new investments
have been funded. These are what we term“dividendable” cash flows to investors thatmight be paid out through share repurchasesas ordinary dividends, or temporarily held ascash at the corporate level.
We estimate dividendable cash flows bysubtracting the investment required to sustainthe long-term growth rate from current yearprofits. This investment can be shown to equalthe projected long-term profit growth (Seesidebar, “Estimating the cost of equity”)divided by the expected return on bookequity. To estimate the return on equity(ROE), we were able to take advantage of thefact that US and UK companies have had fairlystable returns over time. As Exhibit 2 shows,the ROE for both US and UK companies hasbeen consistently about 13 percent per year,6
the only significant exception being found inUK returns of the late 1970s.
3. Real earnings growth based on long-termtrends. The expected growth rate in cash flow
Source: McKinsey analysis
Exhibit 3. Annual estimates of the real cost of equity
0%1962 1966 1970
Average UK ROE
MedianUS ROE
1974 1978 1982 1986 1990 1994 1998 2002
2%
4%
6%
8%
10%
12%
14%
16%
18%
Exhibit 2. Return on book equity (ROE)
Source: McKinsey analysis

1962–1979
Market riskpremium
Real risk-free rate
1990–2000
US UK
5.0%
2.2%
3.6%
3.1%
1962–1979 1995–2000
4.3%
5.7% 5.8%
7.2% 6.7%
1.4%
3.0%
2.8%
Exhibit 4. Decomposition of the inflation-adjustedcost of equity
14 | McKinsey on Finance Autumn 2002
and earnings was estimated as the sum oflong-term real GDP growth plus expectedinflation. Corporate profits have remained arelatively consistent 5.5 percent of US GDPover the past 50 years. Thus, GDP growthrates are a good proxy for long-term corporateprofit growth. Real GDP growth has averagedabout 3.5 percent per year over the last80 years for the US and about 2.5 percentover the past 35 years for the UK. Using GDPgrowth as a proxy for expected earningsgrowth allows us to avoid using analysts’expected growth rates.
We estimated the expected inflation rate ineach year as the average inflation rateexperienced over the previous five years.7 Thenominal growth rates used in the model foreach year were the real GDP growth combinedwith the contemporary level of expectedinflation for that year.
Results
We used the above model to estimate theinflation-adjusted cost of equity implied bystock market valuations each year from 1963 to 2001 in the US and from 1965 to
2001 for the UK (Exhibit 3). In the US, itconsistently remains between 6 and 8 percentwith an average of 7 percent. For the UKmarket, the inflation-adjusted cost of equityhas been, with two exceptions, between4 percent and 7 percent and on average6 percent.
The stability of the implied inflation-adjustedcost of equity is striking. Despite a handful ofrecessions and financial crises over the past40 years including most recently the dot.combubble, equity investors have continued todemand about the same cost of equity ininflation-adjusted terms. Of course, there aredeviations from the long-term averages butthey aren’t very large and they don’t last verylong. We interpret this to mean that stockmarkets ultimately understand that despite upsand downs in the broad economy, corporateearnings and economic growth eventuallyrevert to their long-term trend.
We also dissected the inflation-adjusted cost ofequity over time into two components: theinflation-adjusted return on government bondsand the market risk premium. As Exhibit 4demonstrates, from 1962 to 1979 the expected
Source: McKinsey analysis
The stability of the implied inflation-
adjusted cost of equity is striking.
Despite a handful of recessions and
financial crises over the past
40 years . . . equity investors have
continued to demand about the
same cost of equity in inflation-
adjusted terms.

inflation-adjusted return on government bondsappears to have fluctuated around 2 percent inthe US and around 1.5 percent in the UK. Theimplied equity risk premium was about5 percent in both markets.8 But in the 1990s, itappears that the inflation-adjusted return onboth US and UK government bonds may haverisen to 3 percent, with the implied equity riskpremium falling to 3 percent and 3.6 percent inthe UK and US respectively.
We attribute this decline not to equitiesbecoming less risky (the inflation-adjusted costof equity has not changed) but to investorsdemanding higher returns in real terms ongovernment bonds after the inflation shocks ofthe late 1970s and early 1980s. We believe
that using an equity risk premium of 3.5 to4 percent in the current environment betterreflects the true long-term opportunity costfor equity capital and hence will yield moreaccurate valuations for companies.
Marc H. Goedhart ([email protected])
is associate principal in McKinsey’s Amsterdam
office, Timothy M. Koller ([email protected])
is a principal in McKinsey’s New York office, and
Zane D. Williams (Zane_Williams @McKinsey.com) is
a consultant in McKinsey’s Washington, D.C., office,
Copyright © 2002 McKinsey & Company. All rights
reserved.
1 Defined as the dif ference between the cost of equity and thereturns investors can expect from supposedly risk-freegovernment bonds.
2 See Marc H. Goedhart, Brendan Russel, and Zane D.Williams, “Prophets and profits?” McKinsey on Finance,
Number 2, Autumn 2001.
3 See, for example, Eugene Fama and Kenneth French, “TheEquity Premium,” Journal of Finance, Volume LVII, Number 2,2002; and Robert Arnott and Peter Bernstein, “What RiskPremium is ‘Normal’,” Financial Analysts Journal, March/April, 2002; James Claus and Jacob Thomas, “Equity premiaas low as three percent?” Journal of Finance, Volume LVI,Number 5, 2001.
4 See, for example, Ibbotson and Associates, Stock, Bonds,Bills and Inflation: 1997 Yearbook.
5 See Timothy Koller and Zane Williams, “What happened to thebull market?” McKinsey on Finance, Number 1, Summer 2001.
6 One consequence of combining a volatile nominal growth rate(due to changing inflationary expectations) with a stableROE is that the estimated reinvestment rate varies tremen-dously over time. In the late 1970s, in fact, our estimatesare near 100 percent. This is unlikely to be a true represen-tation of actual investor expectations at the time. Instead,we believe it likely that investors viewed the high inflation ofthose years as temporary. As a result, in all of our estimates,we capped the reinvestment rate at 70 percent.
7 This assumption is the one that we are least comfortablewith, but our analysis seems to suggest that markets build inan expectation that inflation from the recent past willcontinue (witness the high long-term government bond yieldsof the late 1970s).
8 There is some evidence that the market risk premium ishigher in periods of high inflation and high interest rates, aswas experienced in the late 1970s and early 1980s.
MoF
To estimate the cost of equity, we began with a standard perpetuity model:
(1)
where Pt is the price of a share at time t, CFt � 1 is the expected cash flow pershare at time t � 1, k e is the cost of equity, and g is the expected growth rateof the cash flows. The cash flows, in turn, can be expressed as earnings, E,multiplied by the payout ratio:
Since the payout ratio is the share of earnings lef t af ter reinvestment,replacing the payout ratio with the reinvestment rate gives:
The reinvestment rate, in turn, can be expressed as the ratio of the growthrate, g, to the expected return on equity:
And thus the cash flows can be expressed as:
(2)
We then combined formulas (1) and (2) to get the following:
(3)
If the inflation embedded in ke and g is the same, we can then expressequation 3 as:
(4)
Where ker and gr are the inflation-adjusted cost of equity and real growth rate,respectively. We then solved for ker for each year from 1963 through 2001,using the assumptions described in the text of the article.
Estimating the cost of equity
Pt �CFt � 1
k e � g
ke �Et � 1
Pt
ker �Et � 1
Pt
1 �g
Pt
�ROE
cE t � 1 ke � g
CF � E (1 �g )ROE
CF � E(payout ratio)
CF � E(1 � reinvestment rate)
reinvestment rate � g
ROE
The real cost of equity | 15
(1 �g ) � g
ROE
(1 �g ) � grROE

16 | McKinsey on Finance Autumn 2002
The CFO guide to better pricingCutting costs might get more attention, but improving pricing discipline canadd more to the bottom line. Here’s how CFOs can lead the way.
Dieter Kiewell and Eric V. Roegner
Among the many things that jostle forattention in the typical CFO’s agenda,
pricing isn’t usually a priority, crowded out bymore visible demands like cutting costs orstructuring mergers. Yet a straightforwardreview of major contracts or a structuredanalysis of the costs to serve individualcustomers can reveal considerable opportunityto increase profitability. The unintentionalaccumulation of discounts and incrementalconcessions to buyer demands (for benefits likecustomized design, exceptional payment terms,or prioritized delivery) can significantly under-mine a company’s intended pricing structure.Given strong evidence that a sound pricingstrategy can create real value, some CFOs arebeing enticed into this neglected area.
When CFOs do get involved in pricing, theimpact can be significant. In McKinsey’sexperience with more than 500 pricing studiesover the past two years, committed leadershipon pricing strategy improves a company’soperating profit margin by between 2 percentand 7 percent, often doubling historic profitmargins. To put this in perspective, the average5 percent improvement in returns on sales fromimproved pricing creates $1.5 billion ofadditional value over five years for an averageS&P 500 company.
How can such dramatic gains be achievedsimply by getting pricing initiatives in place?Consider the case of ChemicalCo,1 a leading
chemical company with global sales of around$10 billion. At one time, ChemicalCo boastedprofit margins approaching 10 percent but acyclical decline in the chemical market erodedmargins to below 2 percent. Complicating thesituation was the fact that price discipline hadbeen lost across all businesses during thedownturn. The company had no guidelines toprotect price integrity when facing defectionsof large accounts. Downward pressure oncommodity products was contagious, too,infecting even specialty products whereChemicalCo had once earned significantpremiums. And a steady deterioration in pricesthroughout the industry turned even well-positioned corporate peers into the fiercest ofcompetitors—with price becoming the soledifferentiator between products.
It was the CFO who in 2001 elevated priceperformance to the top of the company’spriority list, championing a pricing diagnosticacross the organization. The diagnostichighlighted opportunities in transactionalpricing (unwarranted variation in prices andlack of consistency in the terms and conditionsof sale on a transactional, customer-by-customer level), product market pricing(eroding premiums for value-added productsor premium customer segments), and strategicpricing (declining industry price levels in theabsence of legal price leadership in the under-lying market). Pilot projects to address eachcategory of pricing opportunity have delivered

The CFO guide to better pricing | 17
2 to 5 percentage points in margin improve-ments—more than any cost-cutting or growthinitiative that ChemicalCo has ever achieved.
The advantages of CFO-led pricing change
Our experience shows that CFO-led pricingprojects are more successful in identifyingopportunities, ensuring that their full value iscaptured, and creating an environment ofcontinuous price improvements. CFOs havethe clout to raise the issue among the broadermanagement group, to ensure that theappropriate data and analyses are available,and to push for standardized metrics andreporting. Most importantly, their position
and influence means they can ask thenecessary tough and probing questions tosales, marketing, and operations heads whoseperformance lags behind the performance oftheir peers. In short, the CFO is uniquelypositioned to champion sound pricingbehavior throughout the organization.
Calling attention to pricingopportunities
Most sales organizations are predominantlyvolume driven. If sales incentives exist, theytypically contain a volume component; whenvolume incentives are complemented by amargin-based element, it typically kicks inonly after a volume quota has been hit. So
Exhibit 1. Pricing initiatives make a rapid and striking impact
Source of opportunity
Sample client engagement Strategic Product Market Transactional Percentage point improvement(by industry) Pricing Pricing Pricing in ROS realized1aaaaaa
Defense electronics ●● ● ●Distribution transformers ●● ● ●Business forms ●● ●●◗ ●Telecom equipment ●●◗ ●●◗ ●Building construction ●●◗ ● ●Office furniture ●● ● ●Computer equipment ●● ● ●●◗Industrial hydraulics ●● ●●◗ ●Specialty chemicals ● ●●◗ ●●◗Computer equipment ●● ● ●Electrical controls ●● ●● ●Vinyl flooring ●●◗ ● ●Electric lamps ●●◗ ●●◗ ●Fasteners ●● ●●◗ ●POS/retail equipment ● ● ●●Packaged goods ●● ● ●●◗Construction materials ●●◗ ● ●Tires ●●◗ ● ●Telecommunications ●● ● ●
1 Based on year 1 pilotsSource: McKinsey analysis
15.0
14.0
6.9
5.2
6.0
6.0
3.4
4.9
5.5
3.5
3.3
3.5
3.0
3.0
2.7
6.1
3.9
3.0
2.5
●● low ●●◗ moderate ● strong

18 | McKinsey on Finance Autumn 2002
when the volume/margin trade-off is made,the former usually wins, especially when salesforces are faced with the additional pressuresof downturns.
On their own, sales organizations find it verydifficult to make even incrementalimprovements in performance. This is wherethe finance organization is useful. It can putup a financial mirror in front of sales andmarketing teams that makes clear the realityof decisions made by account managers whilethey are pushing for volume discounts.Finance can also bridge a potential conflict ofinterest between operations managers, whoaim to maximize plant utilization, and theobjective of profitable growth, which mayrequire uncomfortable tactics like downsizing.
For example, the sales organization of oneNorth American basic materials manufac-turer—we’ll call it BaseMat Incorporated—consistently delivered against an aggressiveinternal annual growth target of 10 percentthrough the decade since it entered a stable,slightly declining European market. Althoughthe operational director constantly encouragedgrowing the business, the CFO showed theexecutive committee that a strategy based on“buying market share through lower prices”was not sustainable. An analysis of BaseMat’sthree largest customers showed that thecompany was actually incurring cash losses
with what it regarded as its most importantaccounts. Yet at the same time, othercustomers that had grown in volume wereproducing high profit margins. The CFOconcluded that a lack of pricing transparencyand discipline within the sales organizationhad led to an inappropriate prioritization ofsales activities.
As a result of this analysis by the CFO, thecompany introduced a sales tool that allowedsales staff to evaluate each deal againsthistorical and comparable deals, implicitlyreprioritizing sales activities to focus onprofitable customers. During the first fourmonths after implementation, the companyexperienced an improvement in profit marginof 1.5 percent on the underlying sales.
Ensuring data availability andanalysis
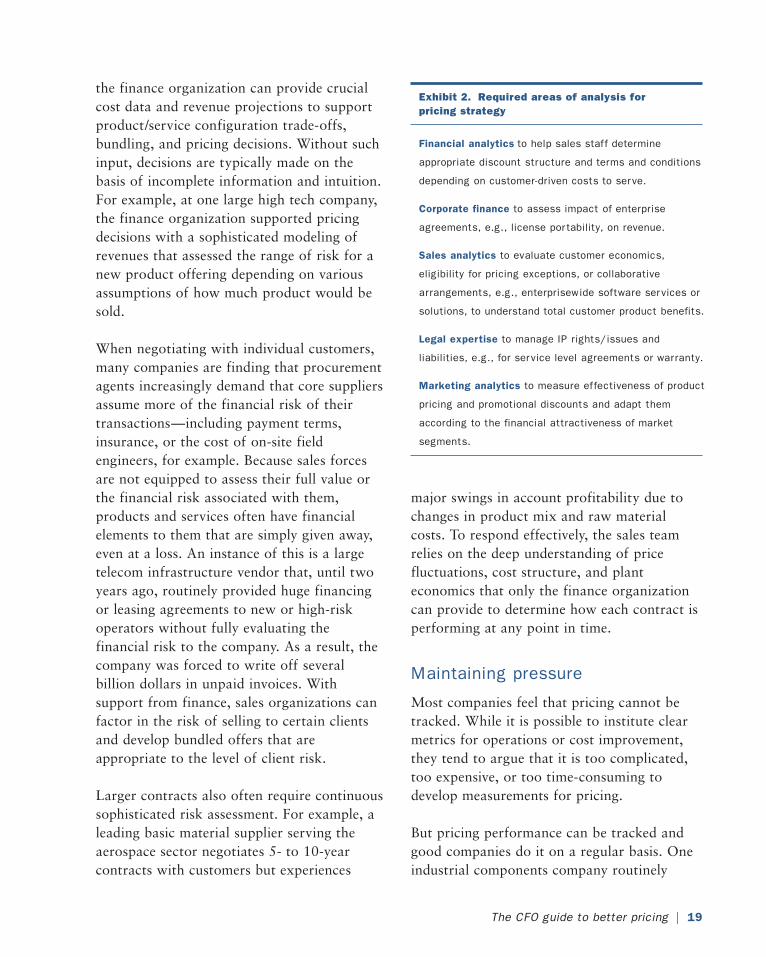
Identifying and quantifying pricingopportunities requires the collection oftransaction-specific data, including things likediscounts, rebates, payment terms, logistics,and actual customer-specific product andservice costs. Typically, a separate databaseneeds to be created that can synthesize theinformation available from a number ofdifferent systems controlled by the CFO. Itscentral position within a company makes thefinance organization the natural owner of sucha database, given that data sources may crossboth functional and business unit-specificborders but feed into established financialreporting systems (Exhibit 2).
Beyond owning the database, financeorganizations can have an enormous impacton pricing performance, both in developing anew product offering and negotiating sales toindividual customers. In developing an offer,
Committed leadership on pricing
strategy improves a company’s
operating profit margin by
between 2 percent and 7 percent
The CFO guide to better pricing | 19
the finance organization can provide crucialcost data and revenue projections to supportproduct/service configuration trade-offs,bundling, and pricing decisions. Without suchinput, decisions are typically made on thebasis of incomplete information and intuition.For example, at one large high tech company,the finance organization supported pricingdecisions with a sophisticated modeling ofrevenues that assessed the range of risk for anew product offering depending on variousassumptions of how much product would besold.
When negotiating with individual customers,many companies are finding that procurementagents increasingly demand that core suppliersassume more of the financial risk of theirtransactions—including payment terms,insurance, or the cost of on-site fieldengineers, for example. Because sales forcesare not equipped to assess their full value orthe financial risk associated with them,products and services often have financialelements to them that are simply given away,even at a loss. An instance of this is a largetelecom infrastructure vendor that, until twoyears ago, routinely provided huge financingor leasing agreements to new or high-riskoperators without fully evaluating thefinancial risk to the company. As a result, thecompany was forced to write off severalbillion dollars in unpaid invoices. Withsupport from finance, sales organizations canfactor in the risk of selling to certain clientsand develop bundled offers that areappropriate to the level of client risk.
Larger contracts also often require continuoussophisticated risk assessment. For example, aleading basic material supplier serving theaerospace sector negotiates 5- to 10-yearcontracts with customers but experiences
major swings in account profitability due tochanges in product mix and raw materialcosts. To respond effectively, the sales teamrelies on the deep understanding of pricefluctuations, cost structure, and planteconomics that only the finance organizationcan provide to determine how each contract isperforming at any point in time.
Maintaining pressure
Most companies feel that pricing cannot betracked. While it is possible to institute clearmetrics for operations or cost improvement,they tend to argue that it is too complicated,too expensive, or too time-consuming todevelop measurements for pricing.
But pricing performance can be tracked andgood companies do it on a regular basis. Oneindustrial components company routinely
Exhibit 2. Required areas of analysis for pricing strategy
Financial analytics to help sales staff determine
appropriate discount structure and terms and conditions
depending on customer-driven costs to serve.
Corporate finance to assess impact of enterprise
agreements, e.g., license portability, on revenue.
Sales analytics to evaluate customer economics,
eligibility for pricing exceptions, or collaborative
arrangements, e.g., enterprisewide software services or
solutions, to understand total customer product benefits.
Legal expertise to manage IP rights/issues and
liabilities, e.g., for service level agreements or warranty.
Marketing analytics to measure effectiveness of product
pricing and promotional discounts and adapt them
according to the financial attractiveness of market
segments.

evaluates and compensates the executive teamon the percentage price premium attained overtheir two largest competitors. Othercompanies institute pricing-specific tools likepocket price or pocket margin metrics acrossparticular businesses to monitor the totalactual value of a sale once all discounts,bonuses, give-aways, premiums and the likeare accounted for. Likewise, highly specificmetrics can also be introduced to focus onparticularly difficult problems such asunearned rebates, accounts receivable/daysoutstanding, rushed freight, consignedinventories, and unbilled service hours.
The finance organization is best positioned todesign systems to track pricing performance,much as it already does for operations andcost-related performance indicators, and thento integrate findings into a company’s otherfinancial reports.
Implementing sound pricingpractices companywide
When a company decides to focus on pricing,it often chooses a specific business orgeography to analyze as a test case or pilotprogram. While the vast majority of pilots aresuccessful, only a few companies haveimplemented new pricing practices across theirwhole business with the same levels of success.
20 | McKinsey on Finance Autumn 2002
The sales team relies on the
deep understanding of price
fluctuations, cost structure, and
plant economics that only the
finance organization can provide.
Typically, this is because of a lack of readilyavailable and reliable pricing information:pricing failures are recognized too late to becorrected and, due to the sensitivity around theissue, pricing successes cannot be celebrated tomaintain the momentum of the initiative.
The companies that are most successful atimplementing pricing programs across anentire enterprise are those that have set uppricing organizations that report directly tothe CFO. In best-in-class pricing organiza-tions, the CFO commits at least 20 percent ofhis or her time to the pricing effort2 andassigns dedicated responsibilities within thefinance organization to manage pricingcontinually. These teams are made responsiblefor organization-wide implementation ofpricing tools and are supported by timely andreliable support from the CFO’s financeorganization, which gives them theammunition to force a discussion with salesand other management units if pricingperformance deviates from plan.
Much attention is paid to the impact ofhighly visible cost-cutting efforts or mergers.But the value of those efforts, in fact, oftenpales when compared to the real gains fromimplementing and enforcing sound pricingpolicies, a job that the CFO is in the bestposition to get done.
Dieter Kiewell ([email protected])
is an associate principal in McKinsey’s London
office and Eric Roegner (Eric_Roegner@McKinsey
.com) is a principal in the Cleveland office.
Copyright © 2002 McKinsey & Company.
All rights reserved.
1 Company names in this article have been disguised.
2 This compares with an average of only 10 percent found inan annual executive survey by McKinsey’s MarketingPractice, 2001.
MoF

ABU DHABIAMSTERDAM
ANTWERPATHENS
ATLANTAAUCKLAND
AUSTINBANGKOK
BARCELONABEIJINGBERLIN
BOGOTABOSTON
BRUSSELSBUDAPEST
BUENOS AIRESCARACAS
CHARLOTTECHICAGO
CLEVELANDCOLOGNE
COPENHAGENDALLAS
DELHIDETROIT
DUBAIDUBLIN
DÜSSELDORFFRANKFURT
GENEVAGOTHENBURG
HAMBURGHELSINKI
HONG KONGHOUSTONISTANBULJAKARTA
JOHANNESBURGKUALA LUMPUR
LISBONLONDON
LOS ANGELESMADRIDMANILA
MELBOURNEMEXICO CITY
MIAMIMILAN
MINNEAPOLISMONTERREY
MONTRÉALMOSCOWMUMBAIMUNICH
NEW JERSEYNEW YORK
ORANGE COUNTYOSAKA
OSLOPARIS
PITTSBURGHPRAGUE
RIO DE JANEIROROME
SAN FRANCISCOSANTIAGO
SÃO PAULOSEATTLE
SEOULSHANGHAI
SILICON VALLEYSINGAPORESTAMFORD
STOCKHOLMSTUTTGART
SYDNEYTAIPEI
TEL AVIVTOKYO
TORONTOVERONAVIENNA
WARSAWWASHINGTON, DC
ZURICH

Copyright © 2002 McKinsey & Company