
RESEARCH SYNOPSIS ON FINANCE BCOM Honours By Akash ...
395
RESEARCH SYNOPSIS ON FINANCE BCOM Honours By Akash Raghuvanshi to the DEPARTMENT OF COMMERCE BHOPAL SCHOOL OF SOCIAL SCIENCES May 2021 Submitted by Akash raghuvanshi Bcom (Hons) 3 rd year Guided by Dr Mrs Smitha Pillai Associate Professor Department of Commerce
-
Upload
khangminh22 -
Category
Documents
-
view
1 -
download
0
Transcript of RESEARCH SYNOPSIS ON FINANCE BCOM Honours By Akash ...

RESEARCH SYNOPSIS ON FINANCE
BCOM Honours
By
Akash Raghuvanshi
to the
DEPARTMENT OF COMMERCE
BHOPAL SCHOOL OF SOCIAL SCIENCES
May 2021
Submitted by
Akash raghuvanshi
Bcom (Hons) 3rd year Guided by
Dr Mrs Smitha Pillai
Associate Professor
Department of Commerce

CERTIFICATE
It is certified that the work contained in the project report titled Corporate
finance by Akash raghuvanshi has been carried out under my/our supervision and
that this work has not been submitted elsewhere for a degree*
Signature of Supervisor: …………….
Name : Dr MRS Smitha Pillai , Associate Professor
Department : Commerce
Bhopal School of Social Sciences
May, 2021

DECLARATION
I hereby declare that this project report entitled “- Corporate finance was carried
out by me for the degree of BCOM Honours under the guidance and supervision
of MRS Smitha Pillai of Department of Commerce, BSSS College. The
interpretations put forth are based on my reading and understanding of the
original texts and they are not published anywhere in any form. The other books,
articles and websites, which I have made use of are acknowledged at the
respective place in the text. This research report is not submitted for any other
degree or diploma in any other University.
Place: Bhopal
Name of the Student: Akash Raghuvanshi
Class & Section: BCOM (HONS) 3rd year
Date: 27/05/2021

ACKNOWLEDGEMENT
I would like to thank our Principal Dr. Fr. John P.J. and Vice Principal Dr Sr
Sonia Kurien for their immense support and blessings. I thank our HOD Dr Amit
Kumar Nag for his support. I would like to express my special thanks of gratitude
to my research guide Dr. MRS Smitha Pillai Associate Professor of Department
of Commerce for her valuable suggestions and guidance and for giving me the
golden opportunity to do this wonderful research project on the topic Consumer
behaviour towards electronic production online shopping Without her help it
would have been difficult for me to have reached this state of completion of my
project report. Also, I would like to thank my parents and friends who helped me
a lot in the preparation of this project.
I wish to acknowledge the help of all those who have provided me information,
guidance and other help during my research period.

Chapter 1 INTRODUCTION
Corporate finance is the area of finance that deals with sources of funding, the capital structure of corporations, the actions that managers take to increase the value of the firm to the shareholders, and the tools and analysis used to allocate financial resources. The primary goal of corporate finance is to maximize or increase shareholder value.
Correspondingly, corporate finance comprises two main sub-disciplines Capital budgeting corporate financier is concerned with the setting of criteria about which value-adding projects should receive investment funding, and whether to finance that investment with equity or debt capital. Working capital management is the management of the company's monetary funds that deal with the short-term operating balance of current assets and current liabilities; the focus here is on managing cash, inventories, and short-term borrowing and lending (such as the terms on credit extended to customers).
The terms corporate finance and are also associated with investment banking. The typical role of an investment bank is to evaluate the company's financial needs and raise the appropriate type of capital that best fits those needs. Thus, the terms "corporate finance" and "corporate financier" may be associated with transactions in which capital is raised in order to create, develop, grow or acquire businesses. Recent legal and regulatory developments in the U.S. will likely alter the makeup of the group of arrangers and financiers willing to arrange and provide financing for certain highly leveraged transactions.
Although it is in principle different from managerial finance which studies the financial management of all firms, rather than corporations alone, the main concepts in the study of corporate finance are applicable to the financial problems of all kinds of firms. Financial management overlaps with the financial function of the accounting profession. However, financial accounting is the reporting of historical financial information, while financial management is concerned with the deployment of capital resources to increase a firm's value to the shareholders.

Bajaj Finance Limited a subsidiary of Bajaj Finserv, is an Indian non-banking financial company (NBFC). The company deals in consumer finance, SME (small and medium-sized enterprises) and commercial lending, and wealth management. Headquartered in Pune, Maharashtra, the company has 294 consumer branches and 497 rural locations with over 33,000+ distribution points. The company reported a pre-tax profit of Rs.626 crores and a post-tax profit of Rs.408 crores
Muthoot Finance Ltd. is an Indian financial corporation and the largest gold loan NBFC in the country.[3] In addition to financing gold transactions, the company offers foreign exchange services, money transfers, wealth management services, travel and tourism services, and sells gold coins. The company's headquarters are located in Kerala, India, and it operates over 4,400 branches throughout the country. Outside India, Muthoot Finance is established in the UK, the US, and the United Arab Emirates.The company falls under the brand umbrella of the Muthoot Group. Its stocks are listed on the Bombay Stock Exchange (BSE) and NSE. As of March 2012, revenue (after expenditure) stood at more than ₹23,000 crore (US$4.2 billion).[4] The target market of Muthoot Finance includes small businesses, vendors, farmers, traders, SME business owners, and salaried individuals.
Mahindra & Mahindra Financial Services Limited (MMFSL) is a rural NBFC headquartered in Mumbai, India.[4] It is amongst the top tractor financers in India and offers a wide range of financial products to address varied customer requirements.[5] The NBFC has 1000+ offices spread over 1 in every 3 villages across India with a total of more than 4.7 million customers to date.Mahindra Finance started on 1 January 1991, as Maxi Motors Financial Services Limited.[6] They received the certificate of commencement of business on 19 February 1991. On 3 November 1992, Mahindra Finance changed their name to Mahindra & Mahindra Financial Services Limited.[7] Mahindra Finance is registered with the Reserve Bank of India as an asset finance, deposit taking NBFC

Chapter 2:
Review of Literature
International Review
Williamson(1998)
Williamson in his article, “Corporate Finance and Corporate Governance”,
analyzed the effects of tangible assets and probability of bankruptcy on the
relationship between capital structure, leverage, and asset liquidity. He predicted
that asset liquidity will increase optimal leverage, which means he concluded
positive relationship between asset liquidity and capital structure.
Shleifer and Vishny (1992)
Shleifer and Vishny (1992) in their article, “Liquidation Values and Debt
Capacity: A Market Equilibrium Approach”, discussed about asset liquidity and
optimal leverage. They argue that in costs of financial distresses, asset liquidity
plays an important role as a determinant. Their paper is focused on industry and
economy wide determinants of liquidity.
Rajan and Zingales (1995)

Rajan and Zingales (1995) analyzed Germany market to explain relationship
between capital structure and its components. Their result can be an explanation
of the empirical finding which firm size is negatively related to leverage in
Germany. This negative effect is for German capital markets which are less
developed and just large firms are traded in public.
Weiss and Wruck (1998)
Weiss and Wruck (1998) believe in their paper “Information problems, conflicts
of interest, and asset stripping” that relationship between asset liquidity and
leverage is negative. They say that distressed companies selling assets are
probably to face a less liquid or illiquid market because their industry companions
are also distressed. Thus companies can sell assets only at minimum price which
is “fire sale”. They find that this illiquidity will decrease a company’s leverage
level or debt capacity. As it is mentioned in Eastern’s case definition of asset
liquidity will be “what allows value-destroying asset stripping to occur”. Less
liquid assets would provide creditors with defense of
such operations. “Unless a credible promise can be made not to engage in asset
stripping, asset liquidity will reduce, not increase, a firm’s ability to issue debt
securities”. They say that if development of capital market is continuing and
provision of liquidity is increasing in a sort of asset markets, the asset stripping
problem will importantly increase.

National Reviews
Chatterjee Debabrata (2010) did a comparative study on Corporate Governance
and Corporate Social Responsibility – The case of Three Indian Companies ITC
Ltd., Reliance Industries Ltd., and Infosys Technologies Ltd. He concluded that
though the corporate governance practices are exemplary, there exist differences
in the way the companies adopt the corporate governance practices. He rated
Infosys better than the other two companies.
Mohamad Wan Adilah Wan Izyani , Sulong Zunaidab (2010) did a
comprehensive study on Corporate Governance Mechanisms and Extent of
Disclosure: Evidence from listed companies in Malaysia has revealed that
companies with a higher percentage of family members, on the board,
significantly have lower level of disclosure in annual report. It has been suggested
that regulators like Bussa Malaysia and Securities Commission should review and
impose a minimum level of family members on the board and Malaysian
regulators should implement the same guidelines.
Thrikawala Sujani, et. al (2011) in their research Corporate Governance –
erformance relationship in Microfinance Institutions suggested that it is important
to determine those corporate governance practices that have great impact on MFI
performance. It has also made an advanced contribution to the understanding of
corporate governance practices in MFI, identifying and developing an appropriate
governance structure. It has also provided guidance for selecting directors for
MFI Boards based on their academic and professional qualifications.

. Kajanathan Rajendran (2012) did a study in Sri Lanka titled Effect of corporate
Governance on Capital Structure. Investigation was made on the impact of
corporate governance on capital structure of Sri Lankan manufacturing firms. It
was concluded that corporate governance has important implications on the
financing decisions of Sri Lankan manufacturing firms.
Bihari Suresh Chandra (2012) conducted the study Corporate Governance is key
to Better Corporate Image: A study in the Banking Sector in India. It has been
concluded that there is a need for a strong culture of compliance at the top of the
organization and necessary to consider how management can respond to ethical
or reputation concerns. The biggest challenge in India is to implement the rules
of corporate governance at the ground level. It is required to extend the principles
of good corporate governance practices to co-operatives, Non-banking Private
Companies and other financial institutions.

Chapter 3 :
Research Methodology
Scope Corporate Finance:
Corporate finance is the area of finance dealing with the sources of funding and
the capital of corporations and the actions that managers take to increase
the value of the firm to the shareholders, as well as the tools and analysis used to
allocate financial resources. The primary goal of corporate finance is
to maximize or increase shareholder.
1. Corporate Finance broadly speaking business finance can be defined as the
activity concerned with the raising and administering of funds used in business.
2. Precedents: Corporate finance deals with precedents, practice and policies
based or experience, accident or anticipation,
3. Financial Problem: Corporate finance deals with the financial problems
of corporate. Also deal with distinction between capital and Income.
4. Capital required: It examine the extent form of Capital required by
Corporate.

5. Income: It scrutinizes the practice and policies of administering corporate
Income.
6. Dividend: It looks into propriety of Dividend, Depreciation and reserve
policies of the companies.
7. Financial Institution: It studies the importance of financial institutions
Insurance, stock exchanges, investment bankers etc
.
8. Role of State: It examine the role of state in regulating and controlling the
financial Practices and policies of Corporate.
9. Divorce ownership and Management: Management is provided with a
number of opportunities to manipulate the financial statements. Corporate finance
separate between ownership and management.
10. Protector of share holders: Corporate finance is likely to stand as a
protector of shareholders.
Objective of Corporate Finance:
A firm is a group of claimants of share holders, creditors, suppliers, customers
and employees. The shareholders appoint a Board of directors to see the
functioning and directing the company. The directors will act in the interest of
the claimant not act in their own interest. In corporate finance theory generally
agrees that the objective of a firm is to maximize the profit and wealth
maximization. Wealth maximization rules require managers to work towards a
sustainable increase in the price of the firm’s stock.

I Profit maximization: Profit is the excess of revenue over expenses. Profit
maximization requires manager to keep low expenses.
ii. Social welfare: Business persons are supposed to be socially responsible.
Iii Corporate Growth:
Chapter 4 :
Data representation & Analysis
PROFITABILITY RATIOS
1. Net Profit Ratio-This ratio establishes the relationship in terms of percentage between net profit and net sales.
Net profit ratio= Net profit / Net sales *100
Table – 1
Bajaj Finance Limited
Muthoot Finance Ltd Years
Net Profit Net sales
Ratio
Net Profit Net sales
Ratio
2016 1,964.57 7304.31 26.89 1,316.75 4,800.67 24.42 2017 2,817.52 9963.02 28.27 1,920.98 5,639.55 34.062018
4,056.36
13287.7730.52 2,844.69 6,161.83 46.1
2019 6,035.30 17386.02 34.7 3,076.82 6,878.21 44.7 2020 6,808.13 23822.53 28.57
4,057.418,714.64 46.55
AVERAGE 29.79 AVERAGE 39.27
Operation profit Ratio – The difference between net profit ratio and net operating profit ratio is that net operating profit is calculated without considering

non-operating expenses and non-operating incomes. If we deduct this ratio from 100, the result will be operating ratio. Higher operating profit ratio enables the organization to recoup non-operating expenses out of operating profits and provide reasonable return.
Operating Profit Ratio = Operating Profit / Net Sales *100
Table - 2
Bajaj Finance Limited Muthoot Finance LtdYearsOperating
Profit Net sales
RatioOperating
ProfitNet sales
Ratio
2016 242.32 7304.31 3.31 4,861.40 4,800.67 101.22017 153.90 9963.02 1.54 5,728.63 5,639.55 101.572018
241.9013287.77
1.813 6,266.526,161.83 101.6
2019 423.05 17386.02 2.433 6,878.21 6,878.21 1002020
779.8623822.53 3.27
8,714.648,714.64 100
AVERAGE 2.47 AVERAGE 100.87
1.2.3. Earnings per share (EPS) - Earnings per share (EPS) is calculated as a
company's profit divided by the outstanding shares of its common stock. The resulting number serves as an indicator of a company's profitability. It is common for a company to report EPS that is adjusted for extraordinary items and potential share dilution. The higher a company's EPS, the more profitable it is considered to be.
Table - 4
Bajaj Finance Limited
Muthoot Finance LtdYears
Net Profit
No. of Equity share
Ratio
Net Profit
No. of Equity share
Ratio

2016 -5395.54 462.09 -23.89 9726.29 1163.17 16.732017 1383.14 462.09 6.00 9801.09 1165.11 16.832018 -2431.81 530.36 -9.17 6777.42 1285.81 10.542019 433.52 530.36 1.64 3363.30 1289.46 5.222020 546.19 925.37 1.18 7930.81 1294.76 12.25
AVERAGE -4.84 AVERAGE 12.31

IMPACT OF COVID-19 ON EDUCATION
Research Project Submitted in Partial Fulfilment of the Requirements for
Degree of
BCOM Honours
by
AKRAM KHAN
to the
DEPARTMENT OF COMMERCE
BHOPAL SCHOOL OF SOCIAL SCIENCES
APRIL,2021

Submitted by Guided by
AKRAM KHAN Dr. Smitha Pillai
Associate Professor
Department of Commerce

CERTIFICATE
It is certified that the work contained in the project report titled “Impact of Covid-
19 on Education”, by “Akram Khan”, has been carried out under my supervision
and that this work has not been submitted elsewhere for a degree.
Signature of the supervisor: ……………
Name : Dr. Smitha Pillai, Associate Professor
Department : Commerce
Bhopal School of Social Sciences
April, 2021

DECLARATION
I hereby declare that this project report entitled “Impact of Covid-19 on
Education” was carried out by me for the degree of BCOM Honours under the
guidance and supervision of Dr. Smitha Pillai, Associate Professor of Department
of Commerce, BSSS College. The interpretations put forth are based on my
reading and understanding of the original texts and they are not published
anywhere in any form. The other books, articles and websites, which I have made
use of are acknowledged at the respective place in the text. This research report
is not submitted for any other degree or diploma in any other University.
Place: Bhopal
Name of the Student: Akram Khan
Class & Section: BCOM HONOURS 3A
Date: 15th April, 2021

ACKNOWLEDGEMENT
I would like to thank our Principal Dr.Fr.John P.J. and Vice Principal Dr. Sr.
Sonia Kurien for their immense support and blessings. I thank our HOD Dr. Amit
Kumar Nag for his support. I would like to express my special thanks of gratitude
to my research guide Dr.Smitha Pillai, Associate Professor of Department of
Commerce for her valuable suggestions and guidance and for giving me this
opportunity to do this wonderful research project on the topic: Impact of Covid-
19 on Education, Without her help it would have been difficult for me to have
reached this state of completion of my project report. Also, I would like to thank
my parents and friends who helped me a lot in the preparation of this project.
I wish to acknowledge the help of all those who have provided me information, guidance and other help during my research period.

Chapter 1: Introduction of the Topic
1.1 Rationale of the study
1.2 Introduction to the Industry
1.3 Introduction to the Company
1.4 Justification of the Topic
Chapter 2: Review of Literature
2.1 International Review
2.2 National Review
Chapter 3: Research Methodology
3.1 Objective of the study
3.2 Scope of Study
3.3 Data Collection
3.4 Limitation of the study
Chapter 4: Data representation & Analysis
4.1 Data representation & Interpretation
Chapter 5: Results & Discussion
5.1 Major Findings
5.2 Discussion & Suggestions
5.3 Conclusion
REFRENCES
ANNEXURE

CHAPTER – 1
INTRODUCTION TO THE TOPIC
1.1 Rationale of the Study
What impact did covid-19 have on education? The impact of pandemic COVID-19 is observed in every
sector around the world. The education sectors of India as well as world are badly affected by this. It
has enforced the world wide lock down creating very bad effect on the students' life. Around 32 crore
learners stopped to move schools/colleges, all educational activities halted in India. The outbreak of
COVID-19 has advised us that change is inevitable. It has worked as a catalyst for the educational
institutions to grow and opt for platforms and techniques, which have not been used before. The
education sector has been fighting to survive the crises with a different approach and digitising the
challenges to wash away the threat of the pandemic. This paper highlights some measures taken by
Govt. of India to provide seamless education in the country. Both the positive and negative impacts of
COVID-19 are discussed and some fruitful suggestions are pointed to carry out educational activities
during the pandemic situation.

1.2 Introduction to the Topic
The pandemic Covid-19 has spread over whole world and compelled the human society to maintain
social distancing. It has significantly disrupted the education sector which is a critical determinant of a
country’s economic future. February 11, 2020, the World Health Organisation (WHO) proposed an
official name of the virus as COVID acronym for Coronavirus disease 2019. It was first identified in
Wuhan, China on December 31, 2019. First death by COVID 19 was the 61-year old man in Wuhan,
China on January 11, 2020. WHO declared COVID-19 as a pandemic on March 11, 2020. The first case
of the COVID-19 pandemic reported on 30 January 2020 in the state of Kerala and the affected had a
travel history from Wuhan, China (Wikipedia). The first death due to COVID-19 was reported in India
on March 12, 2020. It has affected more than 4.5 million peoples worldwide (WHO). According to the
UNESCO report, it had affected more than 90% of total world’s student population during mid-April
2020 which is now reduced to nearly 67% during June 2020. Outbreak of COVID-19 has impacted
more than 120 crores of students and youths across the planet. In India, more than 32 crores of students
have been affected by the various restrictions and the nationwide lockdown for COVID-19. As per the
UNESCO report, about 14 crores of primary and 13 crores of secondary students are affected which are
two mostly affected levels in India.

After observing the corona virus pandemic situation, the WHO advised to maintain social distancing as
the first prevention step. So, every country started the action of lockdown to separate the contaminated
people. The education sectors including schools, colleges and universities became closed. Classes
suspended and all examinations of schools, colleges and universities including entrance tests were
postponed indefinitely. Thus, the lockdown destroyed the schedules of every student. Though it is an
exceptional situation in the history of education, COVID-19 has created many opportunities to come
out of the rigorous classroom teaching model to a new era of digital model.
The lockdown has compelled many educational institutions to cancel their classes, examinations,
internships etc. and to choose the online modes. Initially, the educators and the students were quite
confused and didn’t understand how to cope up with the situation of this sudden crisis that compelled
closure of the educational activities. But latter on all realized that the lockdown has taught so many
lessons to manage with the emergence of such pandemics. Thus, COVID-19 has created many
challenges and opportunities for the educational institutes to strengthen their infrastructure. The
lockdown has given them a ray of hope for teachers and students to continue their educational activities
through online. The teachers assigned work to students via internet, delivered lectures video
conferencing using different Apps like Zoom, Google meet, Facebook, YouTube, and Skype etc. There
are WhatsApp groups of guardians, teachers, students and parents for affective communication through
which they are always in touch to share their difficulties through this e-medium. In a nation like China
that practices a considerably more centralization system, a change to digital learning may be simpler.
Even in a nation like the U.S.A, there are some low pay students who don’t approach broad bands and
unable to use computerized learning arrangement (Study Abroad Life). The same is the situation that
happens with India where not every student is well equipped with the high-speed internet and digital

gadgets and are along these lines of suffer. Numerous advanced educational institutions in India are not
also equipped with digital facilities right now to cope up with sudden change from traditional education
set up to the online education system. (Covid-19 Educational Disruption and Response, 2020)
(UNESCO, 2020)

1.3 Justification of the Topic
The present research report is focusing on quantifying the impact of Covid-19 on Education, which
helps to understand is online teaching mode effective in providing knowledge to students or not in the
pandemic. The primary data on the field is collected through questionnaire and responses are analyses
on percentage basis.

CHAPTER-2
REVIEW OF LITERATURE
2.1 International Reviews
2.1.1 Online Distance Learning versus Face-to-Face Comparative Studies
A large number of studies, before pandemic, compared face-to-face with online distance courses in
terms of university student performance, as well as many other academic and demographic variables of
students. For example, Soesmanto and Bonner evaluated a dual mode design in which students of year
one of a business school at the Griffith University in Australia have the option to undertake the same
statistics course in a face-to-face mode and/or an online mode. The comparative analysis suggested no
significant differences in learning satisfaction and academic performance of the two cohorts within the
dual mode system. In a similar study done in California State University, Tan suggested that, with
proper training and support of technology, university instructors are delivering both the on-ground and
online sections of a business technology course with the same effectiveness as measured by students’
grade points.
For a different type of courses, Lorenzo-Alvarez et al. found that a radiology course taught online at a
university in Australia resulted in similar academic outcomes to F2F learning. In their online vs. face-
to-face comparative study, Cavanaugh and Jacquemin compared grade-based learning outcomes
between online and face-to-face course taught at Ohio University, using a large dataset of 5,000 courses
taught by over 100 faculty members over a period of ten academic terms at a large, public, four-year
university. Given the large scale of the study, the results suggest no difference in grade-based student
performance between instructional modes for courses where both modes are applicable. According to
the regression analysis of the study, the primary influence on individual course grades was student GPA.
Students with higher GPAs performed better in online courses, and students with lower GPAs
performed worse when taking courses in an online format compared to a face-to-face format.
Nyer investigated effective ways of quickly offering an online lecture in a course that is otherwise
taught using traditional face-to-face lectures at Chapman University in California. The study compared

student learning outcomes (using test scores) across three modes of delivering lectures: using a
traditional face-to-face lecture, using online instruction where the lecture was delivered using a video
recording of the classroom lecture, and using online instruction where the lecture was delivered using
a static document created from an edited transcript of the classroom lecture embedded with charts,
graphs, etc. The results showed that quickly created online instruction methods scored lower in
engagement compared to the traditional face-to-face lecture. Students who were exposed to the online
lecture delivered using a static document and students attending the face-to-face lecture both reported
having higher quality of notes compared to students exposed to the video recording. Finally, the effect
of the different instructional material on student test scores was found to be mediated by student
engagement and perceived note quality.
2.1.2 Online Distance Learning and the COVID-19 Lockdown
The research of Bozkurt et al. is one of the early studies reporting the impact of the interruption
of education due to COVID-19 pandemic in 31 countries. In addition to the assessment of each
case by country, the study highlighted major themes that have commonly arisen in these
countries from the interruption of education during COVID-19, such as the inequity and the
digital divide which have been aggravated during the pandemic, the need for alternative
assessment and evaluation methods and the needed switch to formative assessments through
both synchronous and asynchronous means, and the use of online proctoring services as a way
to control for cheating and academic dishonesty.
The research by Hjelsvold et al. is also one of the first studies which investigated educators’
feedback on the distance learning during the COVID-19 lockdown, as a result of a survey
conducted on 303 university students and 56 educators in Norway. The study reported that
short time and lack of ready resources were important barriers to sudden shift to distant
learning. Even though learners and educators report a lack of practice in online education, the
study declared that they both adapted fast, showing a positive attitude towards the change.
According to the results of the survey, key factors affect the online experience during the first
weeks of distance learning, and these are as follows: from learners’ side: feedback to
instructors, engagement in discussion forums, use of online tutorials, and participation in group
work; from educators’ side: timely communication and clear instructions about formative and
summative assessments, exams, quizzes and assignments, informing learners of how to get
help, providing support using synchronous and asynchronous tools, ensuring virtual place for
students-to-students and students-to-instructor online interaction, and giving advice to students

to set their study place and schedule for an effective study-at-home experience; from leaders
and administrators’ side: timely communication with students especially with exam regulations
and petitions, supporting learners in preparing new pedagogical approaches to teaching as well
as learning new tools, and providing a more collective approach to the coordination of activities
and collaboration between educators.
2.1.3 Distant Learning and Higher Education Plans in Egypt after COVID-19
Egypt has the largest education system in the Middle East and North Africa region with 52,000
schools, accommodating 20 million school students, and 44 universities with 830 higher
education institutions, accommodating 3 million higher education students. In March 2020, the
Egyptian government made a set of immediate precautionary decisions to confront the dangers
of the emerging Corona virus, the most important of which was the closure of all schools,
universities, and higher education institutions. The Egyptian Ministry of Higher Education and
Scientific Research, to ensure the continuation of the educational process, urged higher
education institutions to apply distance education as a modality during the lockdown.
In May 2020, four nation-wide surveys were administered to assess the Egyptian experience of distance
education in Egyptian universities and higher institutes, to measure the satisfaction of educational
leaders, professors, administrators, and students, and to set an integrated vision of the future of distance
learning in higher education in Egypt. The data collection was based on the crowdsourcing approach,
whereby surveys were placed on various portals. A total of 106,897 participants filled the survey: 1,041
educational leaders, 11,100 faculty members, 1,258 administrative staff, 89,867 Egyptian students, and
3,631 international students.
The results of the four surveys included the following: the majority of educational leaders endorsed
online distant learning in higher education; Internet connectivity and weak IT skills are the most
prominent difficulties of distance education in Egypt; and recorded lectures are the most plausible ways
to deliver educational materials [16]. Based on the recommendations of these nation-wide surveys, the
government of Egypt decided to integrate face-to-face with online distant learning in all future higher
education plans. This plan for merging on-campus and online distant learning will not only put the
Egyptian universities in a state of movement for any urgent conditions such as COVID-19, but most
importantly achieve vital educational objectives, such as reducing student density, making the best use
of the expertise of professors and technological infrastructure of universities, and making a gradual
transformation of students to lifelong learners.

This study investigates the overall learning experience after the sudden shift from face-to-face to online
distance learning due to COVID-19 lockdown at one of the universities in Egypt. Since Egypt decided
to integrate online distant learning into all future higher education plans, the main aim of this study is
to provide recommendations for future application of this mode of learning in the Egyptian higher
education institutions. The main research question of the current study is to determine if there was a
statistically significant difference in terms of academic performance between face-to-face learners of
an undergraduate course taught on-campus in Spring 2019 and learners who completed the same course
but fully online via long distance learning during the COVID-19 lockdown in spring 2020 semester.
The study also assesses professors’ feedback and students’ satisfaction concerning the online distance
learning experience during the lockdown.
2.2 National Reviews
2.2.1 Cancellation of Exams
In India, all academic activities were suspended after the announcement of the University Grants
Commission (UGC) on 19 March to postpone examinations in all universities until the end of March.
All the central universities like the University of Hyderabad announced to defer all academic activities
and close their hostels, and even private universities the SRM Institute of Science and Technology and
VIT, Vellore declared the summer vacation for students (Crawford et al., 2020).
2.2.2 Change in online teaching for upliftment
An Indian national newspaper, The Hindu (April 14, 2020 ) reports that during the most significant
months of February to April, which includes activities around the curriculum and assessments, around
60 million students around the world are restricted to home. Both students and teachers are under the
pressure of not losing the academic time and are trying to re-design the teaching-learning techniques
by changing it to an online mode, which is the only possible alternative at the moment (The Hindu,
April 14, 2020). However, the bigger question is why the online mode of teaching-learning has not been

adopted (by replacing the face-to-face mode of teaching-learning) before the pandemic when other
activities or industries have changed from offline mode to online? The Hindu (April 14, 2020) states
that online learning is an amalgamation of various pedagogical models instead of anyone single model
as it is a specialized learning science that includes delivery of content, behavioural analytics, learning
psychology and assessments. This enables to measure the learning progress of individuals and therefore,
having a ‘hand-stitched’ mechanism of delivery is the need of the hour. Through interactions and
discussion in the face-to-face classes, the teachers get an idea of the prior knowledge and the collective
ability of the students based on which they can customize the teaching-learning techniques and lesson
plans. However, this becomes difficult in the digital platform. The focus is not on delivering the content
but ensuring effective opportunities for learning. The shift is, thus, from a teacher-centric approach to
a learner-centric one. The aim is always to impact learners in such a manner that they are able to
understand concepts better, think effectively and apply them practically. Thus, it becomes extremely
essential for facilitators to further orient themselves to become efficient disseminators of knowledge on
digital platforms.
2.2.3 Difficulties to opt for online Teaching
According to the Key Indicators of Household Social Consumption on Education in India report, based
on the 2017-18 National Sample Survey, less than 15% of rural Indian households have Internet (as
opposed to 42% urban Indian households). A mere 13% of people surveyed (aged above five) in rural
areas — just 8.5% of females — could use the Internet. The poorest households cannot afford a
smartphone or a computer The Indian Express (June 8, 2020).
The digital divide has not only led to the exclusion of students from poor and m arginalized backgrounds
from digital learning but also pushed many underprivileged students towards depression and death. For
instance, In the Indian state of Kerala, a 14-girl committed suicide as she was unable to join online
classes The Hindu (June 11, 2020). A 16-year-old boy (class 10 student), from a very poor family, took
his life because he did not have a smartphone to attend online classes and examinations organized by
his school in the Chirang district of Assam in India (The Hindustan Times, June 24, 2020).

CHAPTER – 3
RESEARCH METHODOLOGY
3.1 Objectives of the Study

1. To find impact pandemic on education sector.
2. Finding strategies to counter impact of pandemic in this sector
3.2 Scope of the Study
3.2.1 The purview of the study is to analyse the impact of pandemic on education sector.
3.2.2 For analysis primary data is collected through the means of questionnaire and analysed and
based on that results are been stated.
3.2.3 The standard population size of people of age group between 19-35 years is taken.
3.2.4 The duration of the study is of 2 months.
Topics discussed under this study are:
• Enlightenment of various measures taken by Govt. of India for education sector during
this Pandemic.
• Highlights of various measures taken by Govt. of India for education sector during this
Pandemic.
• Enlisting of some negative impacts of COVID-19 and some effective suggestions for
continuing education during the pandemic situation.
3.3 Data Collection
For conducting this research, primary data was collected through the means of questionnaire.
Data collection done through this has been analysed and method use to interpret the data is percentage
method of data collection.

The data collected here is from different working age groups in the education sector to understand its
impact better.
3.4 Limitation of the Study
1) The main limitation for this study was due to pandemic that struck all over the world. Due to the
social distancing norms and prevention methods, the data which could have been collected in person
more accurately was all collected online.
2) Data collected under the “maybe” or “other” section in the questionnaire was interpreted in a manner
which helped the study and could be interpreted differently.
3) The sample size is only confined to 36 people of Bhopal.

CHAPTER – 4
DATA INTERPRETATION AND ANALYSIS
4.1 Data Representation and Interpretation
The data collection was done through a structured questionnaire. The designed questionnaire had two
parts.
• The first part focused on the data related to demographic characteristics of the respondents: this
covered gender, age, education.
• The second part of the questionnaire measures the model variables.
4.1.1 A total of 36 respondents were collected in this study and the gender classification was as under:

• From the above pie-chart it is clearly visible that males are more than females i.e. 55.6% in the total respondents.
4.1.2 The Age and Qualification of the respondents us shown under via pie charts:

• It is clear from the information given in this pie chart that the most popular age range taking this survey was “Under 20” years old comprising of 52.8% of the total respondents, the other ranges did take the survey however “Under 20” was by far the most popular category, this shows the age range in which the Impact of pandemic on Education in this survey applies to.

• The maximum no. of qualification of people lie in the “Under-Graduate” section , 47.2% while “High School”, “Post-Graduate” and “Other” qualification of people are close to each other in group.

4.1.3 Following are the model variable collected in this survey for the study:
• Most of the people in the survey conducted were familiar with the concept of online classes i.e. 75% while the rest 25% were all new to this online teaching system.

• Most of the people had facilities like mobile phone or laptop for joining online classes i.e. 86.1% while the other 13.9% troubled getting any means to have facilities to attend online classes.

• It is to pay emphasis that the 47.2% of the people say that workload has been significantly been smaller or reduced during the pandemic because of online classes and online submission of assignments which is much easier for the students to submit, while people also state that the workload has been same i.e. 33.3% of the group while the rest 19.4% face to be greater due to inaccessibility of online submission materials.

• Here 55.6% people have Completely different experience as they have never been into online mode of teaching
• 19.4% people find online teaching to be similar with offline as they have been thorough with the concept of it.
• While 25% people found it to have a slightly different experience.

• There is no clear justification of are people happy or satisfied with current online classes as freedom and personal teaching in onsite lectures or comfort and efficient time utilisation may be the factor.

• From the given information in this pie chart it is not really obvious what people prefer as to going back to onsite classes, however it can be seen that most people are in the dilemma as to what to choose.

CHAPTER – 5
RESULTS AND DISCUSSION
5.1 Major Findings
Basic statistical methods are applied for data analysis, like frequency and percentages of replies in
favour and against online education to understand how Covid -19 has affected education. After
evaluating, organizing, tabulation and interpreting data, the conclusions are carried away. Roughly,
55.6% people have completely different experience in online classes as they have never been into online
mode of teaching, according to 25% it was similar to offline mode and 19.4% told that they had a
slightly different experience. While roughly 41.7% of the total respondents are not sure whether they
are happy or not of the current concept of online classes, the other 33.3% feel it much better than offline
classes and the rest 25% are not happy with this concept. By this it can be drawn out that, most
respondents face completely different experience and they are not even sure of going back to offline
mode as both way of teaching i.e. online and offline has their own pros and cons.
5.2 Discussions and Suggestions
• India should develop creative strategies to ensure that all children must have sustainable access
to learning during pandemic Covid-19. The Indian policies must include various individuals
from diverse backgrounds including remote regions, marginalised and minority groups for
effective delivery.
• Immediate measures are required to lessen the effects of the pandemic on job offers, internship
programs, and research projects.
• Many online learning platforms offer multiple programmes on the same subjects with different
levels of certifications, methodology and assessment parameters. So, the quality of programmes
may differ across different online learning platforms. Therefore, establishment of quality
assurance mechanisms and quality benchmark for online learning programmes must be
developed and offered by Higher Education Institutions (HEIs) in India keeping in view of
rapid growth of the online learning platforms.
• Across the globe, Indian traditional knowledge is well known for its scientific innovations,
values and benefits to develop sustainable technologies and medicines and this knowledge

systems in different fields should be integrated with a present-day mainstream higher education
system.
• Govt and educational institutes should plan to continue the educational activities maintaining
social distancing. 30-40% students and teachers may attend schools/colleges in two shifts per
day to carry on educational activities by obeying guidelines for Covid-19.
• At current times, access to technology and internet is an urgent requirement. So, the digital
capabilities and the required infrastructure must reach to the remotest and poorest communities
to facilitate the students to continue their education during the pandemics. There is a need to
deploy public funds to fix the internet gap and ensure that students continue to learn digitally.
The state governments/private organisations should come up with ideas to address this issue of
digital education.
• Some significant issues associated with distance learning strategies like the availability and
access to digital devices with internet connectivity, the need for safe learning spaces, creating
capabilities for teachers, families and students to operate and navigate digital devices, and
engaging lesson plans for disabled students and other marginalised groups should be addressed
by Govt. and the stakeholders.
5.3 Conclusion
COVID-19 has impacted immensely to the education sector of India. Though it has created many
challenges, various opportunities are also evolved. The Indian Govt. and different stakeholders of
education have explored the possibility of Open and Distance learning (ODL) by adopting different
digital technologies to cope up with the present crisis of COVID-19. India is not fully equipped to make
education reach all corners of the nation via digital platforms. The students who aren’t privileged like
the others will suffer due to the present choice of digital platforms. But universities and the government
of India are relentlessly trying to come up with a solution to resolve this problem. The priority should
be to utilise digital technology to create an advantageous position for millions of young students in
India. It is need of the hour for the educational institutions to strengthen their knowledge and
Information Technology infrastructure to be ready for facing COVID-19 like situations. Even if the
COVID-19 crisis stretches longer, there is an urgent need to take efforts on maximum utilisation of
online platforms so that students not only complete their degree in this academic year but also to get
ready for the future digital oriented environment. The concept of “work from home” has greater
relevance in such pandemic situation to reduce spread of COVID-19. India should develop creative
strategies to ensure that all children must have sustainable access to learning during pandemic COVID-
19. The Indian policies must include various individuals from diverse backgrounds including remote
regions, marginalised and minority groups for effective delivery of education. As online practice is

benefitting the students immensely, it should be continued after the lockdown. Further detailed
statistical study may be undertaken to explore the impact of COVID-19 on education system of India.
BIBLIOGRAPHY
(April 14, 2020 ). The Hindu.
Covid-19 Educational Disruption and Response. (2020). Wikipedia.
(June 11, 2020). The Hindu.
(June 8, 2020). The Indian Express.
The Hindustan Times. (June 24, 2020).
UNESCO. (2020). Covid-19 Educational Disruption and Response.
ANNEXURE1. Copy of blank Questionnaire:
Personal Details –
• Name:
• Mobile Number:
• Address: ________________________________________________________________
• Occupation:

• Age:
Please select an appropriate option for the asked question
1) Were you familiar with the concept of online Classes?
• Yes
• No
2) Did you had the proper facilities to join the online classes?
• Yes
• No
3) On average, compared to the workload before on-site classes were cancelled, would you say that your study workload over the last year has been?
• Smaller.
• The same.
• Larger
4) How was the teaching/learning experience compared to before?
• Completely Different
• Similar
• Slightly Different
5) Are you happy with the current Concept of Online Classes?
• Yes
• No
• Maybe
6) Are you willing to take proper precautionary methods and try to go back to onsite Classes?
• Yes
• No
• Maybe
7) According to you, how did Covid 19 affected your Studies?
________________________________________________________________


Future of Electric Vehicles in Indian Markets
Research Project Submitted in Partial Fulfillment
Of
the Degree of BCOM Honors
By Akshat Shrivastava to the
DEPARTMENT OF COMMERCE
BHOPAL SCHOOL OF SOCIAL SCIENCES
April 2021
Guided by:-
Dr Smitha Pillai
Associate Professor
Department of Commerce
DECLARATION
I hereby declare that this project report entitled “Future of Electric Vehicles in Indian Markets“ was carried out by me for the degree of BCOM (Honors) under the guidance and supervision of Dr Smitha Pillai of Department of Commerce, BSSS College. The interpretations put forth are based on my reading and understanding of the original texts and they are not published anywhere in any form. The other books, articles and websites, which I have made use of are acknowledged at the respective place in the text. This research report is not submitted for any other degree or diploma in any other University.
Place: Bhopal
Name of the Student: Akshat Shrivastava
Class & Section: BCOM {Honors} – 3 'A'
Date: April 2021

CERTIFICATE
It is certified that the work contained in the project report titled “Future of Electric Vehicles in Indian Markets” by “Akshat Shrivastava” has been carried out under my/our supervision and that this work has not been submitted elsewhere for a degree.
Signature of Supervisor: …………….
Name : Dr Smitha Pillai, Associate Professor
Department : Commerce
Bhopal School of Social Sciences
April, 2021

ACKNOWLEDGEMENT
I would like to thank our Principal Dr. Fr. John P.J. and Vice Principal Dr Sr Sonia Kurien for their immense support and blessings. I thank our HOD Dr Amit Kumar Nag for his support. I would like to express my special thanks of gratitude to my research guide Dr. Smitha Pillai, Associate Professor of Department of Commerce for her valuable suggestions and guidance and for giving me the golden opportunity to do this wonderful research project on the topic: Future of Electric Vehicles in Indian Markets, without her help it would have been difficult for me to have reached this state of completion of my project report. Also, I would like to thank my parents and friends who helped me a lot in the preparation of this project.

Contents
• Declaration
• Certificate
• Acknowledgement
• Chapter 1: Introduction of the Topic
• 1.1 Rationale of the Study
• 1.2 Introduction to the industry
• 1.3 Introduction to the company
• 1.4 Justification of the topic
• Chapter 2: Review of Literature
• Chapter 3: Research Methodology
• 3.1 Objectives of the Study
• 3.2 Research Hypothesis
• 3.3 Scope of the Study
• 3.4 Data collection
• 3.5 Limitations of the study
• Chapter 4 : Data representation & Analysis
• 4.1 Data representation & Interpretation
• 4.2 Hypothesis Testing
• Chapter 5. Results & Discussion
• 5.1 Major Findings
• 5.2 Discussions & Suggestions
• 5.3 Conclusion
• Copy of questionnaire
• Reference

1. INTRODUCTION
1.1 Rationale of Study
Electric Vehicles are those vehicles that uses one or more electric motors for propulsion. These vehicles are generally self-contained i.e. they use batteries as their energy source. Electric vehicles first came into existence at around mid-19th century and since then we have been in a race to develop these more.
India being an economy of around 130 crore people, our daily activities cannot be imagined without the use of vehicles. There has been a duopoly of petrol and diesel as our main source of fuel for the vehicles. This not only causes air pollution, but is also hard on our pockets. Petrol prices hiking as much as up to 98 rupees liter, we are eagerly looking for a substitute.
Commonly, the term EV is used to refer to an electric car. In the 21st century, EVs have seen a resurgence due to technological developments, and an increased focus on renewable energy and the potential reduction of transportation's impact on climate change and other environmental issues. Project Drawdown describes electric vehicles as one of the 100 best contemporary solutions for addressing climate change.
The main reason for taking up this topic for research is to make people more aware about the
Electrical vehicle Industry and it’s comparison with the fuel operated vehicles so that people are
made aware about the benefits of eco-friendly vehicles that go an extra mile to look out for
environment.
1.2 Introduction to the industry
Government incentives to increase adoption were first introduced in the late 2000s, including in the United States and the European Union, leading to a growing market for the vehicles in the 2010s. Increasing public interest and awareness and structural incentives, such as those being built into the green recovery from the COVID-19 pandemic, is expected to greatly increase the electric vehicle market. A pre-COVID 2019 analysis projected that Electric vehicles are expected to increase from 2% of global share in 2016 to 22% in 2030. Much of this market growth is expected

in markets like North America and Europe; a 2020 literature review suggested that growth in use of electric vehicles, especially electric personal vehicles, currently appears economically unlikely in developing economies.
As of yet, 50% of the EV's belong in china and rest is in North America and European countries and India lacks behind by a wider margin in this field.
A giant in the industry of electric vehicles, Tesla, has recently shown interest in introducing their vehicles in India as well.
Tata Nexon , MG gloster are some popular electric vehicles these days
Electric motive power started in 1827, when Hungarian priest Ányos Jedlik built the first crude but viable electric motor, provided with stator, rotor and commutator; the next year, he used it to power a tiny car. In 1835, professor Sibrandus Stratingh of the University of Groningen, the Netherlands, built a small-scale electric car, and between 1832 and 1839 (the exact year is uncertain), Robert Anderson of Scotland invented the first crude electric carriage, powered by non-rechargeable primary cells. American blacksmith and inventor Thomas Davenport built a toy electric locomotive, powered by a primitive electric motor, in 1835. In 1838, a Scotsman named Robert Davidson built an electric locomotive that attained a speed of four miles per hour (6 km/h). In England a patent was granted in 1840 for the use of rails as conductors of electric current, and similar American patents were issued to Lilley and Colten in 1847.

The first mass-produced electric vehicles appeared in America in the early 1900s. In 1902, the Studebaker Automobile Company entered the automotive business with electric vehicles, though it also entered the gasoline vehicles market in 1904. However, with the advent of cheap assembly line cars by Ford, the popularity of electric cars declined significantly.
Due to the limitations of storage batteries at that time, electric cars did not gain much popularity; however, electric trains gained immense popularity due to their economies and achievable speeds. By the 20th century, electric rail transport became commonplace due to advances in the development of electric locomotives. Over time their general-purpose commercial use reduced to specialist roles as platform trucks, forklift trucks, ambulances, tow tractors and urban delivery vehicles, such as the iconic British milk float; for most of the 20th century, the UK was the world's largest user of electric road vehicles.
Electrified trains were used for coal transport, as the motors did not use precious oxygen in the mines. Switzerland's lack of natural fossil resources forced the rapid electrification of their rail network. One of the earliest rechargeable batteries – the nickel-iron battery – was favored by Edison for use in electric cars.
EVs were among the earliest automobiles, and before the preeminence of light, powerful internal combustion engines, electric automobiles held many vehicle land speed and distance records in the early 1900s. They were produced by Baker Electric, Columbia Electric, Detroit Electric, and others, and at one point in history out-sold gasoline-powered vehicles. In 1900, 28 percent of the cars on the road in the US were electric. EVs were so popular that even President Woodrow Wilson and his secret service agents toured Washington, D.C. in their Milburn Electrics, which covered 60–70 mi (100–110 km) per charge.
Types of Electric Vehicles
There are two main types of electric vehicles (EVs), defined by the degree that electricity is used as their energy source.
1. Battery Electric Vehicles (BEVs)

BEVs are fully electric vehicles, meaning they are only powered by electricity and do not have a petrol engine.
BEVs are quiet, cost-efficient to run and eco-friendly, but are more expensive to buy than a comparable petrol fueled car. However, when the total cost of ownership over the time you’re likely to own the car is considered, EVs compare quite favorably, and may even cost less overall.
2. Plug-in Hybrid Electric Vehicles (PHEVs)
This type of EV is powered by both petrol and electricity. The amount of driving that can be done in ‘electric’ mode depends on the capacity of the battery.
The advantage of PHEVs over BEVs is that if you can’t get to a charging point, you can keep driving using fuel alone. The downsides are that the car needs two systems – fuel and electric – so maintenance costs can be higher than for a BEV. Also, once your relatively small battery runs flat, you lose the financial and environmental benefits of an EV until you recharge.
1.3 Company Selected for research
Mahindra Electric
Mahindra Electric is the first major EV manufacturer in India. Mahindra Electric Mobility Limited, formerly known as the Reva Electric Car Company, is an Indian company based in Bangalore, involved in designing and manufacturing of compact electric vehicles. Mahindra Electric started their journey in to the EV space in 2001 by launching Mahindra Reva, India’s first electric car. They subsequently launched Mahindra E20, the current version on roads in India. Some key features of this firm are: • The first and pioneer in the Electric Vehicles in India • The company is selling around 180-200 units per month across India in all models. • Recently, launched a new EV model, eVerito and expecting sales of 350-400 per month • Mahindra has a dedicated R&D centre in Bengaluru where over 200 engineers are working on e-vehicle technology and refinements. • Since 2010, Mahindra electric has 7000+ customers under EV segment and has completed over 50 million miles of Electric vehicle driving in India • Mahindra Electric has partnered with a Corporate Fleet firm - Lithium and provides Electric Corporate fleet services in Bengaluru. • Partnered with OLA to launch 300 EVs in Nagpur
• It has participated in the EESL and has supplied over 150 eVerito in the first EV tender in India • Partnered with NTPC to launch charging stations in Noida and Delhi

• The company is boosting capacity at its Bengaluru facility to make battery packs from 500 per month to 800 -1000 per month in the next two to three months. (two facilities can assemble 5,000 battery packs per month)
• All the EVs have a battery packed by Mahindra, while importing cells from China – typically a battery of 48Volts (or 76 volts) will have about 16 cells and each cell would have 3 modules
• It has tied up with Zoom Car to sell 200 cars (e2o Plus) • They are planning to increase the production capacity that can help them to sell over
5000 units per month over the next 2 years in all category vehicles • Currently they are in discussion with all the fleet operators as most traction in future will
come from commercial operators

1.4 Justification of the study
Mahindra Electric Mobility is the pioneer of electric vehicle technology in the country. Their mission is to bring tomorrow’s movement, today. They have a wide variety of electric vehicles, and will be increasing this range even further, under the brand - Mahindra Electric. Their products span personal and commercial segments and are designed to support the new paradigm of shared, electric and connected mobility.
• Their vision is to become a leading brand in providing customized electric mobility experiences through cutting edge technology.
• In view of this, they have created a comprehensive roadmap to establish a robust EV ecosystem by investing in next generation technology solutions and globally competitive products, to drive adoption of sustainable mobility.
• EV 2.0 will see the company make investments to ramp up manufacturing and to develop new, high-end electric powertrains, motor controllers, systems integration and battery technology. The next generation of EVs will now deliver longer range, higher speeds and futuristic connected car technologies to enable contemporary mobility solutions.
• They are actively engaging with ecosystem stakeholders, both private and public, to drive faster adoption of electric vehicles and ensure a progressive and greener future in the mobility system of the country, together.

2 Review of Literature
Extensive literature searching has been done before and during the work process, mainly on the
websites such as Times of India, Niti Ayog, Mahindra Electric, Department of Heavy Industry,
etc. When Internet has been used for literature searching Google has been the main search engine.
The search for suitable information has been time-consuming since the quality of the information
varies and the hits have been numerous. Therefore, an important part of the work of finding
information has been to separate essential information from unessential.
The literature in this thesis is considered to fulfil the requirements of high reliability.
A huge quantity of academic literature addresses the topic of Future of Electric Vehicles in Indian
Markets. Various Government policies have been criticized to look at positive as well as negative
aspects through high intellectual research methods. The behavior of consumer has been analyzed
and evaluated through various procedures and research work.
3 Research Methodology
3.1OBJECTIVES OF THE PROJECT:
❖ To get an insight knowledge about future of Electric Vehicles in Indian Markets
❖ Understanding the different aspects of the Electric Vehicle Industry and its working
❖ To know the behavior of customers towards the Electrification of the vehicles.
❖ To analyze the comparative study between Electric and fuel operated vehicles.

❖ To gain knowledge about the various policies launched by government towards Electrification of the Vehicles.
3.2 Research Hypothesis
Null Hypotheses:
1. The decision to switch a vehicle from petrol and diesel vehicles to Electric Vehicles is not depends on one’s knowledge and awareness about the pollution caused by fuel emissions.
2. Ability to switch to Electric vehicles is not depends on the income of a consumer as one looks for a mid-range vehicle but EV’s cost a tad higher on the costing spectrum.
3.3 Scope of Study
Shifting modes of mobility could launch new business opportunities. These would emerge in areas such as charging and swapping infrastructure, service, or integrated transport. In India, energy players have entered the mobility industry, while some traditional power companies are exploring possibilities in charging infrastructure, and infrastructure companies are seen entering the battery business. An important task that needs attention is transforming and up-scaling small and medium sub-system and auto-component industries. A large number of such mini-micro industries are auto-ancillary companies for diesel/petrol vehicles. They provide large number of jobs. Many of them will not survive as EV replaces petrol/diesel vehicles. A careful plan to hand-hold such industries and help them during the transition to EV components manufacturing is required.
Expansion of transport fleets based on IC engines negatively impact the economy considerably, apart from their negative health contributions. Crude oil price volatility adds uncertainty to an already burgeoning import bill, while also needing huge investments in oil refineries and related distribution infrastructure. There are several studies that suggest overall positive impact on GDP on introduction of EVs in fuel importing service dominated economies. One study has estimated that driving the shift to electric vehicles would lead to a 1% increase in EU GDP. In another study, net private and social benefits are estimated between $300 and $400 per EV. Coupled with generation of renewable power, the battery manufacturing industry in India can become bigger than the total amount spent on import of crude oil. This would provide a huge boost to the Indian

economy. The revenue loss for governments from the taxes on the oil sector is expected to be replaced by higher tax revenues in other economic sectors.
IMPACT ON EMPLOYMENT
European Climate Foundation has estimated that through reducing oil demand by more efficient electric cars, employment will increase by 5,00,000 to 8,50,000 by 2030. Another report estimates that about 2 million additional jobs will be created by EVs by 2050. The report further adds that oil production and distribution has very low employment intensity of just four jobs per million Euros value added compared to 24 jobs per million Euros in the general economy. Therefore, any shift in expenditure from buying imported oil to other expenditure choices would generate additional employment. Further, as imported oil is replaced by electricity and batteries, large employment is possible in enhancing power-generation and distribution, and in battery manufacturing, including battery-recycling.
As far as the automotive sector is concerned, a large part of the supply chain will get transformed in the power train segment. Traditional suppliers will move from supplying parts such as exhaust pipes and ICEs to perhaps battery materials, electric motors, and regenerative braking systems. EVs will create opportunities in durable and lightweight thermoplastics, higher demand for electricity, storage and many others. The net impact on employment would perhaps be balanced out. In addition, EV battery charging and swapping would create a large number of jobs throughout the country
IMPACT ON ENVIRONMENT AND HEALTH
ICEs are one of the main sources of air pollution globally. They negatively affect both human health and ecology. Emissions from ICE powered motor vehicles are responsible for about two-thirds of air pollution in urban areas. The current ban on older fuel cars in some Indian cities already shows a positive influence on air quality, and this can only further improve with the large scale introduction of EVs.
LAST-MILE CONNECTIVITY AND RURAL TRANSPORT

Some Indian cities today have metros as public transport and others have bus services. Many other cities and most towns do not have either. The last-mile connectivity in cities which have metros/buses is provided by rickshaws/autos. In cities and towns which do not have metros or buses, the only public transport available are rickshaws and autos. Early conversion of these vehicles to electric vehicles using Lithium-ion batteries will provide clean transport to a large number of people.
Today the primary transport for villages, taking people to bus-stops on the highways or train-stations, is ICE three-wheelers. It is possible to quickly convert them to electric, providing clean transport in villages. Further, battery-charging and swapping outlets may be operated in larger villages, creating jobs in rural areas. Specifications must ensure that these vehicles do not pose an inconvenience to other users of public roads and highways.
Freight movement in the rural areas, and for transport connecting farms to cities, are primarily handled by smaller transport vehicles (like rickshaws, autos and tempos). These vehicles are eminently suited for replacement by EVs. Sustainable mobility would require that small freight vehicles are enabled by aggregators to be made available on request, just as Uber or Ola cabs for city commuters. This would cut farm to market costs for the farmers, and also result in better fleet utilization. The electronic platforms to enable such operations need to be developed.
Market behavior towards electrification of vehicles
Electric vehicles will incite crucial changes in the Indian automobile market, and their growing
adoption will lead to more futuristic business models. The global environment seems to favour
electric vehicles, and with time the world seems to be getting serious about them. A large number
of EVs are selling across the globe, and even though China, the US, and Europe are contributing
to a significant chunk of the sales, industry leaders consider India to be a promising player with a
receptive market.
EVs operate at a fundamentally lower cost, and in the last few years, the trends suggest that there
has been a steady interest among the Indian masses for electric cars as well as two-wheelers.

Understanding Consumer Behaviour
Buying a vehicle is a time-consuming process with various internal and external factors
influencing the decision. Particularly in India, the decision-making process is particularly
complicated as the buyers often face an information overload. Market research indicates that
female automobile buyers consider features such as safety, affordability, and efficiency, whereas
male buyers focus on performance, features, and aesthetics such as interiors and style. Also, male
audiences express more interest in electric vehicles.
Viability
In a consumer-based market, the viability of the E.V. industry is affected by factors like incentives
on scrapping used vehicles, favourable government policies, and reducing GST. Consumers also
believe that E.V. manufacturers need a more proactive marketing approach rather than playing
safe.
Fuel Efficiency
Because petrol and diesel prices are always on the rise, consumers are keenly interested in how
much would they save by switching to an electric vehicle from an ICE vehicle. Marketing an
estimated long-term fuel savings are the key to a consumer’s heart.
Technology

Most electric vehicle buyers are early adopters of innovation, green technology, and take pride in
being an environmental ambassador. Consumers applaud EVs as an environment-friendly
technology and are enthusiastic about switching to vehicles that will have zero emissions.
Driving Demand
To understand the factors that drive demand, we first need to know how consumers make
decisions. Even though industry leaders consider EVs to be a promising option for Indian
audiences, just price incentives alone are not enough to drive the demand.
We need to consider the massive impact of charging infrastructure that will be felt in metropolitan
cities, particularly since the pollution levels have reached disastrously high. Close cooperation
among manufacturers, dealers, government, and marketers will also lead to a more progressive
adoption of electric vehicles, mainly if EVs are pushed in the commercial and public transport
segments.
The modern generation runs on innovation, sustainability, and environmental conservation – and
electric vehicles fit the bill perfectly. The indigenous availability of vehicles, batteries, and spare
parts will also impact the consumer mindset.
EVs are definitely the future!
We are at a critical crossroads where electric vehicles and the decisions taken by key players will
shape the future of transportation either for better or for worse. Now is the time, auto experts will
look back to as a stepping stone to a brighter future for not just electric vehicles, but for the auto

industry as a whole. This phase is the beginning of a steady climb to a more extensive electric-
vehicle adoption.
The market and consumer sentiments toward electric vehicles are principally positive. The
consumer mindset is evolving, which will ultimately lead to healthy growth for the electric
vehicles. It is being said that EVs will become mainstream in less than a decade and can be taken
as a sign of markets being aggressively ready for a product launch and marketing by automobile
companies.
Backbone of Electrification of vehicles: Charging Stations
The rate at which electric vehicles (EV) can be charged is becoming a key differentiator in this rapidly developing market, for a very straightforward reason: charging an EV’s battery is currently a lot slower than refilling a tank with petrol to go the same distance.

Take a generic EV with a battery capacity of 60kWh. Charging this battery from zero to 100%, using a cable plugged in to a standard UK 240V, 13A socket, will take about 20 hours. This isn’t practical for a daily driver, much less for a long-distance traveller.
In practice, most EV owners rely on dedicated chargers, often wired in at home to higher-current ring mains. UK energy supplier E-On, for example, will wire a 7.4kW wall-mounted charger, with either a tethered charging cable or a universal socket for a charging cable, into a 32A ring main. With this charger, our generic 60kWh EV can be charged in more like eight and a half hours.
A widespread, accessible public charging infrastructure network is needed to support a robust Indian EV market. And a healthy ratio between the number of EVs to charging stations is important to encourage early adopters and relieve drivers of range anxiety. A technical committee (part of the state-level EV Steering Committee) recently met in Hyderabad to discuss including provisions to the existing building codes and government regulations to set up charging infrastructure in buildings in Telangana. Administrative Staff College of India (ASCI) and NRDC presented on how to regulate the EV policy and make it easier for the charging service providers and manufacturers to operate. There are a number of considerations when it comes to location and siting, the more specific position within a location, for EV charging stations. These include economics and utilization, maintenance, charger type, and interoperability.
Industry Structure in India Existing suppliers
• ~15 firms currently supplying EV Chargers in India
• Only 3 firms in 4W, AC Chargers so far in India
• 4 Wheelers – AC Chargers - RRT Electro Power, Chennai; Mass Tech Controls, Mumbai; Exicom, New Delhi
• These are mostly Power Electronics & Battery Charger manufacturers who have diversified into EV Chargers
• 10-12 firms in small 2W AC Chargers who supply along with their vehicles and a few OEMs for EV Chargers Global EV Charger firms
• 5-6 key global firms eyeing the EV Chargers market closely
• Firms like ABB India, Delta India, Schneider India, Siemens India etc are looking at the Indian market closely
• These firms have their global designs and products and are studying the technical / specifications, business models and potential for their products
• All these firms are only looking at the 4 Wheelers' (Cars) EV Chargers Likely Indian firms in EV chargers • Huge interest in the Indian market for manufacturing EV Chargers
• Most Large & MSME firms in power electronics & battery rectifiers are looking at this market very closely • Some names we could confirm, who have evinced interest in EV Chargers

manufacturing are Raychem RPG India, Analogic India, Deltron, EOS Power, AdorPowertron, Kraft Power Con, Elind etc
• Most of these firms are currently getting their designs and products in place
NTPC will be a key player in setting up EV chargers infra in India

Present Status of EV Charging Stations
• National Thermal Power Corporation (NTPC) ventured into EV-Charging business and has installed first charging stations at its offices in Delhi and Noida
• At present, they are looking for a country-wide licensing. If that happens than they will be able to set up the charging stations very quickly
• The main objective in setting up EV charging points is to be part of promoting clean energy transportation
• In NTPC, the charging station installed as of now is specific to Mahindra vehicles.
• NTPC has applied for National Distribution License to roll out this at a national level
Economics and Utilization
When the EV market is nascent and utilization is low, most network operators find the economics challenging, and seek to be paid through the utility or government without regard to utilization. However, utilization is not necessarily always the best metric to gauge success. An alternative metric could be the ratio of the charging network to the number of EVs in the applicable geographic region.
Traditional utility tariffs contain a feature called a demand charge (or fixed charge), which is a fixed fee based on the account’s peak load during a month. When charging utilization is low, that fee is spread over very few kWh resulting in extremely high operating costs. The solution is an EV rate that reduces the demand charge. Options include various types of demand charge holidays and demand charge rebates, both of which typically decline over some period of years while utilization is expected to increase and therefore obviate the need to mitigate demand charges.
Maintenance
Because reliability is such an important factor, maintenance and repairs are high priority issues.

Operation of charging sites is a critical task because drivers rely on chargers to be in good working order. For that reason, a key determination is who will maintain and service the chargers. It is important to have the ability to diagnose and repair problems without dispatching a technician, but when necessary, provide adequate coverage by trained technicians with spare parts. Another issue is keeping the area surrounding the chargers clean and well maintained. If the chargers are in a retail area, then the landlord will typically handle it, but if located in an area that is not typically visited by the public then these tasks will have to be addressed.
Charger type
The type of location will dictate the type of charging and number of chargers to install. Station layout is important because there is no standard for where on a vehicle the charging port is located. The result is that, depending on the cord length and the location of the charge port, drivers wishing to charge may need to pay close attention to which plug they can access from which parking space and which direction they must face the vehicle.
The type of chargers installed is also critical to meeting customers’ needs. The Bharat chargers are small and can be easily installed, while the 50 kW charger is about the size of a refrigerator and installation is more expensive and complex. The various chargers also require different amounts of power and charge batteries at different speeds.
India has not standardized requirements around private or public charging infrastructure and instead has allowed numerous charging connector standards (for fast chargers) to be utilized by

automakers. This means that charging stations may provide one, some, or all connector options to EV users on a common board or kiosk.
Interoperability
The lack of standardization can lead to interoperability challenges and decreased utilization of charging infrastructure. There are three types of interoperability: plug type, charger-to-network communication, and network to network communication.
• Plug type is of critical importance to drivers because without the right type of connector they will not be able to charge. One best practice is to illustrate the different plug shapes on apps and even on the chargers themselves because many drivers may not know the technical name of the plug.
• Charger-to-network interoperability is relevant only to the owner of the hardware, and this type of interoperability offers the owner the ability to swap network providers.
• Network to network interoperability, enables drivers with credentials for one network to authenticate and receive a charge on a different network. Private networks often prefer not to allow drivers to roam, but drivers very much like to be able to use a single credential on multiple networks. Requiring this is a best practice in public policy.
Open standards or open protocols signal interoperability and ensure that EV charging systems speak the same language. Certification is separate for hardware and software. Factors to consider when choosing a hardware original equipment manufacturer (OEM) include price, experience, reliability, ease of servicing and repair, quality of internal components, spare parts availability, whether technicians must be specially trained, build-quality, Open Charge Point Protocol (OCPP) compliance and certification, and warranty. Factors to consider when choosing a network provider include the ability to process and respond to trouble tickets, types of credentials that can be handled, hardware monitoring capabilities, customization options, call center capabilities, ability to dispatch and manage service technicians, credit card capabilities, reporting capabilities, compliance with OCPP and Open Charge Point Interface (OCPI), and price.
Of the one million EV public charging points installed around the world, about 0.1%, are in India. For a country aiming to increase EV use to 30% by 2030, charging infrastructure needs to ramp
up exponentially. NRDC and partners, ASCI and GERMI are working with states in India to expand the charging infrastructure network and advance electric mobility and build a clean energy future in India.
3.4 Data collection
Large part of the research is based on the secondary data available on various websites.
The primary data used is the information via unstructured observation, personal interview with
few of my friends, customer support of Mahindra Electrics and through the survey conducted with
the help of a questionnaire. The details of which are :
Population – (n) number of people who have any idea about Electric Vehicles
Sample – Friends, family and relatives
Sample size – 30 people
3.5 Limitations of the study
1. The sample size is confined to only 30 people.
2. There are a lot of people who do not have any idea about Electric vehicles or are generally
disinterested
3. The situation of covid 19 was getting worse during the time which made it even more
difficult.
4. A lot of people were merely not interested in discussing the negative causes and effects on
the environment that are caused by fuel emissions.
5. Some responses were not clear.

4. Data representation and analysis
4.1 Data representation and interpretation.


Policies proposed by the government
National Mission on Electric Mobility was approved in 2011, a plan to execute it (National Electric Mobility Mission Plan 2020) was unveiled only in 2013
FAME (2015)

It took another two years before FAME (Faster Adoption and Manufacturing of (Hybrid &) Electric Vehicles in India), a policy which will actually incentivise and catalyse the electrification, saw the light of the day in March 2015.
FAME, with an allocation of 895 crore, achieved little. The incentives to generate demand for EVS, build infrastructure and technology platforms triggered, at best, a minimal interest among the manufacturers and users. The government kept extending the scheme every six months till March 2019 (its original implementation period ended March 2017) but only a few thousand electric vehicles were added to the roads whereas China added 800,000 EVS a year. A need for a revised policy was immensely felt.
FAME 2 (2019)
In 2019 a revised version of the policy came into existence called FAME II, which allocated 10,000 Crore rupees for the EV Market, which was significantly better than the previous version.The main objective of the scheme is to encourage Faster adoption of Electric and hybrid vehicle by way of offering upfront Incentive on purchase of Electric vehicles and also by way of establishing a necessary charging Infrastructure for electric vehicles.
The scheme will help in addressing the issue of environmental pollution and fuel security.
Details –
Emphasis is on electrification of the public transportation that includes shared transport. Demand Incentives on operational expenditure model for electric buses will be delivered through State/city transport corporation (STUs).
In 3W and 4W segment incentives will be applicable mainly to vehicles used for public transport or registered for commercial purposes.
In the e-2Ws segment, the focus will be on the private vehicles. Through the scheme, it is planned to support 10 Lakhs e-2W, 5 Lakhs e-3W, 55000 4Ws and 7000 Buses. To encourage advance technologies, the benefits of incentives, will be extended to only those vehicles which are fitted with advance battery like a Lithium-ion battery and other new technology batteries.
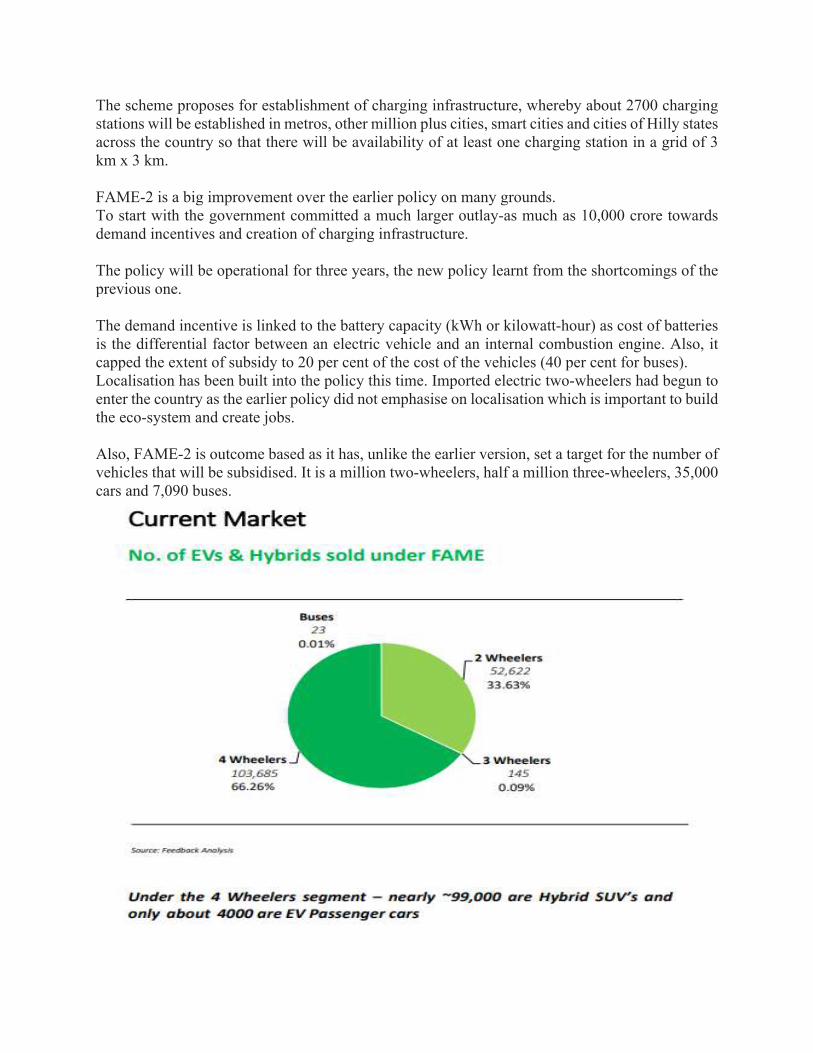
The scheme proposes for establishment of charging infrastructure, whereby about 2700 charging stations will be established in metros, other million plus cities, smart cities and cities of Hilly states across the country so that there will be availability of at least one charging station in a grid of 3 km x 3 km.
FAME-2 is a big improvement over the earlier policy on many grounds.To start with the government committed a much larger outlay-as much as 10,000 crore towards demand incentives and creation of charging infrastructure.
The policy will be operational for three years, the new policy learnt from the shortcomings of the previous one.
The demand incentive is linked to the battery capacity (kWh or kilowatt-hour) as cost of batteries is the differential factor between an electric vehicle and an internal combustion engine. Also, it capped the extent of subsidy to 20 per cent of the cost of the vehicles (40 per cent for buses).Localisation has been built into the policy this time. Imported electric two-wheelers had begun to enter the country as the earlier policy did not emphasise on localisation which is important to build the eco-system and create jobs.
Also, FAME-2 is outcome based as it has, unlike the earlier version, set a target for the number of vehicles that will be subsidised. It is a million two-wheelers, half a million three-wheelers, 35,000 cars and 7,090 buses.


5. Results and Discussion

5.1 Major Findings:
Shortcomings of the policies
FAME – 2 has learned and improved in various aspects from its previous versions but still falls short on many grounds.
• Today, the country has no choice but to import advanced engine and other technologies the tightening emission norms demand.
• The policy also ignores another potential India-specific innovation battery swap, it is a more economical option for a price sensitive market like Indian market
• The emphasis on localization will push battery manufacturers to assemble in India, there is an urgent need to think bigger. Lithium cells have to be manufactured locally and, more importantly, India needs access to lithium itself. This rare earth metal is not available in India and it is time for the government to start signing strategic deals to access it. Otherwise, as the population of EVS grows, India's dependency will shift from West Asia (oil) to China (lithium).
• There is also a re-certification process that resulted in EVs having to undergo the entire process of CMVR Rules, which takes around 30 to 45 days of re-testing and has resulted in many vehicles awaiting certification.
If electric vehicle sales in India have to pick up, a realistic approach with supportive policies will be needed, or else EVs would continue to remain a niche product. A lithium-ion battery powered e-two-wheeler, to get incentives under the FAME II policy, is expected to have a range of around 80km per charge, which means that it will need to have, at least, a 2kW battery that costs around Rs 50,000. This means, for the customer to replace or buy a battery, would be equivalent of buying a new entry level two-wheeler.
The following null Hypotheses were failed to reject based on the above findings that
• The decision to switch a vehicle from petrol and diesel vehicles to Electric Vehicles is not depends on one’s knowledge and awareness about the pollution caused by fuel emissions.

• Ability to switch to Electric vehicles is not depends on the income of a consumer as one looks for a mid-range vehicle but EV’s cost a tad higher on the costing spectrum.
It is learnt from this research that the decision to switch a vehicle from petrol and diesel vehicles to Electric Vehicles clearly depends on one’s knowledge and awareness about the pollution caused by fuel emissions. Also, ability to switch to Electric vehicles also depends on the income of a consumer as one looks for a mid-range vehicle but EV’s cost a tad higher on the costing spectrum.
5.2 Discussions and suggestions
Countering the Shortcomings
National Mission on Transformative Mobility and Battery Storage
• Phased Manufacturing Program (PMP) valid for 5 years till 2024 to support setting up of a few large-scale, export competitive integrated batteries and cell-manufacturing Giga plants in India.
• Creation of a PMP valid for 5 years till 2024 to localize production across the entire Electric Vehicles value chain. The PMP will localize the production of EVs its components within the country.


Challenges faced by Electric vehicles in Indian Markets
India being a developing country, it has its own challenges in the course of electric vehicles. Tata Nexon , MG gloster are some popular electric vehicles these days, but still they face the challenge of rejection. Indians are not known for their adaptive behavior. We tend to keep the things same and simple.
There are number of hurdles standing between the electrification of vehicles in the Indian Markets:
• Reliance on battery imports • Reliance on imported components and parts• Incentives linked to local manufacturing• Range anxiety among consumers• High price of EVs currently• Lack of options for high-performance EVs• Inadequate electricity supply in parts of India• Lack of quality maintenance and repair options• Affected by broader automobile industry downturn
Inadequate charging infrastructure
India was reported to have 650 charging stations in 2018, whereas China had over 456K charging points in the same year. In addition to charging points, the lack of private parking spaces is also noted as a hindrance for electric vehicles adoption, and the lack of affordable renewable energy means charging EVs is putting a toll on the already stressed coal-powered electricity grid.
Range anxiety
Potential EV customers are apprehensive when it comes to the range that an EV offers. They want to ensure that the vehicle would get them to their destination before the battery runs out. This is closely linked to the lack of charging stations in the country. Therefore, there needs to be a stronger push for charging infrastructure and other solutions like battery swapping stations.

Financing challenges
EV customers currently face various financing challenges such as limited financing options, high interest, high insurance cost, and limited loan opportunities. As EVs gain widespread adoption, these financing challenges can hinder EVs' widespread adoption in the country.
Weather Conditions
Generally, an Electric Vehicle has a range of about 500-600 km but due to harsh weather conditions, the batteries have been reported to be faulty or the range of those vehicles have reduced significantly. As low as up to 140kms per charge.
5.3 Conclusion
India has a lot to gain by converting its internal combustion engine (ICE) vehicles to EVs at the earliest. Its oil-import bill would considerably reduce. ICE vehicles are a major contributor to pollution in cities and their replacement with EVs will definitely improve air quality. There is a considerable possibility that we can become leaders in small and public electric vehicles. India has over 170 million two-wheelers. If we assume that each of these vehicles uses a little more than half a liter of petrol per day or about 200 liters per year, the total amount of petrol used by such vehicles is about 34 billion liters. At₹70 per liter, this would cost about ₹2.4 lakh crores. Even if we assume that 50% of this is the cost of imported crude (as tax and other may be 50%), one may save ₹1.2 lakh crores worth of imported oil. There is a real possibility of getting this done in the next five to seven years. This would however require innovations, a policy regime that encourages access to latest technologies and a concerted effort by the Indian industry to achieve global competition through acquiring the necessary scale and using cutting edge technology

ANNEXURE
Questionnaire:
Personal Details –
• Name:
• Mobile Number:
• Address: ______________________________________________________________________________________________________________________________________________________________________________________________________________________________________________________________________________________________________________________________________
• Occupation:
• Age:
Please select an appropriate option for the asked question
1. Do you know what is an Electric Vehicle? • Yes• No

2. Do you think petrol/diesel price hike has affected you in a major way?• Yes• No• Somewhat
3. Would you consider buying an Electric Vehicle?• Yes• No
4. How much are you willing to spend on an Electric Vehicle?• Less than 5 Lakh• 5-10 Lakh• 10-15 Lakh• 15+ Lakh
5. Are you aware about the monetary policies that benefit an EV buyer?• Yes• No• Somewhat
6. What is the most attracting thing about an EV for you?• Eco-Friendly• Easy on pockets (charging)• Technical Features• Other
7. What should be an appropriate range for you of an EV after 1 complete charge?• 100-200 Kms• 200-300 Kms• 400-500 Kms• 500+ Kms
8. Who would be a trustable EV Manufacturer in your opinion?• Mahindra• Maruti• Hyundai• Toyota

Reference:
Kothari, C. (n.d.). Research Design (Second Revised Edition ed.). New Delhi : NEW AGE INTERNATIONAL
(P) LIMITED, PUBLISHERS 4835/24, Ansari Road, Daryaganj, New Delhi - 110002.
Kothari, C. (n.d.). Data Collection (Second Revised Edition ed.). New Delhi : NEW AGE INTERNATIONAL (P)
LIMITED, PUBLISHERS 4835/24, Ansari Road, Daryaganj, New Delhi - 110002
The various websites used for the purpose of studying and research were:-
1 The Times of India: https://timesofindia.indiatimes.com/
2 Mahindra Electric: https://www.mahindraelectric.com/
3 Niti Ayog: http://niti.gov.in/
4 Wikipedia: https://en.wikipedia.org/
5 FAME: https://fame2.heavyindustry.gov.in/

A Study on financial Statement Analyses of Indigo Paints
Private. Ltd.
Research Project Submitted in Partial Fulfillment of the Requirements for the
Degree of
BCOM Honours
by
ALOK SAHU
to the
DEPARTMENT of COMMERCE
BHOPAL SCHOOL of SOCIAL SCIENCES
April, 2021
Submitted by Guided by
Alok Sahu Dr. Smitha Pillai
Assistant Professor
Department of Commerce

CERTIFICATE
It is certified that the work contained in the project report titled A Study on financial Statement Analyses of Indigo Paints Private. Ltd., by Alok Sahu, has been carried out under
my/our supervision and that this work has not been submitted elsewhere for a degree.
Signature of Supervisor: …………….
Name:
Dr. Smitha Pillai
Assistant Professor
Department: Commerce
Bhopal School of Social Sciences
30 April, 2021

DECLARATION
I hereby declare that this project report entitled A Study on financial Statement Analyses of
Indigo Paints Private. Ltd. was carried out by me for the degree of B.COM Honours under the
guidance and supervision of Dr. Smitha Pillai, Assistant Professor of Department of
Commerce, BSSS College. The interpretations put forth are based on my reading and
understanding of the original texts and they are not published anywhere in any form. The other
books, articles and websites, which I have made use of are acknowledged at the respective
place in the text. This research report is not submitted for any other degree or diploma in any
other University.
Place: Bhopal
Name: Alok Sahu
Class & Section: B.Com (Honours) A’’ Final Year
Date: 30, April, 2021
ACKNOWLEDGEMENT

I would like to thank our Principal Dr. Fr. John P.J. and Vice Principal Dr. Sr. Sonia Kurien
for their immense support and blessings. I thank our HOD Dr. Amit Kumar Nag for his support.
I would like to express my special thanks of gratitude to my research guide Dr. Smitha Pillai,
Assistant Professor of Department of Commerce for his valuable suggestions and guidance and
for giving me the golden opportunity to do this wonderful research project on the topic: A
Study on financial Statement Analyses of Indigo Paints Private. Ltd., Without her help it would
have been difficult for me to have reached this state of completion of my project report. Also,
I would like to thank my parents and friends who helped me a lot in the preparation of this
project.
I wish to acknowledge the help of all those who have provided me information, guidance and
other help during my research period.
TABLE OF CONTENTS
CONTENTS PAGE No.
Chapter 1: Introduction of The Topic 1
1.1 Rationale of the Study 2
1.2 Introduction to Industry 3

1.2.1 The Indian Paint Industry 3
1.2.2 Market share of the paints industry in India 2020, by company 4
1.2.3 Industry background 5
1.3 Introduction to Company 7
Chapter 2: Review of Literature 11
Chapter 3: Research Methodology 15
3.1 Research Objective 16
3.2 Research Hypothesis 16
3.3 Scope of the Study 16
3.4 Limitation of the Study 19
Chapter 4: Data representation and Analysis 20
4.1 Data Representation and Interpretation 21
4.2 Hypothesis Testing 31
Chapter 5: Results and Discussion 32
5.1 Major Findings 33
5.2 Discussions and Suggestions 33
5.3 Conclusion 34
References 35
Annexure 38

1 | P a g e
Chapter -1
Introduction to the topic
1.1 Rationale of the Study
1.2 Introduction to Industry
1.2.1 The Indian Paint Industry
1.2.2 Market share of the paints industry in India 2020, by
company
1.2.3 Industry background
1.3 Introduction to Company

2 | P a g e
1.1 Rationale of the studyThe primary objective of the study is to analyze financial statement of the Indigo paints and
measure the performance in terms of assets utilization, and profitability. It also determines,
forecast and evaluate the best of economic conditions and company’s performance in the
future. In detail the research methodology used for the study that has focused on the past and
present performance of Indigo paints.
Financial statement analysis is important for obliging with business laws and regulations,
whereas additionally meeting the wants of stakeholders and numerous alternative parties.
Organizations can benefit from financial statement analysis in a variety of ways. It gives
internal and external stakeholders the information they need to make informed investment
decisions. Financial statement analysis also gives lending institutions an unbiased picture of a
company's financial health, which is useful when making lending decisions.
1.2 Introduction to the industry
1.2.1 The Indian Paint Industry

3 | P a g e
The Paints trade is one among the foremost heavily regulated industries within the world. the arena consists of makers of paints, varnishes, lacquers, shellacs, stains and a spread of alternative specialty coatings.
Three staple items needed to create paint.
• You need a pigment to urge the precise color you want.• Binder to carry the paint along.• Thinner in order that it may be applied simply
The Indian paint trade is over one hundred years previous. Its starting may be copied back to the putting in place of a manufacturing plant by Shalimar Paints in urban center (now Kolkata) in 1902. Till World War II, the trade consisted of little producers and 2 foreign corporations. when the war, the imports stopped, that diode to the putting in place of producing facilities by native entrepreneurs. Still, the foreign corporations continued to dominate the market. Initially British paint corporations like Goodlass Walls (now Goodlass Nerolac), ICI, British Paints (now Berger Paints), Jenson & Nicholson and Blundell & Eomite dominates the market. There square measure presently twelve players inside the organized sector of India's paint and coatings market and over 2,000 inside the unorganized sector. In 2003-04, the organized sector command 70% share of the around $1.5 billion (Rs 6,800 crore) business, whereas the balance was created of the unorganized units. (The Indian paint trade coatings world) (Devaraj, n.d.)
The major players square measure Asian Paints, Goodlass Nerolac, Berger, ICI and Shalimar. Recently, world leaders like Akzo chemist, PPG, DuPont and BASF have established base in Bharat with product ranges like motorcar refinishes, powder coatings and industrial coatings. Kansai Paints of Japan, that entered into collaboration with Goodlass Nerolac in 1984, is currently the company for Goodlass Nerolac with 52% equity holding. PPG features a venture with Asian Paints to manufacture industrial coatings. Jenson & Nicholson and Snowcem Bharat are not any longer active players thanks to dwindling sales in recent years.
In 1990, helped by a growing economy, the Indian paint trade recorded a healthy growth of 12-13% annually. This was chiefly because of a forceful reduction in excise from a staggering four-hundredth to Sixteen Personality Factor Questionnaire. However, the expansion was restricted in 2002-03 to single digits. There was a revival in 2003-04 with a strong growth of thirteen.
The Indian paint trade has 2 main market segments-industrial and ornamental paints. whereas industrial paints square measure used for cover against corrosion and rust on steel structures, vehicles, white product and appliances, ornamental paints square measure utilized in protective valuable assets like buildings.
The Indian ornamental business features a share of roughly 77% in total sales. In foreign countries 50-70% of the business is from the economic section.
The trends square measure possible to shift in Bharat too, however at a slower pace, in favor of business paints. The per capita consumption of paint in Bharat is 700 grams versus nineteen metric weight unit within the U.S. and 2.7 kg and 5.8 metric weight unit in alternative

4 | P a g e
developing countries like China and Brazil as a result of consumption relates to affordability, the low Indian figure isn't a surprise. (Devaraj, n.d.)
Within the ornamental section, the share of exterior paints is 21%, interior emulsions 11% , distempers 30%, solvent-based enamel paint 36% and wood finishes 2%.
The exterior class, notably exterior emulsions, is that the quickest growing section at 200% for the last 3 years.
The industrial coatings section includes high performance coatings with half-hour market share, powder coatings with 10% part, coil coatings with 5 %, marine coatings 5 % and automotive coatings.
While Asian Paints was a transparent market leader with a turnover of roughly $420 million (Rs 1,943 crores) in 2003-04, Goodlass Nerolac was second with some $220 million (Rs 1,010 crores) throughout identical amount.
1.2.2 Market share of the paints industry in India 2020, by company
Asian Paints was the leading company in 2020, with a market share of regarding 39 %. Within the organized phase, Asian Paints LED the ornamental market phase, whereas the economic phase was LED by Kansai Nerolac. As of 2019, the Indian paint trade saw around 12 % growth in its output volumes and regarding 15 % growth in terms of its total worth. Future growth within the trade is probably going to depend upon many factors like disposable incomes, stability of crude costs and growth within the automotive and property sectors. (Jaganmohan, 02)
A. Market leaders
The paint, varnishes, coatings and lacquers business is one the foremost heavily regulated industries within the world. The Indian paint business was the second largest within the APAC region in 2020. The world witnessed important growth over the past few years. In 2019, the Wholesale index number of paints and varnishes stood at 112.7, its highest price compared to the last 5 years. In 2019, the trade price of the country’s paint business was over 57 trillion Indian rupees. Despite being the second largest business globally, the export price of India’s paint business amounted to around 18 trillion rupees as opposition the import price value or so thirty-nine trillion rupees. (Jaganmohan, 02)
B. Segmentation

5 | P a g e
The paint sector across the south Asian nation was generally classified into 2 segments – industrial and ornamental. Exterior and interior wall paints, enamel and appurtenant product and wood finishes created up the ornamental phase. Automotive, powder and protecting coatings on the opposite hand summed up the economic phase. The Indian market was dominated by the ornamental phase accounting for regarding 75 % of the market share compared to industrial phase that had simply over 25 % of the share. Less technical power and also the involvement of organized moreover as unorganized players contributed to the current major distinction in market shares. (Jaganmohan, 02)
Source : (Investment shastra, 2021)
1.2.3 Industry background
The Indian paint trade is valued at | 54500 large integers and it's expected to grow at 12-tone system CAGR in next 5 years. The ornamental paint phase constitutes ~74% of total paint sales (i.e. ~| 40,300 large integer) and is probably going to grow to 74300 crore by FY24E backed by shortening repainting cycle, rising urbanization and aspiration level of class family in India. The domestic ornamental paint trade is basically dominated by organizes players with ~67% market share, whereas unorganized/regional players hold rest 33 % market share. (Parthasarathy, n.d.)
Industrial paint class contributes rest ~26% in total paint sales and is probably going to grow at CAGR of 100% to | 22800 large integer by FY24E supported by favorable base and revival within the automotive business.

6 | P a g e
Source: (The indian paint industry coatings world)
Per capita paint consumption in Asian country has exaggerated by ~7% over the last seven years. Compared to the world average consumption of ~14% kilogram per capita, consumption of paints in Asian country is low, indicating a big chance for penetration going forward. (Sanjay Manyal, Hitesh Taunk, 2021)
Source: (Sanjay Manyal, Hitesh Taunk, 2021)
1.3 Introduction to the company (INDIGO PAINTS)

7 | P a g e
Started within the year 2000, Indigo Paints had a modest starting. it's the 5th largest ornamental paint company in Republic of India. It began with the manufacture of lower-end Cement paints, and bit by bit dilated its vary to hide most segments of water-based paints like Exterior Emulsions, Interior Emulsions, Distempers, Primers, etc. From associate early age, the corporate unfold its footprints across the country, with the speedy growth of its reach across Republic of India. these days the corporate stands out joined of the strongest contenders within the Indian paint trade, being rated as associate innovative paint manufacturer, that keeps starting off with distinctive merchandise never before offered within the country. (indigopaints, n.d.)
Over time, the corporate found its niche within the paint trade through innovation. It unbroken churning out bright new concepts for painting solutions, with horrific regularity. Gradually, the trade began wanting upon the corporate as a artistic movement thinker and a entrepot of recent development. (indigopaints, n.d.)
With dynamical time and trends, Indigo Paints revamped its identity showcasing a brand new wave of thinking by the corporate. A number of years alone it clubbed all its multiple completes for various product classes into one umbrella brand “INDIGO”. A new logo for the brand and therefore the Company was created, that accurately mirrored the core philosophy of the organization. The brand style was extended to any or all packaging style and different kinds of company communication. (indigopaints, n.d.)
The company over the years introduced distinctive paints merchandise that has helped it to expand its dealers touch domestic markets that is otherwise dominated by high four players. The premium product class contributes 28.6% in topline whereas rest comes from the opposite paint merchandise classes. The corporate has pan Republic of India reach with its 11230 dealer networks and it's growing 100% annually. For FY18-20, company according sales, PAT CAGR of 26%, 104% severally, supported by EDITDA margin enlargement of ~800 rate throughout identical amount. (Sanjay Manyal, Hitesh Taunk, 2021)
C. Strong presence in the semi urban and rural markets
The company has a significant in the semi urban and rural markets which contributes ~85% of the total revenue. The significant presence in the semi urban and rural markets has helped company to recover its lost sales quickly amid pandemic. The company now sees a significant untapped (Sanjay Manyal, Hitesh Taunk, 2021)
D. Focus to rationalize advertisement expanses going forward
Indigo’s spend on advertisement and promotion at ~13% is one of the highest in the industry. The higher expenditure could be attributable towards company’s efforts to strengthen the “Indigo” brand. However, company is now (Sanjay Manyal, Hitesh Taunk, 2021)
E. Company Background

8 | P a g e
Over the years, the corporate has introduced a number of the distinctive paints merchandise (where the presence of different paint firms is negligible) that helped indigo to expand its dealer touch domestic markets that is otherwise dominated by high four players. Few merchandises wherever indigo has 1st mover benefits are metal like Emulsions, Tile Coat Emulsions, Bright Ceiling Coat Emulsions, Floor Coat Emulsions, Dirtproof & Waterproof Exterior Laminate, Exterior and Interior Acrylic Laminate, and atomic number 94 Super Gloss Enamel. The premium product class contributes 28.6% in topline whereas rest comes from the opposite paint product classes. Indigo has total paint producing capability of ~1.95 lakh metric tons and its 3 plants are settled in Rajasthan, Kerala and Tamilnadu.
The company has pan Asian country reach with its 11,230 dealer networks and it's growing ~10% annually. For FY18-20, company reported sales, PAT CAGR of 26%, 104% severally, supported by EDITDA margin growth of ~800 bits per second throughout identical amount. Finally, the PAT grew at CAGR of 104% in FY18-20 to | 47.8 crore. (Sanjay Manyal, Hitesh Taunk, 2021)
Source: (The indian paint industry coatings world)

9 | P a g e
Source: (IDirect_IndigoPaints_IPOReview)
F. Investment Rationale
• Continue to focus on developing differential products to grow market share
Indigo paints were the primary company to launch numerous new product classes that is understood as premium class. Those merchandise are silver Emulsions, Tile Coat Emulsions, Bright Ceiling Coat Emulsions, Floor Coat Emulsions, Dirtproof & Waterproof Exterior Laminate, Exterior and Interior Acrylic Laminate, and PU Super Gloss Enamel. The revenue from premium merchandise classes has registered CAGR of half-hour in FY18-20, whereas the revenue contributes 27% in FY18 to 29% by FY20. The corporate has more planned to extend revenue contribution of premium merchandise through dealer addition fresh entered geo graphics. (Sanjay Manyal, Hitesh Taunk, 2021)
Source: (IDirect_IndigoPaints_IPOReview)

10 | P a g e
• Capacity additions in next three years to boost volume growth
Company’s put in capability has augmented at CAGR of 43% within the last 3 years. That has helped company to attain volume CAGR of 27% in FY18-20. the corporate any plans to extend the present capability of terrorist organization by adding capability at its Tamilnadu facilities. Indigo has earmarked AN investment of a 150 crore to expand its Tamilnadu primarily based capability, which is able to be mostly funded through commercialism yield. Company presently manufactures solely solvent-based paints at its Tamilnadu facility; it's currently getting to embrace producing of water primarily based paints (largely higher finish products) to cater the growing demand of water-based paints. (Sanjay Manyal, Hitesh Taunk, 2021)
Source: (The indian paint industry coatings world)

11 | P a g e
Chapter 2
Literature Review
(Dr Ajai Kumar Jain, Vishal Sharma, 2016) The history of Indian Paint business is as previous because the history of the Indian folks. The earliest samples of Indian painting square measure cave paintings going back to 10,000 B.C. The tradition of painting in Indian landmass grew

12 | P a g e
and developed over time, leading to a completely developed and finest vogue, incorporating the culture and religion of the region and faith. Indian paints forever embrace wealthy color and clear symbolism, exploitation specific picture to create spiritual figures clearly recognizable (Indian Mirror July, 2015). Cave paintings representations traces are found at Bhimbetka; getting ready to the Bhopal space in just about thousand caves. The date set for these caves dates back to the Paleolithic amount (7000 BC). in this remote time the inhabitants of this space were still forming the bases of the civilization and but already pictorial realization square measure done on the walls of those dark caves used additionally as protection from the weather and animals (Paint in ancient India, Oct-5, 2013).
(Rajender, 2020) Profit maximization is that the basic objective of each firm. Within the gift competitive world, no firm will sustain while not profit. Typically profit suggests that financial gain over expenditure of a firm. To gauge the money performance of firm, it's vital to analyzing the gain position of firm over an amount of your time. In money accounting there are many techniques and tools are accessible for measurement Performance of a corporation. This study tries to research the money performance of the choose paint corporations in Asian nation victimization quantitative relation analysis also as applied mathematics techniques have wont to interpret the information. The study amount is of five years from 2014-15 to 2018-19. The study ended that gain position of the choose Paint corporations looks to be smart and satisfactory.
(Gandhi, 2018) Fundamental analysis helps to judge the proper worth of the shares. The shareholders will invest their cash within the corporations by creating elementary analysis. The most purpose of this analysis is to spot expensive or underpriced securities. The basic analysis contains a correct framework. For this analysis prime Down (Economic, business and Company Analysis) approach has been adopted. The Indian paint business is growing in multifold. The innovation in product like friendly, odor free, and mud & waterproof paints have attracted massive customers. The Paint business has bright prospects within the returning year. Thus the investments in Paint business could ends up in profit. 2 leading corporations, Asian Paints Ltd & Berger Paints Ltd, listed in National exchange area unit chosen for the study. The analysis is distributed supported secondary knowledge. The info collected from the reports printed by run, web site of NSE, Annual Reports for the 5 year amount of the each the businesses. Elementary of each corporation is distributed by EIC approach to work out the intrinsic worth.
(Krunal J. Kakkad, Dr. C.M. Thakkar, 2020) The paint trade is one amongst the foremost necessary and hard-to-please industries within the world market. It includes producing and selling of paints, varnishes, stains and completely different coatings. As per the literature, the Indian paint trade is of federal agency 50,000 crores turnover. The trade is split in to 2 components, decorative/domestic (like homes, property, etc) and Industrial (which includes cars, electronic things like icebox, washer, etc.). Out of those 2 segments of trade, three–fourth contribution is returning from decorative/domestic whereas one fourth of the business is causative by industrial paint phase. Among domestic phase Asian Paints is that the leading company whereas in industrial phase Kansia Nerolac has captured market in Bharat.
(Biswas) The Indian paint trade is over a hundred years recent. Its starting are often copied back to the fitting of a manufactory by Shalimar paints in Kolkata in 1902. The Indian paint trade has 2 main segments-industrial and ornamental paints. Industrial paints area unit used for

13 | P a g e
cover against corrosion and rust on steel structures, vehicles, white product and appliances. Because of the speedy urbanization, increasing disposable incomes and growing infrastructure, a sturdy growth within the Indian paint trade is anticipated. 10 years knowledge from year 2008 to 2017 of the four paint firms in Asian nation viz, Asian paints, Kansai Nerolac, Berger Paints and Akzo altruist are collected for the study. The target of the study is to seek out the correlation and regression between gain (net profit, come on internet price and come on capital employed) and dividend payout magnitude relation of the choose firms. It's found that just in case of Asian Paints there's correlation and regression between gain and dividend payout magnitude relation.
(Ashok Mohanty, Neha Budhwani, Barun Ghosh, M. Tarafdar & Sanchita Chakravarty, 2013) The paint business in Asian nation is generally classified into 2 categories: organized sector and unorganized sector. International and large Indian firms type the organized sector, whereas the small- and medium-scale industries that turn out paints for the native market type the unorganized sector. The current study was undertaken to work out the amount of lead in ornamental paints in Asian nation. A complete of 148 paint samples sourced from four organized sector firms and 6 unorganized sector firms were analyzed for the entire lead content. Results of this study reveal that thirty-nine you look after the entire paints tested (n = 148) contain lead quite three hundred ppm, the voluntary limit prescribed by Bureau of Indian Standards, BIS (IS 15489:2011), and forty five you look after the tested paints contain lead quite ninety ppm, the U.S.A. limit. any analysis of the information indicates that solely five you look after the tested paints factory-made by organized sector firms contain lead quite three hundred ppm (n = 91), whereas ninety three you look after the tested paints factory-made by unorganized sector firms contain lead quite three hundred ppm (n = 57). Comparison with earlier according information suggests that whereas organized sector firms area unit bit by bit abandoning the employment of lead-based compounds in their paints, the unorganized sector firms area unit still adding lead-based compounds advisedly in their paints despite the potential health hazards related to it. The utmost concentration of lead obtained was eighty, 350 ppm in one in every of the paints factory-made by associate degree unorganized sector company. The presence of high concentration of lead in yellow and inexperienced color paints indicates that colors are often a predictor of lead content in ornamental paints.
(BURRA & MEGHE, 2016) Demand foretelling may be a preliminary and obligatory exercise for a corporation to strategically accomplish its designing and execution route map the least bit levels and business functions. Foretelling becomes easier if the trade and therefore the organization are operational for a substantial quantity of your time because the historical knowledge may be consumed to make familiar alternatives for higher cognitive process. One amongst these techniques that facilitate America in creating higher forecast is statistic with seasonality. Historically Indian paint trade has been driven by seasonality, which has been established by wide discussions and analysis. Off late, this trend is experiencing a paradigm shift that has been known by trade bigwigs however the empirical proof has not however been established within the obtainable literature each at trade and structure level. So, the target of this paper is to grasp the seasonality pattern and latest demand trends in Indian paint trade, not solely at trade level however additionally for every organized player specifically, thereby paving the means for knowledge driven demand foretelling & management and combination designing. The statistic with seasonality technique is being applied to grasp the demand patterns within the Indian paint trade.

14 | P a g e

15 | P a g e
Chapter-3
Research Methodology
3.1 Research Objective
3.2 Research Hypothesis
3.3 Scope of the Study
3.4 Research Design and Methodology
3.5 Limitation of the Study
3.1 Objective of the study
1. To compare and analyze the financial statements for the past three financial years.

16 | P a g e
2. To know the profitability position of indigo paints.
3. To forecast the annual growth rate of income of the company with the help of Trend analysis.
4. To provide suggestions for improving the overall finance performance of the Indigo Paints.
3.2 Hypothesis
H:0 There is no significant difference in financial performance of Indigo paints in 3 years.
3.3 SCOPE OF THE STUDY
The data for a period of 3 years from 2017-18 to 2019-20 has been taken into consideration to
assess the financial strength and weaknesses of the Indigo paints. These statements include the
income statement, balance sheet, statement of cash flows, and a statement of retained earnings.

17 | P a g e
Research design is the framework of research methods and techniques chosen by a researcher. The design allows researchers to hone in on research methods that are suitable for the subject matter and set up their studies up for success.
The research design use in the study is analytical research has to analysis the financial statement which is historical data derive conclusion form it.
Analytical analysis is a type of study that entails the use of critical thinking skills as well as the assessment of facts and relevant data for the study.

18 | P a g e
The design of a research topic explains the type of research (experimental, survey, correlation, semiexperimental, review) and also its sub-type (experimental design, research problem, descriptive case-study).
Tools used for data analysis:
The type of research problem an organization is facing will determine the research design and not vice-versa. The design phase of a study determines which tools to use and how they are used. The last 3 years annual report of the company is compiled and tabulated for the purpose of study.
The techniques used are:
• Comparative study of Balance sheet
• Comparative study of Profit and loss account for the FY 2013-14& 2014-15.
• Trend Analysis
• Ratio Analysis
➢ Profitability ratio.➢ Turnover ratio. ➢ Solvency ratio. ➢ Current ratio.
Data collection tools
For the success of the present study data was collected mainly from secondary sources like annual reports of Indigo from the FY 2017-18 to FY 2019-20, newsletter, magazines and journals of the company. Research involves gathering data that describe events and then organizes, tabulates, depicts and describes the data collection it often uses visual aids such as graphs and charts to aid the reader in understanding the data.
Period of study:
The data for a period of 3 years from 2017-18 to 2019-20 has been taken into consideration to assess the financial strength and weaknesses of the company.
3.4 LIMITATIONS OF THE STUDY:
1. The study is based on secondary data. Hence, it may not provide accurate information

19 | P a g e
2. The study is restricted to the past three years (2017-20) financial information only.

20 | P a g e
Chapter – 4
Data Representation and Analysis
4.1 Data Representation and Interpretation
4.1.1 Analysis-1
4.1.2 Analysis-2
4.1.3 Analysis-3
4.2 Hypothesis Testing
4.1 Data Representation and Interpretation

21 | P a g e
4.1.1 Analysis-1
To compare and analyze the financial statements for the past three financial years.
A. Total current assets and liabilities All amount in Lakh rupees
2018 2019 2020
Non-current assets 11054.63 16294.57 21072.81
Current Assets 17711.8 21023.68 21123.13
Total Assets 28766.43 37318.25 42195.94Equity 11775.91 14746.43 19705.44
Non-current liabilities 1550.41 3548.71 3268.39
Current liabilities 15440.11 19023.11 19222.11
Total Equity and Liabilities 28766.43 37318.25 42195.94
Source: (indigo paints, n.d.)
Source: (indigo paints, n.d.)
Interpretation
As per the figure, company continuously increasing their operation and in 2018 total assets & liabilities were Rs. 28766.43 lakh, in 2019 total assets & liabilities were Rs. 37318.25 lakh which was increased by approx. 30 percent then previous year. In 2020 total assets & liabilities were Rs. 42195.94 lakh which was increased by 13 per cent approx. Share capital of the company seems to continuously increasing, the total amount raised by the company by the sale
0
5000
10000
15000
20000
25000
Non-current assets
Current Assets Equity Non-current liabilities
Current liabilities
2018 2019 2020

22 | P a g e
of share/equity at the growth rate of 26 percent from year 2018 to 2019 and 34 per cent from 2019 to 2020.
B. Revenue & expenses & Net profit of 3 consecutive years
2018 2019 2020Total revenue 4115776322 5613336497 6264060000Total Expenses 4090074159.00 5399861699.00 5786933000.00Net Profit 25702163 213474798 477127000
Source: (indigo paints, n.d.)
Interpretation
As per the figure, total revenue is highest in 2020 in three consecutive years. The net profit seems to be continuously increasing. In 2020 net profit is Rs. 477127000, in 2019 Rs. 213474798 and in 2018 Rs. 25702163. The growth rate of net profit is more than 700 per cent in 2019 and more than 123 per cent in 2020.
C. Cash Inflows
2018 2019 2020Net cash flow from operating Activities
270377152 451260523 858641000
4.1E+9
5.6E+96.3E+9
4090074159.00
5399861699.005786933000.00
2018 2019 2020
Total revenue Total Expenses

23 | P a g e
Net cash flow from Investing Activities
-227326873 -602027288 -751222000
Net cash flow from Financing Activities
-43783176 -222953061 -168997000
Source: (indigo paints, n.d.)
Source: (indigo paints, n.d.)
Interpretation
As per the figure the cash out flow from financing activities is highest in 2019 which is amounted to Rs. 222953061, in 2020 amounted to Rs. 168997000 and in 2018 amounted to Rs. 43783176. Cash flow from financing activities (CFF) measures the movement of cash between a firm and its owners, investors, and creditors. This report shows the net flow of funds used to run the company including debt, equity, and dividends.
The cash out flow from investing activities is highest in 2020 which is amounted to Rs. 751222000, which is increased by approx. 25 per cent. In 2019 cash out flow from investing activity was Rs. 602027288, which was increased by approx. 165 percent. And In 2018 cash out flow from investing activities Rs. 227326873. Investing activities include purchases of physical assets, investments in securities, or the sale of securities or assets.
Cash flow from operating is highest in 2020, amounted to Rs. 858641000 which is increased by approx. 91 per cent. In 2019 cash flow from operating activities was Rs. 451260523 which was increased by 67 per cent. And in 2018 cash flow from operating activities was amounted to Rs.270377152.
4.1.2 Analysis-2
-40%
-20%
0%
20%
40%
60%
2 0 1 8 2 0 1 9 2 0 2 0
Net cash flow from Financing Activities
Net cash flow from Investing Activities
Net cash flow from operating Activities
CASH FLOW

24 | P a g e
To know the profitability position of indigo paints.
A. Profitability Ratio
Profitability ratios are a class of financial metrics that are used to assess a business's ability to generate earnings relative to its revenue, operating costs, balance sheet assets, or shareholders' equity over time, using data from a specific point in time.
Profitability ratios can be compared with efficiency ratios, which consider how well a company uses its assets internally to generate income (as opposed to after-cost profits).
1. Return on Equity
This ratio measures Profitability of equity fund invested the company. It also measures how profitably owner’s funds have been utilized to generate company’s revenues. A high ratio represents better the company is.
Formula: Profit after Tax ÷ Net worth Where, Net worth = Equity share capital, and Reserve and Surplus.
2. Earnings Per Share
This ratio measures profitability from the point of view of the ordinary shareholder. A high ratio represents better the company is.
Formula: Net Profit ÷ Total no of shares outstanding
3. Cash earnings Per Share
Cash earnings per share (cash EPS), or more commonly called operating cash flow, is a financial performance measure comparing cash flow to the number of shares outstanding.
4. Return on Capital Employed
This ratio computes percentage return in the company on the funds invested in the business by its owners. A high ratio represents better the company is.
Formula: Operating Cash Flow ÷ Diluted Shares Outstanding
5. Return on Assets
This ratio measures the earning per rupee of assets invested in the company. A high ratio represents better the company is.
Formula: Net Profit ÷ Total Assets
6. Net Profit Margin
This ratio measures the overall profitability of company considering all direct as well as indirect cost. A high ratio represents a positive return in the company and better the company is.

25 | P a g e
Formula: Net Profit ÷ Sales × 100 Net Profit = Gross Profit + Indirect Income – Indirect Expenses
Formula: Net Operating Profit ÷ Capital Employed × 100 Capital Employed = Equity share capital, Reserve and Surplus, Debentures and long-term Loans Capital Employed = Total Assets – Current Liability
7. Total Debt/Equity (X)
The debt-to-equity (D/E) ratio is used to evaluate a company's financial leverage and is calculated by dividing a company’s total liabilities by its shareholder equity.
Formula: Total Liabilities ÷ Total shareholder equity
Profitability Ratio of Indigo Paints.
2018 2019 2020Return on Equity (%) 2.57 20.8 26.74
Basic EPS 0.9 9.32 16.5Earnings Per ShareDiluted EPS 0.57 5.9 10.5
Cash earnings per share (%) 6.85 15.22 23.23Return on Capital Employed (%) 5.72 20.89 30.84Return on Assets (%) 0.91 7.2 11.33Net Profit Margin (%) 0.62 5.01 7.65Total Debt/Equity (X) 0.32 0.47 0.25
Interpretation
0.9 0.57
6.85 5.720.91 0.62 0.32
9.325.9
15.22
20.89
7.2 5.010.47
16.5
10.5
23.23
30.84
11.337.65
0.2505
101520253035
BASIC EPS
EARNINGS P
ER SHARE
DILUTED EPS
CASH EARNIN
G PER SHARE
RETURN ON CAPITAL EMPLO
YED
RETURN ON ASSETS
NET PROFIT M
ARGIN
TOTAL DEBT/EQUITY (X
)
2018 2.57 2019 20.8 2020 26.74

26 | P a g e
Return on Equity is highest 2020 which is 26.74 per cent, in 2019 return on equity was 20.8 per cent. And in 2018 return on equity was 2.57 per cent.
The higher a company's EPS, the more profitable it is considered to be. A higher EPS indicates greater value because investors will pay more for a company's shares if they think the company has higher profits relative to its share price. Basic Earnings per share is highest in 2020 which is 16.5 per cent, in 2019 it was 9.32 per cent. And in 2018 basic EPD was 0.9 percent. Diluted earning per share is highest in 2020 which is 10.5 per cent. In 2019 diluted EPS was 5.9 percent. And in 2018 Diluted EPS was 0.57 per cent. Cash earnings per share is also highest in 2020 which is 23.23 per cent and 2019 cash EPS was 15.22 per cent. And in 2018 cash EPS was 6.85 per cent.
Return on capital employed or ROCE measures how efficiently a company can generate profits from its capital employed by comparing net operating profit to capital employed. ROCE is highest in 2020 which is 30.84 percent. In 2019 ROCE was 20.89 per cent and lowest in 2018 which is 5.72 percent in three consecutive years.
Return on assets (ROA) is an indicator of how well a company utilizes its assets in terms of profitability. The ROA figure gives investors an idea of how effective the company is in converting the money it invests into net income. The higher the ROA number, the better, because the company is earning more money on less investment. ROA is highest in 2020 which was 11.33 per cent, in 2019 ROA was 7.2 percent and lowest in 2018 which was 0.91 per cent in three consecutive years.
Net profit margin is one of the most important indicators of a company's financial health. By tracking increases and decreases in its net profit margin, a company can assess whether current practices are working and forecast profits based on revenues. The highest net profit margin was in 2020 which is 7.65 per cent than in 2019 which was 5.01 percent and lowest in 2018 which was 0.62 in these three consecutive years.
The debt-to-equity (D/E) ratio compares a company’s total liabilities to its shareholder equity and can be used to evaluate how much leverage a company is using. Higher leverage ratios tend to indicate a company or stock with higher risk to shareholders. D/E ratio is highest in 2018 which was 0.47 then in 2018 which was 0.32 and lowest in 2020 which was 0.25.
2018 2019 2020
Inventory Turnover Ratio (X) 8.15 7.73 8.14
Debtors Turnover Ratio 4.50 5.15 6
Interest Coverage Ratio 1.94 8.23 13.06

27 | P a g e
Interpretation
Inventory turnover measures how many times in a given period a company is able to replace the inventories that it has sold. A slow turnover implies weak sales and possibly excess inventory, while a faster ratio implies either strong sales or insufficient inventory. Inventory turnover ratio seems to be in the year 2018 and 2020 which is approx. 8.15 and lower in 2018 which was 7.73.
The highest debtor turnover was in 2020 and the ratio was 6. A high receivables turnover ratio may indicate that a company’s collection of accounts receivable is efficient and that the company has a high proportion of quality customers that pay their debts quickly. In 2019 debtor turnover ratio was 5.15 land in 2018 the ratio was 4.50. A low receivables turnover ratio could be the result of inefficient collection, inadequate credit policies, or customers who are not financially viable or creditworthy.
The interest coverage ratio is used to measure how well a firm can pay the interest due on outstanding debt. Also called the times interest earned ratio, this ratio is used by creditors and prospective lenders to assess the risk of lending capital to a firm. A higher coverage ratio is better, although the ideal ratio may vary by industry. The interest coverage ratio was highest in 2020 which is 13.06 times. 2019 it was 8.23 And lowest in 2018 which was 1.94.
B. LIQUIDITY RATIOS
Liquidity ratios are an important class of financial metrics used to determine a debtor's ability to pay off current debt obligations without raising external capital. Liquidity ratios measure a company's ability to pay debt obligations and its margin of safety through the calculation of metrics including the current ratio, quick ratio, and operating cash flow ratio.
1. Current Ratio
The current ratio measures a company's ability to pay off its current liabilities (payable within one year) with its total current assets such as cash, accounts receivable, and inventories. The higher the ratio, the better the company's liquidity position:
8.15 7.73 8.14
4.5 5.15 61.94
8.2313.06
0
5
10
15
20
25
30
2018 2019 2020
Inventory Turnover Ratio (X) Debtors Turnover Ratio Interest Coverage Ratio

28 | P a g e
Formula: Current Ratio= Current Assets/// Current Liabilities
2. The Quick Ratio
The quick ratio measures a company's ability to meet its short-term obligations with its most liquid assets and therefore excludes inventories from its current assets. It is also known as the "acid-test ratio":
Formula: (cash & cash equivalents + Marketable securities + Account receivable) ÷ Current liabilities
2018 2019 2020Current Ratio 1.17 1.12 1.14Quick Ratio 0.84 0.75 0.73
Interpretation
After calculating, analyzing and interpreting the various financial reports of the company, we have come to the conclusion, that the company has a good liquidity statement in 2018 than preceding year, because the company has more short-term assets to cover the liabilities short-term, which means that there is more working capital. Also, we know that current assets are also constituted by customer requirements and if it happens that customers do not pay their debts, then the company may become insolvent and this would affect the reputation of the company. In 2018 quick ratio is 0.84 and current ratio is 1.17, in 2019 quick ratio is 0.75 and current ratio is 1.12 and in 2020 quick ratio is 0.73 and current ratio is 1.14.
4.1.3 Analysis-3.
To forecast the annual growth rate of income of the company with the help of Trend analysis.
ANNUAL FY 2020 FY 2019 FY 2018
Total Revenue 626.41 537.25 414.26
1.17 1.12 1.14
0.840.75 0.73
0
0.5
1
1.5
2
2.5
2018 2019 2020
Quick Ratio
Current Ratio

29 | P a g e
Total Revenue Growth (%) 16.6 29.69 42.7Total Expenses 558.98 503.23 410.68Total Expenses Growth (%) 11.08 22.53 33.39Profit after Tax (PAT) 47.81 26.87 2.57PAT Growth (%) 77.95 945.43 -Operating Profit Margin (%) 11.68 7.21 1.78Net Profit Margin (%) 7.65 5.01 0.62Basic EPS (₹) 16.5 9.32 0.9
Source: (economic times, n.d.)
Interpretation
The growth of revenue of the company continuously increasing in the preceding years. The total revenue in the financial year 2020 was 62640.60 lakh which was increased by 16.6 percent than the previous year. In 2019 total revenue was amounted to Rs. 53724.54 lakh which was increased by 29.69 percent than the previous year. And in 2018 total revenue was 41157.76 lakh which was increased by 16.6 percent than the previous year.
Source: (economic times, n.d.)
Interpretation
As the operation of the company continuously increasing expenses of the business also increases, the highest expenses incurred in the year 2020 was amounted to Rs. 55897.92 lakh
626.41537.25
414.26
0100200300400500600700
F Y 2 0 2 0 F Y 2 0 1 9 F Y 2 0 1 8
Total Revenue
16.6
29.69
42.7
0
10
20
30
40
50
F Y 2 0 2 0 F Y 2 0 1 9 F Y 2 0 1 8
Total Revenue Growth (%)
558.98503.23
410.68
0
200
400
600
F Y 2 0 2 0 F Y 2 0 1 9 F Y 2 0 1 8
Total Expenses
11.08
22.53
33.39
0
10
20
30
40
F Y 2 0 2 0 F Y 2 0 1 9 F Y 2 0 1 8
Total Expenses Growth (%)

30 | P a g e
which was increased by 11.08 per cent than the previous year. In year 2019 total expenses was Rs. 50323.03 lakh was increased by 22.53 percent than previous year. And in 2018 total expenses was amounted to Rs. 41068 which was increased by 33.39 per cent than the previous year.
Source: (economic times, n.d.)
Interpretation
Profit after Tax was highest in the year 2020 which was amounted to Rs. 4781.48 lakh and the operating profit margin was 11.68 percent. In the year 2019 PAT was Rs. 2686.97 lakh and operating profit margin was 7.21 percent. And in the year 2018 PAT was Rs. 25702.163 lakh and operating profit margin was 1.78 percent.
4.2 Hypothesis Testing
Mean Standard deviation
Current Ratio 1.143 0.02
Quick Ratio 0.773 0.047
Return on Equity (%) 16.703 2.572
Basic EPS 8.906 6.375
Diluted EPS 5.656 4.057
Cash earnings per share (%) 15.1 6.687
Return on Capital Employed (%) 19.15 10.328
Return on Assets (%) 6.48 4.284
Net Profit Margin (%) 4.426 2.899
Total Debt/Equity (X) 0.346 0.091
Inventory Turnover Ratio (X) 8 0.195
47.81
26.87
2.57
0
10
20
30
40
50
F Y 2 0 2 0 F Y 2 0 1 9 F Y 2 0 1 8
Profit after Tax (PAT)
11.68
7.21
1.78
02468
1012
F Y 2 0 2 0 F Y 2 0 1 9 F Y 2 0 1 8
Operating Profit Margin (%)

31 | P a g e
Debtors Turnover Ratio 5.216 0.614
Interest Coverage Ratio 7.743 4.552
InterpretationA low standard deviation means that the data is very closely related to the average, thus current ratio, Quick ratio, debt to equity ratio, inventory turnover ratio, debtor turnover ratio seems to be very reliable and consistence.
A high standard deviation means that there is a large variance between the data and the statistical average, thus return on equity, Basic EPS, Diluted EPS, Cash earnings per share, Return on capital employed, Return on assets, Net profit margin and Interest coverage ratio is not as reliable & inconsistence. And the reason, there was hug growth in each succeeding year as compared to the previous year.
Chapter – 5
Results and Discussion

32 | P a g e
5.1 Major Findings
5.2 Discussions and Suggestions
5.3 Conclusion
5.1 Major Findings
1. Indigo Paint has strong liquidity position.
2. Indigo Paints is very much efficient in utilizing its assets. It has the lowest level of inventory
days (on an average 44 days).
3. Return on capital employed has increased from 5.72% to 30.84% which shows that the
efficiency and profitability of the company has improved.
4. The companies earn adequate profit during the study although the performance of Indigo
Paints was far better in FY 2020.
5. From the analysis it has been cleared that the short term solvency position of Indigo Paints is satisfactory during the period under study.

33 | P a g e
5.2 Discussions & Suggestions
1. Investors should analyze the financial statements first in order to make investment decision.
2. Companies should focus more in efficiency and asset utilizations.
3. A company can earn more profit by increasing its sales and controlling its cost.
4. Management is able to identify weak points and enforce corrective measures in order to
progress more.
5.3 ConclusionThe analysis of the financial statements is a very important process, even necessary for making accurate decisions. Information obtained from financial analysis, together with accounting, are the basis for making decisions, both internally and externally. This study presents a model for the financial statement’s analysis of Indigo paints during the period from 2018 to 2020 on profitability that traced the measurement of performance. The research finds out that there is continuously growth profitability ratios and subsequently the performance of Indigo paints, during the three years and the highest in 2020. In conclusion, ROE is the most comprehensive measure of profitability of a firm; it considers the operating and investing decisions made as well as the financing and tax related decisions. After calculating, analyzing and interpreting the various financial reports of the company, we have come to the conclusion that in terms of liquidity, the state of the company is better in 2020, because this year the company has more short-term assets to cover short-term liabilities which means that there is more working capital. Regarding profitability ratios, there is a better situation in 2020 as compared to previous years and it is more effective in using assets to generate revenues, hence, there is a greater turnover this year as well as greater return on capital. From turnover assets ratio can be seen that the company is more effective in 2020 because in this year it was more likely to collect customer debts (Receivable Accounts), but it was also more effective in inventory sales, whilst with regard to payable accounts the company has more debts to suppliers in 2018 and 2019.

34 | P a g e
References

35 | P a g e
ReferencesAshok Mohanty, Neha Budhwani, Barun Ghosh, M. Tarafdar & Sanchita Chakravarty. (2013).
Lead content in new decorative paints in India. springerLink.Biswas, D. B. (n.d.). Analysis of Profitability and Dividend Payout: A Study on Some Select
Companies in Indian Paint Industry. Journal of Management & Research, 2018.BURRA, R. G., & MEGHE, B. (2016). UNDERSTANDING SEASONALITY AND ITS IMPACT ON
DEMAND FORECASTING: THE CASE OF INDIAN PAINT INDUSTRY. International Journal of Research in Commerce & Management.
Devaraj, P. (n.d.). coatingsworld. Retrieved from www.coatingsworld.com: https://www.coatingsworld.com/issues/2007-10/view_features/the-indian-paint-industry/7880#:~:text=There%20are%20now%20twelve%20players,up%20of%20the%20unorganized%20units.
Dr Ajai Kumar Jain, Vishal Sharma. (2016). A Study of Paint Industry With Special. INTERNATIONAL JOURNAL OF SCIENTIFIC RESEARCH.
economic times. (n.d.). Retrieved from https://economictimes.indiatimes.com/indigo-paints-ltd/stocks/companyid-1962470.cms
Gandhi, D. K. (2018). Fundamental Analysis of Indian Paint Industry. IOSR Journal of Business and Management.
(n.d.). IDirect_IndigoPaints_IPOReview. (n.d.). IDirect_IndigoPaints_IPOReview. (n.d.). IDirect_IndigoPaints_IPOReview. (n.d.). IDirect_IndigoPaints_IPOReview. indigo paints. (n.d.). Retrieved from indigo paints: https://indigopaints.com/wp-
content/uploads/2020/10/Audited-Financials:2019-2020.pdfindigo paints. (n.d.). Retrieved from indigo paints: https://indigopaints.com/wp-
content/uploads/2020/10/Audited-Financials:2018-2019.pdfindigopaints. (n.d.). Retrieved from indigopaints.com: https://indigopaints.com/about-us

36 | P a g e
Investment shastra. (2021, March Friday). Retrieved March Friday, 2021, from moneyworks4me: https://www.moneyworks4me.com/investmentshastra/indigo-paints-ipo-review/
Jaganmohan, M. (02, 02 2021). statista.com. Retrieved from www.statista.com: https://www.statista.com/statistics/914573/india-paints-industry-market-share-by-company/#:~:text=The%20paint%2C%20varnishes%2C%20coatings%20and,In%202019%2C%20the
Krunal J. Kakkad, Dr. C.M. Thakkar. (2020). Growth of Paint Industries in India. Mukt Shabd Journal.
Parthasarathy, D. (n.d.). coatingsworld. Retrieved from www.coatingsworld.com: https://www.coatingsworld.com/issues/2009-08/view_features/encouraging-growth-potential-for-the-indian-paint-/7908
Rajender, D. P. (2020). Performance Evaluation of Select Paint Companies in India. International Journal of Management .
Sanjay Manyal, Hitesh Taunk. (2021). IDirect_IndigoPaints_IPOReview. ICICI Securities – Retail Equity Research.
The indian paint industry coatings world. (n.d.). Retrieved March Saturday, 2021, from coatingsworld: https://www.coatingsworld.com/issues/2007-10/view_features/the-indian-paint-industry/7883#:~:text=In%202003%2D04%2C%20the%20organized,%2C%20Berger%2C%20ICI%20and%20Shalimar.

37 | P a g e
Annexure`

38 | P a g e
Source: (indigo paints, n.d.)

39 | P a g e
Source: (indigo paints, n.d.)

40 | P a g e
Source: (indigo paints, n.d.)

41 | P a g e
Source: (indigo paints, n.d.)
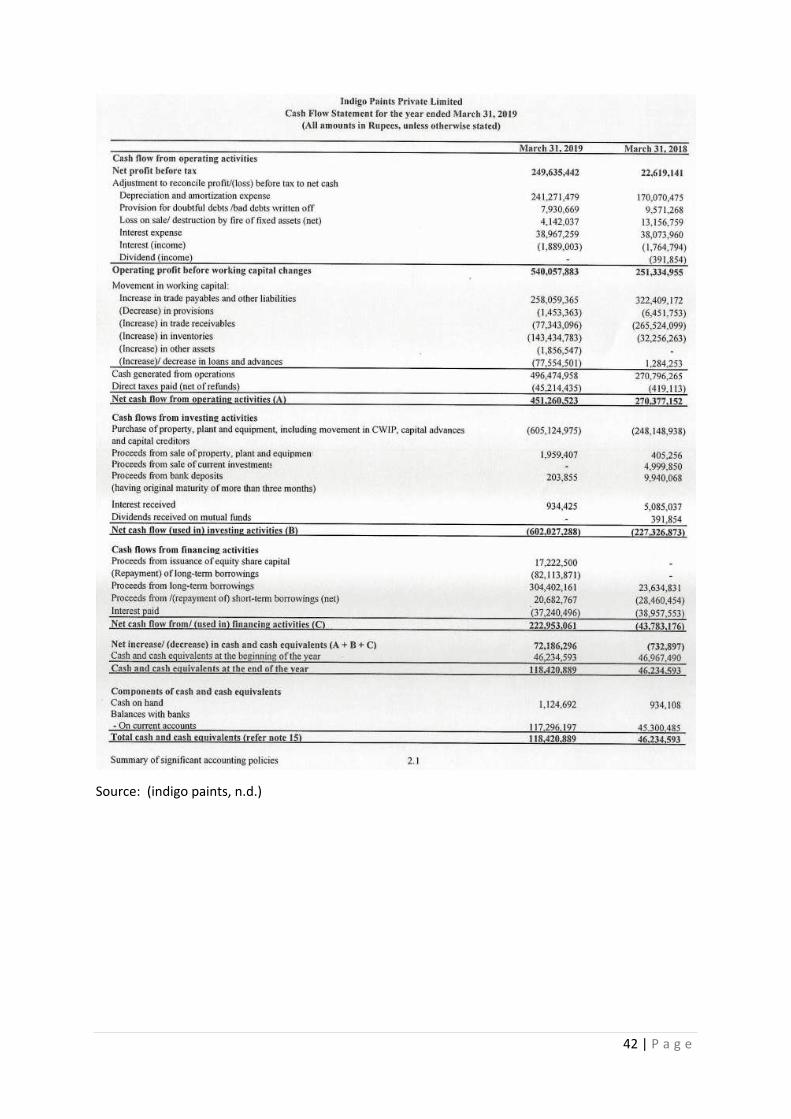
42 | P a g e
Source: (indigo paints, n.d.)

Financial Performance Analysis of BHEL, Bhopal
Research Project Submitted in Partial Fulfillment of the Requirements for the Degree of
BCOM Honours
By
Anjali Thakur
To the
DEPARTMENT OF COMMERCE
BHOPAL SCHOOL OF SOCIAL SCIENCES
April, 2021
Submitted by Guided by
Dr Smitha Pillai Anjali Thakur Associate Professor

1
CERTIFICATE
It is certified that the work contained in the project report titled “Financial Performance Analysis of BHEL, Bhopal,” by “Anjali Thakur,” has been carried out under my/our supervision and that this work has not been submitted elsewhere for a degree*
Signature of Supervisor: _______________________
Name: Dr. Smitha Pillai, Associate Professor
Department: Commerce
Bhopal School of Social Sciences
April, 2021
2
Department of Commerce
DECLARATION
I hereby declare that this project report entitled “Financial Study of BHEL – Ratio analysis” was
carried out by me for the degree of BCOM Honours under the guidance and supervision of Dr.
Smitha Pillai, Associate Professor of Department of Commerce, BSSS College. The interpretations
put forth are based on my reading and understanding of the original texts and they are not published
anywhere in any form. The other books, articles and websites, which I have made use of are
acknowledged at the respective place in the text. This research report is not submitted for any other
degree or diploma in any other University.
Name of the Student: Anjali Thakur
Class & Section: B.com (Hons.) 3rd years ‘A’
Place: Bhopal
Date: 23rd April, 2021
ACKNOWLEDGEMENT

3
I would like to thank our Principal Dr. Fr. John P.J. and Vice Principal Dr Sr Sonia Kurien for
their immense support and blessings. I thank our HOD Dr Amit Kumar Nag for his support. I
would like to express my special thanks of gratitude to my research guide Dr. Smitha Pillai,
Associate Professor of Department of Commerce for her valuable suggestions and guidance and
for giving me the golden opportunity to do this wonderful research project on the topic: Financial
Performance Analysis of BHEL, Bhopal, Without her help it would have been difficult for me
to have reached this state of completion of my project report. Also, I would like to thank my parents
and friends who helped me a lot in the preparation of this project.
I wish to acknowledge the help of all those who have provided me information, guidance and other
help during my research period.

4
Table of contents
List of tables
S. no. Topics Page No.
01 Executive Summary 6
02 Chapter I : Introduction to the topic 7
03 Chapter II: Review of Literature 15
04 Chapter III: Research Methodology 17
05 Chapter IV: Data representation & Analysis 24
06 Chapter V: Results & Discussion 39
07 References 43
08 Annexure 44
Table No Table Topic Page no.
Table no.1 Gross Profit ratios 25
Table no.2 Net Profit ratios 26
Table no.3 Operating Profit ratios 27
Table no.4 Return on assets 28
Table no.5 Return on Investments 29
Table no.6 Current ratios 30
Table no.7 Quick ratios 31
Table no.8 Inventory turnover ratios 32
Table no.9 Working capital turnover ratios 33
Table no.10 Debt to equity ratios 34
Table no.11 Debt to assets ratios 35

5
List of graphs
List of figures
Executives Summary
Table no. 12 Overall growth percentage 36
Graph No Graph Topic Page no.
Graph no.1 Gross Profit ratios 26
Graph no.2 Net Profit ratios 27
Graph no.3 Operating Profit ratios 28
Graph no.4 Return on assets 29
Graph no.5 Return on Investments 30
Graph no.6 Current ratios 31
Graph no.7 Quick ratios 32
Graph no.8 Inventory turnover ratios 33
Graph no.9 Working capital turnover ratios 34
Graph no.10 Debt to equity ratios 35
Graph no.11 Debt to assets ratios 36
Graph no.12 Overall growth percentage 38
Figure No Figure Topic Page no.
Figure 1
Present overview of capital goods industry in India9
Figure 2Company’s Vision & Mission
10
Figure 3Bharat Heavy Electricals Limited Board of directors
11

6
Financial statement analysis has long been considered a component of the fundamental research
needed for stock valuation. However, the research has usually been done on the fly. This project
outlines a financial statement analysis for the Bharat Heavy Electricals Limited (BHEL). It
considers the financial study for the past 4 financial years that are: 2016-17, 2017-18, and 2018-
19, 2019-2020.
Finance is regarded as the most important aspect in any company, and it refers to the supply of
funds when they are needed. Any business, large, medium, or small, requires funding to continue
its day-to-day operations and meet its business goals. Finance has been so important in today's
world that it is properly referred to as an organization's lifeblood. No business will succeed if it
lacks sufficient funds. No business will achieve its goals if it lacks sufficient funds. A business's
capital requirements can be divided into two categories: fixed capital and working capital. Fixed
capital represents the measure of capital which is needed for long run to make manufacturing
facilities through acquisition of fixed resources like plant, hardware, land and structures and so on,
working capital alludes to that part of the organization's capital which is required for financing
short terms or current resources like debtors and inventories, marketable investments and so on,
working capital in short, is the measure of assets important to cope up with the operational
activities of the business. Working capital is critical to the smooth operation of a company, just as
blood circulation is critical to a person's survival. New financial management theory places a larger
emphasis on management decision-making and strategy. The position of a financial manager in an
organization is no longer that of a scorekeeper and arranger of accounting data. Rather, he plays a
critical role in resolving difficult management issues. He is not in charge of the company's fortunes,
but he is interested in the most important management judgment of capital distribution.
The ratio analysis was done to simply the variant financial aspects of the company that can be
understandable with less knowledge and time. Hence, presented project can be helpful for the
external users of accounting information of BHEL like investors, general public, clients, and so
on.

7
Chapter I –
Introduction of the Topic
1.1 Rationale of the Study
1.2 Introduction to Capital Goods Industry
1.3 Introduction to BHEL
• Company Profile• Product Profile
1.4 What is ratio analysis?
1.5 Justification of the topic

8
Chapter I: Introduction of the Topic
1.1 Rationale of the Study
The study of different bits of financial information in a business's financial statements is known as
ratio analysis. They're also used by outside investors to figure out variant aspects like a company's
viability, liquidity, and solvency.
Reasons to choose Bharat Heavy Electricals Limited:-
• It is one of the top 10 capital goods company of India;
• BHEL is a public sector company, hence huge number of investors asses its financial data
frequently;
• As BHEL is one of the well-known company of India, it has good number of people (can
be clients or general public) who are interested in assessing its financial position.
Reasons to choose Ratio analysis for BHEL:-
• Understandable by masses;
• Effective way to compare different financial aspects;
• Time & cost friendly;
• Carefully interpreted in detail, including the many other critical variables and metrics that
go into evaluating results.
1.2 Introduction to Capital Goods company
Capital goods are those items which can be used in manufacturing of other items but cannot
be used in producing new product. The capital goods industry is the "mother" of all manufacturing
industries, and it employs a large number of people. Also, it aids the National security and public
infrastructures. Power machines, heavy machinery, process plant equipment, building and mining
equipment, electrical equipment, sewing machinery, printing and packaging machinery, and other
items fall under this category.
It is in the public sector's best interests to improve the capital goods market, and it’s no doubt
that having a strong domestic industry can help raise competition, lower project capital costs, and,
most importantly, allow for cost-effective plant and equipment repairs.
Imported plants are the cheapest, but importers make up for that with high-priced repair contracts
and replacement parts. Since March 2002, the Capital Goods Market has been on the rise as a result

9
of investments in infrastructure, oil and gas, electricity, steel plants, and the automotive industry,
among other things.
In terms of competitiveness, the capital goods market has consolidated over the years. As a result,
the number of players is limited. It is critical to promote capital goods production rather than
imports, as well as value addition and technology transfer because of country's strategic
significance.
Figure 1 Present overview of capital goods industry in India
Source: Invest India [1]
Major Capital goods companies in India:-
The list of companies was gathered from the recent blog -“Top 10 capital goods companies in
India” [2]. The below list is not based on ranks, random sequence is followed.
• ABB India Ltd. :- Majorly producing variant kinds of electrical products and providing
services in power and automation;
• Apar Industries Ltd. :- Majorly producing power/telecom cables conductors, and
transformer/specialty oils;
• Bharat Heavy Electricals Ltd.:- Majorly manufacturing pumps, gas and steam turbines,
sensors, electric motors, boilers, heat exchangers, etc;
• Jain Irrigation Systems Ltd.:- It produces wide range of items including Sprinkler
Irrigation, Tissue Culture Plants, Precision Farming, Drip Irrigation, Green Energy, etc;
• Cummins India Ltd.:- Provides emission solutions, fuel systems, filtration, electrical
power generation systems, etc.;
12%
• Share in manufacturing
5 million
• Direct employment
40%
• T&D equipment demand
$9.97 billion
• Electrical machinery exports

10
• CG Power and industrial solutions Ltd. (Crompton Greaves):- It manufactures
products like power systems, automations systems, consumer products and industrial
systems.
1.3 Introduction to BHEL
Bharat Heavy Electricals Limited (BHEL) is an Indian government-owned engineering and
manufacturing firm headquartered in New Delhi. It was founded by the government of India in the
year 1956. BHEL is India's one of the largest power generation equipment maker.
❖ Company Profile
BHEL is engineering and manufacturing capabilities through many core industries, including
power generation and transmission, aviation, renewable, water, oil and gas, and defence and
aerospace, with an annual turnover of about $4 billion.
Company’s Vision & Mission
Figure 2 Company’s Vision & Mission
Source: BHEL [3]
History of BHEL
BHEL was established in 1964, marking the beginning of India's Heavy Electrical Equipment
industry. In 1974, Heavy Electricals Ltd amalgamated with Bharat Heavy Electricals Ltd. BHEL
became a publicly traded firm in 1991. It eventually gained the capacity to manufacture a wide
range of electrical, electronic, and mechanical equipment for a number of industries, including
transmission, shipping, oil and gas, and other allied industries. BHEL manufactured its first in
Tamil Nadu for high-pressure boilers, the second in Hyderabad (Telangana) for steam turbo
generators, high-pressure pumps and compressors - all with Czechoslovakian cooperation - and
the third in Haridwar (Uttarakhand) for massive steam turbo generation sets and engines, as well
as hydro generation sets including turbines and generators. . Heavy Electricals (India) Limited, for
Vision
• A global engineering enterprise providing solutions for a better tomorrow
Mission
• Providing sustainable business solutions in the fields of Energy, Industry & Infrastructure

11
which work began in Bhopal, was responsible for these three newly conceived projects.
Till November 1964, all of the preliminary work was completed from Bhopal. Then the
government agreed to set up and manage all three units as a one separate company. As a result,
Bharat Heavy Electricals Limited was formed and formally incorporated on November 13th, 1964.
Company’s Board of Directors
Figure 3 Bharat Heavy Electricals Limited Board of directors
Source: BHEL [3]
BHEL – 2019-2020
❖ Total 23547 orders were received in 2019-20;❖ Turnover amounting to Rs. 20491 crore;❖ Profit before tax amounted to Rs.662 crore (loss);❖ Turnover per employee for the year is Rs.33752 lakhs.
Other than this, BHEL also won Governance Now PSU Awards 2020 in three categories: Best
PSE in HR Excellence & Reskilling of Employees, Geo-strategic Reach, and Research and
Innovation. [3]
❖ Product Profile
BHEL has wide range of products that are supplied to over 82 countries around the world [3]. Its
major products are underlined below:-

12
Power: - Thermal, coal, hydro, and nuclear power plants are also part of the power generation
segment. BHEL has been in this industry for nearly five decades, having started with a coal-fired
power plant in 1969. From design to commissioning, the firm has shown turnkey expertise in the
power industry.
Transportation: - BHEL is a leading supplier of electrical propulsion systems and traction
equipment to Indian railways, which runs one of the world's biggest railway networks. India's first
fully air-conditioned AC EMU is powered by IGBT-based propulsion equipment supplied by
BHEL. Full electric locomotives (up to 6000 HP) and EMU coaches are also produced by the
company. For Indian Railways, the company also produces full electric locomotives (up to 6000
HP) and EMU coaches. BHEL produces diesel electric locomotives (up to 3000 HP) for various
factories and power utilities' shunting needs. For metro trains and Indian Railways, BHEL has
expanded into track maintenance machines and coach production.
Water plants: - In 1999, the company built the first seawater reverse osmosis (SWRO) facility.
BHEL has full water supply solutions, such as desalination plants and water treatment plants.
(WTP), effluent treatment plants (ETP), and water treatment plants. Secondary treatment plants
(STP) and tertiary treatment plants (TTP), (ZLD) system with a zero liquid discharge (TTP) system
applications of power stations, factories, and municipalities. The firm designed the world's first
seawater reverse osmosis system.
Oil & Gas plants: - Onshore drilling rigs with AC-SCR systems or AC drives integrating the new
state-of-the-art technologies; handheld rigs, work-over rigs, and sub-sea wellheads are all available
from BHEL. Also, it supplies to drilling firms with wellheads and X-Mas tree valves with a
pressure level of up to 10,000 psi for onshore and offshore applications. Casing protection systems,
mud line stabilization systems, and block valves have also been supplied for offshore use.
Renewable: - BHEL has developed experience in crucial sections of the silicon value chain, such
as processing of silicon wafer to cell, processing of cell to PV module, and design, supply,
construction, commissioning, and O&M of grid interactive utilities, rooftop solar, canal top, and
floating solar PV power plants, with a current portfolio of more than 465 MW in the field of
photovoltaic.

13
Defence & Aerospace: - BHEL has established itself as a trusted provider of equipment and
services to the Indian defence forces for more than two decades. Super rapid gun mounts, strategic
naval vehicles, advanced platform control systems, thermo pressed parts, turret castings for T72
tanks, simulators, castings and forgings, and other items are among the company's major offerings.
Energy saving solutions: - BHEL is making a huge contribution to the nation's e-mobility
mission. In the past, BHEL had produced and supplied over 300 battery-powered road vehicles.
BHEL provides battery energy storage systems to supplement the insufficient electricity generated
by a solar power system or a standalone battery energy storage system connected to the grid, with
features such as energy time shifting, power smoothing, and frequency regulation.
1.4 What is Ratio Analysis?
A ratio analysis is a study of line items in a company's financial statements. Ratio analysis is used
to assess a variety of problems with a business, including liquidity, operational performance, and
profitability. Since financial statements are a primary source of knowledge for an entity, this
method of research is very helpful to any analysts outside of a company. Corporate insiders, who
have better access to more accurate organizational knowledge about the business, find ratio
research less helpful. It's particularly helpful in the following ways:
Importance of ratio analysis:
1) A graph of the trend – Trend Line
Ratios analysis could also be used by businesses to see whether there is a pattern in their financial
results. Data from financial statements were collected over a wide number of reporting periods
from established businesses. The resulting pattern can be used to forecast future financial results
as well as recognize any potential financial turbulence that would be impossible to predict using
ratios alone. The pattern obtained will be used to forecast projected financial results as well as
classify any potential financial turbulence that would be impossible to forecast using ratios over
a particular reporting period.
2) Effectiveness of operations
Financial ratio analysis can also be used by a company's administration to calculate the degree of
performance in the asset and liability management. Unnecessary costs are incurred as a

14
consequence of inefficient asset use, such as motor cars, property, and buildings, all this can be
avoided with ratio analysis. Financial ratios can also be used to decide if financial services are
being used too much or too less.
3) For comparing
One of the applications of ratio analysis is to equate a company's financial results to that of related
companies in the field in order to determine the company's market position. Obtaining financial
ratios from established rivals and matching them to the company's ratios will assist management
in identifying competition weaknesses and examining its competitive advantage. Obtaining
financial ratios from established rivals and applying them to the company's ratios will assist
management in identifying competition differences and examining the company's strategic
advantages, strengths, and weaknesses. The details will then be used by management to make
decisions aimed at improving the company's business place.
1.5 Justification of the topic
Ratio analysis is a mathematical method for determining a company's operational performance,
liquidity, sales, and profitability by examining its financial statements. It is used by analysts and
investors to assess the financial health of companies by carefully analyzing comparative results
and financial statements. By analyzing the company's results for a given period helps in
defining industry benchmarks, comparative statistics and analysis will provide insight into its
performance. Ratio analysis presents the study that is understandable by the masses and easy to
predict and give opinions on. [4] Hence, I chose ratio analysis to study the financial well-being of
BHEL for past 4 years through ratio analysis.

15
Chapter II –
Review of Literature
2.1 International Reviews
2.2 National Reviews

16
Chapter II: Review of Literature
2.1 International Reviews
• Y. A. Babalola, F. R. Abiola (2013) investigates how financial ratios are used in
accounting and financial reporting analysis to assist management in comprehending a
company's results, financial condition, and operating efficiency. This research looks into
how financial ratios are used in accounting and financial reporting analysis to help
management understand a company's performance, financial status, and operational
quality. [5][5]
• Qasim Saleem & Ramiz Ur Rehman (2011) conducted a study that uncovers the
relationship between liquidity and profitability so that any company can sustain it in their
day-to-day operations. The study's key findings show that each ratio (variable) has a major
impact on the financial conditions of businesses of various sizes, with liquidity ratios being
the most important. Profitability ratios are also critical in determining a company's
financial status. [6][6]
2.2 National Reviews
• Ravi Prakash Gupta, Dr. Manoj Kumar Mishra (2020) has presented a financial study
for BHEL. The primary aim of this paper is to translate BHEL's financial results. In today's
global marketplace, a company's financial health is critical. In the long term, a company
that fails to maintain its financial situation may not be able to compete in the industry. With
the aid of the Z score model, this paper analyses the company's financial stability. [7][7]
• Rajesh K. Yadav, Nishant Dabhade (2013) has conducted the study that aims to identify
the core variables that have a significant impact on the performance management system,
with a focus on BHEL, Bhopal (M.P.). Performance assessment is a continuous method of
defining, evaluating, and improving employee and team performance while also aligning
results with the organization's strategic objectives. [8]

17
Chapter III –
Research Methodology3.1 Objectives of the Study
3.2 Hypothesis
3.3 Scope of the Study
3.4 Limitation of the study
3. 5 Ratios selected for the study
Chapter III: Research Methodology
Data collection: - . A secondary data has been gathered about BHEL industry and its financial
statements to perform the ratio analysis. The researcher mainly used data from BHEL’s Annual

18
Report to compile the data. To provide a definitive view, the researcher also used industrial data
released by different web-based agencies.
Analytical tool: - To simplify and compare the BHEL’s growth in terms of different financial
aspects, the presented study follows the “Ratio Analysis” for data interpretation.
Data presentation: - Graphs and tables are drawn out to imply the change of ratios in different
years.
3.1 Objectives of the Study
❖ To ascertain the yearly fluctuations in terms of profitability and liquidity of BHEL.
❖ To ascertain various types of ratios in the BHEL Company from the years 2016-17 to 2019-
20.
3.2 Hypothesis
❖ H0:- There is no significant growth in the overall financial performance of BHEL, Bhopal
over past 4 years.
❖ H1:- It is assumed that overall financial performance of BHEL, Bhopal over past 4 years is
satisfactory.
3.3 Scope of the Study
The presented literature is confined to the ratio analysis of the BHEL, Bhopal. Its chief aim is to
assess the financial statements of BHEL for past four years: 2016-17, 2017-18, 2018-19, and 2019-
20 to present a comparable financial study.
3.4 Limitation of the study
The limitations relevant to the research include:
• As the time span of the study was just 3 months, it is impossible to gather total information.
• Gathering the confidential or exclusive data is not possible for us.
• The analysis and the interpretation of data are limited to the required information.
3. 5 Ratios selected for the study

19
There are various types of ratios for almost every nature of the financial study. Below is the list of
selected ratios used for this study: -
I. Profitability ratios
Profitability ratios show how well a company can earn sales and earnings from its activities.
i) Gross profit ratio
The Gross Profit Ratio shows the relationship between gross profit and revenue from operations,
i.e. an organization's net sales. As a result:
Aim: - The key goal of calculating the Gross Profit Ratio is to figure out how efficient a company
is. Much higher Gross Profit Ratio is preferable because it allows more room for operating costs
and reserve production.
ii) Net profit ratio
The relationship between net profit and net sales is measured by the Net Profit Ratio. It displays
the amount of Net Profit received from Operations Revenue. The willingness of a company to pay
all overhead expenses, including indirect costs, is measured by this ratio.
Aim: - Net Profit Ratio aims to measure the company's overall performance. Higher the Net Profit
Ratio, stronger is the company. A rise in the percentage from the previous year indicates that
operating performance has improved.
iii) Operating profit ratio
The Operating Profit Ratio calculates the relation between Operating Profit and Revenue from
Operations (Net Sales).
Gross profit ratio = (Gross profit / Net sales) X 100
Net profit ratio = (Net profit / Net sales) x 100
Operating profit ratio = (Net Operating profit/ Net sales) x 100

20
Aim: - The aim of calculating the Operating Profit Ratio is to establish the business's operational
performance. An increase in the percentage from the previous timeframe indicates that the business
enterprise's financial performance has improved.
iv) Return on assets
The return on assets (ROA) is a profitability ratio that shows how much profit a business can make
on its assets.
Aim: - The return on assets (ROA) calculates how effective a company's management is at
extracting profits from its assets on the balance sheet. The higher ROA, the more efficient a
company's management is at managing its balance sheet to generate profits.
v) Return on investment
Return on Investment (ROI) shows the relationship of profit (profit before interest and tax) with
capital employed. Either profit or loss is the outcome of a business's activities.
Aim: - The proprietors' (shareholders') assets and loans are the funds or sources used in the
business to gain profit/loss. The ROI tells how much percentage of return is earned on its
investments. The increase in ROI is considered as increase in performance.
II. Liquidity ratios
Liquidity ratios are used to determine how much liquidity is available to pay off loans. A company
needs liquid capital in order to fulfill its short-term obligations. Liquidity refers to a firm's capacity
to pay their creditors when they become due. As a result, we must quantify Liquidity Ratios in
order to assess liquidity. These ratios are short-term in nature.
i) Current ratio
It is one of the most often used ratios for determining a company's short-term solvency or liquidity.
Return on assets ratio = (Net profit/ Total average assets) x 100
Return on investment ratio = (Net Profit before Interest, Tax and Dividend/Capital Employed) x 100
= (COGS + Operating Expenses/ Net sales) X 100

21
Aim: - It determines if existing assets are enough to pay current obligations with a margin of safety
to provide for future declines in the realization of current assets.
ii) Quick ratio
Acid-test Ratio is another name for it. The quick ratio calculates the relationship between
quick assets and current liabilities. It determines whether there are sufficient readily convertible
short-term funds to cover existing debts. Inventories are not taken into calculations because they
are not easily convertible into cash. Also, prepaid payments are often excluded unless they are paid
in full and cannot be turned into cash.
Aim: - The Quick Ratio, or the Acid-test Ratio, should be 1:1. The quick ratio assesses the
company's ability to meet existing obligations without selling its inventory or obtaining new
funding.
III. Activity or turnover ratios
Activity ratios are used to assess the efficiency of a company's resource allocation. The efficiency
in which assets are used or handled is measured by these ratios. The relationship between sales and
any given asset is illustrated by these ratios.
i) Inventory turnover ratio
The relationship between the cost of product delivered and average stock is the subject of this ratio.
Inventory Turnover Ratio or Stock Velocity Ratio is other names for it.
Aim: - It effectively counts the number of times a stock rotates (completes a cycle) and the revenue
it generates in a given accounting period.
ii) Working Capital turnover ratio
Current ratio = Current Assets/ Current liabilities
`
Quick ratio = Quick Assets/ Current liabilities
`
Inventory turnover ratio = COGS/ Average inventory
`

22
This ratio can be used to determine how well the company uses its Working Capital to finance its
sales output. Working capital is described as a company's excess of existing assets over current
liabilities.
Aim: -A high working Capital Turnover ratio indicates that working capital is being used
effectively. On the other hand, a low ratio may mean that there are so many debtors or a very large
inventory which is not an effective use of capital.
IV. Leverage ratio
The Leverage Ratios are calculated to assess an organization's long-term viability and structure.
The mix of funds provided by the owners and lenders is measured by leverage ratios, also known
as Solvency Ratios. This ratio guarantee long-term fund lenders that interest will be paid on time.
Also, the principal will be repaid when the loan matures.
i) Debt-equity ratio
It calculates the proportion of debt funds and equity funds.
Aim: - A high Debt Equity Ratio means that borrowers are at risk while the low suggests that there
is a large safety cushion. Shareholders Equity includes equity and preferred share capital as well
as post-accrued earnings, although it does not contain fictitious cash.
ii) Debt to Total Assets Ratio
It calculates the debt-to-total-asset ratio. Total debt or outside obligations include short-term and
long –term borrowings from financial institutions, deposits, debentures, bonds, etc
Aim: - It says that it shows the gross assets financed by loans. The higher the debt-to-total-assets
ratio depicts higher the investment risks.
Working capital turnover ratio = COGS/ Working Capital
`
Debt-equity ratio = Total debts/ Shareholder’s fund
`
Debt to total assets ratio= Total debts/ Total assets
`

23

24
Chapter IVData representation & Analysis
4.1 Data representation & Interpretation
4.2 Hypothesis testing

25
Chapter IV: Data representation & Analysis
4.1 Data representation & Interpretation
Ratio analysis of Bharat Heavy Electricals Ltd from its annual reports for the years 2016-17, 2017-
18, 2018-19, and 2019-20 is presented as below:-
I. Profitability ratio analysis
i. Gross profit ratio = Gross profit / Net sales x 100
Important calculations:
• Gross profit = Net sales – COGS
• COGS = Opening Inventory + Net Purchases + Direct Expenses – Closing Inventories
Table 1 Gross profit ratios
(₹ in crore)
Year Net Sales Gross profit/loss Gross profit ratio
2016-17 28447.04 1476.67 5.19%
2017-18 28813.00 2371.39 8.23%
2018-19 30422.68 2522.31 8.29%
2019-20 21486.06 -159.25 -0.74%
5.19
8.29 8.3
-0.74
-2-10123456789
2016-17 2017-18 2018-19 2019-20
Gro
ss P
rofit
ratio
s
Years

26
Graph 1 Gross profit ratio
Interpretation:-
In the year 2016-17, gross profit was 5.19% and it turn 8.23% and further increases to 8.29% but finally crashes in the 2019-20 to -0.74%. It has decreasing slope trend line.
ii. Net profit ratio =Net profit / Net sales x 100
Important calculations:
Net profit = Revenue from Operations – COGS – Operating Expenses – Non-operating Expenses + Non-operating Incomes – Tax
Table 2 Net profit ratios
(₹ in crore)
Year Net Sales Net profit/loss Net profit ratio
2016-17 28447.04 495.86 1.74%
2017-18 28813.00 806.60 2.79%
2018-19 30422.68 1208.65 3.97%
2019-20 21486.06 -1472.97 -6.85%
Graph 2 Net profit ratios
1.742.79
3.97
-6.85
-8
-6
-4
-2
0
2
4
6
2016-17 2017-18 2018-19 2019-20
Net
pro
fit ra
tios
Years

27
Interpretation: - The graph of net profit for BHEL is very unsatisfactory. It grew at good pace from last 3 years, but in 2019-20 it crashed. Also, the decline level i.e. -6.85% is way higher than its growth levels from past year i.e. 1.74%, 2.79% and 3.97%.
iii. Operating profit ratio = (Net Operating profit/ Net sales) x 100
Table 3 Operating profit ratios
(₹ in crore)
Year Net Sales Operating profit Operating profit ratio
2016-17 28447.04 1888.82 6.63%
2017-18 28813.00 2700.95 9.37%
2018-19 30422.68 2899.36 9.53%
2019-20 21486.06 451.92 2.10%
Graph 3 Operating profit ratios
Interpretation: - Unlike gross and net losses of the company in 2019-20. There is no loss from operating activities but still it has huge breakdown in it i.e. falling from 9.53% (2018-19) to 2.10% in 2-019-20.
iv. Return on assets (ROA) = (Net profit/ Average total assets) x 100
Important calculations:-
Average total assets= Opening total assets + Closing total assets
6.63
9.37 9.53
2.1
0
2
4
6
8
10
12
2016-17 2017-18 2018-19 2019-20
Ope
ratin
g pr
ofit
ratio
s
Years

28
Table 4 Return on assets (ROA)
(₹ in crore)
Year Net Profit Average total assets ROA
2016-17 495.86 63196.57 0.78%
2017-18 806.60 62509.675 1.29%
2018-19 1208.65 64067.045 1.88%
2019-20 -1472.97 62851.235 -2.34%
Graph 4 Return on assets (ROA)
Interpretations: - The ROA of BHEL grew positively from 2016-17 to 2017-18 and so in 2018-19. 1.86% is the highest of all 4 year. But again fall down to -2.4% in 2019-20 that is the lowest of all four year.
v. Return on Investment = (Net Profit before Interest, Tax and Dividend/Capital Employed) x 100
Important calculations:-
Capital Employed = Shareholder’s fund + Non-current liabilities
0.781.29
1.88
-2.34
-3-2.5
-2-1.5
-1-0.5
00.5
11.5
22.5
2016-17 2017-18 2018-19 2019-20
Retu
rn o
n as
sets
(RO
A)
Years

29
Table 5 Return on Investment
(₹ in crore)
Year Capital Employed Net profit before tax, dividend and interest
ROI
2016-17 41104.53 1888.82 4.59%
2017-18 41538.92 2700.95 6.5%
2018-19 41060.24 2899.36 7.06%
2019-20 38624.01 451.92 1.17%
Graph 5 Return on investment ratios
Interpretation: - The Company’s ROI has been on a increasing trend line in 2016-17, 2017-18, and 2018-19. But it has declined to 1.17% in the year 2019-20
II. Liquidity ratio analysis
i. Current ratio = Current assets/ Current liabilities
Table 6 Current ratios
(₹ in crore)
Year Current liabilities Current assets Current ratio
2016-17 20125.67 42893.96 2.13:1
4.59
6.57.06
1.17
0
1
2
3
4
5
6
7
8
2016-17 2017-18 2018-19 2019-20
Retu
rn o
n in
vest
men
t rat
ios
Years

30
2017-18 22250.23 43188.39 1.94:1
2018-19 23055.77 38339.89 1.66:1
2019-20 22647.41 32703.53 1.44:1
Graph 6 Current ratios
Interpretation: - BHEL’s trend line for the current ratio is straight sloping downwards. The ideal current ratio is 2:1. And, BHEL managed to maintain this ideal ratio only in the year 2016-17 (2.13:1). Other all three years have lower current ratios. Although, 2017-18 (1.91:1) was very close but couldn’t reach 2:1.
ii. Quick ratio = Quick assets/ Current liabilities
Important calculations:-
Quick assets= Current assets – (Inventory+ Prepaid expenses)
Table 7 Quick ratios
(₹ in crore)
Year Current liabilities Quick assets Ratio
2016-17 20125.67 35521.58 1.76:1
2017-18 22250.23 36929.6 1.65:1
2.131.94
1.661.44
0
0.5
1
1.5
2
2.5
2016-17 2017-18 2018-19 2019-20
Curr
ent r
atio
s
Years

31
2018-19 23055.77 30226.4 1.31:1
2019-20 22647.41 23168.07 1.02:1
Graph 7 Quick ratios
Interpretation: - The ideal quick ratio is 1:1. The company has maintained the quick ratios in all four years. But, it is on a declining trend-line, which needs attention.
III. Activity/turnover ratio analysis
i. Inventory turnover ratio = COGS/ Average inventory
Important calculations:-
Average inventory = Opening inventory + Closing inventory / 2
COGS= Net sales – Gross profit
Table 8 Inventory turnover ratios
(₹ in crore)
Year COGS Average Inventory Inventory turnover ratio
2016-17 26970.37 8487.265 3.177 times
2017-18 26441.61 6815.57 3.87 times
1.761.65
1.31
1.02
00.20.40.60.8
11.21.41.61.8
2
2016-17 2017-18 2018-19 2019-20
Qui
ck ra
tios
Years
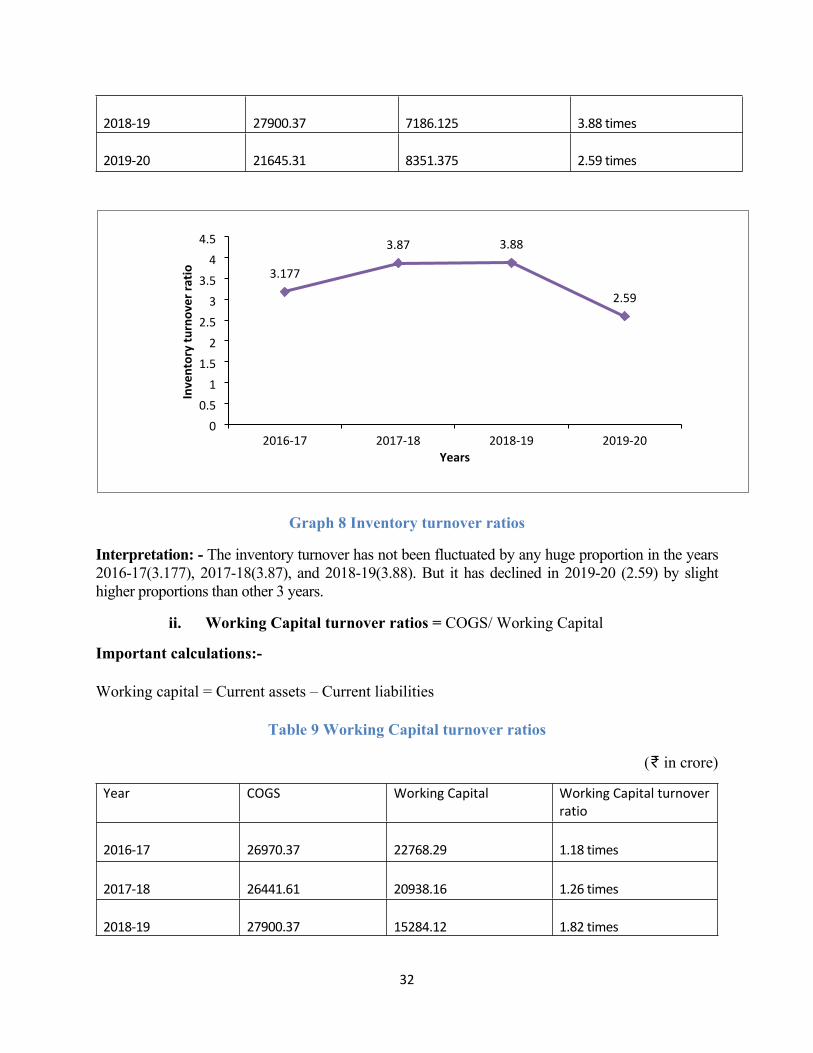
32
2018-19 27900.37 7186.125 3.88 times
2019-20 21645.31 8351.375 2.59 times
Graph 8 Inventory turnover ratios
Interpretation: - The inventory turnover has not been fluctuated by any huge proportion in the years 2016-17(3.177), 2017-18(3.87), and 2018-19(3.88). But it has declined in 2019-20 (2.59) by slight higher proportions than other 3 years.
ii. Working Capital turnover ratios = COGS/ Working Capital
Important calculations:-
Working capital = Current assets – Current liabilities
Table 9 Working Capital turnover ratios
(₹ in crore)
Year COGS Working Capital Working Capital turnover ratio
2016-17 26970.37 22768.29 1.18 times
2017-18 26441.61 20938.16 1.26 times
2018-19 27900.37 15284.12 1.82 times
3.177
3.87 3.88
2.59
00.5
11.5
22.5
33.5
44.5
2016-17 2017-18 2018-19 2019-20
Inve
ntor
y tu
rnov
er ra
tio
Years

33
2019-20 21645.31 10056.12 2.15 times
Graph 9 Working Capital turnover ratios
Interpretation: - The working capital ratio of the company has an increasing trend line and the proportions of increase are much higher between years 2018-19(1.82) and 2019-20 (2.15) compared to 2016-17 (1.18) and 2017-18 (1.26).
IV. Leverage ratio analysis
i. Debt to equity ratio= Total debts/ Shareholder’s fund
Table 10 Debt to equity ratio ratios
(₹ in crore)
Year Total debts Shareholder’s funds Debt to equity ratios
2016-17 149.86 32294.44 0.00 :1
2017-18 99.45 32601.08 0.00 :1
2018-19 2585.65 31431.8 0.08 :1
2019-20 5065.31 29181.21 0.17 :1
1.18 1.26
1.82
2.15
0
0.5
1
1.5
2
2.5
2016-17 2017-18 2018-19 2019-20
Wor
king
Cap
ital t
urno
ver r
atio
s
Years

34
Graph 10 Debt to equity ratio
Interpretation: - The Company’s Debt to equity ratio is satisfactory. But in the year 2019-20 (0.17), the ratio is more than the 2x of 2018-19 (0.08). However, all year’s ratio can be considered good enough.
ii. Debt to Total Assets Ratio= Total Debts/ Total Assets
Table 11 Debt to total assets ratios
(₹ in crore)
Year Total Debts Total assets Debt to asset ratio
2016-17 149.86 31095.61 0.00 :1
2017-18 99.45 27862.06 0.00 :1
2018-19 2585.64 25201.17 0.10 :1
2019-20 5062.31 5062.31 0.23 :1
0 0
0.08
0.17
00.020.040.060.08
0.10.120.140.160.18
2016-17 2017-18 2018-19 2019-20
Debt
to e
quity
ratio
Years

35
Graph 11 Debt to total assets ratios
Interpretation: - The debt to assets ratio is on the increasing trend line that is not a good indicator.
4.2 Hypothesis Testing
❖ H0:- There is no significant growth in the overall financial performance of BHEL, Bhopal
over past 4 years.
❖ H1:- It is assumed that overall financial performance of BHEL, Bhopal over past 4 years is
satisfactory.
Evaluating the overall growth of ratios:-
Overall growth = Current year ratio – Base year ratio / Base year ratio x 100
Table 12 Overall growth percentage
Table No. Graph No. Type of Ratio Current year
ratio
Base year ratio Overall
Growth
Table 1 Graph 1 Gross Profit ratio -0.74 5.2 -114.23%
Table 2 Graph 2 Net Profit ratio -6.85 1.74
-493.67%
Table 3 Graph 3 Operating profit ratio 2.1 6.63 -68.32%
0 0
0.1
0.23
0
0.05
0.1
0.15
0.2
0.25
2016-17 2017-18 2018-19 2019-20
Debt
to e
quity
ratio
Years

36
Table 4 Graph 4 Return on assets -2.34 0.78 -400%
Table 5 Graph 5 Return on investment 1.17 4.59 -74.5%
Table 6 Graph 6 Current ratio 1.44 2.13 -32.39%
Table 7 Graph 7 Quick ratio 1.02 1.76 -42.04%
Table 8 Graph 8 Inventory turnover ratio 2.59 3.177 -18.47%
Table 9 Graph 9 Working capital
turnover ratio
2.15 1.18 82.2%
Table 10 Graph 10 Debt-to-equity ratio 0.17 0.00 0%
Table 11 Graph 11 Debt-to-asset ratio 0.23 0.00 0%

37
Graph 12: Overall growth percentage
Interpretation:-
The above chart clearly depicts that the null hypothesis is acceptable. There is no significant growth in the ratios over the past 4 years. Instead, there is a turn down of 9 ratios out of 11 ratios. The company is experiencing the major decline in its growth during the years.
-114.23
-498.67
-68.32
-400
-74.5
-32.39
-42.04
-18.47
82.2
0
0
-600 -500 -400 -300 -200 -100 0 100 200Grwoth percentage
Inventory turnover ratioQuick ratioCurrent ratioROIROAOperating profit ratioNet profit ratio
Quick ratioCurrent ratio
ROI
ROA
Operating profit ratio
Net profit ratioGross profit ratio
Working capital turnover ratio
Debt-to-equity ratio
Debt-to-asset ratio

38
Chapter VResults & Discussion
5.1 Major Findings
5.3 Conclusion

39
Chapter V: Results & Discussion
5.1 Major Findings
By the ratio analysis, some major aspects found in the financial reports of Bharat Heavy Electricals
Ltd. that are detailed below: -
Profitability through sales - From Graph 1 and Graph 2 it is noted that from past three year, company
was growing in terms of profits and got to a great peak level in the year 20218-19 but crashing in the
year 2019-20. Although with Graph 3, it can be seen that company incurred losses but it is still profitable
with its operating activities in 2019-20. But still the operating profit is lower in the year compared with
past 3 years.
• Overall findings - Among last 4 years, 2018-19 (₹1208.65 crore Net Profits) has been the best
of all in terms of profits earned from sales. Conversely, year 2019-20 (₹1472.97 crore Net
losses) has been the most disappointing in this concept.
Profitability through assets (ROA) - Further, it was found that BHEL is not utilizing its assets to the
optimal levels. Through Graph 4, it is signified that the company’s return on its assets is poor from
past 4 yours. Besides, in the year 2018-19 it has highest of all ROA i.e.1.86 % but it turned straight
to -2.4% in the next year. The Return on assets or ROA is facing a downward slope implying that
assets at BHEL aren’t performing well enough.
• Overall findings – The ROA of the company is not up to mark for all 4 years. The 2019-
20 (-2.4%) is the poorest year of them all.
Profitability through investments (ROI) - Also, with Graph 5, one can notice the same declining
trend of ROI as in ROA. But on the positive sight ROI has way better results than ROA. Many potential
investors consider 6% to 7% ROI as the good sign. BHEL has performed great in the years 2017-18
(6.5%) and 2018-19 (7.6%) but desolately gone down to 1.17% in the year 2019-20.
• Overall findings – Year 2018-19 (7.6%) derived the maxed out ROI compared to other 3
years. Likewise, 2019-20 (1.17%) yields the lowest of all.
Liquidity- The Company’s current ratio has been continuously falling down the ideal ratio i.e. 2:1
(Graph 6). From last 3 years. Also, it has been facing a downward slope since 2017-18. It shows
the urge to better current assets management that can help the company to cover its debts

40
efficiently. Conversely, the quick ratio of the company is good enough as all four year ratios are
above the ideal quick ratio i.e. 1:1 (Graph 7). Also, besides having satisfactory quick ratios for all
4 years, it is noted that it still follows the same decreasing trend line as in current ratios.
• Overall findings- Year 2016-17 has the best of all current ratio i.e. 2.13:1, plus it is the
only year where current ratio is above the ideal current ratio. On the other hand, year 2019-
20 has the lowest current ratio i.e. 1.44:1. Similarly, 2016-17 has the finest quick ratio i.e.
1.76:1 and 2019-20 has the lowest i.e. 1.02:1.
Inventory conversion- BHEL doesn’t have many changes in its inventory turnover ratios around the
4 years. The ratios are merely lower than it should be, it implies that the sales are weak and most of the
stock is kept unsold. This section needs attention of the company as ratios were already lower from
2016-17, and since then it kept on decreasing further in the year 2019-20.
• Overall findings- As in the Graph 8 highest inventory turnover ratio was shown in the year
2018-19 i.e. 3.88 times, which is not much different from previous year’s ratio i.e. 3.87 times.
But in the next year 2019-20, the ratio decreased with greater proportion and it turned 2.59
times.
Working capital- Many market interpreters believes that an ideal working capital turnover ratio is
between 1.2 to 2 times. Now with that effect, BHEL has fine working capital turnover ratios, as
reflecting in Graph 9, 2016-17 is the only year where it is slightly below the ideal ratio i.e. 1.18 times.
Also, it has the increased ratios in next two years which is a good sign. But in the year 2019-20, it should
be capped from increasing further because it depicts major liquidity problems in the organization.
• Overall findings- In viewing working capital turnover ratios of BHEL, the finest ratio was
found in the year 2018-19 i.e. 1.82 times because it is neither much lower nor much higher. The
year 2019-20 could’ve been considered a good year but since the graph has the increasing trend
line, ratios may increase further which will not be good. Hence it is not a good ratio and it
should be stopped from increasing further.
Debt to equity- For debt to equity ratios, the lower the better, and BHEL has pretty good debt to equity
ratios in past 4 years. From Graph 10, 2016-17 and 2017-18 doesn’t even have any values. Also, in
2018-19 and 2019-20, the growth of ratio is below any red flags. The debt to equity seems satisfactory.

41
Debt o assets- With reference to
Graph 11, BHEL’s debt to assets is also fine. Same increasing trend is followed as in debt to equity
ratios. Having lower debt to assets ratios depicts that the company hasn’t bought much of its assets with
creating corresponding debts. The ratios were satisfactory from 3 past years but in the year 2019-20, it
increased with huge proportion and turned 0.23 from 0.00 (2016-17). And, the graph is having trend
line, so the management should consider putting attention to it soon.
5.3 Conclusion
Finance plays an important part in a variety of fields. Each operation requires a high level of
awareness, as each operating year demonstrates varying levels of development in various fields.
As a result, each inflow and outflow of the enterprise demonstrates the management's productivity
and the most efficient use of available capital. In this company, I had a fantastic time. It is a huge
and well-established organization.
After analyzing and interpreting the above 11 different types of ratios I can conclude that liquidity
position of Bharat Heavy Electricals Ltd. is not-satisfactory. Also, the asset management needs the
company’s peer attention. It can’t be a concurrence that company’s performance has decreased
just after having one of the best years. The increasing slopes have been crashed poorly. There
could be many reasons to the same but Covid-19 outbreak and lockdown can be considered one of
the major factors that affected company’s growth. Because the proportion of decrease in profits is
even higher than the proportion of increase from past 3 years, it is the clear sign that BHEL has
0 0
0.1
0.23
0
0.05
0.1
0.15
0.2
0.25
2016-17 2017-18 2018-19 2019-20
Debt
to e
quity
ratio
Years

42
been deficiently affected by the Covid-19 in the year 2019-20 and may further get affecting if no
actions or no new strategies are adopted soon.
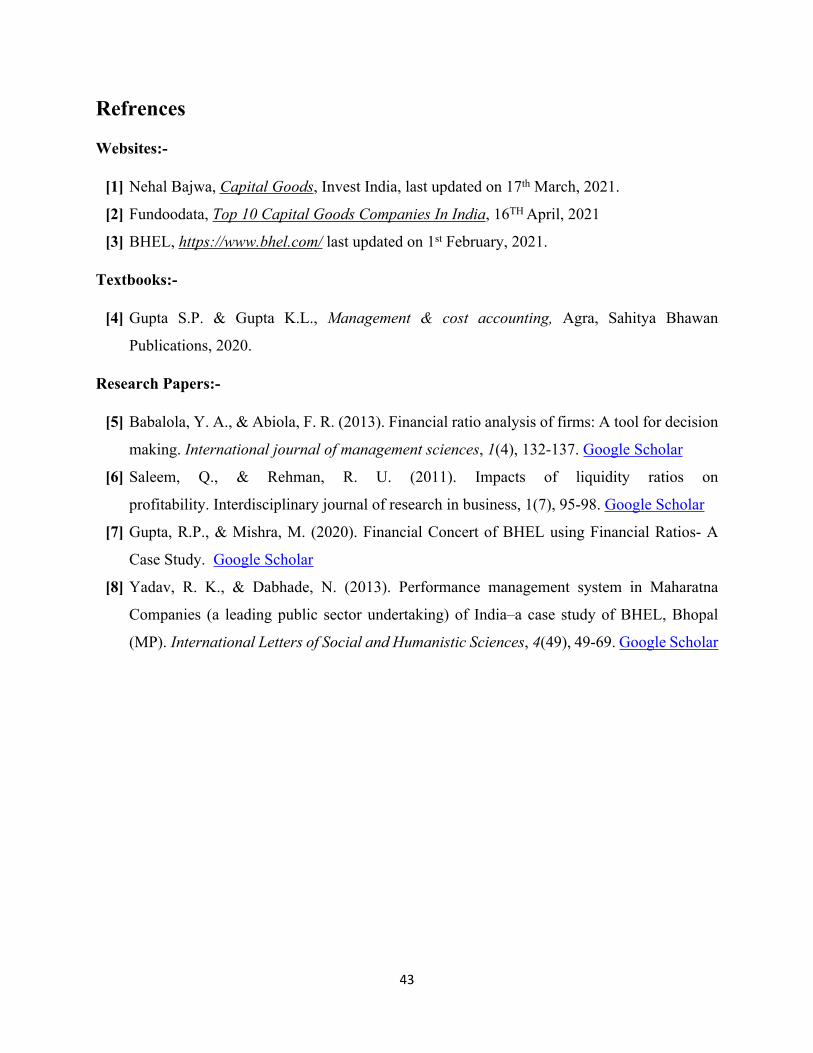
43
Refrences
Websites:-
[1] Nehal Bajwa, Capital Goods, Invest India, last updated on 17th March, 2021.
[2] Fundoodata, Top 10 Capital Goods Companies In India, 16TH April, 2021
[3] BHEL, https://www.bhel.com/ last updated on 1st February, 2021.
Textbooks:-
[4] Gupta S.P. & Gupta K.L., Management & cost accounting, Agra, Sahitya Bhawan
Publications, 2020.
Research Papers:-
[5] Babalola, Y. A., & Abiola, F. R. (2013). Financial ratio analysis of firms: A tool for decision
making. International journal of management sciences, 1(4), 132-137. Google Scholar
[6] Saleem, Q., & Rehman, R. U. (2011). Impacts of liquidity ratios on
profitability. Interdisciplinary journal of research in business, 1(7), 95-98. Google Scholar
[7] Gupta, R.P., & Mishra, M. (2020). Financial Concert of BHEL using Financial Ratios- A
Case Study. Google Scholar
[8] Yadav, R. K., & Dabhade, N. (2013). Performance management system in Maharatna
Companies (a leading public sector undertaking) of India–a case study of BHEL, Bhopal
(MP). International Letters of Social and Humanistic Sciences, 4(49), 49-69. Google Scholar

44
AnnexureSource: - BHEL Annual Reports
BHEL Annual Reports 1 2016-17

45

46

47

48
BHEL Annual Reports 2 2017-18
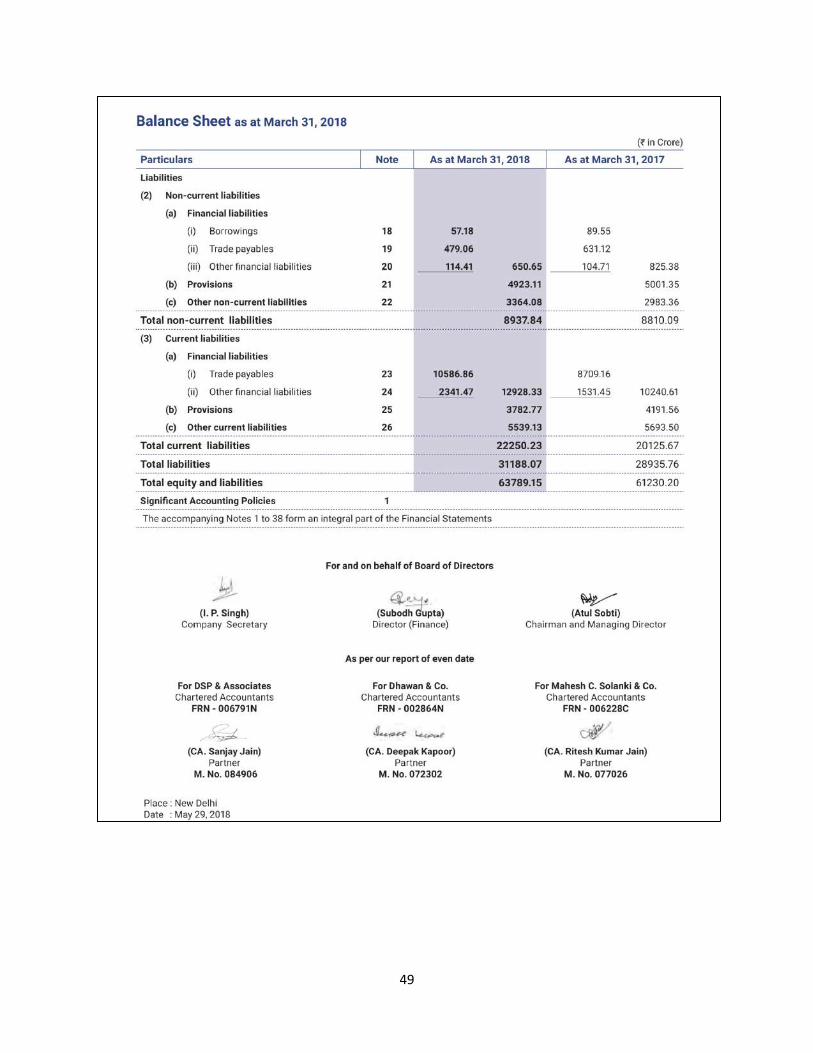
49

50

51

52
BHEL Annual Reports 3 2018-19

53
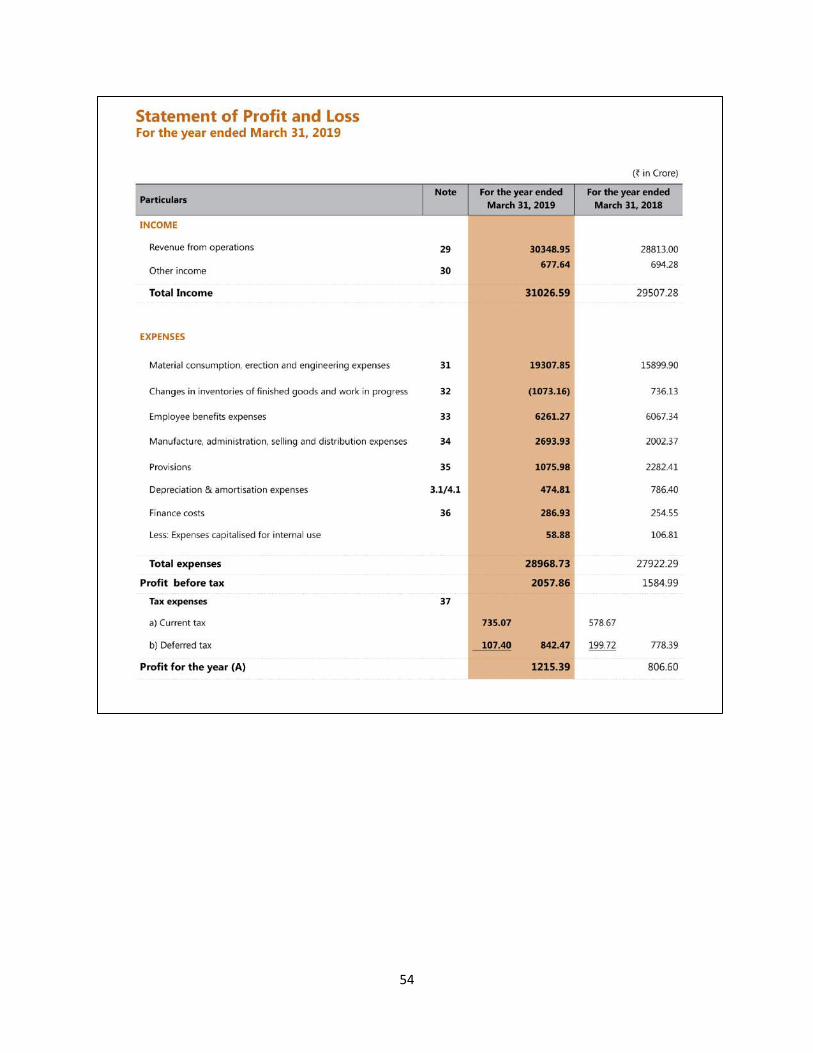
54

55

56
BHEL Annual Reports 4 2019-20

57

58

59

60
Study on Mutual Fund Management
Research project submitted in partial fulfillment of the requirements for the degree of
BCOM HONS
By
ANSH JOSHI
to the
DEPARTMENT OF COMMERCE
BHOPAL SCHOOL OF SOCIAL SCIENCES
April 2021
Submitted by Guided by
Ansh Joshi Dr.Smitha Pillai
Student Associate professor

61
CERTIFICATE
It is to certify that the work contained in the project report titled “ Study on Mutual fund
Management ”, by ANSH JOSHI, has been carried out under my supervision and that this work
has not been submitted elsewhere for a degree.
Signature of the supervisor: ………………………
Name : Dr. SMITHA PILLAI, ASSOCIATE PROFESSOR
Department : Commerce
BHOPAL SCHOOL OF SOCIAL SCIENCES
30th April,2021
DECLARATION

62
I hereby declare that this project report entitled “A study on mutual fund management ” was carried
out by me for the degree of BCOM Honors under the guidance and supervision of Dr. Smitha
Pillai (Name of the Supervisor and designation) of Department of Commerce, BSSS College. The
interpretations put forth are based on my reading and understanding of the original texts and they
are not published anywhere in any form. The other books, articles and websites, which I have made
use of are acknowledged at the respective place in the text. This research report is not submitted
for any other degree or diploma in any other University.
Place: Bhopal
Name of the Student: Ansh Joshi
Class & Section: B.com (honors) 3 year ‘A’
Date: 30th April 2021

63
ACKNOWLEDGEMENT
I would like to thank our Principal Dr. Fr. John P.J. and Vice Principal Dr Sr. Sonia Kurien for
their immense support and blessings. I thank our HOD Dr Amit Kumar Nag for his support. I
would like to express my special thanks of gratitude to my research guide Dr. Smitha Pillai,
Associate Professor of Department of Commerce for her valuable suggestions and guidance and
for giving me the golden opportunity to do this wonderful research project on the topic “A study
on mutual fund management ”, Without her help it would have been difficult for me to have
reached this state of completion of my project report. Also, I would like to thank my parents and
friends who helped me a lot in the preparation of this project.
I wish to acknowledge the help of all those who have provided me information, guidance and other
help during my research period.

64
TABLE OF CONTENTSCHAPTER 1: INTRODUCTION OF THE TOPIC ………………………………1
1.1 Rationale of the Study…………………………………………………………………...2
1.2 Introduction to the industry…………………………………………………………..2 - 6
1.3 Introduction to the company……………………………………………………………..6
1.4 Justification of the topic...……………………………………………………………….7
CHAPTER 2: REVIEW OF LITERATURE…...……………………………..9-15
CHAPTER 3: RESEARCH METHODOLOGY……...………………………....16
3.1 Objectives of the Study………………………………………...……………………….17
3.2 Research Hypothesis………………………………………...………………………….17
3.3 Scope of the Study………………………………………...……………………………17
3.4 Limitation of the study………………………………………………………………….17
CHAPTER 4: DATA REPRESENTATION & ANALYSIS…...………………....18
4.1 Data representation & Interpretation………………………………………………19 - 23
4.2 Hypothesis Testing……………………………………………………………………..24
CHAPTER 5. RESULTS & DISCUSSION……………………………………255.1 Major Findings…………………………………………………………………………26
5.2 Discussions……………………………………………………………….…………….27
5.3 Conclusion……………………………………………………………………………. 28
Refrences………………………………………………………………...28
Bibliography……………………………………………………………………………...30

1
CHAPTER 1: INTRODUCTION OF THE TOPIC1.1 Rationale of the Study
1.2 Introduction to the industry
1.3 Introduction to the company
1.4 Justification of the topic

2
STUDY ON MUTUAL FUND MANAGEMENT Introduction to the topic
1.1 Rationale of the study
There are a lot of investment avenues available today in the financial market for an investor with
an investable surplus. He can invest in Bank Deposits, Corporate Debentures, and Bonds where
there is low risk but low return. He may invest in Stock of companies where the risk is high and
the returns are also proportionately high. The recent trends in the Stock Market have shown that
an average retail investor always lost with periodic bearish tends. People began opting for portfolio
managers with expertise in stock markets who would invest on their behalf. Thus we had wealth
management services provided by many institutions. However they proved too costly for a small
investor. These investors have found a good shelter with the mutual funds.
Mutual fund industry has seen a lot of changes in past few years with multinational companies
coming into the country, bringing in their professional expertise in managing funds worldwide. In
the past few months there has been a consolidation phase going on in the mutual fund industry in
India. Now investors have a wide range of Schemes to choose from depending on their individual
profiles.
1.2 Introduction to the Industry
The mutual fund industry in India started in 1963 with the formation of Unit Trust of India, at the
initiative of the Government of India and Reserve Bank of India. The history of mutual funds in
India can be broadly divided into four distinct phases
First Phase - 1964-1987
Unit Trust of India (UTI) was established in 1963 by an Act of Parliament. It was set up by the
Reserve Bank of India and functioned under the Regulatory and administrative control of the
Reserve Bank of India. In 1978 UTI was de-linked from the RBI and the Industrial Development
Bank of India (IDBI) took over the regulatory and administrative control in place of RBI. The first
scheme launched by UTI was Unit Scheme 1964. At the end of 1988 UTI had Rs. 6,700 crores of
assets under management.

3
Second Phase - 1987-1993 (Entry of Public Sector Funds)
1987 marked the entry of non-UTI, public sector mutual funds set up by public sector banks and
Life Insurance Corporation of India (LIC) and General Insurance Corporation of India (GIC). SBI
Mutual Fund was the first non-UTI Mutual Fund established in June 1987 followed by Canbank
Mutual Fund (Dec 87), Punjab National Bank Mutual Fund (Aug 89), Indian Bank Mutual Fund
(Nov 89), Bank of India (Jun 90), Bank of Baroda Mutual Fund (Oct 92). LIC established its
mutual fund in June 1989 while GIC had set up its mutual fund in December 1990.
At the end of 1993, the mutual fund industry had assets under management of Rs. 47,004 crores.
Third Phase - 1993-2003 (Entry of Private Sector Funds)
With the entry of private sector funds in 1993, a new era started in the Indian mutual fund industry,
giving the Indian investors a wider choice of fund families. Also, 1993 was the year in which the
first Mutual Fund Regulations came into being, under which all mutual funds, except UTI were to
be registered and governed. The erstwhile Kothari Pioneer (now merged with Franklin Templeton)
was the first private sector mutual fund registered in July 1993.
The 1993 SEBI (Mutual Fund) Regulations were substituted by a more comprehensive and revised
Mutual Fund Regulations in 1996. The industry now functions under the SEBI (Mutual Fund)
Regulations 1996.
The number of mutual fund houses went on increasing, with many foreign mutual funds setting up
funds in India and also the industry has witnessed several mergers and acquisitions. As at the end
of January 2003, there were 33 mutual funds with total assets of Rs. 1,21,805 crores. The Unit
Trust of India with Rs. 44,541 crores of assets under management was way ahead of other mutual
funds.
Fourth Phase - since February 2003
In February 2003, following the repeal of the Unit Trust of India Act 1963 UTI was bifurcated into
two separate entities. One is the Specified Undertaking of the Unit Trust of India with assets under
management of Rs. 29,835 crores as at the end of January 2003, representing broadly, the assets
of US 64 scheme, assured return and certain other schemes. The Specified Undertaking of Unit
Trust of India, functioning under an administrator and under the rules framed by Government of
India and does not come under the purview of the Mutual Fund Regulations.

4
The second is the UTI Mutual Fund, sponsored by SBI, PNB, BOB and LIC. It is registered with
SEBI and functions under the Mutual Fund Regulations. With the bifurcation of the erstwhile UTI
which had in March 2000 more than Rs. 76,000 crores of assets under management and with the
setting up of a UTI Mutual Fund, conforming to the SEBI Mutual Fund Regulations, and with
recent mergers taking place among different private sector funds, the mutual fund industry has
entered its current phase of consolidation and growth.
Types of Mutual Fund:1. Money market funds
These funds invest in short-term fixed income securities such as government bonds, treasury bills,
bankers’ acceptances, commercial paper and certificates of deposit. They are generally a safer
investment, but with a lower potential return then other types of mutual funds. Canadian money
market funds try to keep their net asset value (NAV) stable at $10 per security.
2. Fixed income funds
These funds buy investments that pay a fixed rate of return like government bonds, investment-
grade corporate bonds and high-yield corporate bonds. They aim to have money coming into the
fund on a regular basis, mostly through interest that the fund earns. High-yield corporate bond
funds are generally riskier than funds that hold government and investment-grade bonds.
3. Equity funds
These funds invest in stocks. These funds aim to grow faster than money market or fixed income
funds, so there is usually a higher risk that you could lose money. You can choose from different
types of equity funds including those that specialize in growth stocks (which don’t usually pay
dividends), income funds (which hold stocks that pay large dividends), value stocks, large-cap
stocks, mid-cap stocks, small-cap stocks, or combinations of these.
4. Balanced funds
These funds invest in a mix of equities and fixed income securities. They try to balance the aim of
achieving higher returns against the risk of losing money. Most of these funds follow a formula to
split money among the different types of investments. They tend to have more risk than fixed
income funds, but less risk than pure equity funds. Aggressive funds hold more equities and fewer
bonds, while conservative funds hold fewer equities relative to bonds.

5
5. Index funds
These funds aim to track the performance of a specific index such as the S&P/TSX Composite
Index. The value of the mutual fund will go up or down as the index goes up or down. Index funds
typically have lower costs than actively managed mutual funds because the portfolio manager
doesn’t have to do as much research or make as many investment decisions.
6. Specialty funds
These funds focus on specialized mandates such as real estate, commodities or socially responsible
investing. For example, a socially responsible fund may invest in companies that support
environmental stewardship, human rights and diversity, and may avoid companies involved in
alcohol, tobacco, gambling, weapons and the military.
7. Fund-of-funds
These funds invest in other funds. Similar to balanced funds, they try to make asset allocation and
diversification easier for the investor. The MER for fund-of-funds tend to be higher than stand-
alone mutual funds.
Diversify by investment style
Portfolio managers may have different investment philosophies or use different styles of investing
to meet the investment objectives of a fund. Choosing funds with different investment styles allows
you to diversify beyond the type of investment. It can be another way to reduce investment risk.
4 common approaches to investing
1. Top-down approach – looks at the big economic picture, and then finds industries or countries
that look like they are going to do well. Then invest in specific companies within the chosen
industry or country.

6
2. Bottom-up approach – focuses on selecting specific companies that are doing well, no matter
what the prospects are for their industry or the economy.
3. A combination of top-down and bottom-up approaches – A portfolio manager managing a
global portfolio can decide which countries to favour based on a top-down analysis but build
the portfolio of stocks within each country based on a bottom-up analysis.
4. Technical analysis – attempts to forecast the direction of investment prices by studying past
market data.
1.3 Introduction to the company
Some of the 5 popular asset management companies are:
1.Axis mutual fund - Axis Mutual Fund is an asset management company in India. It was
established in 2009 and is headquartered in Mumbai. Axis Mutual Fund offers various types of
mutual fund schemes to invest in India, such as equity funds, hybrid funds, debt funds, and more.
2.Kotak mutual fund - Kotak Mahindra Asset Management Company Limited (KMAMC), a
wholly owned subsidiary of Kotak Mahindra bank Limited (KMBL), is the Asset Manager for
Kotak Mahindra Mutual Fund (KMMF). KMAMC started operations in December 1998 and has
approximately 74 Lac investors in various schemes.
3.Reliance mutual fund - Reliance Capital Limited is an Indian diversified financial
services holding company promoted by Reliance Anil Dhirubhai Ambani Group. Reliance Capital,
a constituent of Nifty Midcap 50 and MSCI Global Small Cap Index, is a part of the Reliance
Group. It is amongst India's leading and most valuable financial services companies in the private
sector. As on 31 March 2017, the net worth of the company stood at Rs 16,548 crore, while its
total assets as on the date stood at Rs 82,209 crore. In Fortune India 500 list of 2018, Reliance
Capital was ranked as the 77th largest corporation in India with 5th rank in 'Non-Banking Finance'
category.

7
4.HDFC mutual funds - Housing Development Finance Corporation Limited (HDFC) is an
Indian financial services company based in Mumbai, India. It is a major housing finance provider
in India. It also has a presence in banking, life and general insurance, asset management, venture
capital, realty, education, deposits and education loans.
5.SBI mutual funds - SBI Mutual Fund was incorporated in 1987 with its corporate head
office located in Mumbai, India. SBIFMPL is a joint venture between the State Bank of India,
an Indian public sector bank, and Amundi, a European asset management company. A shareholder
agreement in this regard has been entered on April 13, 2011, between SBI & AMUNDI Asset
Management. Accordingly, SBI currently holds 63% stake in SBIFMPL and the 37% stake is held
by AMUNDI Asset Management through a wholly owned subsidiary, Amundi India Holding. SBI
& AMUNDI Asset Management shall jointly develop the company as an asset management
company of international repute by adopting global best practices and maintaining international
standards.
1.4 Justification of the topic
In case of individual investor there is higher return by way of dividends and capital appreciation.
Risk of loss is reduced as the funds are managed by well informed professional managers. Risk of
loss is reduced as the funds are managed by well informed professional managers.
It is also reduced due to diversification of portfolio in terms of companies and industries. Further,
since the returns are automatically invested, the scope for capital appreciation is enhanced.
As the savings and investments of a large number of investors are pooled the advantage of
economies of scale accrues. The individual investor is spared of the ordeal of having to self-decide
and then go through the process of investment. Thus, from the individual investor’s angle mutual
funds are very much advantageous.
From the point of view of capital market, if the foreign investors are also investing, due to
increased volume of trading operation the liquidity for the domestic market players is enhanced.
Such competition with a market regulator surely, and to an extent even otherwise, would
automatically demand a higher investor discipline by way of increased disclosure, improved
information flow, etc.

8

9
CHAPTER 2 : REVIEW OF LITERATURE
2.1 International Reviews
2.2 National Reviews

10
2.1 International reviews:
Review of literature is important to a scholar in order to know what has been established and
documented as there are critical summaries of what is already known about a particular topic.
Therefore a review of literature helps in relating the present study to the previous ones in the same
field.
1. Martin P. and McCann B. (1998) in their book titled “The Investor’s Guide to Fidelity Funds
– Winning Strategies for Mutual Fund Investing” have very nicely guided investors regarding
issues related with mutual fund investing. They have advised that Investors should focus on sectors
of the global economy that have the greatest potential for profit in order to beat the market
averages. By combining this approach with the safety provided by mutual funds’ inherent
diversification, mutual funds become an investment vehicle with all the advantages of trading
individual securities and none of the disadvantages. Like any other investment, it is essential to
develop a strategy for selecting which funds to buy and sell – and when. These decisions should
not be left to the emotions or to chance.
2. Gremillion L (2005) in his book “Mutual Fund Industry Handbook – A Comprehensive Guide
for Investment Professionals” has given detailed information about working of mutual fund
industry. It has also mentioned the different type of challenges faced by various professionals
connected with this industry. The book has provided a broad and comprehensive sweep of
information and knowledge, which will help everybody who has serious interest in the industry.
3. Tyson E (2007) in his book “Mutual Funds for DUMMIES” (5th edition) has provided practical
and profitable techniques of mutual fund investing that investors can put to work now and for
many years to come. By proper selection investor can identify good schemes, where fund managers
invest in securities as per that match investors’ financial goals. Investors can spend their time doing
the activities in life that they enjoy and are best at. Mutual Funds should improve investors’
investment returns as well as their social life. The book helps investors how to avoid mutual fund
investing pitfalls and maximizing their chances for success. Whenever any investor wants to buy
or sell a mutual fund, the decision needs to fit his overall financial objectives and individual
situation.
4. Jank S (2010) in his Discussion Paper on “Are there disadvantaged clieneles in mutual funds?”
has mentioned that mutual fund investors chase past performance, even though performance is not
persistent over time. This means that investors buy mutual funds that had a high return in the past.

11
On the other hand, investors are reluctant to withdraw their money from the worst performing
funds. This behavior has often been attributed to the irrationality of mutual fund investors.
Sophisticated investors rationally chase past performance, because high past performance is a
signal for managerial ability. No significant difference was found between investor composition
of the worst performing funds and those with average performance.
5. Cici G et al (2014) in their Discussion Paper on “Market transparency and the marking precision
of bond mutual fund managers” have stated that the transparency enhancing TRACE (Trade
Reporting and Compliance Engine) system was associated with large and statistically decreases in
cross fund bond mark dispersion.
6. Mary Jane Lenard , Syed H. Akhter, B Pervaiz Alamc (2003 ) in their paper titled “Mapping
Mutual Fund Investor Characteristics and Modeling Switching Behavior” have empirically
investigated investor attitudes toward mutual funds. Their model, based on investor responses,
develops an investor's "risk profile" variable. Results indicate that regardless o f whether the
investors invest in non-employer plans or in both employer and non-employer plans, they consider
their investment risk, fund performance, investment mix, and the capital base o f the fund before
switching funds. The model developed in this study can also assist in predicting investors'
switching behavior . In the paper titled “How to measure mutual fund performance: economic
versus statistical relevance”
7. Roger Otten Dennis Bams ( 2004 ) have explored the added value o f introducing extra
variables such as size, book to market, momentum and a bond index to the existing mutual fund
performance models. Their search for most suitable model to measure mutual fund performance
has resulted in the conclusion that conditional models add strong economic relevance because o f
the ability to detect patterns in fund betas. This enables the investor to monitor the dynamic
behavior o f mutual fund managers.
8. Javier Gil-Bazo and Pablo Ruiz-Verdu (2009 ) in their paper titled “The Relation between
Price and Performance in the Mutual Fund Industry” have highlighted Gruber (1996 ) theory that
investors buy actively managed equity mutual funds, even though on average such funds
underperform index funds. Their study reveals another puzzling fact about the market for equity
mutual funds: Funds with worse before free performance charge higher fees. This negative relation
between fees and performance is robust and can be explained as the outcome o f strategic fee
setting by mutual funds in the presence o f investors with different degrees of sensitivity to

12
performance. They found that better fund governance may bring fees more in line with
performance.
9. Stephanos Papadamou and Costas Siriopoulos, (2004 ) in their paper titled “American equity
mutual funds in European markets: Hot hands phenomenon and style analysis” empirically prove
that the American no-load equity mutual funds that invest in European stocks and keep their
managers for more than three years, in order to investigate the persistence o f short term
performance and the related investment style. The results showed an under performance compared
to the Eurostoxx index and a hot hands phenomenon does not persist, with some exceptions.
Mutual funds that performed well in a five month evaluation period continued to generate superior
performance in the next four months. According to style analysis a portfolio constructed by
growth-large, growth-medium and value large capitalization stocks outperformed any other
investment style. However, well diversified finds were the most mean-variance efficient, style
consistent funds.
10. Steven Kaplan and Antoinette Scholar (2005) investigated the performance and capital
inflows o f private equity partnerships. Average fund returns (net of fees) approximately equal the
S&P 500 although substantial heterogeneity across funds exists. Returns persist strongly across
subsequent funds of a partnership. Better performing partnerships are more likely to raise follow-
on funds and larger funds. This relationship is concave, so top performing partnerships grow
proportionally less than average performers. At the industry level, market entry and fund
performance are procyclical; however, established funds are less sensitive to cycles than new
entrants. Several o f these results differ markedly from those for mutual funds.

13
2.2 National Reviews:
1. Singh B K (2012) in an article “A study on investors’ attitude towards mutual funds as an
investment option” from International Journal of Research in Management has reiterated the need
for spreading the awareness about Mutual Funds among common masses. There is a strong need
to make people understand the unique features of investment in Mutual Funds. From the existing
investors point of view the benefits provided by mutual funds like return potential and liquidity
have been perceived to be most attractive by the invertors’ followed by flexibility, transparency
and affordability.
2. Divya K. (2012) in the article “A Comparative study on evaluation of Selected Mutual Funds
in India” from International Journal of Marketing and Technology has suggested that the
investment managers whose performance is below benchmark index should have a relook at their
investment strategy and asset allocation. Investing styles should be redesigned according to up &
down swings of the market to generate superior performance. To increase the efficiency and
popularity of mutual funds, the regulator should set the standard criteria of benchmarks which will
be helpful to asset management companies.
3. Vanaja V. and Karrupasamy R (2013) in the article “A study on the performance of select
Private Sector Balanced Category Mutual Fund Schemes in India” from International Journal of
Management Sciences and Business Research have mentioned that Out of five private sector
balanced category mutual funds (under study) two earned a return above the average returns. Two
have made negative returns. All the private sector balanced category funds selected for the study
have a positive Sharpe ratio. The range of excess returns over risk free return per unit of total risk
is wide. All the funds selected for the study have a positive Treynor ratio. All the funds selected
for the study has positive Jensen’s alpha indicating superior performance.
4. Narayanasamy R. and Rathnamani V (2013) in an article “Performance Evaluation of Equity
Mutual Funds(on selected Equity Large Cap Funds)” from International Journal of Business and
Management Invention have mentioned that all funds performed well during the period under
study despite volatility in the market. The fall in NIFTY during the year 2011 impacted the
performance of all selected mutual funds. In order to ensure consistent performance of mutual
funds, investors should also consider statistical parameters like alpha, beta, standard deviation
besides considering NAV and total return.

14
5. Santhi N.S. and Gurunathan K. (2013) in the article “The growth of Mutual Funds and
Regulatory Challenges” from Indian Journal of Applied Research have mentioned that as mutual
fund industry has grown tremendously over past few years, Regulators are keeping close watch on
any potential impact of mutual fund products on financial stability and market volatility. The
growth of mutual funds has been accompanied by innovative products and servicing methods.
Regulators will have to do balancing act by carefully managing risks and not imposing unnecessary
regulation.
6. Iqbal N (2013) in an article titled, “Market Penetration and Investment Pattern of Mutual Fund
Industry” from International Journal of Advanced Research in Management and Social Sciences
has mentioned that although mutual funds are predominantly present in urban areas but have
started capturing rural markets also through new range of products, new strategies adopted for
Rural Market Penetration and with new awareness programs. As rural market integrate more and
more with urban, there will be huge inflow of investors. The responsibility of various
intermediaries’ especially mutual funds will increase manifold.
7. Sharma R and Pandya N K (2013) in the article “Investing in Mutual Fund: An overview”
from Asian Research Journal of Business Management mentioned that still number of people are
not clear about functioning of Mutual Funds, as a result so far they have not made a firm opinion
about investment in mutual funds. As far existing investors, return potential and liquidity have
been perceived to be most attractive. There is a lot of scope for the growth of mutual funds in
India. People should take decision based on performance of Mutual fund rather than considering
whether it is private sector or public sector.
8. Sharma N. and Ravikumar R (2013) in an article “Analysis of the Risk and Return relationship
of Equity based Mutual Fund in India” from International Journal of Advancements in Research
& Technology have mentioned that their study investigated the performance of Equity based
mutual fund schemes using Capital Asset Pricing Model (CAPM). In the long run private and
public sector mutual funds have performed well. But while comparing the performance over last
15 years it is found that private sector mutual funds have outperformed the Public Sector mutual
funds. The schemes of private sector mutual funds not only performed better than those of public
sector mutual funds but were also found to be less risky.
9. Vasantha S.(2013) in an article “Evaluating the Performance of some selected open ended
equity diversified Mutual fund in Indian mutual fund Industry” from International Journal of

15
Innovative Research in Science, Engineering and Technology have stated that risk appetite of an
investor plays an important role in selection of mutual fund. While deciding their investment in
mutual funds investor should take decision based on their investment objective and analyze the
fund based on various criteria such as risk prevailing in the market, variations on the return and
deviations in the return etc.
10. Jani D and Jain R (2013) in an article “Role of Mutual Funds in Indian Financial System as
a Key Resource Mobilizer” from Abhinav Journal (International Monthly Referred Journal of
Research in Management & Technology) have reiterated that since fundamentals of Indian
economy are relatively strong, the economy will be on a successful path in the coming year. As
economy grows, Mutual Funds are going to be key resource mobilizer for Indian financial system.
Indian Mutual Fund industry is going to observe good growth rate in near Future.

16
CHAPTER 3 : RESEARCH METHODOLOGY
3.1: Objectives of the study
3.2: Research Hypothesis
3.3: Scope of the study
3.4: Limitation of the study

17
3.1 Objectives of the study
1. To study some of the mutual fund schemes and analyse them
2. Explore the recent development in the mutual funds in India.
3. To give an idea about the regulations of mutual funds.
4. To give a brief idea about the benefits available from Mutual Fund investment.
3.2 Research Hypothesis• Null hypothesis (H0) = Equity funds perform better than debt and hybrid funds.
• Alternative hypothesis (H1) = Equity funds do not perform better than Debt and Hybrid
funds.
3.3 Scope of the study
In my project the scope is limited to some prominent mutual funds in the mutual fund industry. I
analyzed the funds depending on their schemes like equity, income, balance. But there is so many
other schemes in mutual fund industry like specialized (banking, infrastructure, pharmacy) funds,
index funds etc.
3.4Limitation of the study• The limited information in the secondary survey report is a fundamental obstacle in finding
out the true consequences of investing in a mutual fund system by investors.
• The study is limited to the different schemes available under the mutual funds selected.
• The study is limited to selected mutual fund schemes.
• The lack of information sources for the analysis part.

18
CHAPTER 4: Data representation and analysis 4.1 Data representation and interpretation
4.2 Hypothesis Testing

19
4.1 Data representation and interpretation
A. Equity Funds:
1. Large cap - also known as big caps are shares that trade for corporations with a
market capitalization of $10 billion or more. Large-cap stocks tend to be less volatile during
rough markets as investors fly to quality and stability and become more risk-averse.
S.no. Fund Fund manager
1 year return(%)
3 year return(%)
Beta(%)
Downside risk(%)
1. Axis bluechip fund Shreyash D. 20.74 15.26 0.78 70.282. BNP Paribas Abhijeet D. 25.09 12.02 0.84 83.253. Nippon India Sailesh Raj 25.11 8.04 1.10 131.15
• Axis fund gave highest return in 3 year, but lowest in 1 year and its risk is also the lowest
of all.
• Nippon India gave highest return in 1 year, but lowest in 3 year, the risk is also high.
2.Large cap and Mid cap - These mutual funds select stocks for investment from the largest 250
stocks listed in the Indian markets (highest market capitalization). Larger stocks are expected to
be less risky whereas smaller stocks may have higher potential to grow .
S.no. Fund Fund manager
1 year return(%)
3 year return(%)
Beta(%)
Downside risk(%)
1. Invesco growth Pranav G. 23.51 10.52 0.93 86.942. Kotak equity Harsha U. 27.62 11.56 0.94 88.293. Sundaram S krishna 20.63 10.14 1.65 104.85
• Kotak gave highest return in both 1 and 3 year, with medium risk.
3.Flexi cap - A flex-cap fund allows investors to diversify their investment portfolio across
companies of different market capitalisation, mitigating risk and lowering volatility. They are also
referred to as diversified equity funds or multi-cap funds.

20
S.no Fund Fund
manager
1 year
return(%)
3 year
return(%)
Beta
(%)
Downside
risk(%)
1. UTI flexi Ajay T. 35.13 16.77 0.97 80.63
2. DSP equity Atul B. 24.61 12.63 0.99 92.96
3. Kotak flexi Harsha U. 24.89 10.79 0.94 88.47
• UTI flexi gave highest return in both the years with lowest risk
4.Multi Cap –in Multi cap equity funds invest in companies of all sizes and across sectors. Unlike
large or mid cap funds, they can decide how money gets allocated between big, mid-sized, and
small companies. This flexibility also allows them to make changes the portfolio as market
conditions change.
S.no. Fund Fund manager
1 year return(%)
3 year return(%)
Beta(%)
Downside risk(%)
1. BNP Paribas Abhijeet D. 23.27 7.68 0.92 101.352. ICICI Pru Sanskaran N. 30.55 9.53 1.00 100.323. Invesco India Amit N. 26.38 7.96 1.03 101.65
• ICICI pru. Gave highest return in both the years, with lowest risk.
5. Mid Cap Funds - Mid Cap Mutual Funds are equity funds that invest in the mid-sized
companies of India. The companies are some of the fastest-growing companies in India and are at
a stage today's leaders were a few years back.
S.no Fund Fund manager
1 year return(%)
3 year return(%)
Beta(%)
Downside risk
1. DSP midcap Vinit S. 27.77 10.10 0.85 76.912. Nippon India Manish G. 32.72 10.91 0.96 87.953. Franklin India R jankirama 32.55 8.30 0.92 85.73
• Nippon India gave highest return in both the years, but the risk was high.
6. Small Cap - Small Cap equity funds invest in the smallest companies in India. These companies
are beyond the top 250 companies and are mostly unheard in our daily lives. While they can deliver
fantastic returns, small cap companies are incredibly volatile, and you can see losses in short to
medium term.
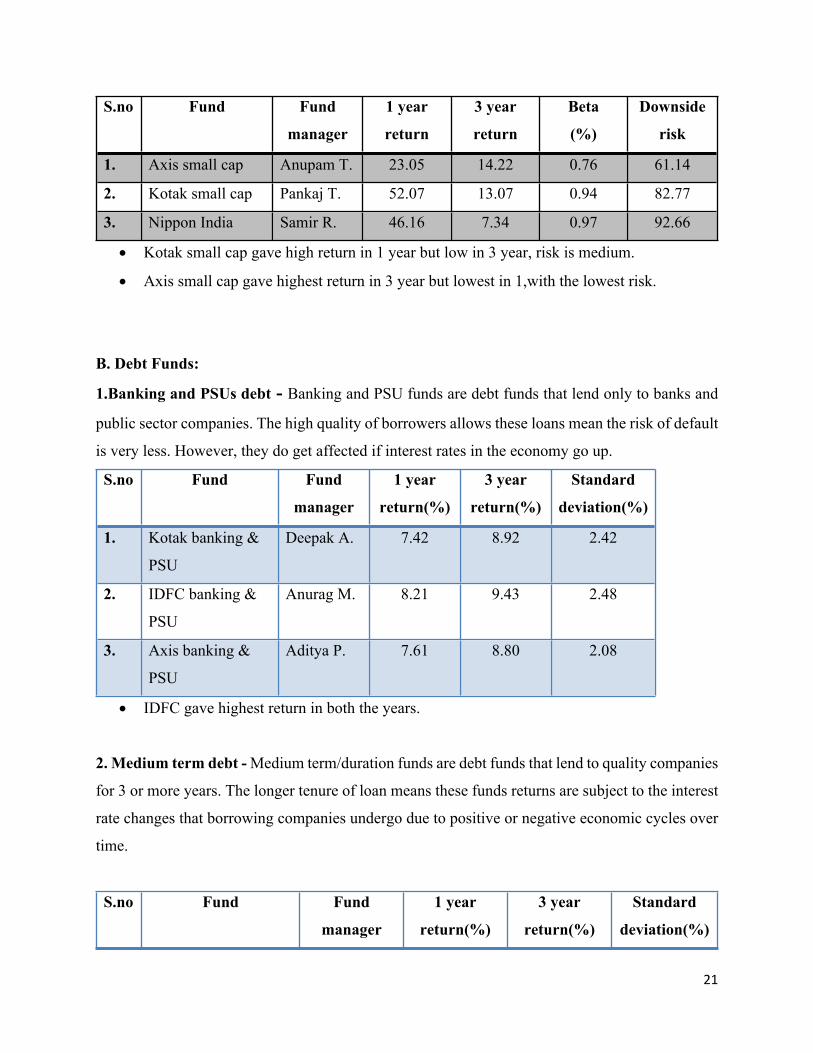
21
S.no Fund Fund
manager
1 year
return
3 year
return
Beta
(%)
Downside
risk
1. Axis small cap Anupam T. 23.05 14.22 0.76 61.14
2. Kotak small cap Pankaj T. 52.07 13.07 0.94 82.77
3. Nippon India Samir R. 46.16 7.34 0.97 92.66
• Kotak small cap gave high return in 1 year but low in 3 year, risk is medium.
• Axis small cap gave highest return in 3 year but lowest in 1,with the lowest risk.
B. Debt Funds:
1.Banking and PSUs debt - Banking and PSU funds are debt funds that lend only to banks and
public sector companies. The high quality of borrowers allows these loans mean the risk of default
is very less. However, they do get affected if interest rates in the economy go up.
S.no Fund Fund
manager
1 year
return(%)
3 year
return(%)
Standard
deviation(%)
1. Kotak banking &
PSU
Deepak A. 7.42 8.92 2.42
2. IDFC banking &
PSU
Anurag M. 8.21 9.43 2.48
3. Axis banking &
PSU
Aditya P. 7.61 8.80 2.08
• IDFC gave highest return in both the years.
2. Medium term debt - Medium term/duration funds are debt funds that lend to quality companies
for 3 or more years. The longer tenure of loan means these funds returns are subject to the interest
rate changes that borrowing companies undergo due to positive or negative economic cycles over
time.
S.no Fund Fund
manager
1 year
return(%)
3 year
return(%)
Standard
deviation(%)

22
1. IDFC Bond Suyash Ch. 6.56 8.06 2.57
2. Axis Strategic Bond Devang S. 7.65 7.79 2.60
3. L&T resurgent India Shriram R. 6.31 6.95 3.32
• Axis gave high return in 1 year, IDFC gave high return in 3 year.
3. Short Duration Debt - Short term funds are debt funds that lend to companies for a period of
1 to 3 years. These funds mostly take exposure only in quality companies that have proven record
of repaying their loans on time as well as have sufficient cash flows from their business operations
to justify the borrowing.
S.no Fund Fund
manager
1 year
return(%)
3 year
return(%)
Standard
Deviation(%)
1. Axis short term Devang S. 7.97 8.44 1.78
2. IDFC bond Suyash Ch. 7.28 8.22 1.94
3. L&T short term Shriram R. 7.17 8.01 1.81
• Axis gave highest return in both the years.
4. Long Duration - Long Duration funds are debt funds that lend to quality companies for 5 or
more years. The tenure of loan means that investment is more or less exposed to the entire
economic cycle and hence is inherently more risky than other Debt Funds.
S.no Fund Fund
Manager
1 year
return(%)
3 year
return(%)
Standard
deviation(%)
1. IDFC bond Inc. Suyash Ch. 5.82 8.88 4.13
2. SBI magnum
income
Dinesh A. 7.69 9.06 2.98
3. Kotak bond Abhishek B. 6.70 8.77 3.75
• SBI gave highest return in both the years.
C. Hybrid Funds:

23
1. Aggressive Hybrid Funds - are balanced funds invest primarily in stocks with some allocation
to FD-like instruments. Spreading out of investments means these funds are less risky than pure
equity funds with almost similar returns in the long run.
S.no Fund Fund
Manager
1 year
return(%)
3 year
return(%)
Beta
(%)
Downside
risk(%)
1. BNP Paribas K.Lakshmanan 22.45 13.39 1.01 97.41
2. SBI Equity R.Srinivasan 18.96 11.11 1.08 119.32
3. DSP Equ &
bond
Vikram C. 20.58 11.23 1.20 126.75
• BNP gave highest return in both the years, with the lowest risk.
2.Conservative Hybrid - Conservative Hybrid funds invest primarily in FD-like instruments with
some allocation to stocks. These funds look to provide more returns than bank fixed deposits
without taking too much risk.
S.no Fund Fund
Manager
1 year
return(%)
3 year
return(%)
Beta
(%)
Downside
risk(%)
1. ICICI Pru Rajat Ch. 11.43 9.10 0.88 40.14
2. Franklin India S. Paudwal 7.34 6.68 1.18 140.65
3. DSP Reg Sav Vinit S. 9.18 4.08 1.47 238.58
• ICICI gave highest return in both the years, with the lowest risk.

24
4.2 Hypothesis Testing• Upon analysis of different Types of Mutual Funds it can be observed that average 1year
return of equity funds always ranged above 20% with the Highest reaching upto 52.07% in
the Equity small cap fund by Kotak.It was observed that 3years returns were significantly
lower and inconsistent with 1 year returns of equity funds ,with Flexi equity funds showing
the highest 3 years returns of 16.77% in the equity fund segment.
• Debt funds had significantly low 1years returns compared to equity funds , with highest
returns reaching upto only 8.21% by the Banking and PSU debt fund of IDFC. It was
observed their 3 years returns were very consistent with 1 year Returns of Debt funds but
still were less than the 3 years returns of most Equity funds.
• Upon Analysis of Hybrid funds it was observed that Aggressive Hybrid funds had
significantly higher 1year returns than conservative Hybrid funds.
• 1year return of Aggressive Hybrid funds stood at par with large cap equity funds but much
lower than Mid, multi and small cap funds. However It was observed that 3years returns
of Hybrid funds were much more higher and consistent with their 1year returns compared
to equity funds.
• Upon risk analysis it was observed that Debt carried the least degree of risk subject to least
rate of return. It was observed that beta of Hybrid funds were above 1.0 on an average
which showed higher volatility compared to the equity funds whose beta was mostly below
1.
• Downward risk was also observed to be the highest in Hybrid funds compared to equity
funds.
• Therefore since most Equity funds showed higher returns than other funds and had a risk
lower than Hybrid funds.
• The null hypothesis is accepted that equity funds perform better than debt and Hybrid
funds.

25
CHAPTER 5: Results and discussion5.1 Major findings
5.2 Discussions
5.3 Conclusions

26
5.1 Major findings
• Primarily, mutual funds are regulated by the Securities and Exchange Board of India (SEBI).
• A mutual fund should have the approval of RBI in order to provide a guaranteed returns
scheme.
• The Ministry of Finance acts as a supervisor of RBI and SEBI and appellate authority under
SEBI regulations.
• The Association of Mutual Funds in India (AMFI) has been made to develop this Mutual Fund
Industry of India on professional and ethical lines and to enhance and maintain standards in all
areas with a view to protect and promote the interests of mutual funds and their unitholders.
• It offers you professional management. Through mutual funds, investors get access to the
professional money managers who have expertise and experience in the field of buying, selling
and monitoring investments by the investors.
• It helps you in holding a wide variety of shares at a much lower price than you really could
own by yourself. If one investment in the Fund decreases in value that does not mean that the
other will also be decreased, it may increase as well. By holding shares in the market you can
take advantage of the changing environment in the industry. It helps in diversification.
• It gives opportunities to the small investors to take part in the professional asset management
and they can have low investment minimums.
• Most of the mutual funds allow investors to deal with shares on any business day. Many funds
provide you with an automatic purchase program. It is according to the convenience of the
investors and helps them in gaining the best out of the money invested.
• The higher level of diversification since the basket of a portfolio will be aimed at spreading
the investment in order to offer protection against concentration risks.
• They provide regular liquidity as shareholders of open-ended funds and unit investment trusts
may sell their holdings back to the fund at regular intervals at a price equal to the NAV of the
fund’s holdings.
• Managed by professional investors who have rich experience in investment and can understand
the nerves of the market.
• Since mutual funds are regulated by a Government body i.e. AMFI in India, it offers protection
and comfort to the investors before considering investment opportunity.

27
• All mutual funds are required to report the same level of information to the investors which
makes it relatively easier for comparison in case of diversification.
• These funds provide regular reports of their performance and are also easily available on the
internet to understand past trends as well as the strategies implemented.
5.2Discussions
Upon findings of the research we can say that:
• Equity funds are preferred for both high risk and moderate risk taking investors. Well, Equity funds are also an ideal investment option for small investors. The benefits which make equity funds suitable for small investors are: low risk, small capital for investment and diversified portfolio.
• Debt funds carry low risk - preferable for retired class. Unlike equity mutual funds, a debt mutual fund is not subject to market conditions. Investments are made in securities with a fixed maturity period and a rate of interest. New investors usually start with a low-risk appetite. Debt mutual funds serve as a great avenue of investment for such investors. There is steady returns without the fear of losing it all due to markets crashing.
• Hybrid funds - preferable for Young and adventurous investors who are willing to take high risks for a high return in the long term. A balanced fund offers investors the benefit of diversification since it combines both equity and debt. When share prices go down, the debt component in these kinds of hybrid mutual funds ensures stability. So these funds are able to withstand shocks during a bear phase. Generally debt and equity have an inverse correlation; they move in different directions. So having a balanced fund helps you hedge your bets. One thing you must remember is that balanced funds do not do as well when the market is on a bull run. Another point is that when share prices rise, fund managers will have to sell stocks in these kinds of hybrid mutual funds to maintain the required equity-debt ratio.
5.3 Conclusions
Mutual fund industry have developed itself very fastly in today’s times . Mutual fund industry in
India is maturing with increase in the number of investors and increasing geographical spread. MF

28
in India have become major players in the equity and corporate bond markets and are also
providing crucial liquidity support to the money market. Consequently, their influence on price
movements in equity and debt markets as also domestic liquidity conditions has increased over
time.
This research was made to understand the management of mutual funds, the schemes which Asset
management companies offers and analysing them from the given data.
REFERENCES:
https://www.indiastudychannel.com/projects/666-a-study-on-mutual-funds-in-india.aspx
https://www.getsmarteraboutmoney.ca/invest/investment-products/mutual-funds-segregated-funds/how-mutual-funds-work/
https://www.investopedia.com/terms/m/mutualfund.asp
https://www.investopedia.com/terms/a/asset_management_company.asp#:~:text=An%20asset%20management%20company%20(AMC)%20invests%20pooled%20funds%20from%20clients,investment%20companies%20sponsoring%20mutual%20funds.
https://www.yourarticlelibrary.com/investment/mutual-funds-rationale-for-and-strengthening-the-mutual-funds/39547
https://www.federatedinvestors.com/resources/resources-for/individual-investors/fund-objective-and-style.do?hint=page
https://www.amfiindia.com/research-information/mf-history
https://www.etmoney.com/mutual-funds
https://blog.ipleaders.in/mutual-funds-regulation-in-india/
https://www.angelbee.in/mutual-funds/hybrid-funds
Bibliography:
• Research Methodology - C.R Kothari• Principals of Statistics - Dr.S.M Shukla

29
• Advanced Statistics - Dr.S.M Shukla and Dr.K.L Gupta

30
IMPACT OF SOCIAL MEDIA ON E-COMMERCEResearch Project Submitted in Partial Fulfillment of the Requirements for the
Degree of
BCOM HONOURSby
ARUNAKSHI PRATAP SINGH
to the
DEPARTMENT OF COMMERCEBHOPAL SCHOOL OF SOCIAL SCIENCES
April, 2021
Submitted by Guided by
Arunakshi Pratap Singh Dr Smitha Pillai
Associate Professor
CERTIFICATE

31
It is certified that the work contained in the project report titled “IMPACT OF
SOCIAL MEDIA ON E-COMMERCE,” by “Arunakshi Pratap Singh,” has
been carried out under my/our supervision and that this work has not been submitted
elsewhere for a degree*
Signature of Supervisor: …………….
Name : Dr Smitha Pillai, Associate Professor
Department : Commerce
Bhopal School of Social Sciences
April, 2021
DECLARATION

32
I hereby declare that this project report entitled “IMPACT OF SOCIAL MEDIA ON
E-COMMERCE” was carried out by me for the degree of BCOM Honours under
the guidance and supervision of Dr Smitha Pillai Associate Professor of
Department of Commerce, BSSS College. The interpretations put forth are based
on my reading and understanding of the original texts and they are not published
anywhere in any form. The other books, articles and websites, which I have made
use of are acknowledged at the respective place in the text. This research report is
not submitted for any other degree or diploma in any other University.
ACKNOWLEDGEMENT

33
I would like to thank our Principal Dr. Fr. John P.J. and Vice Principal Dr Sr Sonia
Kurien for their immense support and blessings. I thank our HOD Dr Amit Kumar
Nag for his support. I would like to express my special thanks of gratitude to my
research guide Dr. Smitha Pillai, Associate Professor of Department of Commerce
for her valuable suggestions and guidance and for giving me the golden opportunity
to do this wonderful research project on the topic: Impact of Social Media on E-
Commerce, Without her help it would have been difficult for me to have reached
this state of completion of my project report. Also, I would like to thank my parents
and friends who helped me a lot in the preparation of this project.
I wish to acknowledge the help of all those who have provided me information,
guidance and other help during my research period.

34
TABLE OF CONTENTS Chapter I: Introduction of the Topic
1.1 Rationale of the Study
1.2 Introduction to the industry
1.3 Introduction to the company
1.4 Justification of the topic
Chapter 2: Review of Literature
2.1 International Reviews
2.2 National Reviews
Chapter 3 : Research Methodology
3.1 Objectives of the Study
3.2 Research Hypothesis
3.3 Scope of the Study
3.4 Data Collection
3.5 Limitation of the study
Chapter 4 : Data representation & Analysis

35
4.1 Data representation & Interpretation
4.2 Hypothesis Testing
Chapter 5. Results & Discussion
5.1 Major Findings
5.2 Discussion & Suggestions
5.2.1 Discussion
5.2.2 Suggestions
5.3 Conclusion
REFERENCES
ANNEXURE

36
CHAPTER 1
Introduction of the Topic
❖ 1.1 RATIONALE OF THE STUDY❖ 1.2 INTRODUCTION TO THE INDUSTRY❖ 1..3 EFFECT OF SOCIAL MEDIA ON VARIOUS AREAS❖ 1.4 JUSTIFICATION OF THE TOPIC

37
CHAPTER1
INTRODUCTION TO THE TOPIC
(1.1) Rationale of the study
E-commerce is a succeeding sector that is advancing with time. Social media is
additionally extraordinarily helping businesses achieve outstanding results. Social
media platforms aim at enhancing the interaction between the consumers and
ecommerce businesses instead of just educating them about moneymaking deals and
new product launches. A part of the social media platforms allows direct selling by
utilizing a couple of social groups and communities , instead of relying on traditional
methods such as television, radio, and magazines etc. Every 7th person in the world
now owns a Facebook account and nearly four in five Internet users are associated
with at least one social media site. Instagram has approximate 1.074 billion users
worldwide in 2021. That’s a big turning point for the photo-sharing network. With
the ever-increasing number of internet and social media users, it has become
inevitable for major brands to understand online customer behavior. The emergence
of social media has led to a subsequent change in media consumption which is
pushing companies and organizations to adopt social media as one of their marketing
strategies and public relation tools. Therefore, social media has become an
progressively familiar platform working in E-Commerce to market services and
resources to current and prospective customers
(1.2) Introduction to the industry
The term social network was first coined to differentiate between networks that were
used for business purposes from those utilized for socializing amid people. The
definition of social networking has been expanded to include grouping of individuals
into specific groups mostly in workplace, universities and high schools, however the
prominently accepted definition of social networks relates to the inter-active websites
which provides clients with message boards, chat rooms, and the faculty to leave
comments and have a discussion with other people. On the other hand social networks

38
is also referred to as a virtual community website that brings people together to chat,
deliberate ideas and interests, or make friends. This type of alliance and sharing on
social networking websites is known as social media. Unlike conventional media that
is typically generated and administered by only a community of people, the social
media authorize users to share their belief, views and uplift interactions and
consensus building shaped by consumers. The term “Social Media” has been obtained
from the words, “Social” and “Media” which are described as follows: Social: the
term ‘Social’ refers to interacting with other people for exchange of information
characterized by the friendly fellowship or relations. Media: the term ‘Media’ refers
to the instrument of the communication such as radios, cell phones, television,
newspapers, magazines, internet etc. that reach people broadly. So we can assume
that social media is a web based social instrument for conveying that allows people
to interact with each other by both sharing and consuming information. Safko and
Brake observed that social media is an umbrella term referring to activities,
practices, behaviors among groups of the peoples who gather online to share and
exchange information, thoughts, knowledge and opinions using communicational
media. According to many renowned schools social media relates to the sharing of
information, knowledge, experiences and perspectives through community aligned
sites. Social media uses web based technology to change and broadcast media
soliloquy into social media dialogues. Since last decade, social media has advanced
from being a simple communication centre to an agent of change, which has effected
every day to day activity of humans and thereby changing people’s lives.
(1.3) Effect of social media on various areas
The various areas which have had a everlasting and permanent impact of social
media are as follows:-
(1.3.1.) Business
Nearly every major business organization has a social presence today. Both existing and emerging
businesses are now using social networking sites to promote their business organization, products,
services, and gain crucial feedback from their clients. In fact, for businesses, interaction via social

39
network has almost become a effective standard for assessing their customer service. It has now
become a common to see small or home based businesses that operate solely through their Face-
book or Instagram accounts. Social media also makes it easy for businesses to provide value
upfront prior to asking anything from a prospect.
(1.3.2.) Marketing and advertising With the emergence of social media, marketing and advertising strategies have modified
themselves from industries relying on mass market channels such as television, radios to the social
platform. All the major brands and organizations today boasts of having huge fan base and
followers on majorly all social media platforms like Face-book, Twitter, YouTube, Instagram etc.
Social media platforms are not only cost effective but they also increase the closeness between the
producer and consumer.
(1.3.3.) Politics and public service Social networks are altering the demography of our society ranging from politics and public
service to business and customer satisfaction Twitter is generally used by almost all progressive
politicians to promote their causes. Thanks to the social networks, fields like politics is no longer
limited to the political leaders but people can also express their concerns and opinions, share their
ideas, and even communicate with political leaders on a one-on-one basis.

40
CHAPTER 2
REVIEW OF LITERTURE❖ 2.1 INTERNATIONAL REVIEWS
❖ 2.2 NATIONAL REVIEWS
CHAPTER 2

41
REVIEW OF LITERTURESocial media and e-commerce
In order to understand customers in a better way and finding their inclination towards different
products, the marketers and advertisers are always looking for a number of ways. This requires a
lot of information to be gathered about the customers and their preferred mode of buying products.
This information could be gathered from social media about online users which could be further
analyzed to trace the behavior of consumers. The various businesses are using social networks like
Twitter and Facebook to help them sell more products and service. The use of social media in e-
commerce, has become an attractive means for companies to generate business value from
consumers’ online social interactions. However, many e-commerce companies today are still
trying to understand which factors drive consumers to participate in social commerce. While first
empirical studies have examined one or more factors that influence consumers’ adoption of social
commerce, the findings of these studies are scattered across the literature base, sometimes not
transparent, and not straightforwardly comparable. To synthesize these findings, we conduct a
systematic literature review. After analyzing 38 academic publications, we contribute a
comprehensive and structured list of factors that influence consumers’ adoption of social
commerce. The results of our work provide implications for future research to develop a more
complete understanding of consumers’ adoption of social commerce. Practitioners can use our
results to improve the effectiveness of their social commerce initiatives.
(2.1) International Reviews1. Yin, Sara (2008) in her research paper How Social Media and PR Connect, writes that with
the emergence of Social Media, the whole 20 communications landscape has transformed and the
mass mobilizing power of Social Media is tremendous. People think that Social Media is a threat
to traditional PR and mainstream media, however Social media complements traditional PR and
traditional PR will exist as an important component of any successful business. The PR and
advertising agencies are all undergoing a change and are trying to evolve their strategy, physical
structure and business models to be in tune with social media.
2. Jiyoung Cha (2009) in research work ―Shopping on Social networking websites ; Attitudes
toward real versus virtual items‖ explored factors affecting the shopping attitude on social
networking site. The study is based on two types of products which are present on social

42
networking sites: Real products and Virtual products. The study reveals that usefulness, age, ease
of use, security and fit play a significant role in determining the attitude for shopping real products.
On the other hand gender, social networking site experience, ease of use and fit influence the
attitudes for shopping virtual products.
3. Chris Murdough (2011)in “A Social Media Mindset ―said Synthesizing all three of
performance categories i.e. Reach, Discussions and Outcomes, helped clarify comprehensively
what was going on in the social Web for brands and best advise them how they can leverage the
audience in this space.
4. Social Media Explained: Untangling the World's Most Misunderstood Business Trend by
Mark W. Schaefer (Publisher: Lightning Source Inc (1 September 2011)"Social Media
Explained" explores the fundamental strategies and answers the questions every business
professional needs to answer before diving into a social media initiative! This the must-have guide
for understanding the sociological and psychological drivers that make social media marketing
work.
5. Tom Smith (2010) in the social media revolution says Social Media has changed the manner
in which the communication between the organizations and the customers were taking place; it has
changed from talking through mass media to listening and conversing through social media. Since
the consumer online is a commentator, reviewer and publisher, all the organizations have to stop
talking and start listening to how they are perceived online.
6. Burson and Marsteller study on ‗Global Social Media Checkup 2012‘has concluded that the
fortune Global 100 brands have active presence on social media. 67 % of the Brands have twitter
accounts while 57% have Facebook and remains have on Youtube, Google+, Pinterest and etc.
(2.2) National Reviews1. Manish Parihar (2012)in “Customer Relationship Management” he mentioned that
Companies of contemporary times have been realizing the insight to create communities around
their products or offerings, invite and encourage members to join them, and then convert them into
loyal customers 35 and advocates. Business owners had been increasingly interested in using
social media to optimize their customer experience management activities because they knew
social media was changing the Customer Relationship Management game.

43
2. A study has been conducted on social networking sites like Facebook, Twitter and Orkut by
authors P. Sri Jothi, M. Neelamalar and R. Shakthi Prasad (March 2011) in their research
paper ―Analysis of social networking strategy in developing brand communication‖, with the
primary objective of determining the effectiveness of brand communication strategy in advertising
products and promoting brands on social networking sites. The various reasons for social media
being a widely used platform, for advertising compared to the other traditional advertising
mediums have been discussed. The various ways that are being provided by social media platform
for its users to communicate with each other and interact with the brand are discussed like chat,
messaging, video, email, voice chat, file-sharing, blogging and discussion groups. According to
the writers views, the marketing communications are becoming personal, interesting, interactive
and social. Findings of the study suggest that social media advertising has its impact on 70% of
the users and half of them access these ads i.e. games, quiz, events etc. It was found that the
interaction is more in the display banner 31 advertisements in Face book and Orkut.
3. ―Social media marketing: strategies & its impact‖ by Vivek Bajpai Sanjay Pandey,
Shweta Shriwas: Social platforms each have an ecosystem of their own. Creating a basic social
media presence is easy enough, getting your community to actually do something is more difficult.
Make sure your site is included in local business directories in order to help ensure that consumers
find you when they need you. Customizing messages across sites help the message spread but it
keeps users from receiving multiple identical communications. By giving exclusive coupons to
your social community, you‘re rewarding and reminding them that you are not only a brand to
engage 37 with, but also to buy from. Taking advantage of these strategies can help you
build your community, make your marketing more effective, and incentivize buying.
4. Anil Bhatt (May 2012) in his paper on Blog Popularity and Activity on Social Media: an
Exploratory Research has made an attempt to find out the impact of some social media website‘s
popularity on ROI. Social media provides a global opportunity for brands to use them as an
effective channel for marketing of products and services. However the effectiveness of any
Marketing channel is largely dependent on a very important entity the ROI. ROI is something that
most marketers look at when one has to determine the effectiveness of any marketing channel. The
study therefore examined ROI for weblogs and how their promotions through two highly popular
social networking sites, namely Facebook and Twitter affects their popularity and in turn increases
their revenue through advertisements. Page views is a direct 40 measure of the traffic a particular

44
blog has and therefore a correlation between page views and Facebook fans and twitter fans was
established to understand the effect of promotion of brands through social media. The findings of
the study revealed a positive correlation across all blog categories and hence it was concluded that
a positive change in Facebook followers and Twitter followers increases the number of page views.
It was also found that the page views increased with the increase in time due to an increase in fans
or followers.
5. Shahir Bhatt and Amola Bhatt (2012) in their research paper Factors influencing Online
Shopping: An Empirical Study in Ahmedabad writes about the factors which influence the
perceptions of consumers regarding online shopping. The study has revealed three important
influencing factors:
▪ Attractiveness of website,
▪ Service quality of websites
▪ Website security
6. Sunil Karve, Shilpa C. Shinde (March 2013) in their paper ―Effectiveness of Social
Networking Sites (SNS)‖ have made an attempt to figure out the experiences of the internet users
regarding social media and have also tried to find out the pattern of SNS usage of the consumers.
The writers state that social media has become so much popular, that it has surpassed the popularity
of email, to become number four after search, portals and PC software applications. The
tremendous increase in the amount of time people are spending using these SNS have changed the
way people spend their time online and this affects the way people behave, interact and share in
their normal daily lives. This paper has tried to analyse the overall effectiveness.

45
CHAPTER 3
Research Methodology
❖ 3.1 OBJECTIVES OF THE STUDY
❖ 3.2 RESEARCH HYPOTHESIS
❖ 3.3 SCOPE OF THE STUDY
❖ 3.4 DATA COLLECTION
CHAPTER 3
Research MethodologyIn today‘s technology driven world, social networking sites have become an avenue where retailers
can extend their marketing campaigns to a wider range of consumers. The tools and approaches

46
for communicating with customers have changed greatly with the emergence of social media;
therefore, businesses must learn how to use social media in a way that is consistent with their
business plan. Based on the respective Research Gaps and critical observations from the extensive
Review of Literature as well as Expert Interviews, the following Research Questions were
developed to guide the study:
Q.1) What is the impact of marketing via social media on the buying behavior of consumers?
Q.2)Does the increased use of internet and social media leads to increased online purchasing?
Q.3) Is the impact of social media marketing same for all the consumers irrespective of their
demographic profile?
Q.4) whether the impact of social media same for all categories of products?
Q.5) What are the factors which motivate a person for online shopping?
(3.1) OBJECTIVE OF STUDY • To identify the impact of social media marketing strategies of e-retailing companies on the
buying behavior of customers.
• To study the effectiveness of Social Media tools like Face book, Twitter, Instagram, You
tube etc.
• To determine the demographic profile of customers who purchase products online from e-
retailers.
• To study on-line purchasing behavior of customers in Bhopal
• To identify factors motivating customers to shop online.
(3.2) HYPOTHESIS
• H01: Social media marketing strategies of e-retailers have no significant impact on buying
behavior of customers.
• H11: Social media marketing strategies of e-retailers have a significant impact on buying
behavior of customers.
• H02: There is no association between effect of social media marketing and gender of
respondent
• H12: There is an association between effect of social medial marketing and gender of
respondent.

47
• H03: There is no association between effect of social media marketing and education of
respondent.
• H13: There is an association between effect of social media marketing and education of
respondent.
• H15: There is an association between effect of social media marketing and occupation of
respondent.
• H06: There is no association between effect of social media marketing and age of
respondent.
(3.3) SCOPE OF THE STUDY
The number of respondents has been limited to 60 as during the corona virus pandemic, it was
difficult to approach people physically owing to physical mobility constraints. Therefore in order
to collect responses from respondents, an online questionnaire was formulated and circulated
among respondents based in Bhopal.
The only condition for eligibility for being a respondent was to have a social media account.
The time period selected for this survey and circulation of questionnaire was August to October
2020, during which nationwide lockdown was imposed owing to the corona virus pandemic.
Therefore, owing to lack of available resources, the scope of the study is limited in nature.
(3.4) DATA COLLECTION

48
GEOGRAPHICAL AREA:
BHOPALDURATION OF STUDY
1 MONTH
SAMPLE SIZE
60 PEOPLE (DIFFERENT AGE GROUPS)
SAMPLING TECHNIQUE
RANDOM SAMPLING TECHNIQUE
POPULATION
Bhopal is selected as field of research which is a very well planned and organized area. With the
existence of many government and private corporate offices, banks, financial institutions, business
houses, malls, ports etc it provide a heterogeneous mix of population which helps in selecting an
unbiased and random sample.
SAMPLE
Sample is a subgroup of population selected for the participation of the study. In this study, a
subgroup of teenagers and millennial are taken into considerations.
SAMPLE SIZE

49
It specifies the number of samples chosen from a target population. The sample size has been
selected as 60 in order to include some more elements of the population.
SAMPLING METHOD
Random Sampling technique has been used for this study. In a Random sample from infinite
population selection of each item is controlled by the same probabilities and the successive
selections are independent of one another.
(3.4) LIMITATIONS OF STUDY The conclusions are drawn on the basis of data collected from Bhopal and every caution has been
taken to keep the sample unbiased and true representative of total population but it may not be
applicable for other parts of nation due to demographic and socio-cultural diversity.

50
CHAPTER 4
DATA REPRESENTATION & ANALYSIS
❖ 4.1 DATA REPRESENTTION & INTERPRETATION
❖ 4.2 HYPOTHESIS TESTING

51
CHAPTER 4
DATA REPRESENTATION & ANALYSIS
(4.1) DATA REPRESENTATION AND INTERPRETATION
To evaluate the objective of the study, required data were collected from primary sources.
The data required for the study were collected from the selected respondents by circulating an
online questionnaire.
General information from the individual respondents on their social and demographic
characteristics.

52

53

54

55

56
(4.2) HYPOTHESIS TESTING The two major types of hypothesis are null and alternative. Null hypothesis states that there is
no significant relationship between the two variables being studied and that the results are due
to chance and are not significant in terms of supporting the idea being investigated. Alternative
hypothesis states that there is relationship between the two variables studied and that the results
are not due to chance and that they are significant in terms of supporting the theory being
investigated.
• Null Hypothesis (H0): There is no significant relationship between consumer perception
of organic products and their awareness regarding it.
• Alternative Hypothesis (H1): There is a significant relationship
between consumer perception of organic products and their
awareness regarding it.

57
CHAPTER 5
RESULTS AND DISCUSSION
❖ 5.1 MAJOR FINDINGS
❖ 5.2 DISCUSSIONS & SUGGESTIONS
❖ 5.3 CONCLUSION

58
CHAPTER 5
RESULTS AND DISCUSSION
(5.1) MAJOR FINDINGS
The raw data has been collected from primary source i.e. with the help of questionnaire which
consists of the question referring to different aspects of consumer behavior and impact of social
media. The findings from the research are:
➢ Among 60 respondents 28.3% (17) are from department of commerce, 23.3% (14) are from
department of computers, 13.3% (8) are from department of management and rest from
other departments.
➢ Among 60 respondents 60% (36) are from final year, 26.7% (16) are from first year and
13.3% (8) are from second year.
➢ Among 60 respondents 93.3% (56) are aware of various social media sites and 6.7% (4)
are not aware of various social media sites.
➢ Among 60 respondents 40% (24) go through social media sites 1-2 times, 25% (15) 3-4
times, 20% (12) more than 6 times, 11.7% (7) 5-6 times and remaining do not visit social
media sites frequently.
➢ Among 60 respondents 98.3% (59) are aware of various social media sites and 1.7% (1)
are not aware of various social media sites.
➢ Among 60 respondents 56.7% (34) prefer online buying, 36.7% (22) prefer sometimes to
buy online and rest never prefer to buy online.
➢ There many factors that affect the behavior of consumer to buy online i.e., Advertisements,
Family, Friends, Door to door service, Easy handling return etc., Ease of sitting at home
and getting things delivered at home, Convenience.
➢ Among 60 respondents 48.3% (29) says social media maybe has an impact on their online
buying preferences, 40% (24) says social media has an impact on their online buying

59
preferences and 11.7% (7) says social media does not have an impact on their online
buying preferences.
➢ Among 60 respondents 33.3% (20) prefer online buying because of easy availability, 30%
(18) for variety and pricing each and remaining due to other factors (return policy).
(5.2) DISCUSSION AND SUGGESTIONS
(5.2.1) Discussion
Social media offer affordable opportunities to reach large populations. Additionally, online
campaigns on social media can benefit from the persuasive features of interactive multi-media
systems. Many researchers and marketing mogul have considered social media as an effective tool
of marketing. Social media is a phenomenon that has become an important aspect in marketing
mix and is revolutionizing the way companies interact with customers.
Association between the social media marketing and buying behavior of consumers:
▪ It is proved that marketing via social media significantly affect the buying behavior of
consumers.
▪ It is established that majority of consumers consider social media as effective means of
marketing.
▪ The availability of social media has made consumers more informed about brands when
making purchase decisions.
▪ Majority of customers strongly agree to the statement that they are more exposed to
marketing communication as a result of increased media use.
(5.2.2) Suggestions
❖ As it has been proved that marketing via social media has a significant impact on customers
buying decision process, it can be used by e-retails as an effective tool of marketing. But
as now a days almost all the e-retailers have a presence on social media so it is very
important to be different in order to prompt the customer to respond to advertisements. It
is of vital importance to make advertisements unique and attractive and customize them as
per the likes and dislikes of customers and prospects.
❖ As trust worthiness of advertisements on social media is an important factor for consumers,
the advertisements by e-retailers must be genuine, simple and draw a realistic picture.

60
❖ As it is evident from the study that majority of people spend more than 2 hours on social
networking sites. There is a need to engage the always connected consumer at every touch
point and in real time, anticipating their needs and responding at every step.
❖ Facebook is most effective tool of marketing as per the study but now a considerable
amount of people are using new SNSs like instagram, pinterest ect so there is an
opportunity to use these new social sites optimally. The Social networking sites like
LinkedIn, Twitter, instagram etc. can improve their marketing efficiency by enhancing
features like targeting the advertisements to the right group of audiences and making the
ads more appealing so that more and more audience are attracted towards them for
socializing as well as accessing product information.
❖ Use Images while posting on social media: Adding an image to an otherwise text-based
announcement is far more compelling and will increase click-through significantly.
❖ There is a need to engage the always connected consumer at every touch point and in real
time, anticipating their needs and responding at every step.
(5.3) CONCLUSION
The findings and the results of our study clearly signifies that social media marketing influences
the building of brands as well as influences the sales of the business. Moreover, the feedback
obtained from the customers further help to design the marketing strategy of their products Also,
the data on which the analysis has been done in this study is recent data, so, the project could be
enhanced to do a detailed study on previous years data in order to see the pattern and trends that
has been evolved with respect to consumer behavior
▪ Similar studies can be conducted in different cities with different demographics.
▪ There can be study of social media marketing on buying behavior of specific group of
people like students, business class, government servants, housewives etc.
▪ There can be study on impact of marketing on particular social networking site like
Facebook, Instagram, Snapchat etc.
REFRENCES
❖ Anil Bhat (May 2012), ―Blog Popularity And Activity On Social Media : An Exploratory
Research‖, Indian Journal of Marketing

61
❖ Bird, S. & Tapp, A. (2008) Social marketing and themeaning of cool. Social Marketing
Quarterly, 14(1), 18-29.
❖ Bush, A. & Hair, J. (1985) An assessment of the mall intercept as a data collection method.
Journal of Marketing Research, 22(2), 158-167
❖ Jiyoung Cha (2009), ―Shopping on Social networking websites ; Attitudes toward real
versus virtual items‖, Journal of Interactive Advertising, pp. 77-93, Vol. 10, Issue 1.
❖ Sunil Karve, Shilpa C. Shinde(2013),‖ Effectiveness of Social Networking Sites‖ IBMRD
Journal of Management and Research, Vol.2 issue1 14.
❖ Tom Smith (2010), ―The social media revolution‖, International Journal of Market
Research, Vol. 51, Issue 4.
❖ Yin Sara(2008), ― How Social Media and PR Connects‖ Media (Hongkong) publications
pg.20-21
http://www.wikipedia.org/
http://scholar.google.co.in/ dated
http://www.mckinsey.com/
ANNEXUREQUESTIONNAIRE
Which Department are you from? *
Dept of Education
Dept of Commerce
Dept of English
Dept of Management
Dept of Humanities
Dept of Computers
Dept of Social Work
Dept of Economics
Other:
WHICH YEAR? *

62
1st
2nd
3rd
Are you aware of the various Social Media Sites? *
Yes
No
How often do you flip through these sites? *
1-2 Times
3-4 Times
5-6 Times
more than 6 times
Other:
Are you aware of the various online shopping sites? *
Yes
No
Do you prefer online buying?
Yes
No
sometimes
Other:
What made you prefer online buying? *
Advertisments
Family
Friends
any other (please specify)

63
Other:
Does Social Media impact your online buying preferences? *
Maybe
Yes
No
Why do you prefer online buying? *
Easy availabilty
Variety
Pricing
others
Other:
What is your opinion regarding EFFECTIVENESS OF SOCIAL MEDIA ON THE
PROCESS OF E-COMMERCE *

64
Consumer Behaviour and Awareness Towards Whey Protein
Research Project Submitted in Partial Fulfilment of the requirements for the Degree of
B.COM Honours
by
Aryan Sharma
To the
Department of Commerce
The Bhopal School Of Social Science
April,2021
Submitted by. Guided by
Aryan Sharma Dr . Smitha Pillai
Associate Professor
Department Of Commerce

65
Certificate
It is certificate that the work contain in project report title consumer behaviour towards whey
protein by Aryan Sharma has been carried out under my supervision and that this work has not
been submitted elsewhere for a degree
Signature of supervisor:...............
Name. : Dr Smitha Pillai, Associate Professor
Department : Commerce
The Bhopal School Of Social Science
April,2021

66
DECLARATION
I hereby declare that this project report entitled “Consumer Behaviour And Awareness Towards
Whey Protein” was carried out by me for the degree of BCOM Honours under the guidance and
supervision of Smitha Pillai Associate Professor of Department of Commerce, BSSS College. The
interpretations put forth are based on my reading and understanding of the original texts and
they are not published anywhere in any form. The other books, articles and websites, which I
have made use of are acknowledged at the respective place in the text. This research Report is
not submitted for any other degree or diploma in any other University.
Place: Bhopal
Name of the Student: Aryan Sharma
Class & Section: B.com Honour’s third year
Date: April,2021

67
Acknowledgement
I would like to thank a principal doctor FR John PJ and vice principal Dr sr. Sonia Kurien
For their immense support and blessing. I would like to thank our HOD Amit Kumar
Nag For his support. I would like to express my special thanks how get you to my research
guide Dr Smitha Pillai, associate professor of department of commerce for her valuable
suggestion and guidance and for giving me the golden opportunity to do this wonderful
research project on the topic:- consumer behaviour towards whey protein, without her
help it would have been difficult for me to have research the state of completion of my
project report also I would like to thank my parents and friend who helped me a lot in the
preparation of this project
I wish to acknowledge the help of all those who have provided me information guidance
and other help during my research

68
Table of content page no
I: Introduction of the Topic --------------------------------------------------------- 7-16
1.1 Rationale of the Study.-------------------------------------------------------------------------8
1.2 Introduction to the industry -------------------------------------------------------------------9
1.3 Introduction to the company -----------------------------------------------------------------10
1.4Justification of the topic -----------------------------------------------------------------------16
Chapter 2: Review of Literature ------------------------------------------------------- 17-25
2.1 International Reviews -----------------------------------------------------------18
2.2 National Reviews ----------------------------------------------------------------23
Chapter 3 : Research Methodology ---------------------------------------------------26-28
3.1 Objectives of the Study -----------------------------------------------------27
3.2 Scope of the study -----------------------------------------------------------27

69
3.3Limitation of the study ------------------------------------------------------28
Chapter 4 : Data representation & Analysis ---------------------------------------29-37
4.1 Data representation & Interpretation!------------------------------------------30
Chapter 5. Results & Discussion -------------------------------------------------------38-42
5.1 Major Findings -------------------------------------------------------------------39
5.2 Discussions & Suggestions -----------------------------------------------------40
5.3 Conclusion ------------------------------------------------------------------------42
REFERENCE ----------------------------------------------------------------------------------43-45

70
CHAPTER 1- INTRODUCTION OF THE TOPIC
1.1. RATIONALE OF THE STUDY 1.2. INTRODUCTION OF THE INDUSTRY 1.3. INTRODUCTION OF THE COMPANY1.4. JUSTIFICATION OF THE TOPIC

71
Chapter :1
Introduction of the topic
1.1 RATIONALE OF THE STUDY:-
Although with the rapid growth and Development of the civilization . People are also
not paying attention on their lifestyle and there health. Most of peoples do not have a
good lifestyle and they are not following a healthy routine in India there is lack of protein
in in Indians diet. Because most of the people in India are vegetarian are vegetarian and
it is difficult to get a rich protein diet when you are on a vegetarian diet this problem is
faced by most of the Indians and most of them are not aware that how important it is to
get a good amount of protein for a body. If person take a balanced diet he or she can

72
fulfil the need of daily protien which a body want it's very hard to take rich protein diet
because due to the busy schedule of a person many times he or she e are not able to
you eat properly e so so take a rich protein diet it will be e very difficult for a vegetarian
person and it will be e less difficult for a non vegetarian person because non-veg is a a
lean and good source of protein which can fulfill the need off the daily protein
According to a survey in India most of the people are facing depression due to access
of work and a unhealthy lifestyle. The pressure of work for age group of 22 to 50 is very
high and the pressure of study for students of age group between 15 to 22 is also very
high due to these reasons they are not able to follow a healthy lifestyle and to maintain a
healthy lifestyle you should take a balanced diet and due to this tight schedule of work
and study it is very difficult for them
For vegetarians the need of protein can be fulfilled by health supplements which are
available in the market. Whey protein can be a best supplement that can fulfil the need
of daily protien. If the whey protein is added in in a person’s daily diet it can balance the
protein part which most of the time missing in Indian diet because carbohydrate and fats
are very easy e available in Indian diet but protein is not on the other hand if we talk about
non vegetarian they can also consume whey protein which I will help them To live a
healthy life
1.2 INTRODUCTION TO THE INDUSTRY
India is the fastest developing nations, in the world . The food sector of the India has grown very well in past decade and is expected to be in the same status in the next 10

73
years. Functional food and beverages have gained immense popularity among the health-conscious Indian population.
In particular, product like whey protein have gained importance due to the health benefits that they offer. The demand for personal care products containing whey protein has also increased in the region. As the Indian youth are highly fitness freak, the demand for whey protein powder among the bodybuilding groups is increasing.
Indian whey protein market offers a wide range of product types, like whey protein concentrate, whey protein Isolate, and Hydrolysate whey protein, which helps in sports and performance nutrition, infant formula, and functional/fortified food.
But Whey protein concentrate is the leader of the market Owing to the multi-functionalities associated with the whey protein concentrates, such as easily digestible, efficient processing, and economic applications have been few major factors augmenting the market growth in the country. Moreover, with the increased consumption of sports nutrition among Indian youth, the demand for WPCs have risen attributed to its wide application in the segment. In addition, whey protein offers a cost-effective alternative to formulate caramels with excellent processability and the good eating quality increasing the desirability of the ingredient
On the other hand if we talk about whey protein isolate . Whey protein isolate contain a higher amount of protein and can be virtually lactose free carbohydrate free fat free and cholesterol free and it is highly available and very quickly absorbed in body and have a high concentration of branched-chain amino acid which are highly concentrated in muscle tissue and are used to fuel working muscle and simulate protein synthesis
Hydrolysate refer to any product of hydrolysis protein hydrolysate has special application in sport medicine because it consumption allow amino acid to be absorbed by the body more rapidly than intact proteins , thus maximizing nutrition delivery to muscle tissue. It is also used in the biotechnology industry as supplement to cell cultures. The December 2013 edition of international journal of food science and technology, hydrolysate was shown to be rich in L- aspartic acid and necessary minerals like manganese are selenium
Whey protein concentrate is cheaper and very economical but it way protein isolate is is expensive and costly than whey protein concentrate. But it was a protein hydrolysate is is the most expensive among the three protein which are available in the market because it is very purest form of protein

74
1.3 INTRODUCTION TO THE COMPANY
In past 10 years the awareness of whey protein is increased and it is expected to increase
the awareness of whey protein at the same rate it in next 10 years. From production to
the selling of the whey protein there are many companies which are manufacturing and
selling whey protein in the market .In past 10 years due to you a good response towards
whey protein there are various types of company which started the production of whey
protein because the market of whey protein will grow in future. In foreign countries whey
protein is very well known to the peoples but in India there are many people who are not
aware that what is a whey protein . If the people of India are well aware about the whey
protein it will be a win-win situation for both the industry and the people because the
industry will earn the money by selling whey protein and people will get a healthy lifestyle
and they will fulfill the the need of the protein which is very difficult nowadays
Now let us take closer look to the main foreign companies which are offering whey protein in India and other countries
1 optimum nutrition :- Glanbia is the parent company of the optimum nutrition company e the headquarter is in Kilkenny, Ireland it was founded in in 1997 optimum nutrition provides all three types of protein which is is whey protein concentrate, whey protein isolate, whey protein hydrolysate. The price of all the whey protein in different quantities are as follows
Proteins 1kg. 2.5 kg. 4.5

75
Whey protein concentrate. 1699. 3499 8799
Whey protein isolate. 2599. 6099. 11990
Whey protein hydrolysate 3799 6799. 13500
the flavours which optimum nutrition offers are as follows
Cappuccinos
Mocha
Banana
Caramel
Chocolate
Cookies and cream
Fruit
Hazelnut
Mint
Peanut
Strawberry

76
Unflavoured
Vanilla
2 My Protein:- it was first founded in 2004 by Oliver Cookson, but was later acquired by British E-Commerce company the hut group in June 2011. In December 2015 My protein announced an agreement with Kentucky Cabinet for Bullitt, country, Kentucky. The headquarter of My protein is in in North which, Cheshire, England. The area served buy my protein is worldwide all three types of protein whey protein concentrate whey protein isolate and whey protein hydrolysate is served by My protein the prices of the whey protein in different quantities are as follows Protein. 1kg. 2 kg. 4kg
Whey protein concentrate. 3000. 6000. 11000
Whey protein isolate. 3599. 7499. 13999
Whey protein hydrolysate 4500. 9000. 16500
The flavours which are offered by my protein are as follows
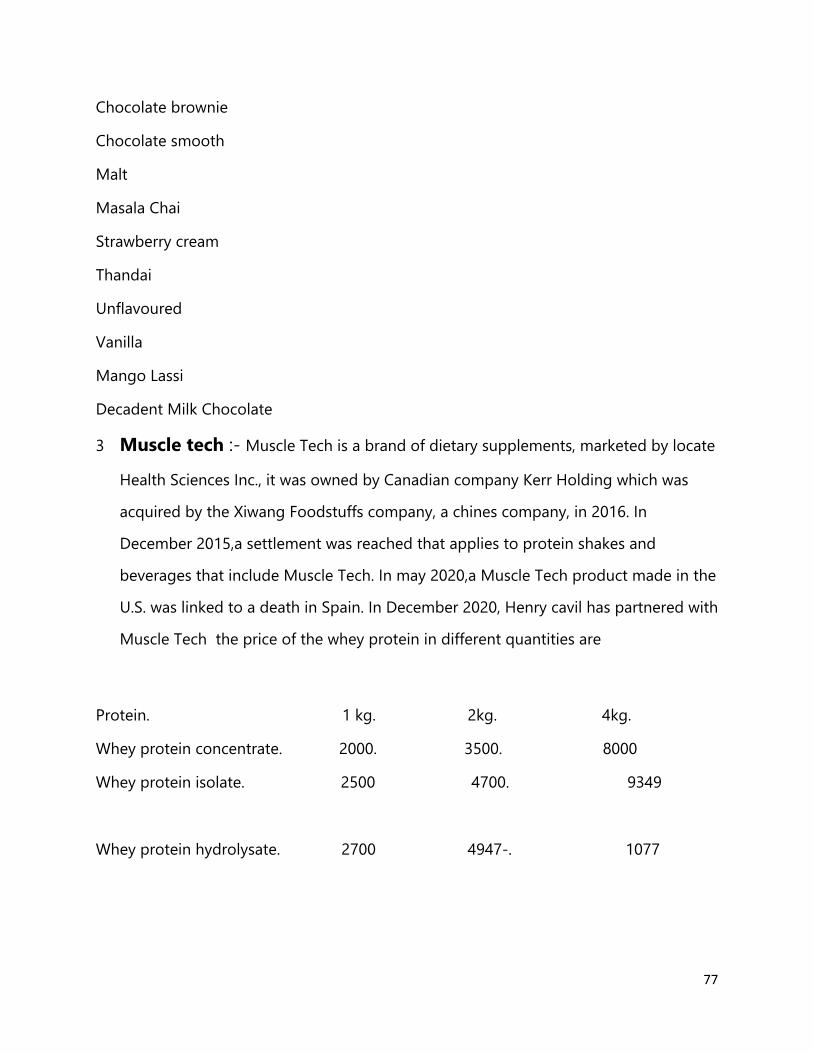
77
Chocolate brownie
Chocolate smooth
Malt
Masala Chai
Strawberry cream
Thandai
Unflavoured
Vanilla
Mango Lassi
Decadent Milk Chocolate
3 Muscle tech :- Muscle Tech is a brand of dietary supplements, marketed by locate
Health Sciences Inc., it was owned by Canadian company Kerr Holding which was
acquired by the Xiwang Foodstuffs company, a chines company, in 2016. In
December 2015,a settlement was reached that applies to protein shakes and
beverages that include Muscle Tech. In may 2020,a Muscle Tech product made in the
U.S. was linked to a death in Spain. In December 2020, Henry cavil has partnered with
Muscle Tech the price of the whey protein in different quantities are
Protein. 1 kg. 2kg. 4kg.
Whey protein concentrate. 2000. 3500. 8000
Whey protein isolate. 2500 4700. 9349
Whey protein hydrolysate. 2700 4947-. 1077

78
The flavour which whey protein offers are as follows
Banana
Birthday cake
Chocolate chip cookies Fought
Chocolate Hazelnut
Chocolate Mint
Cookies and Cream
Milk Chocolate
Mocha Cappuccino
Strawberry
Vanilla
4 Big muscle nutrition:- In 2009, Vats founded big muscle nutrition, a food supplement brand that has grown drastically in last few years the name of the owner is Suhel Vats . Big muscle nutrition is an Indian brand and it offers all the type of whey protein that is is whey protein concentrate, whey protein isolate, whey protein hydrolysate the price of the whey protein according to the quantity are as follows
Protien 1kg. 2kg. 4kgWhey protein concentrate. 1250. 2399. 4600

79
Whey protein isolate. 2549. 4971. 9860
Whey protein hydrolysate. 3300. 5949. 11000
The flavours that are offered by Big Muscle Nutrition are as follows
Belgian Chocolate
Cafe Latte
Vanilla Cream
Strawberry Milkshake
Smooth Banana Cream
Cookie and Cream
Rocky Road
Salted Caramel
Various type of fruit flavour
5.Muscle Blaze :- Sameer Maheshwari is the founder and CEO of the Muscle Blaze and it was founded on 2012 and It is an Indian brand Muscle Blaze is committed to connect

80
and communicate meaningfully with fitness enthusiasts. Muscle Blaze believe zidd as a concept will strike an instant chord with fitness consumer and strengthen muscle Blaze position as a leading sports nutrition brand in India. The price of protein offered by muscle blaze are as follows
Protein 1kg. 2kg. 4kg
Whey protein concentrate. 2199. 3599. 6899
Whey protein isolate. 2774. 5299. Nil
Whey protein hydrolysate 3299. 5999. Nil

81
1.4 Justification Of The Topic :-
India has grown as a big market for the whey protein supplement in past 5 years. Whey protein
is a healthy supplement without any risk of damage of organs in human body. WHEY protein is
made up of cow milk which is a natural substance. Whey protein is a good source of protein
and it is much better than other source of protein like meat protein, egg protien, plant protein Etc.
India is the largest country but the market of whey protein is small in India. Foreign countries
like USA, UK, and Canada the market of whey protein is big. Although India is a developing
country the metro cities of India are a good market for whey protein. Because most of the people

82
are educated and are aware about whey protein who are living in metro cities on the other hand
people who are from villages or other backward areas are not having any kind of awareness
about the whey protein so it will take some time set a big market in India

83
CHAPTER 2- LITERATURE REVIEW
2.1 INTERNATIONAL REVIEW
2.2 DOMESTIC REVIEW
Chapter 2
LITERATURE REVIEW

84
2.1 INTERPRETATION REVIEWS
• (Sebely Pal, Simone Radavelli‐Bagatini) The effects of whey protein on
cardio metabolic risk factors Sebely Pal, Simone Radavelli Bagatini Obesity
has reached epidemic proportions worldwide. The health consequences of
obesity are more dangerous when associated with the metabolic syndrome and
its components. Studies show that whey protein and its bioactive components
can promote greater benefits compared to other protein sources such as egg
and casein. The aim of this paper is to review the effects of whey protein on
cardio metabolic risk factors. Using PubMed as the database, a review was
conducted to identify current scientific literature on whey protein and the
components of the metabolic syndrome published between 1970 and 2012.
Consumption of whey protein seems to play an anti‐obesity and
muscle‐protective role during dieting by increasing thermogenesis and
maintaining lean mass. In addition, whey protein has been shown to improve
glucose levels and insulin response, promote a reduction in blood pressure and
arterial stiffness, and improve lipid profile. The collective view of current
scientific literature indicates that the consumption of whey protein may have
beneficial effects on some symptoms of the metabolic syndrome as well as a
reduction in cardiovascular risk factors
• (Victoria Norton, Stella Lignou, Lisa Methven) Influence of Age and Individual
Differences on Mouthfeel Perception of Whey Protein-Fortified Products

85
Protein needs are considered to increase with age, with protein consumption being
associated with many positive outcomes. Protein-fortified products are often used to
improve nutritional status and prevent age-related muscle mass loss in older adults.
Accordingly, older adults are commonly provided with products fortified with whey
protein; however, such products can cause mouthdrying, limiting consumption and product
enjoyment. Currently, the extent to which age and individual differences (eg, saliva, oral
health, food oral processing) influence the perception of whey protein-derived mouth
drying is relatively unclear. Previous research in this area has mainly focused on
investigating mouth drying, without taking into account individual differences that could
influence this perception within the target population. Therefore, the main focus of this
review is to provide an overview of the relevant individual differences likely to influence
mouthfeel perception (specifically mouth drying) from whey protein-fortified products,
thereby enabling the future design of such products to incorporate better the needs of older
adults and improve their nutritional status. This review concludes that age and individual
differences are likely to influence mouth drying sensations from whey protein-fortified
products. Future research should focus more on the target population and individual
differences to maximise the benefits from whey protein fortification
• (Cian Keogh, Chenguang Li, Zhifeng Gao) Evolving consumer trends for whey protein
sports supplements: the Heckman ordered probit estimation
Despite the fast-rising popularity of whey protein sports supplements over recent years, there
has been little research to investigate the driving forces behind the consumer choices. Using a
consumer dataset collected in Ireland, we applied the ordered Heckman two-stage method to
examine the evolving consumer trend and to determine the key factors that affect consumers’
choices. The study found that demographic variables, such as gender and income, do not
significantly influence the decision on whether or not to consume whey, but exercise type is
highly influential. The desire for power and strength is a stable key consumption driver, with
endurance and flexibility becoming more important in the expansion of this industry. The study
also found that whey is under-consumed by older age groups and under-promoted based on
country of origin affiliation. Findings of the study provide further insights to relevant literature

86
and have direct implications to the sports supplement industry as well as the dairy ingredient
industry.
• (Klaudia Kurajdova, Janka Táborecka-Petrovicova) factors influencing milk purchase
behaviour
today’s highly informed, competitive and saturated market, a key to success of
any business depends on knowing consumer and his consumption patterns and recognizing and
understanding factors influencing his decision-making for the purpose of developing an attractive
offer of products, supporting services, communication means and other marketing tools that would
fit like a glue to customer’s needs. Study of consumer behaviour belongs to a group of very wide
and strong subjects of marketing attention and its examination requires ongoing approach. Milk,
as one category of dairy products, belongs to the group of basic daily-consumed products
characterized by relatively high purchase frequency. On the other hand, its production and
consumption is experiencing certain negative trend in Slovakia what inevitably calls for a scientific
attention and examination in order to reverse this unfavourable development having a negative
impact on the milk companies in Slovakia. Therefore, we focus our attention on studying various
factors influencing consumers when purchasing this specific product. Our research in this stage
resulted in the compilation of literature review on factors influencing consumers when purchasing
milk and determination of boundaries and guidelines for our future research activity.
• (Timothy EL Douglas, Marta Vandrovcová, Nikola Kročilová, Julia K Keppler, Jana
Zárubová, Andre G Skirtach, Lucie Bačáková) Application of whey protein isolate in bone
regeneration: Effects on growth and osteogenic differentiation of bone-forming cells
Recently, milk-derived proteins have attracted attention for applications in the biomedical
field such as tissue regeneration. Whey protein isolate (WPI), especially its main

87
component β-lactoglobulin, can modulate immunity and acts as an antioxidant, antitumor,
antiviral, and antibacterial agent. There are very few reports of the application of WPI in
tissue engineering, especially in bone tissue engineering. In this study, we tested the
influence of different concentrations of WPI on behavior of human osteoblast-like Saos-2
cells, human adipose tissue-derived stem cells (ASC), and human neonatal dermal
fibroblasts (FIB). The positive effect on growth was apparent for Saos-2 cells and FIB but
not for ASC. However, the expression of markers characteristic for early osteogenic cell
differentiation [type-I collagen (COL1) and alkaline phosphatase (ALP)] as well as ALP
activity, increased dose-dependently in ASC. Importantly, Saos-2 cells were able to deposit
calcium in the presence of WPI, even in a proliferation medium without other supplements
that support osteogenic cell differentiation. The results indicate that, depending on the cell
type, WPI can act as an enhancer of cell proliferation and osteogenic differentiation.
Therefore, enrichment of biomaterials for bone regeneration with WPI seems a promising
approach, especially due to the low cost of WPI.
• (Maciej Nastaj, Bartosz G Sołowiej, Waldemar Gustaw, Salvador Peréz‐Huertas,
Stanislaw Mleko, Marta Wesołowska‐Trojanowska) Physicochemical properties of
High‐Protein‐Set Yoghurts obtained with the addition of whey protein preparations
The aim of the paper was to investigate the effects of the
addition of whey protein isolate (WPI) and whey protein concentrate (WPC80) on
physicochemical properties of high‐protein yoghurts. Changes in storage, loss moduli,
phase angle values, flow behaviour and textural parameters were determined. Surface
properties (roughness, contact angles) were also estimated. The properties of yoghurts
depended on the preparation type and their concentration. The application of WPI resulted
in accelerated gel formation in comparison with the yoghurts produced with WPC80. This
technology is addressed to particular consumers who search for new foods to meet their
daily protein requirements

88
• (Diana R Palatnik, María Victoria Ostermann Parcel, Ulises González, Noemi Zaritzky,
Mercedes E Campderrós) Recovery of caprine whey protein and its application in a food
protein formulation
This study investigated the recovery of proteins from whey caprine
cheese which is mostly discarded as waste. A membrane process including microfiltration and
tangential ultrafiltration was used to purify and concentrate the protein solution, reaching a 91.4
g/100 g of protein concentration. The concentrate was then freeze-dried and characterized. The
good emulsifying properties, high water and oil holding capacity and the rheological behaviour
suggested the application of the whey protein concentrate in the formulation of a dressing. Physico-
chemical characterization indicated that the samples were similar to a commercial dressing in
viscosity, texture, moisture and ash contain. Also the sensory analysis demonstrated a good
acceptance mainly in colour and flavour of the samples. However, the protein content of the
product: 0.97 ± 0.12 g/100 g, duplicated the value of the commercial sample incorporating higher
added-value to a product with high consumption.
• (Ayşe Sibel Akalın, Cem Karagözlü, Gülfem Ünal) Rheological properties of reduced-fat
and low-fat ice cream containing whey protein isolate and inulin
Instrumental analyses were used to evaluate the rheological properties of regular (10%),
reduced-fat (6%) and low-fat (3%) ice cream mixes and frozen ice creams stored at −18 °C.
The reduced-fat and low-fat ice creams were prepared using 4% whey protein isolate (WPI) or
4% inulin as the fat replacement ingredient. The composition, colour, apparent viscosity,
consistency coefficient, flow behaviour index, hardness and melting characteristics were
measured. No effect of WPI or inulin was obtained on the colour values. Compared with
regular ice cream, WPI changed rheological properties, resulting in significantly higher
apparent viscosities, consistency indices and greater deviations from Newtonian flow. In
addition, both hardness and melting resistance significantly increased by using WPI in
reduced-fat and low-fat ice creams. Inulin also increased the hardness in comparison to regular
ice cream, but the products made with inulin melted significantly faster than the other samples.

89
• (Ondine van de Rest, Nikita L van der Zwaluw, Lisette CPGM de Groot)the role of dietary
protein and amino acids in cognitive functioning and cognitive decline
As the population of elderly people is growing rapidly, the number of individuals with
dementia and cognitive impairment is also increasing. One of the preventive measures
against cognitive decline is diet and different dietary factors have already been
investigated. This review provides an overview of studies on dietary protein and cognitive
functioning and cognitive decline. Also studies on the individual amino acids that are
related to brain function, tryptophan and tyrosine, are discussed. Overall, the role of dietary
protein intake on cognitive functioning as well as cognitive decline has hardly been studied;
we found eight observational studies and three intervention studies. More studies
investigated the role of tryptophan (14 studies) and tyrosine (nine studies) in relation to
cognitive functioning, but all these studies were performed in young adult populations and
mostly under special conditions. Research in elderly populations, in particular, is
warranted. Also more research is needed to come to definitive conclusions and specific
recommendations regarding protein intake or intake of specific amino acids for maintaining
optimal cognitive functioning.
• (Hellen CG Nabuco, Crisieli M Tomeleri, Paulo Sugihara Junior, Rodrigo R Fernandes,
Edilaine F Cavalcante, Melissa Antunes, Alex S Ribeiro, Denilson C Teixeira, Analiza M
Silva, Luis B Sardinha, Edilson S Cyrino)Effects of whey protein supplementation pre-or
post-resistance training on muscle mass, muscular strength, and functional capacity in pre-
conditioned
Aging is associated with sarcopenia and dynapenia, with both processes contributing to
functional dependence and mortality in older adults. Resistance training (RT) and increased
protein intake are strategies that may contribute to health improvements in older adults.
Therefore, the aim was to investigate the effects of whey protein (WP) supplementation
consumed either immediately pre-or post-RT on skeletal muscle mass (SMM), muscular
strength, and functional capacity in pre-conditioned older women. Seventy older women
participated in this investigation and were randomly assigned to one of three groups: whey
protein pre-RT and placebo post-RT (WP-PLA, n= 24), placebo pre-RT and whey protein post-
RT (PLA-WP, n= 23), and placebo pre-and post-RT (PLA-PLA, n= 23). Each group ingested
35 g of WP or PLA. The RT program was carried out over 12 weeks (three times per week; 3×

90
8–12 repetition maximum). Body composition, muscular strength, functional capacity, and
dietary intake were assessed pre-and post-intervention. Two-way analysis of covariance
(ANCOVA) for repeated measures, with baseline scores as covariates were used for data
analysis Whey protein supplementation was effective in promoting increases in SMM,
muscular strength, and functional capacity in pre-conditioned older women, regardless of
supplementation timing
2.2 NATIONAL REVIEW
• (S Sarkar) Innovation in India fermented milk product
Dahi is considered the oldest Indian fermented milk product and is equivalent to
Western yogurt from which derivatives such as shrikhand (sweetened concentrated curd) and lassi
(stirred curd) are derived. Dietetic significance of Indian fermented milk products has been
established due to its various nutritional and therapeutic properties. Acceptable quality dahi could
be obtained with the application of acid producing as well as flavour (primarily diacetyl)-
producing organisms and adopting a two-stage fermentation. Biotechnological innovations suggest
inclusion of certain probiotic and beneficial bacteria for further enhancement in the dietetic
properties of traditional dahi. Application of bio-preservatives and thermization (mild heat-
treatment) may be recommended for shelf-life extension of dahi to extend the market reach.
• (Aarti Sachdeva et al. World J Gastroenterol. 2014.) Efficacy of fermented milk and whey proteins in Helicobacter pylori eradication
Fermented milk and several of its component whey proteins have emerged as candidates for
complementary therapy. In this context the current review seeks to summarize the current evidence
available on their role in H. Pylori eradication. Pertinent narrative/systematic reviews, clinical
trials and laboratory studies on individual components including fermented milk, yogurt, whey
proteins, lactoferrin, α-lactalbumin (α-LA), glycomacropeptide and immunoglobulin were
comprehensively searched and retrieved from Medline, Embase, Scopus, Cochrane Controlled
Trials Register and abstracts/proceedings of conferences up to May 2013. A preponderance of the

91
evidence available on fermented milk-based probiotic preparations and bovine lactoferrin suggests
a beneficial effect in Helicobacter
The magnitude of the potential benefit documented so far is small and the precise clinical settings
are ill defined. This restricts the potential use of this group as a complementary therapy in a
nutraceutical setting hinging on better patient acceptability/compliance. Further work is necessary
to identify the optimal substrate, fermentation process, dose and the ideal clinical setting
(prevention/treatment, first line therapy/recurrence, symptomatic/asymptomatic, gastritis/ulcer
diseases etc.). The potential of this group in high antibiotic resistance or treatment failure settings
presents interesting possibilities and deserves further exploration.
• (Seema Gulati 2017) Effect of high-protein meal replacement on weight and
cardiometabolic profile in overweight/obese Asian Indians in North India
The aim of the present study was to evaluate the impact of a high-protein meal replacement
(HPMR) on weight and metabolic, lipid and inflammatory parameters in overweight/obese Asian
Indians. In this 12-week open-label, parallel-arm randomised controlled trial, 122
overweight/obese men and women were administered either a HPMR or a control diet after 2
weeks of diet and exercise run-in. Body weight, waist circumference (WC), percentage body fat
(%BF), fasting blood glucose, post-oral glucose tolerance test (post-OGTT) blood glucose, fasting
and post-OGTT serum insulin, lipid profile, high-sensitivity C-reactive protein (hs-CRP), kidney
function and hepatic aminotransferases were assessed before and after the intervention . These
findings show that intervention with HPMR may lead to significant weight loss and improvement
in obesity measures, metabolic, lipid and inflammatory parameters and hepatic transaminases in
overweight/obese Asian Indians.
• (CT Manoj Kumar, Latha Sabikhi, AK Singh, PN Raju, Rajesh Kumar, Rajan
Sharma)Effect of incorporation of sodium caseinate, whey protein concentrate and transglutaminase on the properties of depigmented pearl millet based gluten free pasta

92
The current investigation reports the preparation of gluten free pasta from depigmented pearl millet flour blended individually with sodium caseinate (SC) (10 and 20%). TG addition increased the cooking loss, water absoprtion and pasting properties (in all the samples). Protein solubility (%) decreased with increase in the enzyme concentration confirmed with electrophoretic patterns. Moreover, the TG treatment imparts tenderness and chewiness to pasta. Hence, the present combination could be useful for preparation of good quality of gluten free pasta.
• (Parimal Pal, Jayato Nayak) Development and analysis of a sustainable technology in
manufacturing acetic acid and whey protein from waste cheese whey
A multi-stage membrane-integrated hybrid reactor system was developed
and investigated for fermentative production of high purity acetic acid and whey protein from
waste cheese whey. Integration of largely fouling-free membrane modules with traditional
fermenter allowed fermentation with product withdrawal in a continuous scheme. Provision for
recycling microbial cells, unconverted sugars and nutrients through cross flow membrane
modules resulted in high yield (>98%) and productivity (96 g L−1 h−1) under high cell density.
The final forward osmosis stage concentrated dilute acetic acid to 962 g L−1. The
environmentally friendly modular design of the membrane integrated system ensured
continuous production of more than 98% pure acetic acid in a very simple, compact and flexible
plant configuration reflecting all the major characteristics of high process intensification
essential to sustainable production and business. Concentrated whey protein (955 g L−1)
recovered as a by-product added to the economy of the process raising the possibility of
enhanced profit margin. The developed new design fulfills the major expectations of a
sustainable technology in terms of benefits to the planet, people and profit. The sustainability
parameters in terms of cost of equipment, and production, reduced consumption of material and
energy, flexibility, profitability and environmental friendliness have been analyzed in the paper.
• (NEN Amiruddin, MN Zahary, R Bhaskar, AM Mhd Jalil) Glycaemic index, palatability and
acceptability of energy drinks prepared with β-glucan and whey protein
β-Glucan (βG) and whey protein (WP) are two functional ingredients widely
used to maintain desirable blood glucose and weight management. However, the effect of
combining βG and WP is still not thoroughly explored. This study was aimed to determine the
effects of combining βG and WP in energy drinks on glycaemic index (GI), palatability and
acceptability. Ten females (22.0±0.64 years old, 20.6±0.24 kg/m²) randomly completed four

93
trials (control drink, βG drink, WP drink and βG+ WP drink) in a cross-over manner.
Palatability and acceptability were measured using visual analogue scale (VAS). Capillary
blood was collected at 0 min (fasting state, baseline) and 15, 30, 60 and 120 min after the test
drinks and assayed for glucose. There were no significant differences in palatability and
acceptability of test drinks compared with control (p> 0.005). The incremental area under the
curve (iAUC) for blood glucose responses showed no significant differences between all test
drinks. Time x treatment showed a significant increased from 0 to 30 mins (peak)(p< 0.005) for
all test drinks. Blood glucose response significantly (p< 0.005) decreased from 30 to 120 mins
for all test drinks except control. There were no significant differences in GI of βG, WP, and
βG+ WP drinks compared with control (117%, 124% and 114%, respectively). This study
suggested that drinks prepared with βG and WP were palatable and acceptable either per se or
in combination but did not significantly reduce the GI compared with control drink. In addition,
the drink prepared with βG and whey protein reduced short-term glucose but does not affect
overall glycaemic response.
CHAPTER 3-RESEARCH AND METHODOLOGY3.1 OBJECTIVE OF THE STUDY

94
3.2 SCOPE OF STUDY 3.3 LIMITATION
CHAPTER 3
RESEARCH AND METHODOLOGY
3.1 OBJECTIVE OF STUDY :-
1) To study and analyse consumer shopping behaviour towards whey protien

95
2) To access the behaviour level of different type of consumer shopping whey protein
3) To identify what type of strategies are suitable for the company to reach the targeted customers
4) To find out how the consumer spent their income, time on the purchasing of whey protien
3.2SCOPE OF STUDY
This research is using a case study best methodology which collects or works in non numerical
data it is a method used to narrow down vast field of research into one recapable topic it
understand the meaning and provide in-depth understanding of problem. Consumer behaviour
towards whey protein is the biggest problem that the protein industries are facing till this date
and it is Very necessary to conduct a study to determine that what a consumer think about and
how to change individual perception about the whey protein and supplements thus, A case study
based analysis is appropriate for this research the study gather data from 10 individuals in in five
companies give us sufficient data and information for the investigation namely the challenge
which is faced by the manufacturers of whey protein and companies.
Data was collected from the whey protein industry as it contributes to the economy. Whey protein
industry got a good growth in past 10 years and in 2020 the market size was expected of 9 billion
US dollars and it is expected to expand at compound annual growth rate of 9% from 2016o 2021
the changing of consumer behaviour towards whey protein is promoting food and beverage
industry to add whey protein in their packaged food due to rise in in illness due to change in
lifestyle to get back on track of healthy lifestyle there is a huge demand of whey protein because

96
it is rich in all amino acids and protein due to this whey protein industry is also contributing in
GDP and economic of India
3.3 LIMITATIONS :-1) There are very less research done on consumer behaviour towards whey protein because
of that finding data is very difficult.
2) Due to covid-19 gyms are closed and other places where people are going for exercises
and other sports activities are also closed due to this it's very hard to get primary data for
the research because only e the person can give a 2 review about the whey protein who is
consuming or consumed whey protein once in his life.
3) This research is done during covid-19 and due to this primary data is very difficult to find
and secondary data is this research but the secondary data are old data which is not 100%
effective.
4) Geographical limitation is also limited this research because is very hard to research on a
very large geographical area and all the opinions and are not same am different areas
people may have different opinions about the whey protein

97
CHAPTER 4- DATA REPRESENTATION AND ANALYSIS
4.1 DATA REPRESENTATION AND INTERPRETATION
CHAPTER 4
DATA REPRESENTATION AND ANALYSIS

98
There are equal number of male and female respondents and majorly are in the age group of 16-
30 (71 %) years and rest are above age of 30. Among all 100 participants only 34 % are consuming
any sort of dietary supplements while 60% feel the need of these supplements assuming these are
good for health. At the time of buying these products influence of advertisement, reference group
and family does not seems very impactful while health consult-ants or doctor’s recommendations
plays major role. All the respondents prefer natural or herbal products over chemical products and
preferred forms are shakes or pills followed by powder. Most of the consumer are satisfied with
the supplement’s results (70%) and want to recommend to others (71%). About pricing of these
products 46 % consumers feels that they are fairly priced while 54 % thinks they are overpriced.
Overall it can be concluded that consumers are aware about health and dietary supplements and
feels that it will be helpful for them for keeping good health.
Another study shows that a survey was conducted in Ireland in February and March of 2014
through an online Facebook community. They take people of 18 and above 18 year old in this
survey. This survey contains some characteristics like gender, age, income,employment status.
This survey also this survey is also done keeping in mind that people who are consuming whey
protein are you doing any kind of exercises or not if if yes then what kind of exercises concert
considering that main function of whey protein that it improves muscle protein synthesis in our
body d and it also promote muscle growth and also helps in weight loss for weight gain these all
points are very relevant to the construction and purchase of whey protein there are total of 100
reviews or answers of a questionnaire work collected and used in this study the statistics are shown
in the below table

99
Table Variable. Percentage
Gender
Male. ------------------------------------------------------------------------------- 45.71
Female ----------------------------------------------------------------------------- 54.29
Age
18-25. -------------------------------------------------------------------------------51.94
26-36. ------------------------------------------------------------------------------- 29.42
Gross income
Income above 30,000 ------------------------------------------------------------- 39.60
Between 30,000-50,000. -----------------------------------------------------------44.56
Between 50,001-70,000.----------------------------------------------------------- 13.86
Employment
Full time employed. ---------------------------------------------------------------43.27
Part time employed.----------------------------------------------------------------14.42
Others --------------------------------------------------------------------------------42.31
Exercise hour per week
Up to 3 hours.-----------------------------------------------------------------------23.30.
3 to 6 hours.------------------------------------------------------------------------ 38.83
More than 6 hours. ----------------------------------------------------------------37.87
Main type of exercise
Endurance. -------------------------------------------------------------------------61
Power and strength.---------------------------------------------------------------12
Flexibility. ------------------------------------------------------------------------ 27
When started using whey protein
Within the last year. --------------------------------------------------------------40
1 to 4 years ago. -------------------------------------------------------------------45
More than five years ago.--------------------------------------------------------15

100
In this table the percentage of female are somewhat lower than male and likely e the continued
gender difference between male and female are shown in the conception of sports supplements
and other supplements like whey protein BCAA. The majority of the the people which are used in
this study approx. 77% of people are engaged in more than three hours of exercises per week, and
61% off of people are doing endurance as their main type of exercises in the gym comparing two
to the 27% of people who are doing flexibility as their main type of people. and if we talk about
the people who are below the age of 25 are using whey protein more than the people who are
above the age of 26 so this study shows that the the whey protein is very popular among the
youngsters and less popular amount adults
Model (1) Model (2)
Quantity Expense
Outcome model
Age − 0.495** (− 2.66) − 0.320*. (− 2.18)
Female. − 0.975 (− 1.61). − 0.468 (− 1.05)
Income 0.0150 (0.13) − 0.0220 (− 0.15)
Exercise frequency − 0.0421 (− 0.51) − 0.0565 (− 0.54)
Selection model
Age − 0.0134 (− 0.14). − 0.00832 (− 0.09)
Female − 0.144 (− 0.48). − 0.114 (− 0.39)
Income − 0.0344 (− 0.40) − 0.0576 (− 0.60)
Flexibility 0.417 (1.17) 0.199 (0.51)
Power/strength 1.085** (2.95). 1.111** (3.16)
Constant. − 0.397 (− 0.92) − 0.336 (− 0.73)

101
Athrho 1.208 (1.39) 0.669 (0.89)
Log likelihood − 92.62 − 111.0
Observations 105 105
The lower part of the table reports parameters for the selection model, that is, factors affecting the
decision of whether or not to consume whey protein sports supplements; the upper part of the table
includes estimates for the outcome model, that is, factors affecting the amount of whey products
consumed given a decision to consume in the first place. Whey consumption amount is captured
by both the quantity of whey products consumed (model 1Footnote5) and the money expenditure
on whey products (model 2). In both models, qualitative variables such as gender and exercise type
are included as indicator variables, with endurance being used as the base for exercise type. Results
in model 1 show that demographic variables such as age, gender, and income do not have a
significant influence on the decision on whether or not to consume whey, but exercise type does
make a difference: relative to “endurance” type of exercisers, people who engage in “power and
strength” types of exercises are more likely to consume whey protein sports supplements.
Regarding the quantity purchased, gender and income are not significant in the model results,
indicating the lack of statistical evidence to support the gender difference in the decision for whey
protein consumption. Conversely, age is negative and significant, showing a negative impact at
the 95% confidence level even after controlling for exercise frequency, indicating that among
whey consumers, older people tend to consume less whey protein sports supplements. The results
in model 2 are consistent with those reported in model 1, where expense replaces quantity of whey
sports supplements consumed as the dependent variable.
These findings suggest that income (albeit self-reported) is not a
defining factor of whey protein sports supplement consumption, and also challenge the
conventional understanding that females are less likely than males to use sports supplements. In
addition, perhaps, the most noteworthy finding involves the older age group. Our study shows that
older people tend to consume less whey products even after controlling for exercise frequency in
the analysis. Scientific research indicates that as people age, they tend to become resistant to the

102
positive effect of protein ingestion, which means that older people need a higher protein dose than
younger people post-exercise to achieve desired muscle protein synthesis (Burd et al. 2012). In
summary, older people consume less whey protein when they should be consuming more. This
apparent divergence offers a potential marketing opportunity for this growing industry. To further
identify the changing consumption trend of whey protein supplements, we took the subsample of
the data (in particular, those who consume whey protein products) and divided it into two groups:
group 1 includes people who used whey for more than 2 years and group 2 includes those who just
started using whey within 2 years at the time of the survey. The statistics show that more than half
of the new whey consumers are those who participate in endurance and flexibility types of exercise,
indicating a strong market growth potential in this market segment. The statistics also show that
more than 80% of the female consumers of whey protein supplements only started to use the
product in the last 2 years, indicating a strong growth trend for females in recent years. Reasons
behind this trend include the change in perception (that the function of muscle recovery can be
achieved without building bulk muscle mass) and product availability (companies are targeting
female consumers with specific designs that appeal to females (e.g., pink packaging, smaller
size)).Footnote6 When investigating consumers’ brand preference, we find no significant
correlation among age, gender, or exercise type to the choice of Irish brand vs. non-Irish brand.
But one noteworthy finding is that while 55% of whey consumers surveyed state that they would
prefer Irish brands to non-Irish brands, 41% of consumers within this group were unaware of
whether or not the product they bought is an Irish brand product. This current lack of awareness
of brand origin among consumers likely reflects the under-promotion of origin-related brand
names. On the flip side, using country of origin labelling to further promote whey products may
have strong marketing potential.

103
Barograph showing the growth of whey protein from 2016 to 2024 In India
This graph shows that from 2016 to 2024 the growth of the industry will be at the rate of 10% and there is a prediction for year 2022 ,2023 and 2024

104
Pie chart showing consumption of all 3 type of Whey Protien in India
The pie chart shows that whey protein concentrate is is consumed in high amount compared to
whey protein isolate and whey protein hydrolysate. The reason behind the popularity of whey
protein concentrate is is its cheaper price because whey protein isolate is is expensive then whey
protein concentrate and whey protein hydrolysate is is more expensive than whey protein isolate
market share of the whey protein concentrate is high because of it low price and the market share
of whey protein hydrolysate is low because of its high price

105
Pie chart showing the popularity of whey protein brands
This table shows that Muscle Tech has the highest popularity among all the leading brands and after that transparent labs and on third optimum nutrition

106
Pie chart showing the whey protein market share
Asia Pacific market of whey protein is growing and in 2020 it has the highest share of whey protein after that North America and on third position Europe

107
CHAPTER-5 RESULTS AND DISCUSSION 5.1 MAJOR FINDINGS 5.2 DISCUSSION AND SUGGESTIONS 5.3 CONCLUSION

108
CHAPTER 5
RESULTS AND DISCUSSION
5.1 MAJOR FINDINGS
Hence the research is done on the basis of secondary data which is collected from Google and from some books . The major finding study on the consumer behaviour towards whey protein is taken from secondary data and the major findings are based on the secondary data only
1) In India people are getting aware about whey protein and benefits of whey protein mainly who are doing any type of exercise like endurance, strength, muscle hypertrophy
2) The percentage of male consumer are more than female consumer between the age group of 18 to 35
3) The growth of protein industries are directly affected by the Consumer Behaviour
4) In past 10 years the protein industry e grow on a good rate and in future the rate will be twice the rate of past 10 years rate. Because many people are improving their lifestyle and in future many more will be focus on their lifestyle and will get awareness about whey protein
5.2DISCUSSION AND SUGGESTIONS

109
1) Discussion :-
Few customers that are below the age of 20 or 22 has a major impact of the parents while
buying whey protein . In India due to several myths if a person for age group of 20 or 22 who
is willing to buy a Whey Protein face restriction from their parents . Whey protein market is
going to be e a big market in few years people should know the benefits of the whey protein
like . Whey Protein helps in maintaining a balanced diet, help in muscle building, helps in
controlling the blood pressure, Immune modulating activity, improving cardiovascular activity
, boosting the performance, health blowing the rate of hair fall,
Best practices can help whey protein industries to increase market share of whey protein
suggest increasing consumer purchasing power and encouraging them live a healthy lifestyle
and to add ve protein in their daily diet
We asked consumers if they felt that whey protein is safer for health in an effort
to spend what was widely reported as consumer protection amount and humours of whey
protein Morrison LJ, Reported that there are not many studies are done on consumer behaviour
towards whey protein in fact many recently published report does not properly shows consumer
behaviour to worry protein
But many studies shown that whey protein is safe to use and can be used by
anyone office group from 15 to 80 years old
2) Suggestion
• People are having myth’s about the whey protein. The myth are that protein damages liver, kidney and it is not safe for health. For the growth of whey protein industry companies should red the awareness about the benefits of whey protein and promote healthy life to the people avoiding the myth about whey protein is not a solution it should be completely vanished from the mind of a consumers this will not only helps industry in growing but also help consumer to live a healthy life

110
• Another important issue with the whey proteins are that they are very expensive for many
of the consumers. The company should set a price which should not be so high that the
consumer not be able to buy and the price should not be so low that company faces loss the
price should be moderate so that there should be no loss to anyone
• There is lack of marketing of whey protein companies are not doing a good marketing for
wave protein . In India there are no ads for whey protein supplements or if there are any
ads we really we see them. The company should invest in the marketing of whey protein
which will ultimately e helps them to grow
• Another problem with the whey protein are that there is are huge market of of fake whey
protein they look like original ones the packaging all the details in packaging as same as
original one but the content it off of that packet is not original whey fake whey protein
should be completely removed from the whey protein market it will take some time but
many people have fear of buying fake protein which will not give any good effect to their
health
As a final word, health benefits socially responsible consumption sense of belonging and sense of accomplishment are construct which guide consumer preference that can be used in promotional campaign directed at any of the whey protein market segment
5.3 CONCLUSION
After we study all the secondary data of consumer behaviour towards whey protein we came
to a conclusion that awareness about the whey protein is increasing day by day past 10 years
whey protein gain good amount of popularity among athletes bodybuilder and normal people
in and it will grow on a High rate in next 10 years in this study you also investigate that the
consumer trend is evolving and the gender and the income also effect the purchase of whey
protein the person who is is is an athlete all train for power and strength are more likely to
purchase whey protein on the other hand person with a good income does not hesitate in buying
a whey protein but a person with less income is not a frequent buyer of whey protein people

111
nowadays want to live a healthy lifestyle and that's the reason why they consume whey protein
but in last 10 years the trend was changed but before that it only athletes and bodybuilder are
the consumer for whey protein and only 20to 30 percent who are not doing any type of
exercises consumes whey protein
But now the scenario is changed and a healthy lifestyle main goal that a a individual want to
achieve now a days women also consume whey protein and now the consumption of whey protein
in the gender composition is shifted from the male dominance to the gender neutral in this study
we also find that not only adults can consume whey protein but also it is also safe for the children
because it will also help them to grow keep them healthy. And if we talk about supplement industry
in India we can see e a good growth of this industry should work ok hard for the awareness many
people who are living a healthy lifestyle are aware of whey protein and might be consuming whey
protein but the people who are not following a healthy lifestyle not consuming any supplements
so company should make them aware which help company also to sell their product to the new
customers
It is also find that whey protein is safe for health and it does not affect a body for once like kidney
liver heart but help a body to keep organ healthy on the other hand if we consume whey protein
on high amount then we can face some issues in our body which raise a dangerous situation for a
body if protein is taken into to a specific quantity which is mention on direction to use then there
is no problem with whey protein and there are 100 off benefits for us and it will add some more
year to our life

112
REFERENCES :- 3ABusiness consulting(2017) Global market for whey and lactose ingredients,2917-2021. 3A Business Consulting, Aarhus Agriculture and Agri-Food, Canada [AAFC] (2010) Overview of the sports nutrition market –food, beverages, andsupplements. Agriculture and Agri-Food Canada, Ottawa, Ontario
Am JAgric Econ 88(2):324–337
Baltagi BH (2008) Econometric Analysis of Panel Data. Chichester: Wiley
Basu, S. K., Thomas, j.E., and Acharya, S. N. (2007). Prospects for growth in global nutraceutical and functional food market . A Canadian perspective . Aust.j.basis Appl. Sci, 1(4),637-649.
Bellemare MF, Barrett CB (2006) An ordered Tobit model of market participation: evidence from Kenya and Ethiopia.
Bianco A, Mammina C, Paoli A, Bellafiore M, Battaglia G, Caramazza G, Palma A, Jemni M (2011) Protein supplementation instrength and conditioning adepts: knowledge, dietary behaviour and practice in Palermo, Italy. J Int Soc Sports Nutr 8:25https://doi.org/10.1186/1550-2783-8-25
Bistrom M, Nordstrom K (2002) Identification of key success factors of functional dairy foods product development. TrendsFood Sci Technol 13:372–379
Brower v.Nutraceuticals: poised for a healthy slice of the healthcare market? Nat Biotechnol. 1998,16:728-731.
Burd NA, Yang Y, Moore DR, Tang JE (2012) Greater stimulation of myofibrillar protein synthesis with ingestion of whey protein isolate v. Micellar casein at rest and after resistance exercise in elderly men. Br J Nutr 108(6):958–962Challener C (2000) Functional foods market offers promise and risk. Chem Mark Report 257:16Chiburis R, Lokshin M (2007) Maximum likelihood and two-step estimation of an ordered-probit selection model. Stata J 7(2):167–182
Childs JL, Thompson JL, Lillard JS, Berry TK, Drake M (2008) Consumer perception of whey and soy protein in mealreplacement products. J Sens Stud 23(3):320–339
De Luca G, Perotti V (2011) Estimation of ordered response models with sample selection. Stata J 11:213–239
Department of Agriculture, Food, and the Marine (DAFM) (2011) Implementation of the Food Harvest 2020 in the Dairy sector (2011). Department of Agriculture, Food, and the Marine, DublinEuromonitor (2015) Sports nutrition in Ireland –a category briefing. Euromonitor International, LondonEuromonitor (2016) Global trends in protein. Euromonitor International, London

113
Ervin, R.B., Wright, J.D and Kennedy-Stephenson, j. (1999). Use of dietary supplements in the United States, 1988-1994. Vital and health statistics. Series 11, Data from the national health survey, (244), i-iii.
Food and Drink Business Europe (2011) Glanbia acquires US performance nutrition business for $144 million. Dublin: Premier Publishing Ltd.
Foreland K, Wanda K, Hingst J, Kopecky L (2004) Nutritional supplement use among college athletes and their sources of information. Int J Sport Nutr Exerc Metab 14:104–120
Gao Z, House LO, Gmitter FG Jr, Valim MF, Plotto A, Baldwin EA (2011) Consumer preferences for fresh citrus: impacts of demographic and behavioral characteristics. Int Food Agribus Manage Rev 14:23–40
Gizis F, Shorter B (2004) Prevalent use of dietary supplements among people who exercise at a commercial gym.Int J Sport Nutra Exercise Metab 14(4):481–492
Gupta, S., Chauhan, D., Mehla, k., Sood, p., and Nair , A.(2010).An overview of nutraceuticals: current scenario. Journal of basic and clinical pharmacy.1(2), 55.
Ha E, Zemel MB (2003) Functional properties of whey, whey components, and essential amino acids: mechanisms underlyinghealth benefits for active people. J Nutr Biochem 14:251–258
Hasler CM (1996) Functional foods: the western perspective. Nutr Rev 54:S6–S10
Heckman J (1979) Sample selection bias as a specification error. Econometrica 47:153–161 Note: Heckman received the Nobel Prize for this paper
Kalra, E. K. (2003). Nutraceuticals-definition and introduction. Aaps pharmacy, 5(3), 27-2
Lee SY, Dangaran KL, Guinard JX, Krochta JM (2002) Consumer acceptance of whey-protein-coated as compared with shellac-coated chocolate. J Food Sci 67(7):2764–2769
Macharia J, Collins R, Sun T (2013) Value-based consumer segmentation: the key to sustainable agri-food chains. Br Food J115:1313–1328
Mirasol F (1999) Sloan outlines nutraceutical trends at DCAT health & nutrition seminar. Chem Mark Report 255:4–5
Motwani, D., And Agarwal, K. (2012). Customers Behaviour in Health food Drink product category. Pacific Business Review international,5(1)
Nutraceutical industry in India to touch 6.1 billion by FY20 an article in the Economic times, retrieved online from http://articles.economictimes.indiatimes.com/2015-02-01/news/58675920_1_nutraceutical-functional-food-and-beverages-protein-supplements
Samuels DJ, Zucco C (2013) Using Facebook as a subject recruitment tool for survey-experimental research. SSRN Electron J.https://doi.org/10.2139/ssrn.2101458
StataCorp (2013) Stata Statistical Software: Release 13. Stata Corp, College Station, TX

114
Tan H, Forgasz H, Leder G, McLeod A (2012) Survey recruitment using Facebook: three studies. NETs2012 International Conference on Internet Studies, Bangkok
Wineman R (2013) Econometric analysis of count data, 5th edn. Springer, New York

115
Indian Healthy Food and Beverages
Research Project Submitted in Partial Fulfilment of the Requirements for the
Degree of
B.COM Honours
by
ASHI MALVIYA
to the
DEPARTMENT OF COMMERCE
THE BHOPAL SCHOOL OF SOCIAL SCIENCES
April,2021
Submitted by: Guided By:
Ashi Malviya Dr. Smitha Pillai
Associate Professor
Department of Commerce

116
DECLARATION
I hereby declare that this project report entitled “INDIAN HEALTHY FOOD AND
BEVERAGES“was carried out by me for the degree of B.COM Honours under the guidance
and supervision of Dr. Smitha Pillai, Associate Professor of Department of Commerce, BSSS
College. The interpretations put forth are based on my reading and understanding of the original
texts and they are not published anywhere in any form. The other books, articles and websites,
which I have made use of are acknowledged at the respective place in the text. This research
report is not submitted for any other degree or diploma in any other University.
Place: Bhopal
Name of the Student: Ashi Malviya
Class & Section: B.com Honours 3A
Date:
CERTIFICATE
It is certified that the work contained in the project report titled “Indian Healthy Food and
Beverages,” by “Ashi Malviya,” has been carried out under my supervision and that this work
has not been submitted elsewhere for a degree.
Signature of Supervisor: …………….
Name: Dr. Smitha Pillai, Associate Professor
Department: Commerce
The Bhopal School of Social Sciences
April, 2021

117
ACKNOWLEDGEMENT
I would like to thank our Principal Dr. Fr. John P.J. and Vice Principal Dr. Sr Sonia Kurien
for their immense support and blessings. I thank our HOD Dr. Amit Kumar Nag for his support.
I would like to express my special thanks of gratitude to my research guide Dr. Smitha Pillai,
Associate Professor of Department of Commerce for her valuable suggestions and guidance
and for giving me the golden opportunity to do this wonderful research project on the topic:
INDIAN HEALTHY FOOD AND BEVERAGES, without her help it would have been
difficult for me to have reached this state of completion of my project report. Also, I would
like to thank my parents and friends who helped me a lot in the preparation of this project.
I wish to acknowledge the help of all those who have provided me information, guidance and
other help during my research period.

118
TABLE OF CONTENTS
Chapter I: Introduction of the Topic
1.1 Rationale of the Study
1.2 Introduction to the industry
1.3 Introduction to the company
1.4 Justification of the topic
Chapter 2: Review of Literature
2.1 International Reviews
2.2 National Reviews
Chapter 3 : Research Methodology
3.1 Objectives of the Study
3.2 Research Hypothesis
3.3 Scope of the Study
3.4 Data Collection
3.5 Limitation of the study
Chapter 4 : Data representation & Analysis
4.1 Data representation & Interpretation
4.2 Hypothesis Testing
Chapter 5. Results & Discussion
5.1 Major Findings
5.2 Discussion& Suggestions
5.3 Conclusion
REFERENCES

119
ANNEXURE
Chapter 1
Introduction of the Topic 1.1 Rationale of the study
1.2 Introduction to the industry
1.3 Justification of the topic
CHAPTER 1
INTRODUCTION OF THE TOPIC
1.1 Rationale of the study
I propose to investigate on Indian healthy food and beverages. With delectable flavours and
fragrant spices, Indian cuisine and beverages are certainly popular around the world. In addition

120
to its big variety of rich flavours, a standard Indian diet also boasts of a good sort of nutrients
in a balanced quantity. Indian foods and beverages are enriched with high amounts of protein,
vitamin, mineral, carbohydrate etc. that are important for a healthy diet.
1.2 Introduction to the industry
Indian healthy food and beverages are very important part of our lifestyle. They are very
important for good our good health. Most of Indian food contains all in nutrients that are
required for a healthy diet.
Indian food contains a lot of spices but are good for health if taken in proper amount. Food and
Beverages of this time have different consumption patterns and preferences. Food is a primary
thing that is undergoing significant changes all over the world. Due to a vast luxury lifestyle,
consumers are measuring the growing awareness of food quality in their every meal. These
incidences are increasing because of food-heart-related diseases such as diabetes due to sugar
level and obesity due to fast food. Hereby, the consumers worldwide are showing a keen
interest in preventing their lifestyle rather than a curative approach to food.
Nowadays, people have adapted to better and healthy eating as a way of living a good lifestyle.
This change in the food industry for health is not surprising hereby; the health and wellness
movement is been adapted by companies for consumer’s better health. On the other hand, the
major food companies are proactively tapping into the rapidly growing product categories in
the food market is becoming a pro. The food and beverage sector are at a budding stage in India
and it is very important to poise better growth by combining the understanding of healthy food
in the market.
1.3 Justification of the topicA healthy diet is one that helps maintain or improve overall health. A healthy diet provides the
body with essential nutrition: fluid, macronutrients, micronutrients, and adequate calories.
A healthy diet may contain fruits, vegetables, and whole grains, and includes little to no
processed food and sweetened beverages. The requirements for a healthy diet can be met from
a variety of plant-based and animal-based foods, although a non-animal source of vitamin B12

121
is needed for those following a vegan diet. Various nutrition guides are published by medical
and governmental institutions to educate individuals on what they should be eating to be
healthy. Nutrition facts labels are also mandatory in some countries to allow consumers to
choose between foods based on the components relevant to health.
CHAPTER 2
Review of literature
2.1 International reviews 2.2 National reviews

122
CHAPTER 2
LITERATURE REVIEW
2.1 International reviews
(Patrick J. Skerrett, MA) Healthy eating is one of the simplest ways to be fit and healthy.
According to the study, limiting calorie intake, exercising regularly and not smoking are the
three essential strategies to maintain a healthy weight. The reduction in dietary fats and caused
consumption of carbohydrates more. These carbohydrates are in the form of high processed
grains, which removes fibres, vitamins, healthful fats and minerals from the food and become
the reason for the increase in diseases like type 2 diabetes and more diseases world -wide. An
ideal beverage provides what body needs that is H20 and is very healthy without any additives
or calories.
(Walter C. Willett, MD, DrPH) An unhealthy body weight is the root cause of all the diseases.
If the person’s body mass index is >25 the greater is risk of diseases like hypertension,
cardiovascular diseases, abnormal blood glucose, lipids and blood pressure, diabetes, many
cancers, gallstones, infertility, premature mortality, sleep apnea and complications of
pregnancy. Under the current guidelines, the ideal body mass index is between 18 and 25. And
the best health experience is achieved in this BMI avoiding increase in body weight during
adulthood. One should maintain a healthy body weight by less calorie intake, avoiding sugary
beverages and trans fat and introduce higher amounts of dietary fibre in the diet.

123
(Maria Gabriella Vecchio) According to the study, food intake patterns that most of the Indians
are vegetarians and that food items that are rich in micronutrients that are pulses, other
vegetables, fruits, nuts, oilseeds and animal foods are generally consumed less frequently.
(Claudia Loganes) According to Recommended Daily Allowance (RDA) standards, Poor and
monotonous cereals-based diet may promote inadequate nutrition intakes.
(Hyun-Woo Joung) According to structural equation model study, all hypothesized paths were
statistically significant, it means that the three constructs in the model showed positive
relationships with each other. Results showed that the group of college students are aware of
healthy foods and have positive intentions toward healthy food choices.
(Ngozi M. Eze) In recent years, the scope of public health practice has continued to expand
given the call to action to promote sustainable health and nutrition. According to the study, the
nutritive value and eating practices of consumed foods are becoming increasingly important
areas of research for nutritional counselling professionals across the globe. Adequate and
proper nutrition is an important aspect of a healthy lifestyle. So, it is essential to promote an
awareness of the nutrients contained in Indian foods and beverages in relation to their roles in
body maintenance, growth, reproduction, health, and disease prevention in humans.
(Alexandra Jones, Elizabeth Dunford, Rachel Crossley, Sudhir Raj Thout, Mike Rayner, and
Bruce Neal) Healthiness was assessed using the Australian Health Star Rating (HSR) system
and the World Health Organization’s European Regional Office (WHO Euro) Nutrient Profile
Model. Sales-value-weighted mean healthiness and the proportions of “healthy” products
(using a validated HSR cut-off of ≥3.5, and products meeting WHO Euro criteria as healthy
enough to market to children) were calculated overall, by company and by food category.
Nutrient information for 943 products sold by the 11 largest Indian manufacturers was obtained
from nutrient labels, company websites or directly from the manufacturer. Healthiness was low
overall (mean HSR 1.8 out of 5.0 stars) with a low proportion defined as “healthy” by both
HSR (17%) and also by WHO Euro criteria (8%). There were marked differences in the

124
healthiness of similar products within food categories. Substantial variation between
companies (minimum sales-value-weighted mean HSR 0.5 for Company G, versus maximum
HSR 3.0 for Company F) was a result of differences in the types of products sold and the
nutritional composition of individual products. There are clear opportunities for India’s largest
food companies to improve both the nutritional quality of individual products and to improve
their product mix to include a greater proportion of healthy products.
2.2 National Reviews
(Amritha K) The study shows that, the traditional Indian diet consists of a high intake of plant
foods like vegetables, lentils and fruits, as well as low consumption of meat. When we consume
it in the right way, the ingredients in Indian food and beverages can help improve our health in
many ways. An Indian diet is more of unrefined and fibre-rich carbohydrates. However, the
tropical weather conditions and our body's constitution call for a more energy-rich diet. Studies
says that, the Indian diet can reduce the risk of Alzheimer's disease, which is caused due to the
low consumption of meat and emphasis on vegetables and fruits.
(Allwyn SUNDARRAJ Antony) According to the study, many spices have health benefits, the
nutritional rather than medicinal uses of herbs in foods and dietary supplements. Recently
several targets have been identified for therapeutic / preventive effects of turmeric. Fenugreek
seeds, a rich source of soluble fibre that is used in Indian cuisine reduces blood glucose and
lipids and can be used as a food adjuvant in diabetes. Similarly, garlic, onions, and ginger have
been found to modulate favourably the process of carcinogenesis.

125
(Preetam Sarkar, Lohith Kumar DH, Chanda Dhumal, Shubham Subrot Panigrahia, Ruplal
Choudhary) The study shows that, the concepts of ayurvedic health foods in India and describes
several traditional health foods across various regions of India. In the era of globalization of
the population and international food trading, health-conscious citizens around the globe will
benefit from the wealth of knowledge on traditional Indian and ayurvedic health foods of Indian
origin.
Chapter 3Research Methodology
3.1 Objectives of the Study
3.2 Research Hypothesis
3.3 Scope of the Study
3.4 Data collection
3.5 Limitation of the study

126
CHAPTER 3
RESEARCH METHODOLOGY
3.1 Objectives of the study• To know what people think about Indian healthy food and beverages.
• To know the affordability for Indian Healthy food and beverages worldwide.
• To know the willingness of people to shift towards a healthy lifestyle.
• To know how much people are aware of the availability of healthy food and beverages
in an Indian kitchen.
3.2 Research Hypothesis
Null Hypotheses
HO : There is no significant relationship between consumer perception and Indian
healthy food and beverages
Alternative hypothesis
H1I There is a significant relationship between consumer perception and Indian healthy
food and beverages.
3.3 Scope of study
The number of respondents was 30 as during the coronavirus pandemic, it was difficult
to approach people physically owing to physical mobility constraints. Therefore, in

127
order to collect responses from respondents, an online questionnaire was formulated
and circulated among respondents based in Bhopal.
The time period selected for this survey and circulation of questionnaire was March to
April 2021, during which the country was facing pandemic.
It was circulated to people who follow a healthy lifestyle and consume healthy food
either on a regular basis or occasional and also to the people who don't have a healthy
lifestyle have a knowledge about the market.
Therefore, owing to lack of available resources, the scope of the study is limited in
nature.
3.4 Data Collection
RESEARCH DESIGN
Indian healthy food and beverages
GEOGRAPHICAL AREA
BHOPAL
DURATION OF STUDY
1 Month
SAMPLE SIZE
30 respondents
SAMPLING TECHNIQUE
Random sampling technique
SAMPLE SELECTION:
DATA COLLECTION PROCEDURE: it was collected with the help of a
questionnaire.
DATA COLLECTION INSTRUMENT: Primary Data
3.5 Limitation of the study

128
• Since there is a large food market in India containing many sectors, all of the sectors
could not be covered. The study is conducted only in limited areas.
• Time and money-based restrictions also served as a limitation. This physical mobility constraint could also work as a disadvantage, as people could only be interviewed online through means of videoconferencing.
CHAPTER 4Data representation & Analysis
4.1 Data representation & Interpretation 4.2 Hypothesis testing

129
CHAPTER 4
Data Interpretation & Analysis
4.1 Data representation & Interpretation
• Reviewing the impact of people through representation of data collected through a questionnaire

130

131

132

133

134
4.2 Hypothesis Testing
The two major types of hypotheses are null and alternative. Null hypothesis states that there is
no significant relationship between the two variables being studied and that the results are due
to chance and are not significant in terms of supporting the idea is investigated and is failed to
reject.
Chapter 5
Results & Discussion
5.1 Major Findings
5.2 Discussions & Suggestions
5.3 Conclusion

135
Chapter 5
Result & Discussion
5.1 Major Findings
The research based on a primary survey of 30 people aimed at studying the consumers attitude and
perception towards Indian healthy food and beverages. The findings from the research are:
• Among 30 respondents, 53.3% (16) were females, 43.3% (13) were males and 3.3% (1)
preferred not to say.
• Among 30 respondents, 13.3% (4) were below the age of 0-20 years, 80% (24) were of
age 20- 40 years and rest 6.7% (2) are above the age of 40 years.
• Among 30 respondents, 86.7% (26) were students, 10% (3) were business person and
3.3.% (1) was a homemaker.
• Among 30 respondents, 73.3% (22) agreed, 23.3% (7) were neutral and 3.3% (1) disagreed
that beverages that are made in the Indian kitchen are healthy.
• Among 30 respondents, 73.3% (22) agreed, 23.3% (7) were neutral and 3.3% (1) disagreed
that Indian food is popular worldwide.
• Among 30 respondents, 26.7% (8) agreed, 36.7% (11) were neutral and 36.7% (11)
disagreed to that healthy food items and beverages in Indian market, affordable.
• Among 30 respondents, 50% (15) agreed, 16.7% (5) were neutral and 33.3% (10)
disagreed that there are enough healthy food options available in Indian Market.
• Among 30 respondents, 6.7% (2) agreed, 40% (12) were neutral and 53.3% (16) disagreed
that Indian food items and beverages get enough credit for their health benefits.
• Among 30 respondents, 26.7% (8) agreed, 33.3% (10) were neutral and 40% (12)
disagreed that Indian food and Beverages are advertised in the world market.
• Among 30 respondents, 70% (21) agreed, 23.3% (7) were neutral and remaining 6.7% (2)
disagreed with the statement that Indian kitchen consists of all the nutrients that are
required for a healthy diet.

136
• Among 30 respondents, 86.7% (26) agreed and 13.3% (4) were neutral to the fact that
there is a need to spread more awareness about the healthy food and beverages in the
Indian market.
5.2 Discussion & Suggestions • In India, food habits are strictly associated to symbolic signifiers, cultural peculiarities and
different expressions of social identities. This complex system of interdependent climatic,
geographical as well as traditional variables made India an enormous apparatus of food
production, especially grains, cereals and greens.
• Moreover, Indian cuisine varies from region to region and from season to season,
reflecting the widespread cultural pluralism in this subcontinent, which became a unique
blend of various cuisines across Asia and around the world.
• Food plays a vital role in the growth of a nation, still in economic transition from
underdeveloped country to post-industrialized reality. Food requirements and suggested
dietary intakes, currently recommended by national and inter-national organizations, are
primarily intended for healthy nor-mal growth during the rapid stages of development such
as infancy and childhood, and to meet additional demands during pregnancy and lactation.
• The study taken into consideration by this review are heterogeneous in terms of study
population since urban and rural contexts, low and middle-high income classes and
different age groups are involved. dietary intakes, currently recommended by national and
inter-national organizations, are primarily intended for healthy nor-mal growth during the
rapid stages of development.
• Carbohydrates, indeed, constitutes among 60 and 70 % of Indian population’s total energy
intake. Such a finding represents a countertrend according to general changes in eating
habits on a global scale during the last 30 y, where consumption of carbohydrate-based
products decreased to about 7 %. Such a condition, in contrast to general tendencies,
reflects however a common situation among Indians of Asian origin, whose intake rates
of carbo-hydrates and especially cereals result to be higher than in other ethnic groups
living in this macro-cultural context.
• The consumption, instead, of aliments rich in proteins, such as milk products as well as
flesh foods and fibers contained in green leafy vegetables and fruits, were found to be
negligible. Their absence in Indian diet leads to micronutrient deficiencies, such as

137
vitamins and iron, which are extremely needful in order to grant adequate alimentary
intakes, promoting general wellbeing and health status. Such a nutrition lack may lead to
increase in several diseases in children and early adulthood like greater risk of insulin
resistance.
5.3 ConclusionThe study shows that majority of customers in India are trying to shift towards a healthy lifestyle by changing in their eating habits. Most of the people think that beverages that made in an Indian kitchen are healthy and also think that Indian food is quite popular worldwide. But they are not very affordable in the Indian market .All nutritional studies reported in this project report, carried out indicate that:
i) Indians consume most of the nutrients from their home-made products.ii) most of the subjects (from children to adults) followed a monotonous and
vegetarian diet, based on cerealsiii) dietary consumption and food expenditure vary across geographic areas (rural or
urban) and cultural contextsiv) food intake is almost lower than RDA, and this may lead to nutrient deficit,
which singly or in combination have an important role in making the person (especially child) vulnerable to morbidity and mortality. Strategies and interventions must be therefore proposed to prevent and control micronutrient deficiencies
REFERENCES
Ajzen, I. (1991), “The theory of planned behavior”, Organizational Behavior and Human Decision Processes, Vol. 50, pp. 179-211.
Alexandra Jones Food Policy Division, The George Institute for Global Health, UNSW Sydney, Sydney 2042, Australia
Antil, J.A. (1984), “Socially responsible consumers: profile and implications for public policy”, Journal of Macro marketing, Vol. 5 No. 2, pp. 18-39.
Bibian Amaka Ezeanwu Department of Home Economics and Hospitality Management Education, Faculty of Vocational and Technical Education
Chinwe A. Ayogu Department of Hospitality Management, Institute of Management and Technology, Enugu
Chiedu Eseadi Department of Educational Foundations (Guidance and Counseling Unit) Faculty of Education, University of Nigeria, Nsukka, Enugu State Nigeria.
Department of Food Process Engineering, National Institute of Technology Rourkela, Rourkela, Odisha, India

138
Department of Plant Soil and Agricultural Systems, Southern Illinois University, Carbondale, IL, USA
Elizabeth Dunford Food Policy Division, The George Institute for Global Health, UNSW Sydney, Sydney 2042, Australia
Felicia O. Maduabum Department of Home Economics and Hospitality Management Education, Faculty of Vocational and Technical Education
Ngozi M. Eze Department of Home Economics and Hospitality Management Education, Faculty of Vocational and Technical Education
Ngozi J. Anyaegunam Department of Science Education, University of Nigeria, Nsukka
Nkechi G. Onyeke Department of Home Economics and Hospitality Management Education, Faculty of Vocational and Technical Education
Patrick J. Skerrett Harvard Health Publications, Harvard Medical School
Sudhir Raj Thout the George Institute for Global Health, Hyderabad 500034, India
Walter C. Willett Department of Nutrition, Harvard School of Public Health
https://www.ncbi.nlm.nih.gov/pmc/articles/PMC5691719/
https://www.ncbi.nlm.nih.gov/pmc/articles/PMC3471136/
https://www.researchgate.net/publication/324388697_A_Review-Recent_Advances_in_Nutrition_of_Health_Benefits_and_their_Significance_of_Indian_Spices_in_Foods
ANNEXURE
Name *
Your answer
Gender *
MaleFemaleOthersPrefer not to say

139
Age Group *
Below 20 years20-40 yearsabove 40 years
Occupation *
StudentProfessionalHomemakerBusiness PersonOther
Do you think that Beverages that are made in the Indian kitchen are healthy? *
AgreeDisagreeNeutral
Do you think that the Indian food is popular Worldwide? *
AgreeDisagreeNeutral
According to you, Are the healthy food items and beverages in Indian market, affordable? *
AgreeDisagreeNeutral
Do you think that are there enough healthy food options available in Indian Market? *
AgreeDisagreeNeutral
Do you think that does Indian food items and beverages get enough credit for their health benefits? *
AgreeDisagreeNeutral
Do you think that Indian food and Beverages are advertised in the world market? *
AgreeDisagreeNeutral
Do you believe in the statement that Indian kitchen consists of all the nutrients that are required for a healthy diet? *

140
AgreeDisagreeNeutral
Do you think that is there a need to spread more awareness about the healthy food and beverages in the Indian market? *
AgreeDisagreeNeutral

141

142

143
A STUDY OF IMPACT OF GRADING OF SHARES ON INVESTMENT
Research Project Submitted in Partial Fulfillment of the Requirements for the Degree of
BCOM Honours
by
Ashutosh Agarwal
to the
DEPARTMENT OF COMMERCE
BHOPAL SCHOOL OF SOCIAL SCIENCES
April, 2021
Submitted by Guided by
Ashutosh Agrawal Dr Swapna Pillai
Associate Professor

144
CERTIFICATE
It is certified that the work contained in the project report titled “Grading of share on Bombay
Stock Exchange (BSE) ,” by “Ashutosh Agarwal,” has been carried out under my/our
supervision and that this work has not been submitted elsewhere for a degree*
Signature of Supervisor: …………….
Department: Commerce
Bhopal School of Social Sciences
April, 2021

145
Department of Commerce
DECLARATION
I hereby declare that this project report entitled “Grading of share on Bombay Stock Exchange
(BSE) “ was carried out by me for the degree of BCOM Honours under the guidance and
supervision of Dr. Swapna pillai ,Assistance professor of Department of Commerce, BSSS
College. The interpretations put forth are based on my reading and understanding of the
original texts and they are not published anywhere in any form. The other books, articles and
websites, which I have made use of are acknowledged at the respective place in the text. This
research report is not submitted for any other degree or diploma in any other University.
Place: Bhopal
Name of the Student: Ashutosh Agarwal
Class & Section: B.COM (HONS) 3rd year
Date: 15- April-2021

146
ACKNOWLEDGEMENT
I would like to thank our Principal Dr. Fr. John P.J. and Vice Principal Dr Sr Sonia Kurien for
their immense support and blessings. I thank our HOD Dr Amit Kumar Nag for his support. I
would like to express my special thanks of gratitude to my research guide Dr. Swapna Pillai,
Associate Professor of Department of Commerce for her valuable suggestions and guidance
and for giving me the golden opportunity to do this wonderful research project on the
topic:Grading of share on Bombay stock exchange(BSE), Without her help it would have been
difficult for me to have reached this state of completion of my project report. Also, I would
like to thank my parents and friends who helped me a lot in the preparation of this project.
I wish to acknowledge the help of all those who have provided me information, guidance and
other help during my research period.

147
Chapter I
Introduction of the Topic
Rationale of the Study
The Stock market is a place not necessarily physical where investors indulge in buying and selling of shares with the hopes of making profit. There are different categories of shares based on their fundamental characteristics. Different categories of shares have different trading techniques.
Categories of shares are decided on the basis of their market capitalization , volatility, turnover ratio and growth of the company . BSE and NSE both stock exchanges categorizes their shares on the abovementioned factors. NSE and BSE both categorizes their share under different heads . The Research will study the BSE's unique style of classification of shares and how it help simplify investor decision and manage financial risk.
BSE follows a systematic mechanism of "Grading" of shares. Grades are assigned to each category of share. Grades are allotted at the time of listing of share and change according to the performance of the company. By knowing the grade, the investor get to know about the status of the company and trading technique of that particular share, it also helps the investor to understand the duration for which his amount should be invested. Many rookie investors lack the knowledge of grading of share and many investors who know about grading of shares only have rough idea about it .In- depth knowledge of grading is still inadequate among many investors.
Introduction to the industry
Stock market is place where people use to buy or sell shares of publicly listed companies through their demat account . first of all understand what is share? Shares are units of equity ownership of a company. People who use to buy shares of company are known as share holder of company. There are majorly two exchange for buying and selling of share NSE( national stock exchange ) and BSE(Bombay stock exchange) they both regulate under SEBI ( security and exchange board of India ). To trade in stock market we need to open DEMAT account under stock broker. Stock broker is a professional individual who buys / sells shares on the behalf of its clients. A stock broker is registered as a trading member with stock exchange and holds a stock broking license and operate under guideline prescribed by SEBI.
Introduction to the company
Stock classification is the process of grouping of stock for ease of understanding of investor. In India both BSE and NSE has classifies stocks. More or less classification of stock is similar on both the exchanges.

148
Stock classification was to handle the stock based on trading characteristics of Indian share on stock exchange and these grouping of share is known as grade of share. Mainly there are eight grade of stock namely A,B,T,Z,F,G,X &XT
1. A-Group- Most popular actively traded stocks.2. B-Group- It dosen’t comprise in any of the other group3. T-Group- Securities which are settled under trade –to- trade basis as a surveillance
measure.4. Z-Group- Black listed stock . violated exchange rule 7 regulation or has pending
investors complaints or having any such kind of reasons.5. F-Group- Fixed income securities .6. G-Group- Government securities by retail investors.7. X-Group- Securities that are only listed /traded at BSE and satisfy certain parameter
into separate sub segment come under this group.8. XT-Group- Securities that are only listed /traded at BSE and satisfy certain parameter
into separate sub segment come under this group.
Justification of the topic
By every passing year people are getting more and more interest in share market . Reason behind this is low interest on fixed deposit, digitalization of stock market and increase in literacy rate. Due to lack of technical knowledge investors have to end up by suffering loss. Grading of share is one of the basic thing we have to look for before investing. But unfortunately many of the investor lack the knowledge of grading of share and many investors who know about grading of shares only have rough idea about it.
The purpose of the study is to spread the knowledge about grading of share and to let the investor know how grading of share help investor before investing.

149
Chapter 2
Review of Literature
International Reviews
1. International Stock Market Linkages
In the financial economics sphere, three key questions arise about changes in international stock market linkages: first, what are the implications for the rapid international transmission of national financial disturbances; second, what are the implications of these trends for the efficiency of stock markets in different countries; and third, what are the implications of linkages between stock markets for the international diversification of equity portfolios? The internationalization of equity flows would appear to be accompanied by enhanced information flows, and hence greater market efficiency, while the removal of barriers between markets should lead to a tendency towards the equalization of the price of risk.
2. Stock market development: an analysis from a multilevel and multi-country perspective
(FortiI, Yen-Tsang, & Peixoto, dec 2011) Most studies advocate that the development of a stock market is influenced by a few individual country variables such as the origin of its legal system, enforcement of law, accounting patterns, transparency, corporate ownership structure, and the level of creditor and minority investor protection.
Results showed that more factors may influence the development of stock markets, such as the adaptability of firms and the openness of a country, helping avoid the multicollinearity effects that may have affected earlier studies.
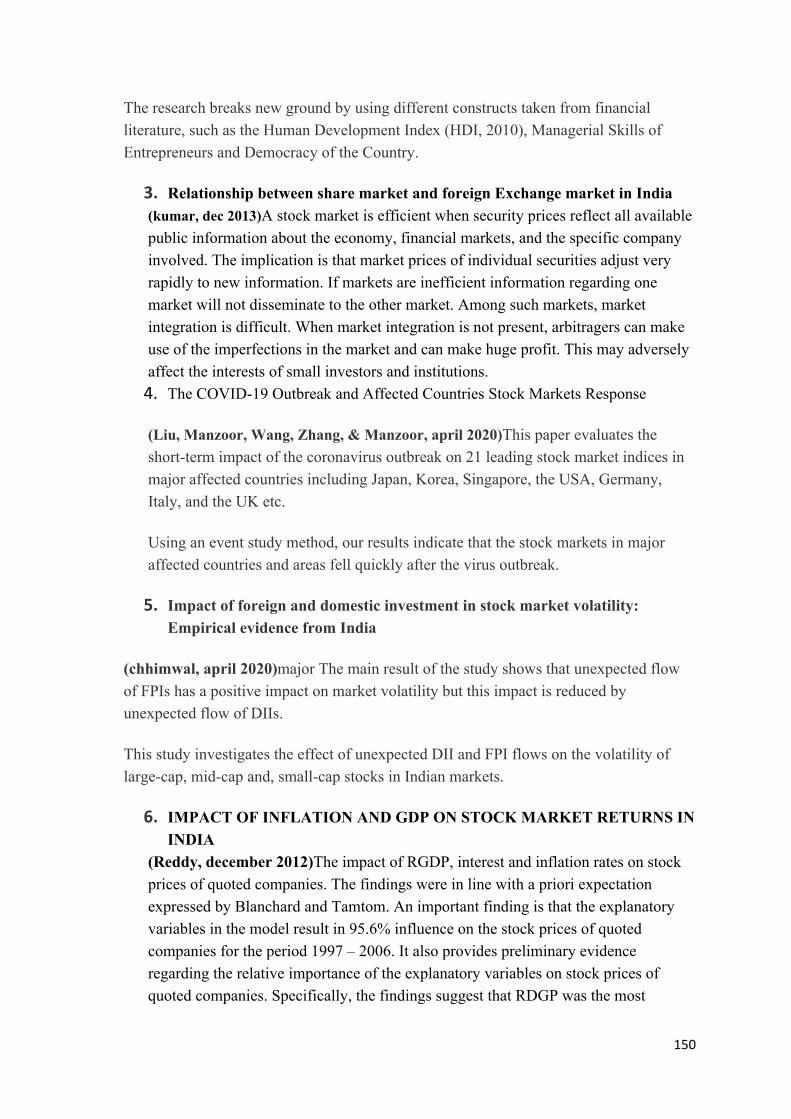
150
The research breaks new ground by using different constructs taken from financial literature, such as the Human Development Index (HDI, 2010), Managerial Skills of Entrepreneurs and Democracy of the Country.
3. Relationship between share market and foreign Exchange market in India(kumar, dec 2013)A stock market is efficient when security prices reflect all available public information about the economy, financial markets, and the specific company involved. The implication is that market prices of individual securities adjust very rapidly to new information. If markets are inefficient information regarding one market will not disseminate to the other market. Among such markets, market integration is difficult. When market integration is not present, arbitragers can make use of the imperfections in the market and can make huge profit. This may adversely affect the interests of small investors and institutions.
4. The COVID-19 Outbreak and Affected Countries Stock Markets Response
(Liu, Manzoor, Wang, Zhang, & Manzoor, april 2020)This paper evaluates the short-term impact of the coronavirus outbreak on 21 leading stock market indices in major affected countries including Japan, Korea, Singapore, the USA, Germany, Italy, and the UK etc.
Using an event study method, our results indicate that the stock markets in major affected countries and areas fell quickly after the virus outbreak.
5. Impact of foreign and domestic investment in stock market volatility: Empirical evidence from India
(chhimwal, april 2020)major The main result of the study shows that unexpected flow of FPIs has a positive impact on market volatility but this impact is reduced by unexpected flow of DIIs.
This study investigates the effect of unexpected DII and FPI flows on the volatility of large-cap, mid-cap and, small-cap stocks in Indian markets.
6. IMPACT OF INFLATION AND GDP ON STOCK MARKET RETURNS IN INDIA
(Reddy, december 2012)The impact of RGDP, interest and inflation rates on stock prices of quoted companies. The findings were in line with a priori expectation expressed by Blanchard and Tamtom. An important finding is that the explanatory variables in the model result in 95.6% influence on the stock prices of quoted companies for the period 1997 – 2006. It also provides preliminary evidence regarding the relative importance of the explanatory variables on stock prices of quoted companies. Specifically, the findings suggest that RDGP was the most

151
important variable influencing stock prices. Conclusively, government should implement policies that will reduce inflation rate and poverty level through infrastructural development and improved standard of living. Also, interest rates should be made moderate in order to encourage investment and transactions in the stock market.
7. Macroeconomic Indicators and their Impact on Stock Market Performance: (Comparative Study between Pakistan and India)
(Haider & Tariq, june 2018)This study examines the performance of different macroeconomic indicators, their fluctuations between stock indexes in Pakistan Stock Exchange (PSX) and Bombay Stock Exchange (BSX) also comparative study between them.
Results help the employees and over the counter investor for understanding about macroeconomic indicators rates and stock market pricing fluctuations effected on economy as well as constructions about stock market performance.
The empirical results indicate that there is a significant pricing relationship between PSX and BSX 100 indexes and the tested macroeconomic variables; have a significant in explaining the stock market fluctuations in various portfolios.
This data is collected on eight specified macroeconomic variables which are: interest rate (IR), inflations (IF), GDP growth, export (EXP), import (IMP), unemployment(UR), (BSX) and (PSX) index.
8. Research on Measure of Noise Trading in Stock Market Based on EGARCH-M Model
(Feng, Lin, & Yan, year 2014)The impact of noise on stock market is one of the main reasons for inefficiency of information, and deviation of stock price. The measure of noise trading is beneficial for judgment of stock value. This paper has authenticated the existence of noise trading in SHSE A-share market through the variance ratio test method. Then the EGARCH-M model of stock price and trading volume has been established, to authenticate the asymmetric effect of the impact of information. On this basis, this paper utilized the fitting result of the model to separate noise trading, and then build the measure indexes of noise risk and noise component. It has broken through the limitations of previous methods for measure of noise trading.
9. THE STUDY OF FACTORS THAT AFFECT INVESTMENT OF INDIVIDUAL IN THE CAPITAL MARKET

152
(Bhosle & Subhash, april 2018)Household sector was the highest contributor to gross saving with a share of 59.25 percent of gross domestic saving out of that 41.47 percent saving is in a financial asset in 2015-16.but out of that saving in financial assets only 6.16% share in the stock market in the form of share and debenture.
There are many factors which affect the individual investors to invest their saving in physical and financial assets other than share and debenture.
10.Aftermarket performance of IPOs
(Hussin, 2005)has studied effect of promoter’s lockup period to participate in the secondary market on IPO under-pricing in the Malaysian stock exchange. The more the proprietors take an interest in the IPO by offering auxiliary offers the lower is the normal undervaluing as proprietors have incentive to value the IPO all the more completely to limit their abundance misfortunes from pointless undervaluing. The positive affiliation between oversubscription proportion and undervaluing supports earlier proof by. A reasonable clarification, is that tremendous financial backer eagerness in the IPO as reflected by the degree in which request overpowers supply produces dissimilarity of convictions concerning the genuine estimation of the organization which brings about a higher introductory return.
National Reviews
1. Stock market volatility- a study of Indian stock market
(yadav, april 2017)The study would facilitate the reader to understand the past, current and future aspects of Indian Stock Market is one of the most versatile sectors in the financial system, and Stock Market plays an important role in economic development .In the current scenario, long term investors are investing in the companies through Stock Market to attain pro .In Stock Market various companies are listed to their business venture through public issues .In other words, Stock Market is a platform for trading various securities and derivatives without any barriers.
2. An Empirical Analysis of Stock Market Performance and Economic Growth: Evidence from India
(Sudharshan Reddy Paramati, 2011)The Engle-Granger residual based co integration test suggests that there is a long-run relationship between the stock market performance and economic growth .The monthly results of Granger causality test suggest that there is a bidirectional relationship between IIP and Stock prices (BSE and NSE) and quarterly results reveal that there is no relationship between GDP and BSE but in the case of NSE and GDP

153
there is a unidirectional relationship and that runs from GDP to NSE .This study aims to investigate whether the stock market performance leads to economic growth or vice versa; study also examines short-run and long-run dynamics of the stock market .Similarly, the results of error correction model reveal that when the long-run equilibrium deviates then the economic growth adjusts to restore equilibrium by rectifying the disequilibrium .We undertake; Unit root (ADF, PP and KPSS) tests, Granger Causality test, Engle-Granger Co integration test and Error Correction Model.
3. A Research on Volatility in the Indian Stock Market with Special Reference to Nifty and Selected Companies Of financial Service Sector of NSE
(M.Pushpalatha, OCTOBER 2019)In recent years the increasing importance of the future market in the Indian markets has received considerable attention from researchers ,academicians and financial analysis .the present study is undertaken with an attempt to determine the share price movements and its volatility of the selected ten companies of financial service sector ,which is in nifty fifty companies list. The period of the study selected between January 2009 and December 2017.for examining the share price movements and its volatility ,the researcher took descriptive statistics and for finding the volatility ,kolmgorovsmirnovtest ,from the results ,among the selected ten financial service companies are not homogenous during the study period, and also examine the run test in Indian stock market is weak form efficient, the non-random behaviour of the market has only short term implications .Finally should take necessary steps to maintain its financial health and increase the market share in India.
4. IPO grading
(Aggarwal, Bhagat, & Rangan, 2009)using a sample of 1655 IPOs examined impact of fundamentals on IPOs over 3 periods – Normal period, the Boom period and the crash period. the data suggest that IPOs with negative earnings are correlated differently with value than IPOs with positive earnings. Income of IPOs with positive earnings is correlated positively with valuations ,whereas income of IPOs with negative earnings is correlated negatively .For expected future cash flows, the researcher found that income of IPO firms is associated with higher valuations and sales are associated with smaller valuations in the boom period as compared to the late 1980s
In an effort to reduce the information asymmetry between the investors and underwriters, The SEBI has had introduced the first of its kind IPO grading system ranging from grade-1 being the company with poor fundamentals to grade-5 companies with strong fundamentals. (Poudyal, 2008)in his research noticed there was a strong significance in IPO grade’s ability to predict the extent of under-pricing. He concluded that securities with high IPO grades were less likely to be under-

154
priced. The research also suggests that there is a positive correlation between IPO grades and retail subscription.
5. The outbreak of COVID-19 pandemic and Its Impact on Stock Market Volatility: Evidence from a worst-affected economy
(bora)Findings reveal that the stock market in India has experienced volatility during the pandemic period .The return of both the stock market reached the bottom line during the first lockdown period, which is from24th March to 6th April .Using daily closing prices of indices such as Nifty and Sensex , this study examines the volatility of these indices over the period 3rd September 2019 to 10th July 2020.Further, the study has attempted to make a comparative analysis of the return of the stock market in pre-COVID-19 and during the COVID19 situation .Due to the disruptions that emerged in the global market; the financial market of India also reacted to the pandemic and witnessed sharp volatility .While comparing the results with that of the pre-COVID-19 period, we find that return on the indices is higher in the pre-COVID-19 period than during COVID-19.Given the COVID-19 situation, this paper empirically investigates the impact of COVID-19 on the Indian stock market .The outbreak of COVID-19 has affected the entire global financial market in an unprecedented way.
6. A Research on Investment Behaviour of Corporate and Individual Investors from Southern India.
(Ashish Dewan, april 2019) Investment Behavior, Corporate Investors, Individual Investors, Southern India, Investors related factors, Market or environment related factor, Investment related factors and Company specific factors .Current study aims to identify the factors affecting investment behavior of the corporate and individual investors, and also to make a comparative study of the investment behavior of both the corporate and individual investors from Southern India .Researcher has identified total four factors which successfully represent the investment behavior of the corporate and individual investors .The study was primarily based on the perception of the investors and the data was collected from 576 investors (304 individual investors and 272 corporate investors) from four major cities of South India namely; Bangalore, Hyderabad, Chennai and Visakhapatnam using questionnaire method .Further, it was found from the comparative analysis of the corporate and individual investors, that there is a significant difference in the investment behavior of the corporate and individual investors from Southern India.
7. The Stock Market and Investment
(silverstoves, july 2006)this paper investigates the relation between equity prices and aggregate investment in major European countries including France, Germany, Italy, the
155
Netherlands and the United Kingdom .Increasing integration of European financial markets is likely to result in even stronger correlation between equity prices in different European countries .This process can also lead to convergence in economic development across European countries if developments in stock markets influence real economic components, such as investment and consumption.
8. A Study on Analysis of Equity Share Price Behaviour of the Selected Industries
(S, B., & R., april 2014)The investors should keenly watch the situations like market price, economy, company progress, returns, and the risk involved in a share before taking decision on a particular share.
A better understanding of the stock market trend will facilitate allocation of financial sources to the most profitable investment opportunity.
9. Comparative Analysis of Indian Stock Market with International Markets
(Mukherjee, april 2007)This study covers New York Stock Exchange (NYSE), Hong Kong Stock exchange (HSE), Tokyo Stock exchange (TSE), Russian Stock exchange (RSE), Korean Stock exchange (KSE) from various sociopolitical -economic backgrounds .In the current context of globalization and the subsequent integration of the global markets this paper captures the trends, similarities and patterns in the activities and movements of the Indian Stock Market in comparison to its international counterparts .Both the Bombay Stock exchange (BSE) and the National Stock Exchange of Indian Limited (NSE) have been used in the study as a part of Indian Stock Market.
10. Analysis of long-run grade wise performance of IPOs with CARS and BHARS
(Selvamathi.R & A.A.Ananth, Dec 2018)In that grade wise IPOs performance are evaluated by Cumulative abnormal returns (CARS) and buy and hold abnormal returns (BHARS) with statistics these are Cumulative Raw Return , Cumulative Market Return , Cumulative Abnormal Return (CAR),Wealth Relative was measured and observed by Poor , Below Average , Average , Above Average , Good , All with minimum and maximum and mean ,t-value ,p-value statistics parameter In that the comparative studies of grade wise IPOs performance was observed from 2010 to 2014 in NSE.

156
Chapter 3
Research Methodology
Objectives of the Study
1. To study the basis of grading of shares.
2. To understand how grading of share affect our investment decision.
3. To understand the technique to trade with these sort of share.
4. To understand purpose behind grading of shares.
5. To identify the risk and profit margin behind different group of shares
Research Hypothesis
A and B grade share witness higher return on investment and less risky investment.
H0 = Grade A and Grade B shares show higher returns than other share grades.
H1 = Grade A and Grade B shares do not show higher returns than other share grades.
Scope of the Study
This project aim to study the basis of grading of share by BSE and how the knowledge of grading of share help investor to invest wisely in shares. Grades are alotted to share on basis of performance of company. Share grades change according to the performance of the company . The researcher has used sample of 30 shares listed in BSE. Current market cap , volume and ratios was acquired from secondary data sources i.e. from money control app to know the financial of company. The researcher has applied descriptive visuals to discover the finding and arrive at the conclusion.
Limitation of the study
The stock under the exchange were listed in Bombay stock exchange , the grouping of share is different under national stock exchange . research methodology is based on descriptive visualisation. Volume and market capital differ in both the exchanges . Sample size is limited due to short coming of time and availability data on sites . Finding the data of low grade share is one of the most problematic task to do . Many times researcher have face question about the existence of share specially in F and G grade share.

157
Chapter 4 : Data representation & Analysis
Data Interpretation
Ratio analysis helps us understand the overall efficiency of the company, its financial health and profitability of company
1. Market capital-Market capitalization is one of the efficient of evaluating the value of the company .to calculate the market capital of the company is simply to multiply the issued and outstanding shares by current selling price of the company.
2. Volume –Volume is the amount of the asset or security that changes hands over some period of time or over the course of day . for example stock trading volume refer to the number of share of security traded between its daily open and close.
3. Interest- Interest on share should never be treated as a profit. Instead interest on share should be treated as a discretionary operating expense , payable only if the society can afford to do so, having taken into accounts the other libalities of the society and the need for reinvestment in society.
4. Dividend- dividend are regular payment of profit made to investor who own company’s stocks. Not all the company pay dividend on their share. Dividend are payment a company makes to share a profit with its investors. They paid dividend on regular basis, and they are one of the ways investors earn a return from investing in stock.
5. EBIT- Earning before interest and taxes(EBIT) is an indicator of company profitability. EBIT can be calculated as revenue minus expenses of company excluding tax and interest. EBIT is also refer as operating earning, operating profit, and profit before interest and taxes.
6. EPS- Earning per share (EPS) is a figure describing a public company’s profit per share of stock, calculated on quarterly or annual basis.EPS is arrived at by taking company’s quarterly or annual net income and dividing by the number of its shares of stock outstanding.
7. Liquidity ratio- Liquidity ratios measure a company’s ability to pay off current debt obligations and its margin of safety through the calculation of metrics including the current ratio, quick ratio, and operating cash flow ratio.
8. Current ratio-Current ratio = current assets / current liabilities

158
A ratio greater than 1 means that company to meet short term payment obligation.
9. Quick ratio-Quick ratio= (cash +receivable +current investment ) + current libalities This may eliminate inventories and other current asset that may not sold immediately to raise cash. The higher the ratio , the better the company is placed to meet short term payments obligations.
10. P/E- PEG ratio = current price /earning per shareThis ratio shows that how much the investors are willing to pay on each rupee of earnings. Companies with strong EPS growth outlook typically trade at high PE multiplies whereas those with unpredictable outlook trade at lower multiples.
11. P/B-PEG ratio= PE ratio / earning growth rateThis ratio show how much premium/ discount investor are willing to pay over share holder equity as per balance sheet companies at higher ROE trade at a premium to book value of shareholder fund whereas those who generate at low or no ROE trade at discount to book value.
12. EV/EBITDA- Peg ratio = PE ratio / Earning growth rateThis is clear metric that the PE ratio since it take into consideration operating performance(true profit potential) and is not influenced by company depreciation policy and capital structure.
13. P/S- Price- to- sale Ratio (P/S) ratio is valuation ratio that compares company’s stock price to its revenue.P/S ratio = market capitalization/ total salesA low ratio could imply that the stock is undervalued, while higher ratio than the average imply that the company is overvalued.
14. Asset Turnover Ratio-
Asset turnover ratio = revenue for the period / average of total asset at beginning and end of the year
A higher number show that the able to generate more revenues for the value of assets on its balance sheet and hence s able to sweat ratio better than the competition.
15. Inventory turn over ratio-
Inventory turnover= (COGS) Cost of good sold / average of inventory a beginning and end of the year

159
a higher number show that the company dosen’t overstock and quickly convert inventory into sale and hence collect cash fast.
DATA REPRSENTATION
RELIANCE INDUSTRIES- A (GRP)

160
( RS. CR.)
MARKET CAPITAL 1,328,882.66VOLUME 317,137INTEREST 4326
DIVIDEND/SHARES(RS) 6.50EBIT 19,233PER SHARE RATIO
BASIC (EPS) 63.49DILLUTED (EPS) 63.49LIQUIDITY RATIOSCURRENT RATIO (X) 0.63QUICK RATIO (X) 0.45VALUTION RATIOSP/E (X) 17.38P/B (X) 1.56EV/ EBITDA (X) 9.53P/S (X) 1.18GROWTH RATIOS3YR CAGR SALES (%) 25.023 YR CAGR NET PROFIT(%) 9.93TURNOVER RATIOASSET TURNOVER (%) 51.18INVENTORY TURNOVER RATIO(X) 8.07
ADANI ENTERPRISE-A

161
( RS. CR.)
MARKET CAPITAL 108,980.18VOLUME 897,824INTEREST 1,572
DIVIDEND/SHARES(RS) 1.0EBIT 2,694PER SHARE RATIO
BASIC (EPS) 10.35DILLUTED (EPS) 10.35LIQUIDITY RATIOSCURRENT RATIO (X) 1.04QUICK RATIO (X) 0.93VALUTION RATIOSP/E (X) 13.29P/B (X) 0.89EV/ EBITDA (X) 8.31P/S (X) 0.35GROWTH RATIOS3YR CAGR SALES (%) 5.913 YR CAGR NET PROFIT(%) --TURNOVER RATIOASSET TURNOVER (%) 92.4INVENTORY TURNOVER RATIO(X) 16.94
INDIABULLS HOUSING FINANCE -A

162
( RS. CR.)
MARKET CAPITAL 9,859.59VOLUME 899,918INTEREST 8,511
DIVIDEND/SHARES(RS) 31.00EBIT 11,072PER SHARE RATIO
BASIC (EPS) 51.70DILLUTED (EPS) 51.69LIQUIDITY RATIOSCURRENT RATIO (X) 2.04QUICK RATIO (X) 2.04VALUTION RATIOSP/E (X) 1.87P/B (X) 0.26EV/ EBITDA (X) 6.41P/S (X) 0.31GROWTH RATIOS3YR CAGR SALES (%) 8.323 YR CAGR NET PROFIT(%) --TURNOVER RATIOASSET TURNOVER (%) 12.84INVENTORY TURNOVER RATIO(X) 0.00
HDFC -A

163
( RS. CR.)
MARKET CAPITAL 457,102.26VOLUME 85,195INTEREST 6,954DIVIDEND/SHARES(RS) 21EBIT 12,005PER SHARE RATIOBASIC (EPS) 124.14DILLUTED (EPS) 123.19LIQUIDITY RATIOSCURRENT RATIO (X) 2.43QUICK RATIO (X) 2.43VALUTION RATIOSP/E (X) 13.16P/B (X) 2.23EV/ EBITDA (X) 13.44P/S (X) 2.78GROWTH RATIOS3YR CAGR SALES (%) 18.563 YR CAGR NET PROFIT(%) 25.56TURNOVER RATIOASSET TURNOVER (%) 13.93INVENTORY TURNOVER RATIO(X) 0.00
IRCTC –A (RECENTLY LISTED)

164
( RS. CR.)
MARKET CAPITAL 29,474.40VOLUME 1,320,265INTEREST 7
DIVIDEND/SHARES(RS) 12.5EBIT 752PER SHARE RATIO
BASIC (EPS) 33.04DILLUTED (EPS) 33.04LIQUIDITY RATIOSCURRENT RATIO (X) 1.60QUICK RATIO (X) 1.59VALUTION RATIOSP/E (X) 29.74P/B (X) 11.84EV/ EBITDA (X) 18.22P/S (X) 6.91GROWTH RATIOS3YR CAGR SALES (%) 14.323 YR CAGR NET PROFIT(%) 35.03TURNOVER RATIOASSET TURNOVER (%) 70.01INVENTORY TURNOVER RATIO(X) 233.07

165
DR. REDDY LAB - A
( RS. CR.)
MARKET CAPITAL 72,711.06VOLUME 665,236INTEREST 98DIVIDEND/SHARES(RS) 25.00EBIT 1,927PER SHARE RATIO
BASIC (EPS) 122.22DILLUTED (EPS) 121.99LIQUIDITY RATIOSCURRENT RATIO (X) 1.75QUICK RATIO (X) 1.26VALUTION RATIOSP/E (X) 25.53P/B (X) 3.32EV/ EBITDA (X) 17.27P/S (X) 2.96GROWTH RATIOS3YR CAGR SALES (%) 7.263 YR CAGR NET PROFIT(%) 16.15TURNOVER RATIOASSET TURNOVER (%) 75.42INVENTORY TURNOVER RATIO(X) 5.00

166
BAJAJ FINANCE-A
( RS. CR.)
MARKET CAPITAL 324,119.68VOLUME 1,849,038INTEREST 9,473
DIVIDEND/SHARES(RS) 10.00EBIT 16,795PER SHARE RATIO
BASIC (EPS) 89.77DILLUTED (EPS) 89.07LIQUIDITY RATIOSCURRENT RATIO (X) 2.87QUICK RATIO (X) 2.87VALUTION RATIOSP/E (X) 24.68P/B (X) 4.11EV/ EBITDA (X) 15.29P/S (X) 5.04GROWTH RATIOS3YR CAGR SALES (%) 38.323 YR CAGR NET PROFIT(%) 42.05TURNOVER RATIOASSET TURNOVER (%) 16.04INVENTORY TURNOVER RATIO(X) 0.00

167
BAJAJ HEALTHCARE - B
( RS. CR.)
MARKET CAPITAL 645.53VOLUME 16,134INTEREST 6
DIVIDEND/SHARES(RS) 0.00EBIT 38PER SHARE RATIO
BASIC (EPS) 16.31DILLUTED (EPS) 16.31LIQUIDITY RATIOSCURRENT RATIO (X) 1.23QUICK RATIO (X) 0.97VALUTION RATIOSP/E (X) 0P/B (X) 2.53EV/ EBITDA (X) 6.88P/S (X) 0.69GROWTH RATIOS3YR CAGR SALES (%) 21.143 YR CAGR NET PROFIT(%) 42.23TURNOVER RATIOASSET TURNOVER (%) 125.86INVENTORY TURNOVER RATIO(X) 10.44

168
ALOK INDUSTRIES – B
( RS. CR.)
MARKET CAPITAL 10,451.83VOLUME 1,460,138INTEREST 113DIVIDEND/SHARES(RS) 0.00EBIT 1,422PER SHARE RATIO
BASIC (EPS) 9.05DILLUTED (EPS) 3.32LIQUIDITY RATIOSCURRENT RATIO (X) 0.76QUICK RATIO (X) 0.54VALUTION RATIOSP/E (X) 0.44P/B (X) -0.07EV/ EBITDA (X) -334.22P/S (X) 0.26GROWTH RATIOS3YR CAGR SALES (%) -27.473 YR CAGR NET PROFIT(%) --TURNOVER RATIOASSET TURNOVER (%) 18.58INVENTORY TURNOVER RATIO(X) 7.92

169
BIRLA TYERS – B
( RS. CR.)
MARKET CAPITAL 356.48VOLUME 27,502INTEREST 151
DIVIDEND/SHARES(RS)EBIT -134PER SHARE RATIO
BASIC (EPS) -20.11DILLUTED (EPS) -20.11LIQUIDITY RATIOSCURRENT RATIO (X) 0.24QUICK RATIO (X) 0.17VALUTION RATIOSP/E (X) -0.15P/B (X) -0.15EV/ EBITDA (X) -9.06P/S (X) 0.09GROWTH RATIOS3YR CAGR SALES (%) 678.433 YR CAGR NET PROFIT(%) 559.37TURNOVER RATIOASSET TURNOVER (%) 28.96INVENTORY TURNOVER RATIO(X) 6.14

170
BHARAT RASAYAN – B
( RS. CR.)
MARKET CAPITAL 4,120.70VOLUME 1,036INTEREST 15
DIVIDEND/SHARES(RS)EBIT 220PER SHARE RATIO
BASIC (EPS) 371.03DILLUTED (EPS) 371.03LIQUIDITY RATIOSCURRENT RATIO (X) 3.38QUICK RATIO (X) 2.33VALUTION RATIOSP/E (X) 13.91P/B (X) 3.92EV/ EBITDA (X) 9.17P/S (X) 1.82GROWTH RATIOS3YR CAGR SALES (%) 25.093 YR CAGR NET PROFIT(%) 42.45TURNOVER RATIOASSET TURNOVER (%) 161.60INVENTORY TURNOVER RATIO(X) 7.58

171
EVEREST INDUSTRIES - B
( RS. CR.)
MARKET CAPITAL 469.32VOLUME 10,738INTEREST 7DIVIDEND/SHARES(RS) 1.00EBIT 27PER SHARE RATIOBASIC (EPS) 8.35DILLUTED (EPS) 8.35LIQUIDITY RATIOSCURRENT RATIO (X) 1.34QUICK RATIO (X) 0.25VALUTION RATIOSP/E (X) 15.85P/B (X) 0.46EV/ EBITDA (X) 5.23P/S (X) 0.16GROWTH RATIOS3YR CAGR SALES (%) 3.483 YR CAGR NET PROFIT(%) 64.81TURNOVER RATIOASSET TURNOVER (%) 151.43INVENTORY TURNOVER RATIO(X) 4.14

172
HINDUSTAN FOODS – B (R.L.)
( RS. CR.)
MARKET CAPITAL 4,443.12VOLUME 1,503INTEREST 10DIVIDEND/SHARES(RS) 0.00EBIT 45PER SHARE RATIOBASIC (EPS) 11.53DILLUTED (EPS) 11.53LIQUIDITY RATIOSCURRENT RATIO (X) 1.28QUICK RATIO (X) 0.73VALUTION RATIOSP/E (X) 48.7P/B (X) 6.40EV/ EBITDA (X) 22.83P/S (X) 1.54GROWTH RATIOS3YR CAGR SALES (%) 817.323 YR CAGR NET PROFIT(%) 183.27TURNOVER RATIOASSET TURNOVER (%) 143.17INVENTORY TURNOVER RATIO(X) 7.03

173
IND BANK – B
( RS. CR.)
MARKET CAPITAL 60.13VOLUME 4,693INTEREST 1
DIVIDEND/SHARES(RS) 0.00EBIT 4PER SHARE RATIO
BASIC (EPS) 0.47DILLUTED (EPS) 0.47LIQUIDITY RATIOSCURRENT RATIO (X) 2.84QUICK RATIO (X) 2.84VALUTION RATIOSP/E (X) 10.53P/B (X) 0.36EV/ EBITDA (X) -2.80P/S (X) 2.51GROWTH RATIOS3YR CAGR SALES (%) -1.583 YR CAGR NET PROFIT(%) --TURNOVER RATIOASSET TURNOVER (%) 11.82INVENTORY TURNOVER RATIO(X) 0.00

174
KHADIM INDUSTRIES - B
( RS. CR.)
MARKET CAPITAL 276.01VOLUME 15,310INTEREST 29DIVIDEND/SHARES(RS) 0.00EBIT -4PER SHARE RATIOBASIC (EPS) -17.37DILLUTED (EPS) -17.37LIQUIDITY RATIOSCURRENT RATIO (X) 1.19QUICK RATIO (X) 0.66VALUTION RATIOSP/E (X) -4.42P/B (X) 0.59EV/ EBITDA (X) 11.19P/S (X) 0.18GROWTH RATIOS3YR CAGR SALES (%) 8.133 YR CAGR NET PROFIT(%) 0.63TURNOVER RATIOASSET TURNOVER (%) 110.50INVENTORY TURNOVER RATIO(X) 4.55
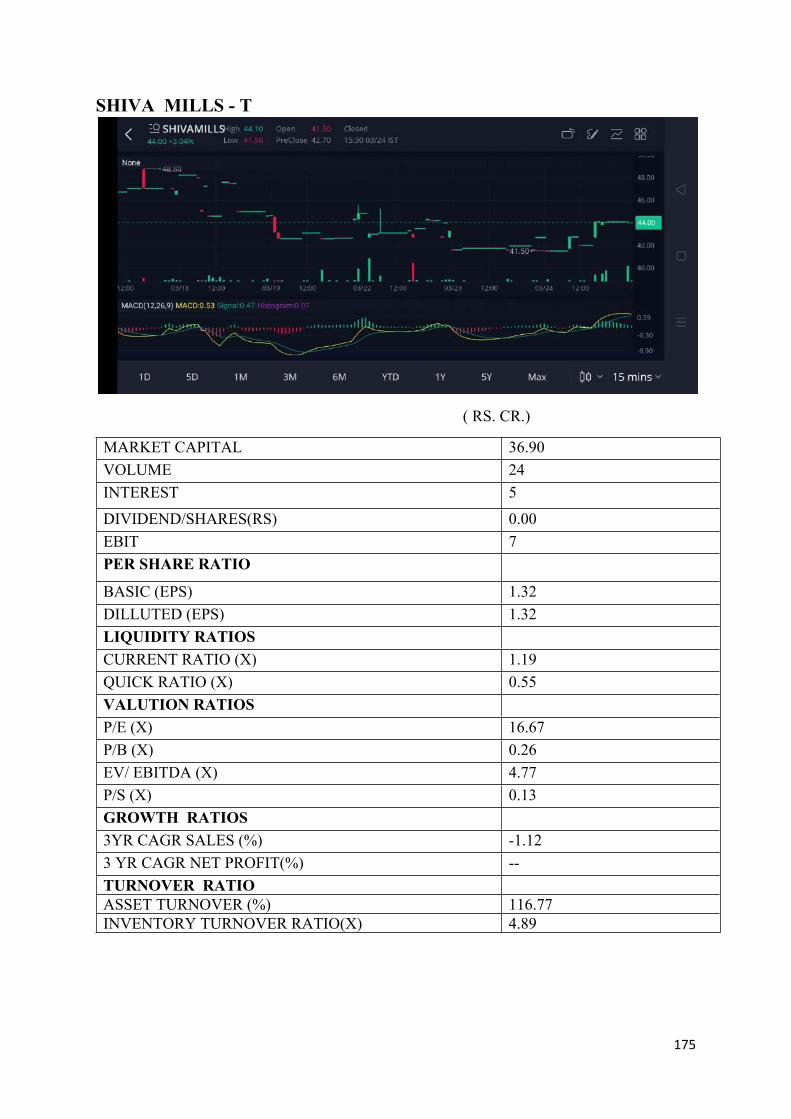
175
SHIVA MILLS - T
( RS. CR.)
MARKET CAPITAL 36.90VOLUME 24INTEREST 5
DIVIDEND/SHARES(RS) 0.00EBIT 7PER SHARE RATIO
BASIC (EPS) 1.32DILLUTED (EPS) 1.32LIQUIDITY RATIOSCURRENT RATIO (X) 1.19QUICK RATIO (X) 0.55VALUTION RATIOSP/E (X) 16.67P/B (X) 0.26EV/ EBITDA (X) 4.77P/S (X) 0.13GROWTH RATIOS3YR CAGR SALES (%) -1.123 YR CAGR NET PROFIT(%) --TURNOVER RATIOASSET TURNOVER (%) 116.77INVENTORY TURNOVER RATIO(X) 4.89

176
TECHINIA NIRM - T
( RS. CR.)
MARKET CAPITAL 4.38VOLUME 290INTEREST 0
DIVIDEND/SHARES(RS) 0EBIT 0PER SHARE RATIO
BASIC (EPS) -2.80DILLUTED (EPS) -2.80LIQUIDITY RATIOSCURRENT RATIO (X) 0.77QUICK RATIO (X) 0.77VALUTION RATIOSP/E (X) -0.71P/B (X) 0.16EV/ EBITDA (X) -182.95P/S (X)GROWTH RATIOS3YR CAGR SALES (%) -1003 YR CAGR NET PROFIT(%) --TURNOVER RATIOASSET TURNOVER (%) 0.00INVENTORY TURNOVER RATIO(X) 0.00

177
TVS ELECTRONIC –T
( RS. CR.)
MARKET CAPITAL 242.73VOLUME 6,822INTEREST 2
DIVIDEND/SHARES(RS) 1.50EBIT 2PER SHARE RATIO
BASIC (EPS) 0.21DILLUTED (EPS) 0.21LIQUIDITY RATIOSCURRENT RATIO (X) 1.21QUICK RATIO (X) 0.87VALUTION RATIOSP/E (X) 252.86P/B (X) 1.23EV/ EBITDA (X) 6.12P/S (X) 0.38GROWTH RATIOS3YR CAGR SALES (%) -53.173 YR CAGR NET PROFIT(%) --TURNOVER RATIOASSET TURNOVER (%) 145.11INVENTORY TURNOVER RATIO(X) 8.44

178
USHA MARTIN EDUCATION & SOLUTION -T
( RS. CR.)
MARKET CAPITAL 10.14VOLUME 2,593INTEREST 0DIVIDEND/SHARES(RS) 0EBIT 0PER SHARE RATIOBASIC (EPS) 0.02DILLUTED (EPS) 0.02LIQUIDITY RATIOSCURRENT RATIO (X) 0.49QUICK RATIO (X) 0.49VALUTION RATIOSP/E (X) 45P/B (X) 0.21EV/ EBITDA (X) 23.15P/S (X) 4.20GROWTH RATIOS3YR CAGR SALES (%) -21.183 YR CAGR NET PROFIT(%) --TURNOVER RATIOASSET TURNOVER (%) 3.83INVENTORY TURNOVER RATIO(X) 0.00

179
URJA GLOBAL LIMITED – T 526987
( RS. CR.)
MARKET CAPITAL 388.38VOLUME 343,076INTEREST 0
DIVIDEND/SHARES(RS) 0.00EBIT 2PER SHARE RATIO
BASIC (EPS) 0.02DILLUTED (EPS) 0.02LIQUIDITY RATIOSCURRENT RATIO (X) 1.09QUICK RATIO (X) 1.06VALUTION RATIOSP/E (X) 48P/B (X) 0.32EV/ EBITDA (X) 19.78P/S (X) 0.30GROWTH RATIOS3YR CAGR SALES (%) 8.423 YR CAGR NET PROFIT(%) 2.5TURNOVER RATIOASSET TURNOVER (%) 33.64INVENTORY TURNOVER RATIO(X) 16.88

180
MOUNT SHIVALIK INDUSTRIES – Z
( RS. CR.)
MARKET CAPITAL 1.40VOLUME 881INTEREST 1
DIVIDEND/SHARES(RS) 0.00EBIT -3PER SHARE RATIO
BASIC (EPS) -7.90DILLUTED (EPS) -7.90LIQUIDITY RATIOSCURRENT RATIO (X) 0.04QUICK RATIO (X) 0.03VALUTION RATIOSP/E (X) 0P/B (X) -0.05EV/ EBITDA (X) -32.28P/S (X) 0.60GROWTH RATIOS3YR CAGR SALES (%) -13.563 YR CAGR NET PROFIT(%) --TURNOVER RATIOASSET TURNOVER (%) 11.09INVENTORY TURNOVER RATIO(X) 5.09

181
ACTION FINANCIAL SERVICES – Z
( RS. CR.)
MARKET CAPITAL 5.70VOLUME 381INTEREST 0
DIVIDEND/SHARES(RS) 0EBIT 0PER SHARE RATIO
BASIC (EPS) 0.08DILLUTED (EPS) 0.08LIQUIDITY RATIOSCURRENT RATIO (X) 2.71QUICK RATIO (X) 0.81VALUTION RATIOSP/E (X) 0P/B (X) 0.44EV/ EBITDA (X) 11.55P/S (X) 2.71GROWTH RATIOS3YR CAGR SALES (%) 7.653 YR CAGR NET PROFIT(%) --TURNOVER RATIOASSET TURNOVER (%) 10.86INVENTORY TURNOVER RATIO(X) 0.21

182
ABIRAMI FINANCIAL SERVICES – Z
( RS. CR.)
MARKET CAPITAL 2.27VOLUME 149INTEREST 0
DIVIDEND/SHARES(RS) 0EBIT 0PER SHARE RATIO
BASIC (EPS) 13.41DILLUTED (EPS) 13.41LIQUIDITY RATIOSCURRENT RATIO (X) 40.92QUICK RATIO (X) 40.92VALUTION RATIOSP/E (X) 0P/B (X) 0.43EV/ EBITDA (X) -3.65P/S (X) 0.00GROWTH RATIOS3YR CAGR SALES (%) -1003 YR CAGR NET PROFIT(%) 38.67TURNOVER RATIOASSET TURNOVER (%) 0INVENTORY TURNOVER RATIO(X) 0

183
ALPS MOTOR FINANCE LTD –Z
( RS. CR.)
MARKET CAPITAL 3.76VOLUME 492INTEREST 0
DIVIDEND/SHARES(RS)EBIT -8PER SHARE RATIO
BASIC (EPS) -0.79DILLUTED (EPS) -0.79LIQUIDITY RATIOSCURRENT RATIO (X) 2.54QUICK RATIO (X) 1.24VALUTION RATIOSP/E (X) 0P/B (X) 1.08EV/ EBITDA (X) -4.13P/S (X) 0.43GROWTH RATIOS3YR CAGR SALES (%) 103.43 YR CAGR NET PROFIT(%) 485.29TURNOVER RATIOASSET TURNOVER (%) 25.56INVENTORY TURNOVER RATIO(X) 0.61

184
ADITIYA BIRLA SUN LIFE MUTUAL -F
DATA NOT AVALIABLE
( RS. CR.)
MARKET CAPITAL
VOLUME
INTEREST
DIVIDEND/SHARES(RS)
EBIT
PER SHARE RATIO
BASIC (EPS)
DILLUTED (EPS)
LIQUIDITY RATIOS
CURRENT RATIO (X)
QUICK RATIO (X)
VALUTION RATIOS
P/E (X)
P/B (X)
EV/ EBITDA (X)
P/S (X)
GROWTH RATIOS
3YR CAGR SALES (%)
3 YR CAGR NET PROFIT(%)
TURNOVER RATIOASSET TURNOVER (%)INVENTORY TURNOVER RATIO(X)

185
ADITYA ISPAT LTD – X
( RS. CR.)
MARKET CAPITAL 2.75VOLUME 102INTEREST 1
DIVIDEND/SHARES(RS) 0EBIT 1PER SHARE RATIO
BASIC (EPS) 0.47DILLUTED (EPS) 0.47LIQUIDITY RATIOSCURRENT RATIO (X) 0.99QUICK RATIO (X) 0.99VALUTION RATIOSP/E (X) 0P/B (X) 0.29EV/ EBITDA (X) 12.14P/S (X) 0.09GROWTH RATIOS3YR CAGR SALES (%) -5.653 YR CAGR NET PROFIT(%) --TURNOVER RATIOASSET TURNOVER (%) 82.10INVENTORY TURNOVER RATIO(X) 7.15

186
GENERIC PHARMA –X
( RS. CR.)
MARKET CAPITAL 250.00VOLUME 94,543INTEREST 0
DIVIDEND/SHARES(RS) 0EBIT 1PER SHARE RATIO
BASIC (EPS) 0.05DILLUTED (EPS) 0.02LIQUIDITY RATIOSCURRENT RATIO (X) 2.17QUICK RATIO (X) 2.17VALUTION RATIOSP/E (X) 0P/B (X) 1.48EV/ EBITDA (X) 21.07P/S (X) 1.70GROWTH RATIOS3YR CAGR SALES (%) 225.153 YR CAGR NET PROFIT(%) 269.63TURNOVER RATIOASSET TURNOVER (%) 66.65INVENTORY TURNOVER RATIO(X) 0.00

187
GAGAN GASES – XT
( RS. CR.)
MARKET CAPITAL 2.71VOLUME 231INTEREST 0
DIVIDEND/SHARES(RS) 0EBIT 0PER SHARE RATIO
BASIC (EPS) 0.11DILLUTED (EPS) 0.11LIQUIDITY RATIOSCURRENT RATIO (X) 12.18QUICK RATIO (X) 10.98VALUTION RATIOSP/E (X) 0P/B (X) 3.01EV/ EBITDA (X) 33.32P/S (X) 2.98GROWTH RATIOS3YR CAGR SALES (%) 29.173 YR CAGR NET PROFIT(%) --TURNOVER RATIOASSET TURNOVER (%) 69.47INVENTORY TURNOVER RATIO(X) 15.02

188
FACOR ALLOYS – XT
( RS. CR.)
MARKET CAPITAL 42.82VOLUME 45,224INTEREST 4
DIVIDEND/SHARES(RS) 0EBIT 27PER SHARE RATIO
BASIC (EPS) 0.59DILLUTED (EPS) 0.59LIQUIDITY RATIOSCURRENT RATIO (X) 0.54QUICK RATIO (X) 0.47VALUTION RATIOSP/E (X) 0P/B (X) 0.13EV/ EBITDA (X) 1.26P/S (X) 0.07GROWTH RATIOS3YR CAGR SALES (%) 29.953 YR CAGR NET PROFIT(%) 105.62TURNOVER RATIOASSET TURNOVER (%) 117.58INVENTORY TURNOVER RATIO(X) 48.23

189
Hypothesis Testing
Group A sharesS.no Company mkt cap (cr) Volume
1RELIANCE INDUSTRIES 1,328,882.66 317,137
2ADANI INTERPRISE 108,980.18 897,824
3INDIABULLS HOUSUING FIN. 9,859.59 899,918
4 HDFC 457,102.26 85,1955 IRCTC 29,474.40 1,320,6256 DR. REDDY LAB 72,711.06 665,2367 BAJAJ FINANCE 324,119.68 1,849,038
AVERAGE 333018.5471 862139
GROUP B SHARES.no Company Mkt cap Volume
1BAJAJ HEALTHCARE 645.53 16,134
2ALOK INDUSTRIES 10,451 1,460,138
3 BIRLA TYERS 356.48 27,502
4BHARAT RASAYAN 4,120.70 1,036
5EVEREST INDUSTRIES 469.32 10,738
6HINDUSTAN FOODS 4,443.12 1,503
7 IND BANK 60.13 4,693
8KHADIM INDUSTRIES 276.01 15,310
AVERAGE 2602.7863 192131.75
GROUP T SHARES.no Company Mkt cap Volume
1TECHINIA NIRM 4.38 290
2TVS ELECTRONIC 242.73 6,822
3 USHA MARTIN 10.14 2,5934 URJA GLOBAL 388.38 343,076
AVERAGE 161.4075 88195.25

190
GROUP Z SHARES.no Company Mkt cap Volume
1 MOUNT SHIVALIK 1.4 8812 ACTION FINANCIAL 5.7 381
3ABIRAMI FINANCIAL 2.27 149
4ALPS MOTOR FINANCE 3.76 492
AVERAGE 3.2825 475.75
GROUP X, XT SHARES.no Company Mkt cap Volume
1GENERIC PHARMA 250 94,543
2ADITYA ISPAT LTD 2.75 102
3 GAGAN GASES 2.71 2314 FACOR ALLOY 42.82 45,224
AVERAGE 74.57 35025
In above tables we have taken average/ mean of market capitalization (cr.) and volume of different group of share. These are the most important to be consider at the time of grading of share. Market capital show size of the company and trading volume show fluctuation in the stock. Higher the market capital is bigger the company and chances of dissolution of company is less. Higher the trading volume is more the fluctuation in their share price and chances of manipulating the share price is less.
From the above tables we have concluded that A and B grade share are most suitable stock for trading purpose because their market capital and trading volume both are high and gives higher return and have less risk on their investment.
Other grade share have both market capital and trading volume low which shows the chances of manipulation in stock and risk on investment is very high in these stocks.

191
Chapter- 5
Results & Discussion
Major Findings
1. BSE has broadly divide share in 8 groups.2. A and B grade share comes under the category of good share.3. T , X and XT come under the category of average share4. We try to avoid invest in Z- group share .5. F- group shares are complicated share and there are few share that under this
category.6. Data of A and B grade are easily available .7. Investor are facing problem while searching for T,X,XT,Z and F group share.8. Different group of shares have different trading technique.9. Many investor and share broker are not having in-depth knowledge of basis of
grading of share.10. Last but not least is that A and B grade share are good for both intraday trading and
holding for short and long term.
Discussions & Suggestions
1. A and B grade share highly profitable and less risky share.2. Intraday is not allowed in T grade share.3. Z grade share are legally challenged share.4. Before investing please watch all basic information of the share.5. Share market is news sensitive market .
Conclusion
BSE has broadly classify stock in 8 groups for the convenience of the investor. It help the investor to know the status of the company and have different trading technique for different group of share. Basic knowledge of share help investor to take wise decision before investing.
A and B group share are most suitable share for any individual for investment purpose . They are highly profitable and less risky share .
Except A and B other group share are highly risky and less profitable . data of these group stock are not easily available.
REFERENCES
https://www.bseindia.com/
https://www.moneycontrol.com/

192
https://www.bseindia.com/markets/equity/EQReports/tra_trading.aspx#:~:text=The%20Securities%20traded%20on%20BSE%20have%20been%20classified%20into%20various%20groups.&text=The%20%22F%22%20Group%20represents%20the,under%20the%20%22G%22%20group.
CITATION REFERENCEAggarwal, R., Bhagat, S., & Rangan, S. (2009). The Impact of Fundamentals. Financial Management • Summer 2009 .Ashish Dewan, R. G. (april 2019). A Research on Investment Behavior of.Bhosle, D. P., & Subhash, &. M. (april 2018). THE STUDY OF FACTORS THAT AFFECT INVESTMENT OF INDIVIDUAL.bora, d. (n.d.). The outbreak of COVID-19 pandemic and Its Impact on Stock Market.chhimwal, b. (april 2020). Impact of foreign and domestic investment in stock market volatility: Empirical evidence from India.Feng, J., Lin, D., & Yan, &. X. (year 2014). Research on Measure of Noise Trading in Stock Market.FortiI, C. A., Yen-Tsang, C., & Peixoto, &. F. (dec 2011). Stock market development: an analysis from a multilevel and multi-country perspective.Haider, Z., & Tariq, &. R. (june 2018). Macroeconomic Indicators and their Impact on Stock.Hussin, W. N. (2005). THE EFFECTS OF OWNERS' PARTICIPATION AND LOCKUP ON IPO UNDERPRICING IN MALAYSIA. Asian Academy of Management Journal, Vol. 10, No. 1, 19–36, January 2005 .kumar, r. (dec 2013). Relationship between share market and.Liu, H., Manzoor, A., Wang, C., Zhang, L., & Manzoor, &. (april 2020). The COVID-19 Outbreak and Affected Countries.M.Pushpalatha, J. S. (OCTOBER 2019). A Research on Volatility in the Indian Stock Market.Mukherjee, D. (april 2007). Comparative Analysis of Indian Stock Market with International Markets.Poudyal, S. (2008). Grading Initial Public Offerings (IPOs) in India’s Capital Markets. IIM(A) Research and Publications .Reddy, D. V. (december 2012). IMPACT OF INFLATION AND GDP ON STOCK MARKET RETURNS IN INDIA.S, M. V., B., M. S., & R., &. M. (april 2014). A Study on Analysis of Equity Share Price.Selvamathi.R, & A.A.Ananth, &. D. (Dec 2018). Analysis of long-run grade wise performanceof IPOs with CARS and.silverstoves, b. (july 2006). The Stock Market and Investment.Sudharshan Reddy Paramati, R. G. (2011). An Empirical Analysis of Stock Market Performance and.yadav, s. (april 2017). stock market volitality-the study of indian stock market.