FINAL REPORT FOR TANZANIA
92
Implemented with Supported by the Agence Française de Développement FINAL REPORT FOR TANZANIA January 2021
-
Upload
khangminh22 -
Category
Documents
-
view
0 -
download
0
Transcript of FINAL REPORT FOR TANZANIA

Implemented with
Supported by the Agence Française de Développement
FINAL REPORT FOR TANZANIA
January 2021

Plastic pollution hotspots: Tanzania 2
Report published in January 2021, results for the year 2018
Dr. Paola Paruta, EAAlexandre Bouchet, EADr. Margherita Pucino, EA Dr. Julien Boucher, EA
Laura Peano, QuantisViolaine Magaud, Quantis
Peter Manyara, IUCNLynn Sorrentino, IUCNDr. Janaka da Sikva, IUCN
Dr. Feng Wang, UNEPRan Xie, UNEP
Dr. Lydia Gaspare KanyairitaPeter Manyara, IUCN Doyi Mazenzele, IUCNCharles Oluchina, IUCN
Martha Perea Palacios, ORO
Implementing lead Methodological support ReviewersTechnical lead
Design
To be cited as:
IUCN-EA-QUANTIS, 2020, National Guidance for plastic pollution hotspotting and shaping action, Country report Tanzania

Plastic pollution hotspots: Tanzania 3
It is with deep gratitude that the IUCN Plastics and Coastal Communities (PlactiCoCo) project leaders wish to thank the various partners from government, private sector and industry, academia and research, civil society and non-governmental organizations that contributed to this work through their participation in workshops and in-country consultations.
This work could not have been accomplished, first and foremost, without the partners and stakeholders who supported the data collection efforts in the country.
Finally, the tremendous technical guidance, cooperation, and support from Feng Wang and Ran Xie of the United Nations Environment Programme (UNEP) was pivotal in the development of the hotspotting methodology guidance.
Above all, the PlastiCoCo team acknowledges the generous support of the Agence Française de Développement (AFD).
IUCN wishes to thank the United Republic of Tanzania, through its National Environment Management Council (NEMC), under the leadership of Dr. Eng. Samuel Mafwenga, the Director General.
We also wish to acknowledge Dr. Lydia Kanyairita, University of Dar es Salaam for her support in coordinating the national data collection exercise.
Thanks also goes to colleagues in the ESARO regional and country teams for their continuous and invaluable support throughout the implementation of the assessment, in particular Charles Oluchina, Tanzania Country Representative, Thomas Sberna, Regional Technical Coordinator, Marine and Coastal Resilience, Luther Bois Anukur, Regional Director, Doyi Mazenzele, Programme Officer, Tanzania Programme, and Eva Msella. In addition, the PlastiCoCo team extends its gratitude to colleagues at IUCN Secretariat.

Plastic pollution hotspots: Tanzania 4
IUCN wishes to acknowledge the following organizations for their contribution and feedback towards validating the findings of the report
during the in-country consultations and workshops:
The Office of Vice President (Department of Environment), National Environment Management Council (NEMC), Tanzania Marine Parks
and Reserves Unit (MPRU), Institute of Marine Sciences, United Nations Environment Programme (UNEP Tanzania), SIDA / Embassy of
Sweden, Embassy of Ireland, University of Dar es Salaam, Sokoine University of Agriculture, University of Dodoma (UDOM), ARENA
Recycling, ECO Act, PREYO, Jane Goodall’s Roots and Shoots, Libe Green Innovation, Nipe Fagio, Seasense, Tanzania Recyclers
Association (TARA), Tanzania Gender Networking Programme (TGNP), The Nature Conservancy (TNC), and World Wide Fund For Nature
(WWF Tanzania).
We appreciate the support of a number of journalists and their respective media houses who spared time to cover and broadcast the
findings of the report through their various platforms, especially, Bonge Africa TV, Daily News Magazine, Habari leo Magazine, ITV, ITV,
Majira Magazine, Radio One FM, The Guardian Magazine.

Plastic pollution hotspots: Tanzania 5
Collection for recycling
Leakage Dar es Salaamis responsible for
71% of the plastic leakage
Per capita leakage
ActionableHotspots
PriorityInterventions
Mismanagedrate
Collection rate
Global view of plastic in Tanzania Hotspots Shaping action from the hotspots
Most critical Polymers
Number of hotspots perwaste management stage
Domestic recycling rate
PET
PP
HDPE
Synthetic Rubber
LDPE
Polyester
PS
PVC
Waste generation
Waste segregation
Waste collection
Leakage while waiting for collection
Waste related behaviors
Waste management infrastructure

Plastic pollution hotspots: Tanzania 6
Provides the objectives of the Guidance, and introduces its associated workflow
and main deliverables.
Provides a detailed assessment of plastic leakage across five distinct yet
complementary hotspots categories and draws clear statements to help shape action.
Provides a preliminary set of possible interventions and instruments in line with
the plastic pollution hotspots results.
Provides additional information including results data tables, hotspot score
assessments and modelling assumptions.

Plastic pollution hotspots: Tanzania 7
Provides an outlook of the leakage assessment at the country level.
Provides a visual analysis and key interpretations across five complementary categories in which hotspots are prioritised based on a plastic leakage assessment.
Formulates clear statements based on the detailed hotspot analysis to help shape action towards plastic leakage abatement.

Plastic pollution hotspots: Tanzania 8
Suggests meaningful actions based on the actionable hotspots drawn from the detailed plastic hotspot analysis.
Provides a list of possible instruments to implement and monitor progress of suggested interventions.

Plastic pollution hotspots: Tanzania 9
Provides data tables with the detailed figures behind the graphs.
Provides an in-depth analysis of the quality scores behind the graphs.

Plastic pollution hotspots: Tanzania 10
Learnings, that complement the key take aways with more details, of information that is not necessarily visible on the graph
Limitations of the study, can be inaccurate data or gap in the modelling
Things we foresee to unlock the limitations. They can serve as guidance for future studies
Methodology and appendices
Sections slides
Results and interpretations
Reference to the methodology (module/tool)
Reference to the appendices
Key take away as the main conclusion of a graph or result in a writen format

Plastic pollution hotspots: Tanzania 11
Hotspots: They refer to the most relevant plastic polymers, applications, industrial sectors, regions or waste management stages causing the leakage of plastics into the environment (including land, air, water and marine environment), as well as associated impacts, through the life cycle of plastic products.
Interventions: They are tangible actions that can be taken to mitigate hotspots and are to be prioritised and designed to address the most influential hotspots in the plastic value chain.
Instruments: They are the ways an intervention may be practically implemented through specific regulatory, financial or informative measures, in light of context factors such as country dynamics and existing measures. As an illustrative example, a country may identify “mismanaged polyethylene bottles” as one of its hotspots. A relevant intervention may be an increase in bottle collection rate. A relevant instrument may be to instate a bottle return deposit scheme.
Properly disposed: Waste fraction that is disposed in a waste management system where no leakage is expected to occur, such as an incineration facility or a sanitary landfill. We define a sanitary landfill as a particular area where large quantities of waste are deliberately disposed in a controlled manner (e.g., waste being covered on a daily basis, as well as the bottom of the landfill designed in a way to prevent waste from leaching out). Landfilling is mainly the result of a formal collection sector.
Improperly disposed: Waste fraction that is disposed in a waste management system where leakage is expected to occur, such as a dumpsite or an unsanitary landfill. A dumpsite is a particular area where large quantities of waste are deliberately disposed in an uncontrolled manner, and can be the result of both the formal and informal sectors. A landfill is considered as unsanitary when waste management quality standards are not met, thus entailing a potential for leakage.
Littering: Incorrect disposal of small, one-off items, such as: throwing a cigarette, dropping a crisp packet, or a drink cup. Most of the time these items end-up on the road or side-ways. They may or may not be collected by municipal street cleaning.
Uncollected: Waste fraction (including littering) that is not collected by the formal sector.
Domestic waste: Waste generated within the country.
For additional definitions, please refer to the publication: United Nations Environment Programme (2020). National guidance for plastic pollution hotspotting and shaping action - Introductionreport. Boucher J.,; M. Zgola, et al. United Nations Environment Programme. Nairobi, Kenya. Definitions of formal and informal sector are taken from: United Nations Framework Convention OnClimate Change - Clean Development Mechanism (UNFCCC-CDM) , 2010, AMS-III.AJ. EB70, Annex 28 - Small-scale Methodology: Recovery and Recycling of Materials from Solid Wastes.
Mismanaged waste: It is defined as the sum of uncollected and improperly disposed waste. It is plastic that is prone to be released to the environment. The mismanaged waste index is the ratio of the mismanaged waste and the total waste. It is abbreviated as MWI and its value given in percentage.
Leakage: it is defined as the plastic released to the to rivers and oceans. The leakage rate is ratio between leakage and total waste generated, and its value is given in percentage.
Release rate: It is defined as the ratio between leakage and total mismanaged waste, and its value is given in percentage.
Macro-plastic: Large plastic waste readily visible and with dimensions larger than 5 mm, typically plastic packaging, plastic infrastructure or fishing nets.
Micro-plastic: Small plastic particulates below 5 mm in size and above 1 mm. Two types of micro-plastics are contaminating the world’s oceans: primary and secondary micro-plastics. In this study, we focus on primary micro-plastics which are are plastics directly released into the environment in the form of small particulates.
Mass balance: Mass balancing is a mathematical process aiming at equalising inputs and outputs of a given material flow across a system boundary. In our case, inputs consist of domestic production and imports while outputs consists of exports, waste generation and increase of stock. A mass balance allows to check data consistency and helps reconcile different datasets when needed.
Formal sector: Waste management activities planned, sponsored, financed, carried out or regulated and/or recognized by the local authorities or their agents, usually through contracts, licenses or concessions
Informal sector: Individuals or a group of individuals who are involved in waste management activities, but are not formally registered or formally responsible for providing waste management services. Newly established formalized organizations of such individuals; for example, cooperatives, social enterprises and programs led by non-governmental organizations (NGOs), can also be considered as the informal sector for the purpose of this methodology.

Plastic pollution hotspots: Tanzania 12
Leaked plastic stems from uncollected and improperly disposed waste.
Note that the rest of the uncollected and improperly disposed plastic may be leaking into other environmental compartments such as “soil”, “air” or “other terrestrial compartment” as defined in the Plastic Leak Project (PLP) guidance.
This information is not required to shape action but could be calculated using the PLP guidance.
• General waste management• Recycling• Wastewater and run-off water
management• Plastic consumption patterns• Population density• Value of the polymer• Size of application• Type of use• Distance to shore and rivers• Hydrological patterns
• Beach clean-up data• Size and shape of applications• Presence of toxic substances in
polymers or additives
By plastic leakage we refer to a quantity of plastic entering rivers and the oceans
By plastic impact we refer to a potential effect the leaked plastic may have on ecosystems and/or human health
# Parameters ruling the leakage quantification in the model
# Parameters ruling qualitative impact assessment
LINK to the PLP guidance

Plastic pollution hotspots: Tanzania 13
1. Mass of macroplastic waste
2. Collection 3. Waste management
4. Leakage to waterways and ocean
Land sources of plastic waste
(including imports and
exports, domestic
production and change
of stock)
Collected
Uncollected
(through the formal
waste collection
system or informal
sector) Properly disposed* Sanitary landfills
* Incineration facilities
Collected for recycling
Leakage
Domestic recycling
Export of waste
Improperly disposed
* Dumpsites
* Unsanitary landfills
Mismanaged
Uncollected

Plastic pollution hotspots: Tanzania 14
Polymer abbreviations Key units
NAME SYMBOL
Kilogram kg
Tonne t
Kilo tonne (or thousand tonne) kt
Mega tonne (or million tonne) Mt
Kilometer km
Square kilometer km2
NAME ABBREVIATION TYPICAL PRODUCTS
Polyethylene Terephthalate PET* bottles, food wrappings
Polypropylene PP hot food containers, sanitary pad liners
Low-density Polyethylene LDPE bags, container lids
High-density Polyethylene HDPE milk containers, shampoo bottles
Polystyrene PS food containers, disposable cups,
Polyvinyl Chloride PVCconstruction pipes, toys, detergent bottles
NAME ABBREVIATION
Mismanaged waste index MWI
Leakage rate LR
Release rate RR
Calculation variables*In this study, PET resins are distinguished from Polyester which includes polyester fibres, polyester films and polyester engineered resins.

Plastic pollution hotspots: Tanzania 15
National guidance for plastic pollution hotspotting and shaping action

Plastic pollution hotspots: Tanzania 16
The guidance allows users to:
1. Generate country-specific plastic waste management datasets
2. Identify plastic leakage and pollution hotspots
3. Prioritise actions
LINK to theguidance

Plastic pollution hotspots: Tanzania 17
The guidance is built upon the backbone of three questions: where to act? (Hotspots), what to do? (Interventions) and how to do it? (Instruments)
A component of the system that directly or indirectly contributes to the magnitude of plastic leakage and/or its impacts.
It can be a component of the system,
a type of product/polymer or a region within the country.
An action that can be taken to mitigate the leakage from a given hotspot or reduce its impacts.
A practical way to implement the intervention and enable progress.
Examples
Single-use plastic bags
Low waste collection rate in rural areas
Implement better eco-design + chemical recycling
Reduce plastic bag use in the country
Increase waste collection
Develop funding mechanism through EPR scheme
Ban on plastic bags / introduce re-usable alternative
Help local waste pickers to create a revenue stream
Interventions
Hotspots
Instruments
Low recycling rate for flexible packaging

Plastic pollution hotspots: Tanzania 18
INVENTORY OF
PLASTIC FLOWS Data collection templates
Wastemodelcanvas
Fisheries
model
canvas
COMTRADE
data extractionRaw data repository
CHARACTERISATION OF
WASTE MANAGEMENT
MODELLINGPOLYMER/APPLICATION/
SECTOR HOTSPOTS
Fisheries
leakage calculation
Polymer
application/
sector MFA &
leakage calculation Polymer/application/sector hotspots prioritization canvas
MFA modelling quality assessment
Project data repository
IDENTIFICATION OF WASTE MANAGEMENT HOTSPOTS
Waste management hotspot canvas
MODELLING REGIONAL
HOTPOTSGIS model Leakage calculation
ASSESSING
IMPACTS
Plastic application impact assessment
ACTIONABLE HOTSPOT
FORMULATIONActionable hotspotsformulation
INTERVENTION
IDENTIFICATIONInterventions selection
Interventions prioritisation
Final intervention and instrument pairing
INSTRUMENTALIGNMENT
Instruments library template
Instruments selection
Instruments prioritisation
Interventions library template
Inventory
of data sources
and data
gaps
Waste data by archetype
GIS modelling quality assessment
Plastic pollution hotspots: Tanzania 19
This report intends to present only the
results of the analysis and not the detailed modelling process.
Additional information on the methodology and modelling
process can be found directly in the modules and tools
associated with the guidance and highlighted by this icon.

Plastic pollution hotspots: Tanzania 20

Plastic pollution hotspots: Tanzania 21

Plastic pollution hotspots: Tanzania 22
[ 2018 ]
Key take-aways
Summary of the results for all plastics in the country
Waste: 319
Domestic: 315
Imported: 4
• 315 thousand tonnes of plastic waste were generated in Tanzania in 2018.
• It is estimated that only 40% of the plastic waste is collected.
• 96% of the plastic waste is mismanaged and can potentially leak to the oceans, rivers and lakes of Tanzania.
• 29 thousand tonnes of plastic leaked to ocean, rivers and lakes in 2018. That is around 9% of the waste generated.
• Because there are no sanitary landfill and incineration facilities, there is no proper disposal of waste in Tanzania.
• 4% of the plastic waste is collected for recycling.
Note: For simplicity, in this figure, we removed a part of the “leakage” from the “improperly disposed” and “uncollected”, so that the values displayed for these two metrics correspond to a post-leakage situation.
Waste Import
Import of products
Import and production of
primary
Export of primary and products
Waste export
Change in stock
Recycling
Improperly disposed
Uncollected
Leakage
• Per capita plastic waste generation is around 5.6 kg/year which is lower than the world average of 29 kg/year.

Plastic pollution hotspots: Tanzania 23
[ 2018 ]
Key take-aways
* The methodology used to calculate micro-plastics leakage is based on the Plastic Leak Project (2019)
More details available in Appendices
TO WATERWAYS AND OCEANS:
276tCosmetics
359 tTextile fibers 1’383 t
Tyre dust
2’018 tMicro-leakage
26’849 tMacro-leakage
• Micro-leakage contributes for 7% of the overall country leakage. This is mainly driven by tyre abrasion during road transportation.
Learnings
Tyre dust due to tyre abrasion from road vehicles is the first cause of primary plastic micro-leakage. Micro-leakage of textile fibres from clothes washing and of microbeads from cosmetic products have similar leakage in absolute terms. This is driven by low wastewater treatment levels (NESR, 2017) that provides little barrier to the release of primary plastic micro-particles in waterways and oceans. Contrary to other countries, Tanzania does not generate any leakage from primary pellets (due to losses during the production and transport process) since the country does not produce any primary plastic.

Plastic pollution hotspots: Tanzania 24
[ 2018 ]
• Open burning of plastic waste in Tanzania poses significant risks for human health (due to the release of noxious chemical substances such as dioxins and particulate matters) and directly contributes to climate change.
Key take-aways
Limitations
Investigate open burning practices and conduct field studies to estimate the amount of mismanaged plastic waste that is burned.Unlocking
limitations
POLLUTION TO THE AIR:
released into the air
as noxious chemical substances through open burning
Total plastic mismanaged
Although we do not have specific data on burning, we suggest a rough estimate of how much plastic could be polluting the air by using the assumptions made in the Breaking the Plastic Wave report (Lau et al, 2020): 60% of uncollected plastic waste and 13 % of plastic waste at dumpsites are burnt on average worldwide. In the case of Tanzania, it would translate into having 42% of the total plastic mismanaged ending up polluting the air through open burning.

Plastic pollution hotspots: Tanzania 25
• Only 0.5% of the 316 kt domestically generated plastic waste is eventually recycled.
Key take-aways
Learnings
Limitations
Unlocking limitations
There is a lack of understanding of the fate of imported waste in Tanzania and on the origin of the exported waste. We also lack data on recycled quantities.
Contact customs authorities to gather insight on origin and fate of import and export of plastic waste.
Contact local recyclers to have data on total recycling.
Waste imported
Waste collected for recycling
Quantities in thousand tonnes
Waste exported
4.0
11.3
5.6
9.7
0.5%
Domestic recycling
of domestic waste generated
Recycling of domestic waste accounts for
• Only 1.6 kt out of the 315 kt of plastic waste generated in Tanzania are recycled domestically.
• According to BACI database (Gaulier, G. et al., 2008) there are 4 kt of plastic import and 9.7 kt of plastic export.

Plastic pollution hotspots: Tanzania 26

Plastic pollution hotspots: Tanzania 27
POLYMERHotspots
APPLICATION
Hotspots
SECTORHotspots
REGIONALHotspots
WASTE MANAGEMENT
Hotspots
WHY is it leaking?
WHAT is leaking?
WHERE is it leaking?
WHY
WHAT
WHAT
WHERE
WHERE
ACTIONABLE
HOTSPOTS
FORMULATION
Plastic pollution hotspots: TanzaniaPlastic pollution hotspots: Tanzania 28
APPLICATION
Hotspots
SECTORHotspots
REGIONALHotspots
WASTE
MANAGEMENTHotspots
POLYMER
Hotspots

Plastic pollution hotspots: Tanzania 29
Key question answered:
Which polymers are most critical in the country regarding plastic leakage?
How to read the polymer hotspot graph?
What are the bar components of the polymer mass balance graph?
Waste Import
Net increase of stock
Waste Export
Export of primary and applications
Recycling
Properly disposed
Uncollected
Improperly disposed
Import of applications
Import andproduction of primary
(th
ou
sa
nd
ton
ne
s/y
ea
r)
OUTPUT
COMPONENT
tho
us
an
dto
nn
es
Polymer
For more details, please read the Methodology
INPUT
COMPONENT
MWI =Mismanaged
Waste
LR =Leakage
Waste
11%
12%
9%
5%
10%
0%
2%
4%
6%
8%
10%
12%
14%
0
20
40
60
80
100
120
140
LDPE PET PP Polyester HDPE
Leak
age
rate
tho
usa
nd
to
nn
es
PP
LDPE
PET
HDPE
Polyester
3 highest leakage contributors in absolute ORrelative value
Highest leakage contributors in absolute AND relative value
4. Assess the quality score of the results3. Select hotspots based on absolute and relative leakage
2. Focus on leakage and leakage rate1. Determine leakage from mismanaged waste
Waste
UncollectedWaste Improperly disposed Leaked
Mismanaged
+
Raw data
Modelling
Reliability
Geographic correlation
Temporal correlation
Granularity
Pe
dig
ree
ma
trix
2.01
2
3
4
5
ScoreCriteria

Plastic pollution hotspots: Tanzania
[ 2018 ]
30
I N P U T
O U T P U T
Uncollected
Improperly disposed
Properly disposed
Export of primary and products
Change in stock
Import of products
Waste Import
Import and production of primary
Waste Export
Recycling
2.7
1
2
3
4
5
Quality Score

Plastic pollution hotspots: Tanzania
[ 2018 ]
31
Uncollected
Domestic waste
Improperly disposed
Leaked
+ Mismanaged
X% | Mismanaged Waste Index (MWI)
X% | Leakage Rate (LR)
2.7
1
2
3
4
5
Quality Score

Plastic pollution hotspots: Tanzania
[ 2018 ]
32
Key take-aways:
3 highest leakage contributors in absolute ORrelative value
Highest leakage contributors in absolute AND relative value
PET
PP
HDPE
Synthetic Rubber
LDPE
Polyester
PS
PVC
Other
• PP is the top leaking polymer by absolute leakage with 7.1 kt of leakage.
• PET is the main hotspot because it has both a high absolute leakage (4.7 kt) and relative leakage (12%).
• HDPE is the third polymer by absolute leakage, with 4.5 kt of leakage.
• LDPE and Synthetic Rubber have the highest relative leakage.
2.7
1
2
3
4
5
Quality Score

Plastic pollution hotspots: Tanzania 33
PP
PP is the top polymer by absolute leakage with 7.1 kt. It is the polymer with the highest waste generation. There is only 1 tonne of PP that is collected for recycling, which corresponds to around 1% of the plastic waste generated. As a consequence, since there is no proper disposal of waste in Tanzania, 99% of PP is mismanaged.
Centralise information from all recyclers on recycling quantities by polymer.
PET
Learnings
Limitations
Unlockinglimitations
Learnings
As we are missing data on recycling, we might be underestimating the quantity of PP that was in 2018 in Tanzania.
PET is the second polymer by absolute leakage with 4.7 kt. As PET is one of the most recycled polymer with 9 kt collected for recycling, most of which is exported, it is less mismanaged than other polymers with a MWI at 78%. However, since PET is mostly used for on-the-go packaging items, it is very likely to be released into waterways and the ocean.
Polyester
Learnings
Polyester has the second most generated plastic waste with 59 kt in 2018. There is no recycling of Polyester, nonetheless, because Polyester is used in textile, automotive and engineering sector, its leakage rate is smaller than other polymers and ”only” 3.4 kt of Polyester leak to ocean and waterways.

Plastic pollution hotspots: Tanzania 34
LDPE
Contrary to what has been found for other countries through the National Guidance, UNEP-IUCN (2020), in Tanzania LDPE is not one of the top three polymers by absolute leakage. This could be explained by the ban on plastic bags that came into effect in 2019. Nonetheless there are still 4.5 kt of plastic leakage due to LDPE, corresponding to 13% of the amount going to waste.
Synthetic Rubber
Learnings
All polymers
• We are unaware of any domestic production of primary plastic in Tanzania.
• The low amount of per-capita plastic waste generated, raises doubts on whether there could be some plastic import that enters Tanzania illegally, without being recorded at customs.
• We are missing data on plastic recycling and only have a partial knowledge of the recycling activities occurring in Tanzania. This might impact the accuracy of mismanaged plastic waste quantities by polymer, and hence final leakage values.
Limitations
Unlocking limitations
Learnings
From 2 kt of synthetic rubber leaked, 1.4 kt are due to micro-plastics from tyre abrasion leaking into waterways and only 0.6 kt come from mismanaged tyres. The micro-leakage from tyre abrasion is the cause of the high leakage rate, which at 13% makes Synthetic Rubber the top polymer by relative leakage.
• Investigate on whether there is any primary plastic production in Tanzania.
• Contact customs authorities to have a better insight on the magnitude of illegal trade.
• Centralise information from all recyclers on recycling quantities by polymer.

Plastic pollution hotspots: TanzaniaPlastic pollution hotspots: Tanzania 35
POLYMERHotspots
APPLICATION
Hotspots
SECTORHotspots
REGIONALHotspots
WASTE
MANAGEMENTHotspots

Plastic pollution hotspots: Tanzania 36
Key question answered:
Which applications are most critical in the country regarding plastic leakage?
How to read the application hotspot graph?
What are the bar components of the application mass balance graph?
Waste Import
Waste Export
Export of applications
Recycling
Properly disposed
Uncollected
Improperly disposed
Import of applications
Production fromprimary
(th
ou
sa
nd
ton
ne
s/y
ea
r)
OUTPUT
COMPONENT
tho
us
an
dto
nn
es
Application
For more details, please read the Methodology
INPUT
COMPONENT
UncollectedWaste Improperly disposed Leaked
MWI =Mismanaged
Waste
LR =Leakage
Waste
Mismanaged
2. Focus on leakage and leakage rate1. Determine leakage from mismanaged waste
+
Waste
11%
12%
9%
5%
10%
0%
2%
4%
6%
8%
10%
12%
14%
0
20
40
60
80
100
120
140
LDPE PET PP Polyester HDPE
Leak
age
rate
tho
usa
nd
to
nn
es
Bags Bottles Boxes Caps and lids
…
Boxes
Bags
Bottles
…
Caps and lids
3 highest leakage contributors in absolute ORrelative value
Highest leakage contributors in absolute AND relative value
4. Assess the quality score of the results3. Select hotspots based on absolute and relative leakage
Raw data
Modelling
Reliability
Geographic correlation
Temporal correlation
Granularity
Pe
dig
ree
ma
trix
2.01
2
3
4
5
ScoreCriteria

Plastic pollution hotspots: Tanzania 37
[ 2018 ]
I N P U T
O U T P U T
Uncollected
Improperly disposed
Properly disposed
Export of applications
Import of products
Waste Import
Production from primary
Waste Export
Recycling
The application analysis covers most of known short-lived products (mainly from the packaging sector), which corresponds to 54% of total plastic waste generated in 2018.
3.3
Quality Score
1
2
3
4
5

Plastic pollution hotspots: Tanzania 38
[ 2018 ]
X% | Mismanaged Waste Index (MWI)
X% | Leakage Rate (LR)
Uncollected
Domestic waste
Improperly disposed
Leaked
+ Mismanaged
3.3
Quality Score
1
2
3
4
5

Plastic pollution hotspots: Tanzania
Key take-aways
[ 2018 ]
3939
• Other bottles, i.e. non-driking bottles, have the highest absolute leakage at 7.7 kt.
• Bags and Lids and caps come next with 4.6 and 2.5 kt of leakage respectively. They both have high leakage rate with 16% of the waste being leaked to the environment.
• Fishing nets have only a small contribution to the country plastic leakage (0.05 kt), but due to gear loss at sea, 20% of the fishing gears in use leak into the environment.
Harmful to marine life
and ecosystems
*The impact assessment uses data from the coastal clean-up report from Ocean Conservancy (2019)
3 highest leakage contributors in absolute ORrelative value
Highest leakage contributors in absolute AND relative value
Bags
Other bottles
Cigarette filters
Drinks bottles
Boxes, cases, crates
Dairy packaging
Baby diapers
Sanitary towels
Fishing nets
Lids and caps
3.3
Quality Score
1
2
3
4
5

Plastic pollution hotspots: Tanzania 40
All packaging applications
For the applications targeted in this study, Tanzania mostly imports virgin plastic or intermediate plastics such as plates, sheets and films of plastic that are then turned into products by local manufacturers. Usually, the lack of insights on local manufacturing and retailing of products makes it very challenging to know precisely the consumption quantities. In the case of Tanzania, for packaging, we assumed that the production of an application is proportional to the relative importance that the application has in trade, and that the total production matches the total production from the packaging sector.
Unlocking limitations
Collect information on consumption quantities by packaging application in Tanzania, either by contacting manufacturers and retailers or by conducting a consumer survey.
Limitations

Plastic pollution hotspots: TanzaniaPlastic pollution hotspots: Tanzania
POLYMERHotspots
APPLICATION
Hotspots
SECTOR
Hotspots
REGIONALHotspots
WASTE
MANAGEMENTHotspots
41

Plastic pollution hotspots: Tanzania 42
Key question answered:
Which sectors are most critical in the country regarding plastic leakage?
How to read the sector hotspot graph?
What are the bar components of the sector mass balance graph?
Waste Export
Recycling
Properly disposed
Uncollected
Improperly disposed
Long-lived products*
Short-lived products**
(th
ou
sa
nd
ton
ne
s/y
ea
r)
OUTPUT
COMPONENT
tho
us
an
dto
nn
es
Sector
For more details, please read the Methodology
INPUT
COMPONENT
MWI =Mismanaged
Waste
LR =Leakage
Waste
2. Focus on leakage and leakage rate1. Determine leakage from mismanaged waste
Waste
11%
12%
9%
5%
10%
0%
2%
4%
6%
8%
10%
12%
14%
0
20
40
60
80
100
120
140
LDPE PET PP Polyester HDPE
Leak
age
rat
e
tho
usa
nd
to
nn
es
Packaging Textile Tourism Fishing …
Net increase of stock
UncollectedWaste Improperly disposed Leaked
Mismanaged
+
* Short-lived products: products that are disposed within the year of study (Life-time < 1 year)** Long-lived products: products that are disposed after the year of study (Life-time > 1 year)
Tourism
Packaging
Textile
…
Fishing
3 highest leakage contributors in absolute ORrelative value
Highest leakage contributors in absolute AND relative value
4. Assess the quality score of the results3. Select hotspots based on absolute and relative leakage
Raw data
Modelling
Reliability
Geographic correlation
Temporal correlation
Granularity
Pe
dig
ree
ma
trix
2.01
2
3
4
5
ScoreCriteria

Plastic pollution hotspots: Tanzania
[ 2018 ]
43
I N P U T
O U T P U T
Uncollected
Improperly disposed
Properly disposed
Export of primary and products
Charge in stock
Short-lived products
Long-lived products
Waste Export
Recycling
1
2
3
4
5
Quality Score
2.3

Plastic pollution hotspots: Tanzania 44
[ 2018 ]
X% | Mismanaged Waste Index (MWI)
X% | Leakage Rate (LR)
Uncollected
Domestic waste
Improperly disposed
Leaked
+ Mismanaged
1
2
3
4
5
Quality Score
2.3

Plastic pollution hotspots: Tanzania
3 highest leakage contributors in absolute ORrelative value
Highest leakage contributors in absolute AND relative value
Key take-aways
45
[ 2018 ]
1
2
3
4
5
Quality Score
Packaging
Textile
Fishing
Medical
Tourism
Agriculture
Electrical & electronics
Automotive-other
• The packaging sector causes 62% of the total country leakage, with 18 kt.
• The automotive-tyres sector contribution of 2 kt of plastic leakage is partly due to tyre-abrasion. Its leakage rate is the third highest, at 13%.
Construction
• Textile is the second sector by absolute leakage with 2.6 kt.
2.3
Automotive-tyres
• The fishing sector has the highest leakage rate, due to loss of fishing gear but also overboard littering of packaging items.

Plastic pollution hotspots: Tanzania 46
Packaging
Packaging is the sector with the highest absolute leakage, higher than all other sectors combined. This is due to various reasons. Firstly, packaging is the sector with the highest plastic consumption and, unlike other sectors, all of the products in the packaging sector are short lived and become waste within the year. Secondly, although most of the plastic collected for recycling in Tanzania comes from the packaging sector, this represents only 7% of the entire plastic packaging production. Thirdly, plastics from packaging sector has one of the highest release rates.
Learning
Textile
Textile is the second sector by absolute leakage, the plastic embedded in textile is not recycled, but the overall relative leakage is smaller because of lower release rate with respect to packaging.
Learning
Medical
Medical waste appears to have high relative leakage and low absolute leakage. The high relative leakage is most likely not accurate, as we do not assume that there is a special treatment of medical waste, as should be the case in most countries, with the majority of the medical waste being incinerated.
Limitation
Unlocking limitations
Gain a better understanding regarding the fate of medical waste in Tanzania.

Plastic pollution hotspots: Tanzania 47
Fishing
The fishing sector has a high relative leakage, but a very low absolute leakage. Leakage from fishing includes: leakage from gear loss at sea, leakage from overboard littering of packaging, and leakage from fishing gear mismanaged on land. Data on the number of fishing gears in use was found in the Fisheries Department frame survey prepared for the BILLFISH-WIO project (2019). Data on the number of fishermen by fishing area (including lakes and territorial waters) are projected from data available in the fisheries report by the Ministry of Agriculture, Livestock and Fisheries (2016).
Learning
Automotive-tyres
We could not include in our analysis a quantification of the number of tyres that are either burnt in factory kilns, or reused through rethreading.
Limitation
Unlocking limitations
Gather information on the amount of tyres being burnt in factory kilns (which would be considered as properly disposed in our study) and investigate whether there are reuse practices through rethreading in Tanzania, which would extend the lifetime of tyres.
The Automotive-tyres sector is the third highest contributor to the total country leakage, with 2 kt of Synthetic Rubber leaking into lakes, rivers and the ocean in 2018. It encompasses both the mismanaged waste (discarded tyres) and tyre dust due to tyre abrasion from road vehicles. The high leakage rate (13%) is explained by the direct contribution of micro-leakage from tyre dust to the total leakage.
Learning

Plastic pollution hotspots: TanzaniaPlastic pollution hotspots: Tanzania 48
POLYMERHotspots
APPLICATION
Hotspots
SECTORHotspots
REGIONAL
Hotspots
WASTE
MANAGEMENTHotspots
Plastic pollution hotspots: Tanzania 49
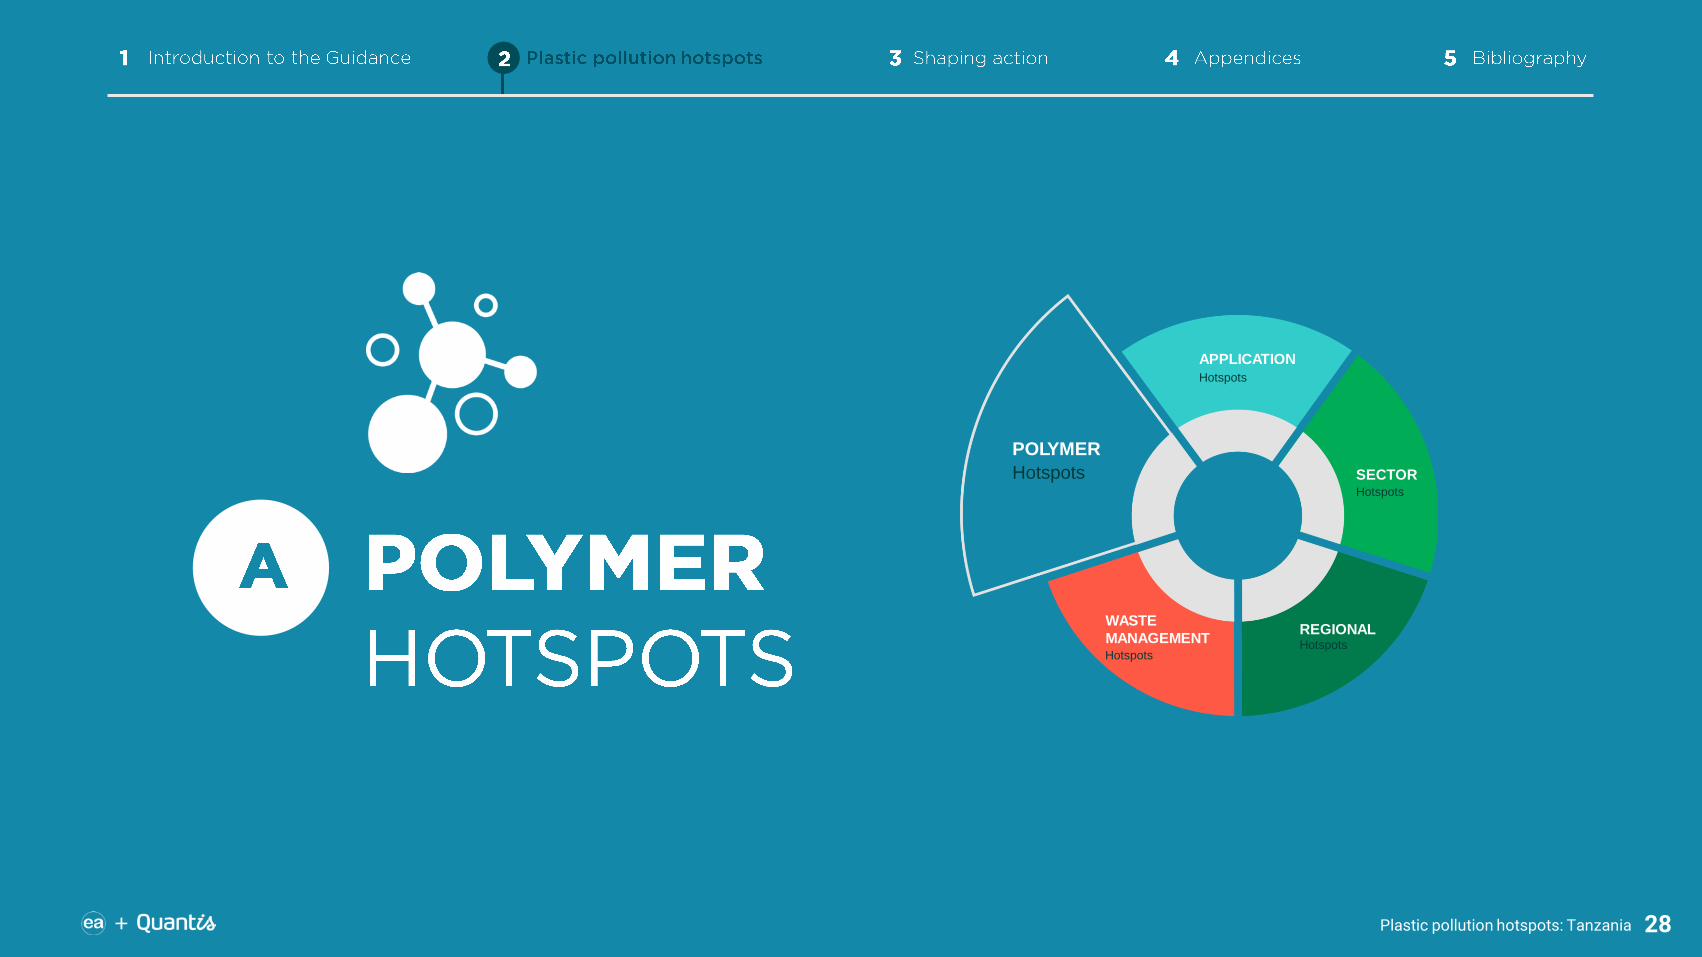
Key question answered:
Which areas are most critical in the country regarding plastic leakage?
Waste Generation (tonnes)
Waste Collection Rate (%)
Mismanaged Waste Index (%)
2) … and using geographic, hydrographic and demographic information…
3) … allows to compute a leakage map and identify regional hotspots
Plastic leakage (tonnes)
1) Overlaying different information available at
city / district / sub-district level and/of
modelled through archetypes…

Plastic pollution hotspots: Tanzania
[ 2018 ]
50
Key take-aways
• Plastic waste generation is concentrated around Dar es Salaam, where the per capita plastic waste generation nears 30 kg/cap/year.
Unlocking limitations
Limitations
We assume all cities to have the same per capita plastic waste generation pattern, except for some cities for which more granular data was available. Similarly, all rural areas have the same plastic waste generation pattern, although assumed very low compared to cities. No distinction was made between touristic and non-touristic areas.
• Conduct waste generation characterisation studies at household level in additional cities and rural areas.
• Identify touristic hubs in the country and carry out surveys to better understand plastic consumption patterns of tourists.More details
available in Appendices
• The average per capita plastic waste generation is 5.7 kg/cap/year.

Plastic pollution hotspots: Tanzania
[ 2018 ]
51
Key take-aways
Unlockinglimitations
The collection rate in urban areas ranges from 15% up to 58% in the Temeke district of Dar es Salaam.
• The average collection rate in Tanzania is 40%.
Learnings
Limitations
The collection rate was only known some cities. For other urban areas we have set an average collection rate of 15% (Nyampundu, 2020). For rural areas, we assumed that the collection rate was 0%.
Improve data granularity of waste collection rates across the country.
More details available in Appendices
• Collection of waste varies greatly around the country, with the highest rate in Dar Es Salaam (58%) and the lowest in rural areas where there is no organised waste collection.

Plastic pollution hotspots: Tanzania
[ 2018 ]
52
Key take-aways
• MWI is 100% everywhere except for Dar Es Salaam where a small share (less than 5%) of the plastic waste is recycled.
More details available in Appendices
Unlocking limitations
Limitations
We assumed collection of plastic for recycling to be limited to Dar es Salaam and its surroundings. However, the lack of data on recycling might lead to an overestimate of mismanaged plastic waste in areas where recycling occurs and that are currently not taken into account.
Contact recycling companies and centralise data on recycling quantities as well as the origin of recyclable waste.
Learnings
The only plastic waste that is not mismanaged in Tanzania is the waste collected for recycling.

Plastic pollution hotspots: Tanzania
[ 2018 ]
53
Leakage pathways to lakes as well as fishing activities occuring on lakes were taken into account in our model.
Key take-aways
Learnings
More details available in Appendices
• Annual leakage from mismanaged waste: 26’785 tonnes
• Annual leakage from mismanaged/lost at sea fishing gears and from overboard littering: 69 tonnes
• 71% of plastic leakage stems from Dar es Salaam districts (i.e. Kinondoni, Ilala and Temeke)
Leakage from fisheries (tonnes)
Territorial waters: 52.5
Lake Victoria: 12.3
Lake Tanganyika: 3.5
Lake Nyasa: 0.6
Other lakes: 0.2
Unlocking limitations
Limitations
As previously mentioned, we assigned a very low plastic waste generation per capita in rural areas, which in turn results in having a lower contribution to leakage from these areas. We are possibly missing some illlegal trade of plastics at borders that artificially lowers the total plastic waste generated.
Contact customs authorities to have a better insight on the magnitude of illegal trade.

Plastic pollution hotspots: TanzaniaPlastic pollution hotspots: Tanzania
POLYMERHotspots
APPLICATION
Hotspots
SECTORHotspots
REGIONALHotspots
WASTE
MANAGEMENT
Hotspots
54

Plastic pollution hotspots: Tanzania 55
Key question answered:
Which waste management stages are most critical in the country regarding plastic leakage?
1) We decided for each element* of the waste management system if its contribution to leakage mitigation is positive (coolspot), neutral or negative (hotspot)
2) Understand at a glance the status of the waste management system in the country with this dashboard
*For detailed element descriptions and methodology, refer to tool T4.1

Plastic pollution hotspots: Tanzania
Key take-aways
56
Negative contribution to the leakage
Neutral contribution
Not assessed
Positive contribution
For more details and justifications, check tool T4.1
SO
UR
CE
CO
LL
EC
TIO
NE
ND
-OF
-LIF
E
* Average plastic waste generation per capita values are derived from the What a Waste 2.0 database (Kaza et al., 2018)
• Plastic waste per capita generation (6 kg/cap/year) is below the average in Africa (14 kg/cap/year), which is a positive factor.
• Waste collection rate (40%) is below the 48% average in low-middle income countries.
• Value of recycled plastics for waste pickers seems higher than in some other African countries.
• Due to the absence of sanitary landfills and incinerators, there is no proper disposal of waste in Tanzania.
• Burning of waste is a widespread practice in Tanzania.
• Plastic recycling is not well understood and could not be properly assessed.

Plastic pollution hotspots: Tanzania 57
Waste Collector
Waste Picker
Buy-back center
Transfer Station Truck
Unsanitary landfill and dumpsite
(sorting and aggregationof recyclable waste)
House
Fo
rma
l wa
ste
ma
na
ge
me
nt
Info
rma
l co
llec
tio
n a
nd
re
cyc
ling
Incineration and sanitary landfill
Formal recycling
Informal recycling

Plastic pollution hotspots: Tanzania 58

Plastic pollution hotspots: Tanzania
3 highest leakage contributorsin absolute OR relative value
Highest leakage contributors in absolute AND relative value
59
Polymer Application Sector Waste managementRegional
Negative contribution to the leakage
Neutral contribution
Positive contribution
Not assessed
Packaging
Textile
Fishing
Medical
Tourism
Agriculture
Electrical & electronics
Automotive-other
Construction
Automotive-tyres
PET
PP
HDPE
Synthetic Rubber
LDPE
Polyester
PS
PVC
Other
Bags
Other bottles
Cigarette filters
Drinks bottles
Boxes, cases, crates
Dairy packaging
Baby diapers
Fishing nets
Lids and caps

Plastic pollution hotspots: Tanzania
[ # ] [ A C T I O N A B L E H O T S P O T ] [ / ]
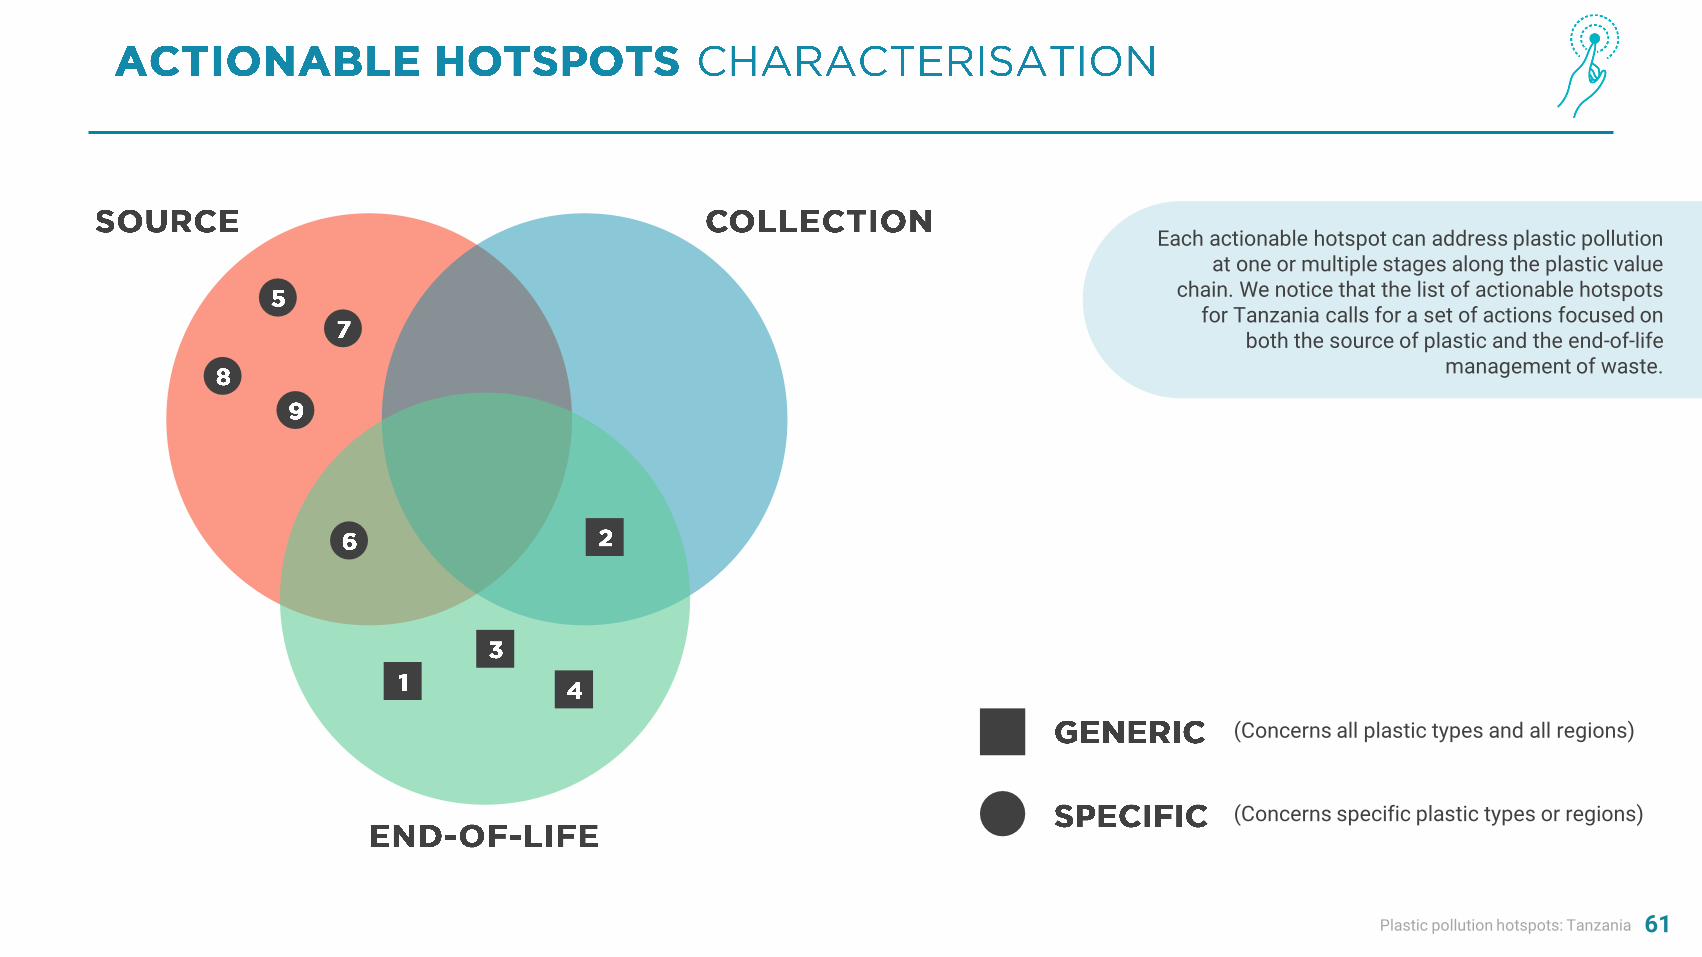
1Plastic waste leaks in Tanzania because there is no proper disposal of waste in either sanitary landfills or incineration facilities, hence all collected waste that is not recycled accumulates in dumpsites.
2 Low collection rates across the country reduce the amount of waste available to recyclers and increase leakage.
3 The widespread practice of open burning reduces the amount of potentially recyclable plastic waste.
4 Dumping and littering practices reduce the amount of waste collected for recycling.
5 Plastic is leaking from cities due to a much higher plastic consumption than in rural areas, especially from Dar es Salaam.
6Plastic products made of PP, PET and HDPE are leaking in Tanzania due to high consumption in the packaging sector and higher chances of leaking into waterways and the Ocean.
7 Plastic products in the packaging sector leak in Tanzania due to a higher consumption and a shorter lifetime than in other sectors.
8 Tyres made of synthetic rubber contribute to most of micro-leakage due to tyre abrasion while driving road vehicles.
9The fishing sector has a very high relative leakage due to the extensive use of longlines in territorial waters, which have a high loss rate at sea.
60
(Concerns all plastic types and all regions) (Concerns specific plastic types and all regions)
Plastic pollution hotspots: Tanzania 61
(Concerns all plastic types and all regions)
(Concerns specific plastic types or regions)
Each actionable hotspot can address plastic pollution at one or multiple stages along the plastic value
chain. We notice that the list of actionable hotspots for Tanzania calls for a set of actions focused on
both the source of plastic and the end-of-life management of waste.

Plastic pollution hotspots: Tanzania 62

Plastic pollution hotspots: Tanzania 63

Plastic pollution hotspots: Tanzania 64
Actionable hotspots (AH)
AH 1
AH 2
AH 3
…
AH x
Interventions (I)Leakage mitigation
potential*Unintended
consequences**
I1
I2 medium medium
I3 high low
I4
I5
…
I79 medium high
I80
I81
I82 high medium
I83
* Leakage mitigation potential: high mitigation potential actions are those that contribute to meaningful reductions of plastic leakage and impacts.** Unintended consequences: highly consequential actions are those most likely to generate unintended environmental or socio-economic trade-offs (e.g., substitution from plastic to another material may generate additional environmental impacts such as GHG emissions).
STEP 1: choose up to 3 interventions for each actionable hotspot
STEP 2: assess criteria levels for each chosen intervention
STEP 3: visualise priority interventions in the top right corner of the chart
Intervention 79
Intervention 82
Intervention
2
Intervention X
Intervention 3
Priority InterventionsMitigation Potential*
Unintended Consequences**
HIGHPlasticleakage
mitigation
MEDIUMPlasticleakage
mitigation
LOWPlasticleakage
mitigation
HIGH
with acute environmental and
socio-economic
trade-off
MEDIUM
with potential environmental and
socio-economic
trade-off
LOW
with no
environmental and socio-economic
trade-off

Plastic pollution hotspots: Tanzania 65
Unlock button
Points are randomly distributed within the designated box to avoid overlapping. Each box on this 9 facets grid corresponds to a couple low/low or low/medium or low/high, etc. Only the facet in which the point falls into should be accounted for, not its relative position to points nearby.
Learning
Limitations
The list of interventions results from the hotspot analysis ; it is currently based on the authors perception. A final version of the interventions should be elaborated through a multi-stakeholder consultation process.
Set up a workshop for a multi-stakeholder process and repeat the interventions selection procedure.
I14
I19
I20
I29
I43
I55
I59
I68
I71I75
0
1
2
3
0 1 2 3
LOW
< -
Leak
age
mit
igat
ion
po
ten
tial
-> H
IGH
HIGH <- Unintended consequences -> LOW
Prioritisation of interventions
I14: Reduce littering in urban areas
I19: Reduce demand for, and use of, single-use,especially on-the-go, plastics
I20: Reduce tyre abrasion
I29: Avoid producing / importing plastic objects thatdo not benefit from a recycling solution in the country
I43: Reduce open burning of plastic waste
I55: Ensure recuperation of used fishing gears
I59: Ensure plastic waste has enough value to covercollection costs (for all polymers)
I68: Install system to collect road run-off watercontaminated with tyre particles
I71: Increase capacity for proper waste disposal(sanitary landfills if other upstream solutions cannotbe applied)

Plastic pollution hotspots: Tanzania 66
Interventions may occur at any point along the value chain.
We categorise them into six types of approaches along the valuechain.

Plastic pollution hotspots: Tanzania 67
[ INTERVENTION CLASS ] [ P R I O R I T Y I N T E R V E N T I O N ] [ CODE ]
SUSTAINABLE CONSUMPTION AND LIFESTYLES
Reduce littering in urban areas I14
Reduce demand for, and use of, single-use, especially on-the-go, plastics I19
WASTE COLLECTION SYSTEMS
Reduce open burning of plastic waste I43
Ensure recuperation of used fishing gears I55
Ensure plastic waste has a enough value to cover collection costs (for all polymers) I59
WASTE INFRASTRUCTURE
Increase capacity for proper waste disposal (sanitary landfills if other upstream solutions cannot be applied)
I71

Plastic pollution hotspots: Tanzania 68

Plastic pollution hotspots: Tanzania 69
Intervention (I)
I2
I3
…
I79
I82
Instruments (J) Feasability* Synergies**
J1
J2 medium medium
J3 high high
J4
J5
…
J79 medium low
J80
J81
J82 high medium
J83
* Feasability: technical and socio-economic assessment of each instrument should be performed. We do not assert a method to perform the assessment as this is beyond the scope of the Guidance. The user can decide on the method to use based on resources available. A by default qualitative assessment with three levels is suggested.
** Synergies: Some instruments may be beneficial to multiple interventions, thus creating a positive synergetic effect. This criterion does not only evaluate the number of suggested interventions benefitting from an instrument, but also assess if the proposed instrument harmonises well with instruments already in place.
STEP 1: choose up to 3 instruments for each intervention selected in S2
STEP 2: assess criteria levels for each chosen instrument
STEP 3: visualise priority instruments in the top right corner of the chart
Instrument79
Instrument82
Instrument
2
InstrumentX
Instrument3
Priority instrumentsSynergies**
Feasability*
HIGHMany interventions
are positively affectedby the instruments
and the latterharmonises well with
pre-existinginstruments
MEDIUMMany interventions
are positively affected by the
instrument
LOWOnly few
interventions are positively affected by the instrument
LOW MEDIUM HIGH

Plastic pollution hotspots: Tanzania 70
Knowledgecreation
Database
Mapping
Expertise
Businesses
Citizens
Waste sector
Partnership
Structuration
R&D
Social
Technology fisheries
Technology microplastics
Technology waste
Incentive
Informal sector
Investment
New business models
Tax
Ban
Extended producer responsability (EPR)
Enforcement
Industry regulation
Municipality regulation
Trade regulation
Waste sector regulation
Standardisation
Monitoring
Awareness raising
INSTRUMENTS
Capacity building
Economic
Innovation
Policy / Regulatory

Plastic pollution hotspots: Tanzania 71

Plastic pollution hotspots: Tanzania 72
Data on recycling in Tanzania is lacking. Two
sources of data are available:
• One provided by a local expert based on
data from three recyclers with a recycling
quantities by polymer [1.5 kt domestic
recycling]
• The other from NESR (2017) which
provides higher total value without
specification by polymer [51 kt collected
for recycling, incl. nylon]
We chose the first data source, because NESR
(2017) is missing granularity by polymer and
because there is a lack of insight on the fate of
the plastic collected for recycling.
If we were to use the value from NESR (2017)
instead, we would obtain an alternative
scenario where the domestic recycling rate
increases to 13% and the MWI drops to 84%.
Eventually, plastic leakage would decrease
going from 29 kt to 25 kt, but the order of
magnitude for leakage would remain the
same.
Report analysis Alternative scenario
Collection for recycling
Leakage Per capita leakage
Mismanagedrate
Collection rate
Domestic recycling rate
Collection for recycling
Leakage Per capita leakage
Mismanagedrate
Collection rate
Domestic recycling rate
Plastic pollution hotspots: Tanzania 73

Plastic pollution hotspots: Tanzania 74
▪ Waste = Collected + Uncollected
▪ Collected = Domestic recycling of collected + Export of collected + Properly disposed + Improperly disposed
▪ Mismanaged = Improperly disposed + Uncollected

Plastic pollution hotspots: Tanzania 75Per capita values are calculated by dividing total values by the 2020 population forecasted by NASA in 2015.

Plastic pollution hotspots: Tanzania 76
Plastic pollution hotspots: Tanzania 77
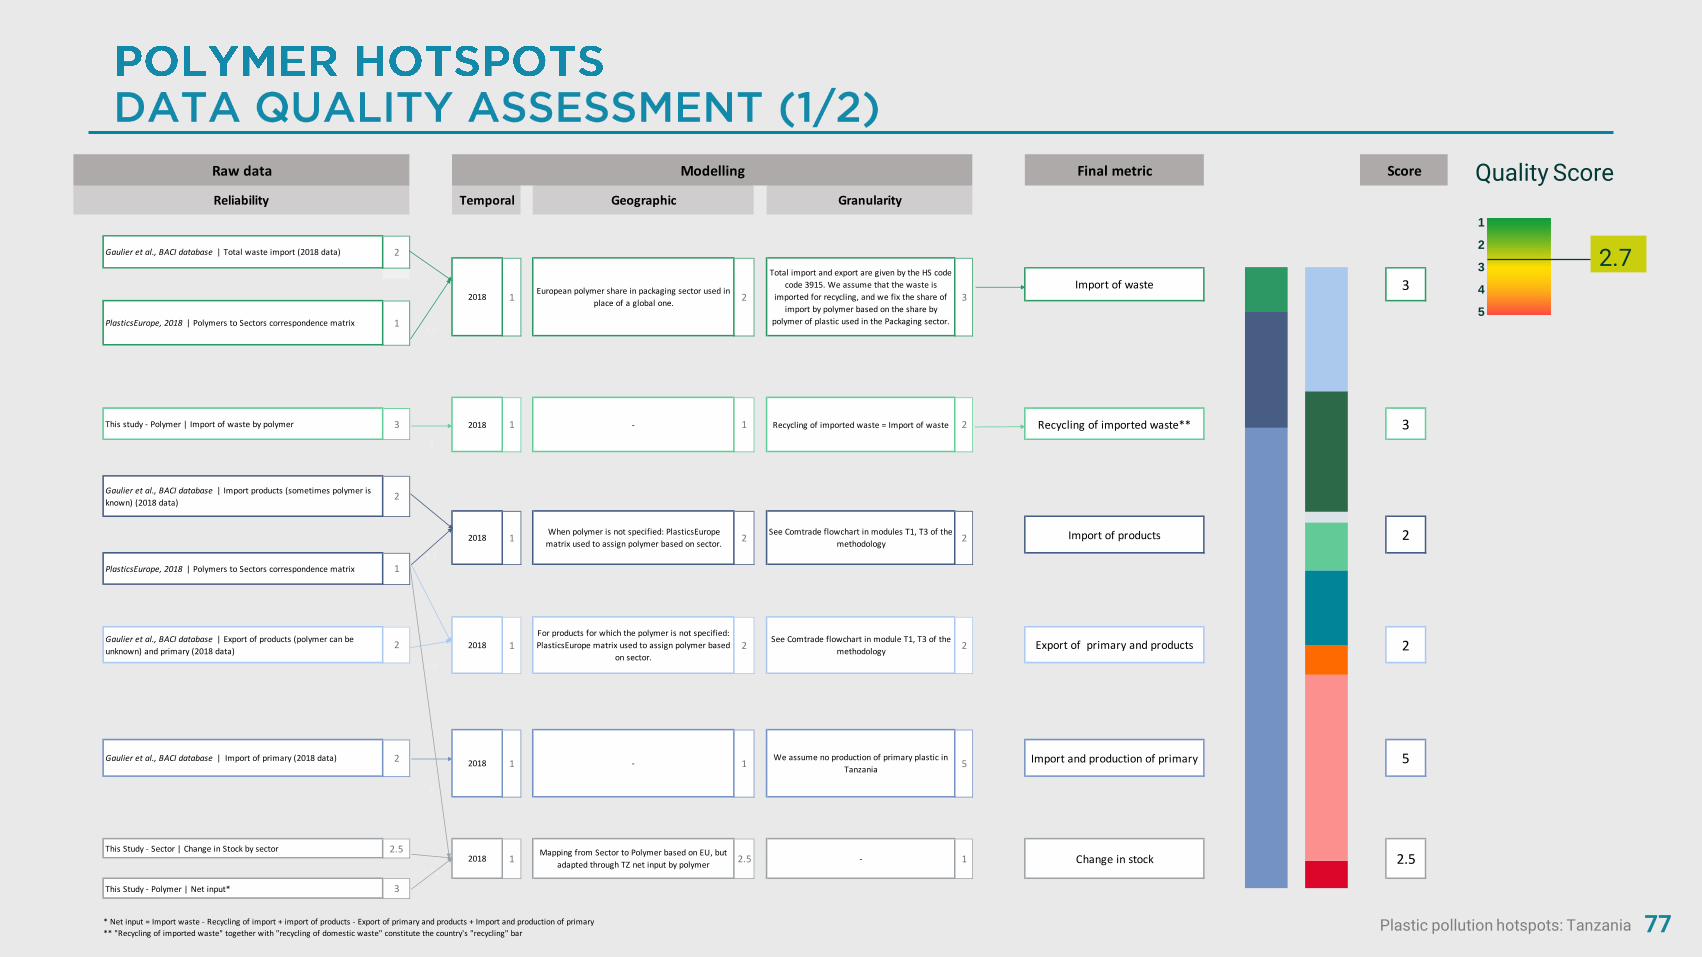
2.7
1
2
3
4
5
Quality ScoreFinal metric
This study - Polymer | Import of waste by polymer 3 Recycling of imported waste** 3
This Study - Sector | Change in Stock by sector 2.5
This Study - Polymer | Net input* 3
* Net input = Import waste - Recycling of import + import of products - Export of primary and products + Import and production of primary
** "Recycling of imported waste" together with "recycling of domestic waste" constitute the country's "recycling" bar
Modelling ScoreRaw data
Reliability Temporal Geographic Granularity
2
2
Mapping from Sector to Polymer based on EU, but
adapted through TZ net input by polymer2018 -2.51 1
1.25
Change in stock 2.5
5 Import and production of primary 5
21When polymer is not specified: PlasticsEurope
matrix used to assign polymer based on sector.2
See Comtrade flowchart in modules T1, T3 of the
methodology 2 Import of products
Gaulier et al., BACI database | Total waste import (2018 data) 2
PlasticsEurope, 2018 | Polymers to Sectors correspondence matrix 1
Gaulier et al., BACI database | Import products (sometimes polymer is
known) (2018 data)2
1.5
2018
PlasticsEurope, 2018 | Polymers to Sectors correspondence matrix 1
Export of primary and products1For products for which the polymer is not specified:
PlasticsEurope matrix used to assign polymer based
on sector.
Gaulier et al., BACI database | Export of products (polymer can be
unknown) and primary (2018 data)2
1.5
2018 2See Comtrade flowchart in module T1, T3 of the
methodology2
-We assume no production of primary plastic in
Tanzania 1
Gaulier et al., BACI database | Import of primary (2018 data) 212018
2018 1
3
3
Recycling of imported waste = Import of waste 2- 1
3Import of waste
1.5
1European polymer share in packaging sector used in
place of a global one.
Total import and export are given by the HS code
code 3915. We assume that the waste is
imported for recycling, and we fix the share of
import by polymer based on the share by
polymer of plastic used in the Packaging sector.
2018 2
Final metric
This study - Polymer | Import of waste by polymer 3 Recycling of imported waste** 3
This Study - Sector | Change in Stock by sector 2.5
This Study - Polymer | Net input* 3
* Net input = Import waste - Recycling of import + import of products - Export of primary and products + Import and production of primary
** "Recycling of imported waste" together with "recycling of domestic waste" constitute the country's "recycling" bar
Modelling ScoreRaw data
Reliability Temporal Geographic Granularity
2
2
Mapping from Sector to Polymer based on EU, but
adapted through TZ net input by polymer2018 -2.51 1
1.25
Change in stock 2.5
5 Import and production of primary 5
21When polymer is not specified: PlasticsEurope
matrix used to assign polymer based on sector.2
See Comtrade flowchart in modules T1, T3 of the
methodology 2 Import of products
Gaulier et al., BACI database | Total waste import (2018 data) 2
PlasticsEurope, 2018 | Polymers to Sectors correspondence matrix 1
Gaulier et al., BACI database | Import products (sometimes polymer is
known) (2018 data)2
1.5
2018
PlasticsEurope, 2018 | Polymers to Sectors correspondence matrix 1
Export of primary and products1For products for which the polymer is not specified:
PlasticsEurope matrix used to assign polymer based
on sector.
Gaulier et al., BACI database | Export of products (polymer can be
unknown) and primary (2018 data)2
1.5
2018 2See Comtrade flowchart in module T1, T3 of the
methodology2
-We assume no production of primary plastic in
Tanzania 1
Gaulier et al., BACI database | Import of primary (2018 data) 212018
2018 1
3
3
Recycling of imported waste = Import of waste 2- 1
3Import of waste
1.5
1European polymer share in packaging sector used in
place of a global one.
Total import and export are given by the HS code
code 3915. We assume that the waste is
imported for recycling, and we fix the share of
import by polymer based on the share by
polymer of plastic used in the Packaging sector.
2018 2

Plastic pollution hotspots: Tanzania 78
Final metric
4
3.0
This study - Polymer | Waste - Export of waste - Domestic recycling -
Properly disposed - Improperly disposed2.6
2.6
2018 1 - 1Uncollected = Waste - Export of waste -
Domestic recycling - Properly disposed -
Improperly disposed
1 Uncollected 2.6
This Study - Sector | Leakage by sector 2.55
This Study - Polymer | Mismanaged waste by polymer 2.8
* "Recycling of imported waste" together with "recycling of domestic waste" constitute the country's "recycling" bar
Raw data Modelling Score
Reliability Temporal Geographic Granularity
Domestic recycling of collected
waste*
Data collection IUCN | Recycled by polymer for some recyclers 4
Gaulier et al., BACI database | Total waste export (2018 data) 2
We assume that export of waste comes from
plastic waste collected for recycling, hence the
share by polymer are assumed to be the same.
The plastic collected for recycling that is not
exported is domestically recycled
2- 12018 1
3
Export of waste 3.0
Properly disposed 1.01.0
2018 1 - 1No proper management of waste in Tanzania (no
sanitary landfill or incineration facility)
This study - Polymer | Remaining after recycling and properly managed 2.5
Mapping from sector to polymer based on EU, but
adapted through TZ "remaining after recycling and
properly managed" by polymer.Improperly disposed
waste by sector is specific to TZ
3See Polymer flowchart in module T3 of the
methodology2 Imporperly disposed 3.0
This study - Sector | Improperly disposed by sector 2.94
2.1
2018 1
1Kanyairita (2019) | No sanitary landfill or incineration facility 1.0
PlasticsEurope, 2018 | Sector to polymer mapping based on EU market 1
See Polymer flowchart in module T3 of the
methodology1 Leaked 2.7
2.7
2018 1Mapping from sector to polymer based on EU, but
adapted using TZ mismanaged" waste specific to TZ2
2.7
1
2
3
4
5
Quality Score
Plastic pollution hotspots: Tanzania 79
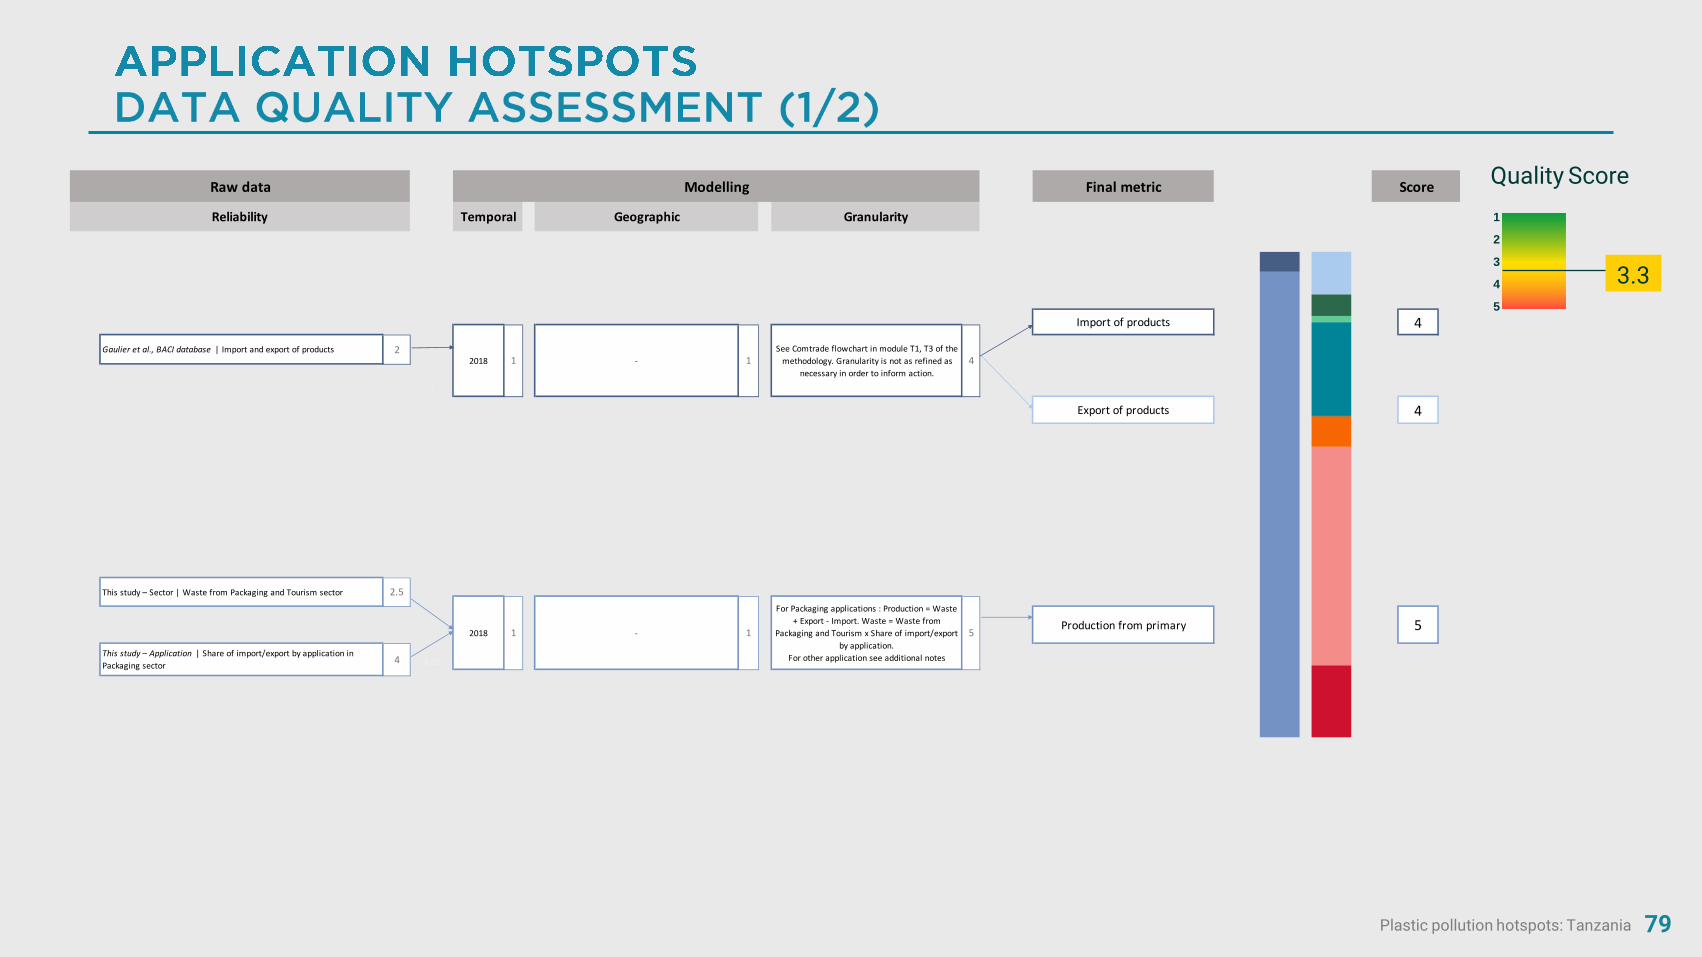
Final metric
5Production from primary
This study – Sector | Waste from Packaging and Tourism sector 2.5
3.25This study – Application | Share of import/export by application in
Packaging sector4
1 -2018 1
For Packaging applications : Production = Waste
+ Export - Import. Waste = Waste from
Packaging and Tourism x Share of import/export
by application.
For other application see additional notes
Export of products 4
5
Gaulier et al., BACI database | Import and export of products 2
2
2018
4
1 - 1See Comtrade flowchart in module T1, T3 of the
methodology. Granularity is not as refined as
necessary in order to inform action.
4
Import of products
Raw data Modelling Score
Reliability Temporal Geographic Granularity
3.3
Quality Score
1
2
3
4
5

Plastic pollution hotspots: Tanzania 80
3.3
Quality Score
1
2
3
4
5
Final metric
0
This study - Application | Waste - Export of waste - Domestic recycling -
Properly disposed - Improperly disposed3.2
3.2
2018 1 - 1Uncollected = Waste - Export of waste - Domestic
recycling - Properly disposed - Improperly disposed1 Uncollected 3.2
Plastic Leak Project, 2019 | Release rate per packaging application 3
This Study - Sector | Leakage from Packaging and Tourism sector 2.55 Leaked 2.5
This Study - Application | Mismanaged 2.8
2.3
2018 1 - 2.5
European littering rates. Data on improperly
disposed plastic from packaging and tourism are
from TZ, as well as waste by application.4
For packaging applications: See Application
flowchart
For other applications: See additional notes.2
Imporperly disposed 2.4
Leaked to ocean = (Waste - Recycling –
Properly)*Release Rate, adjusted so that the total
leakage matches leakage from the geographical
analysis
1
0.8
2018 1 - 1No proper management of waste = no sanitary
landfills or incinerators1 Properly disposed 1.0
Raw data Modelling Score
Reliability Temporal Geographic Granularity
2018Littering rates based on Europe. Recycling quantity
and export specific to Tanzania
This study - Applications | Waste genrated per application 4.33
4.0
4.0Export of waste
4
Packaging applications : Recycling per application =
recycling from packaging * (waste - littering per
packaging application) / (tot packaging waste -
littering). Similarly for export of waste. For the
non-packaging applications taken into account we
assume no recycling.
4
2This Study - Sector| Plastic in packaging and tourism sector collected for
recycling and exported
2.444444
1
3.3This study - Application | Remaining after recycling and properly
managed
Domestic recycling of collected
waste*
European Commission, 2018 | Plastic packaging application ittering rate
in EU1
Kanyairita (2019) | No sanitary landfill or incineration facility 1.0
This study - Sector | Improperly managed for Packaging and Tourism
sector2.94
2.8
2018 1
Plastic pollution hotspots: Tanzania 81
Cigarette filters: We estimate the number of cigarette filters fromcigarette consumption in 2019 from the GlobalData report oncigarettes in Tanzania (2019). The plastic weight of a cigarettefilter is 0.17gr. From these data we obtain the waste generated.Trade data on import and export are determined through the BACIdatabase (HS code: 240220). Recycling is set to zero. The shareof properly disposed waste items is taken from the average shareof properly disposed (sector hotspot), applied to the cigarettefilters that are not littered. Littering rate is set to 29%, based onEuropean Commission littering report (2018). The share ofimproperly disposed is based on the average share of improperlydisposed (sector hotspot), applied to cigarette filters not litteredor properly disposed. The release rate is taken from PLP (2020)and applied to uncollected and improperly disposed to determinethe total leakage.
Sanitary towels: import and export are determined through BACIdatabase (HS code: 961900). Waste generation is estimated to be3 sanitary towels/ day, 4 days/month, 12 month/year for all thefemale population from 15 to 55 years old (Index Mundi, 2020),with one sanitary towel weighting 2gr. Recycling is set to zero.The share of properly disposed waste items is taken from theaverage share of properly disposed (sector hotspot), applied tothe sanitary towels that are not littered. Littering rate is set to 21%,based on European Commission littering report (2018). Theimproperly disposed part is based on the average share ofimproperly disposed (sector hotspot), applied to sanitary towelsnot littered or properly disposed. The leakage rate is taken fromPLP (2020) and applied to uncollected and improperly disposed todetermine de total leakage.
Baby diapers: import and export are determined through the BACIdatabase (2020). To determine the waste generation of babydiapers in Tanzania, we only consider the urban population (22%)of children from 0-2 years old (half of the 0-4 population in UNstatistics database) using 4.16 unit of diapers/day (Mendosa etal., 2018). Average weight of a baby diaper is 29,1 gr, from which33% made of plastic components (Espinosa et al. 2015).Recycling is set to zero. The share of properly disposed wasteitems is taken from the average share of properly disposed(sector hotspot), applied to the baby towels that are not littered.Littering rate is set to 21% (using sanitary towels as a proxy),based on the European Commission littering report (2018) Theimproperly disposed is based on the average share of improperlydisposed (sector hotspot), applied to baby diapers not littered orproperly disposed. The leakage rate is taken from PLP (2020) andapplied to uncollected and improperly disposed to determine detotal leakage.
Plastic pollution hotspots: Tanzania 82
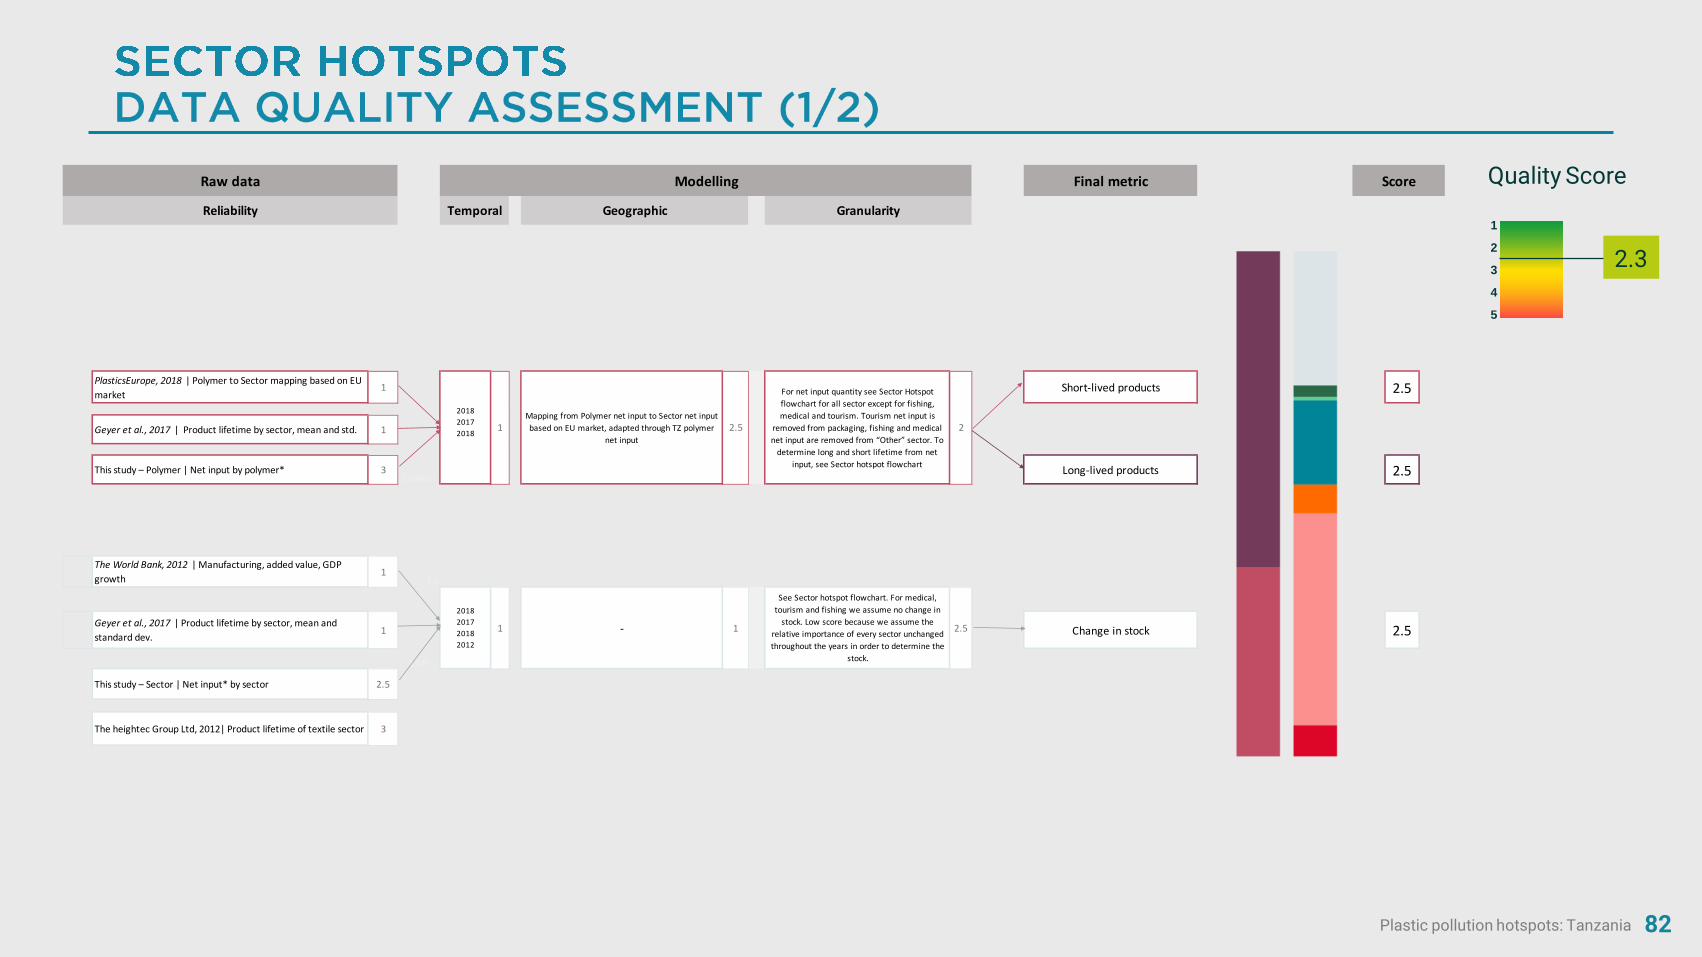
1
2
3
4
5
Quality Score
2.3
Final metric
PlasticsEurope, 2018 | Polymer to Sector mapping based on EU
market1 Short-lived products 2.5
Geyer et al., 2017 | Product lifetime by sector, mean and std. 1
This study – Polymer | Net input by polymer* 3 Long-lived products 2.5
The World Bank, 2012 | Manufacturing, added value, GDP
growth1
1.5
Geyer et al., 2017 | Product lifetime by sector, mean and
standard dev.1 Change in stock 2.5
This study – Sector | Net input* by sector 2.5
The heightec Group Ltd, 2012| Product lifetime of textile sector 3
For net input quantity see Sector Hotspot
flowchart for all sector except for fishing,
medical and tourism. Tourism net input is
removed from packaging, fishing and medical
net input are removed from “Other” sector. To
determine long and short lifetime from net
input, see Sector hotspot flowchart
Mapping from Polymer net input to Sector net input
based on EU market, adapted through TZ polymer
net input
2018
2017
201822.51
Raw data Modelling Score
Reliability Temporal Geographic Granularity
See Sector hotspot flowchart. For medical,
tourism and fishing we assume no change in
stock. Low score because we assume the
relative importance of every sector unchanged
throughout the years in order to determine the
stock.
1.666667
2.5-
2018
2017
2018
2012
11
1.875

Plastic pollution hotspots: Tanzania 83
1
2
3
4
5
Quality Score
2.3
Final metric
4
This study - Sector | Waste - Export of waste - Domestic recycling -
Properly disposed - Improperly disposed2.4 2018 1 - 1
Uncollected = Waste - Export of waste -
Domestic recycling - Properly disposed -
Improperly disposed
1 Uncollected 2
This Study - Sector | Mismanaged 2.7
Plastic Leak Project, 2019 | Release Rate by sector (base on product size
and value for informal recyclers)3
Leakage 2.6
This Study - Regional | Total macro-leakage from mismanaged waste 2.03
* Net input = Import waste - Recycling of import + import of products - Export of primary and products + Import and production of primary
** "Recycling of imported waste" together with "recycling of domestic waste" constitute the country's "recycling" bar
This study - Sector | Waste generated by sector 2.5
See Sector flowchart in module T3 of the
methodology.2
Improperly disposed
We assume that export of waste comes from
plastic waste collected for recycling, hence the
share by polymer are assumed to be the same.
The plastic collected for recycling that is not
exported is domestically recycled. We assume
that Synthetic Rubbers and Textiles are not
recycled. For the remaining sectors we distribute
the remaining recycling quantity from Eunomia
based on the waste generated by sector.
2
Domestic recycling of collected
waste**
1.0
Gaulier et al. BACI database | Total export of plastic waste (data 2018) 2
This Study - Sector | Micro-leakage by sector (see additional notes) 2.5
2
For Micro-leakage computation see additional
notes, for Macro-leakage see sector hotspot
flowchart, except for fishing (see additional
notes)
1.02018 11 Properly disposed
2
2.6
2018 1 - 1
This study - Regional | Total plastic being improperly disposed 4
2.9
2018
- 1No sanitary landfill or incinerator facility -> No
properly managed wasteKanyairita (2019 ) | No sanitary landfill or incineration facility 1
2.9
Raw data Modelling Score
Reliability Temporal Geographic Granularity
Data collection IUCN | Recycled by polymer for some recyclers 4
2.833333
20181 - 1
2.83
Export of waste 2.83
This study - Sector | Waste - Properly managed - Recycled - Export of
Waste 2.2
1Country specific littering habits are not accounted
for
3.0Plastic Leak Project, 2019 | Littering rate by sector

Plastic pollution hotspots: Tanzania 84
Fishing: Data on number number of fishing gears comes fromFisheries Department frame survey 2019 (BILLFISH-WIO project,2019). By default plastic weights by fishing gear type were derivedfrom technical designs found in multiple publications includingFAO and Nédélec et al., 1990. Combining these two pieces ofinformation yields the net plastic input from fishing gears. Byestimating the lifetime of a fishing net and by looking at the GDPgrowth of Spain, we estimate the amount of fishing nets going towaste from previous years.
Medical: In order to know the amount of plastic going to wastefrom the medical sector we combine the latest available numberof hospital beds in Tanzania for 2010 (WHO, 2020) with theoccupancy rate (131%), the amount of waste generated per bedper day (0.75 kg/bed/day) and the plastic share of medical waste(11%) provided by Manyele et al. (2006).
Tourism: Data on number of tourists is taken from the WorldBankdatabase (2020) and the average stay length was found in the ,2017 International Visitors’ Exit Survey Report (NBS, 2018). Weassume tourist and local population have the same daily plasticwaste generation. The total plastic waste generated comes fromthe regional hotspot analysis.
Micro-leakage contribution
• Automotive-tyres (Tyre dust): loss and leakage of syntheticrubbers particles from tyres to the marine environment iscalculated based on the methodology described in PLP (2019).Its contribution to leakage is included in “Automotive-tyres”.Data on vehicle numbers for 2018 is taken from MWTC (2018)and average distance travelled is based on the average inKenya for 2018 (Notter et al., 2019).
• Textile (Textile fibers): loss and leakage of textile fibers to themarine environment is calculated based on the methodologydescribed in the Plastic Leak Project (2020). Share of watercollected and treated is set at 20% (NESR, 2017).
• Others (Cosmetics): loss and leakage of plastic micro-particles from cosmetics to the marine environment iscalculated based on the methodology described in PlasticLeak Project (2020). Share of water collected and treated is setat 20% (NESR, 2017).
• Others (Pellets): loss and leakage the marine environment ofplastic pellets during transportation and production stages iscalculated based on the methodology described in PlasticLeak Project (2020). Share of water collected and treated is setat 20% (NESR, 2017).

Plastic pollution hotspots: Tanzania 85
1
2
3
4
5
Quality Score
2.6
Final metric
This study - Regional | Waste - Collected for recycling - Properly
disposed - Improperly disposed (by province)2,8 2018 1 - 1
Uncollected = Waste - Collected for recycling -
Properly disposed - Improperly disposed1 Uncollected 2,8
11 -
1
various sources cited above | Waste collected then disposed at
dumpsites2,5
3
1998 - 2018 3
For some cities, a specific collection rate is
available. For other urban areas, we use an average
of uncollected from Nyampundu et al. (2020).
Collection rate for rural areas is set to 0.
32 - 1
Improperly disposed
Collected for recycling1
We assume waste collected for recycling only in the
Dar es Salaam. The share of collected for recycling
= population share wrt the tot population of the
districts in Dar es Salaam.
4
Properly disposed 12018
4 -
CIESIN, 2018 | Population count per km2 projection for 2020 2
Partial data collection, IUCN | Recycled by polymer for few recyclers 3
3
2020
2018
Kanyairita (2019) | No sanitary landfill or incineration facility 11
1,0
Per capita waste generation in urban areas comes
from various sources for some cities. The share of
plastic in waste comes from Kazuva et al (2019) for
Dar es Salaam, from Mgimba et al. (2016) for other
urban areas, and from minimum value in CCAC
(2015) for rural areas. Waste generated by km2 =
population per km2 * per capita waste generated
(urban/rural)
ScoreRaw data Modelling
Babijes, 2016 | Waste generation and collection rate in Kigoma city
Reliability Temporal Geographic Granularity
This study – Sector | Plastic waste generated in the country 2,5
3
-
Kazuva et al. 2019 | Plastic share in household and non-household
waste for Dar es Salaam2 Waste generated 3
3 - 1
2,5
Mgimba et al, 2016 | Waste generation, collection rate and plastic share
in Mbeya city2
CCAC, 2015 | waste generation and collection rates in Dar es Salaam
districts.2
2008-2017 3Nyampundu et al., 2020 | Waste generation and collection rate in
Dodoma city2
Wilson et al, 2012 | Waste generation in Moshi city 2
Kanyairita L., interview | Waste generation and collection rate in
Mwanza city5

Plastic pollution hotspots: Tanzania 86
Final metric
This study - Regional | Collected = Collected for recycling + Properly
disposed + Improperly disposed2 2018 1 - 1
Share of collected = Waste mismanaged by
province / waste generated by province1 Share of Collected 2
0
This study - Regional | MWI by province 3.2
Boucher et al., 2019, IUCN | Release Rate matrix based on distance to
waterbody and surface runoff2.5
Jambeck et al., 2015 | Central estimate for maximum release rate 2
Raw data Modelling Score
Reliability Temporal Geographic Granularity
Share of mismanaged by district = Waste
mismanaged by province / waste generated by
district
1Share of Mismanaged 3.2
This Study - Regional | Mismanaged = Uncollected + Improperly
managed by disctrict3.4
3
2018 1
This Study - Regional | Waste generated by district 3.0
- 1.0
NASA - SEDAC population count | GIS Population on 1kmx1km grid 1.5
WWF HydroRivers | Country rivers 2
Lebreton et al., 2017 | Catchment run-off of watersheds
2
2.0
WWF HydroSHEDS | Country watersheds 1
-2
Macro-leakage from land 2.01
2.5
Nédélec et al., 1990 | Drawings of various fishing gear 2
2.0
2019
1990
2018
2.5 See additional notes 2 See additional notes (Sector Quality assessment) 2Leakage from fishing sector
Richardson et al., 2019 | Loss rate by fishing gear type 2
Fisheries Department, 2019 | Number of fishing gear per typein Tanzania 2
For each km^2 pixel: assign it to a watershed (based
on its location) to know the runoff [R], compute the
distance to shore or river (>10cms)[D], compute RR
matrix*.
Leakage of pixel = population of pixel x MWI of
province x RR
2020
2019
2017
20152
*1 With max release rate from Jambeck et al., 2015: 25%; D1 short < 2 km, D2 long > 100 km (Sistemiq), R1 small < 1st quartile of world runoff, R3 large > 3rd quartile of world runoff (Lebreton et al; 2017)
1
2
3
4
5
Quality Score
2.6

Plastic pollution hotspots: Tanzania 87
Fishing:
Leakage from lost/mismanaged fishing gear & overboard litter isestimated not only for the coastal areas but also for major lakes inTanzania mainland:
1) Leakage due to gears lost at sea is computed using loss ratesby fishing gear type provided by Richardson et al. (2019). Forsome fishing gears, loss is considered for fragments of the gearonly, thus we had to make an assumption on how big a fragmentwould be (10%, 50% or 90% of a gear unit). Our defaultcalculation takes the assumption of a fragment representing50% of a gear unit.
2) Leakage from gear waste mismanaged on land is computedfrom the difference between net input and loss at sea, to whichspecific loss and release rates are applied.
3) Overboard littering is estimated by taking the average dailylittering rate for packaging products in the country and applyingit to the number of days each fisherman is out at sea(assumption: 120 days per year at sea for full time fishermen).The number of fishermen is taken from The Tanzanian fisheriessector challenges and opportunities. (Ministry of Agriculture,Livestock and Fisheries, 2016)

Plastic pollution hotspots: Tanzania 88

Plastic pollution hotspots: Tanzania 89
Babijes, R. M. (2016). Environmental and social impact assessment for proposed additional investment sub-project in Kigoma-Ujiji Municipacity (No. SFG3397, pp. 1-181). The World Bank.
Boopendranath, M. (2012). Basic principle of fishing gear desing and classification.
Boucher, J. et al. (2019). The Marine Plastic Footprint. IUCN.
Center for International Earth Science Information Network - CIESIN - Columbia University (2018). Population Estimation Service, Version 3 (PES-v3). Palisades, NY: NASA Socioeconomic Data and Applications Center (SEDAC). https://doi.org/10.7927/H4DR2SK5.
Clean Virginia Waterways, Longwood University (2008). Cigarette butt litter. Available at: http://www.longwood.edu/cleanva/cigbutthowmany.htm
Espinosa-Valdemar, R. M et al. (2015). Assessment of gardening wastes as a co-substrate for diapers degradation by the fungus Pleurotus ostreatus. Sustainability, 7(5), 6033-6045.
European Commission (2018). Plastics: Reuse, recycling and marine litter, final report.
BILLFISH-WIO project (2019). Fisheries Department frame surveys in Tanzania.
Kaza, S. et al (2018). What a Waste 2.0 : A Global Snapshot of Solid Waste Management to 2050. Urban Development;. Washington, DC: World Bank. © World Bank. https://openknowledge.worldbank.org/handle/10986/30317 License: CC BY 3.0 IGO
Kazuva, E., & Zhang, J. (2019). Analyzing municipal solid waste treatment scenarios in rapidly urbanizing cities in developing countries: The case of Dar es Salaam, Tanzania. International journal of environmental research and public health, 16(11), 2035.
Kishan, W. et al. (2018). Design characteristics and technical specifications of mackerel gill nets of Sindhudurg, Maharashtra. Journal of Experimental Zoology, India, 21(1), 373-378.
Kostova, D. et al. (2014). Exploring the relationship between cigarette prices and smoking among adults: a cross-country study of low-and middle-income nations. nicotine & tobacco research, 16(Suppl_1), S10-S15.
Lebreton, L. C et al. (2017). River plastic emissions to the world’s oceans. Nature communications, 8, 15611.
Geyer, R. et al. (2017). Production, use, and fate of all plastics ever made. Science advances, 3(7), e1700782.
Gaulier, G., et al. (2008). BACI: A world database of international trade at the product-level. CEPII wp. Data accessed for 2018.
CCAC (2015), Solid waste management city profile.
Kanyairita, L. (2019). Marine Litter and Microplastics, Tanzania.
Lau, W. W. et al. (2020). Evaluating scenarios toward zero plastic pollution. Science, 369(6510), 1455-1461.
GlobalData (2020). Cigarettes in Tanzania, 2020. Abstract summary.
Index Mundi (2020), Tanzania Demographics Profile 2019. Available at: https://www.indexmundi.com/tanzania/demographics_profile.html
Jambeck, J. et al.. (2015). Plastic waste inputs from land into the ocean. Science, 347(6223), 768-771.

Plastic pollution hotspots: Tanzania 90
Mendoza, J. M. F. et al. (2019). Improving resource efficiency and environmental impacts through novel design and manufacturing of disposable baby diapers. Journal of Cleaner Production, 210, 916-928.
Nédélec, C. et al. (1990). Definition and classification of fishing gear categories (No. 222). FAO.
Mgimba, C., & Sanga, A. (2016). Municipal Solid Waste Composition Characterization for Sustainable Management Systems in Mbeya City, Tanzania. International Journal of Science, Environment and Technology, 5(1), 47-58.
Nyampundu, K., Mwegoha, W. J., & Millanzi, W. C. (2020). Sustainable solid waste management Measures in Tanzania: an exploratory descriptive case study among vendors at Majengo market in Dodoma City. BMC Public Health, 20(1), 1-16.
PLP (2020). Plastic Leak Project. ( https://quantis-intl.com/metrics/initiatives/plastic-leak-project/)
Prado, J. et al. (1990). Fisherman's workbook. Fishing News Books.
Queirolo, D. et al. (2009). Improved interspecific selectivity of nylon shrimp (Heterocarpus reedi) trawling in Chile. Latin American Journal of Aquatic Research, 37(2), 221-230.
Richardson, K. et al. (2019). Estimates of fishing gear loss rates at a global scale: A literature review and meta‐analysis. Fish and Fisheries, 20(6), 1218-1231.
The World Bank, World Development Indicators (2012). Industry (including construction), value added (annual % growth). Retrieved from https://data.worldbank.org/indicator/NV.IND.TOTL.KD.ZG
The World Bank (2020). International tourism, number of arrivals - Tanzania. Retrieved from: https://data.worldbank.org/indicator/ST.INT.ARVL?locations=TZ
Ministry of Agriculture, Livestock and Fisheries (2016). The Tanzanian fisheries sector challenges and opportunities.
ODYSSEE-MURE (2020). Sectoral profile – Transport.
PlasticsEurope (2018). Plastic - the Facts 2018.
Lehner, B. et al. (2013): Global river hydrography and network routing: baseline data and new approaches to study the world’s large river systems. Hydrological Processes, 27(15): 2171–2186. Data is available at www.hydrosheds.org.
Lehner, B. et al. (2008): New global hydrography derived from spaceborne elevation data. Eos, Transactions, AGU, 89(10): 93-94. Data is available at www.hydrosheds.org.
Ministry of Works, Transport and Communication - MWTC (2018). Transport and Meteorology Sector Statistics.
National Bureau of Statistic - NBS (2018). Tanzania Tourism Sector Survey, 2017 International Visitors’ Exit Survey Report.
National Environment Statistics Report, 2017 (NESR, 2017). Dar es Salaam, Tanzania Mainland.
Notter et al. (2019). Updated Transport Data in Kenya 2018: An Overview. GIZ TraCS project.

Plastic pollution hotspots: Tanzania 91
UNEP-IUCN (2020). Modules and tools for the “National guidance for plastic pollution hotspotting and shaping action”, available at: https://plastichotspotting.lifecycleinitiative.org/modules/
Wilson, D. C., Rodic, L., Scheinberg, A., Velis, C. A., & Alabaster, G. (2012). Comparative analysis of solid waste management in 20 cities. Waste management & research, 30(3), 237-254.
UN Environment (2018). “Table A3. Use share of polymer resin production according to plastic application” in Mapping of global plastics value chain and plastics losses to the environment (with a particular focus on marine environment). Ryberg, M., Laurent, A., Hauschild, M.(2018) United Nations Environment Programme. Nairobi, Kenya
The World Health Organization (2020). Health indicators – Hospital beds (per 10’000 population): Available at: https://www.who.int/data/gho/data/indicators/indicator-details/GHO/hospital-beds-(per-10-000-population)

92
Published in January 2021,results for the year 2018
Implemented with
Supported by the Agence Française de Développement