Fetal Growth and Risk of Stillbirth: A Population-Based Case–Control Study
18
Fetal Growth and Risk of Stillbirth: A Population-Based Case–Control Study Radek Bukowski 1 *, Nellie I. Hansen 2 , Marian Willinger 3 , Uma M. Reddy 3 , Corette B. Parker 2 , Halit Pinar 4 , Robert M. Silver 5 , Donald J. Dudley 6 , Barbara J. Stoll 7 , George R. Saade 1 , Matthew A. Koch 2 , Carol J. Rowland Hogue 8 , Michael W. Varner 5 , Deborah L. Conway 6 , Donald Coustan 4 , Robert L. Goldenberg 9 , for the Eunice Kennedy Shriver National Institute of Child Health and Human Development Stillbirth Collaborative Research Network " 1 University of Texas Medical Branch at Galveston, United States of America, 2 RTI International, Research Triangle Park, North Carolina, United States of America, 3 The Pregnancy and Perinatology Branch, the Eunice Kennedy Shriver National Institute of Child Health and Human Development, National Institutes of Health, Bethesda, Maryland, United States of America, 4 Brown University School of Medicine, Providence, Rhode Island, United States of America, 5 University of Utah School of Medicine and Intermountain Health Care, Salt Lake City, Utah, United States of America, 6 University of Texas Health Science Center at San Antonio, United States of America, 7 Emory University School of Medicine and Children’s Healthcare of Atlanta, Atlanta, Georgia, United States of America, 8 Rollins School of Public Health, Emory University, Atlanta, Georgia, United States of America, 9 Columbia University Medical Center, New York, New York, United States of America Abstract Background: Stillbirth is strongly related to impaired fetal growth. However, the relationship between fetal growth and stillbirth is difficult to determine because of uncertainty in the timing of death and confounding characteristics affecting normal fetal growth. Methods and Findings: We conducted a population-based case–control study of all stillbirths and a representative sample of live births in 59 hospitals in five geographic areas in the US. Fetal growth abnormalities were categorized as small for gestational age (SGA) (,10th percentile) or large for gestational age (LGA) (.90th percentile) at death (stillbirth) or delivery (live birth) using population, ultrasound, and individualized norms. Gestational age at death was determined using an algorithm that considered the time-of-death interval, postmortem examination, and reliability of the gestational age estimate. Data were weighted to account for the sampling design and differential participation rates in various subgroups. Among 527 singleton stillbirths and 1,821 singleton live births studied, stillbirth was associated with SGA based on population, ultrasound, and individualized norms (odds ratio [OR] [95% CI]: 3.0 [2.2 to 4.0]; 4.7 [3.7 to 5.9]; 4.6 [3.6 to 5.9], respectively). LGA was also associated with increased risk of stillbirth using ultrasound and individualized norms (OR [95% CI]: 3.5 [2.4 to 5.0]; 2.3 [1.7 to 3.1], respectively), but not population norms (OR [95% CI]: 0.6 [0.4 to 1.0]). The associations were stronger with more severe SGA and LGA (,5th and .95th percentile). Analyses adjusted for stillbirth risk factors, subset analyses excluding potential confounders, and analyses in preterm and term pregnancies showed similar patterns of association. In this study 70% of cases and 63% of controls agreed to participate. Analysis weights accounted for differences between consenting and non-consenting women. Some of the characteristics used for individualized fetal growth estimates were missing and were replaced with reference values. However, a sensitivity analysis using individualized norms based on the subset of stillbirths and live births with non-missing variables showed similar findings. Conclusions: Stillbirth is associated with both growth restriction and excessive fetal growth. These findings suggest that, contrary to current practices and recommendations, stillbirth prevention strategies should focus on both severe SGA and severe LGA pregnancies. Please see later in the article for the Editors’ Summary. Citation: Bukowski R, Hansen NI, Willinger M, Reddy UM, Parker CB, et al. (2014) Fetal Growth and Risk of Stillbirth: A Population-Based Case–Control Study. PLoS Med 11(4): e1001633. doi:10.1371/journal.pmed.1001633 Academic Editor: Nicholas M. Fisk, University of Queensland, Australia Received October 31, 2013; Accepted March 11, 2014; Published April 22, 2014 This is an open-access article, free of all copyright, and may be freely reproduced, distributed, transmitted, modified, built upon, or otherwise used by anyone for any lawful purpose. The work is made available under the Creative Commons CC0 public domain dedication. Funding: This work, including the design and conduct of the study; collection, management, analysis, and interpretation of the data; and preparation, review and approval of the manuscript, was supported by grant funding from the Eunice Kennedy Shriver National Institute of Child Health and Human Development: U10- HD045953 Brown University, Rhode Island; U10-HD045925 Emory University, Georgia; U10-HD045952 University of Texas Medical Branch at Galveston, Texas; U10- HDO45955 University of Texas Health Sciences Center at San Antonio, Texas; U10-HD045944 University of Utah Health Sciences Center, Utah; and U01-HD045954 RTI International, RTP. Program officers from the funding agency (UMR and MW) were members of the Steering Committee of the study, and contributed to the study design, management, interpretation of the data, as well as preparation, review and approval of the manuscript. Competing Interests: The authors have declared that no competing interests exist. Abbreviations: AGA, appropriate for gestational age; BMI, body mass index; GA, gestational age; LGA, large for gestational age; OR, odds ratio; SCRN, Stillbirth Collaborative Research Network; SGA, small for gestational age. * E-mail: [email protected] " Membership of the Stillbirth Collaborative Research Network is provided in the Acknowledgments. PLOS Medicine | www.plosmedicine.org 1 April 2014 | Volume 11 | Issue 4 | e1001633
Transcript of Fetal Growth and Risk of Stillbirth: A Population-Based Case–Control Study

Fetal Growth and Risk of Stillbirth: A Population-BasedCase–Control StudyRadek Bukowski1*, Nellie I. Hansen2, Marian Willinger3, Uma M. Reddy3, Corette B. Parker2, Halit Pinar4,
Robert M. Silver5, Donald J. Dudley6, Barbara J. Stoll7, George R. Saade1, Matthew A. Koch2,
Carol J. Rowland Hogue8, Michael W. Varner5, Deborah L. Conway6, Donald Coustan4,
Robert L. Goldenberg9, for the Eunice Kennedy Shriver National Institute of Child Health and Human
Development Stillbirth Collaborative Research Network"
1 University of Texas Medical Branch at Galveston, United States of America, 2 RTI International, Research Triangle Park, North Carolina, United States of America, 3 The
Pregnancy and Perinatology Branch, the Eunice Kennedy Shriver National Institute of Child Health and Human Development, National Institutes of Health, Bethesda,
Maryland, United States of America, 4 Brown University School of Medicine, Providence, Rhode Island, United States of America, 5 University of Utah School of Medicine
and Intermountain Health Care, Salt Lake City, Utah, United States of America, 6 University of Texas Health Science Center at San Antonio, United States of America,
7 Emory University School of Medicine and Children’s Healthcare of Atlanta, Atlanta, Georgia, United States of America, 8 Rollins School of Public Health, Emory University,
Atlanta, Georgia, United States of America, 9 Columbia University Medical Center, New York, New York, United States of America
Abstract
Background: Stillbirth is strongly related to impaired fetal growth. However, the relationship between fetal growth andstillbirth is difficult to determine because of uncertainty in the timing of death and confounding characteristics affectingnormal fetal growth.
Methods and Findings: We conducted a population-based case–control study of all stillbirths and a representative sampleof live births in 59 hospitals in five geographic areas in the US. Fetal growth abnormalities were categorized as small forgestational age (SGA) (,10th percentile) or large for gestational age (LGA) (.90th percentile) at death (stillbirth) or delivery(live birth) using population, ultrasound, and individualized norms. Gestational age at death was determined using analgorithm that considered the time-of-death interval, postmortem examination, and reliability of the gestational ageestimate. Data were weighted to account for the sampling design and differential participation rates in various subgroups.Among 527 singleton stillbirths and 1,821 singleton live births studied, stillbirth was associated with SGA based onpopulation, ultrasound, and individualized norms (odds ratio [OR] [95% CI]: 3.0 [2.2 to 4.0]; 4.7 [3.7 to 5.9]; 4.6 [3.6 to 5.9],respectively). LGA was also associated with increased risk of stillbirth using ultrasound and individualized norms (OR [95%CI]: 3.5 [2.4 to 5.0]; 2.3 [1.7 to 3.1], respectively), but not population norms (OR [95% CI]: 0.6 [0.4 to 1.0]). The associationswere stronger with more severe SGA and LGA (,5th and .95th percentile). Analyses adjusted for stillbirth risk factors,subset analyses excluding potential confounders, and analyses in preterm and term pregnancies showed similar patterns ofassociation. In this study 70% of cases and 63% of controls agreed to participate. Analysis weights accounted for differencesbetween consenting and non-consenting women. Some of the characteristics used for individualized fetal growth estimateswere missing and were replaced with reference values. However, a sensitivity analysis using individualized norms based onthe subset of stillbirths and live births with non-missing variables showed similar findings.
Conclusions: Stillbirth is associated with both growth restriction and excessive fetal growth. These findings suggest that,contrary to current practices and recommendations, stillbirth prevention strategies should focus on both severe SGA andsevere LGA pregnancies.
Please see later in the article for the Editors’ Summary.
Citation: Bukowski R, Hansen NI, Willinger M, Reddy UM, Parker CB, et al. (2014) Fetal Growth and Risk of Stillbirth: A Population-Based Case–Control Study. PLoSMed 11(4): e1001633. doi:10.1371/journal.pmed.1001633
Academic Editor: Nicholas M. Fisk, University of Queensland, Australia
Received October 31, 2013; Accepted March 11, 2014; Published April 22, 2014
This is an open-access article, free of all copyright, and may be freely reproduced, distributed, transmitted, modified, built upon, or otherwise used by anyone forany lawful purpose. The work is made available under the Creative Commons CC0 public domain dedication.
Funding: This work, including the design and conduct of the study; collection, management, analysis, and interpretation of the data; and preparation, review andapproval of the manuscript, was supported by grant funding from the Eunice Kennedy Shriver National Institute of Child Health and Human Development: U10-HD045953 Brown University, Rhode Island; U10-HD045925 Emory University, Georgia; U10-HD045952 University of Texas Medical Branch at Galveston, Texas; U10-HDO45955 University of Texas Health Sciences Center at San Antonio, Texas; U10-HD045944 University of Utah Health Sciences Center, Utah; and U01-HD045954RTI International, RTP. Program officers from the funding agency (UMR and MW) were members of the Steering Committee of the study, and contributed to thestudy design, management, interpretation of the data, as well as preparation, review and approval of the manuscript.
Competing Interests: The authors have declared that no competing interests exist.
Abbreviations: AGA, appropriate for gestational age; BMI, body mass index; GA, gestational age; LGA, large for gestational age; OR, odds ratio; SCRN, StillbirthCollaborative Research Network; SGA, small for gestational age.
* E-mail: [email protected]
" Membership of the Stillbirth Collaborative Research Network is provided in the Acknowledgments.
PLOS Medicine | www.plosmedicine.org 1 April 2014 | Volume 11 | Issue 4 | e1001633

Introduction
One in 160 births at $20 wk gestation in the United States is
stillborn, resulting in over 25,000 stillbirths each year [1], a rate
similar to the rate of infant death [2]. Stillbirth also constitutes one
of the main causes of mortality worldwide [3,4]. Fetal growth
restriction, and its proxy small for gestational age (SGA) fetus, is
one of the most important predictors of stillbirth because of its
strong association with stillbirth and relatively high prevalence.
Fetal growth restriction is a pathological decrease in the rate of
fetal growth that frequently results in an adverse outcome, but is
difficult to define because it requires serial evaluation of fetal
growth. Conversely, SGA is easier to define—a birth weight
smaller than expected—but includes a proportion of small but
normal pregnancies. The overlap between fetal growth restriction
and SGA depends on the norm and cutoff used. Approximately a
quarter of stillbirths are associated with SGA fetus, almost double
the proportion associated with any other risk factor [5,6]. For these
reasons, standards of clinical practice recommend evaluation of
fetal growth during each prenatal visit and further evaluation and
possible intervention if the fetal growth rate is poor [7–10]. Despite
ubiquitous use of fetal growth monitoring in clinical practice and
extensive research, the relationship between fetal growth and
stillbirth is not completely understood, for the following reasons.
First, birth weight percentile is a function of birth weight and
age of the fetus. Thus, studies using gestational age (GA) at
delivery rather than GA at death, as an estimate of the age of the
fetus, systematically overestimate the GA of stillbirths. This leads
to overestimation of the proportion of birth weights considered
SGA and underestimation of birth weights considered large for
GA (LGA) among stillbirths.
Second, a number of maternal characteristics such as weight,
height, age, race/ethnicity, parity, exposures during pregnancy,
smoking, and measures of placental function (such as maternal
blood concentrations of placental hormones) have been observed
to influence the magnitude of both fetal growth and risk of
stillbirth [5,6,11–14]. Specific ranges of these characteristics are
also associated with birth weight among uncomplicated live birth
pregnancies and are accounted for by using individualized birth
weight norms [15]. Thus, to accurately assess fetal growth and
identify fetal growth abnormalities, an accurate estimate of GA
and accounting for the effect of physiologic determinants of fetal
growth are needed. This is especially important in stillbirths,
because their exact GA is mostly not known, and GA at delivery
overestimates GA of stillbirths. Moreover, many characteristics
that affect the growth of live and normal pregnancies, such as
maternal race/ethnicity, body mass index (BMI), and parity, are
also associated with the risk of stillbirth. The effect of these charac-
teristics on fetal growth and risk of stillbirth is complex, because
within a certain range their effect on fetal growth is observed
among normal live pregnancies without complications [15].
Therefore, we hypothesized that accounting for time of death in
determining fetal age and birth weight percentile, and determining
percentiles of birth weight based on norms that account for factors
affecting birth weight in normal pregnancies, will more accurately
identify the proportion of stillbirths associated with abnormal
growth than using traditional methods.
Methods
Ethics StatementThis study was approved by the institutional review boards at
each of the clinical recruiting sites and at the data coordinating
center. All mothers participating in the study gave written
informed consent.
Study DesignThe Stillbirth Collaborative Research Network (SCRN) con-
ducted a population-based case–control study of stillbirths in the
United States. The study design has been previously described
[16]. Briefly, the population consisted of residents of five
geographic areas defined a priori by state and county lines: (1)
the state of Rhode Island and Bristol County, Massachusetts; (2)
DeKalb County, Georgia; (3) Galveston and Brazoria Counties,
Texas; (4) Bexar County, Texas; and (5) Salt Lake County, Utah.
Participants were recruited at delivery between March 1, 2006,
and September 30, 2008, from 59 community and academic,
urban, and rural hospitals in the five areas, with a cumulative
average of 80,000 deliveries per year. The investigators selected
the 59 hospitals to ensure access to at least 90% of all pregnancies
ending in either stillbirth or live birth within each geographic area
based on estimates of the number of hospital deliveries from vital
statistics data and hospital medical records available during study
planning. All women whose pregnancies resulted in stillbirth and a
representative sample of women with live births, oversampled for
those delivering at ,32 wk gestation and those of African descent
delivering at $32 wk gestation, were approached for enrollment.
Terminations of pregnancy were excluded.
A stillbirth was defined by Apgar scores of 0 at 1 and 5 min,
and no signs of life by direct observation. The protocol included
an in-hospital maternal interview, medical record abstraction,
placental pathology examination, and biospecimen collection for
stillbirths and live births. For stillbirths, a standardized postmor-
tem examination was also performed.
Fetal AgeFetal age was based on an estimated due date and the date of
delivery for live births and an estimated due date and estimated
date of death for stillbirths, using an algorithm developed by the
SCRN investigators [17]. For both stillbirths and live births, the
due date was estimated using (1) menstrual dating criteria that
agreed with ultrasound or ultrasound dating criteria (when the last
menstrual period date was unknown or uncertain, or menstrual
dating did not agree with ultrasound dating within specified
constraints) in 88.3% of pregnancies, (2) menstrual dating alone
when ultrasound was not available in 6.1%, and (3) review of all
clinical information available in 5.6%.
The SCRN algorithm for estimating time of death and fetal age
at death in stillbirths considered the following: the reliability of the
estimated due date; the length of the interval between the time
the fetus was last documented alive and the time fetal demise was
first recorded based on information from prenatal care visits,
hospitalizations, and ultrasound examinations (the time-of-death
interval); and information available from postmortem exami-
nation, including degree of fetal maceration and foot length
measurement. The estimated due date was considered reliable
if estimated by ultrasound or by certain menstrual dating that
agreed with ultrasound (within specified constraints). Briefly, (1) if
the estimated due date was reliable, the fetal age at death was
estimated using the due date and the date fetal demise was
diagnosed (if the interval during which death occurred was #1 d)
or the date at the midpoint of the time-of-death interval (if the
interval was .1 and #7 d); (2) if the estimated due date was
unreliable, or the time-of-death interval was .7 d, GA at death
was estimated using foot length, or using GA reported by the study
site at screening based on clinical criteria when foot length
Fetal Growth and Stillbirth
PLOS Medicine | www.plosmedicine.org 2 April 2014 | Volume 11 | Issue 4 | e1001633

information was not available. Precise estimates of GA at death,
defined as meeting reliable dating criteria and having an interval
of 1 wk or less during which the demise could have occurred, were
possible for 47% of stillbirths.
The fetal age at death estimated by the SCRN algorithm was
used for all stillbirths in the primary analysis. For comparison, GA
at stillbirth delivery, calculated using the estimated due date and
the delivery date, and GA at delivery minus 2 d were also used as
estimates of fetal age at death to examine the impact on birth
weight percentiles. For live births, fetal age at delivery was
estimated using the estimated due date if reliable and the delivery
date, or if the estimated due date was unreliable, the GA reported
by the study site at screening was used.
Fetal WeightFetal weight percentiles were determined based on birth weight
and the fetal age estimate for stillbirths and live births. Birth
weight was obtained from medical records or postmortem
examination and was compared to expected weight for GA based
on three types of norms: population, ultrasound, and individual-
ized norms [15,18,19]. Alexander et al.’s population norms
reported percentiles of birth weight for completed weeks of GA,
20–44 wk, based on data from the population of over 3 million US
single live births in 1991 [18]. SCRN live birth and stillbirth birth
weights were compared to Alexander et al.’s population norms to
determine a percentile category. Hadlock et al.’s ultrasound norms
used fetal weight estimated in utero by ultrasound in 392
uncomplicated pregnancies progressing to term to develop an
equation to predict fetal weight as a function of GA [19]. The
observed SCRN birth weight was compared to the fetal weight
predicted by Hadlock et al.’s equation, with a percentile computed
under normality assumptions. Bukowski et al.’s individualized
norms used data from 9,818 uncomplicated pregnancies resulting
in singleton births to develop an equation to predict expected term
birth weight based on a number of maternal and fetal
characteristics affecting normal fetal growth [15]. A proportion
derived using Hadlock et al.’s equation [19] was then used to
adjust the prediction at term to a prediction at the GA of the
SCRN live birth or stillbirth, and the observed birth weight was
then compared to this individualized predicted birth weight, with a
percentile computed under normality assumptions. Steps used to
estimate percentiles are summarized in Figure 1, and details of
estimation are provided for each norm below. SGA birth weight
was defined as birth weight less than the 10th percentile, and LGA
as birth weight above the 90th percentile for GA, while severe
SGA and LGA were defined by the 5th and 95th percentiles
Figure 1. Summary of steps used to assign infants to a birth weight percentile category. GASCRN is the fetal age at death (for stillbirths) ordelivery (for live births) estimated by the SCRN algorithm [17]. BW, birth weight; SD, standard deviation. References: Alexander et al. [18], Hadlock etal. [19]; Bukowski et al. [15].doi:10.1371/journal.pmed.1001633.g001
Fetal Growth and Stillbirth
PLOS Medicine | www.plosmedicine.org 3 April 2014 | Volume 11 | Issue 4 | e1001633

respectively. Birth weights in the 10th–90th percentile range were
classified as appropriate for age (AGA).
Population norms. The estimated GA at death (for
stillbirths) or delivery (for live births) using the SCRN algorithm
(GASCRN) was recorded in weeks, with days retained as a fractional
component. Alexander et al. reported 5th, 10th, 50th, 90th, and
95th percentiles of birth weight for completed weeks of GA
derived using data from over 3 million US 1991 single live births
[18]. Linear interpolation was used with Alexander et al.’s
reported percentiles for each completed week of GA, 20–44 wk,
to derive birth weight percentiles for GASCRN. For interpolation,
each percentile reported by Alexander et al. was taken to represent
birth weight at the midpoint of the GA week range (0–6 d). For
example, the 10th percentile of birth weight reported for an infant
of 30 wk GA was considered the 10th percentile for 30.5 wk GA.
The observed birth weight of each infant was compared to the
interpolated 5th, 10th, 50th, 90th, and 95th percentiles of birth
weight for GASCRN and assigned to a percentile category (e.g.,
,10th percentile). Three infants with GASCRN.44.5 wk were
assigned to the 10th–90th percentile category based on birth
weight between the 10th and 90th percentiles reported for 44 wk.
Ultrasound norms. Hadlock et al. used in utero fetal weight,
estimated with ultrasound measurements, from 392 uncomplicated
pregnancies progressing to term among predominantly middle-
class white women to develop a best-fitting equation for fetal
weight as a function of GA [19]. Furthermore, they estimated fetal
weight percentiles by GA, assuming a Gaussian distribution for
fetal weight on the natural log scale. In like manner, a birth weight
percentile for GASCRN was estimated for each infant in the SCRN
cohort as the normal probability of a Z-score, ZULTRASOUND,
calculated as follows:
ZULTRASOUND~ ln oBW½ �{ln eBW½ �ð Þ=SD ln oBW½ �ð Þ ð1Þ
where ln(oBW) is the natural log of the observed birth weight of
the SCRN infant, SD(ln[oBW]) is the standard deviation of birth
weight on the natural log scale reported by Hadlock et al. ( = 0.12),
and ln(eBW) is the natural log of the expected birth weight for
GASCRN by Hadlock et al.’s equation:
ln eBWð Þ~ 0:578z0:332 �GASCRN{0:00354 �GA2SCRN
� �ð2Þ
Individualized norms. Bukowski et al. developed a regres-
sion model for birth weight in a normal population using singleton
births from 9,818 women with uncomplicated pregnancies [15].
The model equation accounts for maternal and other character-
istics affecting birth weight (see Table 2 of [15]). This equation,
with some modifications, was used to compute an individualized
expected birth weight at 280 d for each SCRN infant. The
modifications were as follows. (1) Maternal weight in the first
trimester was not available, and maternal pre-pregnancy weight
was substituted. (2) Fetal heart rate in the first trimester was not
available and could not be included. (3) GA was not needed in the
prediction equation when estimating birth weight at 280 d, as
Bukowski et al.’s regression model used GA minus 280. (4) SCRN
marital status categories were ‘‘not married,’’ ‘‘cohabitating,’’ and
‘‘married.’’ For the purposes of modeling, ‘‘not married’’ was
given the coefficient for ‘‘single,’’ and ‘‘cohabitating’’ was given the
coefficient for ‘‘other’’ in Table 2 of [15]. (5) Values for continuous
variables outside the range of values observed in the population in
which the model equation was developed were truncated to
conform to those ranges. Values were truncated for nine of the 19
variables included in the model equation. For eight of these nine
variables—maternal weight, cigarettes/day, nuchal translucency
size, and maternal blood concentrations of five placental
hormones—values were truncated for between 1 and 21 infants
(representing ,1% to 3.8%). DeltaGA (the difference between GA
estimated by first trimester ultrasound and age estimated by last
menstrual period date) was truncated for 190 infants with
measures outside the 27 to 7 range of the data included in the
modeling (representing 29%). (6) Accommodations were made for
a number of variables that were missing. Missing values for ordinal
variables, with the exception of education, were set to mean or
median values (maternal weight: 64 kg; maternal height: 165 cm;
number of prior term pregnancies: 0; number of prior abortions: 0;
number of cigarettes/day: 0; first and second trimester test results
in multiples of the median: 1; DeltaGA: 0). For each categorical
variable, and for education, the coefficient for ‘‘missing’’ values
was derived as a weighted average of the coefficients of the non-
missing levels, with weights taken as the proportion of the
corresponding level in the SCRN singleton cohort.
After computing an individualized expected birth weight at
280 d (BWINDIV280) for each SCRN infant, an individualized
expected birth weight for GASCRN (eBW) was calculated using a
proportion derived using Hadlock et al.’s equation [19]:
eBW~BWINDIV280| BWHADLOCK=BWHADLOCK280ð Þ: ð3Þ
where BWHADLOCK is the predicted birth weight for GASCRN
using Hadlock et al.’s equation and BWHADLOCK280 is the
predicted birth weight for GA at 280 d using Hadlock et al.’s
equation ( = 3,619.17 g).
Finally, an individualized birth weight percentile was estimated
as the normal probability of an individualized Z-score, ZINDIV, of
the form:
ZINDIV~ oBW{eBWð Þ=SD oBWð Þ ð4Þ
where oBW is the observed birth weight of the SCRN infant, eBW
is the individualized expected birth weight at GASCRN, and
SD(oBW) is an estimate of the standard deviation of the observed
birth weight. The standard deviation was estimated using an
estimate of the coefficient of variation at 280 d (CVINDIV280)
multiplied by eBW (CVINDIV2806eBW). CVINDIV280 was taken as
the reported square root of the residual mean square from the
model from Bukowski et al. (358.479 g) divided by the expected
birth weight at 280 d from Hadlock et al. (BWHADLOCK280 =
3,619.17 g). Thus, CVINDIV280 = 358.479/3,619.17.
In sensitivity analyses, individualized norm percentiles were
recalculated based on three different reduced prediction equations
that included subsets of variables largely non-missing in the SCRN
cohort, instead of the original 19 variables. First, percentiles were
estimated based on a prediction equation that included the 11
variables with largely non-missing values in the SCRN cohort
(maternal weight, height, race/ethnicity, education, marital status,
number of prior term pregnancies, number of prior abortions,
altitude of residence, use of ovulation induction to become
pregnant, cigarettes smoked per day during the first trimester, and
male fetus), with coefficients derived using data from the original
Bukowski et al. population. Second, percentiles were estimated
based on a prediction equation that included the six variables
suggested previously [20] (maternal weight, height, race/ethnicity,
number of prior term pregnancies, cigarettes smoked per day
during the first trimester, and male fetus), with coefficients derived
using data from the original Bukowski et al. population. Third,
Fetal Growth and Stillbirth
PLOS Medicine | www.plosmedicine.org 4 April 2014 | Volume 11 | Issue 4 | e1001633

percentiles were estimated based on a prediction equation that
included five of the six variables listed previously (cigarette
smoking was excluded), with coefficients derived using data from
the original Bukowski et al. population.
Statistical AnalysisData were weighted for the analysis. The analysis weights were
constructed in steps. First, weights were constructed that took into
account the sampling design, including staggered enrollment starts
across the 59 site hospitals, and different sampling probabilities
associated with the oversampling of live births ,32 wk gestation
and live births at $32 wk gestation to women of African descent.
Some women screened and determined eligible for the study were
not approached, and others were approached but did not consent.
Additional weight adjustments were constructed to account for this
nonresponse and utilized information collected at screening to
determine characteristics associated with the likelihood of partic-
ipating. The final analysis weights were constructed as the product
of these weighting factors. Details of the live birth sample selection
procedure and construction of the analysis weights have been
reported previously [16]. The weighted sample was intended
to approximate a random selection of live births in the five
geographic areas during the enrollment period, with proportions
according to GA and maternal race reflective of the population,
and to reduce potential bias associated with failing to include all
women eligible for participation.
The analysis was restricted to singleton stillbirths and live
births with non-missing birth weight and GA$20 wk at death or
delivery. Statistical significance for comparisons of characteristics
between stillbirths and live births was determined by the median
or chi-square test, and for comparisons between proportions
among stillbirths by the McNemar test. Crude and adjusted odds
ratios (ORs) and 95% confidence intervals were calculated from
logistic regression models. Primary results used all stillbirths and all
live births. Term stillbirth and live birth were defined as GA of
37 wk 0 d or more. To assess the association of SGA and LGA
with preterm stillbirth, the logistic model was restricted to preterm
stillbirth versus all live births. Multivariable models used to
estimate adjusted ORs included study site (five geographic areas)
and stillbirth risk factors known at the beginning of pregnancy
[21]. Approximately 10% of observations were missing values of
covariates included in the multivariable models and were omitted
from computations of adjusted ORs. Weighted analyses were
conducted using SUDAAN software version 10.0.1.
Results
The SCRN identified 953 women with stillbirths and 3,088
women with live births eligible for participation in the study. Of
these, 663 (70%) women with stillbirths and 1,932 (63%) women with
live births consented to participate. Women with stillbirths enrolled
in the study did not differ from those not enrolled on maternal age,
maternal race/ethnicity, insurance/method of payment, or GA at
delivery [21]. Women with live births enrolled in the study did not
differ from those not enrolled on maternal age and insurance/
method of payment. However, the proportion of Hispanic women
was larger among those enrolled than among those not enrolled (34%
versus 27%), and the proportions of non-Hispanic black and non-
Hispanic white women were smaller (21% versus 25% and 41%
versus 42%, respectively). Enrolled and non-enrolled women with
live births also differed on GA at delivery, with a larger proportion of
births $37 wk among those enrolled (75% versus 69%) [21]. From
the pregnancies of women enrolled, 527 singleton stillbirths and
1,821 singleton live births were included in these analyses (Figure 2).
Women who delivered stillbirths were more likely than women
who delivered live births to be non-Hispanic black (23% versus
11%, p,0.001), overweight (BMI$25 kg/m2) (57% versus 46%,
p,0.01), single (52% versus 39%, p,0.001), smokers before
pregnancy (21% versus 14%, p,0.01), and less educated (less than
12 y of school) (24% versus 19%, p,0.001). They were more likely
to have hypertension (11% versus 5%, p,0.001), to have
pregestational diabetes (5% versus 2%, p,0.001), and to be
nulliparous or to have had a prior stillbirth (p,0.001) (Table 1). As
expected, stillborn infants had lower GA (median 28 versus 39 wk,
p,0.001) and lower birth weight (p,0.001) and were more likely
to have congenital malformations than live born infants (13%
versus 3%, p,0.001) (Table 1).
Some variables used to compute individualized norms were
missing in a proportion of pregnancies and were set to mean,
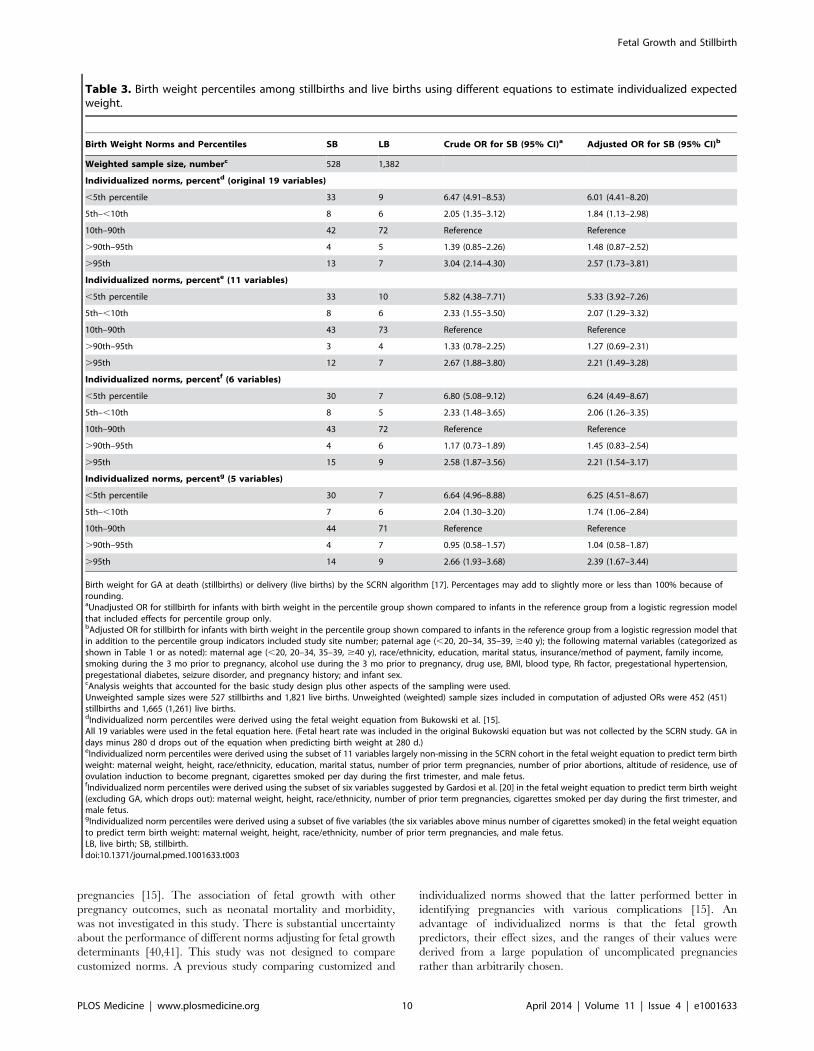
median, or weighted average (Table 2). However, in sensitivity
analyses, individualized norm percentiles derived using a subset of
11 variables largely non-missing in the cohort, or derived from a
subset of six or five variables suggested previously [20] (with or
without smoking), yielded patterns of association with stillbirth
similar to those derived using the full model (Table 3). Thus,
accounting for maternal smoking in computing individualized norms
did not affect the association between fetal growth abnormalities and
stillbirth. The five-variable model without smoking also showed that
the association between SGA and LGA and risk of stillbirth was
observed when individualized norms were derived without including
factors with potentially adverse effects on pregnancy. However, it
could be argued that smoking should not be used in individualization
of fetal growth because of its potential adverse effect on a given
pregnancy.
SGA pregnancies were associated with a statistically significant
3- to 4-fold increased risk of stillbirth compared to AGA
pregnancies using percentiles based on population, ultrasound,
and individualized norms (OR [95% CI]: 3.0 [2.2 to 4.0]; 4.7 [3.7
to 5.9]; 4.6 [3.6 to 5.9], respectively). LGA birth weight was
associated with a significantly increased risk of stillbirth using
percentiles derived from the ultrasound and individualized norms
(OR [95% CI]: 3.5 [2.4 to 5.0]; 2.3 [1.7 to 3.1], respectively), but
not using percentiles based on the population norms (OR [95%
CI]: 0.6 [0.4 to 1.0]). Abnormal fetal growth (SGA or LGA) was
identified in 25% of stillbirths using population norms and in twice
as many stillbirths using ultrasound (57%, p,0.001) and individ-
ualized norms (58%, p,0.001). The association between stillbirth
and SGA and LGA infants was mainly due to the high risk of
stillbirth among infants with birth weights in the ,5th and .95th
percentiles and was not substantially changed when adjusted for
stillbirth risk factors (Table 4).
SGA and LGA defined using the ultrasound and individualized
norms were also associated with significantly increased risk of
stillbirth in the subsets of pregnancies without pregestational
diabetes, gestational diabetes, hypertension, or preeclampsia; non-
anomalous births at more than 24 wk of gestation; and pregnan-
cies with optimal estimates of GA and time of death (Table 5).
Fetuses classified as SGA based on the population reference were
also at significantly increased risk of stillbirth in these subsets, but
those classified as LGA were not.
Among stillbirths identified as LGA by each of the norms, only
one had a GA of more than 40 wk, and LGA was observed among
preterm as well as term stillbirths. Hydrops was diagnosed among
11% (10/91), 14.5% (9/62), and 12.5% (3/24) of stillbirths
identified as LGA using the individualized, ultrasound, and
population norms, respectively. LGA was associated with stillbirth
in the subset of non-anomalous pregnancies, which excluded the
pregnancies with hydrops (Table 5).
Fetal Growth and Stillbirth
PLOS Medicine | www.plosmedicine.org 5 April 2014 | Volume 11 | Issue 4 | e1001633

Accounting for the time of death in stillbirths to determine fetal
age did influence the proportion of SGA and LGA infants
(Table 6). Increasing the accuracy of the fetal age estimate—from
using GA at delivery to GA at delivery minus 2 d to GA at
estimated time of fetal death—to determine weight-for-age
percentiles decreased the proportion of stillbirths classified as
SGA and increased the proportion classified as LGA using each of
the three norms of fetal growth. ORs for stillbirth associated with
SGA increased, and those associated with LGA decreased, when
GA at delivery was used to determine birth weight percentiles for
stillbirths instead of GA at death, regardless of which norms were
used.
SGA and LGA birth weights based on ultrasound and
individualized norm percentiles were significantly associated with
an increased risk of preterm as well as term stillbirth. Using
population norms, only SGA pregnancies were significantly
associated with preterm and term stillbirth (Table 7). There was
no significant difference in the GA distributions of stillbirths
Figure 2. Study enrollment and inclusion in analysis.doi:10.1371/journal.pmed.1001633.g002
Fetal Growth and Stillbirth
PLOS Medicine | www.plosmedicine.org 6 April 2014 | Volume 11 | Issue 4 | e1001633

Table 1. Characteristics of stillbirth and live birth pregnancies.
Category Characteristica Stillbirth Live Birth p-Valueb
Weighted sample size, numberc 528 1,382
Mother Maternal age at delivery, years 0.50
Median 26 26
Interquartile range 21 to 32 22 to 31
Paternal age at delivery, years 0.02
Median 28 29
Interquartile range 23 to 34 24 to 34
Maternal race/ethnicity, percent ,0.001
Non-Hispanic white 34 46
Non-Hispanic black 23 11
Hispanic 38 36
Other 6 8
BMI, percent 0.003
,18.5 4 3
18.5–24.9 40 50
25–29.9 26 23
30–34 15 12
$35 16 11
Maternal education, grade, percent ,0.001
0–11 24 19
12 31 26
$13 45 55
Marital status, percent ,0.001
Not married 26 15
Cohabiting 26 24
Married 48 60
Insurance, percent 0.02
No insurance 5 4
Any public/private assistance 55 49
VA/commercial health insurance/HMO 40 47
Family income last 12 mo, percent 0.13
Only public/private assistance 9 6
Assistance and personal income 38 38
Only personal income 53 56
Blood type, percent 0.31
A 31 34
B 14 11
O 51 51
AB 4 3
Rh negative, percent 9 11 0.20
Smoking status, percentd 0.003
Did not smoke 79 86
,10 cigarettes/day 11 7
$10 cigarettes/day 10 7
Alcohol consumption, percentd 0.60
Did not drink 58 58
Drank, no bingeing 21 23
Binged 21 19
Lifetime drug use, percent 0.03
Fetal Growth and Stillbirth
PLOS Medicine | www.plosmedicine.org 7 April 2014 | Volume 11 | Issue 4 | e1001633

classified as LGA versus AGA or SGA using ultrasound or
individualized norms.
Discussion
This study demonstrates that stillbirth is associated with both
growth restriction and excess growth. The extremes of SGA and
LGA (,5th and .95th percentiles) were associated with the
highest risk of stillbirth.
StrengthsThe strengths of this study lie in its geographically defined
population-based design capturing live births and stillbirths, the
large number of stillbirths evaluated, the accurate estimation of
GA at death in stillbirths, the assessment of fetal growth using
different fetal growth standards, and the ability to examine the
contribution of factors affecting both birth weight and the risk of
stillbirth. The systematic and standardized estimation of time of
death and thus GA at death for stillbirths allowed for more accurate
assessment of the association between birth weight and stillbirth
and, consequently, of the association of stillbirth with LGA.
Prior studies have either not accounted for the interval between
time of death and time of delivery of stillbirths [22–27] or have
assigned an arbitrary interval of 2 d from GA at death to GA at
delivery [28–30]. These approaches substantially overestimate GA
at death [17,31–33] and thus result in overestimation of the
proportion of SGA infants and underestimation of the proportion
of LGA infants.
Studies evaluating the interval between death and delivery have
shown that in 25%–50% of stillbirths the interval was longer than
Table 1. Cont.
Category Characteristica Stillbirth Live Birth p-Valueb
Never 66 69
Ever, without addiction 29 28
Ever, with addiction 5 2
Medical history, percent
Hypertension 11 5 ,0.001
Diabetes 5 2 ,0.001
Seizure disorder 3 2 0.23
Pregnancy history, percent ,0.001
Nulliparous; never pregnant or only elective terminations 36 30
Nulliparous with previous losses 11 5
Multiparous with no previous losses at ,20 wk or stillbirths 31 46
Multiparous with no stillbirth but previous losses at ,20 wk 14 17
Multiparous with stillbirth 7 2
Infant GA, weekse ,0.001
Median 28 39
Interquartile range 23 to 36 38 to 40
GA category, percent ,0.001
20–23 wk 33 ,1
24–27 wk 17 ,1
28–31 wk 11 1
32–36 wk 21 9
37+ wk 18 89
Birth weight, grams ,0.001
Median 992 3,317
Interquartile range 454 to 2,468 2,978 to 3,628
Male sex, percent 52 50 0.55
Congenital anomaly, percent 13 3 ,0.001
aInformation was missing as follows (unweighted missing n for stillbirths and live births, respectively): paternal age (44 and 98), maternal race/ethnicity (1 stillbirth), BMI(21 and 42), maternal education (36 and 82), marital status (34 and 76), insurance (3 and 4), family income (40 and 90), blood type (5 and 6), Rh factor (2 and 6), cigarettesmoking (34 and 78), alcohol consumption (37 and 81), drug use (38 and 91), hypertension (2 and 5), diabetes (1 and 5), seizure disorder (2 and 6), male sex (5 and 2).Percentages may not sum to 100 because of rounding.bp-Value for a difference between stillbirths and live births by the median test (continuous variables) or the Wald chi-square test (categorical variables).cAnalysis weights that accounted for the basic study design plus other aspects of the sampling were used.Unweighted sample sizes were 527 stillbirths and 1,821 live births.dAverage number of cigarettes smoked per day during the 3 mo prior to pregnancy or alcohol consumption during the 3 mo prior to pregnancy.Drank without bingeing was defined as 0–6 drinks in a typical week and no occasion where four or more drinks were consumed in a single time period (‘‘binge’’).Bingeing was defined as at least one binge and/or seven or more drinks in a typical week.eGA at death (stillbirths) or delivery (live births) by the SCRN algorithm [17].HMO, health maintenance organization; VA, Veterans Affairs.doi:10.1371/journal.pmed.1001633.t001
Fetal Growth and Stillbirth
PLOS Medicine | www.plosmedicine.org 8 April 2014 | Volume 11 | Issue 4 | e1001633

7 d [31–33]. Using the algorithm defined by the SCRN, over 40%
of deaths were estimated to have occurred at least a week before
delivery [17]. Thus, increasing the accuracy of the fetal age estimate
in stillbirths, from GA at delivery to GA at delivery minus 2 d to GA
at estimated time of death, decreased the proportion of stillbirths
classified as SGA and increased the proportion classified as LGA.
Many prior studies of stillbirth have focused exclusively on the
association of stillbirth with SGA [22–24,28–30]. They compared
risk of stillbirth in women with and without SGA infants, including
LGA infants in the non-SGA comparison group. This approach
resulted in failure to identify the association between LGA and
stillbirth and also decreased the strength of the association of
stillbirth with SGA. A retrospective study analyzed the association
between both SGA and LGA and stillbirth, using population
norms derived from the study population [27]. In that study, the
proportion of SGA infants was 25% among stillbirths and 10%
among live births, but the proportions of LGA infants were the
same among stillbirths and live births, both 10%. That study was
also limited by incomplete account of the confounding effects of
stillbirth risk factors such as diabetes, maternal weight, hyperten-
sion, and smoking. Another study of the association between birth
weight and risk of stillbirth found that birth weight in excess of
4,500 g was associated with increased risk of stillbirth [34].
However, infants with birth weight greater than 4,500 g are
almost exclusively post-term and thus at risk of stillbirth due to
prolonged duration of pregnancy [18,19,35].
A recent case series reported a higher than expected proportion
of LGA among stillbirths. However, the majority of the LGA
stillbirths in this series were related to fetal hydrops or maternal
diabetes [36].
In our study, abnormal fetal growth was identified in twice as
many stillbirths using ultrasound and individualized norms as
when using population norms. Although SGA was associated with
stillbirth based on all three norms, the association of stillbirth with
LGA was observed only when using ultrasound or individualized
norms. Differences in design may account for these results. The
population norms by Alexander et al. are commonly used and were
developed using birth weights from all pregnancies resulting in single
live births, including those with complications associated with growth
abnormalities, resulting in a wide range of birth weights between the
10th and 90th percentiles, classified as AGA [18]. In contrast, both
the ultrasound and the individualized norms were derived from a
cohort of uncomplicated pregnancies. Furthermore, the individual-
ized norms account for maternal and pregnancy characteristics to
the extent they affect birth weight in uncomplicated live born
pregnancies, which may result in more accurate assessment of the
expected fetal weight and deviations from expected size.
In a large population of uncomplicated pregnancies, population
reference percentiles and, to a lesser degree, ultrasound norms
were shown to overestimate the proportion of AGA and to
underestimate the proportion of LGA infants [15]. Consistent with
those findings, in this study only 8% of live births and 4% of
stillbirths were classified as LGA by population norms. Using
individualized norms, 12% of live births and 17% of stillbirths
were classified as LGA. The underestimation of LGA and the high
proportion of stillbirths classified as AGA by population norms
may explain the observed lack of association between stillbirth and
LGA based on population norms.
In individualized norms, the predictors of fetal growth, the sizes
of their effects, and the ranges of their values were derived from a
carefully selected population of almost 10,000 pregnancies without
pregnancy or neonatal complications [15]. Among those predic-
tors are ones with known association with SGA, such as smoking.
This is likely because the relationship between smoking and fetal
growth is complex. Smoking is associated with SGA, but the
majority of those SGA pregnancies will not have adverse outcomes
[37]. Smoking is also associated with a decreased risk of
preeclampsia, a major risk factor for SGA [38]. Because of the
opposing effects of smoking on birth weight, smoking was taken
into account in individualization of fetal growth, despite its clear
adverse effect on pregnancy outcome. Consistent with these
observations, our sensitivity analysis showed that individualized
norms with and without smoking, as well as with all the predictors,
had similar patterns of association with stillbirth (Table 3). However,
an argument might be made in general against accounting for
maternal smoking in predicting optimal individualized expected
birth weight, as smoking may have an adverse effect on a particular
pregnancy, and the effect of smoking on an individual pregnancy is
difficult to determine. The effect of smoking on fetal growth and
adverse pregnancy outcome is complex because of its dual effect on
both SGA and pregnancy complications due to a positive
association of SGA directly with smoking, but a negative association
indirectly through lower risk of preeclampsia. Additionally, the
effect of smoking on SGA and complications of pregnancy is
confounded by co-exposures and other characteristics, and is
unclear with very low levels of exposure.
Consistent with prior studies, the findings of this study show that
population norms are inferior to norms derived from uncompli-
cated populations, either ultrasound or individualized norms [39].
The ultrasound and individualized norms performed similarly
in identifying pregnancies at risk of stillbirth. Both similarly
detected SGA pregnancies associated with stillbirth in this study,
and both, in a prior study, classified approximately 10% of
uncomplicated pregnancies as SGA [15]. Ultrasound norms
appear to underestimate the proportion of LGA pregnancies,
both among stillbirth in this study and among uncomplicated
Table 2. Variables used to compute individualized expectedbirth weight at 280 d for SCRN singleton stillbirths and livebirths (unweighted n = 2,348).
Variable N N Missing
Maternal weight 2,293 55
Maternal height 2,334 14
Race/ethnicity 2,347 1
Maternal education 2,230 118
Marital status 2,238 110
Number of prior term pregnancies 2,345 3
Number of prior abortions 2,347 1
Altitude of residence 2,348 0
Cigarettes/day first trimester 2,236 112
Ovulation induction 2,346 2
Nuchal translucency size 76 2,272
Pregnancy-associated plasma protein A 103 2,245
Free beta human chorionic gonadotropin 42 2,306
Alpha-fetoprotein 870 1,478
Inhibin A 576 1,772
Total human chorionic gonadotropin 838 1,510
Unconjugated estriol 831 1,517
First trimester size (DeltaGA) 621 1,727
Male fetus 2,341 7
doi:10.1371/journal.pmed.1001633.t002
Fetal Growth and Stillbirth
PLOS Medicine | www.plosmedicine.org 9 April 2014 | Volume 11 | Issue 4 | e1001633
pregnancies [15]. The association of fetal growth with other
pregnancy outcomes, such as neonatal mortality and morbidity,
was not investigated in this study. There is substantial uncertainty
about the performance of different norms adjusting for fetal growth
determinants [40,41]. This study was not designed to compare
customized norms. A previous study comparing customized and
individualized norms showed that the latter performed better in
identifying pregnancies with various complications [15]. An
advantage of individualized norms is that the fetal growth
predictors, their effect sizes, and the ranges of their values were
derived from a large population of uncomplicated pregnancies
rather than arbitrarily chosen.
Table 3. Birth weight percentiles among stillbirths and live births using different equations to estimate individualized expectedweight.
Birth Weight Norms and Percentiles SB LB Crude OR for SB (95% CI)a Adjusted OR for SB (95% CI)b
Weighted sample size, numberc 528 1,382
Individualized norms, percentd (original 19 variables)
,5th percentile 33 9 6.47 (4.91–8.53) 6.01 (4.41–8.20)
5th–,10th 8 6 2.05 (1.35–3.12) 1.84 (1.13–2.98)
10th–90th 42 72 Reference Reference
.90th–95th 4 5 1.39 (0.85–2.26) 1.48 (0.87–2.52)
.95th 13 7 3.04 (2.14–4.30) 2.57 (1.73–3.81)
Individualized norms, percente (11 variables)
,5th percentile 33 10 5.82 (4.38–7.71) 5.33 (3.92–7.26)
5th–,10th 8 6 2.33 (1.55–3.50) 2.07 (1.29–3.32)
10th–90th 43 73 Reference Reference
.90th–95th 3 4 1.33 (0.78–2.25) 1.27 (0.69–2.31)
.95th 12 7 2.67 (1.88–3.80) 2.21 (1.49–3.28)
Individualized norms, percentf (6 variables)
,5th percentile 30 7 6.80 (5.08–9.12) 6.24 (4.49–8.67)
5th–,10th 8 5 2.33 (1.48–3.65) 2.06 (1.26–3.35)
10th–90th 43 72 Reference Reference
.90th–95th 4 6 1.17 (0.73–1.89) 1.45 (0.83–2.54)
.95th 15 9 2.58 (1.87–3.56) 2.21 (1.54–3.17)
Individualized norms, percentg (5 variables)
,5th percentile 30 7 6.64 (4.96–8.88) 6.25 (4.51–8.67)
5th–,10th 7 6 2.04 (1.30–3.20) 1.74 (1.06–2.84)
10th–90th 44 71 Reference Reference
.90th–95th 4 7 0.95 (0.58–1.57) 1.04 (0.58–1.87)
.95th 14 9 2.66 (1.93–3.68) 2.39 (1.67–3.44)
Birth weight for GA at death (stillbirths) or delivery (live births) by the SCRN algorithm [17]. Percentages may add to slightly more or less than 100% because ofrounding.aUnadjusted OR for stillbirth for infants with birth weight in the percentile group shown compared to infants in the reference group from a logistic regression modelthat included effects for percentile group only.bAdjusted OR for stillbirth for infants with birth weight in the percentile group shown compared to infants in the reference group from a logistic regression model thatin addition to the percentile group indicators included study site number; paternal age (,20, 20–34, 35–39, $40 y); the following maternal variables (categorized asshown in Table 1 or as noted): maternal age (,20, 20–34, 35–39, $40 y), race/ethnicity, education, marital status, insurance/method of payment, family income,smoking during the 3 mo prior to pregnancy, alcohol use during the 3 mo prior to pregnancy, drug use, BMI, blood type, Rh factor, pregestational hypertension,pregestational diabetes, seizure disorder, and pregnancy history; and infant sex.cAnalysis weights that accounted for the basic study design plus other aspects of the sampling were used.Unweighted sample sizes were 527 stillbirths and 1,821 live births. Unweighted (weighted) sample sizes included in computation of adjusted ORs were 452 (451)stillbirths and 1,665 (1,261) live births.dIndividualized norm percentiles were derived using the fetal weight equation from Bukowski et al. [15].All 19 variables were used in the fetal equation here. (Fetal heart rate was included in the original Bukowski equation but was not collected by the SCRN study. GA indays minus 280 d drops out of the equation when predicting birth weight at 280 d.)eIndividualized norm percentiles were derived using the subset of 11 variables largely non-missing in the SCRN cohort in the fetal weight equation to predict term birthweight: maternal weight, height, race/ethnicity, education, marital status, number of prior term pregnancies, number of prior abortions, altitude of residence, use ofovulation induction to become pregnant, cigarettes smoked per day during the first trimester, and male fetus.fIndividualized norm percentiles were derived using the subset of six variables suggested by Gardosi et al. [20] in the fetal weight equation to predict term birth weight(excluding GA, which drops out): maternal weight, height, race/ethnicity, number of prior term pregnancies, cigarettes smoked per day during the first trimester, andmale fetus.gIndividualized norm percentiles were derived using a subset of five variables (the six variables above minus number of cigarettes smoked) in the fetal weight equationto predict term birth weight: maternal weight, height, race/ethnicity, number of prior term pregnancies, and male fetus.LB, live birth; SB, stillbirth.doi:10.1371/journal.pmed.1001633.t003
Fetal Growth and Stillbirth
PLOS Medicine | www.plosmedicine.org 10 April 2014 | Volume 11 | Issue 4 | e1001633

The strength and pattern of the association between fetal
growth and risk of stillbirth was similar in term and preterm
pregnancies. SGA and LGA birth weights were associated with
increased risk of stillbirth in preterm as well as term pregnancies
using ultrasound or individualized norms. Using population
norms, only SGA pregnancies had an increased risk of stillbirth,
both preterm and term. The distribution of GA at death was
similar among stillbirths classified as SGA, AGA, and LGA using
ultrasound norms and also when classified using individualized
norms, and the association of stillbirth with SGA and with LGA
was observed when using both of these norms.
The association of LGA with stillbirth in this study was not
related to post-term GA or known conditions that increase fetal
weight and risk of stillbirth. Among stillbirths classified as LGA,
only one pregnancy was greater than 40 wk. LGA was also
associated with stillbirth among the subset of pregnancies that
excluded hydrops and other congenital abnormalities. Because the
relationship between congenital abnormalities and birth weight is
complex and depends on the type of abnormality, we conducted
analyses in pregnancies with and without congenital abnormalities.
Both showed similar patterns of associations. Although the effect of
maceration on a stillbirth’s birth weight is uncertain, if birth
Table 4. Birth weight percentiles among stillbirths and live births.
Birth Weight Norms and Percentiles SB LB Crude OR for SB (95% CI)a Adjusted OR for SB (95% CI)b
Weighted sample size, numberc 528 1,382
Individualized norms, percentd
,5th percentile 33 9 6.47 (4.91–8.53) 6.01 (4.41–8.20)
5th–,10th 8 6 2.05 (1.35–3.12) 1.84 (1.13–2.98)
10th–90th 42 72 Reference Reference
.90th–95th 4 5 1.39 (0.85–2.26) 1.48 (0.87–2.52)
.95th 13 7 3.04 (2.14–4.30) 2.57 (1.73–3.81)
,10th 41 15 4.59 (3.59–5.88) 4.39 (3.34–5.78)
.90th 17 12 2.33 (1.73–3.14) 2.13 (1.52–2.97)
Ultrasound norms, percente
,5th percentile 36 10 6.32 (4.86–8.22) 5.44 (4.03–7.33)
5th–,10th 9 7 2.30 (1.54–3.43) 2.33 (1.50–3.62)
10th–90th 43 77 Reference Reference
.90th–95th 4 3 2.50 (1.43–4.37) 1.99 (1.04–3.81)
.95th 8 3 4.39 (2.79–6.89) 3.71 (2.23–6.16)
,10th 45 17 4.67 (3.69–5.92) 4.27 (3.27–5.59)
.90th 12 6 3.48 (2.42–5.01) 2.90 (1.92–4.37)
Population norms, percentf
,5th percentile 12 4 3.49 (2.36–5.16) 3.05 (1.99–4.67)
5th–,10th 9 4 2.51 (1.64–3.84) 2.18 (1.31–3.65)
10th–90th 75 84 Reference 1.00 (1.00–1.00)
.90th–95th 2 4 0.48 (0.22–1.05) 0.55 (0.22–1.40)
.95th 3 4 0.75 (0.42–1.32) 0.70 (0.40–1.22)
,10th 20 8 3.00 (2.22–4.04) 2.62 (1.86–3.68)
.90th 4 8 0.63 (0.40–1.01) 0.64 (0.39–1.05)
Birth weight for GA at death (stillbirths) or delivery (live births) by the SCRN algorithm [17]. Percentages may add to slightly more or less than 100% because ofrounding.aUnadjusted OR for stillbirth for infants with birth weight in the percentile group shown compared to infants in the reference group from a logistic regression modelthat included effects for percentile group only.bAdjusted OR for stillbirth for infants with birth weight in the percentile group shown compared to infants in the reference group from a logistic regression model thatin addition to the percentile group indicators included study site number; paternal age (,20, 20–34, 35–39, $40 y); the following maternal variables (categorized asshown in Table 1 or as noted): maternal age (,20, 20–34, 35–39, $40 y), race/ethnicity, education, marital status, insurance, family income, smoking during the 3 moprior to pregnancy, alcohol use during the 3 mo prior to pregnancy, drug use, BMI, blood type, Rh factor, pregestational hypertension, pregestational diabetes, seizuredisorder, and pregnancy history; and infant sex.cAnalysis weights that accounted for the basic study design plus other aspects of the sampling were used.Unweighted sample sizes were 527 stillbirths and 1,821 live births. Unweighted (weighted) sample sizes included in computation of adjusted ORs were 452 (451)stillbirths and 1,665 (1,261) live births.dIndividualized norm percentiles were derived using the fetal weight for GA equation from Bukowski et al. [15].eUltrasound norm percentiles were derived using the fetal weight for GA equation and standard error from Hadlock et al. [19].fAlexander et al. population norm percentiles of birth weight for GA were used [18].Simple linear interpolation was used with the Alexander birth weight percentiles reported for completed weeks of GA in whole weeks to derive birth weight percentilesfor GA in weeks and days.LB, live birth; SB, stillbirth.doi:10.1371/journal.pmed.1001633.t004
Fetal Growth and Stillbirth
PLOS Medicine | www.plosmedicine.org 11 April 2014 | Volume 11 | Issue 4 | e1001633

Ta
ble
5.
Bir
thw
eig
ht
pe
rce
nti
les
amo
ng
sub
sets
of
still
bir
ths
and
live
bir
ths.
Bir
thW
eig
ht
No
rms
an
dP
erc
en
tile
s
Su
bse
tw
ith
ou
tM
ate
rna
lD
iab
ete
so
rH
yp
ert
en
sio
n/P
ree
cla
mp
sia
No
n-A
no
ma
lou
sS
ing
leto
ns
$2
4w
kG
est
ati
on
Su
bse
tw
ith
Op
tim
al
Est
ima
tes
of
GA
a
SB
LB
Cru
de
OR
for
SB
(95
%C
I)b
SB
LB
Cru
de
OR
for
SB
(95
%C
I)b
SB
LB
Cru
de
OR
for
SB
(95
%C
I)b
We
igh
ted
sam
ple
siz
e,
nu
mb
erc
38
21
,07
93
10
1,3
39
20
09
72
Ind
ivid
ua
liz
ed
no
rms,
pe
rce
ntd
,5
thp
erc
en
tile
30
86
.14
(4.4
0–
8.5
6)
36
87
.50
(5.4
4–
10
.36
)2
88
5.5
0(3
.63
–8
.33
)
5th
–,
10
th8
72
.08
(1.3
0–
3.3
4)
97
2.4
0(1
.47
–3
.92
)1
06
2.4
5(1
.36
–4
.43
)
10
th–
90
th4
57
4R
efe
ren
ce4
17
2R
efe
ren
ce4
67
3R
efe
ren
ce
.9
0th
–9
5th
55
1.4
6(0
.84
–2
.53
)3
51
.12
(0.5
8–
2.1
5)
46
1.0
0(0
.45
–2
.19
)
.9
5th
13
73
.15
(2.1
0–
4.7
4)
10
72
.35
(1.5
0–
3.6
9)
13
73
.00
(1.7
9–
5.0
0)
,1
0th
38
15
4.3
2(3
.23
–5
.77
)4
61
55
.28
(3.9
5–
7.0
6)
37
14
4.1
6(2
.87
–6
.02
)
.9
0th
17
12
2.4
0(1
.70
–3
.38
)1
31
31
.82
(1.2
3–
2.6
8)
17
13
2.0
7(1
.32
–3
.23
)
Ult
raso
un
dn
orm
s,p
erc
en
te
,5
thp
erc
en
tile
33
96
.02
(4.4
1–
8.2
3)
38
10
6.7
1(4
.94
–9
.13
)3
21
05
.56
(3.7
7–
8.2
1)
5th
–,
10
th1
08
2.1
6(1
.38
–3
.39
)1
17
2.7
1(1
.71
–4
.31
)9
72
.22
(1.2
3–
4.0
0)
10
th–
90
th4
57
8R
efe
ren
ce4
47
7R
efe
ren
ce4
77
7R
efe
ren
ce
.9
0th
–9
5th
53
2.8
8(1
.52
–5
.45
)3
31
.48
(0.6
7–
3.2
8)
53
2.9
4(1
.40
–6
.16
)
.9
5th
73
4.5
9(2
.68
–7
.86
)5
32
.95
(1.6
2–
5.3
6)
63
3.3
1(1
.62
–6
.77
)
,1
0th
43
17
4.3
1(3
.27
–5
.68
)4
81
75
.06
(3.8
3–
6.6
9)
42
17
4.1
5(2
.91
–5
.90
)
.9
0th
12
53
.74
(2.4
4–
5.7
3)
86
2.2
4(1
.37
–3
.65
)1
26
3.1
3(1
.83
–5
.35
)
Po
pu
lati
on
no
rms,
pe
rce
ntf
,5
thp
erc
en
tile
93
3.0
0(1
.83
–4
.92
)1
14
3.6
0(2
.26
–5
.73
)1
33
4.0
6(2
.31
–7
.15
)
5th
–,
10
th8
42
.14
(1.2
9–
3.5
4)
10
42
.74
(1.6
9–
4.4
6)
54
1.3
5(0
.65
–2
.81
)
10
th–
90
th7
98
5R
efe
ren
ce7
58
4R
efe
ren
ce7
98
4R
efe
ren
ce
.9
0th
–9
5th
24
0.6
2(0
.28
–1
.36
),
14
0.1
8(0
.04
–0
.75
),
14
0.1
2(0
.02
–0
.90
)
.9
5th
24
0.5
0(0
.23
–1
.08
)4
50
.93
(0.4
9–
1.7
6)
35
0.7
3(0
.32
–1
.65
)
Fetal Growth and Stillbirth
PLOS Medicine | www.plosmedicine.org 12 April 2014 | Volume 11 | Issue 4 | e1001633

Ta
ble
5.
Co
nt.
Bir
thW
eig
ht
No
rms
an
dP
erc
en
tile
s
Su
bse
tw
ith
ou
tM
ate
rna
lD
iab
ete
so
rH
yp
ert
en
sio
n/P
ree
cla
mp
sia
No
n-A
no
ma
lou
sS
ing
leto
ns
$2
4w
kG
est
ati
on
Su
bse
tw
ith
Op
tim
al
Est
ima
tes
of
GA
a
SB
LB
Cru
de
OR
for
SB
(95
%C
I)b
SB
LB
Cru
de
OR
for
SB
(95
%C
I)b
SB
LB
Cru
de
OR
for
SB
(95
%C
I)b
,1
0th
17
72
.53
(1.7
6–
3.6
3)
21
73
.15
(2.2
2–
4.4
7)
18
72
.62
(1.6
7–
4.1
1)
.9
0th
48
0.5
6(0
.32
–0
.97
)4
80
.60
(0.3
3–
1.0
7)
49
0.4
6(0
.21
–0
.97
)
Bir
thw
eig
ht
for
GA
atd
eat
h(s
tillb
irth
s)o
rd
eliv
ery
(liv
eb
irth
s)b
yth
eSC
RN
alg
ori
thm
[17
].St
illb
irth
san
dliv
eb
irth
sin
wo
me
nw
ith
pre
ge
stat
ion
al(t
ype
1o
rty
pe
2)
or
ge
stat
ion
ald
iab
ete
so
rw
ith
chro
nic
hyp
ert
en
sio
no
rg
est
atio
nal
hyp
ert
en
sio
n/p
ree
clam
psi
aw
ere
exc
lud
ed
fro
mth
esu
bse
tw
ith
ou
tm
ate
rnal
dia
be
tes.
Still
bir
ths
and
live
bir
ths
wit
hm
alfo
rmat
ion
so
rch
rom
oso
mal
abn
orm
alit
ies
or
wh
ow
ere
est
imat
ed
tob
e,
24
wk
ge
stat
ion
atd
eat
ho
rd
eliv
ery
we
ree
xclu
de
dfr
om
the
no
n-a
no
mal
ou
ssu
bse
t.T
he
sub
set
wit
ho
pti
mal
est
imat
ion
of
GA
isd
efi
ne
db
elo
w.
Pe
rce
nta
ge
sm
ayad
dto
slig
htl
ym
ore
or
less
than
10
0%
be
cau
seo
fro
un
din
g.
aIn
this
sub
set,
GA
was
est
imat
ed
usi
ng
ane
xpe
cte
dd
ue
dat
eb
ase
do
nan
ult
raso
un
de
xam
inat
ion
at#
20
wk
6d
or
last
me
nst
rual
pe
rio
dth
atag
ree
dw
ith
that
ult
raso
un
d,a
nd
for
still
bir
ths
the
rew
asan
inte
rval
of
7d
or
few
er
be
twe
en
the
dat
eth
efe
tus
was
last
reco
rde
dal
ive
and
the
dat
efe
tal
de
mis
ew
asfi
rst
rep
ort
ed
.b
Un
adju
ste
dO
Rfo
rst
illb
irth
for
infa
nts
wit
hb
irth
we
igh
tin
the
pe
rce
nti
leg
rou
psh
ow
nco
mp
are
dto
infa
nts
inth
ere
fere
nce
gro
up
fro
ma
log
isti
cre
gre
ssio
nm
od
el
that
incl
ud
ed
eff
ect
sfo
rp
erc
en
tile
gro
up
on
ly.
Th
eO
Rs
adju
ste
dfo
rst
illb
irth
risk
fact
ors
asd
efi
ne
din
Tab
le4
,fo
otn
ote
b(e
xclu
din
gad
just
me
nt
for
pre
ge
stat
ion
alh
ype
rte
nsi
on
and
pre
ge
stat
ion
ald
iab
ete
sin
the
sub
set
wit
ho
ut
mat
ern
ald
iab
ete
so
rh
ype
rte
nsi
on
),w
ere
sim
ilar
and
are
no
tsh
ow
n.
cA
nal
ysis
we
igh
tsth
atac
cou
nte
dfo
rth
eb
asic
stu
dy
de
sig
np
lus
oth
er
asp
ect
so
fth
esa
mp
ling
we
reu
sed
.In
the
sub
set
of
pre
gn
anci
es
wit
ho
ut
mat
ern
ald
iab
ete
so
rh
ype
rte
nsi
on
/pre
ecl
amp
sia,
un
we
igh
ted
sam
ple
size
sw
ere
38
4st
illb
irth
san
d1
,40
2liv
eb
irth
s.In
the
sub
set
of
no
n-a
no
mal
ou
ssi
ng
leto
ns
$2
4w
kg
est
atio
n,u
nw
eig
hte
dsa
mp
lesi
zes
we
re3
15
still
bir
ths
and
1,6
61
live
bir
ths.
Inth
esu
bse
tw
ith
op
tim
ale
stim
atio
no
fG
A,
un
we
igh
ted
sam
ple
size
sw
ere
19
9st
illb
irth
san
d1
,22
6liv
eb
irth
s.d
Ind
ivid
ual
ize
dn
orm
pe
rce
nti
les
we
red
eri
ved
usi
ng
the
feta
lw
eig
ht
for
GA
eq
uat
ion
fro
mB
uko
wsk
ie
tal
.[1
5].
eU
ltra
sou
nd
no
rmp
erc
en
tile
sw
ere
de
rive
du
sin
gth
efe
tal
we
igh
tfo
rG
Ae
qu
atio
nan
dst
and
ard
err
or
fro
mH
adlo
cke
tal
.[1
9].
f Ale
xan
de
re
tal
.p
op
ula
tio
nn
orm
pe
rce
nti
les
of
bir
thw
eig
ht
for
GA
we
reu
sed
[18
].Si
mp
lelin
ear
inte
rpo
lati
on
was
use
dw
ith
the
Ale
xan
de
re
tal
.b
irth
we
igh
tp
erc
en
tile
sre
po
rte
dfo
rco
mp
lete
dw
ee
kso
fG
Ain
wh
ole
we
eks
tod
eri
veb
irth
we
igh
tp
erc
en
tile
sfo
rG
Ain
we
eks
and
day
s.LB
,liv
eb
irth
;SB
,st
illb
irth
.d
oi:1
0.1
37
1/j
ou
rnal
.pm
ed
.10
01
63
3.t
00
5
Fetal Growth and Stillbirth
PLOS Medicine | www.plosmedicine.org 13 April 2014 | Volume 11 | Issue 4 | e1001633

weight is decreased in macerated stillbirths, this would decrease the
strength of the association with LGA. However, the associations
between SGA and LGA and risk of stillbirth were also observed in
the subset with optimal estimates of fetal age that included non-
macerated stillbirth infants with a short interval of less than 7 d
between the time they were last reported alive and the time they
were first identified as demised. Results of the subset analysis of
pregnancies without pregestational or gestational diabetes or
hypertension also showed similar associations with LGA.
Screening for gestational diabetes is performed in the US at 24
to 28 wk. Women at increased risk with a history of gestational
diabetes, impaired glucose metabolism, or obesity are additionally
screened in early pregnancy [42]. It is possible that a small
proportion of women without those risk factors and delivering
before routine screening was performed were not diagnosed,
although those with LGA stillbirth are also recommended to be
screened after stillbirth. However, it is unlikely that any
misclassification would significantly affect the study findings, as
the patterns of association between fetal growth and risk of
stillbirth observed in the subset without pregestational or
gestational diabetes and in the entire study population, including
women with diabetes, were very similar.
Table 6. Birth weight percentiles in relation to different GA estimates among singleton stillbirths.
Birth Weight Norms and Percentiles Stillbirths Live Births Using Percentiles Based on GA at Delivery
GA atDeath
GA at DeliveryMinus 2 d
GA atDelivery
Crude ORfor SB (95% CI)a
Adjusted ORfor SB (95% CI)b
Weighted sample size, numberc 528 561 570 1,382
Individualized norms, percentd
,5th percentile 33 44 48 9 11.25 (8.62–14.67) 11.27 (8.40–15.12)
5th–,10th 8 6 6 6 2.04 (1.33–3.14) 2.22 (1.36–3.62)
10th–90th 42 37 35 72 Reference Reference
.90th–95th 4 3 2 5 0.87 (0.48–1.55) 1.02 (0.55–1.87)
.95th 13 11 8 7 2.48 (1.69–3.64) 2.15 (1.40–3.29)
,10th 41 50 54 15 7.34 (5.77–9.33) 7.70 (5.91–10.04)
.90th 17 14 11 12 1.79 (1.28–2.49) 1.68 (1.16–2.42)
Ultrasound norms, percente
,5th percentile 36 45 51 10 11.34 (8.79–14.63) 10.79 (8.11–14.35)
5th–,10th 9 8 7 7 2.17 (1.43–3.31) 2.24 (1.41–3.57)
10th–90th 43 38 34 77 Reference Reference
.90th–95th 4 2 2 3 1.62 (0.83–3.18) 1.56 (0.76–3.19)
.95th 8 7 5 3 3.87 (2.37–6.34) 2.98 (1.73–5.12)
,10th 45 53 58 17 7.58 (6.01–9.57) 7.53 (5.80–9.78)
.90th 12 9 8 6 2.79 (1.86–4.19) 2.31 (1.48–3.61)
Population norms, percentf
,5th percentile 12 23 25 4 8.98 (6.36–12.68) 9.20 (6.33–13.39)
5th–,10th 9 9 9 4 3.10 (2.06–4.66) 2.90 (1.78–4.72)
10th–90th 75 65 63 84 Reference Reference
.90th–95th 2 1 ,1 4 0.34 (0.13–0.89) 0.53 (0.19–1.45)
.95th 3 2 2 4 0.67 (0.36–1.25) 0.62 (0.34–1.15)
,10th 20 31 34 8 6.01 (4.59–7.88) 6.02 (4.44–8.16)
.90th 4 4 3 8 0.53 (0.31–0.89) 0.58 (0.34–1.01)
Birth weight percentiles for stillbirths $20 wk gestation using three GA estimates: GA at delivery, GA at delivery minus 2 d, and GA at death estimated using the SCRNalgorithm [17]. Percentages may add to slightly more or less than 100% because of rounding.aUnadjusted OR for stillbirth for infants with birth weight in the percentile group shown compared to infants in the reference group from a logistic regression modelthat included effects for percentile group only.bAdjusted OR for stillbirth for infants with birth weight in the percentile group shown compared to infants in the reference group from a logistic regression model thatin addition to the percentile group indicators included study site number; paternal age (,20, 20–34, 35–39, $40 y); the following maternal variables (categorized asshown in Table 1 or as noted): maternal age (,20, 20–34, 35–39, $40 y), race/ethnicity, education, marital status, insurance, family income, smoking during the 3 moprior to pregnancy, alcohol use during the 3 mo prior to pregnancy, drug use, BMI, blood type, Rh factor, pregestational hypertension, pregestational diabetes, seizuredisorder, and pregnancy history; and infant sex.cAnalysis weights that accounted for the basic study design plus other aspects of the sampling were used.Unweighted sample sizes were 527, 561, and 570 stillbirths for GA at death, GA at delivery minus 2 d, and GA at delivery, respectively, and 1,821 live births. Unweighted(weighted) sample sizes included in computation of adjusted ORs were 491 (489) stillbirths and 1,665 (1,261) live births.dIndividualized norm percentiles were derived using the fetal weight for GA equation from Bukowski et al. [15].eUltrasound norm percentiles were derived using the fetal weight for GA equation and standard error from Hadlock et al. [19].fAlexander et al. population norm percentiles of birth weight for GA were used [18].Simple linear interpolation was used with the Alexander et al. birth weight percentiles reported for completed weeks of GA in whole weeks to derive birth weightpercentiles for GA in weeks and days.doi:10.1371/journal.pmed.1001633.t006
Fetal Growth and Stillbirth
PLOS Medicine | www.plosmedicine.org 14 April 2014 | Volume 11 | Issue 4 | e1001633

LimitationsA limitation of this study is that retrospective review of medical
records was used to obtain birth weight, criteria for GA estimation,
and certain maternal characteristics. However, these variables
were recorded in medical records prospectively and thus were
unlikely to be subject to substantial bias. Many of the character-
istics used to determine individualized expected birth weight were
missing and were replaced with reference values. However,
individualized norms based on subsets of non-missing variables
showed very similar findings (Table 3). In this study 70% of cases
and 63% of controls agreed to participate. Analysis weights
accounted for the observed differences between consenting and
non-consenting women [16].
The mechanism of stillbirth in LGA pregnancies is not known.
However, it has been suggested that LGA stillbirths may have
relatively insufficiently large placentae, which, although not small
per se, may be inadequate to support the metabolic demands of a
large fetus, rendering it vulnerable to insults during pregnancy
[36]. Burmeister et al. found that almost half of LGA stillbirths had
placentae smaller than expected for fetal weight, and none larger
than expected [36].
SummaryIn summary, when accounting for time of death and using
norms developed in normal pregnancies, both SGA and LGA
birth weights were associated with stillbirth in our study. The
Table 7. Birth weight percentiles among preterm and term stillbirths and live births.
Birth Weight Normsand Percentiles Preterm SB and All LB Term SB and LB
Preterm SB All LBCrude OR forPreterm SB (95% CI)a Term SB Term LB
Crude OR forTerm SB (95% CI)a
Weighted sample size, numberb 433 1,382 94 1,233
Individualized norms, percentc
,5th percentile 36 9 7.37 (5.52–9.84) 19 8 3.30 (1.80–6.04)
5th–,10th 7 6 1.88 (1.18–2.99) 12 6 2.83 (1.38–5.81)
10th–90th 41 72 Reference 49 73 Reference
.90th–95th 4 5 1.44 (0.85–2.45) 4 5 1.17 (0.45–3.07)
.95th 12 7 2.97 (2.03–4.35) 16 6 3.67 (1.97–6.84)
,10th 43 15 5.04 (3.88–6.54) 30 15 3.10 (1.86–5.15)
.90th 16 12 2.31 (1.67–3.21) 20 12 2.52 (1.45–4.39)
Ultrasound norms, percentd
,5th percentile 39 10 7.30 (5.53–9.63) 21 10 3.08 (1.77–5.39)
5th–,10th 8 7 2.22 (1.44–3.45) 13 6 2.88 (1.42–5.86)
10th–90th 41 77 Reference 55 78 Reference
.90th–95th 5 3 2.96 (1.65–5.30) 2 3 0.92 (0.21–3.95)
.95th 8 3 4.49 (2.76–7.31) 9 3 4.69 (2.12–10.41)
,10th 47 17 5.22 (4.06–6.72) 34 16 3.00 (1.86–4.85)
.90th 12 6 3.76 (2.55–5.55) 11 6 2.74 (1.35–5.55)
Population norms, percente
,5th percentile 13 4 3.71 (2.47–5.55) 7 4 2.33 (1.00–5.41)
5th–,10th 8 4 2.25 (1.42–3.57) 12 4 3.68 (1.80–7.55)
10th–90th 76 84 Reference 69 84 Reference
.90th–95th 2 4 0.51 (0.23–1.17) ,1 4 0.29 (0.04–2.12)
.95th 1 4 0.31 (0.12–0.77) 11 5 2.81 (1.39–5.67)
,10th 21 8 2.97 (2.17–4.07) 19 8 3.02 (1.70–5.36)
.90th 3 8 0.40 (0.21–0.74) 12 9 1.67 (0.86–3.22)
Birth weight for GA at death (stillbirths) or delivery (live births) by the SCRN algorithm [17]. Percentages may add to slightly more or less than 100% because ofrounding.aUnadjusted OR for stillbirth for infants with birth weight in the percentile group shown compared to infants in the reference group from a logistic regression modelthat included effects for percentile group only.bAnalysis weights that accounted for the basic study design plus other aspects of the sampling were used.In the subset used to assess risk of preterm stillbirth, unweighted sample sizes were 433 preterm stillbirths and 1,821 (preterm and term) live births. In the subset ofterm pregnancies, unweighted sample sizes were 94 stillbirths and 1,386 live births.cIndividualized norm percentiles were derived using the fetal weight for GA equation from Bukowski et al. [15].dUltrasound norm percentiles were derived using the fetal weight for GA equation and standard error from Hadlock et al. [19].eAlexander et al. population norm percentiles of birth weight for GA were used [18].Simple linear interpolation was used with the Alexander et al. birth weight percentiles reported for completed weeks of GA in whole weeks to derive birth weightpercentiles for GA in weeks and days.LB, live birth; SB, stillbirth.doi:10.1371/journal.pmed.1001633.t007
Fetal Growth and Stillbirth
PLOS Medicine | www.plosmedicine.org 15 April 2014 | Volume 11 | Issue 4 | e1001633

association is mainly related to severe SGA and LGA pregnancies,
with birth weights either below the 5th or above the 95th
percentile. Thus, classifying 10% of pregnancies as abnormally
grown has the potential to identify 44%–46% of future stillbirths.
This would provide an opportunity for prevention of stillbirth,
especially in term pregnancies, when delivery is associated
with relatively low neonatal mortality and morbidity. However,
the effectiveness of stillbirth prevention would be expected to
be decreased by inaccuracy of the fetal growth estimates. The
association between large birth weights and stillbirth cannot be
captured by population norms that include pregnancies with
complications associated with growth abnormalities.
ImplicationsOur results suggest that, contrary to current practices and
recommendations, the most effective approach to identifying fetal
growth abnormalities for prediction and prevention of stillbirth
would focus on both severe SGA and LGA (,5th and .95th
percentile) pregnancies and would use norms developed from
normal pregnancies, rather than population norms, for fetal
growth surveillance. This strategy would identify as at risk almost
half of the pregnancies that would result in stillbirth. However, the
majority of stillbirths would remain unidentified either because of
inaccuracy of the fetal growth assessment or because they are not
associated with growth abnormalities.
Supporting Information
Table S1 STROBE checklist.(DOC)
Acknowledgments
The Stillbirth Collaborative Research Network is solely responsible for the
design and conduct of the study; collection, management, analysis, and
interpretation of the data; and preparation, review, or approval of the
manuscript. The following institutions and researchers compose the
Stillbirth Collaborative Research Network: University of Texas Health
Science Center at San Antonio—Donald J. Dudley, Deborah L. Conway,
Karen Aufdemorte, Angela Rodriguez, Monica Pina; University of Utah
School of Medicine—Robert M. Silver, Michael W. Varner, Kristi Nelson;
Emory University School of Medicine and the Rollins School of Public
Health—Carol J. Rowland Hogue, Barbara J. Stoll, Janice Daniels Tinsley,
Bahig Shehata, Carlos Abramowsky; Brown University—Donald Coustan,
Halit Pinar, Marshall Carpenter, Susan Kubaska; University of Texas
Medical Branch at Galveston—George R. Saade, Radek Bukowski,
Jennifer Lee Rollins, Hal Hawkins, Elena Sbrana; RTI International—
Corette B. Parker, Matthew A. Koch, Vanessa R. Thorsten, Holly
Franklin, Pinliang Chen; Pregnancy and Perinatalogy Branch, Eunice
Kennedy Shriver National Institute of Child Health and Human
Development, National Institutes of Health—Marian Willinger, Uma M.
Reddy; Columbia University Medical Center—Robert L. Goldenberg.
Additional Contributions: We would like to acknowledge the
following members of the Eunice Kennedy Shriver National Institute of
Child Health and Human Development Scientific Advisory and Safety
Monitoring Board: Reverend Phillip Cato, PhD; James W. Collins, Jr.,
MD, MPH; Terry Dwyer, MD, MPH; William P. Fifer, PhD; John Ilekis,
PhD; Marc Incerpi, MD; George Macones, MD, MSCE; Richard M.
Pauli, MD, PhD; Raymond W. Redline, MD; Elizabeth Thom, PhD
(chair), as well as all of the other physicians, study coordinators, research
nurses, and patients who participated in the Stillbirth Collaborative
Research Network.
Author Contributions
Conceived and designed the experiments: RB NIH MW UMR CBP HP
RMS DJD BJS GRS MAK CH MDV DLC DC RLG. Analyzed the data:
NIH CBP MAK. Wrote the first draft of the manuscript: RB. Contributed
to the writing of the manuscript: RB NIH MW UMR CBP HP RMS DJD
BJS GRS MAK CH MDV DLC DC RLG. ICMJE criteria for authorship
read and met: RB NIH MW UMR CBP HP RMS DJD BJS GRS MAK
CH MDV DLC DC RLG. Agree with manuscript results and conclusions:
RB NIH MW UMR CBP HP RMS DJD BJS GRS MAK CH MDV DLC
DC RLG.
References
1. MacDorman MF, Kirmeyer S (2009) Fetal and perinatal mortality, United
States, 2005. Natl Vital Stat Rep 57: 1–19.
2. MacDorman MF, Mathews TJ (2008) Recent trends in infant mortality in theUnited States. NCHS Data Brief 1–8.
3. Lawn JE, Blencowe H, Pattinson R, Cousens S, Kumar R, et al. (2011)
Stillbirths: Where? When? Why? How to make the data count? Lancet 377:1448–1463. doi:10.1016/S0140-6736(10)62187-3
4. Stanton C, Lawn JE, Rahman H, Wilczynska-Ketende K, Hill K (2006)Stillbirth rates: delivering estimates in 190 countries. Lancet 367: 1487–1494.
doi:10.1016/S0140-6736(06)68586-3
5. Flenady V, Koopmans L, Middleton P, Froen JF, Smith GC, et al. (2011) Majorrisk factors for stillbirth in high-income countries: a systematic review and meta-
analysis. Lancet 377: 1331–1340. doi:10.1016/S0140-6736(10)62233-7
6. Smith GC, Fretts RC (2007) Stillbirth. Lancet 370: 1715–1725. doi:10.1016/S0140-6736(07)61723-1
7. (2000) ACOG practice bulletin. Antepartum fetal surveillance. Number 9,October 1999 (replaces Technical Bulletin Number 188, January 1994). Clinical
management guidelines for obstetrician-gynecologists. Int J Gynaecol Obstet 68:175–185.
8. Royal College of Obstetricians and Gynaecologists (2010) Late intrauterine fetal
death and stillbirth. RCOG Green-top Guideline No. 55. London: RoyalCollege of Obstetricians and Gynaecologists.
9. Liston R, Sawchuck D, Young D (2007) Fetal health surveillance: antepartumand intrapartum consensus guideline. Society of Obstetricians and Gynaecol-
ogists of Canada. J Obstet Gynaecol Can 29: S3–56.
10. Royal Australian and New Zealand College of Obstetricians and Gynaecologists(2009) Intrapartum fetal surveillance clinical guidelines—second edition. East
Melbourne: Royal Australian and New Zealand College of Obstetricians andGynaecologists.
11. Smith GC, Shah I, White IR, Pell JP, Crossley JA, et al. (2007) Maternal andbiochemical predictors of antepartum stillbirth among nulliparous women in
relation to gestational age of fetal death. BJOG 114: 705–714. doi:10.1111/j.1471-0528.2007.01343.x
12. Smith GC, Crossley JA, Aitken DA, Pell JP, Cameron AD, et al. (2004)
First-trimester placentation and the risk of antepartum stillbirth. JAMA 292:2249–2254. doi:10.1001/jama.292.18.2249
13. Spencer K (2000) Second-trimester prenatal screening for Down syndrome and
the relationship of maternal serum biochemical markers to pregnancy
complications with adverse outcome. Prenat Diagn 20: 652–656.
14. Yaron Y, Cherry M, Kramer RL, O’Brien JE, Hallak M, et al. (1999) Second-
trimester maternal serum marker screening: maternal serum alpha-fetoprotein,
beta-human chorionic gonadotropin, estriol, and their various combinations as
predictors of pregnancy outcome. Am J Obstet Gynecol 181: 968–974.
15. Bukowski R, Uchida T, Smith GC, Malone FD, Ball RH, et al. (2008)
Individualized norms of optimal fetal growth: fetal growth potential. Obstet
Gynecol 111: 1065–1076. doi:10.1097/AOG.0b013e3181704e48
16. Parker CB, Hogue CJ, Koch MA, Willinger M, Reddy UM, et al. (2011)
Stillbirth Collaborative Research Network: design, methods and recruitment
experience. Paediatr Perinat Epidemiol 25: 425–435. doi:10.1111/j.1365-
3016.2011.01218.x
17. Conway DL, Hansen NI, Dudley DJ, Parker CB, Reddy UM, et al. (2013)
An algorithm for the estimation of gestational age at the time of fetal death.
Paediatr Perinat Epidemiol 27: 145–157. doi:10.1111/ppe.12037
18. Alexander GR, Himes JH, Kaufman RB, Mor J, Kogan M (1996) A United
States national reference for fetal growth. Obstet Gynecol 87: 163–168.
doi:10.1016/0029-7844(95)00386-X
19. Hadlock FP, Harrist RB, Martinez-Poyer J (1991) In utero analysis of fetal
growth: a sonographic weight standard. Radiology 181: 129–133.
20. Gardosi J, Chang A, Kalyan B, Sahota D, Symonds EM (1992) Customised
antenatal growth charts. Lancet 339: 283–287.
21. Stillbirth Collaborative Research Network (2011) Association between stillbirth
and risk factors known at pregnancy confirmation. JAMA 306: 2469–2479.
doi:10.1001/jama.2011.1798
22. Borrell C, Cirera E, Ricart M, Pasarin MI, Salvador J (2003) Social inequalities
in perinatal mortality in a southern European city. Eur J Epidemiol 18: 5–13.
23. Canterino JC, Ananth CV, Smulian J, Harrigan JT, Vintzileos AM (2004)
Maternal age and risk of fetal death in singleton gestations: USA, 1995–2000.
J Matern Fetal Neonatal Med 15: 193–197. doi:10.1080/14767050410001668301
24. Cnattingius S, Haglund B, Kramer MS (1998) Differences in late fetal death
rates in association with determinants of small for gestational age fetuses:
population based cohort study. BMJ 316: 1483–1487.
Fetal Growth and Stillbirth
PLOS Medicine | www.plosmedicine.org 16 April 2014 | Volume 11 | Issue 4 | e1001633

25. Hutcheon JA, Zhang X, Cnattingius S, Kramer MS, Platt RW (2008)
Customised birthweight percentiles: does adjusting for maternal characteristicsmatter? BJOG 115: 1397–1404. doi:10.1111/j.1471-0528.2008.01870.x
26. Zhang X, Platt RW, Cnattingius S, Joseph KS, Kramer MS (2007) The use of
customised versus population-based birthweight standards in predicting perinatalmortality. BJOG 114: 474–477. doi:10.1111/j.1471-0528.2007.01273.x
27. Ray JG, Urquia ML (2012) Risk of stillbirth at extremes of birth weight between20 to 41 weeks gestation. J Perinatol 32: 829–836. doi:10.1038/jp.2012.60
28. Clausson B, Gardosi J, Francis A, Cnattingius S (2001) Perinatal outcome in SGA
births defined by customised versus population-based birthweight standards.BJOG 108: 830–834.
29. Froen JF, Gardosi JO, Thurmann A, Francis A, Stray-Pedersen B (2004)Restricted fetal growth in sudden intrauterine unexplained death. Acta Obstet
Gynecol Scand 83: 801–807. doi:10.1111/j.0001-6349.2004.00602.x30. Gardosi J, Mul T, Mongelli M, Fagan D (1998) Analysis of birthweight and
gestational age in antepartum stillbirths. Br J Obstet Gynaecol 105: 524–530.
31. Genest DR, Singer DB (1992) Estimating the time of death in stillborn fetuses: III.External fetal examination; a study of 86 stillborns. Obstet Gynecol 80: 593–600.
32. Genest DR (1992) Estimating the time of death in stillborn fetuses: II. Histologicevaluation of the placenta; a study of 71 stillborns. Obstet Gynecol 80: 585–592.
33. Genest DR, Williams MA, Greene MF (1992) Estimating the time of death in
stillborn fetuses: I. Histologic evaluation of fetal organs; an autopsy study of 150stillborns. Obstet Gynecol 80: 575–584.
34. Zhang X, Decker A, Platt RW, Kramer MS (2008) How big is too big?The perinatal consequences of fetal macrosomia. Am J Obstet Gynecol 198:
517.e1–6. doi:10.1016/j.ajog.2007.12.005
35. Smith GC (2001) Life-table analysis of the risk of perinatal death at term and
post term in singleton pregnancies. Am J Obstet Gynecol 184: 489–496.doi:10.1067/mob.2001.109735
36. Burmeister B, Zaleski C, Cold C, McPherson E (2012) Wisconsin Stillbirth
Service Program: analysis of large for gestational age cases. Am J Med Genet A158A: 2493–2498. doi:10.1002/ajmg.a.35578
37. Polakowski LL, Akinbami LJ, Mendola P (2009) Prenatal smoking cessation andthe risk of delivering preterm and small-for-gestational-age newborns. Obstet
Gynecol 114: 318–325. doi:10.1097/AOG.0b013e3181ae9e9c
38. Castles A, Adams EK, Melvin CL, Kelsch C, Boulton ML (1999) Effectsof smoking during pregnancy. Five meta-analyses. Am J Prev Med 16: 208–
215.39. Gibbons K, Chang A, Flenady V, Mahomed K, Gardener G, et al. (2013)
Customised birthweight models: do they increase identification of at-risk infants?J Paediatr Child Health 49: 380–387. doi:10.1111/jpc.12189
40. Carberry AE, Gordon A, Bond DM, Hyett J, Raynes-Greenow CH, et al. (2011)
Customised versus population-based growth charts as a screening tool fordetecting small for gestational age infants in low-risk pregnant women. Cochrane
Database Syst Rev 2011: CD008549. doi:10.1002/14651858.CD008549.pub2
41. Gibbons KS, Chang AM, Flenady VJ, Mahomed K, Gray PH, et al. (2013) A test
of agreement of customised birthweight models. Paediatr Perinat Epidemiol 27:131–137. doi:10.1111/ppe.12041
42. Committee on Practice Bulletins—Obstetrics (2013) Practice Bulletin No. 137:Gestational diabetes mellitus. Obstet Gynecol 122: 406–416. doi:10.1097/
01.AOG.0000433006.09219.f1
Fetal Growth and Stillbirth
PLOS Medicine | www.plosmedicine.org 17 April 2014 | Volume 11 | Issue 4 | e1001633

Editors’ Summary
Background. Pregnancy is usually a happy time, when theparents-to-be anticipate the arrival of a new baby. But, sadly,about 20% of pregnancies end in miscarriage—the early lossof a fetus (developing baby) that is unable to surviveindependently. Other pregnancies end in stillbirth—fetaldeath after 20 weeks of pregnancy (in the US; after 24 weeksin the UK). Stillbirths, like miscarriages, are common. In theUS, for example, one in every 160 pregnancies ends instillbirth. How women discover that their unborn baby hasdied varies. Some women simply know something is wrongand go to hospital to have their fears confirmed. Others findout when a routine check-up detects no fetal heartbeat.Most women give birth naturally after their baby has died,but if the mother’s health is at risk, labor may be induced.Common causes of stillbirth include birth defects andinfections. Risk factors for stillbirth include being overweightand smoking during pregnancy.
Why Was This Study Done? Stillbirths are often associ-ated with having a ‘‘small for gestational age’’ (SGA) fetus.Gestation is the period during which a baby develops in itsmother’s womb. Gestational age is estimated from the dateof the woman’s last menstrual period and/or from ultra-sound scans. An SGA fetus is lighter than expected for its agebased on observed distributions (norms) of fetal weights forgestational age. Although stillbirth is clearly associated withimpaired fetal growth, the exact relationship between fetalgrowth and stillbirth remains unclear for two reasons. First,studies investigating this relationship have used gestationalage at delivery rather than gestational age at death as anestimate of fetal age, which overestimates the gestationalage of stillbirths and leads to errors in estimates of theproportions of SGA and ‘‘large for gestational age’’ (LGA)stillbirths. Second, many characteristics that affect normalfetal growth are also associated with the risk of stillbirth, andthis has not been allowed for in previous studies. In thispopulation-based case–control study, the researchers inves-tigate the fetal growth abnormalities associated withstillbirth using a new approach to estimate gestational ageand accounting for the effect of characteristics that affectboth fetal growth and stillbirth. A population-based case–control study compares the characteristics of patients with acondition in a population with those of unaffected people inthe same population.
What Did the Researchers Do and Find? The researchersinvestigated all the stillbirths and a sample of live births thatoccurred over 2.5 years at 59 hospitals in five US regions.They used a formula developed by the Stillbirth Collabora-tive Research Network to calculate the gestational age atdeath of the stillbirths. They categorized fetuses as SGA ifthey had a weight for gestational age within the bottom 10%(below the 10th percentile) of the population and as LGA if
they had a weight for gestational age above the 90thpercentile at death (stillbirth) or delivery (live birth) usingpopulation, ultrasound, and individualized norms of fetalweight for gestational age. Population norms incorporateweights for gestational age from normal pregnancies andfrom pregnancies complicated by growth abnormalities,whereas the other two norms include weights for gestationalage from normal pregnancies only. Having an SGA fetus wasassociated with a 3- to 4-fold increased risk of stillbirthcompared to having a fetus with ‘‘appropriate’’ weight forgestational age based on all three norms. LGA wasassociated with an increased risk of stillbirth based on theultrasound and individualized norms but not the populationnorms. Being more severely SGA or LGA (below the 5thpercentile or above the 95th percentile) was associated withan increased risk of stillbirth.
What Do These Findings Mean? These findings indicatethat, when the time of death is accounted for and norms forweight for gestational age only from uncomplicated preg-nancies are used, stillbirth is associated with both restrictedand excessive fetal growth. Overall, abnormal fetal growthwas identified in 25% of stillbirths using population normsand in about 50% of stillbirths using ultrasound orindividualized norms. Although the accuracy of thesefindings is likely to be affected by aspects of the studydesign, these findings suggest that, contrary to currentpractices, strategies designed to prevent stillbirth shouldfocus on identifying both severely SGA and severely LGAfetuses and should use norms for the calculation of weightfor gestational age based on normal pregnancies only. Suchan approach has the potential to identify almost half of thepregnancies likely to result in stillbirth.
Additional Information. Please access these websites viathe online version of this summary at http://dx.doi.org/10.1371/journal.pmed.1001633.
N The March of Dimes, a nonprofit organization forpregnancy and baby health, provides information onstillbirth
N Tommy’s, a UK nonprofit organization that funds researchinto stillbirth, premature birth, and miscarriage andprovides information for parents-to-be, also providesinformation on stillbirth (including personal stories)
N The UK National Health Service Choices website providesinformation about stillbirth (including a video aboutdealing with grief after a stillbirth)
N MedlinePlus provides links to other resources aboutstillbirth (in English and Spanish)
N Information about the Stillbirth Collaborative ResearchNetwork is available
Fetal Growth and Stillbirth
PLOS Medicine | www.plosmedicine.org 18 April 2014 | Volume 11 | Issue 4 | e1001633