Strategies for automated fetal cell screening
13
Strategies for automated fetal cell screening Fatima A.Merchant 1 and Kenneth R.Castleman Advanced Digital Imaging Research, LLC, League City, TX 77573, USA 1 To whom correspondence should be addressed at: Advanced Digital Imaging Research, LLC, 2450 South Shore Blvd, Suite 305, League City, TX 77573, USA; E-mail: [email protected] Studies to date have demonstrated fetal sex determination and aneuploidy detection from maternal blood, but a clinical screening technique has not yet emerged. A key limiting factor is the small number of fetal cells, which makes detection specificity and reliability critical. Visual inspection of unsorted or sorted fetal cells is laborious, and cells can be easily missed. Moreover, it is impractical to examine manually all the separated cells. It is highly likely that automation may increase the number of cells inspected, resulting in higher detection sensitivities. Flow and image cytometry are two feasible approaches for automated detection of cells. This review details computerized microscopy (image cytometry) techniques for the automatic detection of fetal cells. Microscopy-based approaches used to identify fetal origin include: (i) immunocytochemical identification of fetal haemoglobin-specific cells (light or fluorescence microscopy); (ii) identification of sex chromosomes and/or aneuploidy using fluorescence in-situ hybridization; and (iii) morphological identification of nucleated red blood cells using light microscopy. The relevant instrumentation, including motorized stages and filters, cameras and digitizer boards are discussed, and software algorithms, including image enhancement, autofocusing, object detection and relocation, and features for operator review and data analysis, are outlined. Keywords: aneuploidy detection/automated microscopy/fetal cell detection/image analysis/rare event detection TABLE OF CONTENTS Introduction Image cytometry-based strategies FISH labelling of fetal cells Transmitted-light imaging of fetal cells Conclusions Summary Acknowledgements References Introduction The ultimate goal of much current research in medical cytogenetics is to make low-cost, low-risk prenatal genetic screening widely available (Steele et al., 1996; Bianchi et al., 2001). Scientists have documented the presence of fetal cells in maternal blood, and have envisioned using them to enable non- invasive prenatal screening. Using fetal cells isolated from maternal peripheral blood samples eliminates the procedure- related risks associated with amniocentesis and chorionic villus sampling (Firth et al., 1991). The minute proportion of fetal cells found in maternal blood can now be enriched to one per few thousand using either magnetic activated cell sorting (MACS) (Ganshirt-Ahlert et al., 1992, 1993) or fluorescence activated cell sorting (FACS) (Bianchi et al., 1993), or a combination of the two. Aneuploidies can then be detected with chromosome-specific DNA probes using either fluorescence in-situ hybridization (FISH) (Elias et al., 1992; Ganshirt-Ahlert et al., 1993) or other techniques such as PCR (Geifman-Holtzman et al., 1996). Current status Despite some promising results and several investigations in this field, non-invasive prenatal screening using fetal cells for routine genetic analysis is far from being realized in the clinical setting. A key limiting factor is the small number of fetal cells in the maternal circulation, and this makes cell detection labour- intensive and also limits accuracy. To be useful for genetic analysis, fetal cells must not only be separated and distinguished from maternal cells, but they must be unequivocally identified as cells of fetal origin (Bianchi et al., 2001). Microscopy-based approaches that have been used to identify fetal origin have included techniques such as: (i) immunocytochemical identifica- tion of fetal haemoglobin (HbF) -specific cells (light or fluorescence microscopy) (Oosterwijk et al., 1996, 1998a,b; Tanke et al., 1996; Bajaj et al., 2000); (ii) identification of X and Y chromosomes (male fetal cells) using FISH (Elias et al., 1992; Ganshirt-Ahlert et al., 1993); and (iii) morphological identifica- tion of May–Giemsa-stained nucleated red blood cells (nRBCs) Human Reproduction Update, Vol.8, No.6 pp. 509–521, 2002 Ó European Society of Human Reproduction and Embryology 509 by guest on August 19, 2015 http://humupd.oxfordjournals.org/ Downloaded from
Transcript of Strategies for automated fetal cell screening

Strategies for automated fetal cell screening
Fatima A.Merchant1 and Kenneth R.Castleman
Advanced Digital Imaging Research, LLC, League City, TX 77573, USA
1To whom correspondence should be addressed at: Advanced Digital Imaging Research, LLC, 2450 South Shore Blvd, Suite 305,
League City, TX 77573, USA; E-mail: [email protected]
Studies to date have demonstrated fetal sex determination and aneuploidy detection from maternal blood, but aclinical screening technique has not yet emerged. A key limiting factor is the small number of fetal cells, which makesdetection speci®city and reliability critical. Visual inspection of unsorted or sorted fetal cells is laborious, and cellscan be easily missed. Moreover, it is impractical to examine manually all the separated cells. It is highly likely thatautomation may increase the number of cells inspected, resulting in higher detection sensitivities. Flow and imagecytometry are two feasible approaches for automated detection of cells. This review details computerized microscopy(image cytometry) techniques for the automatic detection of fetal cells. Microscopy-based approaches used to identifyfetal origin include: (i) immunocytochemical identi®cation of fetal haemoglobin-speci®c cells (light or ¯uorescencemicroscopy); (ii) identi®cation of sex chromosomes and/or aneuploidy using ¯uorescence in-situ hybridization; and(iii) morphological identi®cation of nucleated red blood cells using light microscopy. The relevant instrumentation,including motorized stages and ®lters, cameras and digitizer boards are discussed, and software algorithms,including image enhancement, autofocusing, object detection and relocation, and features for operator review anddata analysis, are outlined.
Keywords: aneuploidy detection/automated microscopy/fetal cell detection/image analysis/rare event detection
TABLE OF CONTENTS
Introduction
Image cytometry-based strategies
FISH labelling of fetal cells
Transmitted-light imaging of fetal cells
Conclusions
Summary
Acknowledgements
References
Introduction
The ultimate goal of much current research in medical
cytogenetics is to make low-cost, low-risk prenatal genetic
screening widely available (Steele et al., 1996; Bianchi et al.,
2001). Scientists have documented the presence of fetal cells in
maternal blood, and have envisioned using them to enable non-
invasive prenatal screening. Using fetal cells isolated from
maternal peripheral blood samples eliminates the procedure-
related risks associated with amniocentesis and chorionic villus
sampling (Firth et al., 1991). The minute proportion of fetal cells
found in maternal blood can now be enriched to one per few
thousand using either magnetic activated cell sorting (MACS)
(Ganshirt-Ahlert et al., 1992, 1993) or ¯uorescence activated cell
sorting (FACS) (Bianchi et al., 1993), or a combination of the
two. Aneuploidies can then be detected with chromosome-speci®c
DNA probes using either ¯uorescence in-situ hybridization
(FISH) (Elias et al., 1992; Ganshirt-Ahlert et al., 1993) or other
techniques such as PCR (Geifman-Holtzman et al., 1996).
Current status
Despite some promising results and several investigations in this
®eld, non-invasive prenatal screening using fetal cells for routine
genetic analysis is far from being realized in the clinical setting. A
key limiting factor is the small number of fetal cells in the
maternal circulation, and this makes cell detection labour-
intensive and also limits accuracy. To be useful for genetic
analysis, fetal cells must not only be separated and distinguished
from maternal cells, but they must be unequivocally identi®ed as
cells of fetal origin (Bianchi et al., 2001). Microscopy-based
approaches that have been used to identify fetal origin have
included techniques such as: (i) immunocytochemical identi®ca-
tion of fetal haemoglobin (HbF) -speci®c cells (light or
¯uorescence microscopy) (Oosterwijk et al., 1996, 1998a,b;
Tanke et al., 1996; Bajaj et al., 2000); (ii) identi®cation of X and
Y chromosomes (male fetal cells) using FISH (Elias et al., 1992;
Ganshirt-Ahlert et al., 1993); and (iii) morphological identi®ca-
tion of May±Giemsa-stained nucleated red blood cells (nRBCs)
Human Reproduction Update, Vol.8, No.6 pp. 509±521, 2002
Ó European Society of Human Reproduction and Embryology 509
by guest on August 19, 2015
http://humupd.oxfordjournals.org/
Dow
nloaded from

using light microscopy (Takabayashi et al., 1995). These
techniques, however, tend to be very labour-intensive because
hundreds of maternal cells have to be examined to locate one or
more fetal cell(s). Furthermore, it is critical to locate fetal cells
reliably because of the limited number of cells available for
diagnosis. This creates the need for automated systems that allow
repeatable, unbiased and practical detection of the small
proportions of fetal cells in enriched maternal blood samples.
To date, fetal cells have been isolated using a variety of
techniques such as density gradient centrifugation, ¯ow cytometry
or magnetic cell sorting. Not only have the sorting approaches
varied widely, but the gestation period is also different in most of
the studies published (Bianchi et al., 2001). Thus, it has been
dif®cult to use data from these studies to generalize about the
absolute numbers of fetal cells recovered. Further, it is quite likely
that the number of fetal cells varies from time to time in the same
individual, as well as among individuals. There is therefore a
pressing need for systematic sequential studies designed to
evaluate enrichment procedures, time of entry of fetal cells into
maternal blood, and the absolute concentrations of these cells at
different periods of gestation.
The need for automation
Computer automation has the potential to make the procedure
practical on a large scale because: (i) it reduces cost by relieving
humans of tedious duties; (ii) it uses quantitative methods to
determine statistically signi®cant results on the relatively rare
fetal cells; and (iii) it can support signi®cantly expanded testing
volumes without concomitant requirements for additional per-
sonnel and ¯oor space. Moreover, automation may also serve as
enabling technology to enhance current research in prenatal
screening. For instance, automated screening may be used to
evaluate enrichment procedures in terms of both yield (the
absolute number of fetal cells isolated from a maternal sample)
and purity (the ratio of fetal cells to the total number of cells
isolated). This is because virtually all the cells in a sorted sample
can be examined using automation, and an increase in the number
of cells inspected may result in higher detection sensitivities.
Flow versus imaging
Flow and image cytometry are two feasible approaches for the
automated detection of cells (Iverson et al., 1981; Price et al.,
1991; Wachtel et al., 1991; Tanke et al., 1996; Oosterwijk et al.,
1998a). Both of these methods rely on morphological descriptors
and/or highly speci®c markers for cell recognition. Flow cytometry
is superior when analysing a large number of cells at higher speeds,
but image-based cytometry with a microscope is becoming a
primary technique for screening clinical tissue specimens because
it allows a diverse range of quantitative and non-destructive
measurements to be made on specimens (Ploem et al., 1986; Parry
and Hemstreet, 1988). While ¯ow cytometry has excellent
quantitative precision, the measured parameters are limited to
integrated ¯uorescence intensities and light scatter per cell. Image
cytometry offers other advantages that are not possible with ¯ow
cytometry, including: (i) permanent records of detected cells can
be stored as images in memory; and (ii) the re-examination of
detected cellsÐsuch cells can be easily re-located on slides using
previously determined spatial locations. The limit of detection is
also relatively higher for image cytometry.
Image cytometry-based strategies
The fetal cell detection approaches based on image cytometry
with light microscopy that are discussed in this review form three
major categories: (i) immunophenotyping of fetal cells using a
marker, such as embryonic haemoglobins, which allows easy
microscopic identi®cation; (ii) FISH for sex or aneuploidy
determination; and (iii) morphological descriptors to identify
nucleated cells using characteristic structural features.
Immunocytochemical labelling of fetal cells
Monoclonal antibodies that are directed to characteristic cellular
components have been used routinely to identify cells of interest.
This not only uniquely identi®es the target cell, but also increases
the sensitivity of detection. In the case of fetal cells, antibodies to
the gamma/epsilon/zeta chains of haemoglobin are used to
identify fetal haemoglobin speci®cally (Zheng et al., 1993,
1995, 1999). Immunophenotyping for selective identi®cation of
fetal haemoglobin by microscopy has been used in conjunction
with FISH for the detection of fetal cells (Zheng et al., 1993).
The Applied Imaging system
A semi-automated approach for the detection of fetal erythro-
blasts in maternal blood, using multi-mode microscopy has been
described (Tanke et al., 1996). This system was further developed
under a joint venture with Applied Imaging Corporation (Santa
Clara, CA, USA). The instrumentation and software for this
system were described in 1998 (Ravkin and Temov, 1998), while
others (Oosterwijk et al., 1998c) tested the system's performance
by locating fetal nucleated red blood cells (fnRBCs) in 52% of 42
maternal blood samples. The detection of fetal cells was achieved
using labelled monoclonal antibodies directed to gamma and
epsilon haemoglobin chains, in combination with nuclear staining
using DAPI (4¢,6-diamidino-2-phenyl indole dihydrochloride).
This allows the use of both transmitted light (bright®eld) and
¯uorescence microscopy for the speci®c identi®cation of fetal
cells. The nucleated fetal cells stain positively for both the HbF
and nucleus.
The Applied Imaging system was built around a conventional
microscope with transmission and ¯uorescence optics. It included
a motorized stage and motorized ®lter wheels for both transmis-
sion and ¯uorescence. Image acquisition was achieved using a
Cohu 4910 camera. The software capabilities included scanning,
relocation, autofocusing, feature extraction, and facilities for
operator review and data analysis.
In a description of system performance, the limit of detection
was reported as 1:1.53106 with 91% sensitivity (Oosterwijk et
al., 1998c). These authors used maternal blood samples processed
via a protocol consisting of one enrichment step followed by
immunocytochemical staining for HbF, and FISH for X- and Y-
chromosomal sequences. The system automatically detected cells
positive for both DAPI and HbF, and this was followed by manual
identi®cation of the detected cells to con®rm fetal origin. Out of
44 slides that were screened, 23 were found to be positive for HbF
by automated screening, and 19 were positive by manual
screening. The number of objects selected as HbF/DAPI-positive
by the system ranged from 107 to 9981 (average 1452). Following
operator review, the actual number of HbF/DAPI-positive cells
ranged from 0 to 111 (average 8) cells. Thus, the false-positive
F.A.Merchant and K.R.Castleman
510
by guest on August 19, 2015
http://humupd.oxfordjournals.org/
Dow
nloaded from

rate was quite high, though a possible contributing factor to this
was non-speci®c staining. The average time needed for screening
was 4 h and 27 min (range 1 h 20 min to 7 h 20 min). The
screening time per slide was much longer than that required for
manual screening (average 20 min). Only true fetal cells were
then subjected to visual genetic analysis via FISH. However,
FISH data on the detected nRBC population were insuf®cient to
enable reliable statistical analysis.
A novel feature of this system was the capability to acquire
simultaneously the absorption (HbF) and ¯uorescence (DAPI)
images. This had the advantages of speed and easy human
recognition. A disadvantage was that stringent slide preparation
was needed for cell ®xation and DAPI staining. Non-optimal slide
preparation resulted in fuzzy DAPI images that overlapped the
cytoplasm (HbF staining), in which case only sequential imaging
was possible. However, it was unclear from the data reported,
whether simultaneous or sequential data acquisition was used.
Despite the relatively promising results reported earlier, no further
data are available on the current status of this instrument.
Scanning cytometer for detection of rare events
More recently, an automated scanning cytometer for the detection
of rare events was described (Bajaj et al., 2000), which used a
model of fnRBCs in the maternal circulation. Adult cells were
spiked with fetal cells to create ratios of about 1 fnRBC in 107
nucleated cells, and deposited on slides using centrifugal
cytology. The cells were stained with ¯uorescein isothiocyanate
(FITC)-conjugated anti-fetal haemoglobin (gamma chain), and
DAPI. The fnRBCs stained positively for both DAPI (nucleus)
and FITC (HbF). The instrument was built around a conventional
microscope ®tted with a CCD camera, motorized XY-stage, and a
piezoelectric Z-axis objective positioner. A key feature of this
instrument was the application of analogue autofocus circuitry for
achieving fast autofocus (Bravo-Zanoguera et al., 1998). A FITC
image was ®rst obtained, and the DAPI-labelled cells were
recorded in a second scan by relocating to the previously stored
FITC cell co-ordinates. A dual-colour montage of the detected
cells was prepared and manually edited to discard artefacts and
verify fetal origin.
Fetal cell detection was tested using 15 spiked samples.
Approximately 1±14 fnRBCs were detected in 20 million
peripheral blood mononuclear cells. An average sensitivity of
91% was reported, with a correlation coef®cient of 0.9915
between manually and automatically scanned data. The total time
to analyse 203106 cells was approximately 6 h 26 min (four
slides, 5800 ®elds per slide at a 1-Hz ®eld rate). Considerable
effort was devoted to optimizing cell preparation and immuno-
cytochemical staining. Minimal enrichment and centrifugal
cytology techniques were implemented to minimize cell loss.
These results showed that scanning cytometry had potential for
rare-event detection, and it remains to be seen whether its
application to fetal cell detection from maternal blood yields
equally exciting results.
Limitations of immunocytochemical labelling
A major weakness of the immunophenotyping approach is the
lack of any speci®c marker for fetal cells. To date, no antibodyÐ
whether cell surface or intracellularÐis 100% speci®c for fetal
cells (Zheng et al, 1997, 1999). In the 5- to 35-week fetus, the
predominant haemoglobin molecule consists of alpha and gamma
chains and is known as HbF. However, gamma globin, while
reasonably speci®c for fetal cells, is not expressed in all fetal
cells. Moreover, there is some evidence that pregnancy stimulates
the synthesis of small amounts of HbF in the adult (Pembrey et
al., 1973). In the embryonic stage, additional chains (known as
the zeta chains) are found in the haemoglobin molecule; these are
present in fetal cells up to 14 weeks (DeMaria et al., 1996).
Monoclonal antibodies directed against the zeta chain of the fetal
haemoglobin molecule were expected to be highly speci®c to fetal
cells, but no relationship was seen between zeta-positive cells and
gestational age. Instead, dual-labelling studies showed that most
zeta-positive cells were also gamma-positive. New antibodies that
would potentially label all fetal cells and no maternal cells, would
greatly improve the outcome of immunophenotyping-based image
cytometry systems.
Most of the commercially available antibodies recognize
different epitopes and have varying amounts of non-speci®c
background staining. This makes it dif®cult to calibrate
imaging systems to differentiate automatically between speci®c
and non-speci®c backgrounds. Also, it has been shown that
processing cells for staining of globin chains requires reagents
that often contain preservatives capable of interfering with FISH
(Zheng et al., 1993), thus making subsequent genetic analysis
dif®cult. Hence, this approach has a few limitations, the most
signi®cant being the absence of a highly speci®c marker for fetal
cells.
FISH labelling of fetal cells
Another approach utilizes hybridization techniques such as FISH
for the detection of fetal cells. FISH is a quick, inexpensive,
accurate, sensitive and relatively speci®c method, that allows the
detection of the autosomal trisomies 13, 18 and 21, and X and Y
abnormalities, and any other chromosome abnormality for which
a speci®c probe is available. It is presently used as an adjunct to
conventional cytogenetic analysis, with a high detection rate and
low false-positive and false-negative rates. FISH is one of the
methods currently under investigation for the automated detection
of fetal cells. Recently developed automated image analysis
techniques for nuclei detection and FISH dot counting (Carothers,
1994; Castleman et al., 1996; Vrolijk et al., 1996; Netten et al.,
1997; Ortiz de Solorzano et al., 1998), in conjunction with the
rapid evolution in digital imaging technology and computation,
have made feasible the automation of analyses of FISH fetal cell
samples. The separated cells in enriched maternal blood are
examined for gender and genetic aneuploidy using chromosome-
speci®c DNA probes via FISH. If the fetus is male, FISH can be
used directly, with one probe targeting the Y-chromosome, and
different coloured probes for other chromosomes, to detect
aneuploidies. An automated system can examine enough cells
to locate several fetal (Y-positive) cells and then make a
determination about aneuploidy in the fetus. If the fetus is
female, a suf®cient number of cells must be analysed so as to rule
out the possibility of aneuploid fetal cells.
Automated FISH analysis
The automatic detection and scoring of FISH signals in interphase
nuclei was ®rst reported in 1997 (Netten et al., 1997). These
Strategies for automated fetal cell screening
511
by guest on August 19, 2015
http://humupd.oxfordjournals.org/
Dow
nloaded from
authors developed an automated ¯uorescence microscope system
that could examine 500 cells in 15 min to determine the number of
dots (labelled chromosomes) in each cell nucleus. The system was
built around a Zeiss Axioskop microscope ®tted with motorized
focus, scanning stage, excitation ®lter wheels and shutter. Images
were acquired by a Photometrics KAF 1400 camera and analysed
on a Macintosh Quadra 840AV computer. This system was
designed to analyse one-colour FISH, i.e. double-labelled nuclei
(counterstain and one hybridization signal), and system perfor-
mance was compared with manual counting. The automated
system dot counting feature was reported to be biased with respect
to manual counting, with a higher variance and an error rate of
11%. A major disadvantage of this system is that it analyses only
one-colour FISH specimens.
Subsequently, a fully automated hybridization dot analyser was
developed that performed dot counting on two-colour FISH
specimens (counterstain and two hybridization signals) (Ortiz de
Solorzana et al., 1998). The system was built around a microscope
with motorized stages and ®lter wheels, and equipped with image
capture and digitization capabilities. The software incorporated
FISH image analysis algorithms reported in the literature
(Castleman et al., 1996), with the addition of one new feature
for systematic error correction. In order to avoid differences
between the `detectable' and the `actual' populations, an
internal control was implemented by using a probe of which the
copy number was known a priori. The strategy for correction
involved examination of the FISH control signals, with nuclei
whose control copy numbers were different than the expected
number being discarded. The use of control signals to discard
cells with spurious signals limits the direct applicability of this
system for fetal cell detection. It is dif®cult to pick a suitable
control signal, and removal of cells may result in missed rare fetal
cells.
More recently, an automated system was developed which was
capable of analysing microscope slides with FISH-stained
interphase nuclei in both two and three dimensions (Kozubek et
al., 1999). This can be used to analyse multi-colour FISH images
using sequential acquisition of signals from individual probes
through appropriate single band-pass excitation and emission
®lters. The system was built around a fully automated
epi¯uorescence microscope (Leica Microsystems Inc.,
Bannockburn, IL, USA), with customized software for scanning,
focusing, digitization and image analysis. Other software
capabilities include the computation of spatial distances between
the hybridized dots, and analysis of repeatedly hybridized
samples. The functionality of the system was demonstrated using
a sample for the detection of the BCR/ABL [the fusion gene
found in 95% chronic myelogeneous leukaemia (CML) patients]
translocation in interphase nuclei, and for the determination of
three-dimensional distances between centromeres in HL-60 cells.
The authors projected that the system should be able to analyse
~105 nuclei per slide at a cell density of 10 nuclei per ®eld, at
speeds of 50±100 nuclei per min and 1 to 5 nuclei per min, in two
and three dimensions respectively. Although these statistics are
suf®cient for a number of clinical tasks such as routine
diagnostics, follow-up of therapy and studies of chromatin
structure, the application of the system for rare-event detection
remains to be tested.
The advanced digital imaging research (ADIR) system for FISH
imaging
A similar system has been built by our group for the identi®cation
of fetal cells using ¯uorescence microscopy of FISH-labelled
maternal blood samples. Assembled around an Axioskop epi-
illumination microscope (Carl Zeiss Microimaging, Inc.,
Thornwood, NY, USA), the instrument is equipped with two
lampsÐa 100 W mercury lamp for ¯uorescence imaging and a 30
W halogen source for conventional light microscopy. The
microscope is ®tted with a three-axis motorized scanning stage
system (Prior Scienti®c Inc., Rockland, MA, USA) and a four-
specimen slide holder. The spatial resolution of the scanning stage
is 0.5 mm in X and Y, and 0.05 mm in the Z direction. A cooled
triple chip colour camera (Dage-MTI, Inc., Michigan City, IN,
USA) capable of on-chip integration up to 8 s and 575-line
resolution, is used in conjunction with a 24-bit frame grabber
(Scion Corporation, Frederick, ML, USA) to allow simultaneous
acquisition of all three colour channels (640348033). Triple-
band and Quad-band ®lter sets (Vysis Inc., Downers Grove, IL,
USA) are used for imaging three- and four-colour FISH samples
respectively.
The software that controls the automated microscope includes
functions for spatial and photometric calibration, automatic focus,
image scanning and digitization, background subtraction and
colour compensation, nuclei segmentation, location and measure-
ment, and FISH dot counting (Castleman et al., 1996). Cells are
located in one colour channel (e.g. blue for DAPI staining), and
dots are counted in user-selected channels and associated with the
cell to which they belong. A count of the number of dots of each
colour in the nucleus provides chromosomal enumeration. For
each slide scanned, screening results are reported as a distribution
of `dots-per-cell' for each colour.
Autofocus
The autofocus algorithm is a two-pass algorithm designed to
determine ®rst whether the ®eld in question is empty or not, and
then to bring the image into sharp focus. The ®rst pass of the
algorithm examines images at three different z-axis positions to
determine whether there is enough variation among the images to
indicate the presence of objects in the ®eld to focus on. Once the
coarse focus step is complete, a different algorithm is used to
bring the image into sharp focus. To ensure that the background
image of the nuclei (blue) and dots (red/green/aqua) are all in
sharp focus, the ®ne focus value is taken to be the sum of the ®ne
focus function output for each of the three- or four-colour
channels. This technique has been found to be more reliable for
bringing all the dots into sharp focus.
The coarse focus routine (three video frames) is followed
by the ®ne focus algorithm to ®nd the optimal focus plane
(~5±8 video frames). Autofocusing is executed at the
beginning of every scan, and may be executed for every scan
position, or at regular intervals as de®ned by the user. In our
experience, the images are `in-focus' over a relatively large area
of the slide, and frequent refocusing is not required. For an
integration time of 0.5 s, an average autofocus time of 28 6 4 s
was observed. The total time for autofocus depends upon image
content (which affects processing time), and the selected
integration time.
F.A.Merchant and K.R.Castleman
512
by guest on August 19, 2015
http://humupd.oxfordjournals.org/
Dow
nloaded from

Slide scanning
The automated slide scanning algorithm scans the slide in a
raster pattern. It moves vertically down the user-selected area,
retraces back to the top, moves a predetermined distance across,
and then starts another scan vertically downward. This process
continues until the entire user-de®ned area is scanned. The
step size is adjusted such that there is no overlap between
sequential scan ®elds. The system was designed to implement
slide scanning in two modes depending on the slide preparation.
A `spread' mode scans the entire slide, whereas a `cytospin'
mode2allows scanning of slides prepared using centrifugal
cytology. Both modes allow user-de®ned areas to be scanned.
The average slide-scanning rate recorded for the system is 12
images per min.
Cell detection
The digitized images are initially thresholded in the user-de®ned
cell channel (generally, blue for DAPI counterstain) to obtain
binary images of the cells. The cells are then uniquely identi®ed
using a region-labelling procedure (Merchant et al., 1993). The
number of pixels in each object is used as a measure of cell size.
Shape analysis is used to discard large cell clusters and non-
circular objects. Isolated cells are initially evaluated to determine
gender and/or aneuploidy, and ®nally classi®ed as fetal or
maternal cells. The stage and image co-ordinates of fetal cells
are stored in a table along with each cell's morphological features
(area, shape factor and dot count). The detected cells can be
automatically re-located later using the previously stored stage
and image co-ordinates.
Figure 1. Colour compensation applied to an image of a FISH-labelled lymphocyte. The nuclei is counterstained with DAPI, and dots are labelled with red(chromosome 21) and green (chromosome 13). (A) Original image and individual red (R), green (G), and blue (B) channels. The blue ¯uorophore (nuclear stain) isseen in both the red and green channels. Similarly, green dots are also seen in the red channel and vice versa. (B) Intensity pro®le of a line segment through a redand green dot (white arrows in original image). (C, D) Colour- compensated images. The smearing of colours across the individual channels is effectively removed.Original magni®cation = 3630.
Strategies for automated fetal cell screening
513
by guest on August 19, 2015
http://humupd.oxfordjournals.org/
Dow
nloaded from
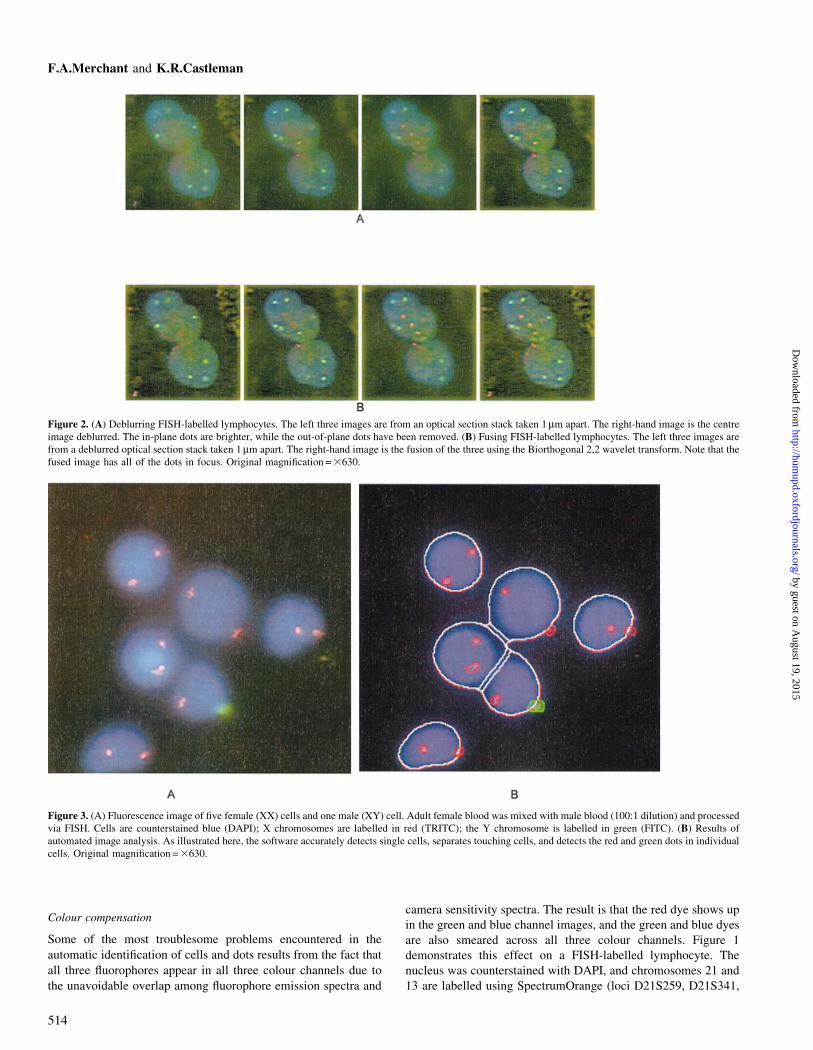
Colour compensation
Some of the most troublesome problems encountered in the
automatic identi®cation of cells and dots results from the fact that
all three ¯uorophores appear in all three colour channels due to
the unavoidable overlap among ¯uorophore emission spectra and
camera sensitivity spectra. The result is that the red dye shows up
in the green and blue channel images, and the green and blue dyes
are also smeared across all three colour channels. Figure 1
demonstrates this effect on a FISH-labelled lymphocyte. The
nucleus was counterstained with DAPI, and chromosomes 21 and
13 are labelled using SpectrumOrange (loci D21S259, D21S341,
Figure 2. (A) Deblurring FISH-labelled lymphocytes. The left three images are from an optical section stack taken 1 mm apart. The right-hand image is the centreimage deblurred. The in-plane dots are brighter, while the out-of-plane dots have been removed. (B) Fusing FISH-labelled lymphocytes. The left three images arefrom a deblurred optical section stack taken 1 mm apart. The right-hand image is the fusion of the three using the Biorthogonal 2,2 wavelet transform. Note that thefused image has all of the dots in focus. Original magni®cation = 3630.
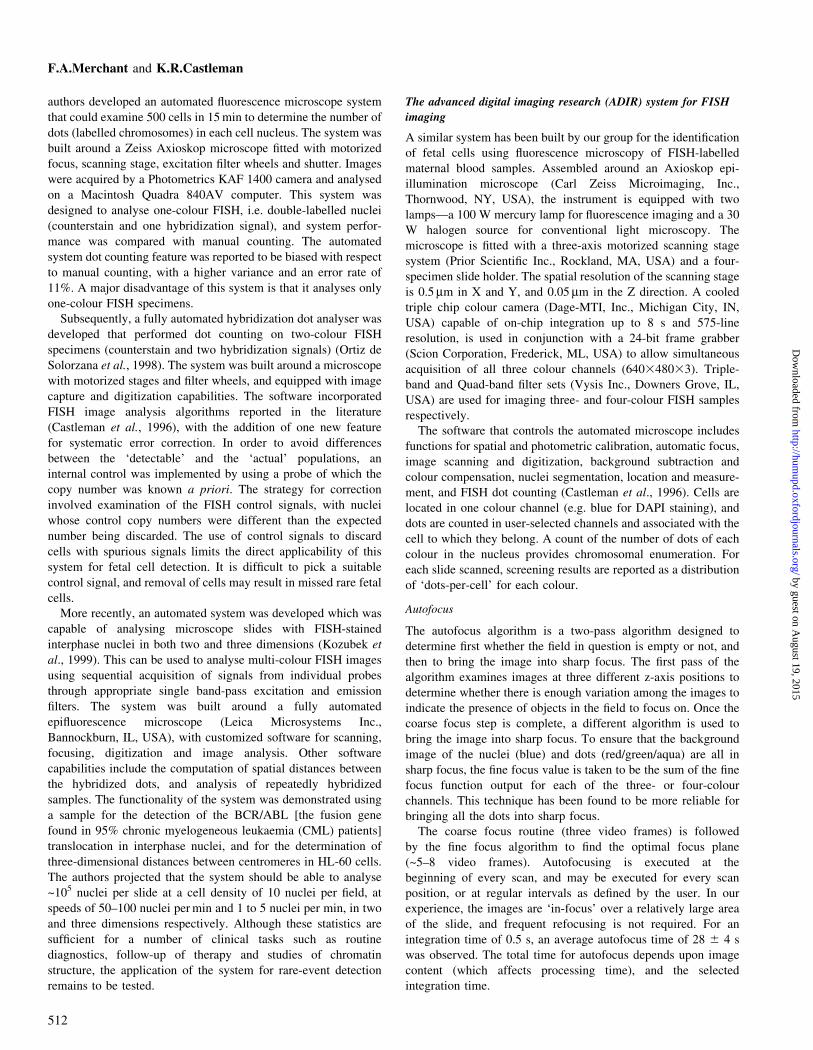
Figure 3. (A) Fluorescence image of ®ve female (XX) cells and one male (XY) cell. Adult female blood was mixed with male blood (100:1 dilution) and processedvia FISH. Cells are counterstained blue (DAPI); X chromosomes are labelled in red (TRITC); the Y chromosome is labelled in green (FITC). (B) Results ofautomated image analysis. As illustrated here, the software accurately detects single cells, separates touching cells, and detects the red and green dots in individualcells. Original magni®cation = 3630.
F.A.Merchant and K.R.Castleman
514
by guest on August 19, 2015
http://humupd.oxfordjournals.org/
Dow
nloaded from
D21S342; 21q22.13-q22.2) and SpectrumGreen (RB1; 13q14)
(Vysis Inc.). An intensity pro®le of the line connecting the arrows
in Figure 1A is presented in Figure 1B. A process has been
developed that effectively isolates the three ¯uorophores by
separating them into three colour channels (RGB) of the digitized
image (Castleman, 1994). The method, which can account for
background level and unequal integration times, is applied to all
images prior to dot counting. Figure 1C and 1D demonstrate the
application of this technique to a peripheral blood cell
(lymphocyte) processed for FISH.
Dot counting
Hybridization dots are located by thresholding in the probe colour
channels. A minimum size criterion is used to eliminate noise
spikes, and shape analysis is used to ¯ag non-compact dots. The
location of dots found is compared with the cell masks to
associate each chromosomal dot with its corresponding cell.
Finally, a statistical model is used to determine unbiased
estimates of the proportion of cells having each number of dots.
The befuddlement theory (Castleman and White, 1995) provides
guidelines for dot counting algorithm development by establish-
ing the point at which further reduction of dot counting errors will
not additionally improve the estimate. This occurs when statistical
sampling error outweighs dot-counting error.
Handling thick specimens
Automated microscope instruments almost uniformly carry out
their analysis on two-dimensional images, and their ability to
handle thick specimens is severely limited. In thick specimen
preparations, FISH dots may not all occur at the same depth in the
focused nuclei. Also, the presence of artefacts at times may result
in a highly defocused image of cells. While automatic focusing is
suf®cient for detecting nuclei and FISH signals, in the case of
thick specimens the FISH dots that fall above or below the focal
plane can be lost. A technique has been developed by the present
authors to enhance the image content available in microscope
images of thick sections by performing optical section deblurring,
followed by image fusion using wavelet transforms.
Originally, the deblurring of optical section images was
performed using a simple method that involved subtracting
adjacent plane images which had been blurred with an appropriate
defocus point spread function (Weinstein and Castleman, 1971).
While this technique could not recover the specimen function
exactly, it did improve optical section images at reasonable
computational expense. The deblurred section images could then
be combined in the wavelet transform domain by taking the
maximum-amplitude coef®cient at each co-ordinate. An inverse
wavelet transform of the resulting coef®cients then reconstructed
the fused image (Lu and Healy, 1994; Lu et al., 1994). It was
found that deblurring prior to wavelet fusion signi®cantly
improved the measured sharpness of the processed images.
Figure 2A presents colour images of FISH-labelled lymphocytes
that were acquired at focus positions 1 mm apart and deblurred.
An example of wavelet image fusion is shown in Figure 2B.
Optical section deblurring followed by image fusion produced an
image in which all of the dots are visible.
System performance
Arti®cial samples of female blood spiked with male blood
(emulating speci®c fetal cell to maternal cell ratios) were
processed using the prototype automated imaging system to
investigate the feasibility of automated detection. The samples
(provided by Dr Laird Jackson, MCP Hahnemann University,
Philadelphia, PA, USA) were prepared for FISH using DAPI as
the counterstain, with X and Y chromosomes labelled with
tetramethylrhodamine B isothiocyanate (TRITC) and FITC
respectively. An example illustrating the operation of the
automated cell detection and dot-counting algorithm is presented
in Figure 3. Figure 3A shows a ¯uorescence image of ®ve female
(XX) cells and one male cell. The specimen was obtained from
female blood mixed with male blood (100:1 dilution), and
processed via FISH. The results of automated image analysis are
illustrated in Figure 3B. The software accurately: (i) detects single
cells; (ii) separates touching cells; and (iii) detects the red and
green dots in the isolated cells.
Automated detection of male cells (XY, one red dot, one green
dot) from surrounding female cells (XX, two red dots) was
performed for four different dilutions of male to female cells,
namely 1:10, 1: 100 and 1:500 and 1:1000. Table I presents a
direct comparison of automated dot counting with manual dot
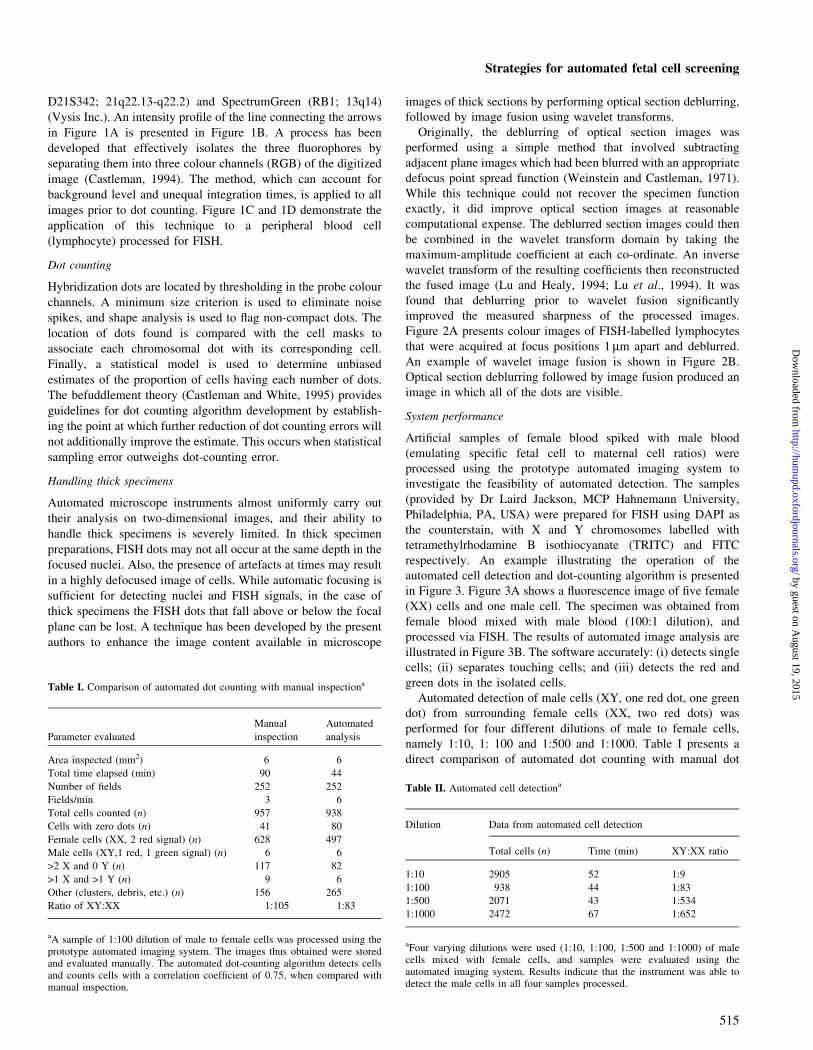
Table I. Comparison of automated dot counting with manual inspectiona
Parameter evaluated
Manual
inspection
Automated
analysis
Area inspected (mm2) 6 6
Total time elapsed (min) 90 44
Number of ®elds 252 252
Fields/min 3 6
Total cells counted (n) 957 938
Cells with zero dots (n) 41 80
Female cells (XX, 2 red signal) (n) 628 497
Male cells (XY,1 red, 1 green signal) (n) 6 6
>2 X and 0 Y (n) 117 82
>1 X and >1 Y (n) 9 6
Other (clusters, debris, etc.) (n) 156 265
Ratio of XY:XX 1:105 1:83
aA sample of 1:100 dilution of male to female cells was processed using theprototype automated imaging system. The images thus obtained were storedand evaluated manually. The automated dot-counting algorithm detects cellsand counts cells with a correlation coef®cient of 0.75, when compared withmanual inspection.
Table II. Automated cell detectiona
Dilution Data from automated cell detection
Total cells (n) Time (min) XY:XX ratio
1:10 2905 52 1:9
1:100 938 44 1:83
1:500 2071 43 1:534
1:1000 2472 67 1:652
aFour varying dilutions were used (1:10, 1:100, 1:500 and 1:1000) of malecells mixed with female cells, and samples were evaluated using theautomated imaging system. Results indicate that the instrument was able todetect the male cells in all four samples processed.
Strategies for automated fetal cell screening
515
by guest on August 19, 2015
http://humupd.oxfordjournals.org/
Dow
nloaded from
counting. A sample of 1:100 dilution of male to female cells was
processed using the prototype automated imaging system. The
images thus obtained were stored and evaluated manually. As
shown in Table I, the automated dot counting algorithm detects
cells and counts cells with a correlation coef®cient of 0.75, when
compared with manual inspection. In order to evaluate the ability
of this instrument to detect rare cells, four dilutions were used
(1:10, 1:100, 1:500 and 1:1000) of male cells mixed with female
cells. The results of that study are presented in Table II. Male
cells could be detected in both the lower and higher dilutions.
Since the ratio of 1:1000 closely mimics the actual proportion of
fetal cells recovered after enrichment in maternal blood (Steele et
al., 1996), the automated system should be able to detect fetal
cells in maternal blood at enrichment ratios in the range of 2±5
cells per 3000 maternal cells. A manual evaluation of 3000 cells
takes approximately 3±4 h. As seen in Table II, the automated
system should be able to accomplish the same task in
approximately half the time. These results suggest feasibility for
development of chromosome-based (FISH) detection of nucleated
fetal cells found in the maternal circulation. Further re®nements
in both instrumentation and slide preparations are currently in
progress.
Limitations of FISH
There are certain drawbacks inherent in using the ¯uorescence
imaging approach for fetal cell detection: (i) the inherently low
light levels place limits on how quickly the system can operate;
(ii) depth-of-®eld is a limitation, with small dots distributed inside
ellipsoidal interphase cells; (iii) auto¯uorescence and photo-
bleaching can affect performance; and (iv) the system is more
expensive because ¯uorescence lamps are costly (life of
approximately 200 h).
Furthermore, in FISH samples the hybridization and detection
ef®ciency, as well as the geometry or chromosomal location
within the nucleus, directly in¯uences the enumeration of
chromosomes. In any population of euploid cells, although
~90% of the cells display two signals, a number of cells appear
to have either one, three or four signals. Thus, a large number of
cells must be analysed in order to obtain statistically signi®cant
data on dot counts.
Transmitted-light imaging of fetal cells
An alternative approach is to use transmitted light imaging to
detect the fetal cells automatically, thereby avoiding the
complexities of ¯uorescence imaging, and providing a faster,
and less expensive technique for fetal cell detection. One
approach describing the use of transmitted-light (bright®eld)
microscopy for the detection of fetal cells has been reported
(Takabayashi et al., 1995). This study demonstrated that nRBCs
may be isolated from maternal blood using a simple Percoll
discontinuous density gradient centrifugation method. The
enriched maternal blood is subjected to a May±Giemsa staining
protocol, and nRBCs may be microscopically identi®ed from the
surrounding maternal cells based on distinct morphological
features speci®c to the nucleated erythrocytes. Sensitive and
speci®c analytical methods such as PCR and FISH may then be
applied to perform genetic testing for gender and aneuploidy.
The ADIR system for bright®eld imaging
A study was performed to evaluate the feasibility of using
morphological descriptors for the detection of fetal cells from
maternal blood. The automated screening process used trans-
mitted light (not ¯uorescence) for cell ®nding. Visual analysis and
FISH dot-counting were then used to perform genetic testing.
Maternal blood enrichment was performed using the Percoll
discontinuous density gradient separation protocol described
previously (Takabayashi et al., 1995). Peripheral blood from
pregnant women at between 10 and 27 weeks gestation was
collected serially prior to invasive prenatal diagnostic procedures
(either chorionic villus sampling or amniocentesis). Following
centrifugation at 4003g for 30 min, the granulocytes with nRBCs
separated at the interface of 1.075 and 1.085 g/ml Percoll
gradients. The enriched maternal blood was then processed using
the May±Giemsa staining protocol, and slides were examined
microscopically using transmitted light.
Following minor modi®cations, the prototype instrument
described earlier (for FISH imaging) was used to perform
automated detection of rare nRBCs in maternal blood. Since in
bright®eld, no integration time is required, an average autofocus
time of 1864 s was recorded, with a slide-scanning rate of 17 6 1
images per min.
Image analysis
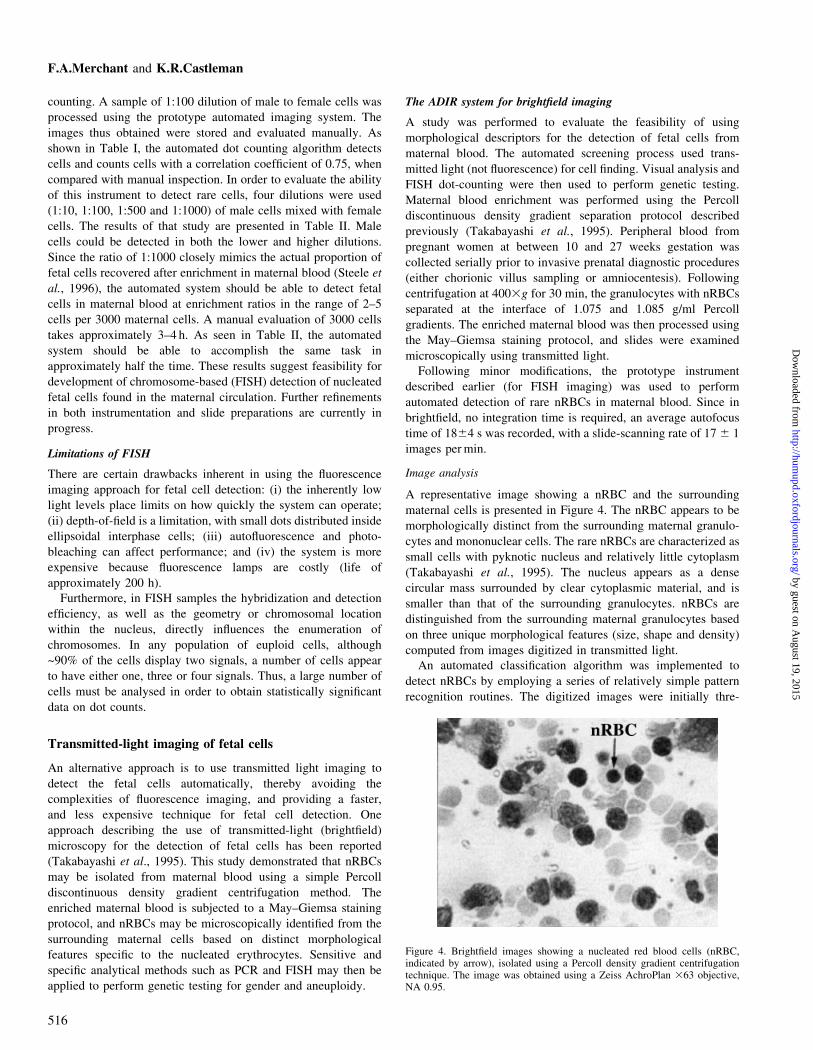
A representative image showing a nRBC and the surrounding
maternal cells is presented in Figure 4. The nRBC appears to be
morphologically distinct from the surrounding maternal granulo-
cytes and mononuclear cells. The rare nRBCs are characterized as
small cells with pyknotic nucleus and relatively little cytoplasm
(Takabayashi et al., 1995). The nucleus appears as a dense
circular mass surrounded by clear cytoplasmic material, and is
smaller than that of the surrounding granulocytes. nRBCs are
distinguished from the surrounding maternal granulocytes based
on three unique morphological features (size, shape and density)
computed from images digitized in transmitted light.
An automated classi®cation algorithm was implemented to
detect nRBCs by employing a series of relatively simple pattern
recognition routines. The digitized images were initially thre-
Figure 4. Bright®eld images showing a nucleated red blood cells (nRBC,indicated by arrow), isolated using a Percoll density gradient centrifugationtechnique. The image was obtained using a Zeiss AchroPlan 363 objective,NA 0.95.
F.A.Merchant and K.R.Castleman
516
by guest on August 19, 2015
http://humupd.oxfordjournals.org/
Dow
nloaded from

sholded to obtain binary images of cells. The cells were then
uniquely identi®ed using a region-labelling procedure as before.
The density of the nucleus was computed as the average optical
density (AOD), the size of the nucleus was taken as cell area, and
the circularity of nucleus was quanti®ed by the shape factor using
digital image analysis.
System performance
A blinded study was conducted using seven maternal blood
samples. The slides were analysed automatically by our group and
manually at Dr Bischoff's laboratory (Baylor College of
Medicine, Houston, TX). The total number of ®elds analysed
per slide ranged from 7500 to 75 000. Of the total cells scored, the
automated system detected 25% as nRBCs. Upon manual
examination, 3% of the automatically detected cells were found
to be false-positives, and 1.5% of the nRBCs were missed by the
automated system. The locations of the detected nRBCs were
recorded and stored for each individual slide.
When the cells had been detected via light microscopy and
their location recorded, they were hybridized for FISH. The
detected and hybridized nRBCs were then relocated and tested for
gender using ¯uorescence microscopy. The system can accurately
relocate in both the X and Y directions to an accuracy of 61 mm.
Results
A total of seven samples was analysed, but subsequent FISH
analysis was possible on only four samples. The results are
summarized in Table III. The number of nRBCs identi®ed varied
for the different samples, ranging from 5 to 327 cells. The ratio of
nRBCs to maternal cells varied from 1:4000 to 1:40 000; hence,
there was an ~10-fold variation in the number of nRBCs
identi®ed.
Initially, it was believed that all nRBCs isolated from a
maternal sample were fetal in origin. This assumption was made
because of reports (Pembrey et al., 1973) that nRBCs were rarely
seen in peripheral blood samples from pregnant women. The more
recent and more sensitive techniques of enrichment used to detect
fetal cells have now uncovered a previously under-appreciated
population of maternal nRBCs that circulate during pregnancy
(Slunga-Tallberg et al., 1995).
There are several factors that in¯uence the number of nRBCs
present in maternal blood, including gestation age, loss of cells
during enrichment, aneuploidy status of the fetus and pre-
eclampsia. Other factors likely to in¯uence the number of fetal
cells present in the mother include blood group incompatibility
and prior sensitization, and whether or not an invasive procedure
has been previously performed. So far, several estimates have
been reported for the number of nucleated cells in maternal blood.
One group (Hall and Williams, 1992) estimated that the ratio of
fetal nucleated cells to maternal nucleated cells ranged from
1:4.753106 to 1:1.63107. Others (Hamada et al., 1993) estimated
the ratio of fetal nucleated cells to maternal nucleated cells; fetal
cell frequencies in successive trimesters were 0.27, 3.52 and
8.563105 respectively. Subsequent to FISH analysis, it was found
that 50% of the slides (two out of four could not be FISH-
labelled) had fnRBCs, and the fetal gender was accurately
identi®ed in all cells found. The ratio of fnRBCs to that of
maternal nRBCs in those samples was approximately 1:75 and
1:175.
However, out of the seven specimen slides processed for FISH
following automated detection of nRBCs, FISH signals were
detected in only four slides (57%). Also, the quality and quantity
of the FISH signals varied for each of the specimen slides
processed (Table IV). In addition, FISH signals were observed in
only 22 6 4% of the total nRBCs found. Although other
mononuclear cells in surrounding regions of the nRBCs showed
FISH signals, the appearance of FISH signals in the nRBCs
varied. Thus, it was concluded that the FISH protocol was
functioning, and the variability existed only in the nRBCs. Some
Table IV. Percentage FISH signals observed in the detected nRBCs
Slide Total Total nRBCs with Cells with X
nRBCs FISH signals and Y
R0743 77 20 (26) 1
R0943 327 55 (17) 2
R0391 18 4 (22) 0
R0578 33 7 (21) 0
Values in parentheses are percentages.
Table III. Automated detection of NRBCs followed by FISH to detect male fetal cells
Slide Total area Total Total Total Total Amnio (A)/ FISH cells
scanned ®eldsa time cellsb nRBCs CVS (C) w/XY
(cm2) (h) results fnRBCs
R0743 6 75 000 72 1 575 000 77 (A) 46 XY 1
R0943 5.36 67 000 65 1 423 750 327 (C) 46 XY 2
R0391 2.72 34 000 30 722 500 18 (C) 46 XY 0
R0578 0.6 7600 8 202 500 33 (A) 46 XY 0
and 46 XXc
R0567 1.2 15 000 15 275 400 5 (A) 46 XY NA
R0576 1.0 12 000 12 244 800 10 (A) 46 XY NA
R0460 0.5 6500 6 110 500 6 (C) 46 XY NA
a~10±15% of ®elds had less than three cells.b~25 cells/®eld scored.cAmniocentesis analysis for specimen R0578 reported twinsNA = FISH data not available.
Strategies for automated fetal cell screening
517
by guest on August 19, 2015
http://humupd.oxfordjournals.org/
Dow
nloaded from
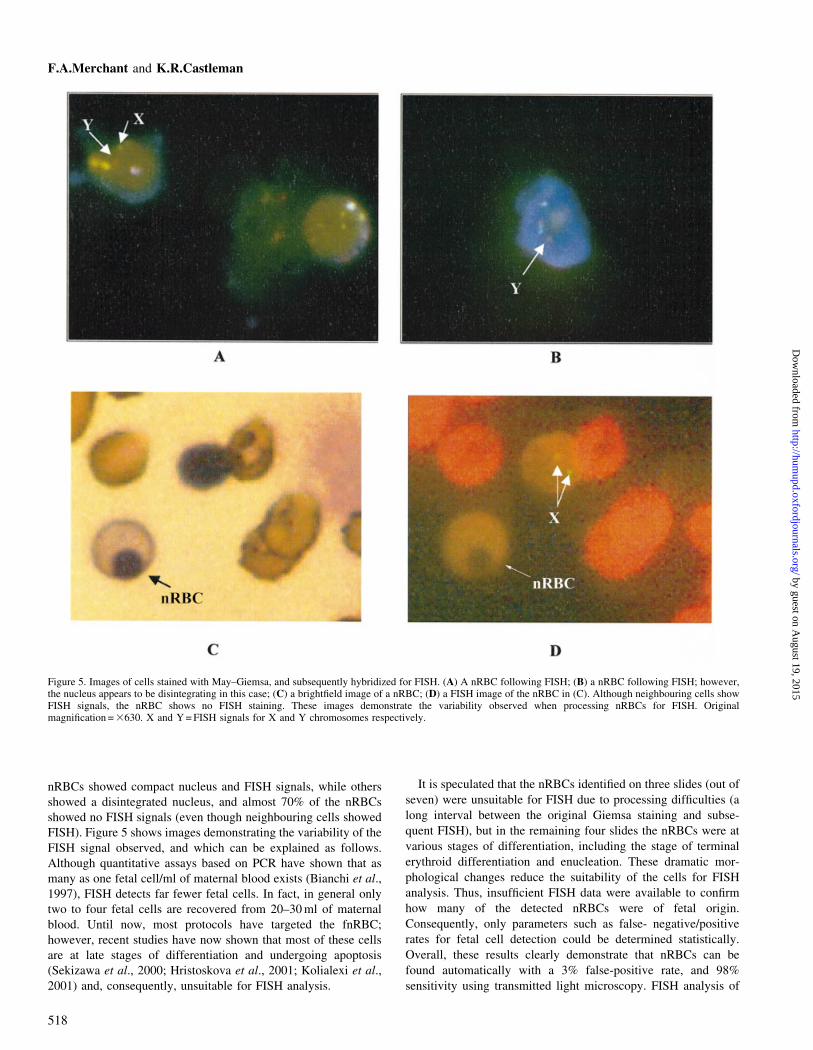
nRBCs showed compact nucleus and FISH signals, while others
showed a disintegrated nucleus, and almost 70% of the nRBCs
showed no FISH signals (even though neighbouring cells showed
FISH). Figure 5 shows images demonstrating the variability of the
FISH signal observed, and which can be explained as follows.
Although quantitative assays based on PCR have shown that as
many as one fetal cell/ml of maternal blood exists (Bianchi et al.,
1997), FISH detects far fewer fetal cells. In fact, in general only
two to four fetal cells are recovered from 20±30 ml of maternal
blood. Until now, most protocols have targeted the fnRBC;
however, recent studies have now shown that most of these cells
are at late stages of differentiation and undergoing apoptosis
(Sekizawa et al., 2000; Hristoskova et al., 2001; Kolialexi et al.,
2001) and, consequently, unsuitable for FISH analysis.
It is speculated that the nRBCs identi®ed on three slides (out of
seven) were unsuitable for FISH due to processing dif®culties (a
long interval between the original Giemsa staining and subse-
quent FISH), but in the remaining four slides the nRBCs were at
various stages of differentiation, including the stage of terminal
erythroid differentiation and enucleation. These dramatic mor-
phological changes reduce the suitability of the cells for FISH
analysis. Thus, insuf®cient FISH data were available to con®rm
how many of the detected nRBCs were of fetal origin.
Consequently, only parameters such as false- negative/positive
rates for fetal cell detection could be determined statistically.
Overall, these results clearly demonstrate that nRBCs can be
found automatically with a 3% false-positive rate, and 98%
sensitivity using transmitted light microscopy. FISH analysis of
Figure 5. Images of cells stained with May±Giemsa, and subsequently hybridized for FISH. (A) A nRBC following FISH; (B) a nRBC following FISH; however,the nucleus appears to be disintegrating in this case; (C) a bright®eld image of a nRBC; (D) a FISH image of the nRBC in (C). Although neighbouring cells showFISH signals, the nRBC shows no FISH staining. These images demonstrate the variability observed when processing nRBCs for FISH. Originalmagni®cation = 3630. X and Y = FISH signals for X and Y chromosomes respectively.
F.A.Merchant and K.R.Castleman
518
by guest on August 19, 2015
http://humupd.oxfordjournals.org/
Dow
nloaded from

the nRBCs is, however, largely variable, being dependent on the
state of differentiation of the erythroid cells.
These results, together with those of other studies, have now
shown that these cells may not be the ideal target cell for
enrichment, given that most are in late stages of differentiation
and are undergoing apoptosis (Sekizawa et al., 2000; Hristoskova
et al., 2001; Kolialexi et al., 2001). An alternative approach might
be to evaluate the potential for fetal cell analysis of progenitor
cells from whole blood (Little et al., 1997).
Conclusions
Although fetal cells are known to exist in the maternal blood
circulation, they are few in number and are not detected in every
case. This is primarily because the recovered cell population is
not analysed in its entirety. As is frequently observed with
separation protocols, many thousands of cells are recovered
following enrichment. Following FISH, however, only a small
fraction of these cells can be scored. In addition, due to individual
bias at the time of scoring, FISH results may be inconsistent,
requiring enforcement of strict scoring criteria. However, this is
dif®cult to achieve across different laboratories. Thus, it is clear
that an unbiased analysis of almost all of the recovered cells is
needed, and this can be achieved by using automated image
cytometry.
Three strategies for the automated detection of fetal cells were
discussed. Each approach exploits an independent feature of fetal
cells (immunophenotype, genetic constitution or morphology) for
its detection, and each offers different advantages and limitations.
Unfortunately, none of these approaches has been extensively
tested for the detection of fetal cells in maternal blood samples,
thus making it dif®cult to judge their ef®cacies.
Immunophenotyping
The immunophenotyping approach using antibodies for fetal
haemoglobin has the advantage of scanning specimens at higher
speeds using transmitted light imaging for the detection of HbF-
positive cells. However, a second scan is typically required in this
approach for genetic analysis using FISH. A key disadvantage of
this approach is that a speci®c marker for fetal haemoglobin is
lacking at the present time.
The Applied Imaging system is a multi-mode technique that
was developed to acquire transmitted light and ¯uorescence
images simultaneously, but it encountered problems regarding an
overlap between the DAPI (nuclear) and FITC (HbF/cytoplasm)
stained areas.
The scanning cytometer (Bajaj et al., 2000) provides faster
focusing and segmentation algorithms, but requires manual
interaction for ®lter changes; this makes the system only semi-
automated, which is not practical for routine screening. The
application of this system to clinical samples of peripheral
maternal blood would provide more meaningful data regarding its
potential for fetal cell diagnosis.
FISH
FISH for the detection of fetal cells is relatively straightforward
when the fetus is male, whereas in the case of a female fetus,
detection is only possible if the fetus has a chromosomal
aneuploidy. Several systems for automated FISH dot counting
have been developed, and a considerable amount of published
data exists regarding FISH image analysis, and the statistical
interpretation of FISH data. These studies have also been
successfully incorporated into semi- or fully automated imaging
systems (Ravkin and Temov, 1998; Kozubek et al., 1999).
However, none of the automated systems developed to date has
been extensively tested to determine the clinical feasibility of
automatically detecting fetal cells from maternal blood samples.
The FISH-based system developed by the present authors' group
is in the ®nal development stage, and is scheduled for installation
at MCP Hahnemann University, PA, USA (Dr Laird Jackson's
Laboratory) for clinical testing.
The key limitation is that scanning thousands of cells using
¯uorescence techniques is not practical for routine cytogenetic
analysis. Furthermore, the reliability of results is heavily
dependent on slide quality. Some of the factors responsible for
errors in FISH dot counting include: (i) overlapping nuclei; (ii)
poor microscopic resolution of contiguous signals; (iii) split
signals; (iv) touching cells with overlap; and (v) spatial location
of signals (a dot that is unclear in one plane may become clear on
refocusing in another plane). There are numerous image analysis
and statistical methods that can be applied to address these issues
(Carothers, 1994; Castleman, 1994; Castleman and White, 1995;
Castleman et al., 1996; Netten et al., 1997). However, extensive
implementation of such correction methods tends to increase the
sample processing time, whereas discarding cells with spurious
signals may result in missing the rare fetal cells. Most automated
systems based on the FISH approach try to balance the use of
correction methods versus simply discarding problematic cells to
achieve reasonable slide-scanning rates. Hence, an extensive
evaluation of this approach is required to determine its clinical
feasibility. Employing the approach of isolating every object or
cluster of objects that have a Y-signal, irrespective of its
morphological integrity would increase the odds of ®nding a
fetal cell in the case of a male fetus.
Morphology
Finally, the use of morphological descriptors is highly
promising because it does not need speci®c fetal cell markers,
and also has the advantage of reduced scanning times.
Currently, its major limitation is the target cell type. Despite
the presence of unique morphological descriptors, most nRBCs
are in various stages of differentiation and are thus not robust
for FISH analysis. PCR can be used instead of FISH, but
there is some concern over allele-dropout and PCR ef®ciency
using the nRBCs. In addition, a signi®cant number of
separated nRBCs are maternal, so the only mutations or
genes that can be detected with PCR must be paternal in
origin. Recently, culturing erythroid progenitor cells from
maternal blood has been considered as a potential alternative
method to increase the number of target fetal cells available
for genetic analysis (Little et al., 1997). However, culturing
techniques designed to stimulate fetal cells have so far proved
to be unsuccessful (Manotaya et al., 2002; Zimmermann et al.,
2002). One approach is to use progenitor cells to increase the
number of target fetal cells available for genetic analysis via
FISH. Fetal progenitor cells can then be examined to evaluate
any characteristic morphological features and, based on these
Strategies for automated fetal cell screening
519
by guest on August 19, 2015
http://humupd.oxfordjournals.org/
Dow
nloaded from
structural descriptors, transmitted light automated imaging can
be implemented.
Summary
There is a pressing need for automated microscopy for the
detection of fetal cells. Automation is not only required for the
eventual clinical realization of fetal cell diagnosis using maternal
blood, but is also critical for research progress to be made in the
®eld. The current status of automation in fetal cell screening is
that image cytometry-based automated approaches have trans-
cended the investigational and development stage. A systematic
application of these approaches to the actual detection of fetal
cells from maternal blood is impending. This will provide the
statistical data required to determine whether or not imaging
cytometry can provide a practical solution to the problem of non-
invasive fetal cell screening. Moreover, irrespective of the
eventual status of clinical non-invasive fetal cell screening, the
incorporation of automation in current research is critical in order
to achieve any breakthrough technological advances.
Commercialization
Unfortunately, an automated microscopy system especially for
fetal cell screening is not commercially available at the present
time, although we are currently in the process of completing the
development and testing of an automated microscopy system for
transmitted light and ¯uorescence microscopy. Several of the
systems discussed in this review have been developed at academic
institutions and have not (yet) been commercialized. Applied
Imaging Corporation (Santa Clara, CA, USA) reported the
development of a system in 1998, but its current commercializa-
tion status is not known. CompuCyte LSC (CompuCyte Corp.,
Cambridge, MA, USA) sells a laser scanning cytometer
(Kamentsky et al., 1997a,b). Laser scanning cytometry (LSC)
uses lasers to excite ¯uorochromes in cellular specimens and
detects the ¯uorescence in discrete wavelengths with multiple
photomultiplier tubes. LSC, like ¯ow cytometry, yields high-
content stoichiometric data on heterogeneous populations of large
numbers of cells, and offers software analysis tools to obtain
statistical data on the populations. It can be used to count and
measure the ¯uorescence of FISH probe spots, or to navigate
around a segmented nucleus in order to identify cytoplasmic
¯uorescence and distinguish it from nuclear ¯uorescence. The
resolution of LSC is relatively low, and only two-dimensional
studies are possible; furthermore, the use of lasers makes the
equipment expensive. Most importantly, this system has not found
wide use in the area of clinical cytogenetics, and its applicability
to the problem of fetal cell detection is presently unknown. Most
recently, MetaSystems (Altlussheim, Germany) introduced a
high-throughput scanning system which is currently being
evaluated for the detection of fetal cells (Plesch and Loerch,
2001).
Future work
Several key issues related to the detection of fetal cells from
maternal blood have yet to be addressed. First, can the fetal cell
detection rate be improved by scoring most or all cells recovered
following enrichment? Second, can we reduce false-positive rates
by removing observer bias? Third, do fetal progenitor cells persist
from prior pregnancies? Automation may play a signi®cant role in
addressing these issues.
Acknowledgements
The authors thank Dr Laird Jackson from MCP Hahnemann University,Philadelphia, PA, USA for providing FISH specimens, and Dr FaridehBischoff from Baylor College of Medicine, Houston, TX, USA for providingMay±Giemsa-stained specimens. The development of the bright®eld approachfor automated microscopy was supported by NIH SBIR Grant No. 1R43HD37308-01, and the development of the FISH-based automated microscopysystem is supported by NIH SBIR Grant No. 2R44 HD34719-02.
References
Bajaj, S., Welsh, J.B., Leif, R.C. and Price, J.H. (2000) Ultra-rare-eventdetection performance of a custom scanning cytometer on a modelpreparation of fetal nRBCs. Cytometry, 39, 285±294.
Bianchi, D.W., Zickwolf, G.K., Yih, M.C., Flint, A.F., Geifman, O.H.,Erikson, M.S. and Williams, J.M. (1993) Erythroid -speci®c antibodiesenhance detection of fetal nucleated erythrocytes in maternal blood.Prenat. Diagn., 13, 293±300.
Bianchi, D.W., Williams, J.M., Sullivan, L.M., Hanson, F.W., Klinger, K.W.and Shuber, A.P. (1997) PCR quantitation of fetal cells in maternal bloodin normal and aneuploid pregnancies. Am. J. Hum. Genet., 61, 822±829.
Bianchi, D.W., Simpson, J.L., Jackson, L.G., Elias, S., Holzgreve, W., Evans,M.I., Dukes, K.A., Sullivan, L.M., Klinger, K.W., Bischoff, F.Z., et al.(2001) Fetal gender and aneuploidy detection using fetal cells in maternalblood: analysis of NIFTY I data. Prenat. Diagn., 22, 609±615.
Bravo-Zanoguera, M., Massenbach, B., Kellner, A. and Price, J.H. (1998)High-performance autofocus circuit for biological microscopy. Rev. Sci.Instrum., 69, 3966±3977.
Carothers, A.D. (1994) Counting, measuring, and mapping in FISH-labeledcells: Sample size considerations and implications for automation.Cytometry, 16, 298±304.
Castleman, K.R. (1994) Digital image color compensation with unequalintegration periods. Bioimaging, 2, 160±162.
Castleman, K.R. and White, B.S. (1995) Dot-count proportion estimation in®sh specimens. Bioimaging, 3, 88±93.
Castleman, K.R., Riopka, T.P. and Wu, Q. (1996) FISH Image Analysis. IEEEEngineering in Medicine and Biology, 15, 67±75.
DeMaria, M.A., Zheng, Y.L., Zhen, D.K., Weinschenk, N.M., Vadnais, T.J.and Bianchi, D.W. (1996) Improved fetal nucleated erythrocyte sortingpurity using intracellular antifetal hemoglobin and Hoechst 33342.Cytometry, 25, 37±45.
Elias, S., Price, J., Dockter, M., Wachtel, S., Tharapel, A., Simpson, J.L. andKlinger, K.W. (1992) First trimester prenatal diagnosis of trisomy 21 infetal cells from maternal blood. Lancet, 340, 1033.
Firth, H., Boyd, P.A., Chamberlain, P., Mackenzie, I.Z., Lindenbaum, R.H.and Hudson, S.M. (1991) Severe limb abnormalities after chorionic villussampling at 56 to 66 days. Lancet, 1, 762±763.
Ganshirt-Ahlert, D., Burschyk M., Garritsen H.S.P., Helmer, L., Miny, P.,Horst, J., Schneider, H.P. and Holzgreve, W. (1992) Magnetic cell sortingand the transferrin receptor as potential means of prenatal diagnosis frommaternal blood. Am. J. Obstet. Gynecol., 166, 1350±1355.
Ganshirt-Ahlert, D., Borjesson-Stoll, R.M., Burschyk, M., Dohr A., Garritsen,H.S., Helmer, E., Miny, P., Velasco, M., Walde, C., Patterson, D., et al.(1993) Detection of fetal trisomies 21 and 18 from maternal blood usingtriple gradient and magnetic cell sorting. Am. J. Reprod. Immunol., 30,194±201.
Geifman-Holtzman, O., Bernstein I.M., Berry S.M., Holtzman, E.J., Vadnais,T.J., DeMaria, M.A. and Bianchi, D.W. (1996) Fetal RhD genotyping infetal cells ¯ow sorted from maternal blood. Am. J. Obstet. Gynecol., 174,818±822.
Groen, F.C.A., Young, I.T. and Ligthart, G. (1985) A comparison of differentfocus functions for use in autofocus algorithms. Cytometry, 6, 81±91.
Hall, J.M. and Williams, S.J. Isolation and puri®cation of CD34++ fetal cellsfrom maternal blood. Am. J. Hum. Genet., 51, A257, 1992.
Hamada, H., Arinami, T., Kubo, T., Hamaguchi, H. and Iwasaki, H. (1993)Fetal nucleated cells in maternal peripheral blood: frequency andrelationship to gestational age. Hum. Genet., 91, 427±432.
Hristoskova, S., Holzgreve, W. and Hahn, S. (2001) More than One-Half of
F.A.Merchant and K.R.Castleman
520
by guest on August 19, 2015
http://humupd.oxfordjournals.org/
Dow
nloaded from

the erythroblasts in the fetal circulation and cord blood are TUNELpositive. Clin. Chem., 47, 1870±1871.
Iverson, G.M., Bianchi, D.W., Cann, H.M. and Herzenberg, L.A. (1981)Detection and isolation of fetal cells from maternal blood using the¯uorescence-activated cell sorter (FACS). Prenat. Diagn., 1, 61±73.
Kamentsky, L.A., Burger, D.E., Gershman, R.J., Kamentsky, L.D. and Luther,E. (1997a) Slide-based laser scanning cytometry. Acta Cytol., 41, 123±143.
Kamentsky, L.A., Kamentsky, L.D., Fletcher, J.A., Kurose, A. and Sasaki, K.(1997b) Methods for automatic multiparameter analysis of ¯uorescence insitu hybridized specimens with a laser scanning cytometer. Cytometry, 27,117±125.
Kolialexi, A., Tsangaris, G.T., Antsaklis, A., Tzortzatou, F., Amentas, C.,Koratzis, A. and Mavrou, A. (2001) Apoptosis in maternal peripheralblood during pregnancy. Fetal Diagn. Ther., 16, 32±37.
Kozubek, M., Kozubek, S., Lukasova, E., Mareckova, A., Bartova, E.,Skalnikova, M. and Jergova, A. (1999) High-resolution cytometry ofFISH dots in interphase cell nuclei. Cytometry, 36, 279±293.
Little, M.T., Langlois, S., Wilson, R.D. and Lansdorp, P.M. (1997) Frequencyof fetal cells in sorted subpopulations of nucleated erythoid and CD34+hemapoietic progenitor cells from maternal peripheral blood. Blood, 89,2347±2358.
Lu, J., Healy, D.M. and Weaver, J.B. (1994a) Contrast enhancement ofmedical images using multiscale edge representation. OpticalEngineering, 33, 2151±2161.
Lu, J. and Healy, D.M. (1994b) Contrast enhancement via multiscale gradienttransformation. Proc. ICIP '94, II, 482±486.
Manotaya, S., Elias, S., Lewis, D.E., Simpson, J.L. and Bischoff, F.Z. (2002)Evaluation of a culture system for enrichment of CD34+ hematopoieticprogenitor cells present in maternal blood. Fetal Diagn. Ther., 17, 90±96.
Merchant, F.A., Aggarwal, S.J., Diller, K.R., Bartels, K.A. and Bovik, A.C.(1993) Three-dimensional distribution of damaged cells in cryopreservedpancreatic islets as determined by laser scanning confocal microscopy. J.Microsc., 169: 329±338.
Netten, H., Young, I.T., van Vliet, L.J., Tanke, H.J., Vroljik, H. and Sloos,W.C.R. (1997) FISH and Chips: Automation of ¯uorescent dot countingin interphase cell nuclei. Cytometry, 28, 1±10.
Oosterwijk, J.C., Mesker, W.E. and Ouwerkerk, M.C. (1996) Detection offetal erythroblasts in maternal blood by one-step gradient enrichment andimmunocytochemical recognition. Early Hum. Dev., 47 (Suppl), 595±597.
Oosterwijk, J.C., Mesker, W.E., Ouwerkerkerk-vanVelzen, M.C., Knep¯e,C.F., Wiesmeijer, K.C., van den Burg, M.J., Beverstock, G.C., Bernini,L.F., van Ommen, G.J., Kanhai, H.H. and Tanke, H.J. (1998a)Development of a preparation and staining method for fetalerythroblasts in maternal blood: Simultaneous immunocytochemicalstaining and FISH analysis. Cytometry, 32, 170±177.
Oosterwijk J.C., Mesker, W.E., Ouwerkerk-van Velzen, M.C., Knep¯e, C.F.,Wiesmeijer, K.C., Beverstock, G.C., van Ommen, G.J., Tanke, H.J. andKanhai, H.H. (1998b) Prenatal diagnosis of trisomy 13 on fetal cellsobtained from maternal blood after minor enrichment. Prenat. Diagn., 18,1082±1085.
Oosterwijk J.C., Knep¯e, C.F.H.M., Mesker, W.E., Vrolijk, H., Sloos, W.C.,Pattenier, H., Ravkin, I., van Ommen, G.J., Kanhai, H.H. and Tanke, H.J.(1998c) Strategies for rare-event detection: An approach for automatedfetal cell detection in maternal blood. Am. J. Hum. Genet., 63, 1783±1792.
Ortiz de Solorzano, C., Sanyos, A., Vallcorba, I., Garcia-Sagredo, J.M. and delPozo, F. (1998) Automated FISH spot counting in interphase nuclei:statistical validation and data correction. Cytometry, 31, 93±99.
Parry, W.L. and Hemstreet, G.P. (1988) Cancer detection by quantitative¯uorescence image analysis. J. Urol., 139, 270±274.
Pembrey, M.E., Weatherall, D.J. and Clegg, J.B. (1973) Maternal synthesis ofhemoglobin F in pregnancy. Lancet, 2, 1350±1354.
Ploem, J.S., van Driel-Kilker, A.M.J., Goyarts-Veldstra, L., Ploem-Zaaijer,
J.J., Verwoerd, N.P. and van der Zwan, M. (1986) Image analysiscombined with quantitative cytochemistry. Histochemistry, 84, 549±555.
Plesch, A. and Loerch, T. (2001) MetaferÐa novel ultra high throughputscanning system for rare cell detection and automatic interphase FISHscoring. In Macek, M. Sr., Bianchi, D. and Cuckle H. (eds) Early PrenatalDiagnosis, Fetal Cells and DNA in the Mother, Present State andPerspectives. 12th Fetal Cell Workshop, Charles University in Prague,The Karolinum Press, Prague, pp. 329±339.
Price, J.O., Elias, S., Wachtel, S.S., Klinger, K., Dockter, M., Tharapel, A.,Shulman, L.P., Phillips, O.P., Meyers, C.M., Shook, D., et al. (1991)Prenatal diagnosis using fetal cells from maternal blood by multi-parameter ¯ow cytometry. Am. J. Obstet. Gynecol., 165, 1731±1737.
Ravkin, I. and Temov, V. (1998) Automated microscopy system for detectionand genetic characterization of fetal nucleated red blood cells on slides.Proc. Opt. Invest. Cells In Vitro In Vivo., 3260, 180±191.
Sekizawa, A., Samura, O., Zhen, D., Falco, V., Farina, A. and Bianchi, D.W.(2000) Apoptosis in fetal nucleated erythrocytes circulation in maternalblood. Prenat Diagn, 20, 886±889.
Steele C.D., Wapner R.J., Smith J.B., Haynes, M.K. and Jackson, L.G. (1996)Prenatal diagnosis using fetal cells isolated from maternal peripheralblood: a review. Clin. Obstet. Gynecol., 39, 801±813.
Slunga-Tallberg, A., El Rifai, W., Keinanen, M., Ylinen, K., Kurki, T.,Klinger, K., Ylikorkala, O. and Knuutila, S. (1995) Maternal origin ofnucleated erythrocytes in peripheral blood of pregnant women. Hum.Genet., 96, 53±57.
Takabayashi, H., Kuwabara, S., Ukita, T., Ikawa, K., Yamafuji, K. andIgarashi, T. (1995) Development of non-invasive fetal diagnosis frommaternal blood. Prenat. Diagn., 15, 74±77.
Tanke, H.J., Oosterwijk, J.C., Mesker, W.E., Ouwerkerk van-Velzen, M.C.,Knep¯e, C.F., Wiesmeyer, C.C., van Ommen, G.J., Kanhai, H.H. andVrolijk, J. (1996) Detection of `rare event' fetal erythroblasts in maternalblood using automated microscopy. Early Hum. Dev., 47 (Suppl), S89-S93.
Vrolijk, H., Sloos, W.C.R., van de Rijke, F.M., Mesker, W.E., Netten, H.,Young, I.T., Raap, A.K. and Tanke, H.J. (1996) Automation of spotcounting in interphase cytogenetics using bright®eld microscopy.Cytometry, 24, 158±166.
Wachtel, S., Elias, S., Price, J., Wachtel, G., Phillips, O., Shulman, L., Meyers,C., Simpson, J.L. and Dockter, M. (1991) Fetal cells in maternalcirculation: Isolation by multiparameter ¯ow cytometry and con®rmationby polymerase chain reaction. Hum. Reprod., 6, 1466±1469.
Weinstein, M. and Castleman, K.R. (1971) Reconstructing 3-D specimensfrom 2-D section images. Proceedings of the SPIE, 26, 131±138.
Zheng, Y.L., Carter, N.P., Price, C.M., Colman, S.M., Milton, P.J., Hackett,G.A., Greaves, M.F. and Ferguson-Smith, M.A. (1993) Prenatal diagnosisfrom maternal blood: Simultaneous immunophenotyping and FISH offetal nucleated erythrocytes isolated by negative magnetic cell sorting. J.Med. Genet., 30, 1051±1056.
Zheng, Y.L., DeMaria, M.A., Zhen, D.K., Vadnais, T.J. and Bianchi, D.W.(1995) Flow sorting of fetal erythroblasts using intracytoplasmic anti-fetalhemoglobin: Preliminary observations on maternal samples. Prenat.Diagn., 15, 897±905.
Zheng, Y.L., Zhen, D.K., DeMaria, M.A., Berry, S.M., Wapner, R.J., Evans,M.I., Copeland, D., Williams, J.M. and Bianchi, D.W. (1997) Search forthe optimal fetal cell antibody: results of immunophenotyping studiesusing ¯ow cytometry. Hum. Genet., 100, 35±42.
Zheng, Y.L., Zhen, D.K., Farina, A., Berry, S.M., Wapner, R.J., Williams,J.M. and Bianchi, D.W. (1999) Fetal cell identi®ers: results of microscopeslide-based immunocytochemical studies as a function of gestational ageand abnormality. Am. J. Obstet. Gynecol., 180, 1234±1239.
Zimmermann, B., Holzgreve, W., Zhong, X.Y. and Hahn, S. (2002) Inabilityto clonally expand fetal progenitors from maternal blood. Fetal Diagn.Therapy, 17, 97±100.
Strategies for automated fetal cell screening
521
by guest on August 19, 2015
http://humupd.oxfordjournals.org/
Dow
nloaded from