Automated High-Content Live Animal Drug Screening Using C. elegans Expressing the Aggregation Prone...
16
Automated High-Content Live Animal Drug Screening Using C. elegans Expressing the Aggregation Prone Serpin a1-antitrypsin Z Sager J. Gosai 1 , Joon Hyeok Kwak 1 , Cliff J. Luke 1 , Olivia S. Long 1 , Dale E. King 1 , Kevin J. Kovatch 1 , Paul A. Johnston 2 , Tong Ying Shun 2 , John S. Lazo 2 , David H. Perlmutter 1 , Gary A. Silverman 1 *, Stephen C. Pak 1 * 1 Department of Pediatrics, Cell Biology and Physiology, University of Pittsburgh School of Medicine, Children’s Hospital of Pittsburgh of UPMC and Magee-Womens Hospital Research Institute, Pittsburgh, Pennsylvania, United States of America, 2 Department of Pharmacology and Chemical Biology, University of Pittsburgh Drug Discovery Institute, University of Pittsburgh, Pennsylvania, United States of America Abstract The development of preclinical models amenable to live animal bioactive compound screening is an attractive approach to discovering effective pharmacological therapies for disorders caused by misfolded and aggregation-prone proteins. In general, however, live animal drug screening is labor and resource intensive, and has been hampered by the lack of robust assay designs and high throughput work-flows. Based on their small size, tissue transparency and ease of cultivation, the use of C. elegans should obviate many of the technical impediments associated with live animal drug screening. Moreover, their genetic tractability and accomplished record for providing insights into the molecular and cellular basis of human disease, should make C. elegans an ideal model system for in vivo drug discovery campaigns. The goal of this study was to determine whether C. elegans could be adapted to high-throughput and high-content drug screening strategies analogous to those developed for cell-based systems. Using transgenic animals expressing fluorescently-tagged proteins, we first developed a high-quality, high-throughput work-flow utilizing an automated fluorescence microscopy platform with integrated image acquisition and data analysis modules to qualitatively assess different biological processes including, growth, tissue development, cell viability and autophagy. We next adapted this technology to conduct a small molecule screen and identified compounds that altered the intracellular accumulation of the human aggregation prone mutant that causes liver disease in a1-antitrypsin deficiency. This study provides powerful validation for advancement in preclinical drug discovery campaigns by screening live C. elegans modeling a1-antitrypsin deficiency and other complex disease phenotypes on high-content imaging platforms. Citation: Gosai SJ, Kwak JH, Luke CJ, Long OS, King DE, et al. (2010) Automated High-Content Live Animal Drug Screening Using C. elegans Expressing the Aggregation Prone Serpin a1-antitrypsin Z. PLoS ONE 5(11): e15460. doi:10.1371/journal.pone.0015460 Editor: Anne C. Hart, Brown University, United States of America Received August 2, 2010; Accepted September 29, 2010; Published November 12, 2010 Copyright: ß 2010 Gosai et al. This is an open-access article distributed under the terms of the Creative Commons Attribution License, which permits unrestricted use, distribution, and reproduction in any medium, provided the original author and source are credited. Funding: This work was supported by grants from The Hartwell Foundation (GAS), the Fiske Drug Discovery Fund (JSL) and the National Institutes of Health (DK079806 and DK081422 to GAS and MH07441 to JSL). Some nematode strains used in this work were provided by the Caenorhabditis Genetics Center, which is funded by the NIH National Center for Research Resources (NCRR). The funders had no role in the study design, data collection and analysis, decision to publish, or preparation of the manuscript. Competing Interests: The authors have declared that no competing interests exist. * E-mail: [email protected] (GAS); [email protected] (SCP) Introduction The pathologic accumulation of misfolded or aggregation-prone proteins underlies a wide range of human diseases including neurodegenerative disorders (e.g., Alzheimer’s disease, Hunting- ton’s disease, Parkinson’s disease, amyotrophic lateral sclerosis, frontotemporal dementia, and spongiform encephalopathies), systemic amyloidoses (e.g., immunoglobulin light chain (AL), serum amyloid A (AA) and transthyretin (ATTR) amyloidosis), retinal dystrophies (e.g., non-syndromic forms of retinitis pigmen- tosa) and the serpinopathies (e.g., a1-antitrypsin (AT, SERPINA1) deficiency) [1,2,3,4,5]. Although a network of factors and pathways attempt to maintain protein homeostasis (proteostasis) by balancing bulk protein synthesis with proper folding, trafficking and turnover [6]; the gradual accretion of toxic oligomers and possibly higher order polymers or aggregates leads to cellular injury and death [7]. Moreover, many disease states, such as diabetes, malignancies, cardiovascular disease, systemic inflam- mation, sepsis, and aging also add stress to the proteostasis network, which contributes to organ dysfunction and exacerbation of the underlying disease states [6]. Notwithstanding their prevalence, effective therapies for protein misfolding disorders are lacking [1,8,9]. However, experimental studies show that genetic or pharmacologic enhancement of the proteostasis network reduces the accumulation of aggregation prone proteins [10,11]. Thus, one approach to developing novel therapies capable of treating a wide-range of protein misfolding disorders is to conduct target-directed (reverse chemical genetic) screens for compounds that enhance the activity of the proteostasis network. The development of small-molecule therapeutics by target-directed strategies has been accelerating due to the genome- driven discovery of new drug targets, the expansion of natural and synthetic combinatorial chemistry compound collections and the development of high- and ultra high-throughput screening (HTS) technologies [12,13]. Despite these advances, a lead series painstakingly developed in vitro may be abandoned due to a lack PLoS ONE | www.plosone.org 1 November 2010 | Volume 5 | Issue 11 | e15460
-
Upload
upmchealthsecurity -
Category
Documents
-
view
0 -
download
0
Transcript of Automated High-Content Live Animal Drug Screening Using C. elegans Expressing the Aggregation Prone...
Automated High-Content Live Animal Drug ScreeningUsing C. elegans Expressing the Aggregation ProneSerpin a1-antitrypsin ZSager J. Gosai1, Joon Hyeok Kwak1, Cliff J. Luke1, Olivia S. Long1, Dale E. King1, Kevin J. Kovatch1, Paul A.
Johnston2, Tong Ying Shun2, John S. Lazo2, David H. Perlmutter1, Gary A. Silverman1*, Stephen C. Pak1*
1 Department of Pediatrics, Cell Biology and Physiology, University of Pittsburgh School of Medicine, Children’s Hospital of Pittsburgh of UPMC and Magee-Womens
Hospital Research Institute, Pittsburgh, Pennsylvania, United States of America, 2 Department of Pharmacology and Chemical Biology, University of Pittsburgh Drug
Discovery Institute, University of Pittsburgh, Pennsylvania, United States of America
Abstract
The development of preclinical models amenable to live animal bioactive compound screening is an attractive approach todiscovering effective pharmacological therapies for disorders caused by misfolded and aggregation-prone proteins. Ingeneral, however, live animal drug screening is labor and resource intensive, and has been hampered by the lack of robustassay designs and high throughput work-flows. Based on their small size, tissue transparency and ease of cultivation, theuse of C. elegans should obviate many of the technical impediments associated with live animal drug screening. Moreover,their genetic tractability and accomplished record for providing insights into the molecular and cellular basis of humandisease, should make C. elegans an ideal model system for in vivo drug discovery campaigns. The goal of this study was todetermine whether C. elegans could be adapted to high-throughput and high-content drug screening strategies analogousto those developed for cell-based systems. Using transgenic animals expressing fluorescently-tagged proteins, we firstdeveloped a high-quality, high-throughput work-flow utilizing an automated fluorescence microscopy platform withintegrated image acquisition and data analysis modules to qualitatively assess different biological processes including,growth, tissue development, cell viability and autophagy. We next adapted this technology to conduct a small moleculescreen and identified compounds that altered the intracellular accumulation of the human aggregation prone mutant thatcauses liver disease in a1-antitrypsin deficiency. This study provides powerful validation for advancement in preclinical drugdiscovery campaigns by screening live C. elegans modeling a1-antitrypsin deficiency and other complex disease phenotypeson high-content imaging platforms.
Citation: Gosai SJ, Kwak JH, Luke CJ, Long OS, King DE, et al. (2010) Automated High-Content Live Animal Drug Screening Using C. elegans Expressing theAggregation Prone Serpin a1-antitrypsin Z. PLoS ONE 5(11): e15460. doi:10.1371/journal.pone.0015460
Editor: Anne C. Hart, Brown University, United States of America
Received August 2, 2010; Accepted September 29, 2010; Published November 12, 2010
Copyright: � 2010 Gosai et al. This is an open-access article distributed under the terms of the Creative Commons Attribution License, which permitsunrestricted use, distribution, and reproduction in any medium, provided the original author and source are credited.
Funding: This work was supported by grants from The Hartwell Foundation (GAS), the Fiske Drug Discovery Fund (JSL) and the National Institutes of Health(DK079806 and DK081422 to GAS and MH07441 to JSL). Some nematode strains used in this work were provided by the Caenorhabditis Genetics Center, which isfunded by the NIH National Center for Research Resources (NCRR). The funders had no role in the study design, data collection and analysis, decision to publish, orpreparation of the manuscript.
Competing Interests: The authors have declared that no competing interests exist.
* E-mail: [email protected] (GAS); [email protected] (SCP)
Introduction
The pathologic accumulation of misfolded or aggregation-prone
proteins underlies a wide range of human diseases including
neurodegenerative disorders (e.g., Alzheimer’s disease, Hunting-
ton’s disease, Parkinson’s disease, amyotrophic lateral sclerosis,
frontotemporal dementia, and spongiform encephalopathies),
systemic amyloidoses (e.g., immunoglobulin light chain (AL),
serum amyloid A (AA) and transthyretin (ATTR) amyloidosis),
retinal dystrophies (e.g., non-syndromic forms of retinitis pigmen-
tosa) and the serpinopathies (e.g., a1-antitrypsin (AT, SERPINA1)
deficiency) [1,2,3,4,5]. Although a network of factors and
pathways attempt to maintain protein homeostasis (proteostasis)
by balancing bulk protein synthesis with proper folding, trafficking
and turnover [6]; the gradual accretion of toxic oligomers and
possibly higher order polymers or aggregates leads to cellular
injury and death [7]. Moreover, many disease states, such as
diabetes, malignancies, cardiovascular disease, systemic inflam-
mation, sepsis, and aging also add stress to the proteostasis
network, which contributes to organ dysfunction and exacerbation
of the underlying disease states [6].
Notwithstanding their prevalence, effective therapies for protein
misfolding disorders are lacking [1,8,9]. However, experimental
studies show that genetic or pharmacologic enhancement of the
proteostasis network reduces the accumulation of aggregation
prone proteins [10,11]. Thus, one approach to developing novel
therapies capable of treating a wide-range of protein misfolding
disorders is to conduct target-directed (reverse chemical genetic)
screens for compounds that enhance the activity of the proteostasis
network. The development of small-molecule therapeutics by
target-directed strategies has been accelerating due to the genome-
driven discovery of new drug targets, the expansion of natural and
synthetic combinatorial chemistry compound collections and the
development of high- and ultra high-throughput screening (HTS)
technologies [12,13]. Despite these advances, a lead series
painstakingly developed in vitro may be abandoned due to a lack
PLoS ONE | www.plosone.org 1 November 2010 | Volume 5 | Issue 11 | e15460
of activity or an unfavorable therapeutic index upon testing in
mammalian cell cultures, vertebrate animals or phase 1 clinical
trials [14,15]. Frequently, attrition of a lead series is due to
unfavorable drug absorption, distribution, metabolism, excretion
or toxicity (ADMET) [16,17].
Some ADMET deficiencies are avoided, by conducting the
initial drug screens in cells, and numerous cell-based assay
technologies have been developed for HTS lead generation
[18,19,20,21,22,23,24,25,26]. The emergence of imaging plat-
forms, which combine automated fluorescence image acquisi-
tion with quantitative cellular image analysis, has converted cell-
based screening from simple assays measuring a single
parameter into high-content screening (HCS) strategies assess-
ing multiple information-rich parameters (e.g., size, shape,
granularity and fluorescence intensity) for each cell in culture
[18,19,20,21,22,23,24,25,26]. Temporal and spatial integration
of these parameters facilitates the evaluation of compound
effects on complex physiological processes such as cell death
activation, cell-to-cell contacts, vesicular trafficking and the
translocation of fluorescent markers to different subcellular
locations [18,19,20,21,22,23,24,25,26].
While HCS using cell-based assays facilitate the rejection of
compounds that are directly cytotoxic, they are unable to identify
those that lack the desired therapeutic effect in vivo, or demonstrate
deleterious side effects on complex developmental or physiological
processes, such as cellular migration or synaptic transmission,
respectively. Moreover, the therapeutic effects of compounds on
the systemic aspects of protein misfolding disorders cannot be
modeled easily in cell culture systems. For this reason, forward
chemical genetic (i.e., phenotype-directed) screens using live
animals that model human protein misfolding disease phenotypes
might serve as suitable alternatives to target-directed reverse
chemical screens [27]. Drug screens using live organisms provide
several distinct advantages over molecular- or cell-based assays
and include: 1) the assessment of ADMET characteristics at the
earliest stages of the drug discovery process, 2) the identification of
leads without detailed knowledge of specific disease-related targets
or molecular pathways and 3) the avoidance of ascertainment
biases associated with targeting pathways or molecules whose
involvement may ultimately prove to be tangential to the disease
process. Despite these advantages, the assimilation of live animals
into drug screening protocols presents logistical challenges. These
barriers include labor- and cost-intensive development of disease
phenotypes; screening protocols that are low-throughput and
unamenable to statistically robust HTS-like formats; and the
prohibitive consumption of compound libraries. Over the last
several years, however, investigators began adapting small
organisms, such as Caenorhabditis elegans and Danio rerio, to HTS
protocols [28,29,30,31,32,33,34,35,36]. Taken together, these
studies suggest that organisms dispensed by automated liquid-
handling workstations and cultivated in microtiter plates may
provide an economical alternative to molecular and cell-based
screens. C. elegans, in particular, should be an ideal candidate for
live animal HCS campaigns, as their tissues are transparent at all
developmental stages, the use of fluorescent probes and tissue-
specific fluorescent transgenic markers to study physiological
processes in vivo are well established, fundamental cellular
processes are highly conserved across species, and aspects of
mammalian diseases can be successfully modeled in these
invertebrates (reviewed in [37,38,39,40]). Nonetheless, experimen-
tal variables that affect high-quality HCS protocols, such as sample
preparation, assay strategy, image acquisition and image analysis,
have yet to be optimized for any organism [41]. The goal of this
study was to develop an all-liquid work-flow strategy that
eliminates a major bottleneck in the screening process and fully
exploits the advantages of C. elegans as a platform for in vivo high-
content and high-throughput pre-clinical drug discovery cam-
paigns for protein misfolding disorders. Moreover, by adapting an
automated system that streamlines the image acquisition and data
analysis components to accurately define objects and detect tissue-
specific changes using fluorescent markers, we can easily adapt this
system to screen for compounds that modulate a wide range of
normal physiological processes (e.g., growth, development,
organogenesis and ageing) and pathological phenotypes (e.g., cell
death pathways, neuromuscular degeneration, inborn errors of
metabolism and host-pathogen interactions).
Results
Detection of C. elegans developmental stages based onsize
The inability to automate the image capture and data analysis
steps continues to serve as the most significant bottleneck in live
animal screening. In collaboration with Cellomics Inc., we
adapted an automated fluorescence microscopy imaging system,
originally designed for HCS and analysis of cultured cells (http://
www.cellomics.com/content/menu/ArrayScan/), to automate the
detection and analysis of C. elegans in a 96- or 384-well microtiter
format. The instrument, ArrayScan VTI, consists of an inverted
light microscope (Axiovert 200M, Carl Zeiss) configured with a
motorized objective turret with Plan-Neofluar objectives, a
motorized 5-position filter cube turret, a mechanized stage, a
12-bit cooled CCD camera and controller software. Samples are
illuminated for brightfield imaging using a broad white-light
source and for fluorescence imaging in up to 4 different spectra
using a mercury-based light source. Different types of analysis
modules (Thermo Scientific BioApplications) automatically con-
vert 16-bit monochromatic images into numeric data. To
determine whether the ArrayScan VTI and the BioApplications
software could accurately segment the images to identify and
count small animals, we first assessed the number of young adult C.
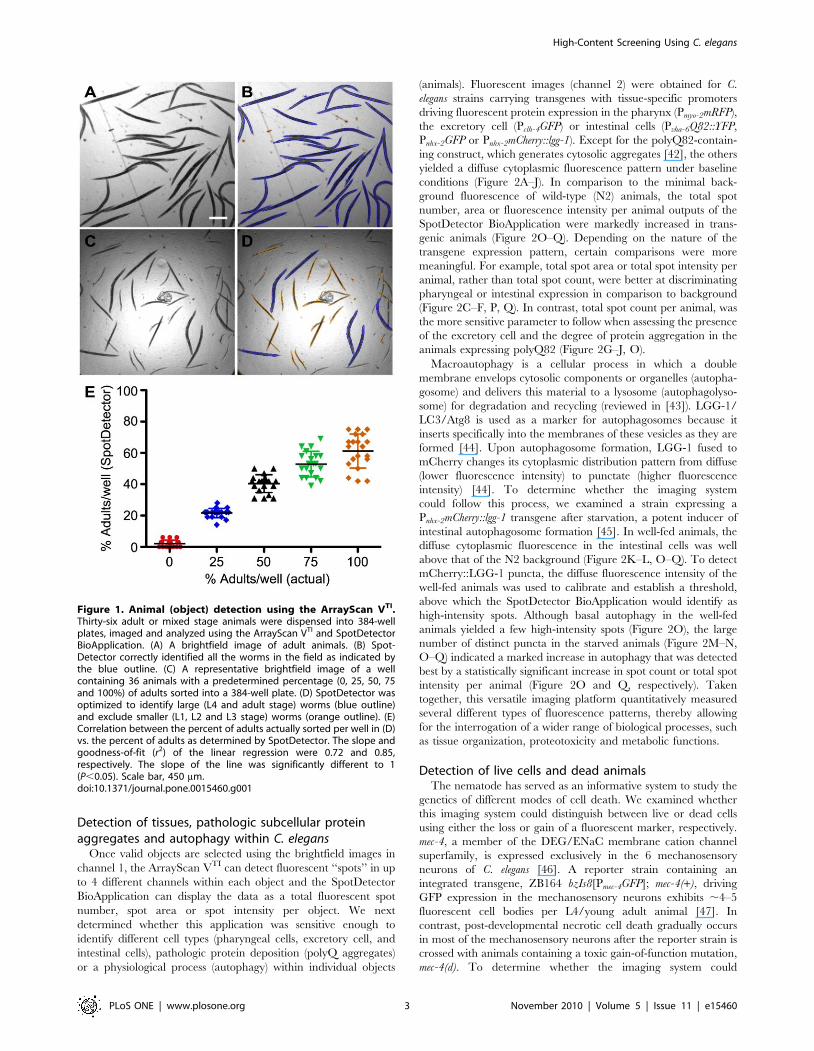
elegans sorted into a 384-well plate (Figure 1A). The software
application required that objects first be defined and counted in
channel 1. Using brightfield illumination, the SpotDetector
BioApplication, which was programmed to detect dark objects
on a bright background with a specified morphological size (width,
length, area), identified nearly all the adult animals (Figure 1B,
outlined in blue). Since the algorithm also excludes objects on the
basis of size, we determined whether, the system could distinguish
young adult animals from eggs and the smaller L1 through L4
larval forms. Populations of 36 animals, each containing different
percentages of adult worms were sorted into wells of a 384-well
microtiter plate (Figure 1C). The SpotDetector BioApplication
correctly selected objects within (outlined in blue) and excluded
objects without (outlined in yellow) the pre-selected size param-
eters (Figure 1D). However, in wells containing a higher
proportion of adults, some animals were not counted. Miscount-
ing, which decreased the overall goodness-of-fit of linear
regression, was due to the inability of algorithm to resolve
overlapping patterns into more than one discrete object
(Figure 1E). As expected, the accuracy of detection improved
when ,10 adults were added to a well. Of note, the BioApplica-
tion can be configured to detect animals at, for example, the L1–
L2 stage and exclude those at the L3–L4 adult stages (not shown).
Taken together, these studies suggested that the instrument could
be used to screen for compounds that alter the growth and
development of synchronized cultures by counting the proportion
of animals of a particular size at a constant time point.
High-Content Screening Using C. elegans
PLoS ONE | www.plosone.org 2 November 2010 | Volume 5 | Issue 11 | e15460
Detection of tissues, pathologic subcellular proteinaggregates and autophagy within C. elegans
Once valid objects are selected using the brightfield images in
channel 1, the ArrayScan VTI can detect fluorescent ‘‘spots’’ in up
to 4 different channels within each object and the SpotDetector
BioApplication can display the data as a total fluorescent spot
number, spot area or spot intensity per object. We next
determined whether this application was sensitive enough to
identify different cell types (pharyngeal cells, excretory cell, and
intestinal cells), pathologic protein deposition (polyQ aggregates)
or a physiological process (autophagy) within individual objects
(animals). Fluorescent images (channel 2) were obtained for C.
elegans strains carrying transgenes with tissue-specific promoters
driving fluorescent protein expression in the pharynx (Pmyo-2mRFP),
the excretory cell (Pclh-4GFP) or intestinal cells (Pvha-6Q82::YFP,
Pnhx-2GFP or Pnhx-2mCherry::lgg-1). Except for the polyQ82-contain-
ing construct, which generates cytosolic aggregates [42], the others
yielded a diffuse cytoplasmic fluorescence pattern under baseline
conditions (Figure 2A–J). In comparison to the minimal back-
ground fluorescence of wild-type (N2) animals, the total spot
number, area or fluorescence intensity per animal outputs of the
SpotDetector BioApplication were markedly increased in trans-
genic animals (Figure 2O–Q). Depending on the nature of the
transgene expression pattern, certain comparisons were more
meaningful. For example, total spot area or total spot intensity per
animal, rather than total spot count, were better at discriminating
pharyngeal or intestinal expression in comparison to background
(Figure 2C–F, P, Q). In contrast, total spot count per animal, was
the more sensitive parameter to follow when assessing the presence
of the excretory cell and the degree of protein aggregation in the
animals expressing polyQ82 (Figure 2G–J, O).
Macroautophagy is a cellular process in which a double
membrane envelops cytosolic components or organelles (autopha-
gosome) and delivers this material to a lysosome (autophagolyso-
some) for degradation and recycling (reviewed in [43]). LGG-1/
LC3/Atg8 is used as a marker for autophagosomes because it
inserts specifically into the membranes of these vesicles as they are
formed [44]. Upon autophagosome formation, LGG-1 fused to
mCherry changes its cytoplasmic distribution pattern from diffuse
(lower fluorescence intensity) to punctate (higher fluorescence
intensity) [44]. To determine whether the imaging system
could follow this process, we examined a strain expressing a
Pnhx-2mCherry::lgg-1 transgene after starvation, a potent inducer of
intestinal autophagosome formation [45]. In well-fed animals, the
diffuse cytoplasmic fluorescence in the intestinal cells was well
above that of the N2 background (Figure 2K–L, O–Q). To detect
mCherry::LGG-1 puncta, the diffuse fluorescence intensity of the
well-fed animals was used to calibrate and establish a threshold,
above which the SpotDetector BioApplication would identify as
high-intensity spots. Although basal autophagy in the well-fed
animals yielded a few high-intensity spots (Figure 2O), the large
number of distinct puncta in the starved animals (Figure 2M–N,
O–Q) indicated a marked increase in autophagy that was detected
best by a statistically significant increase in spot count or total spot
intensity per animal (Figure 2O and Q, respectively). Taken
together, this versatile imaging platform quantitatively measured
several different types of fluorescence patterns, thereby allowing
for the interrogation of a wider range of biological processes, such
as tissue organization, proteotoxicity and metabolic functions.
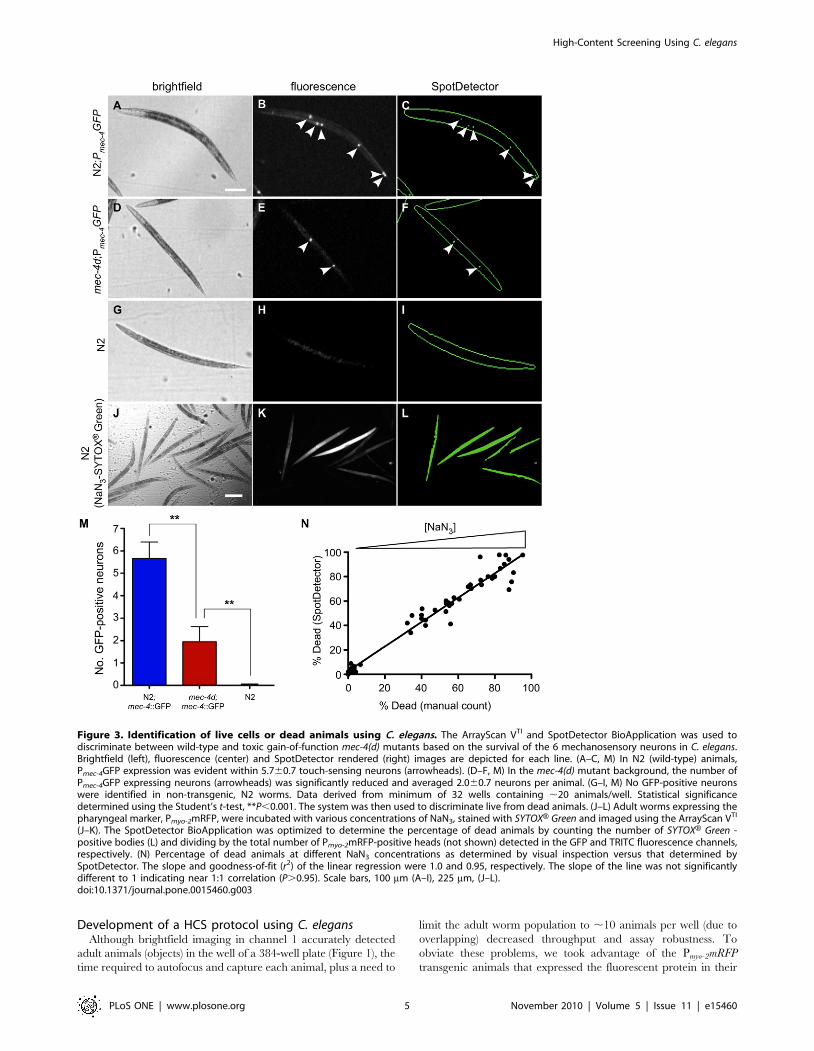
Detection of live cells and dead animalsThe nematode has served as an informative system to study the
genetics of different modes of cell death. We examined whether
this imaging system could distinguish between live or dead cells
using either the loss or gain of a fluorescent marker, respectively.
mec-4, a member of the DEG/ENaC membrane cation channel
superfamily, is expressed exclusively in the 6 mechanosensory
neurons of C. elegans [46]. A reporter strain containing an
integrated transgene, ZB164 bzIs8[Pmec-4GFP]; mec-4(+), driving
GFP expression in the mechanosensory neurons exhibits ,4–5
fluorescent cell bodies per L4/young adult animal [47]. In
contrast, post-developmental necrotic cell death gradually occurs
in most of the mechanosensory neurons after the reporter strain is
crossed with animals containing a toxic gain-of-function mutation,
mec-4(d). To determine whether the imaging system could
Figure 1. Animal (object) detection using the ArrayScan VTI.Thirty-six adult or mixed stage animals were dispensed into 384-wellplates, imaged and analyzed using the ArrayScan VTI and SpotDetectorBioApplication. (A) A brightfield image of adult animals. (B) Spot-Detector correctly identified all the worms in the field as indicated bythe blue outline. (C) A representative brightfield image of a wellcontaining 36 animals with a predetermined percentage (0, 25, 50, 75and 100%) of adults sorted into a 384-well plate. (D) SpotDetector wasoptimized to identify large (L4 and adult stage) worms (blue outline)and exclude smaller (L1, L2 and L3 stage) worms (orange outline). (E)Correlation between the percent of adults actually sorted per well in (D)vs. the percent of adults as determined by SpotDetector. The slope andgoodness-of-fit (r2) of the linear regression were 0.72 and 0.85,respectively. The slope of the line was significantly different to 1(P,0.05). Scale bar, 450 mm.doi:10.1371/journal.pone.0015460.g001
High-Content Screening Using C. elegans
PLoS ONE | www.plosone.org 3 November 2010 | Volume 5 | Issue 11 | e15460

distinguish the wild-type from the mec-4(d) strain, we identified
adult animals by brightfield illumination in channel 1 (Figure 3A,
D, G), and for comparison, by fluorescence imaging to display the
GFP-labeled mechanosensory neurons in channel 2 (Figure 3B, E,
H). SpotDetector quantified the number of live florescent cells
(spots) present in each brightfield object (Figure 3C, F, I).
Consistent with previous studies, the mec-4(+) and mec-4(d) strains
averaged ,6 and ,2 cells/animal, respectively (Figure 3M) [47].
Remarkably, the system was capable of discriminating between
wild-type and mutant animals based on the differential viability of
just six mechanosensory neurons.
Animals exposed to toxic doses of sodium azide (NaN3) undergo
massive necrotic intestinal cell death characterized by a marked
loss of membrane permeability [48]. Thus, the uptake of the
membrane impermeant fluorescent nucleic acid dye, SYTOXHGreen, serves as a dead cell indicator [49]. To determine whether
the system could discriminate dead from live intestinal cells, we
scanned and analyzed young adult animals exposed to different
concentrations of NaN3 in the presence SYTOXH Green. Dead
animals showed extensive uptake of SYTOXH Green that was
accurately detected by the imaging system (Figure 3J–L), as was
shown by a dose dependent increase in the number of dead
animals that correlated with the number counted manually
(Figure 3N). We concluded that this automated system was
capable of detecting dead cells and should prove useful in
developing HCS for drugs that modulate necrotic cell death.
Figure 2. Automated detection and quantification of cells, tissues, subcellular protein aggregates or autophagy in individualanimals. (A–J) The SpotDetector BioApplication was used to identify and quantitate different types of transgene expression (left of panels) in adultanimals. The brightfield channel (left panels) was used to discriminate between complete adult animals (outlined in blue) and debris or incompleteanimals (outlined in orange), while a fluorescence channel (colored overlays in right panels) was used to detect different types of fluorescently taggedtransgenes in correctly identified objects. (K–N) Fluorescence images of well-fed (K) and starved (M) animals expressing the autophagy marker,mCherry::LGG-1. In well-fed animals, mCherry::LGG-1 was diffusely cytoplasmic (K). In contrast, induction of autophagy by starvation leads to apunctate fluorescence pattern within intestinal cells, as LGG-1 is incorporated in to autophagosomes (M). (L, N) Higher magnification of the boxedareas in (K) and (M), respectively. (O–Q) The different types of transgene expression were quantified by spot count (O), spot area (P) or spot intensity(Q) per animal. Spot count, spot area and spot intensity values for each of the transgenic lines were significantly (Student’s t-test, P,0.001) differentto that of N2 animals. Data derived from 10–50 wells containing ,20 animals/well. Scale bars, 225 mm (A–J, K, M), 50 mm (L, N).doi:10.1371/journal.pone.0015460.g002
High-Content Screening Using C. elegans
PLoS ONE | www.plosone.org 4 November 2010 | Volume 5 | Issue 11 | e15460
Development of a HCS protocol using C. elegansAlthough brightfield imaging in channel 1 accurately detected
adult animals (objects) in the well of a 384-well plate (Figure 1), the
time required to autofocus and capture each animal, plus a need to
limit the adult worm population to ,10 animals per well (due to
overlapping) decreased throughput and assay robustness. To
obviate these problems, we took advantage of the Pmyo-2mRFP
transgenic animals that expressed the fluorescent protein in their
Figure 3. Identification of live cells or dead animals using C. elegans. The ArrayScan VTI and SpotDetector BioApplication was used todiscriminate between wild-type and toxic gain-of-function mec-4(d) mutants based on the survival of the 6 mechanosensory neurons in C. elegans.Brightfield (left), fluorescence (center) and SpotDetector rendered (right) images are depicted for each line. (A–C, M) In N2 (wild-type) animals,Pmec-4GFP expression was evident within 5.760.7 touch-sensing neurons (arrowheads). (D–F, M) In the mec-4(d) mutant background, the number ofPmec-4GFP expressing neurons (arrowheads) was significantly reduced and averaged 2.060.7 neurons per animal. (G–I, M) No GFP-positive neuronswere identified in non-transgenic, N2 worms. Data derived from minimum of 32 wells containing ,20 animals/well. Statistical significancedetermined using the Student’s t-test, **P,0.001. The system was then used to discriminate live from dead animals. (J–L) Adult worms expressing thepharyngeal marker, Pmyo-2mRFP, were incubated with various concentrations of NaN3, stained with SYTOXH Green and imaged using the ArrayScan VTI
(J–K). The SpotDetector BioApplication was optimized to determine the percentage of dead animals by counting the number of SYTOXH Green -positive bodies (L) and dividing by the total number of Pmyo-2mRFP-positive heads (not shown) detected in the GFP and TRITC fluorescence channels,respectively. (N) Percentage of dead animals at different NaN3 concentrations as determined by visual inspection versus that determined bySpotDetector. The slope and goodness-of-fit (r2) of the linear regression were 1.0 and 0.95, respectively. The slope of the line was not significantlydifferent to 1 indicating near 1:1 correlation (P.0.95). Scale bars, 100 mm (A–I), 225 mm, (J–L).doi:10.1371/journal.pone.0015460.g003
High-Content Screening Using C. elegans
PLoS ONE | www.plosone.org 5 November 2010 | Volume 5 | Issue 11 | e15460
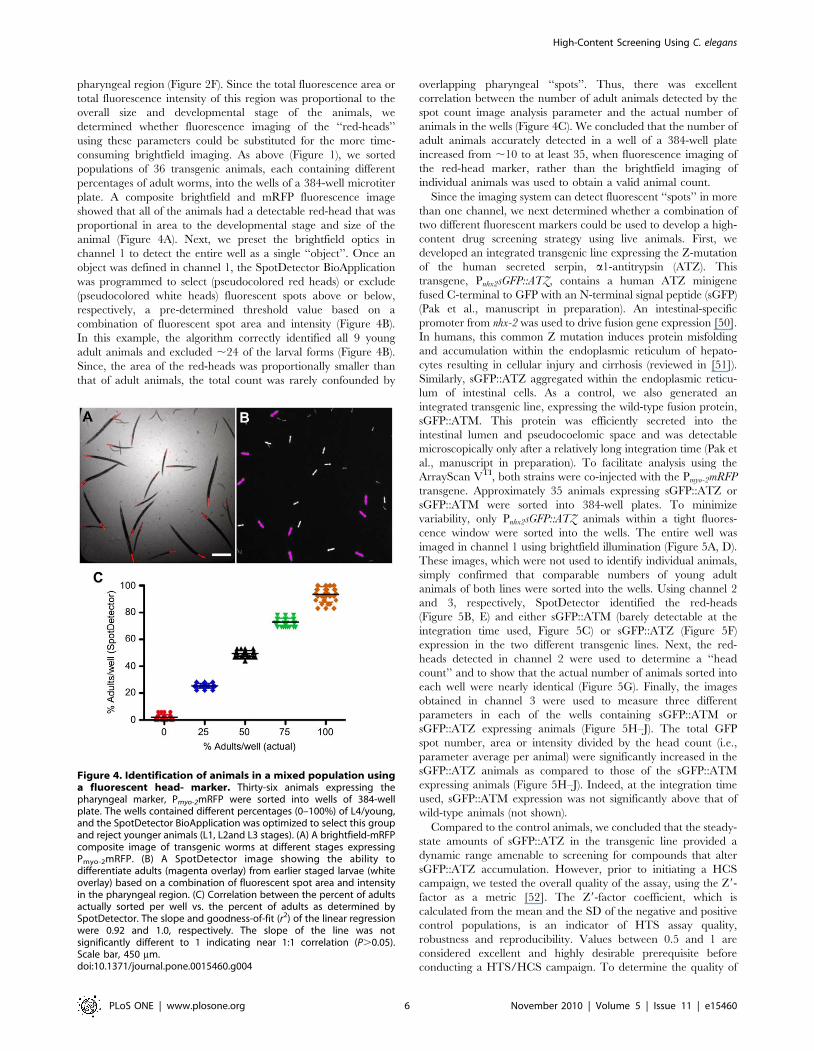
pharyngeal region (Figure 2F). Since the total fluorescence area or
total fluorescence intensity of this region was proportional to the
overall size and developmental stage of the animals, we
determined whether fluorescence imaging of the ‘‘red-heads’’
using these parameters could be substituted for the more time-
consuming brightfield imaging. As above (Figure 1), we sorted
populations of 36 transgenic animals, each containing different
percentages of adult worms, into the wells of a 384-well microtiter
plate. A composite brightfield and mRFP fluorescence image
showed that all of the animals had a detectable red-head that was
proportional in area to the developmental stage and size of the
animal (Figure 4A). Next, we preset the brightfield optics in
channel 1 to detect the entire well as a single ‘‘object’’. Once an
object was defined in channel 1, the SpotDetector BioApplication
was programmed to select (pseudocolored red heads) or exclude
(pseudocolored white heads) fluorescent spots above or below,
respectively, a pre-determined threshold value based on a
combination of fluorescent spot area and intensity (Figure 4B).
In this example, the algorithm correctly identified all 9 young
adult animals and excluded ,24 of the larval forms (Figure 4B).
Since, the area of the red-heads was proportionally smaller than
that of adult animals, the total count was rarely confounded by
overlapping pharyngeal ‘‘spots’’. Thus, there was excellent
correlation between the number of adult animals detected by the
spot count image analysis parameter and the actual number of
animals in the wells (Figure 4C). We concluded that the number of
adult animals accurately detected in a well of a 384-well plate
increased from ,10 to at least 35, when fluorescence imaging of
the red-head marker, rather than the brightfield imaging of
individual animals was used to obtain a valid animal count.
Since the imaging system can detect fluorescent ‘‘spots’’ in more
than one channel, we next determined whether a combination of
two different fluorescent markers could be used to develop a high-
content drug screening strategy using live animals. First, we
developed an integrated transgenic line expressing the Z-mutation
of the human secreted serpin, a1-antitrypsin (ATZ). This
transgene, Pnhx2sGFP::ATZ, contains a human ATZ minigene
fused C-terminal to GFP with an N-terminal signal peptide (sGFP)
(Pak et al., manuscript in preparation). An intestinal-specific
promoter from nhx-2 was used to drive fusion gene expression [50].
In humans, this common Z mutation induces protein misfolding
and accumulation within the endoplasmic reticulum of hepato-
cytes resulting in cellular injury and cirrhosis (reviewed in [51]).
Similarly, sGFP::ATZ aggregated within the endoplasmic reticu-
lum of intestinal cells. As a control, we also generated an
integrated transgenic line, expressing the wild-type fusion protein,
sGFP::ATM. This protein was efficiently secreted into the
intestinal lumen and pseudocoelomic space and was detectable
microscopically only after a relatively long integration time (Pak et
al., manuscript in preparation). To facilitate analysis using the
ArrayScan VTI, both strains were co-injected with the Pmyo-2mRFP
transgene. Approximately 35 animals expressing sGFP::ATZ or
sGFP::ATM were sorted into 384-well plates. To minimize
variability, only Pnhx2sGFP::ATZ animals within a tight fluores-
cence window were sorted into the wells. The entire well was
imaged in channel 1 using brightfield illumination (Figure 5A, D).
These images, which were not used to identify individual animals,
simply confirmed that comparable numbers of young adult
animals of both lines were sorted into the wells. Using channel 2
and 3, respectively, SpotDetector identified the red-heads
(Figure 5B, E) and either sGFP::ATM (barely detectable at the
integration time used, Figure 5C) or sGFP::ATZ (Figure 5F)
expression in the two different transgenic lines. Next, the red-
heads detected in channel 2 were used to determine a ‘‘head
count’’ and to show that the actual number of animals sorted into
each well were nearly identical (Figure 5G). Finally, the images
obtained in channel 3 were used to measure three different
parameters in each of the wells containing sGFP::ATM or
sGFP::ATZ expressing animals (Figure 5H–J). The total GFP
spot number, area or intensity divided by the head count (i.e.,
parameter average per animal) were significantly increased in the
sGFP::ATZ animals as compared to those of the sGFP::ATM
expressing animals (Figure 5H–J). Indeed, at the integration time
used, sGFP::ATM expression was not significantly above that of
wild-type animals (not shown).
Compared to the control animals, we concluded that the steady-
state amounts of sGFP::ATZ in the transgenic line provided a
dynamic range amenable to screening for compounds that alter
sGFP::ATZ accumulation. However, prior to initiating a HCS
campaign, we tested the overall quality of the assay, using the Z9-
factor as a metric [52]. The Z9-factor coefficient, which is
calculated from the mean and the SD of the negative and positive
control populations, is an indicator of HTS assay quality,
robustness and reproducibility. Values between 0.5 and 1 are
considered excellent and highly desirable prerequisite before
conducting a HTS/HCS campaign. To determine the quality of
Figure 4. Identification of animals in a mixed population usinga fluorescent head- marker. Thirty-six animals expressing thepharyngeal marker, Pmyo-2mRFP were sorted into wells of 384-wellplate. The wells contained different percentages (0–100%) of L4/young,and the SpotDetector BioApplication was optimized to select this groupand reject younger animals (L1, L2and L3 stages). (A) A brightfield-mRFPcomposite image of transgenic worms at different stages expressingPmyo-2mRFP. (B) A SpotDetector image showing the ability todifferentiate adults (magenta overlay) from earlier staged larvae (whiteoverlay) based on a combination of fluorescent spot area and intensityin the pharyngeal region. (C) Correlation between the percent of adultsactually sorted per well vs. the percent of adults as determined bySpotDetector. The slope and goodness-of-fit (r2) of the linear regressionwere 0.92 and 1.0, respectively. The slope of the line was notsignificantly different to 1 indicating near 1:1 correlation (P.0.05).Scale bar, 450 mm.doi:10.1371/journal.pone.0015460.g004
High-Content Screening Using C. elegans
PLoS ONE | www.plosone.org 6 November 2010 | Volume 5 | Issue 11 | e15460
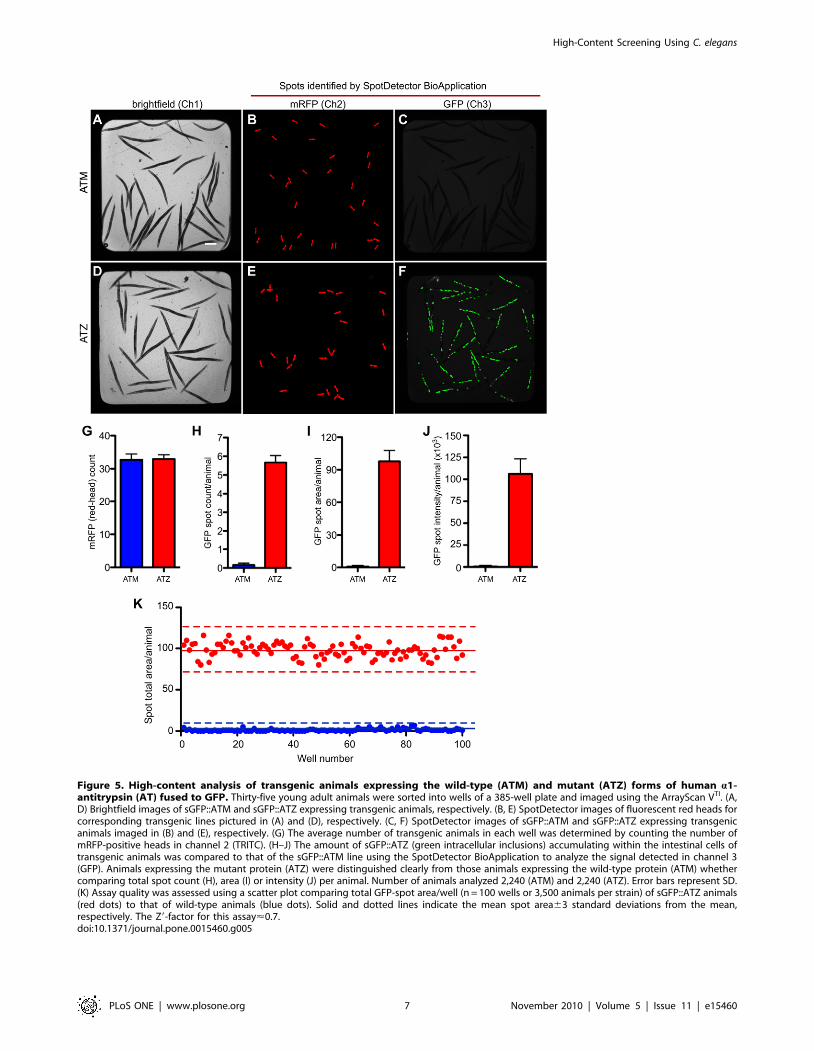
Figure 5. High-content analysis of transgenic animals expressing the wild-type (ATM) and mutant (ATZ) forms of human a1-antitrypsin (AT) fused to GFP. Thirty-five young adult animals were sorted into wells of a 385-well plate and imaged using the ArrayScan VTI. (A,D) Brightfield images of sGFP::ATM and sGFP::ATZ expressing transgenic animals, respectively. (B, E) SpotDetector images of fluorescent red heads forcorresponding transgenic lines pictured in (A) and (D), respectively. (C, F) SpotDetector images of sGFP::ATM and sGFP::ATZ expressing transgenicanimals imaged in (B) and (E), respectively. (G) The average number of transgenic animals in each well was determined by counting the number ofmRFP-positive heads in channel 2 (TRITC). (H–J) The amount of sGFP::ATZ (green intracellular inclusions) accumulating within the intestinal cells oftransgenic animals was compared to that of the sGFP::ATM line using the SpotDetector BioApplication to analyze the signal detected in channel 3(GFP). Animals expressing the mutant protein (ATZ) were distinguished clearly from those animals expressing the wild-type protein (ATM) whethercomparing total spot count (H), area (I) or intensity (J) per animal. Number of animals analyzed 2,240 (ATM) and 2,240 (ATZ). Error bars represent SD.(K) Assay quality was assessed using a scatter plot comparing total GFP-spot area/well (n = 100 wells or 3,500 animals per strain) of sGFP::ATZ animals(red dots) to that of wild-type animals (blue dots). Solid and dotted lines indicate the mean spot area63 standard deviations from the mean,respectively. The Z9-factor for this assay<0.7.doi:10.1371/journal.pone.0015460.g005
High-Content Screening Using C. elegans
PLoS ONE | www.plosone.org 7 November 2010 | Volume 5 | Issue 11 | e15460
this assay, 200 wells containing either sGFP::ATM or sGFP::ATZ
animals were imaged using the ArrayScan VTI. In a representative
experiment, the mean total spot area per sGFP::ATM and
sGFP::ATZ animals were 1.361.5 and 98.169.0, respectively
(Figure 5K). The Z9-factor for this assay was ,0.7. Within a single
experiment (sort) the Z9-factor remained constant from plate-to-
plate. However, the Z9-factor varied as much as 0.4 to 0.7 from
day-to-day depending mostly on the size of the sort-window used
to select the Pnhx2sGFP::ATZ animals (not shown).
Compound screenTo test the HCS protocol, we performed a pilot drug screen
using the library of pharmacologically active compounds (LO-
PAC1280TM, 1280 compounds). Tight gating parameters for total
fluorescence were used to sort 35 young adult Pnhx2sGFP::ATZ
animals into wells of 384-well plates containing 50 mM of a
LOPAC compound and 0.5% DMSO. Pnhx2sGFP::ATM and
Pnhx2sGFP::ATZ animals incubated with 0.5% DMSO served as
untreated controls and were placed in the first-two and last-two
columns of each plate. In a representative experiment, plate 1 of
the LOPAC library was set-up for screening on day 1, and 3 other
plates were set-up on the next day. After a 24 hour incubation at
22uC, animals were immobilized by the addition of NaN3 and
placed in the ArrayScan VTI for automated imaging. To examine
for systematic errors, the raw data (total spot area/animal) were
depicted as a plate-well scatter plot (Figure 6A). From these data, a
small amount of drift was seen in plate 1 in comparison to plates
2–4. This difference reflects a slight variation in the sort-window
used to collect animals on day 1 in comparison to that used on day
2. As the average values of the negative controls and that of the
sample wells were similar, we combined the control and sample
wells for normalization and to identify potential hits using the z-
score (Figure 6B). The ArrayScan VTI reads microtiter plates by
rows, alternating from left-to-right, and then right-to-left. For
some assays, we noted that the control fluorescence values would
drift upwards slightly in rows towards the bottom of the plate. This
drift appeared to correlate with an increase in chamber
temperature during the scanning period and was minimized by
cooling the chamber with a fan or shortening the read times by
using 2.56 objective with a 0.636 coupler. Nonetheless, we
controlled for intra-plate variation by presenting the data as a B-
score (Figure 6C). Under the same conditions, we repeated the
entire screen on a single day. We created an average rank-score for
each compound by first compiling a list for each screen based on
ascending B-scores, and then calculating the average rank for each
compound (Table 1). To verify potential hits, we arbitrarily
focused on those compounds with rank-scores ,110 (n = 33) or
.1225 (n = 15). Generally, compounds with these rank-scores had
B-scores lesser or greater than 3 in at least one of the screens, and
demonstrated the ability to significantly decrease or increase
sGFP::ATZ accumulation, respectively. Based on cost and
commercial availability, we selected 16 compounds to test for
dose-dependent effects (Table 1). Cantharidin (Figure 6D),
fluphenazine (Figure 6E) and pimozide (Figure 6F) were
representative examples of 6 of 12 compounds that showed a
dose-dependent decrease in sGFP::ATZ accumulation; whereas
tyrphostin (Figure 6G) was an example of 3 of 4 compounds that
showed an increase in sGFP::ATZ accumulation. Interestingly, all
three compounds that decreased GFP::ATZ accumulation were
isolated previously in screens for compounds that enhance
autophagy, a known elimination pathway for ATZ. When we
treated animals expressing the Pnhx-2mCherry::lgg-1 transgene with
cantharidin, fluphenazine and pimozide, the distribution of
mCherry::LGG-1 changed from diffusely cytosolic to punctate,
suggesting an increase in the number of autophagosomes
(Figure 7). To ensure that the puncta were not due to drug-
induced mCherry aggregation, we treated animals expressing a
Pnhx-2mCherry transgene with fluphenazine. No mCherry puncta
were detected (Figure S1). Taken together, these studies suggest
that this screening assay was capable of identifying hit compounds
that significantly altered sGFP::ATZ accumulation.
Discussion
As a platform for drug discovery, C. elegans provides several
distinct advantages over other in vivo models. Well established
reverse and forward genetic screening technologies permits target
validation or target identification of new hit compounds selected
by forward chemical screening campaigns. Their small size and
ability to grow in liquid medium makes them amenable to high-
throughput work-flows using large-particle (animal) sorters, higher
order microtiter plates and liquid handling robotic work-stations.
Their transparency at all developmental stages and ease of
creating transgenic lines makes them ideal for studying a range of
biological processes using fluorescence microscopy. Finally, live
animal screens appear to be ideal candidates for drug discovery
strategies designed to address ADMET deficiencies at the outset of
the screening process [53]. In practical terms, however, two major
obstacles block the adaptation of small animals, such as C. elegans,
to high-throughput, high-content screening protocols: the absence
of 1) high-quality assays and 2) an automated system to capture,
analyze and store data documenting the biological effects of
thousands of compounds [41]. Using a combination of transgenic
lines expressing fluorescent proteins and a commercially available
automated fluorescence microscopy imaging system, the ArrayS-
can VTI, we showed that the C. elegans was capable of serving as a
high-quality drug discovery platform analogous to those devised
for cell-based HCS protocols [19].
To improve assay quality we focused initially on parameters that
affected sample population variability. Despite using integrated
and staged transgenic lines, the fluorescence intensity of the
sGFP::ATZ-expressing animals varied two-fold. We minimized
this variability in the assay population by using the COPASTM
BIOSORT to collect a precise number of animals using a tightly-
gated size and fluorescence intensity window. The growth
conditions in the microtiter wells also had a profound effect on
assay quality. C. elegans Maintenance Medium (CeMM, chemically
defined, bacteria free medium) appeared to be an ideal growth
medium for animals cultivated in microtiter plates, but intense
autofluorescence precluded further use [54]. We ultimately used S
Medium supplemented with antibiotics and E. coli (OP50).
Antibiotics were included to prevent growth of fast-growing
bacterial contaminates that could negatively affect survival of the
nematodes. Defining the optimal growth conditions, which vary
depending on the length of the assay period and the number and
condition of the animals, were crucial to developing a robust and
reproducible assay.
The second major impediment to the routine use of C. elegans in
HCS was the lack of systems that automated the time-consuming
process of image acquisition, analysis and storage. This bottleneck
is evident in the first series of relatively low-throughput and labor-
intensive C. elegans drug screens [28,29,33,55,56]. Compound
effects were assessed by direct inspection of animals in microtiter
plate wells using a stereomicroscope or of images captured by a
CCD camera. Although sensitive for the detection of certain
phenotypes, such as alterations in movement or morphology,
manual inspection of plates or images is time consuming and
tedious for HTS campaigns scaled for assaying hundreds-of-
High-Content Screening Using C. elegans
PLoS ONE | www.plosone.org 8 November 2010 | Volume 5 | Issue 11 | e15460
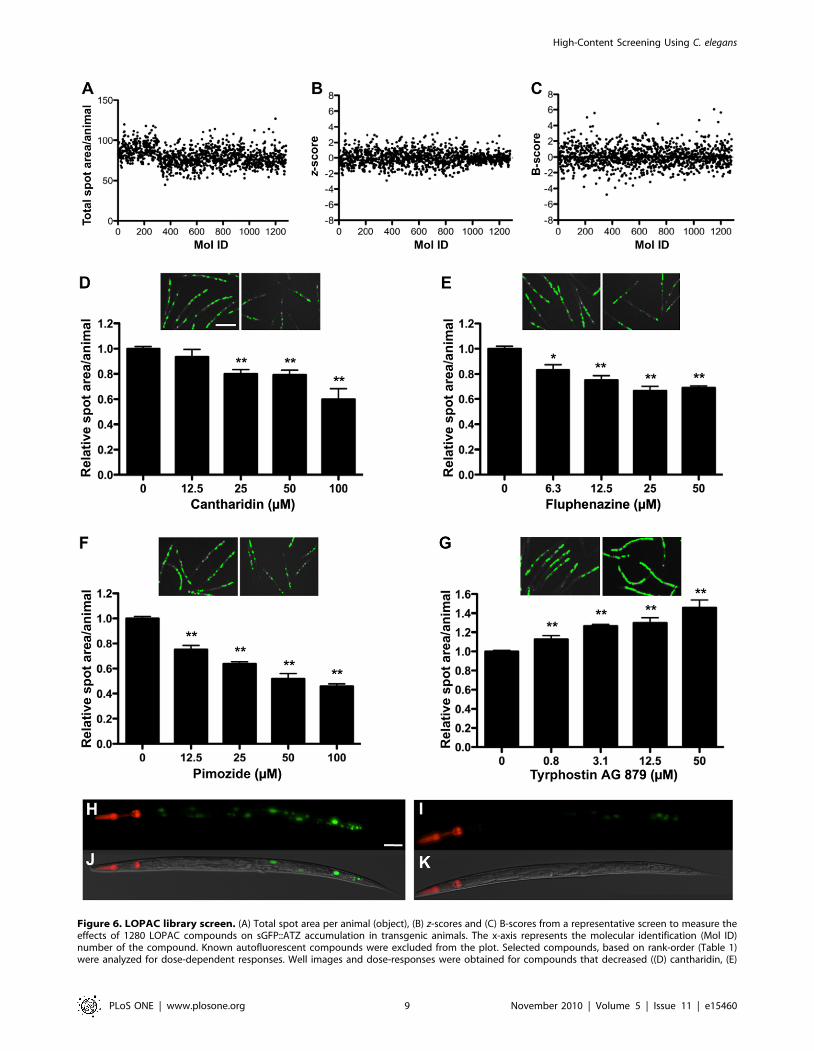
Figure 6. LOPAC library screen. (A) Total spot area per animal (object), (B) z-scores and (C) B-scores from a representative screen to measure theeffects of 1280 LOPAC compounds on sGFP::ATZ accumulation in transgenic animals. The x-axis represents the molecular identification (Mol ID)number of the compound. Known autofluorescent compounds were excluded from the plot. Selected compounds, based on rank-order (Table 1)were analyzed for dose-dependent responses. Well images and dose-responses were obtained for compounds that decreased ((D) cantharidin, (E)
High-Content Screening Using C. elegans
PLoS ONE | www.plosone.org 9 November 2010 | Volume 5 | Issue 11 | e15460
thousands of compounds [28,29,33]. Moreover, operator fatigue
increases variability and decreases specificity. An enzymatic assay
that measures fluorescent substrate conversion in culture medium
can be automated, but the effects of compounds on the whole
animal are lost [55]. Recently, Moy et al., reported an automated
high-throughput screen for novel antimicrobial compounds that
protect C. elegans from a lethal dose of S. faecalis [31]. While their
automated screening assay was five-times faster than screening
manually, the algorithm was limited to a simple yes-no (live-dead)
assessment using the uptake of SYTOXH Orange as an indicator
of death, and was unable to quantify the effects of compounds on
individual animals. Taken together and as compared to established
cell-based HCS protocols, these studies suggest that whole animal
HCS was cumbersome and lacked the refinements in image
acquisition and analysis to quantitatively assess compound effects
on continuous physiological variables such as growth and
development, autophagy, misfolded protein disposition and cell
permeability. In contrast, the HCS format we developed captured
images from up to 5 channels of each well of a 384-well microtiter
plate using an automated inverted fluorescence microscope
platform, while the image analysis software converted these signals
into multiparametric output in real time. Since the images were
stored on a server, different algorithms could be applied at
different times to extract various quantitative measures, such as
fluorescent spot count, spot area or spot intensity per animal.
These types of qualitative measures could never be assessed
accurately manually, as the time required to count, for example, a
dozen fluorescent spots in 35 animals in each well of a 384-well
plate would rapidly fatigue even the most fastidious observer.
However, we recommend that the stored images still be scanned
occasionally for overall quality control and to examine outliers for
irregularities that might account for a large change in signal. For
example, several wells with high total fluorescence were due to
autofluorescent compounds rather than hits that enhanced the
expression or accumulation of sGFP::ATZ. Similarly, for wells in
which the fluorescence was diminished, by for example 50%,
inspection of the images allowed us to distinguish between those
compounds that decreased sGFP::ATZ accumulation comparably
in all animals versus those that simply killed half the animals
without affecting the signal from the others. The ability to
eliminate nuisance compounds at the earliest stages of the
screening process was a significant advantage to using this imaging
system.
The instrument settings used for image acquisition also affected
assay quality, and were improved considerably by optimizing the
microscope’s autofocus and scanning times, and the degree of
magnification used to scan the wells of 96- versus 384-well plates.
The analysis algorithms, which were used to establish the
fluorescence intensity cut-offs and to define fluorescent objects,
also had a significant impact on overall assay quality. By adjusting
these parameters, we consistently obtained a Z9-factor, which
serves as a measure of assay quality, in the excellent range of 0.5 to
0.7; scores that rivaled those of the highest quality cell- or
molecule-based HTS schemes [52]. Based on our studies using
transgenic animals expressing misfolded sGFP::ATZ, we conclud-
ed that the ArrayScan VTI and the BioApplication programs
possessed the automation, speed and sensitivity to generate a high-
quality assay that would permit the quantitative assessment of
compound libraries on a continuous physiological variable, such as
misfolded protein accumulation. Moreover, by optimizing the
imaging analysis, we reduced the scanning time of a 384-well plate
to ,30 minutes. Thus, ,6,000 compounds could be screened in a
typical workday, or ,18,000 compounds per day if the ArrayScan
VTI was configured with an automated plate loader. Screening of
compound effects on a discrete variable, such as a live-dead screen,
would be even faster.
As a test of our C. elegans screening strategy, we performed a
limited drug screen for compounds that affect accumulation of the
misfolded human serpin, a1-antitrypin (sGFP::ATZ). Of the 6
compounds inducing a concentration-dependent decrease in
sGFP::ATZ accumulation, four (cantharidin, tamoxifen, fluphen-
azine and pimozide) belong to classes of drugs that were identified
previously as enhancers of autophagy [57,58]—a physiological
process involved in the elimination of ATZ [59]. Thus, the drug
discovery strategy outlined in this report has significant clinical
import, as C. elegans has been used to model several protein
misfolding disorders including Alzheimer’s disease [60], fronto-
temporal dementia with parkinsonism chromosome 17 type [61],
Parkinson’s disease [62], polyglutamine repeat disorders [63] and
amyotrophic lateral sclerosis [64]. Taken together, we suggest that
live animal HCS for compounds that ameliorate disorders of
proteostasis is feasible [6]. [6,60,63].
Materials and Methods
Construction of promoter-transgene fusionsWe constructed a transcriptional Pmyo-2mRFP fusion construct
was by subcloning the myo-2 promoter and the mRFP cDNA into
the SphI/XbaI and NheI/EcoRV sites of the canonical expression
vector, pPD49.26 (a kind gift from Dr. Andrew Fire, Stanford
University School of Medicine), respectively. To generate the Pnhx-
2mCherry::lgg-1 construct, we PCR amplified a 3.5 kb genomic
fragment containing the lgg-1 promoter, coding region and 39-
UTR and cloned it into pCRH-Blunt II-TOPOH vector (Invitro-
gen, Carlsbad, CA, USA). Using site directed mutagenesis a
unique MluI restriction enzyme site, was introduced upstream of
the lgg-1 translation start codon. The mCherry cDNA, lacking a
translation stop codon, was inserted into the MluI site, which
places it in-frame with the lgg-1 coding region. To direct
expression of the mCherry::lgg-1 fusion gene in intestinal cells, we
replaced the lgg-1 promoter with a 1.5 kb nhx-2 promoter using a
HindIII restriction site.
Pnhx-2sGFP::ATM was generated by inserting a 1.5 kb nhx-2
promoter fragment into HindIII/XbaI restriction sites of the
expression vector, pPD95.85. We then introduced a KasI
restriction site by site-directed mutagenesis into the GFP
translational stop codon. A 1.4 kb fragment containing the
ATM cDNA and 3 synthetic introns was then cloned into the
KasI site. Pnhx-2sGFP::ATZ was generated by site-directed muta-
genesis of Pnhx-2sGFP::ATM, thereby generating the E342K (Z)
mutation.
The plasmid containing Pnhx-2GFP, pFH6IInhx-2, was a kind gift
from Keith Nehrke (University of Rochester Medical Center) [65].
fluphenazine and (F) pimozide) or increased ((G) tyrphostin AG 879) sGFP::ATZ accumulation. In each panel (D–G), well images on the left and rightare DMSO (control)- and drug-treated animals, respectively. (H–K) Higher magnification fluorescent (top) and merged DIC (bottom) images of (H, J)DMSO- or (I, K) cantharidin- treated animals. Note loss of GFP::ATZ accumulation in the cantharidin treated animal. Scale bars, 450 mm (D–G) and50 mm (H–K). Error bars represent SEM. Number of animals used was 140 for each compound concentration and 520 for the DMSO control.Significance was determined using an unpaired Student’s t-test. Asterisks indicate values that differed significantly from animals treated with DMSO.*P,0.01 and **P,0.001.doi:10.1371/journal.pone.0015460.g006
High-Content Screening Using C. elegans
PLoS ONE | www.plosone.org 10 November 2010 | Volume 5 | Issue 11 | e15460
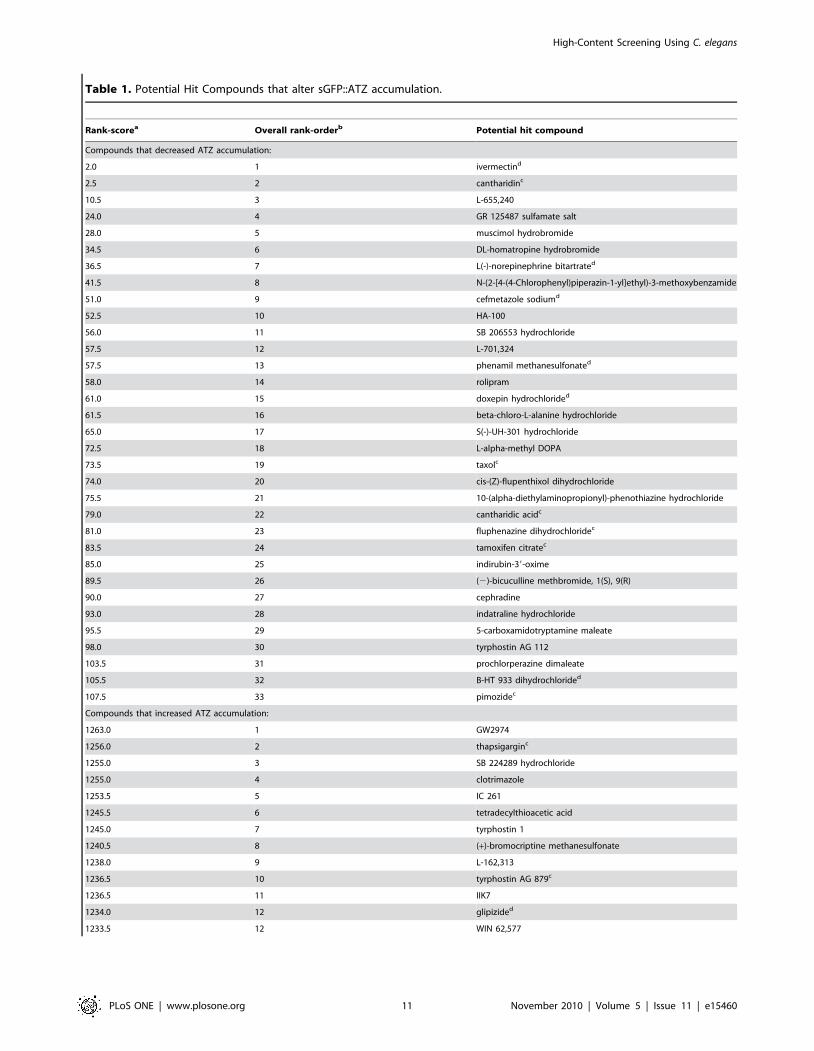
Table 1. Potential Hit Compounds that alter sGFP::ATZ accumulation.
Rank-scorea Overall rank-orderb Potential hit compound
Compounds that decreased ATZ accumulation:
2.0 1 ivermectind
2.5 2 cantharidinc
10.5 3 L-655,240
24.0 4 GR 125487 sulfamate salt
28.0 5 muscimol hydrobromide
34.5 6 DL-homatropine hydrobromide
36.5 7 L(-)-norepinephrine bitartrated
41.5 8 N-(2-[4-(4-Chlorophenyl)piperazin-1-yl]ethyl)-3-methoxybenzamide
51.0 9 cefmetazole sodiumd
52.5 10 HA-100
56.0 11 SB 206553 hydrochloride
57.5 12 L-701,324
57.5 13 phenamil methanesulfonated
58.0 14 rolipram
61.0 15 doxepin hydrochlorided
61.5 16 beta-chloro-L-alanine hydrochloride
65.0 17 S(-)-UH-301 hydrochloride
72.5 18 L-alpha-methyl DOPA
73.5 19 taxolc
74.0 20 cis-(Z)-flupenthixol dihydrochloride
75.5 21 10-(alpha-diethylaminopropionyl)-phenothiazine hydrochloride
79.0 22 cantharidic acidc
81.0 23 fluphenazine dihydrochloridec
83.5 24 tamoxifen citratec
85.0 25 indirubin-39-oxime
89.5 26 (2)-bicuculline methbromide, 1(S), 9(R)
90.0 27 cephradine
93.0 28 indatraline hydrochloride
95.5 29 5-carboxamidotryptamine maleate
98.0 30 tyrphostin AG 112
103.5 31 prochlorperazine dimaleate
105.5 32 B-HT 933 dihydrochlorided
107.5 33 pimozidec
Compounds that increased ATZ accumulation:
1263.0 1 GW2974
1256.0 2 thapsigarginc
1255.0 3 SB 224289 hydrochloride
1255.0 4 clotrimazole
1253.5 5 IC 261
1245.5 6 tetradecylthioacetic acid
1245.0 7 tyrphostin 1
1240.5 8 (+)-bromocriptine methanesulfonate
1238.0 9 L-162,313
1236.5 10 tyrphostin AG 879c
1236.5 11 IIK7
1234.0 12 glipizided
1233.5 12 WIN 62,577
High-Content Screening Using C. elegans
PLoS ONE | www.plosone.org 11 November 2010 | Volume 5 | Issue 11 | e15460
Worm strain and culture conditionsWorm strains: VK413 (Pnhx-2GFP), VK1093 (Pnhx-2mCherry::lgg-
1), VK821 (Pmyo-2mRFP) were generated by injecting the respective
plasmids into the gonad of young adult N2 hermaphrodites at a
final concentration 80 ng/ml. Strains VK689 (Pnhx-2sGFP::ATM)
and VK694 (Pnhx-2sGFP::ATZ) were generated by co-injecting the
plasmids and Pmyo-2mRFP at a final concentration of 70 ng/ml and
10 ng/ml, respectively. The worm strain expressing Pclh-4GFP
(pFL6IIclh-4) were a gift from Keith Nehrke [65]. N2 and GF66
(Pvha-4Q82::YFP, [42]) were obtained from Caenorhabditis Genetics
Center (CGC), http://www.cbs.umn.edu/CGC/). Worms were
routinely cultured at 22uC on nematode growth medium (NGM)
plates seeded with E. coli strain, OP50, unless otherwise specified.
Imaging of transgenic animals using ArrayScan VTI
Twenty N2 or transgenic L4-adult stage worms were transferred
to 384-well plates containing 60 ml of PBS and anesthetized with
30 ml of 0.02 M NaN3 prior to image capture. NaN3 treatment
prevents z-axis movements ensuring animals are in a uniform
plane for imaging. Images were acquired with the ArrayScan VTI
HCS Reader (Cellomics, ThermoFisher, Pittsburgh, PA, USA)
fitted with a 56 or 2.56 objective and a 0.636 coupler. For the
detection of various developmental stages using N2 worms, images
were captured using the brightfield channel. Valid objects (adult
worms) were automatically selected using the SpotDetector
BioApplication (Cellomics). For image capture and analysis of
the lines expressing fluorescent transgenes, we employed a 2-
channel (brightfield and GFP or TRITC) assay. Algorithms were
optimized to first identify valid objects (blue outline in Figs.),
defined as non-overlapping, whole worms in the brightfield
channel. Debris and partial worms were automatically excluded
(orange outline in Figs.) from analysis. Fluorescent transgene
expression, within valid objects, was quantified in the TRITC or
GFP channels. SpotDetector BioApplication was optimized to
identify transgene expression as spots. Parameters were optimized
such that spots of varying shape, size and intensity could be
identified. For this paper, spot count, spot total area and spot total
intensity per object were used to compare transgene expression in
different animals.
Whole animal alive-dead assayAdult N2;vkIs1033[Pmyo-2::mRFP] animals were incubated at
room temperature with sodium azide (0–100 mM) for 4 hours.
Animals were washed 5 times with M9 medium and stained with
2 mM SYTOXTM Green (Invitrogen) for 5 minutes at room
temperature [48]. Approximately 50 animals/well were dispensed
into an optical bottom black walled 96 well plate (Nunc Thermo
Fisher Scientific, Rochester, NY, USA). Wells were imaged using
the ArrayScan VTI over the entire area of the well in brightfield,
red (TRITC) and green (GFP) channels at 506magnification. The
total number of animals and the number of dead bodies were
determined by counting red and green spots, respectively. Data
from SpotDetector algorithm were confirmed by manual counting
of the live and dead animals. Percent dead = (the number of green
objects detected / total number of animals)6100.
Rank-scorea Overall rank-orderb Potential hit compound
1231.0 14 (R)-(+)-WIN 55,212-2 mesylate
1229.5 15 rottlerinc
aRank-scores were calculated by averaging compound rankings based on ascending B-scores from two independent drug screens. Compounds with rank-scores ,110or .1225 significantly decreased or increased the accumulation of sGFP::ATZ inclusions, respectively.
bOverall rank-order, based on relative rank-scores, for compounds that decreased or increased sGFP::ATZ accumulation.cCompound demonstrated a dose-dependent response.dCompound failed to demonstrate a dose-dependent response.doi:10.1371/journal.pone.0015460.t001
Table 1. Cont.
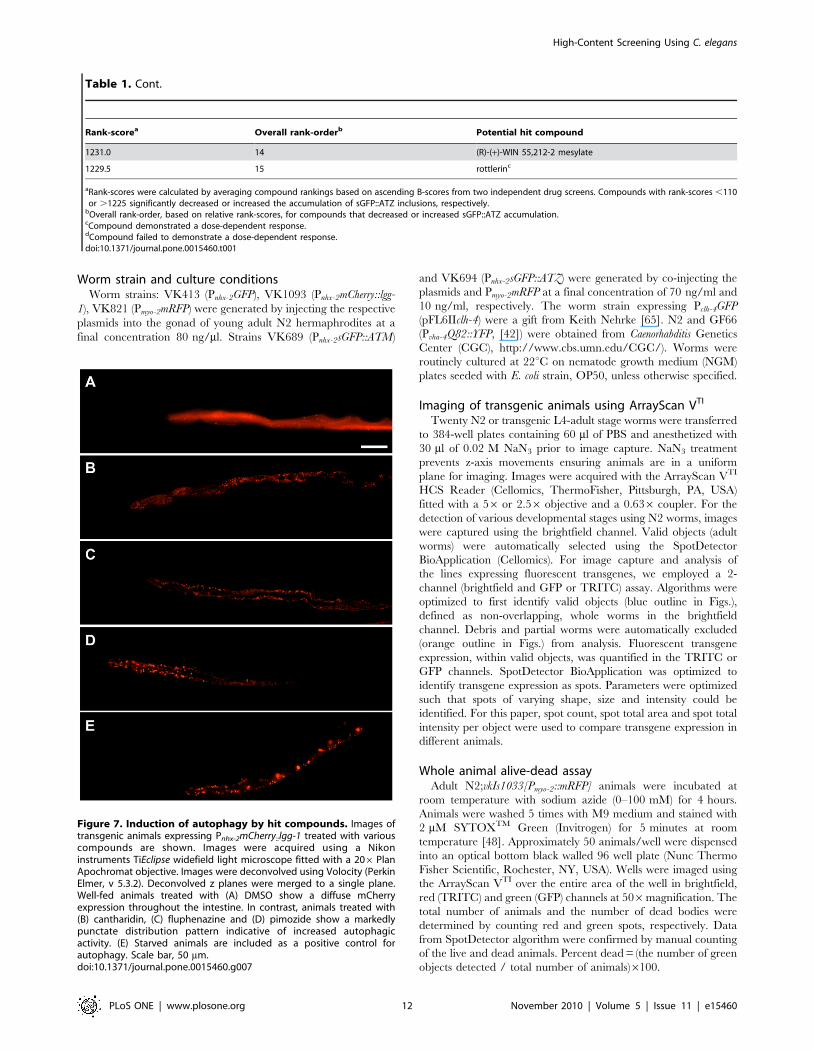
Figure 7. Induction of autophagy by hit compounds. Images oftransgenic animals expressing Pnhx-2mCherry::lgg-1 treated with variouscompounds are shown. Images were acquired using a Nikoninstruments TiEclipse widefield light microscope fitted with a 206PlanApochromat objective. Images were deconvolved using Volocity (PerkinElmer, v 5.3.2). Deconvolved z planes were merged to a single plane.Well-fed animals treated with (A) DMSO show a diffuse mCherryexpression throughout the intestine. In contrast, animals treated with(B) cantharidin, (C) fluphenazine and (D) pimozide show a markedlypunctate distribution pattern indicative of increased autophagicactivity. (E) Starved animals are included as a positive control forautophagy. Scale bar, 50 mm.doi:10.1371/journal.pone.0015460.g007
High-Content Screening Using C. elegans
PLoS ONE | www.plosone.org 12 November 2010 | Volume 5 | Issue 11 | e15460
OP50 preparation for growth of animals in liquid cultureA single colony of OP50 was placed in 3 ml LB broth and
incubated at 37uC with vigorous shaking overnight. One milliliter
of overnight culture was added to 1 L sterile LB broth and was
incubated at 37uC with vigorous shaking until reaching an
OD600 = 0.5. The bacteria were washed twice with PBS and
concentrated to an OD600 = 10.0. An equal volume of 50%
glycerol was added for long-term storage at 280uC. After thawing,
the bacteria were concentrated by centrifugation and re-suspended
in PBS to an OD600 = 10.0.
Preparation of animals for HCS drug screeningTen adult animals were placed on twelve 10 cm plates of NGM
agar medium spread with a lawn of E. coli strain OP50 (NGM/
OP50). Approximately 7 days later, young adult stage F2 animals
were isolated by differential sedimentation and transferred to 12
NGM/OP50 plates. After an overnight incubation at 22uC, adults
were washed off with PBS and the remaining eggs were allowed to
hatch overnight. Early-stage larvae were transferred to 48 NGM/
OP50 plates and allowed to grow until most of the worms were in
the 4th larval (L4) stage. Using the COPASTM BIOSORT (Union
Biometrica, Holliston, MA, USA) approximately 15,000 L4 stage
animals expressing similar levels of GFP were sorted into twelve
10 cm NGM/OP50 plates. After an overnight incubation at 22uC,
gravid adults were washed off and transferred to fresh NGM/
OP50 plates and allowed to lay eggs for 5 hours. Following this
incubation period, adults were washed off and discarded leaving a
synchronous population of eggs on the plates. The eggs were
incubated at 22uC for 16 hours. The hatchlings were then washed
off and transferred to 80–100 100 mm NGM plates seeded with
OP50. After further incubation for 28–32 hours or until the
majority of the worms were in the L4/young adult stages. This
method generated a population of ,200,000 age-synchronized
animals for small molecule screening.
In preparation for sorting, animals were washed off plates and
transferred into 50 ml conical tubes and allowed to settle by
gravity for 5 minutes. After discarding the supernatant, animals
were washed again with 50 ml of PBS to remove excess bacteria
and other debris that could interfere with worm sorting. Following
the final rinse, total worm count was determined by taking aliquots
of the worm suspension. The final worm concentration was
routinely adjusted to ,400 animals/ml.
Compound Libraries and handling, dilution and transferto assay plates
The 1280 compound Library of Pharmacologically Active
Compounds (LOPAC) was purchased from Sigma-Aldrich (St.
Louis, MO, USA). Compounds were arrayed into 384-well
microtiter master plates at a concentration of 10 mM in DMSO.
LOPAC compounds were given unique University of Pittsburgh
Drug Discovery Institute (UPDDI) substance identity numbers and
were handled and stored as described previously [21,22,23,66].
Daughter plates containing 2 ml of 10 mM compounds in DMSO
were prepared and replicated from the LOPAC master plates
using the Vprep (Agilent Technologies, Santa Clara CA, USA)
outfitted with a 384-well transfer head. Aluminum adhesive plate
seals were applied with an Abgene Seal-IT 100 (Rochester, NY,
USA) plate sealer and plates were stored at 220uC in a Matrical
MatriMinistoreTM (Spokane, WA, USA) automated compound
storage and retrieval system. For the primary screen, daughter
plates were withdrawn from the 220uC freezer, thawed at
ambient temperature and centrifuged 1–2 min at 506g. The plate
seals were removed and 98 ml of S-medium were added to the
wells using the Flex Drop dispenser (Perkin Elmer, Waltham, MA,
USA). This intermediate stock of library compounds was at a
concentration of 200 mM in 2% DMSO. The diluted compounds
were mixed by repeated aspiration and dispensation using a 384-
well P30 dispensing head on the Evolution-P3 (EP3) liquid
handling platform (Perkin Elmer), and then 15 ml of each
compound were transferred to the wells of assay plates. In the
primary screen, compounds were screened individually at a final
concentration of 50 mM.
Assay plate preparation for drug screenOn the day of the screen, assay plates containing 15 ml of each
compound were thawed and centrifuged at 2146g for 60 s. Fifteen
microliters of 46 assay medium, which was prepared by mixing
4.0 ml OP50, 25.4 ml S-medium, 0.6 ml 1006 antibiotic-
antimycotic stock solution (stock contained 10,000 units penicillin,
10 mg streptomycin and 25 mg amphotericin B/ml, Sigma) and
120 ml 200 mM FUDR, were added to each well. Animals were
then sorted into the wells using the COPASTM BIOSORT worm
sorter.
Animal sorting using the COPASTM BIOSORTTo reduce assay variability, a tightly-synchronized population of
worms was selected based on size (i.e., stage of development) and
fluorescence intensity (i.e., transgene expression) using the
COPASTM BIOSORT. L4 to young adult-stage worms were
initially selected using empirically-determined time-of-flight (TOF)
and coefficient of extinction (EXT) values. Animals were also
gated based on GFP fluorescence intensity. Approximately 30% of
the starting population was selected.
For analytical assays, animals were suspended in S-medium
(minus EDTA) for sorting. The flow rate was maintained at ,25
worms/sec. Coincidence check was employed to enhance selection
specificity. For LOPAC library screening, COPAS sheath fluid
was replaced with 0.01% Triton X-100 in S-medium (minus
EDTA) to promote healthy bacteria and worm growth. Thirty-five
L4 to young-adult animals were sorted into wells containing
compounds and assay medium. The final total volume per well
after addition of the animals was 60 ml. Approximately 45,000
worms were required for each 384-well plate. On average, sorting
time was 90 minutes per plate. The flow cell was periodically
flushed between plates to prevent clogging. Four 384-well plates
were routinely sorted on the same day. Plates were then sealed
with ThinSeal T-2417-4 (ISC BioExpress, Kaysville, UT, USA)
and incubated at 22uC for 24–48 hours.
Imaging of animals using the ArrayScan VTI
Prior to imaging, worms were anesthetized by adding 30 ml of
0.02 M NaN3 in PBS to each well. Plates were resealed, inverted
twice, and incubated for 5 minutes at room temperature. Images
were acquired with the ArrayScan VTI HCS Reader fitted with a
2.56 objective and a 0.636 coupler using a 2-channel (TRITC
and GFP) assay. Real-time analysis was performed using the
SpotDetector BioApplication optimized to quantify fluorescent
protein expression in C. elegans. Image acquisition and analysis of a
384-well plate was completed in ,45 minutes.
The total number of animals in the well was determined by
counting the number of red heads (Pmyo-2mRFP) in the TRITC
channel. Total spot area or total spot intensity was determined by
quantifying the GFP-positive spots in the GFP channel. Total spot
area or total spot intensity per animal was determined by dividing
the values from the GFP channel by that from the TRITC
channel.
High-Content Screening Using C. elegans
PLoS ONE | www.plosone.org 13 November 2010 | Volume 5 | Issue 11 | e15460

HCS data analysisCompound tracking and data analysis for the primary HCS
assay were performed using ActivityBaseTM (IDBS, Guildford,
UK), CytoMiner (UPDDI) software and visualized using Spot-
fireTM DecisionSiteH (TIBCO Software Inc., Somerville, MA,
USA) software, as described previously [21,22,23,66]. Custom
calculators were written to process the HCS data and perform the
z-score and B-score statistical analysis [67,68].
As a measure of assay quality and robustness, we utilized the Z9-factor
[52]. The Z9-factor was calculated from the mean and the standard
deviation of the negative and positive control populations as follows:
Z0~1{((3|(spzsn))7(mp{mn))
where s is the standard deviation, m is the mean and p and n are positive
and negative controls, respectively. Z9-factors between 0.5 and 1.0
indicate the separation band (signal window) between the positive and
negative controls is wide and the assay is of excellent quality and suitable
for HTS/HCS. Z9-factors between 0 and 0.5 indicate a good quality
screen, whereas a score ,0 indicates the assay is of poor quality and
unsuitable for HTS/HCS.
We utilized the z-score plate-based statistical scoring method as
described previously to identify compounds that behaved as
statistical outliers compared to the other substances (n = 320, no
controls) tested on an assay plate for selected HCS multi-
parameter measurements output by the image analysis module
[22]. The z-score = (Xi2,X.)/s, where Xi was the raw measure-
ment on the ith compound, and ,X. and s were the mean and
standard deviation of all the sample measurements on a plate.
The B-score was calculated from all of the sample measure-
ments on an assay plate and used an iterative mathematical model
to eliminate systematic row and column artifacts on a plate. The
mathematical model of the B-score was described as:
Yijp~mijpzYRipzYCjpzeijp
where Yijp was the compound measurement at ith row and jthcolumn of the pth plate, mijp was the ‘true’ activity value, eijp was
the random error of the assay on the pth plate, and YRip and YCjp
represented the row and column artifacts on the pth plate,
respectively. A two-way median polish statistic method was
applied to estimate the B-score of a HCS assay. The implemented
procedures are described below. The random error estimate, eeijp,
of the measurement at ith row and jth column of the pth plate was
calculated by fitting a two-way median polish as:
eeijp~Yijp{YYijp~Yijp{(mmzRRipzCCjp)
where YYijp was the fitted compound value, mm was the estimated
average of the plate, and RRip and CCjp were the estimated
systematic artifacts for the ith row on pth plate and jth column on pth
plate, respectively. Next the median absolute deviation (MAD) of
the random error estimate on pth plate was computed as:
MADp~Median eeijp{Median(eeijp)�� ��� �
At the last step, the B score was calculated as:
B{score~eeijp
MADp
The compounds were ranked according to ascending B-score
values. Rank-scores were calculated by taking the average of
compound rankings from two independent drug screens. Com-
pounds with rank-scores ,110 significantly decreased the
accumulation of sGFP::ATZ inclusions. Conversely, compounds
with rank-scores .1225 significantly increased the accumulation
of sGFP::ATZ inclusions. Selected compounds (based on cost and
availability) from both groups were chosen for further analysis.
Hit compound characterizationCompounds that were identified as potential hits were
purchased (if available) and retested for verification. Compounds
that failed to produce a dose-dependent response were not
analyzed further. Compounds that produced a response in a dose-
dependent manner were further tested for a time-dependent
response.
Compound dose-response curves were performed by dispensing
15 ml of a 46 stock solution into 384-well plates containing 15 ml
of assay medium (see above). Thirty-five animals were sorted into
each well bringing the volume to ,60 ml. The final compound
concentrations in each well varied from 0–100 mM. Assay plates
were incubated in a 22uC incubator for 24 or 48 hours. Each
compound was tested in quadruplicate in at lease 2 independent
experiments.
Statistical evaluationStatistical evaluation of data was performed using PrismH
(Graphpad Software). The significance of actual and predicted
data in Figures 1, 3 and 4 was determined using a linear regression
analysis and comparing the slope and goodness-of-fit (r2) values.
Statistical significance of the spot count, spot area and spot
intensity values between N2 (wild-type) and various transgenic
lines in Figure 2 and dose-response in Figure 6 was determined
using an unpaired, one-tailed, Student’s t-test.
Supporting Information
Figure S1 Effect of fluphenazine on mCherry aggrega-tion. To determine whether fluphenazine causes non-specific
aggregation of mCherry, transgenic animals expressing Pnhx-2Ub-
M::mCherry were exposed to fluphenazine for 24 hours. The Ub-
M::mCherry fusion is used as a control for ubiquitin (Ub) fusion
protein degradation. Upon Ub cleavage, the absence of a
degradation signal (due to an N-terminal methionine) prevents
mCherry degradation. Thus, mCherry behaves as an unmodified
cytosolic protein [69]. Pnhx-2mCherry::lgg-1 (top) and Pnhx-2Ub(GM)::
mCherry (bottom) animals were treated with (A, C) 0.5% DMSO or
(B, D) 50 mM fluphenazine. Images were acquired using a Nikon
instruments TiEclipse widefield light microscope fitted with a 406objective. Scale bar, 100 mm. (JPG)
Acknowledgments
We would like to thank Debby Nickischer and Scott Keefer (Thermo
Scientific Cellomics Products) for their help in the early stages of assay
development.
Author Contributions
Conceived and designed the experiments: DHP GAS SCP. Performed the
experiments: SJG JHK OSL DEK KKK CJL. Analyzed the data: PAJ
TYS JSL. Wrote the paper: DHP GAS SCP.
High-Content Screening Using C. elegans
PLoS ONE | www.plosone.org 14 November 2010 | Volume 5 | Issue 11 | e15460

References
1. Aguzzi A, O’Connor T (2010) Protein aggregation diseases: pathogenicity and
therapeutic perspectives. Nat Rev Drug Discov 9: 237–248.
2. Herczenik E, Gebbink MF (2008) Molecular and cellular aspects of protein
misfolding and disease. FASEB J 22: 2115–2133.
3. Krebs MP, Holden DC, Joshi P, Clark CL, 3rd, Lee AH, et al. (2010) Molecular
mechanisms of rhodopsin retinitis pigmentosa and the efficacy of pharmacolog-
ical rescue. J Mol Biol 395: 1063–1078.
4. Lomas DA, Belorgey D, Mallya M, Miranda E, Kinghorn KJ, et al. (2005)
Molecular mousetraps and the serpinopathies. Biochem Soc Trans 33: 321–330.
5. Picken MM (2010) Amyloidosis-where are we now and where are we heading?
Arch Pathol Lab Med 134: 545–551.
6. Balch WE, Morimoto RI, Dillin A, Kelly JW (2008) Adapting proteostasis for
disease intervention. Science 319: 916–919.
7. Cohen E, Bieschke J, Perciavalle RM, Kelly JW, Dillin A (2006) Opposing
activities protect against age-onset proteotoxicity. Science 313: 1604–1610.
8. Bartolini M, Andrisano V (2010) Strategies for the inhibition of protein
aggregation in human diseases. Chembiochem 11: 1018–1035.
9. Krainc D (2010) Clearance of mutant proteins as a therapeutic target in
neurodegenerative diseases. Arch Neurol 67: 388–392.
10. Hidvegi T, Ewing M, Hale P, Dippold C, Beckett C, et al. (2010) An autophagy-
enhancing drug promotes degradation of mutant alpha1-antitrypsin Z and
reduces hepatic fibrosis. Science 329: 229–232.
11. Link CD (2006) C. elegans models of age-associated neurodegenerative diseases:
lessons from transgenic worm models of Alzheimer’s disease. Exp Gerontol 41:
1007–1013.
12. Frearson JA, Collie IT (2009) HTS and hit finding in academia - from chemical
genomics to drug discovery. Drug Discov Today 14: 1150–1158.
13. Mayr LM, Bojanic D (2009) Novel trends in high-throughput screening. Curr
Opin Pharmacol 9: 580–588.
14. Bleicher KH, Bohm HJ, Muller K, Alanine AI (2003) Hit and lead generation:
beyond high-throughput screening. Nat Rev Drug Discov 2: 369–378.
15. Hodgson J (2001) ADMET–turning chemicals into drugs. Nat Biotechnol 19:
722–726.
16. Gleeson MP (2008) Generation of a set of simple, interpretable ADMET rules of
thumb. J Med Chem 51: 817–834.
17. Gleeson P, Bravi G, Modi S, Lowe D (2009) ADMET rules of thumb II: A
comparison of the effects of common substituents on a range of ADMET
parameters. Bioorg Med Chem 17: 5906–5919.
18. Giuliano KA, Johnston PA, Gough A, Taylor DL (2006) Systems cell biology
based on high-content screening. Methods Enzymol 414: 601–619.
19. Haney SA, LaPan P, Pan J, Zhang J (2006) High-content screening moves to the
front of the line. Drug Discov Today 11: 889–894.
20. Johnston PA (2002) Cellular platforms for HTS: three case studies. Drug Discov
Today 7: 353–363.
21. Johnston PA, Foster CA, Tierno MB, Shun TY, Shinde SN, et al. (2009)
Cdc25B dual-specificity phosphatase inhibitors identified in a high-throughput
screen of the NIH compound library. Assay Drug Dev Technol 7: 250–265.
22. Johnston PA, Phillips J, Shun TY, Shinde S, Lazo JS, et al. (2007) HTS identifies
novel and specific uncompetitive inhibitors of the two-component NS2B-NS3
proteinase of West Nile virus. Assay Drug Dev Technol 5: 737–750.
23. Johnston PA, Soares KM, Shinde SN, Foster CA, Shun TY, et al. (2008)
Development of a 384-well colorimetric assay to quantify hydrogen peroxide
generated by the redox cycling of compounds in the presence of reducing agents.
Assay Drug Dev Technol 6: 505–518.
24. Nickischer D, Laethem C, Trask OJ, Jr., Williams RG, Kandasamy R, et al.
(2006) Development and implementation of three mitogen-activated protein
kinase (MAPK) signaling pathway imaging assays to provide MAPK module
selectivity profiling for kinase inhibitors: MK2-EGFP translocation, c-Jun, and
ERK activation. Methods Enzymol 414: 389–418.
25. Trask OJ, Jr., Baker A, Williams RG, Nickischer D, Kandasamy R, et al. (2006)
Assay development and case history of a 32K-biased library high-content MK2-
EGFP translocation screen to identify p38 mitogen-activated protein kinase
inhibitors on the ArrayScan 3.1 imaging platform. Methods Enzymol 414:
419–439.
26. Williams RG, Kandasamy R, Nickischer D, Trask OJ, Jr., Laethem C, et al.
(2006) Generation and characterization of a stable MK2-EGFP cell line and
subsequent development of a high-content imaging assay on the Cellomics
ArrayScan platform to screen for p38 mitogen-activated protein kinase
inhibitors. Methods Enzymol 414: 364–389.
27. Stockwell BR (2000) Chemical genetics: ligand-based discovery of gene function.
Nat Rev Genet 1: 116–125.
28. Breger J, Fuchs BB, Aperis G, Moy TI, Ausubel FM, et al. (2007) Antifungal
chemical compounds identified using a C. elegans pathogenicity assay. PLoS
Pathog 3: e18.
29. Kwok TC, Ricker N, Fraser R, Chan AW, Burns A, et al. (2006) A small-
molecule screen in C. elegans yields a new calcium channel antagonist. Nature
441: 91–95.
30. Molina G, Vogt A, Bakan A, Dai W, Queiroz de Oliveira P, et al. (2009)
Zebrafish chemical screening reveals an inhibitor of Dusp6 that expands cardiac
cell lineages. Nat Chem Biol 5: 680–687.
31. Moy TI, Conery AL, Larkins-Ford J, Wu G, Mazitschek R, et al. (2009) High-throughput screen for novel antimicrobials using a whole animal infection
model. ACS Chem Biol 4: 527–533.
32. North TE, Goessling W, Walkley CR, Lengerke C, Kopani KR, et al. (2007)Prostaglandin E2 regulates vertebrate haematopoietic stem cell homeostasis.
Nature 447: 1007–1011.
33. Petrascheck M, Ye X, Buck LB (2007) An antidepressant that extends lifespan in
adult Caenorhabditis elegans. Nature 450: 553–556.
34. Rihel J, Prober DA, Arvanites A, Lam K, Zimmerman S, et al. (2010) Zebrafish
behavioral profiling links drugs to biological targets and rest/wake regulation.
Science 327: 348–351.
35. Tran TC, Sneed B, Haider J, Blavo D, White A, et al. (2007) Automated,
quantitative screening assay for antiangiogenic compounds using transgenic
zebrafish. Cancer Res 67: 11386–11392.
36. Yu PB, Hong CC, Sachidanandan C, Babitt JL, Deng DY, et al. (2008)Dorsomorphin inhibits BMP signals required for embryogenesis and iron
metabolism. Nat Chem Biol 4: 33–41.
37. Artal-Sanz M, de Jong L, Tavernarakis N (2006) Caenorhabditis elegans: a
versatile platform for drug discovery. Biotechnol J 1: 1405–1418.
38. de Voer G, Peters D, Taschner PE (2008) Caenorhabditis elegans as a model for
lysosomal storage disorders. Biochim Biophys Acta 1782: 433–446.
39. Kaletta T, Hengartner MO (2006) Finding function in novel targets: C. elegansas a model organism. Nat Rev Drug Discov 5: 387–398.
40. Silverman GA, Luke CJ, Bhatia SR, Long OS, Vetica AC, et al. (2009)
Modeling molecular and cellular aspects of human disease using the nematode
Caenorhabditis elegans. Pediatr Res 65: 10–18.
41. Lee S, Howell BJ (2006) High-content screening: emerging hardware and
software technologies. Methods Enzymol 414: 468–483.
42. Morley JF, Brignull HR, Weyers JJ, Morimoto RI (2002) The threshold forpolyglutamine-expansion protein aggregation and cellular toxicity is dynamic
and influenced by aging in Caenorhabditis elegans. Proc Natl Acad Sci U S A
99: 10417–10422.
43. Lum JJ, DeBerardinis RJ, Thompson CB (2005) Autophagy in metazoans: cellsurvival in the land of plenty. Nat Rev Mol Cell Biol 6: 439–448.
44. Melendez A, Talloczy Z, Seaman M, Eskelinen EL, Hall DH, et al. (2003)
Autophagy genes are essential for dauer development and life-span extension in
C. elegans. Science 301: 1387–1391.
45. Kang C, You YJ, Avery L (2007) Dual roles of autophagy in the survival of
Caenorhabditis elegans during starvation. Genes Dev 21: 2161–2171.
46. Driscoll M, Chalfie M (1991) The mec-4 gene is a member of a family ofCaenorhabditis elegans genes that can mutate to induce neuronal degeneration.
Nature 349: 588–593.
47. Royal DC, Bianchi L, Royal MA, Lizzio M, Jr., Mukherjee G, et al. (2005)
Temperature-sensitive mutant of the Caenorhabditis elegans neurotoxic MEC-4(d) DEG/ENaC channel identifies a site required for trafficking or surface
maintenance. J Biol Chem 280: 41976–41986.
48. Luke CJ, Pak SC, Askew YS, Naviglia TL, Askew DJ, et al. (2007) An
intracellular serpin regulates necrosis by inhibiting the induction and sequelae oflysosomal injury. Cell 130: 1108–1119.
49. Gill MS, Olsen A, Sampayo JN, Lithgow GJ (2003) An automated high-
throughput assay for survival of the nematode Caenorhabditis elegans. FreeRadic Biol Med 35: 558–565.
50. Nehrke K (2003) A reduction in intestinal cell pHi due to loss of the
Caenorhabditis elegans Na+/H+ exchanger NHX-2 increases life span. J Biol
Chem 278: 44657–44566.
51. Perlmutter DH (2002) Liver injury in alpha1-antitrypsin deficiency: an
aggregated protein induces mitochondrial injury. Journal of Clinical Investiga-
tion 110: 1579–1583.
52. Zhang JH, Chung TD, Oldenburg KR (1999) A Simple Statistical Parameter for
Use in Evaluation and Validation of High Throughput Screening Assays.
J Biomol Screen 4: 67–73.
53. Giacomotto J, Segalat L (2010) High-throughput screening and small animalmodels, where are we? Br J Pharmacol 160: 204–216.
54. Szewczyk NJ, Kozak E, Conley CA (2003) Chemically defined medium and
Caenorhabditis elegans. BMC Biotechnol 3: 19–25.
55. Ellerbrock BR, Coscarelli EM, Gurney ME, Geary TG (2004) Screening for
presenilin inhibitors using the free-living nematode, Caenorhabditis elegans.
J Biomol Screen 9: 147–152.
56. Okoli I, Coleman JJ, Tampakakis E, An WF, Holson E, et al. (2009)Identification of antifungal compounds active against Candida albicans using
an improved high-throughput Caenorhabditis elegans assay. PLoS One 4:
e7025.
57. Williams A, Sarkar S, Cuddon P, Ttofi EK, Saiki S, et al. (2008) Novel targetsfor Huntington’s disease in an mTOR-independent autophagy pathway. Nat
Chem Biol 4: 295–305.
58. Zhang L, Yu J, Pan H, Hu P, Hao Y, et al. (2007) Small molecule regulators of
autophagy identified by an image-based high-throughput screen. Proc Natl AcadSci U S A 104: 19023–19028.
59. Kamimoto T, Shoji S, Hidvegi T, Mizushima N, Umebayashi K, et al. (2006)
Intracellular inclusions containing mutant alpha1-antitrypsin Z are propagated
in the absence of autophagic activity. J Biol Chem 281: 4467–4476.
High-Content Screening Using C. elegans
PLoS ONE | www.plosone.org 15 November 2010 | Volume 5 | Issue 11 | e15460
60. Link CD (1995) Expression of human beta-amyloid peptide in transgenic
Caenorhabditis elegans. Proc Natl Acad Sci U S A 92: 9368–9372.61. Kraemer BC, Zhang B, Leverenz JB, Thomas JH, Trojanowski JQ, et al. (2003)
Neurodegeneration and defective neurotransmission in a Caenorhabditis elegans
model of tauopathy. Proc Natl Acad Sci U S A 100: 9980–9985.62. Lakso M, Vartiainen S, Moilanen AM, Sirvio J, Thomas JH, et al. (2003)
Dopaminergic neuronal loss and motor deficits in Caenorhabditis elegansoverexpressing human alpha-synuclein. J Neurochem 86: 165–172.
63. Faber PW, Alter JR, MacDonald ME, Hart AC (1999) Polyglutamine-mediated
dysfunction and apoptotic death of a Caenorhabditis elegans sensory neuron.Proc Natl Acad Sci U S A 96: 179–184.
64. Oeda T, Shimohama S, Kitagawa N, Kohno R, Imura T, et al. (2001) Oxidativestress causes abnormal accumulation of familial amyotrophic lateral sclerosis-
related mutant SOD1 in transgenic Caenorhabditis elegans. Hum Mol Genet10: 2013–2023.
65. Nehrke K, Melvin JE (2002) The NHX family of Na+-H+ exchangers in
Caenorhabditis elegans. J Biol Chem 277: 29036–29044.
66. Johnston PA, Foster CA, Shun TY, Skoko JJ, Shinde S, et al. (2007)
Development and implementation of a 384-well homogeneous fluorescence
intensity high-throughput screening assay to identify mitogen-activated protein
kinase phosphatase-1 dual-specificity protein phosphatase inhibitors. Assay Drug
Dev Technol 5: 319–332.
67. Brideau C, Gunter B, Pikounis B, Liaw A (2003) Improved statistical methods
for hit selection in high-throughput screening. J Biomol Screen 8: 634–647.
68. Malo N, Hanley JA, Cerquozzi S, Pelletier J, Nadon R (2006) Statistical practice
in high-throughput screening data analysis. Nat Biotechnol 24: 167–175.
69. Dantuma NP, Lindsten K, Glas R, Jellne M, Masucci MG (2000) Short-lived
green fluorescent proteins for quantifying ubiquitin/proteasome-dependent
proteolysis in living cells. Nat Biotechnol 18: 538–543.
High-Content Screening Using C. elegans
PLoS ONE | www.plosone.org 16 November 2010 | Volume 5 | Issue 11 | e15460