Control of pore radius regulation for electroporation-based drug delivery
Available online at www.sciencedirect.com
(2007) 164–171www.elsevier.com/locate/bioelechem
Bioelectrochemistry 71
Feasibility study for cell electroporation detection and separationby means of dielectrophoresis
Jakob Oblak a, Dejan Križaj b, Slavko Amon b, Alenka Maček-Lebar b, Damijan Miklavčič b,⁎
a Institute for Rehabilitation, Linhartova 51, 1000 Ljubljana, Sloveniab University of Ljubljana, Faculty of Electrical Engineering, Ljubljana, Slovenia
Received 9 March 2007; accepted 6 April 2007Available online 18 April 2007
Abstract
Electroporation is a phenomenon during which exposure of a cell to high voltage electric pulses results in a significant increase in its membranepermeability. Aside from the fact that after the electroporation the cell membrane becomes more permeable, the cells' geometrical and electricalproperties change considerably. These changes enable use of the force on dielectric particles exposed to non-uniform electric field(dielectrophoresis) for separation of non-electroporated and electroporated cells. This paper reports the results of an attempt to separate non-electroporated and electroporated cells by means of dielectrophoresis. In several experiments we managed to separate the non-electroporated andelectroporated cells suspended in a medium with conductivity 0.174 S/m by exposing them to a non-uniform electric field at a frequency of2 MHz. The behaviour of electroporated cells exposed to dielectrophoresis raises the presumption that in addition to conductivity, considerablechanges in membrane permittivity occur after the electroporation.© 2007 Elsevier B.V. All rights reserved.
Keywords: Electroporation; Dielectrophoresis; Cell separation; Membrane permittivity
1. Introduction
In biotechnology, biology and medicine, it is sometimesimportant to be able to introduce specific molecules which areotherwise cell membrane impermeant. Electroporation is awidely-used technique for delivering a large variety of imperme-able molecules, such as drugs [1–3] and genes [4–6] into cells,both in vitro and in vivo. This is a phenomenon during whichexposure of a cell to an electric field results in a significantincrease in its membrane permeability [7–9]. It is believed thatpores are formed in the membrane due to induced electricpotential difference across the cell membrane above some criticalvalue (0.3 and 1 V). For this reason, the phenomenon was namedelectroporation [10,11]. Nevertheless, in order to emphasize on
⁎ Corresponding author. University of Ljubljana, Faculty of ElectricalEngineering, Tržaška 25, 1000 Ljubljana, Slovenia. Tel.: +386 1 4768 456 or221; fax: +386 1 426 46 58 or 30.
E-mail addresses: [email protected] (J. Oblak), [email protected](D. Križaj), [email protected] (S. Amon),[email protected] (A. Maček-Lebar),[email protected] (D. Miklavčič).
1567-5394/$ - see front matter © 2007 Elsevier B.V. All rights reserved.doi:10.1016/j.bioelechem.2007.04.001
increased membrane permeability, also a more descriptive termelectropermeabilization is in use for the observed phenomenon[12]. If electric pulse parameters like duration, number, amplitudeand repetition frequency are chosen properly, so that resultingexternal electric field is not too intense, the cell is capable to resealits membrane and electroporation is reversible [13,14]. On theother side, if the external electric field is too large, membranerupture takes place and the electroporation becomes irreversible,resulting in cell death [15,16]. Beside the parameters of theelectroporation pulse, the properties of the medium and the cellaffect induced electric potential on the cell membrane and thus theelectroporation itself [17,18].
Normally, a test whether a cell is electroporated or not isperformed by exposing cells to dye (propidium iodide, trypanblue, lucifer yellow…) [19–21]. In these procedures the cell isdestroyed and, as such, can not be further used. In many cases,researchers would prefer a more convenient method whichwould separate the non-electroporated and electroporated cellsfrom the cell suspension. It would be especially convenient ifthe method would monitor the efficacy of cell electroporation inreal time [22]. A very useful method for manipulation and
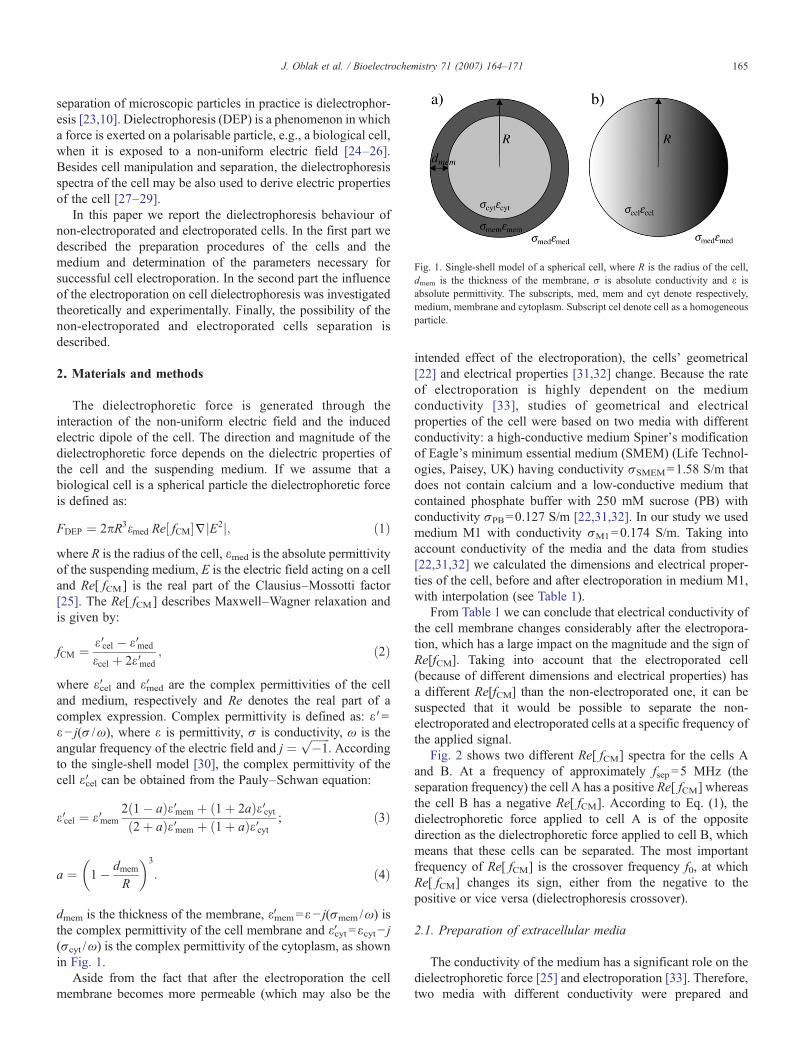
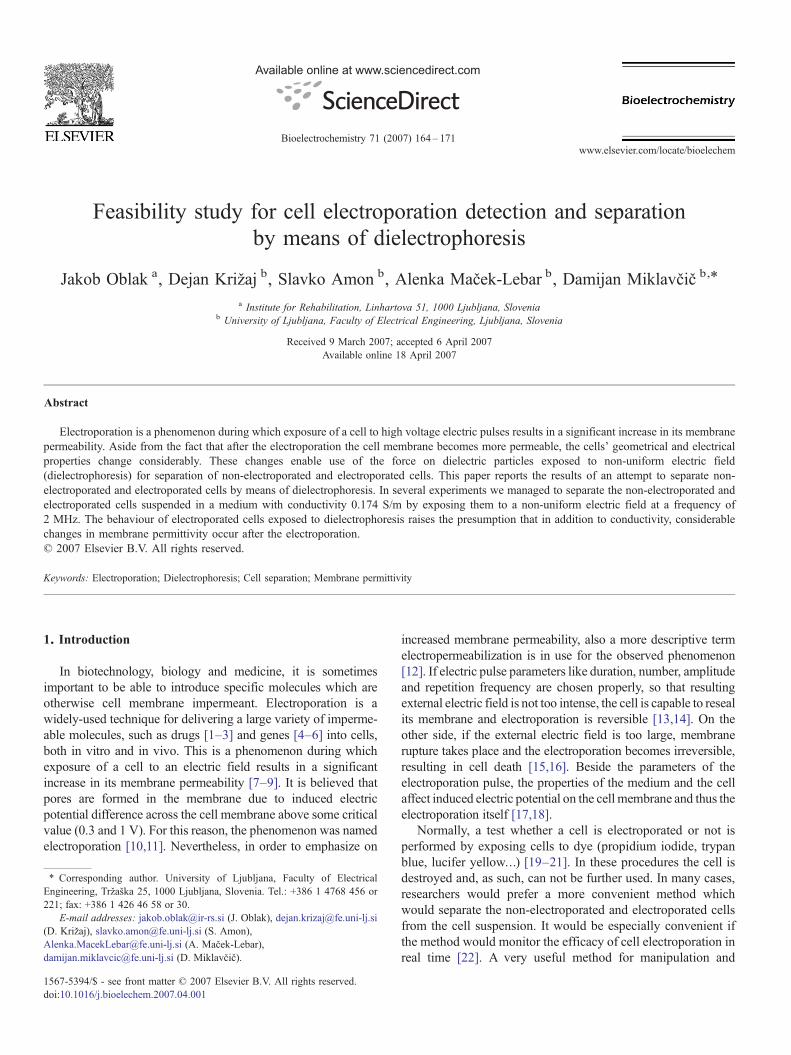
Fig. 1. Single-shell model of a spherical cell, where R is the radius of the cell,dmem is the thickness of the membrane, σ is absolute conductivity and ε isabsolute permittivity. The subscripts, med, mem and cyt denote respectively,medium, membrane and cytoplasm. Subscript cel denote cell as a homogeneousparticle.
165J. Oblak et al. / Bioelectrochemistry 71 (2007) 164–171
separation of microscopic particles in practice is dielectrophor-esis [23,10]. Dielectrophoresis (DEP) is a phenomenon in whicha force is exerted on a polarisable particle, e.g., a biological cell,when it is exposed to a non-uniform electric field [24–26].Besides cell manipulation and separation, the dielectrophoresisspectra of the cell may be also used to derive electric propertiesof the cell [27–29].
In this paper we report the dielectrophoresis behaviour ofnon-electroporated and electroporated cells. In the first part wedescribed the preparation procedures of the cells and themedium and determination of the parameters necessary forsuccessful cell electroporation. In the second part the influenceof the electroporation on cell dielectrophoresis was investigatedtheoretically and experimentally. Finally, the possibility of thenon-electroporated and electroporated cells separation isdescribed.
2. Materials and methods
The dielectrophoretic force is generated through theinteraction of the non-uniform electric field and the inducedelectric dipole of the cell. The direction and magnitude of thedielectrophoretic force depends on the dielectric properties ofthe cell and the suspending medium. If we assume that abiological cell is a spherical particle the dielectrophoretic forceis defined as:
FDEP ¼ 2pR3emed Re½ fCM�jjE2j; ð1Þwhere R is the radius of the cell, εmed is the absolute permittivityof the suspending medium, E is the electric field acting on a celland Re[ fCM] is the real part of the Clausius–Mossotti factor[25]. The Re[ fCM] describes Maxwell–Wagner relaxation andis given by:
fCM ¼ e Vcel � e Vmed
ecel þ 2e Vmed; ð2Þ
where εcel′ and εmed′ are the complex permittivities of the celland medium, respectively and Re denotes the real part of acomplex expression. Complex permittivity is defined as: ε′=ε− j(σ /ω), where ε is permittivity, σ is conductivity, ω is theangular frequency of the electric field and j ¼ ffiffiffiffiffiffiffi�1
p. According
to the single-shell model [30], the complex permittivity of thecell εcel′ can be obtained from the Pauly–Schwan equation:
e Vcel ¼ e Vmem2ð1� aÞe Vmem þ ð1þ 2aÞe Vcytð2þ aÞe Vmem þ ð1þ aÞe Vcyt ; ð3Þ
a ¼ 1� dmem
R
� �3
: ð4Þ
dmem is the thickness of the membrane, εmem′ =ε− j(σmem /ω) isthe complex permittivity of the cell membrane and εcyt′ =εcyt− j(σcyt /ω) is the complex permittivity of the cytoplasm, as shownin Fig. 1.
Aside from the fact that after the electroporation the cellmembrane becomes more permeable (which may also be the
intended effect of the electroporation), the cells’ geometrical[22] and electrical properties [31,32] change. Because the rateof electroporation is highly dependent on the mediumconductivity [33], studies of geometrical and electricalproperties of the cell were based on two media with differentconductivity: a high-conductive medium Spiner's modificationof Eagle's minimum essential medium (SMEM) (Life Technol-ogies, Paisey, UK) having conductivity σSMEM=1.58 S/m thatdoes not contain calcium and a low-conductive medium thatcontained phosphate buffer with 250 mM sucrose (PB) withconductivity σPB=0.127 S/m [22,31,32]. In our study we usedmedium M1 with conductivity σM1=0.174 S/m. Taking intoaccount conductivity of the media and the data from studies[22,31,32] we calculated the dimensions and electrical proper-ties of the cell, before and after electroporation in medium M1,with interpolation (see Table 1).
From Table 1 we can conclude that electrical conductivity ofthe cell membrane changes considerably after the electropora-tion, which has a large impact on the magnitude and the sign ofRe[fCM]. Taking into account that the electroporated cell(because of different dimensions and electrical properties) hasa different Re[fCM] than the non-electroporated one, it can besuspected that it would be possible to separate the non-electroporated and electroporated cells at a specific frequency ofthe applied signal.
Fig. 2 shows two different Re[ fCM] spectra for the cells Aand B. At a frequency of approximately fsep=5 MHz (theseparation frequency) the cell A has a positive Re[ fCM] whereasthe cell B has a negative Re[ fCM]. According to Eq. (1), thedielectrophoretic force applied to cell A is of the oppositedirection as the dielectrophoretic force applied to cell B, whichmeans that these cells can be separated. The most importantfrequency of Re[ fCM] is the crossover frequency f0, at whichRe[ fCM] changes its sign, either from the negative to thepositive or vice versa (dielectrophoresis crossover).
2.1. Preparation of extracellular media
The conductivity of the medium has a significant role on thedielectrophoretic force [25] and electroporation [33]. Therefore,two media with different conductivity were prepared and
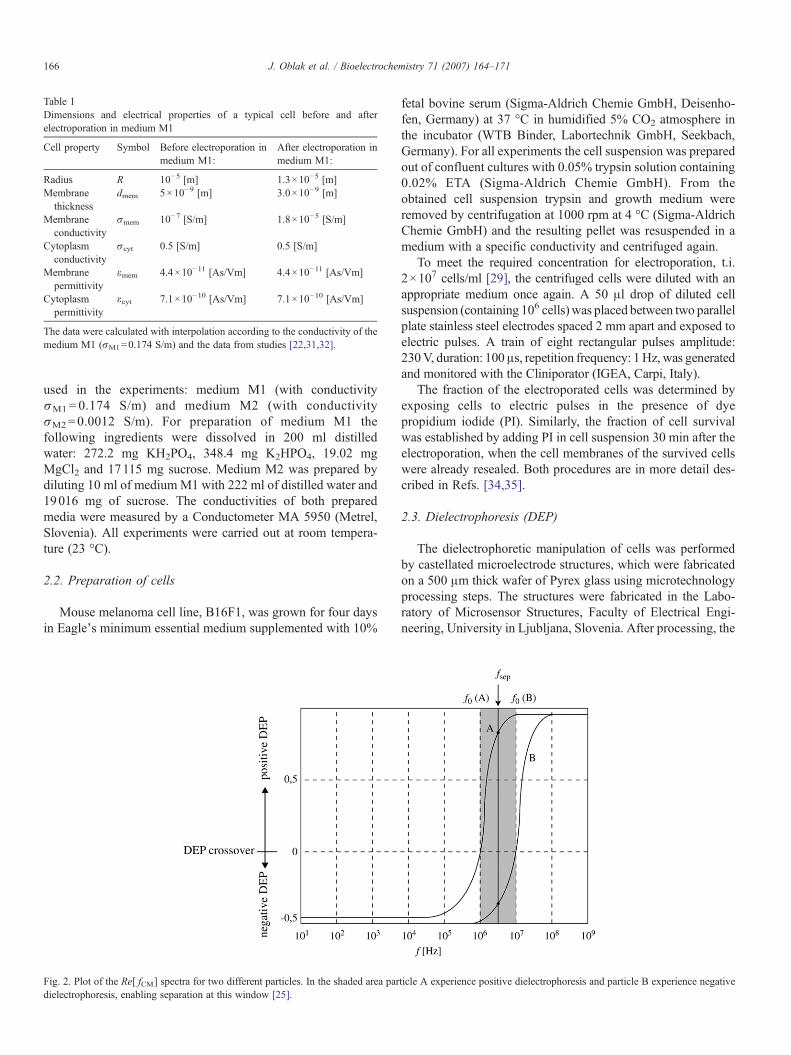
Table 1Dimensions and electrical properties of a typical cell before and afterelectroporation in medium M1
Cell property Symbol Before electroporation inmedium M1:
After electroporation inmedium M1:
Radius R 10−5 [m] 1.3×10⁻⁵ [m]Membranethickness
dmem 5×10⁻⁹ [m] 3.0×10⁻⁹ [m]
Membraneconductivity
σmem 10−7 [S/m] 1.8×10⁻⁵ [S/m]
Cytoplasmconductivity
σcyt 0.5 [S/m] 0.5 [S/m]
Membranepermittivity
εmem 4.4×10⁻¹¹ [As/Vm] 4.4×10⁻¹¹ [As/Vm]
Cytoplasmpermittivity
εcyt 7.1×10⁻¹⁰ [As/Vm] 7.1×10⁻¹⁰ [As/Vm]
The data were calculated with interpolation according to the conductivity of themedium M1 (σM1=0.174 S/m) and the data from studies [22,31,32].
166 J. Oblak et al. / Bioelectrochemistry 71 (2007) 164–171
used in the experiments: medium M1 (with conductivityσM1= 0.174 S/m) and medium M2 (with conductivityσM2=0.0012 S/m). For preparation of medium M1 thefollowing ingredients were dissolved in 200 ml distilledwater: 272.2 mg KH2PO4, 348.4 mg K2HPO4, 19.02 mgMgCl2 and 17115 mg sucrose. Medium M2 was prepared bydiluting 10 ml of mediumM1 with 222 ml of distilled water and19016 mg of sucrose. The conductivities of both preparedmedia were measured by a Conductometer MA 5950 (Metrel,Slovenia). All experiments were carried out at room tempera-ture (23 °C).
2.2. Preparation of cells
Mouse melanoma cell line, B16F1, was grown for four daysin Eagle's minimum essential medium supplemented with 10%
Fig. 2. Plot of the Re[ fCM] spectra for two different particles. In the shaded area pardielectrophoresis, enabling separation at this window [25].
fetal bovine serum (Sigma-Aldrich Chemie GmbH, Deisenho-fen, Germany) at 37 °C in humidified 5% CO2 atmosphere inthe incubator (WTB Binder, Labortechnik GmbH, Seekbach,Germany). For all experiments the cell suspension was preparedout of confluent cultures with 0.05% trypsin solution containing0.02% ETA (Sigma-Aldrich Chemie GmbH). From theobtained cell suspension trypsin and growth medium wereremoved by centrifugation at 1000 rpm at 4 °C (Sigma-AldrichChemie GmbH) and the resulting pellet was resuspended in amedium with a specific conductivity and centrifuged again.
To meet the required concentration for electroporation, t.i.2×107 cells/ml [29], the centrifuged cells were diluted with anappropriate medium once again. A 50 μl drop of diluted cellsuspension (containing 106 cells) was placed between two parallelplate stainless steel electrodes spaced 2 mm apart and exposed toelectric pulses. A train of eight rectangular pulses amplitude:230V, duration: 100μs, repetition frequency: 1Hz, was generatedand monitored with the Cliniporator (IGEA, Carpi, Italy).
The fraction of the electroporated cells was determined byexposing cells to electric pulses in the presence of dyepropidium iodide (PI). Similarly, the fraction of cell survivalwas established by adding PI in cell suspension 30 min after theelectroporation, when the cell membranes of the survived cellswere already resealed. Both procedures are in more detail des-cribed in Refs. [34,35].
2.3. Dielectrophoresis (DEP)
The dielectrophoretic manipulation of cells was performedby castellated microelectrode structures, which were fabricatedon a 500 μm thick wafer of Pyrex glass using microtechnologyprocessing steps. The structures were fabricated in the Labo-ratory of Microsensor Structures, Faculty of Electrical Engi-neering, University in Ljubljana, Slovenia. After processing, the
ticle A experience positive dielectrophoresis and particle B experience negative

Fig. 3. Module with a microelectrode structure.
167J. Oblak et al. / Bioelectrochemistry 71 (2007) 164–171
microelectrode structures were cut from the wafer and preparedas modules as presented in Fig. 3. The fabrication of themicroelectrode structures was not a subject of this study and isin more detail described in Ref. [36].
Sinusoidal signals of magnitude 7 Vpp were applied to thepair of electrodes over the frequency range 5 kHz– 50 MHzusing a function generator 33250A (Agilent, USA).
The cells were diluted with a medium with a selected electricconductivity, since the most appropriate concentration toobserve cell motion under the microscope is 2×10⁶ cells/ml.After placing the diluted cell suspension in the module, the cellswere left for 5 min to swell and reseal before being examined bydielectrophoresis. To investigate dielectrophoresis, the cellswere exposed to a non-uniform electric field and observed under
Fig. 4. Cells exposed to eight rectangular pulses amplitude: 230 V, duration: 100electroporation in the presence of propidium iodide is large and the fraction of dead
the transmitted-light microscope (Zeiss 200, Axiovert, Jena,Germany). The frequency of the electric field was varied and theimages were recorded with a camera (Visicam, Visitron Systems,Germany). Each experiment was repeated at least three times.
2.4. Numerical calculations
According to Eq. (1), it is obvious that the frequencydepended Re[ fCM] has the most significant impact on cellmotion caused by dielectrophoresis. If Re[ fCM] of a cell isnegative, the cell is subjected to negative dielectrophoresis andmoves away from the high-field region. However, if Re[ fCM] ofa cell is positive, the cell is subjected to positive dielectrophor-esis and moves toward the high-field region. Re[ fCM] wascalculated from Eq. (2) using electrical properties of the cells andthe suspending medium from Table 1. The spectra of Re[ fCM]was determined for non-electroporated and electroporated cellsin medium M1.
Another crucial parameter in Eq. (1) is the gradient of thesquare of the electric field. Electric field distribution is obtainedby suitable design of the microelectrode structures. Severalstructures are suitable for development of large non-homo-geneities of electric field [25]. In this work we used castellatedmicroelectrode structures. Areas of high-and low-field intensity
μs and repetition frequency 1 Hz. Fraction of permeable cells (a) after thecells (b) 30 min after the electroporation is small.
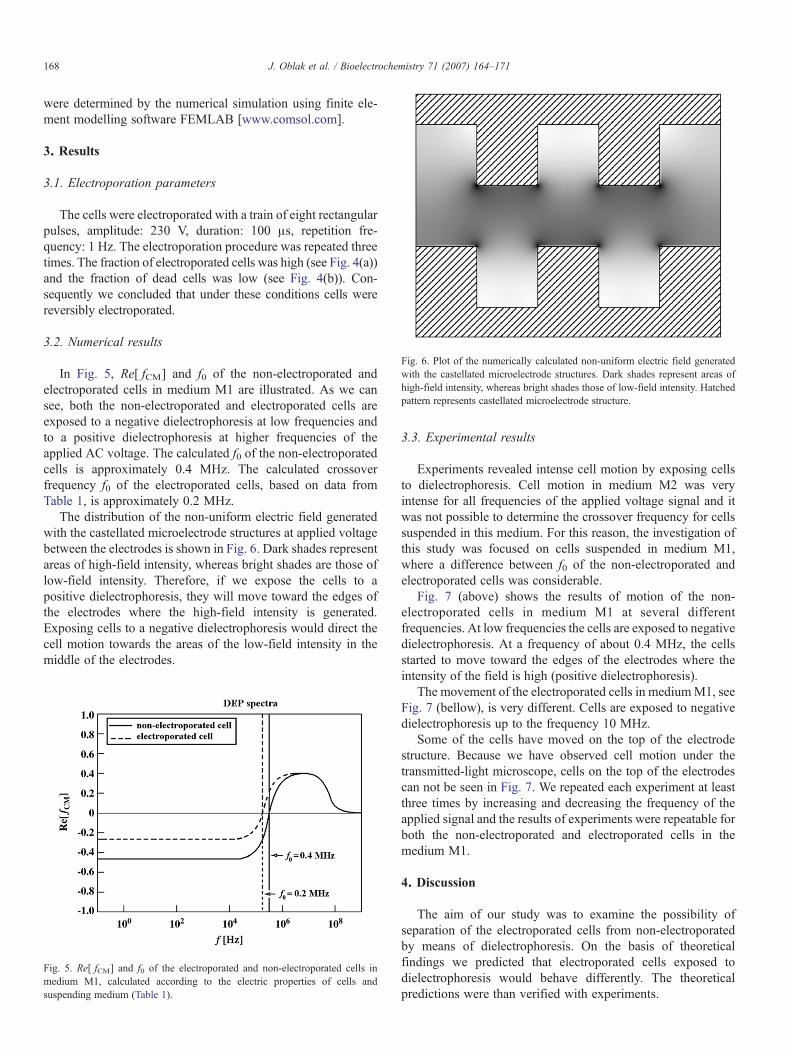
Fig. 6. Plot of the numerically calculated non-uniform electric field generatedwith the castellated microelectrode structures. Dark shades represent areas ofhigh-field intensity, whereas bright shades those of low-field intensity. Hatchedpattern represents castellated microelectrode structure.
168 J. Oblak et al. / Bioelectrochemistry 71 (2007) 164–171
were determined by the numerical simulation using finite ele-ment modelling software FEMLAB [www.comsol.com].
3. Results
3.1. Electroporation parameters
The cells were electroporated with a train of eight rectangularpulses, amplitude: 230 V, duration: 100 μs, repetition fre-quency: 1 Hz. The electroporation procedure was repeated threetimes. The fraction of electroporated cells was high (see Fig. 4(a))and the fraction of dead cells was low (see Fig. 4(b)). Con-sequently we concluded that under these conditions cells werereversibly electroporated.
3.2. Numerical results
In Fig. 5, Re[ fCM] and f0 of the non-electroporated andelectroporated cells in medium M1 are illustrated. As we cansee, both the non-electroporated and electroporated cells areexposed to a negative dielectrophoresis at low frequencies andto a positive dielectrophoresis at higher frequencies of theapplied AC voltage. The calculated f0 of the non-electroporatedcells is approximately 0.4 MHz. The calculated crossoverfrequency f0 of the electroporated cells, based on data fromTable 1, is approximately 0.2 MHz.
The distribution of the non-uniform electric field generatedwith the castellated microelectrode structures at applied voltagebetween the electrodes is shown in Fig. 6. Dark shades representareas of high-field intensity, whereas bright shades are those oflow-field intensity. Therefore, if we expose the cells to apositive dielectrophoresis, they will move toward the edges ofthe electrodes where the high-field intensity is generated.Exposing cells to a negative dielectrophoresis would direct thecell motion towards the areas of the low-field intensity in themiddle of the electrodes.
Fig. 5. Re[ fCM] and f0 of the electroporated and non-electroporated cells inmedium M1, calculated according to the electric properties of cells andsuspending medium (Table 1).
3.3. Experimental results
Experiments revealed intense cell motion by exposing cellsto dielectrophoresis. Cell motion in medium M2 was veryintense for all frequencies of the applied voltage signal and itwas not possible to determine the crossover frequency for cellssuspended in this medium. For this reason, the investigation ofthis study was focused on cells suspended in medium M1,where a difference between f0 of the non-electroporated andelectroporated cells was considerable.
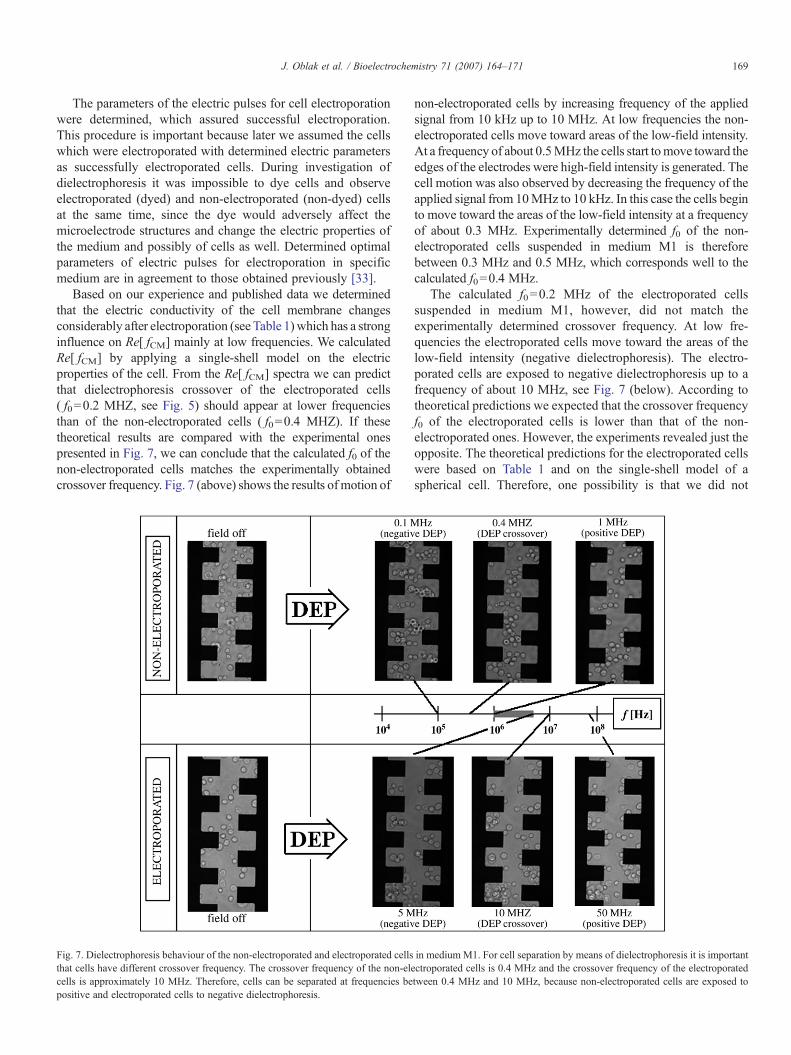
Fig. 7 (above) shows the results of motion of the non-electroporated cells in medium M1 at several differentfrequencies. At low frequencies the cells are exposed to negativedielectrophoresis. At a frequency of about 0.4 MHz, the cellsstarted to move toward the edges of the electrodes where theintensity of the field is high (positive dielectrophoresis).
The movement of the electroporated cells in mediumM1, seeFig. 7 (bellow), is very different. Cells are exposed to negativedielectrophoresis up to the frequency 10 MHz.
Some of the cells have moved on the top of the electrodestructure. Because we have observed cell motion under thetransmitted-light microscope, cells on the top of the electrodescan not be seen in Fig. 7. We repeated each experiment at leastthree times by increasing and decreasing the frequency of theapplied signal and the results of experiments were repeatable forboth the non-electroporated and electroporated cells in themedium M1.
4. Discussion
The aim of our study was to examine the possibility ofseparation of the electroporated cells from non-electroporatedby means of dielectrophoresis. On the basis of theoreticalfindings we predicted that electroporated cells exposed todielectrophoresis would behave differently. The theoreticalpredictions were than verified with experiments.
169J. Oblak et al. / Bioelectrochemistry 71 (2007) 164–171
The parameters of the electric pulses for cell electroporationwere determined, which assured successful electroporation.This procedure is important because later we assumed the cellswhich were electroporated with determined electric parametersas successfully electroporated cells. During investigation ofdielectrophoresis it was impossible to dye cells and observeelectroporated (dyed) and non-electroporated (non-dyed) cellsat the same time, since the dye would adversely affect themicroelectrode structures and change the electric properties ofthe medium and possibly of cells as well. Determined optimalparameters of electric pulses for electroporation in specificmedium are in agreement to those obtained previously [33].
Based on our experience and published data we determinedthat the electric conductivity of the cell membrane changesconsiderably after electroporation (see Table 1) which has a stronginfluence on Re[ fCM] mainly at low frequencies. We calculatedRe[ fCM] by applying a single-shell model on the electricproperties of the cell. From the Re[ fCM] spectra we can predictthat dielectrophoresis crossover of the electroporated cells( f0=0.2 MHZ, see Fig. 5) should appear at lower frequenciesthan of the non-electroporated cells ( f0=0.4 MHZ). If thesetheoretical results are compared with the experimental onespresented in Fig. 7, we can conclude that the calculated f0 of thenon-electroporated cells matches the experimentally obtainedcrossover frequency. Fig. 7 (above) shows the results of motion of
Fig. 7. Dielectrophoresis behaviour of the non-electroporated and electroporated cellsthat cells have different crossover frequency. The crossover frequency of the non-elecells is approximately 10 MHz. Therefore, cells can be separated at frequencies bepositive and electroporated cells to negative dielectrophoresis.
non-electroporated cells by increasing frequency of the appliedsignal from 10 kHz up to 10 MHz. At low frequencies the non-electroporated cells move toward areas of the low-field intensity.At a frequency of about 0.5MHz the cells start tomove toward theedges of the electrodes were high-field intensity is generated. Thecell motion was also observed by decreasing the frequency of theapplied signal from 10MHz to 10 kHz. In this case the cells beginto move toward the areas of the low-field intensity at a frequencyof about 0.3 MHz. Experimentally determined f0 of the non-electroporated cells suspended in medium M1 is thereforebetween 0.3 MHz and 0.5 MHz, which corresponds well to thecalculated f0=0.4 MHz.
The calculated f0=0.2 MHz of the electroporated cellssuspended in medium M1, however, did not match theexperimentally determined crossover frequency. At low fre-quencies the electroporated cells move toward the areas of thelow-field intensity (negative dielectrophoresis). The electro-porated cells are exposed to negative dielectrophoresis up to afrequency of about 10 MHz, see Fig. 7 (below). According totheoretical predictions we expected that the crossover frequencyf0 of the electroporated cells is lower than that of the non-electroporated ones. However, the experiments revealed just theopposite. The theoretical predictions for the electroporated cellswere based on Table 1 and on the single-shell model of aspherical cell. Therefore, one possibility is that we did not
in medium M1. For cell separation by means of dielectrophoresis it is importantctroporated cells is 0.4 MHz and the crossover frequency of the electroporatedtween 0.4 MHz and 10 MHz, because non-electroporated cells are exposed to
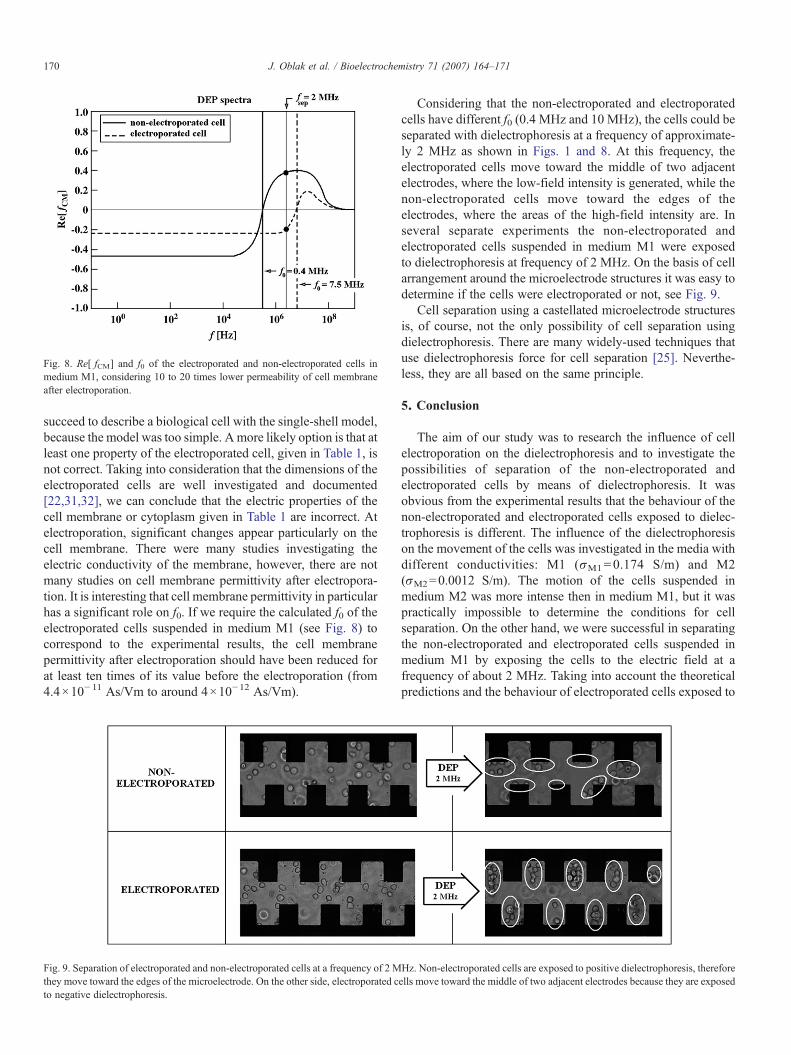
Fig. 8. Re[ fCM] and f0 of the electroporated and non-electroporated cells inmedium M1, considering 10 to 20 times lower permeability of cell membraneafter electroporation.
170 J. Oblak et al. / Bioelectrochemistry 71 (2007) 164–171
succeed to describe a biological cell with the single-shell model,because the model was too simple. Amore likely option is that atleast one property of the electroporated cell, given in Table 1, isnot correct. Taking into consideration that the dimensions of theelectroporated cells are well investigated and documented[22,31,32], we can conclude that the electric properties of thecell membrane or cytoplasm given in Table 1 are incorrect. Atelectroporation, significant changes appear particularly on thecell membrane. There were many studies investigating theelectric conductivity of the membrane, however, there are notmany studies on cell membrane permittivity after electropora-tion. It is interesting that cell membrane permittivity in particularhas a significant role on f0. If we require the calculated f0 of theelectroporated cells suspended in medium M1 (see Fig. 8) tocorrespond to the experimental results, the cell membranepermittivity after electroporation should have been reduced forat least ten times of its value before the electroporation (from4.4×10− 11 As/Vm to around 4×10⁻¹² As/Vm).
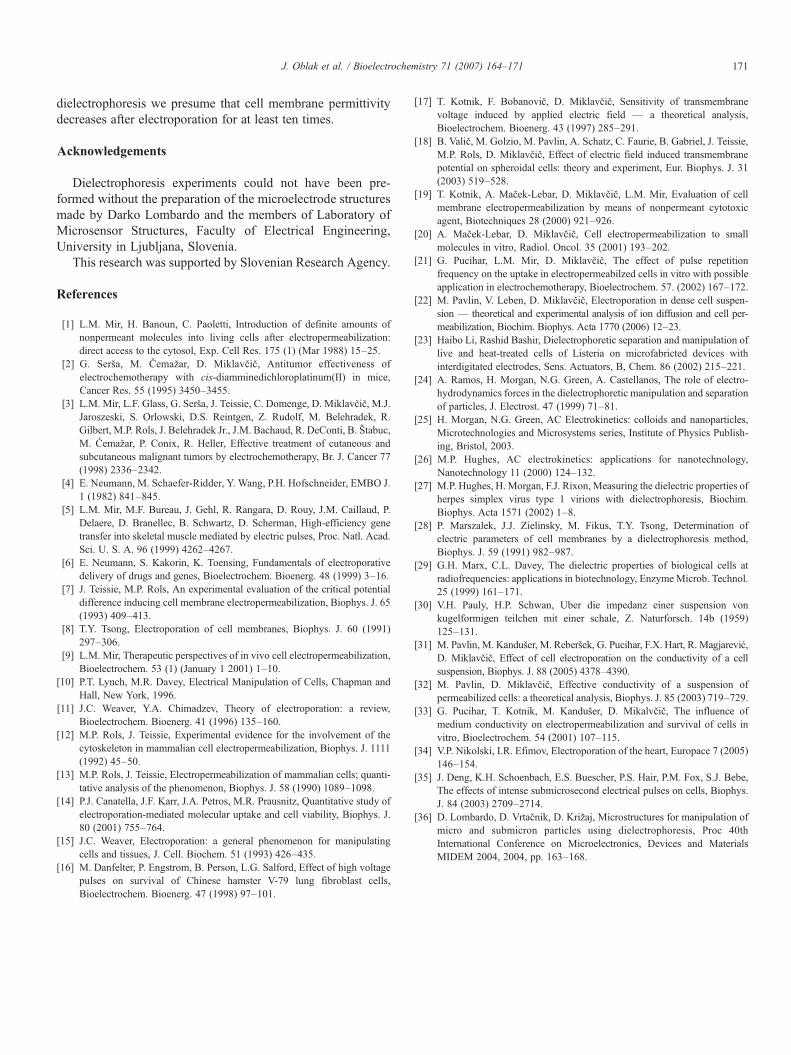
Fig. 9. Separation of electroporated and non-electroporated cells at a frequency of 2 Mthey move toward the edges of the microelectrode. On the other side, electroporated cto negative dielectrophoresis.
Considering that the non-electroporated and electroporatedcells have different f0 (0.4 MHz and 10 MHz), the cells could beseparated with dielectrophoresis at a frequency of approximate-ly 2 MHz as shown in Figs. 1 and 8. At this frequency, theelectroporated cells move toward the middle of two adjacentelectrodes, where the low-field intensity is generated, while thenon-electroporated cells move toward the edges of theelectrodes, where the areas of the high-field intensity are. Inseveral separate experiments the non-electroporated andelectroporated cells suspended in medium M1 were exposedto dielectrophoresis at frequency of 2 MHz. On the basis of cellarrangement around the microelectrode structures it was easy todetermine if the cells were electroporated or not, see Fig. 9.
Cell separation using a castellated microelectrode structuresis, of course, not the only possibility of cell separation usingdielectrophoresis. There are many widely-used techniques thatuse dielectrophoresis force for cell separation [25]. Neverthe-less, they are all based on the same principle.
5. Conclusion
The aim of our study was to research the influence of cellelectroporation on the dielectrophoresis and to investigate thepossibilities of separation of the non-electroporated andelectroporated cells by means of dielectrophoresis. It wasobvious from the experimental results that the behaviour of thenon-electroporated and electroporated cells exposed to dielec-trophoresis is different. The influence of the dielectrophoresison the movement of the cells was investigated in the media withdifferent conductivities: M1 (σM1=0.174 S/m) and M2(σM2=0.0012 S/m). The motion of the cells suspended inmedium M2 was more intense then in medium M1, but it waspractically impossible to determine the conditions for cellseparation. On the other hand, we were successful in separatingthe non-electroporated and electroporated cells suspended inmedium M1 by exposing the cells to the electric field at afrequency of about 2 MHz. Taking into account the theoreticalpredictions and the behaviour of electroporated cells exposed to
Hz. Non-electroporated cells are exposed to positive dielectrophoresis, thereforeells move toward the middle of two adjacent electrodes because they are exposed
171J. Oblak et al. / Bioelectrochemistry 71 (2007) 164–171
dielectrophoresis we presume that cell membrane permittivitydecreases after electroporation for at least ten times.
Acknowledgements
Dielectrophoresis experiments could not have been pre-formed without the preparation of the microelectrode structuresmade by Darko Lombardo and the members of Laboratory ofMicrosensor Structures, Faculty of Electrical Engineering,University in Ljubljana, Slovenia.
This research was supported by Slovenian Research Agency.
References
[1] L.M. Mir, H. Banoun, C. Paoletti, Introduction of definite amounts ofnonpermeant molecules into living cells after electropermeabilization:direct access to the cytosol, Exp. Cell Res. 175 (1) (Mar 1988) 15–25.
[2] G. Serša, M. Čemažar, D. Miklavčič, Antitumor effectiveness ofelectrochemotherapy with cis-diamminedichloroplatinum(II) in mice,Cancer Res. 55 (1995) 3450–3455.
[3] L.M. Mir, L.F. Glass, G. Serša, J. Teissie, C. Domenge, D. Miklavčič, M.J.Jaroszeski, S. Orlowski, D.S. Reintgen, Z. Rudolf, M. Belehradek, R.Gilbert, M.P. Rols, J. Belehradek Jr., J.M. Bachaud, R. DeConti, B. Štabuc,M. Ćemažar, P. Conix, R. Heller, Effective treatment of cutaneous andsubcutaneous malignant tumors by electrochemotherapy, Br. J. Cancer 77(1998) 2336–2342.
[4] E. Neumann, M. Schaefer-Ridder, Y. Wang, P.H. Hofschneider, EMBO J.1 (1982) 841–845.
[5] L.M. Mir, M.F. Bureau, J. Gehl, R. Rangara, D. Rouy, J.M. Caillaud, P.Delaere, D. Branellec, B. Schwartz, D. Scherman, High-efficiency genetransfer into skeletal muscle mediated by electric pulses, Proc. Natl. Acad.Sci. U. S. A. 96 (1999) 4262–4267.
[6] E. Neumann, S. Kakorin, K. Toensing, Fundamentals of electroporativedelivery of drugs and genes, Bioelectrochem. Bioenerg. 48 (1999) 3–16.
[7] J. Teissie, M.P. Rols, An experimental evaluation of the critical potentialdifference inducing cell membrane electropermeabilization, Biophys. J. 65(1993) 409–413.
[8] T.Y. Tsong, Electroporation of cell membranes, Biophys. J. 60 (1991)297–306.
[9] L.M. Mir, Therapeutic perspectives of in vivo cell electropermeabilization,Bioelectrochem. 53 (1) (January 1 2001) 1–10.
[10] P.T. Lynch, M.R. Davey, Electrical Manipulation of Cells, Chapman andHall, New York, 1996.
[11] J.C. Weaver, Y.A. Chimadzev, Theory of electroporation: a review,Bioelectrochem. Bioenerg. 41 (1996) 135–160.
[12] M.P. Rols, J. Teissie, Experimental evidence for the involvement of thecytoskeleton in mammalian cell electropermeabilization, Biophys. J. 1111(1992) 45–50.
[13] M.P. Rols, J. Teissie, Electropermeabilization of mammalian cells; quanti-tative analysis of the phenomenon, Biophys. J. 58 (1990) 1089–1098.
[14] P.J. Canatella, J.F. Karr, J.A. Petros, M.R. Prausnitz, Quantitative study ofelectroporation-mediated molecular uptake and cell viability, Biophys. J.80 (2001) 755–764.
[15] J.C. Weaver, Electroporation: a general phenomenon for manipulatingcells and tissues, J. Cell. Biochem. 51 (1993) 426–435.
[16] M. Danfelter, P. Engstrom, B. Person, L.G. Salford, Effect of high voltagepulses on survival of Chinese hamster V-79 lung fibroblast cells,Bioelectrochem. Bioenerg. 47 (1998) 97–101.
[17] T. Kotnik, F. Bobanovič, D. Miklavčič, Sensitivity of transmembranevoltage induced by applied electric field — a theoretical analysis,Bioelectrochem. Bioenerg. 43 (1997) 285–291.
[18] B. Valič, M. Golzio, M. Pavlin, A. Schatz, C. Faurie, B. Gabriel, J. Teissie,M.P. Rols, D. Miklavčič, Effect of electric field induced transmembranepotential on spheroidal cells: theory and experiment, Eur. Biophys. J. 31(2003) 519–528.
[19] T. Kotnik, A. Maček-Lebar, D. Miklavčič, L.M. Mir, Evaluation of cellmembrane electropermeabilization by means of nonpermeant cytotoxicagent, Biotechniques 28 (2000) 921–926.
[20] A. Maček-Lebar, D. Miklavčič, Cell electropermeabilization to smallmolecules in vitro, Radiol. Oncol. 35 (2001) 193–202.
[21] G. Pucihar, L.M. Mir, D. Miklavčič, The effect of pulse repetitionfrequency on the uptake in electropermeabilzed cells in vitro with possibleapplication in electrochemotherapy, Bioelectrochem. 57. (2002) 167–172.
[22] M. Pavlin, V. Leben, D. Miklavčič, Electroporation in dense cell suspen-sion — theoretical and experimental analysis of ion diffusion and cell per-meabilization, Biochim. Biophys. Acta 1770 (2006) 12–23.
[23] Haibo Li, Rashid Bashir, Dielectrophoretic separation and manipulation oflive and heat-treated cells of Listeria on microfabricted devices withinterdigitated electrodes, Sens. Actuators, B, Chem. 86 (2002) 215–221.
[24] A. Ramos, H. Morgan, N.G. Green, A. Castellanos, The role of electro-hydrodynamics forces in the dielectrophoretic manipulation and separationof particles, J. Electrost. 47 (1999) 71–81.
[25] H. Morgan, N.G. Green, AC Electrokinetics: colloids and nanoparticles,Microtechnologies and Microsystems series, Institute of Physics Publish-ing, Bristol, 2003.
[26] M.P. Hughes, AC electrokinetics: applications for nanotechnology,Nanotechnology 11 (2000) 124–132.
[27] M.P. Hughes, H. Morgan, F.J. Rixon, Measuring the dielectric properties ofherpes simplex virus type 1 virions with dielectrophoresis, Biochim.Biophys. Acta 1571 (2002) 1–8.
[28] P. Marszalek, J.J. Zielinsky, M. Fikus, T.Y. Tsong, Determination ofelectric parameters of cell membranes by a dielectrophoresis method,Biophys. J. 59 (1991) 982–987.
[29] G.H. Marx, C.L. Davey, The dielectric properties of biological cells atradiofrequencies: applications in biotechnology, EnzymeMicrob. Technol.25 (1999) 161–171.
[30] V.H. Pauly, H.P. Schwan, Uber die impedanz einer suspension vonkugelformigen teilchen mit einer schale, Z. Naturforsch. 14b (1959)125–131.
[31] M. Pavlin, M. Kandušer, M. Reberšek, G. Pucihar, F.X. Hart, R. Magjarević,D. Miklavčič, Effect of cell electroporation on the conductivity of a cellsuspension, Biophys. J. 88 (2005) 4378–4390.
[32] M. Pavlin, D. Miklavčič, Effective conductivity of a suspension ofpermeabilized cells: a theoretical analysis, Biophys. J. 85 (2003) 719–729.
[33] G. Pucihar, T. Kotnik, M. Kandušer, D. Mikalvčič, The influence ofmedium conductivity on electropermeabilization and survival of cells invitro, Bioelectrochem. 54 (2001) 107–115.
[34] V.P. Nikolski, I.R. Efimov, Electroporation of the heart, Europace 7 (2005)146–154.
[35] J. Deng, K.H. Schoenbach, E.S. Buescher, P.S. Hair, P.M. Fox, S.J. Bebe,The effects of intense submicrosecond electrical pulses on cells, Biophys.J. 84 (2003) 2709–2714.
[36] D. Lombardo, D. Vrtačnik, D. Križaj, Microstructures for manipulation ofmicro and submicron particles using dielectrophoresis, Proc 40thInternational Conference on Microelectronics, Devices and MaterialsMIDEM 2004, 2004, pp. 163–168.
Copyright © 2022 FDOKUMEN