
Feasibility of creating a high-resolution 3D diffusion tensor imaging based atlas of the human...
20
Feasibility of creating a high-resolution 3D diffusion tensor imaging based atlas of the human brainstem: A case study at 11.7T Manisha Aggarwal a , Jiangyang Zhang a , Olga Pletnikova b , Barbara Crain b , Juan Troncoso b , and Susumu Mori a,c,* a Russell H. Morgan Department of Radiology and Radiological Science, Johns Hopkins University School of Medicine, Baltimore, Maryland, USA b Division of Neuropathology, Department of Pathology, Johns Hopkins University School of Medicine, Baltimore, Maryland, USA c F.M. Kirby Research Center for Functional Brain Imaging, Kennedy Krieger Institute, Baltimore, Maryland, USA Abstract A three-dimensional stereotaxic atlas of the human brainstem based on high resolution ex vivo diffusion tensor imaging (DTI) is introduced. The atlas consists of high resolution (125–255 μm isotropic) three-dimensional DT images of the formalin-fixed brainstem acquired at 11.7T. The DTI data revealed microscopic neuroanatomical details, allowing three-dimensional visualization and reconstruction of fiber pathways including the decussation of the pyramidal tract fibers, and interdigitating fascicles of the corticospinal and transverse pontine fibers. Additionally, strong grey-white matter contrasts in the apparent diffusion coefficient (ADC) maps enabled precise delineation of grey matter nuclei in the brainstem, including the cranial nerve and the inferior olivary nuclei. Comparison with myelin-stained histology shows that at the level of resolution achieved in this study, the structural details resolved with DTI contrasts in the brainstem were comparable to anatomical delineation obtained with histological sectioning. Major neural structures delineated from DTI contrasts in the brainstem are segmented and three-dimensionally reconstructed. Further, the ex vivo DTI data are nonlinearly mapped to a widely-used in vivo human brain atlas, to construct a high-resolution atlas of the brainstem in the Montreal Neurological Institute (MNI) stereotaxic coordinate space. The results demonstrate the feasibility of developing a 3D DTI based atlas for detailed characterization of brainstem neuroanatomy with high resolution and contrasts, which will be a useful resource for research and clinical applications. Keywords human brainstem; atlas; stereotaxic; diffusion tensor imaging © 2012 Elsevier Inc. All rights reserved. * Corresponding author: Susumu Mori, Ph.D., Russell H. Morgan Department of Radiology and Radiological Science, Johns Hopkins University School of Medicine, 330B Traylor Building, 720 Rutland Avenue, Baltimore, MD, 21205, USA, Phone: (+1) 410-614-2702, [email protected]. Publisher's Disclaimer: This is a PDF file of an unedited manuscript that has been accepted for publication. As a service to our customers we are providing this early version of the manuscript. The manuscript will undergo copyediting, typesetting, and review of the resulting proof before it is published in its final citable form. Please note that during the production process errors may be discovered which could affect the content, and all legal disclaimers that apply to the journal pertain. NIH Public Access Author Manuscript Neuroimage. Author manuscript; available in PMC 2014 July 01. Published in final edited form as: Neuroimage. 2013 July 1; 74: 117–127. doi:10.1016/j.neuroimage.2013.01.061. NIH-PA Author Manuscript NIH-PA Author Manuscript NIH-PA Author Manuscript
Transcript of Feasibility of creating a high-resolution 3D diffusion tensor imaging based atlas of the human...
Feasibility of creating a high-resolution 3D diffusion tensorimaging based atlas of the human brainstem: A case study at11.7T
Manisha Aggarwala, Jiangyang Zhanga, Olga Pletnikovab, Barbara Crainb, Juan Troncosob,and Susumu Moria,c,*
aRussell H. Morgan Department of Radiology and Radiological Science, Johns HopkinsUniversity School of Medicine, Baltimore, Maryland, USAbDivision of Neuropathology, Department of Pathology, Johns Hopkins University School ofMedicine, Baltimore, Maryland, USAcF.M. Kirby Research Center for Functional Brain Imaging, Kennedy Krieger Institute, Baltimore,Maryland, USA
AbstractA three-dimensional stereotaxic atlas of the human brainstem based on high resolution ex vivodiffusion tensor imaging (DTI) is introduced. The atlas consists of high resolution (125–255 μmisotropic) three-dimensional DT images of the formalin-fixed brainstem acquired at 11.7T. TheDTI data revealed microscopic neuroanatomical details, allowing three-dimensional visualizationand reconstruction of fiber pathways including the decussation of the pyramidal tract fibers, andinterdigitating fascicles of the corticospinal and transverse pontine fibers. Additionally, stronggrey-white matter contrasts in the apparent diffusion coefficient (ADC) maps enabled precisedelineation of grey matter nuclei in the brainstem, including the cranial nerve and the inferiorolivary nuclei. Comparison with myelin-stained histology shows that at the level of resolutionachieved in this study, the structural details resolved with DTI contrasts in the brainstem werecomparable to anatomical delineation obtained with histological sectioning. Major neuralstructures delineated from DTI contrasts in the brainstem are segmented and three-dimensionallyreconstructed. Further, the ex vivo DTI data are nonlinearly mapped to a widely-used in vivohuman brain atlas, to construct a high-resolution atlas of the brainstem in the MontrealNeurological Institute (MNI) stereotaxic coordinate space. The results demonstrate the feasibilityof developing a 3D DTI based atlas for detailed characterization of brainstem neuroanatomy withhigh resolution and contrasts, which will be a useful resource for research and clinicalapplications.
Keywordshuman brainstem; atlas; stereotaxic; diffusion tensor imaging
© 2012 Elsevier Inc. All rights reserved.*Corresponding author: Susumu Mori, Ph.D., Russell H. Morgan Department of Radiology and Radiological Science, Johns HopkinsUniversity School of Medicine, 330B Traylor Building, 720 Rutland Avenue, Baltimore, MD, 21205, USA, Phone: (+1)410-614-2702, [email protected].
Publisher's Disclaimer: This is a PDF file of an unedited manuscript that has been accepted for publication. As a service to ourcustomers we are providing this early version of the manuscript. The manuscript will undergo copyediting, typesetting, and review ofthe resulting proof before it is published in its final citable form. Please note that during the production process errors may bediscovered which could affect the content, and all legal disclaimers that apply to the journal pertain.
NIH Public AccessAuthor ManuscriptNeuroimage. Author manuscript; available in PMC 2014 July 01.
Published in final edited form as:Neuroimage. 2013 July 1; 74: 117–127. doi:10.1016/j.neuroimage.2013.01.061.
NIH
-PA Author Manuscript
NIH
-PA Author Manuscript
NIH
-PA Author Manuscript
INTRODUCTIONThe brainstem is the primary relay center for efferent and afferent connections between thecerebral cortex and the cerebellum and spinal cord (Carpenter, 1976). Prominent anatomicstructures in the brainstem comprise densely-packed cranial nerve nuclei interspersed withascending and descending white matter tracts, many of which, e.g. the corticospinal tract andthe superior cerebellar peduncles, undergo decussations in this region. Fiber pathways in thebrainstem are critically important for vital sensory and motor functions, and are implicatedin the pathogenesis of a wide spectrum of neurologic disorders, including multiple sclerosis,Parkinson’s disease, and amyotrophic lateral sclerosis. The anatomy of the brainstem hasbeen largely studied using two-dimensional histological sectioning and staining techniques(Afshar et al., 1978; Paxinos and Huang, 1995; Nolte, 2008). However, even in detailedatlases of myelin-stained sections, the orientations and exact three-dimensional anatomicallocations of individual brainstem tracts, and their spatial positions relative to various nucleiand adjacent pathways, are sometimes difficult to comprehend. Because of the importantneural structures concentrated in this relatively small region, lesions within the brainstemcan lead to multiple neurologic deficits (Donaldson et al., 2006). Hence, three-dimensionalimaging and detailed delineation of brainstem neuroanatomy are important to provide acomplete understanding of its complex structure, and will also aid our ability to evaluate theimpact of brainstem lesions and associated deficits.
Despite its highly organized structure, the brainstem appears relatively homogeneous inconventional relaxometry-based magnetic resonance images, e.g. T1- and T2-weightedimages, which provide limited contrasts to visualize its neuroanatomy. In comparison,studies using diffusion tensor imaging (DTI) have shown the potential of this technique toidentify key brainstem structures and tracts. DTI provides orientation-based tissue contrastsfor better structural delineation, and has been routinely used for anatomical imaging of thebrainstem (Virta et al., 1999; Stieltjes et al., 2001; Nagae-Poetscher et al., 2004; Salamon etal., 2005), and evaluation of brainstem pathology in clinical studies (Parvizi and Damasio,2003; Chen et al., 2007; Lui et al., 2007; Helton et al., 2008). Typical in vivo resolutions forbrainstem imaging in these studies range from 1.7–2.0 mm for two-dimensional DTI, withslice thickness ranging from 2.0–5.0 mm. Although the achievable resolution range with invivo DTI enables the reconstruction of major brainstem tracts, it is too coarse to be used fordelineation of microstructural details, and is far from comparable to histological stainingmethods. Axonal tracing techniques, such as silver impregnation, are therefore still used asthe ‘gold standard’ to study pathways of the brainstem in postmortem specimens. Polarizedlight imaging, a relatively new technique, has been recently shown to reveal fiberorientations in sections of the postmortem brainstem with relatively high in-plane resolution(Axer et al., 2011). However, these techniques are currently limited to sectioning of thetissue specimen into multiple slabs of ~100–120 μm thickness.
Compared to in vivo imaging, ex vivo DTI of postmortem tissue specimens can allow dataacquisition at significantly higher resolutions, which can reveal fiber architecture and detailsthat are not resolvable in vivo. As indicated by previous studies of ex vivo tissue specimens(McNab et al., 2009; Augustinack et al., 2010; Miller et al., 2011), postmortem DTIcontrasts can enable detailed anatomical characterization of brain structures. Previousstudies have reported two-dimensional postmortem DTI of the brainstem, with through-plane resolutions of ~0.6 mm (Soria et al., 2011; Prats-Galino et al., 2012). Recently, anatlas of the postmortem brainstem based on DTI has also been introduced (Naidich et al.,2009). However, postmortem DTI studies of brainstem anatomy have been limited to two-dimensional imaging. The application of DTI for three-dimensional high resolution imagingof the brainstem is hindered by the long acquisition times required and the concomitantdecrease in the signal-to-noise ratio with increasing resolutions. Additionally, the alteration
Aggarwal et al. Page 2
Neuroimage. Author manuscript; available in PMC 2014 July 01.
NIH
-PA Author Manuscript
NIH
-PA Author Manuscript
NIH
-PA Author Manuscript
of tissue properties with postmortem fixation is known to reduce the diffusion coefficient(Schmierer et al., 2008), which mandates the use of significantly high b-values to obtainsensitivity to diffusion for tissue contrasts. As such, there is currently no three-dimensionalatlas of the brainstem with detailed anatomical delineation. A three-dimensional atlas of thebrainstem is important for several applications. For instance, previous studies have used 3Dinterpolation of stacked two-dimensional histological sections in order to stereotaxicallyregister patient MR images (Afshar and Dykes, 1982; Niemann et al., 1999). A detailed 3DMRI/DTI based atlas will enable direct stereotaxic registration of patient MR data, and willadditionally lead to a better understanding of in vivo DTI contrasts in the brainstem.
Therefore, in the present study, we aimed to develop a three-dimensional human brainstematlas based on high resolution ex vivo DTI. The use of fast acquisition techniques combinedwith high field strength on a preclinical scanner (11.7T) enabled three-dimensional DTI athigh spatial resolution (125–255 μm isotropic) with strong tissue contrasts. The resultsrevealed very fine neuroanatomical details in the brainstem, allowing delineation of tractfeatures such as the decussation of the pyramidal fibers three-dimensionally. Comparisonwith histology shows that the level of structural details revealed by the high resolution DTIcontrasts was comparable to anatomical delineation obtained with myelin-staining in thebrainstem. Various neural structures are three-dimensionally reconstructed and the dataregistered to a widely-used in vivo MRI based brain atlas in the MNI stereotaxic coordinatespace. The atlas developed in our study provides high-resolution visualization of brainstemneuroanatomy and reconstructed structures, and will be a useful resource for research andclinical applications.
MATERIAL AND METHODSSpecimen preparation
The brainstem specimen used in this study was obtained at autopsy from an adult womanwith no history of neurological disease. The brainstem and adjacent cervical spinal cordwere removed and immersion fixed in 10% neutral buffered formalin for one week. Thespecimen was then transferred to phosphate-buffered saline (PBS) with 2 mM gadopentetatedimeglumine (Magnevist, Berlex Imaging, Wayne, NJ, USA) for 48 h. For imaging, thespecimen was placed in a polyethylene container that was filled with Fomblin (FomblinPerfluoropolyether, Solvay Solexis, Thorofare, NJ, USA), to prevent dehydration and reducesusceptibility artifacts at tissue margins. Following imaging of the whole brainstem, themedulla oblongata and the cervical spinal cord at the level of the spinomedullary junctionwere extracted separately in order to fit smaller diameter coils for higher resolution imaging.During imaging, the temperature of the specimens was maintained constant at 37°C via thespectrometer’s temperature control system.
DTI acquisitionImaging of the whole brainstem was performed on a horizontal bore 11.7-Tesla NMRspectrometer (Bruker Biospin, Billerica, MA, USA) with a triple-axis gradient system(maximum gradient strength of 740 mT/m), using an 8-channel volume coil. DTI data wereacquired using a 12-segment diffusion-weighted echo planar imaging sequence, with echotime (TE)/repetition time (TR) = 27/500 ms, 1 signal average, partial Fourier acquisitionfactor of 1.4, 2 non-diffusion weighted (b0) images and 30 diffusion directions (Jones, 2004)(b-value=4000 s/mm2). The field of view (FOV) and matrix size were 4.3 × 4.3 × 6.5 cm3
and 168 × 168 × 256, respectively, for a native spatial resolution of 255 × 255 × 255 μm3
and total imaging time of 13.5 h. A T2-weighted image was acquired at the same resolutionand FOV as the DTI data, using a 3D RARE sequence with TE/TR=31/2000 ms, 4 signalaverages, rare-factor of 8, and imaging time 8.5 h.
Aggarwal et al. Page 3
Neuroimage. Author manuscript; available in PMC 2014 July 01.
NIH
-PA Author Manuscript
NIH
-PA Author Manuscript
NIH
-PA Author Manuscript
DTI of the medulla and the spinomedullary junction was performed on a vertical bore 11.7-Tesla spectrometer (Bruker Biospin, Billerica, MA, USA), equipped with a Micro2.5gradient system (maximum gradient strength of 1000 mT/m), using birdcage transmit/receive coils of 30- and 20-mm diameters, respectively. For the medulla, a diffusion-weighted multiple spin echo sequence was used with TE/TR=34, 45, 56/400 ms, 2 signalaverages, 2 b0 images and 6 diffusion directions (b-value=2800 s/mm2), FOV 3.0 × 2.6 ×2.45 cm3, matrix size 176 × 152 × 144, resolution 170 × 170 × 170 μm3, and imaging timeof 35 h. For the spinomedullary junction, a diffusion-weighted gradient and spin echo(GRASE) sequence with navigator phase correction was used (Aggarwal et al., 2010), withTE/TR=32/800 ms, 4 signal averages, 12 echoes per refocusing pulse, 2 b0 images and 16diffusion directions (b-value=2100 s/mm2), FOV 1.6 × 1.25 × 1.72 cm3, matrix size 128 ×100 × 138, resolution 125 × 125 × 125 μm3, and scan time of 18.5 h. The spectral data wereapodized by a trapezoidal function with symmetric 10% ramp widths, and zero-filled totwice the matrix size prior to Fourier transformation.
Data processing and tract reconstructionDiffusion tensor fitting was done using the log-linear fitting function in DtiStudio (Jiang etal., 2006). The eigenvalues and associated eigenvectors (Basser et al., 1994) of the voxel-wise diffusion tensors were computed, from which maps of the apparent diffusioncoefficient (ADC) and fractional anisotropy (FA) indices were derived. Isotropic diffusion-weighted (iDW) images were generated by averaging diffusion-weighted images alongisotropically-distributed diffusion directions. The FA and primary eigenvector maps werecombined to generate direction-encoded colormap (DEC) images, with the ratio between thered, green and blue components equal to the ratio of absolute values of x, y and zcomponents of the primary eigenvector, and the intensity proportional to FA. Red, green andblue were assigned to anisotropy orientation along the medial-lateral, anterior-posterior, andsuperior-inferior axes, respectively (Pajevic and Pierpaoli, 1999).
For tractography, the fiber assignment by continuous tracking (FACT) algorithm (Mori etal., 1999) was used, with an FA threshold of 0.3 and inner product threshold of 0.8 (anglesgreater than 37° excluded from tracking). A brute force approach was used to track fibersoriginating from all voxels within the brainstem, and fibers that penetrated manually-definedregions of interest (ROIs) were assigned to specific tracts associated with each ROI.Anatomical definitions of tracts in corresponding axial brain sections in a histology-basedatlas (Nolte and Angevine, 2000) were used to guide the placement of ROIs in the DTIimages. The reconstructed fiber data were imported into the MRtrix package (Tournier et al.,2012) for three-dimensional visualization.
Coregistration to stereotaxic in vivo brain atlasTo incorporate the high-resolution neuroanatomical information of the brainstem in widely-used Montreal Neurological Institute (MNI) stereotaxic coordinates, the ex vivo DTI data ofthe brainstem were co-registered to an in vivo whole-brain MRI atlas (JHU brain atlas,www.mristudio.org). The JHU brain atlas contains single-subject and population-averaged(ICBM-DTI-81) images in the MNI coordinate system with T1-weighted, T2-weighted, andDTI-derived contrasts (Oishi et al., 2011). The registration was driven by DEC mapscalculated from DTI, in which major structures can be readily identified in both in vivo andex vivo coordinates. The JHU brain atlas was first cropped and resampled to match the FOVand resolution of the ex vivo brainstem data, followed by intensity-based rigid registration.To remove residual misalignment and correct for possible postmortem tissue distortion, theregistered brainstem data were then nonlinearly deformed to the in vivo atlas via largedeformation diffeomorphic metric mapping (Miller et al., 2002) based on placement of 40
Aggarwal et al. Page 4
Neuroimage. Author manuscript; available in PMC 2014 July 01.
NIH
-PA Author Manuscript
NIH
-PA Author Manuscript
NIH
-PA Author Manuscript
manually-defined anatomic landmarks. Transformation of the tensor field was carried out asdescribed previously by Alexander et al. (2001).
RESULTSAnatomical details in the brainstem resolved with DTI contrasts
Fig. 1 shows 2D planar views generated from the 3D DEC maps of the brainstem acquired at255 μm resolution. Corresponding T2-weighted axial sections are shown for anatomiccomparison. Structural orientation based contrasts in the DEC maps enabled detailedanatomical delineation in the brainstem. At the medullary level, major longitudinal pathwaysincluding the corticospinal tract, medial lemniscus, and medial longitudinal fasciculus wereidentified by their predominantly inferior-superior orientations (blue in the DEC maps). Atthe level of the pons, the corticospinal tract splits into multiple fiber bundles, that descendthrough interdigitating transverse pontine fibers. The DEC maps provided striking contraststo delineate the craniocaudally-oriented fiber bundles of the corticospinal tract (blue) and theinterleaving mediolaterally-oriented transverse pontine fibers (red), based on their respectivestructural orientations (Fig. 1). The superior cerebellar peduncle was distinctly delineated(crescent-shaped in axial sections) in the pontine tegmentum, which appeared relativelyhomogeneous in T2-weighted contrasts. Fig. 2 further illustrates the level of structural detailresolved by the high-resolution DTI data at different sagittal and coronal levels in thebrainstem. The decussation of the superior cerebellar peduncles was clearly demarcated inthe DEC maps as red crossing fibers at the mid sagittal level (Fig. 2b–d). Crossing fibers ofthe posterior commissure and the trapezoid body can also be clearly seen in the DEC mapsin Fig. 2, delineated by their mediolateral orientation (Fig. 2b,d).
Fig. 3 shows three-dimensional reconstruction of major white matter tracts and grey matternuclei from the tensor data. Brainstem nuclei, including the cranial nerve and the inferiorolivary nuclei, were three-dimensionally segmented based on their hyperintense appearancein ADC maps. The pontine nuclei, dispersed among the corticospinal and transverse pontinefibers in the basal pons, were delineated as hyperintense bands in the ADC map (inset inFig. 3a). Tractography results from the tensor data enabled three-dimensional reconstructionof fiber fascicles of the corticospinal tract interleaving through the transversely-orientedpontine fibers (Fig. 3b,c). The transverse pontine fibers were traced coursing dorso-laterallyand merging with the contralateral middle cerebellar peduncle (Fig. 3c,d). The shift in thedorso-ventral position of the medial lemniscus along the longitudinal axis of the brainstemcan be seen in Fig. 3. The medial lemniscus coursed along the ventral side in the caudalmedulla, and turned sharply towards the dorsal side of the brainstem as it entered the pons.These trajectories agree well with the 2D histological description of these tracts(Nieuwenhuys et al., 1983; Nolte, 2008).
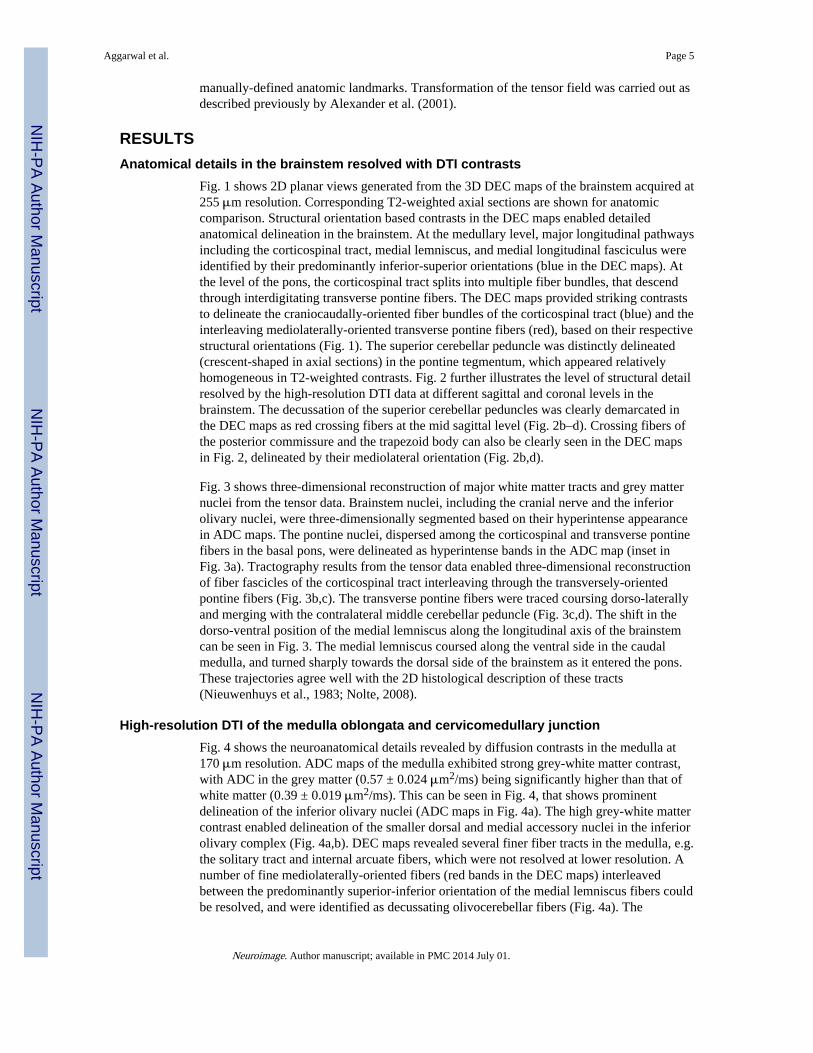
High-resolution DTI of the medulla oblongata and cervicomedullary junctionFig. 4 shows the neuroanatomical details revealed by diffusion contrasts in the medulla at170 μm resolution. ADC maps of the medulla exhibited strong grey-white matter contrast,with ADC in the grey matter (0.57 ± 0.024 μm2/ms) being significantly higher than that ofwhite matter (0.39 ± 0.019 μm2/ms). This can be seen in Fig. 4, that shows prominentdelineation of the inferior olivary nuclei (ADC maps in Fig. 4a). The high grey-white mattercontrast enabled delineation of the smaller dorsal and medial accessory nuclei in the inferiorolivary complex (Fig. 4a,b). DEC maps revealed several finer fiber tracts in the medulla, e.g.the solitary tract and internal arcuate fibers, which were not resolved at lower resolution. Anumber of fine mediolaterally-oriented fibers (red bands in the DEC maps) interleavedbetween the predominantly superior-inferior orientation of the medial lemniscus fibers couldbe resolved, and were identified as decussating olivocerebellar fibers (Fig. 4a). The
Aggarwal et al. Page 5
Neuroimage. Author manuscript; available in PMC 2014 July 01.
NIH
-PA Author Manuscript
NIH
-PA Author Manuscript
NIH
-PA Author Manuscript
relatively less-myelinated spinothalamic and spinal trigeminal pathways were also clearlydelineated in the DEC maps. Fig. 4b shows three-dimensional reconstruction of structures inthe medulla from the tensor data. Tractography-based reconstruction of the mediallemniscus fibers showed the sharp dorsolateral bend at the level of the rostral medulla. Thesolitary tract, with a diameter of approximately 1-mm, was traced coursing obliquely alongthe craniocaudal axis of the medulla (Fig. 4b). Placement of seed regions in the inferiorolivary nuclei resulted in tracing of a large number of fine olivocerebellar fibers. Theolivocerebellar fibers originate at the inferior olivary nuclei, and decussate in the raphe tojoin the contralateral inferior cerebellar peduncle (Nieuwenhuys et al., 1983). Althoughdecussation of the olivocerebellar fibers could be identified in the DEC maps as loosely-arranged fascicles coursing mediolaterally through the raphe, 3D reconstruction of the fibertrajectories to the contralateral inferior cerebellar peduncle could not be performed owing tothe very small diameters of the individual fascicles.
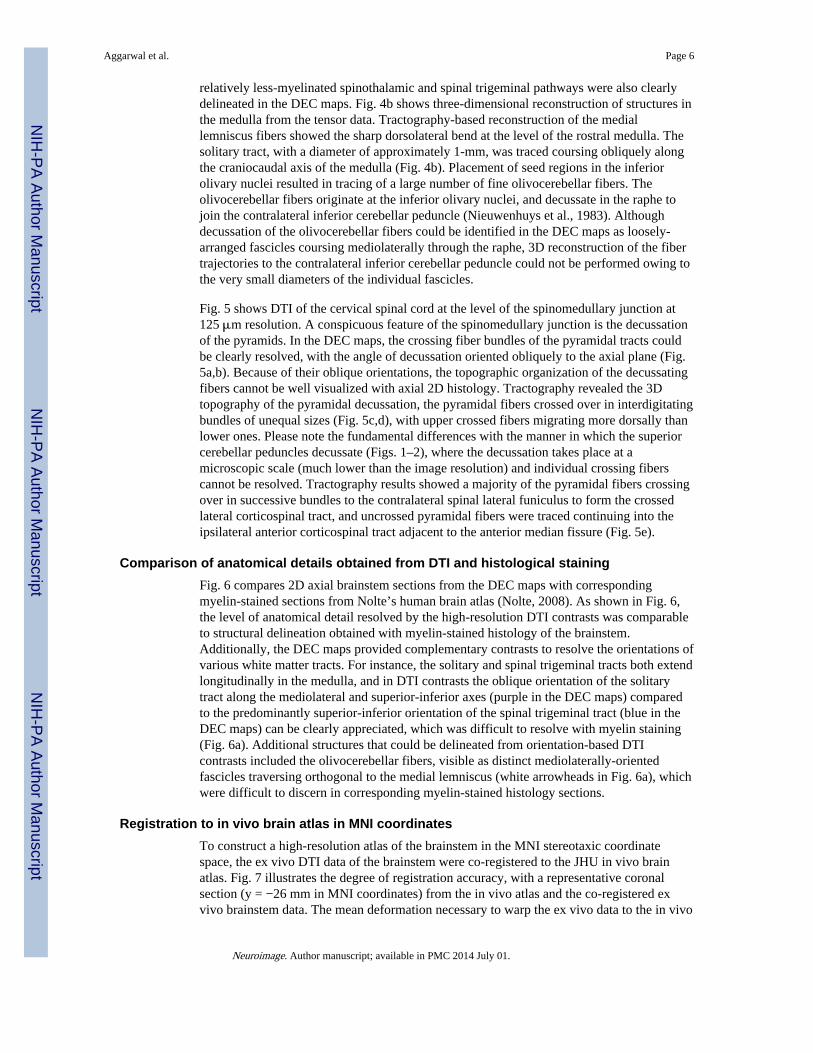
Fig. 5 shows DTI of the cervical spinal cord at the level of the spinomedullary junction at125 μm resolution. A conspicuous feature of the spinomedullary junction is the decussationof the pyramids. In the DEC maps, the crossing fiber bundles of the pyramidal tracts couldbe clearly resolved, with the angle of decussation oriented obliquely to the axial plane (Fig.5a,b). Because of their oblique orientations, the topographic organization of the decussatingfibers cannot be well visualized with axial 2D histology. Tractography revealed the 3Dtopography of the pyramidal decussation, the pyramidal fibers crossed over in interdigitatingbundles of unequal sizes (Fig. 5c,d), with upper crossed fibers migrating more dorsally thanlower ones. Please note the fundamental differences with the manner in which the superiorcerebellar peduncles decussate (Figs. 1–2), where the decussation takes place at amicroscopic scale (much lower than the image resolution) and individual crossing fiberscannot be resolved. Tractography results showed a majority of the pyramidal fibers crossingover in successive bundles to the contralateral spinal lateral funiculus to form the crossedlateral corticospinal tract, and uncrossed pyramidal fibers were traced continuing into theipsilateral anterior corticospinal tract adjacent to the anterior median fissure (Fig. 5e).
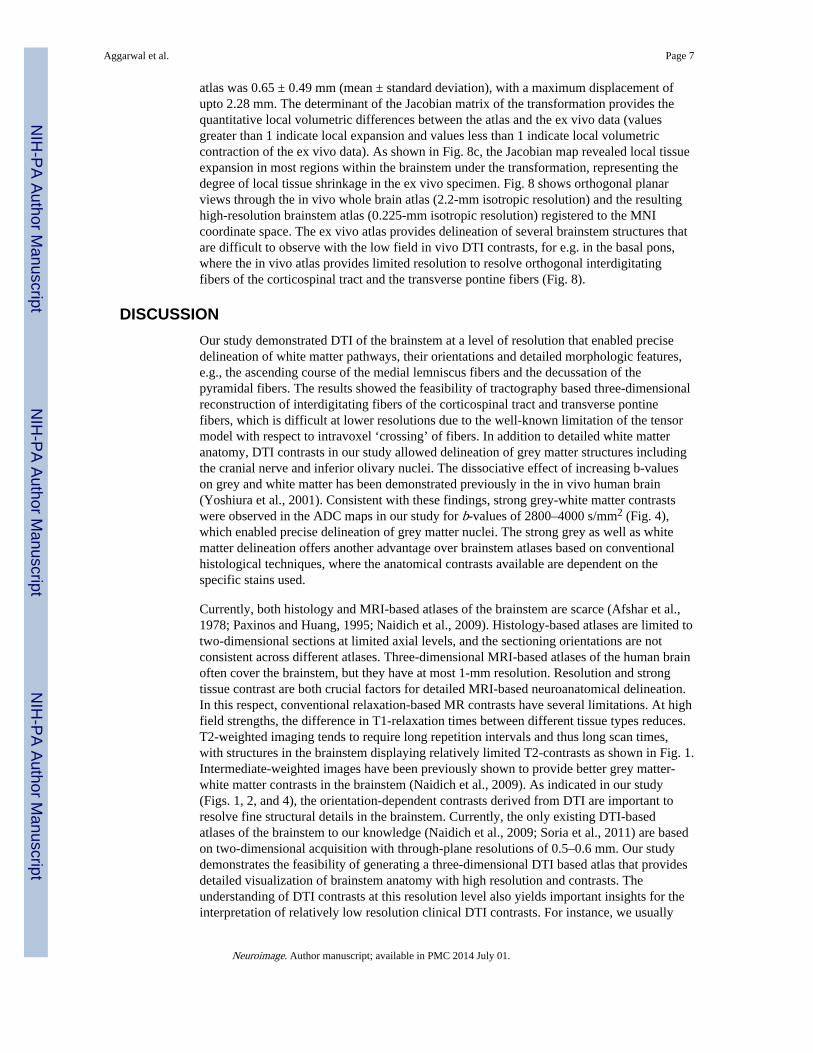
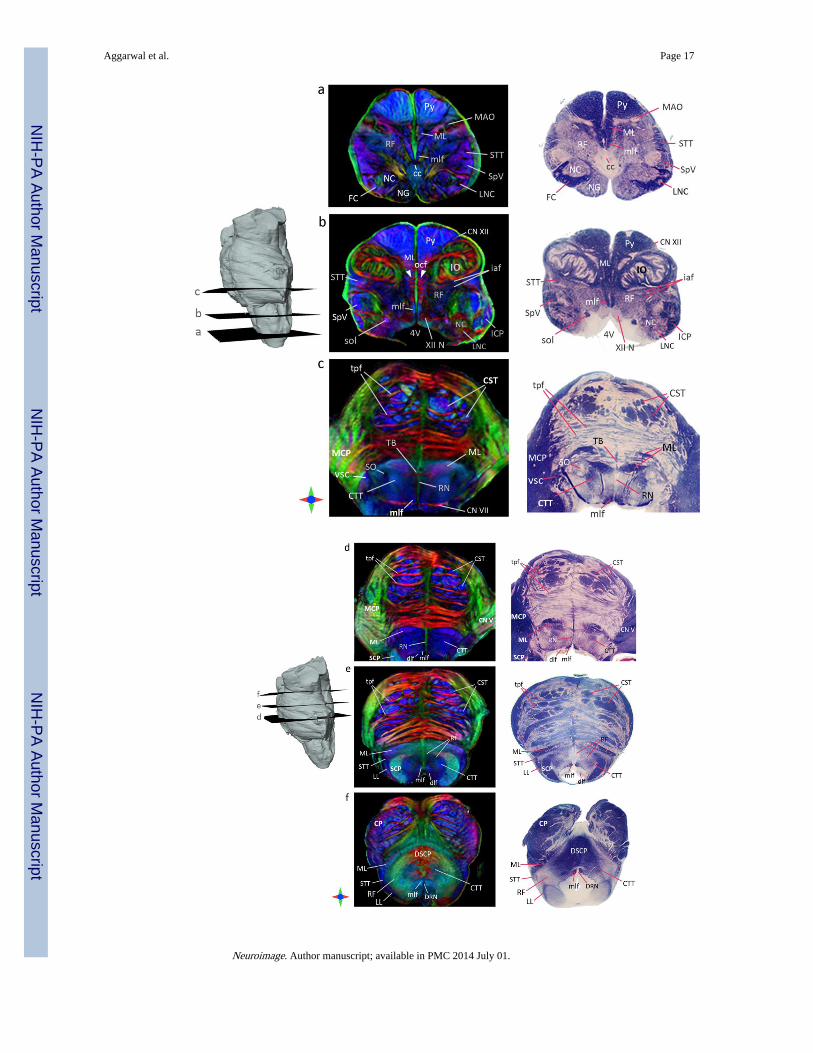
Comparison of anatomical details obtained from DTI and histological stainingFig. 6 compares 2D axial brainstem sections from the DEC maps with correspondingmyelin-stained sections from Nolte’s human brain atlas (Nolte, 2008). As shown in Fig. 6,the level of anatomical detail resolved by the high-resolution DTI contrasts was comparableto structural delineation obtained with myelin-stained histology of the brainstem.Additionally, the DEC maps provided complementary contrasts to resolve the orientations ofvarious white matter tracts. For instance, the solitary and spinal trigeminal tracts both extendlongitudinally in the medulla, and in DTI contrasts the oblique orientation of the solitarytract along the mediolateral and superior-inferior axes (purple in the DEC maps) comparedto the predominantly superior-inferior orientation of the spinal trigeminal tract (blue in theDEC maps) can be clearly appreciated, which was difficult to resolve with myelin staining(Fig. 6a). Additional structures that could be delineated from orientation-based DTIcontrasts included the olivocerebellar fibers, visible as distinct mediolaterally-orientedfascicles traversing orthogonal to the medial lemniscus (white arrowheads in Fig. 6a), whichwere difficult to discern in corresponding myelin-stained histology sections.
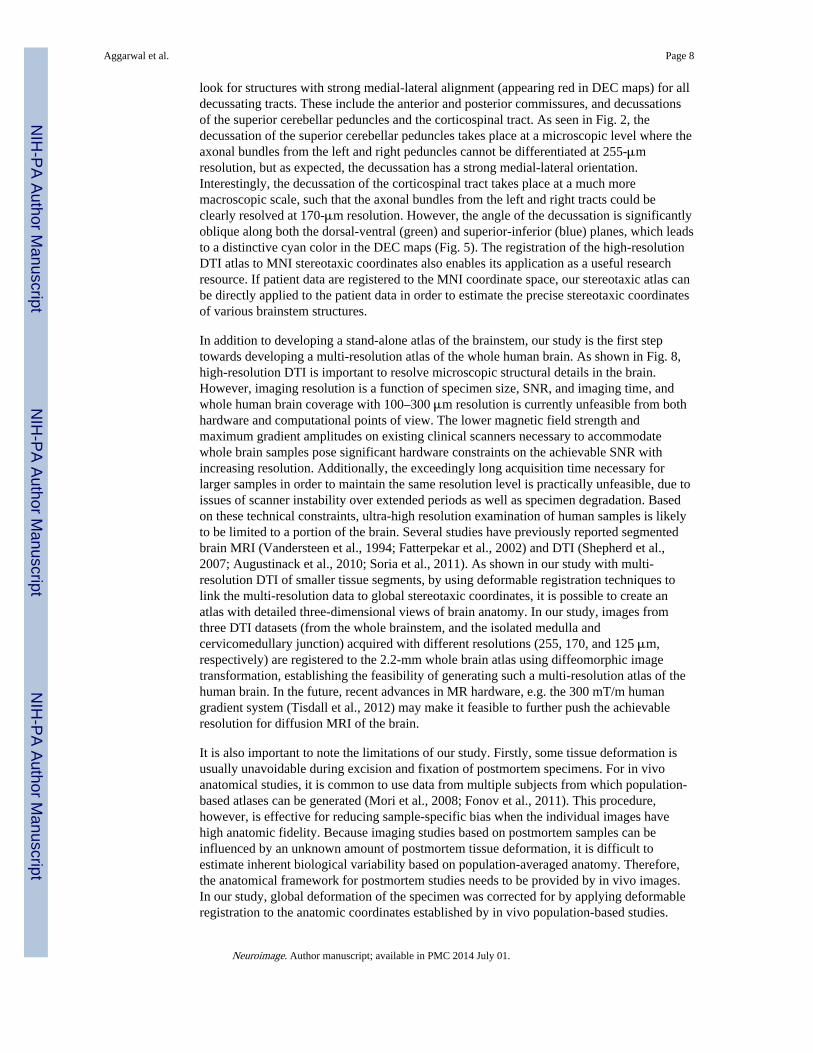
Registration to in vivo brain atlas in MNI coordinatesTo construct a high-resolution atlas of the brainstem in the MNI stereotaxic coordinatespace, the ex vivo DTI data of the brainstem were co-registered to the JHU in vivo brainatlas. Fig. 7 illustrates the degree of registration accuracy, with a representative coronalsection (y = −26 mm in MNI coordinates) from the in vivo atlas and the co-registered exvivo brainstem data. The mean deformation necessary to warp the ex vivo data to the in vivo
Aggarwal et al. Page 6
Neuroimage. Author manuscript; available in PMC 2014 July 01.
NIH
-PA Author Manuscript
NIH
-PA Author Manuscript
NIH
-PA Author Manuscript
atlas was 0.65 ± 0.49 mm (mean ± standard deviation), with a maximum displacement ofupto 2.28 mm. The determinant of the Jacobian matrix of the transformation provides thequantitative local volumetric differences between the atlas and the ex vivo data (valuesgreater than 1 indicate local expansion and values less than 1 indicate local volumetriccontraction of the ex vivo data). As shown in Fig. 8c, the Jacobian map revealed local tissueexpansion in most regions within the brainstem under the transformation, representing thedegree of local tissue shrinkage in the ex vivo specimen. Fig. 8 shows orthogonal planarviews through the in vivo whole brain atlas (2.2-mm isotropic resolution) and the resultinghigh-resolution brainstem atlas (0.225-mm isotropic resolution) registered to the MNIcoordinate space. The ex vivo atlas provides delineation of several brainstem structures thatare difficult to observe with the low field in vivo DTI contrasts, for e.g. in the basal pons,where the in vivo atlas provides limited resolution to resolve orthogonal interdigitatingfibers of the corticospinal tract and the transverse pontine fibers (Fig. 8).
DISCUSSIONOur study demonstrated DTI of the brainstem at a level of resolution that enabled precisedelineation of white matter pathways, their orientations and detailed morphologic features,e.g., the ascending course of the medial lemniscus fibers and the decussation of thepyramidal fibers. The results showed the feasibility of tractography based three-dimensionalreconstruction of interdigitating fibers of the corticospinal tract and transverse pontinefibers, which is difficult at lower resolutions due to the well-known limitation of the tensormodel with respect to intravoxel ‘crossing’ of fibers. In addition to detailed white matteranatomy, DTI contrasts in our study allowed delineation of grey matter structures includingthe cranial nerve and inferior olivary nuclei. The dissociative effect of increasing b-valueson grey and white matter has been demonstrated previously in the in vivo human brain(Yoshiura et al., 2001). Consistent with these findings, strong grey-white matter contrastswere observed in the ADC maps in our study for b-values of 2800–4000 s/mm2 (Fig. 4),which enabled precise delineation of grey matter nuclei. The strong grey as well as whitematter delineation offers another advantage over brainstem atlases based on conventionalhistological techniques, where the anatomical contrasts available are dependent on thespecific stains used.
Currently, both histology and MRI-based atlases of the brainstem are scarce (Afshar et al.,1978; Paxinos and Huang, 1995; Naidich et al., 2009). Histology-based atlases are limited totwo-dimensional sections at limited axial levels, and the sectioning orientations are notconsistent across different atlases. Three-dimensional MRI-based atlases of the human brainoften cover the brainstem, but they have at most 1-mm resolution. Resolution and strongtissue contrast are both crucial factors for detailed MRI-based neuroanatomical delineation.In this respect, conventional relaxation-based MR contrasts have several limitations. At highfield strengths, the difference in T1-relaxation times between different tissue types reduces.T2-weighted imaging tends to require long repetition intervals and thus long scan times,with structures in the brainstem displaying relatively limited T2-contrasts as shown in Fig. 1.Intermediate-weighted images have been previously shown to provide better grey matter-white matter contrasts in the brainstem (Naidich et al., 2009). As indicated in our study(Figs. 1, 2, and 4), the orientation-dependent contrasts derived from DTI are important toresolve fine structural details in the brainstem. Currently, the only existing DTI-basedatlases of the brainstem to our knowledge (Naidich et al., 2009; Soria et al., 2011) are basedon two-dimensional acquisition with through-plane resolutions of 0.5–0.6 mm. Our studydemonstrates the feasibility of generating a three-dimensional DTI based atlas that providesdetailed visualization of brainstem anatomy with high resolution and contrasts. Theunderstanding of DTI contrasts at this resolution level also yields important insights for theinterpretation of relatively low resolution clinical DTI contrasts. For instance, we usually
Aggarwal et al. Page 7
Neuroimage. Author manuscript; available in PMC 2014 July 01.
NIH
-PA Author Manuscript
NIH
-PA Author Manuscript
NIH
-PA Author Manuscript
look for structures with strong medial-lateral alignment (appearing red in DEC maps) for alldecussating tracts. These include the anterior and posterior commissures, and decussationsof the superior cerebellar peduncles and the corticospinal tract. As seen in Fig. 2, thedecussation of the superior cerebellar peduncles takes place at a microscopic level where theaxonal bundles from the left and right peduncles cannot be differentiated at 255-μmresolution, but as expected, the decussation has a strong medial-lateral orientation.Interestingly, the decussation of the corticospinal tract takes place at a much moremacroscopic scale, such that the axonal bundles from the left and right tracts could beclearly resolved at 170-μm resolution. However, the angle of the decussation is significantlyoblique along both the dorsal-ventral (green) and superior-inferior (blue) planes, which leadsto a distinctive cyan color in the DEC maps (Fig. 5). The registration of the high-resolutionDTI atlas to MNI stereotaxic coordinates also enables its application as a useful researchresource. If patient data are registered to the MNI coordinate space, our stereotaxic atlas canbe directly applied to the patient data in order to estimate the precise stereotaxic coordinatesof various brainstem structures.
In addition to developing a stand-alone atlas of the brainstem, our study is the first steptowards developing a multi-resolution atlas of the whole human brain. As shown in Fig. 8,high-resolution DTI is important to resolve microscopic structural details in the brain.However, imaging resolution is a function of specimen size, SNR, and imaging time, andwhole human brain coverage with 100–300 μm resolution is currently unfeasible from bothhardware and computational points of view. The lower magnetic field strength andmaximum gradient amplitudes on existing clinical scanners necessary to accommodatewhole brain samples pose significant hardware constraints on the achievable SNR withincreasing resolution. Additionally, the exceedingly long acquisition time necessary forlarger samples in order to maintain the same resolution level is practically unfeasible, due toissues of scanner instability over extended periods as well as specimen degradation. Basedon these technical constraints, ultra-high resolution examination of human samples is likelyto be limited to a portion of the brain. Several studies have previously reported segmentedbrain MRI (Vandersteen et al., 1994; Fatterpekar et al., 2002) and DTI (Shepherd et al.,2007; Augustinack et al., 2010; Soria et al., 2011). As shown in our study with multi-resolution DTI of smaller tissue segments, by using deformable registration techniques tolink the multi-resolution data to global stereotaxic coordinates, it is possible to create anatlas with detailed three-dimensional views of brain anatomy. In our study, images fromthree DTI datasets (from the whole brainstem, and the isolated medulla andcervicomedullary junction) acquired with different resolutions (255, 170, and 125 μm,respectively) are registered to the 2.2-mm whole brain atlas using diffeomorphic imagetransformation, establishing the feasibility of generating such a multi-resolution atlas of thehuman brain. In the future, recent advances in MR hardware, e.g. the 300 mT/m humangradient system (Tisdall et al., 2012) may make it feasible to further push the achievableresolution for diffusion MRI of the brain.
It is also important to note the limitations of our study. Firstly, some tissue deformation isusually unavoidable during excision and fixation of postmortem specimens. For in vivoanatomical studies, it is common to use data from multiple subjects from which population-based atlases can be generated (Mori et al., 2008; Fonov et al., 2011). This procedure,however, is effective for reducing sample-specific bias when the individual images havehigh anatomic fidelity. Because imaging studies based on postmortem samples can beinfluenced by an unknown amount of postmortem tissue deformation, it is difficult toestimate inherent biological variability based on population-averaged anatomy. Therefore,the anatomical framework for postmortem studies needs to be provided by in vivo images.In our study, global deformation of the specimen was corrected for by applying deformableregistration to the anatomic coordinates established by in vivo population-based studies.
Aggarwal et al. Page 8
Neuroimage. Author manuscript; available in PMC 2014 July 01.
NIH
-PA Author Manuscript
NIH
-PA Author Manuscript
NIH
-PA Author Manuscript
Further studies using registration to in vivo MRI data may be necessary to provide estimatesof the degree of inter-subject variability. Secondly, the effects of fixatives on postmortemtissue properties are not precisely understood at present, and need to be taken into accountwhile extrapolating the contrasts of the ex vivo atlas to in vivo DTI studies. Several studieshave shown that ADC in brain tissue changes with formalin fixation, although the degree ofanisotropy (FA) stays unaffected (Guilfoyle et al., 2003; Sun et al., 2005). Therefore,although anisotropy-based orientation contrasts can be directly compared with in vivo DTIdata, quantitative comparison of diffusivity indices is not feasible and should be avoided.Lastly, the six-element tensor model and deterministic tractography approach have someknown limitations (Mori and van Zijl, 2002). The use of more sophisticated diffusionsampling schemes, such as high angular resolution diffusion imaging (HARDI), andtractography algorithms (Behrens et al., 2003; Tuch et al., 2003) may possibly reveal furtherstructural details in the postmortem brainstem. However, HARDI-type data acquisitionrequires a large number of diffusion-encoding directions, typically more than 60orientations, requiring significantly longer scanning time. In addition, the higher b-valuesnecessary compared to DTI can further reduce the achievable SNR at increasing resolutions.The gain in scan time/SNR can be traded for image resolution enhancement of DTI, whichcould also potentially reveal finer microstructures. Therefore, the relative advantagesbetween DTI and HARDI need to be carefully evaluated.
In conclusion, the results of this study will significantly enhance existing 2D atlases of thehuman brainstem, and improve our understanding and interpretation of relatively lowresolution in vivo DTI contrasts. The high-resolution DTI atlas will also serve as a usefulneuroanatomical reference for future research and clinical imaging studies of the brainstem.
AcknowledgmentsThis study was supported by National Institutes of Health grants R01AG020012 and R01EB003543.
ReferencesAfshar F, Dykes E. A three-dimensional reconstruction of the human brain stem. J Neurosurg. 1982;
57(4):491–495. [PubMed: 7050312]
Afshar, F.; Watkins, ES., et al. A Variability Study. New York: Raven Press; 1978. Stereotaxic Atlasof the Human Brainstem and Cerebellar Nuclei.
Aggarwal M, Mori S, et al. Three-dimensional diffusion tensor microimaging for anatomicalcharacterization of the mouse brain. Magn Reson Med. 2010; 64(1):249–261. [PubMed: 20577980]
Alexander DC, Pierpaoli C, et al. Spatial transformations of diffusion tensor magnetic resonanceimages. IEEE Transactions on Medical Imaging. 2001; 20(11):1131–1139. [PubMed: 11700739]
Augustinack JC, Helmer K, et al. Direct visualization of the perforant pathway in the human brain withex vivo diffusion tensor imaging. Front Hum Neurosci. 2010; 4:42. [PubMed: 20577631]
Axer H, Beck S, et al. Microstructural analysis of human white matter architecture using polarizedlight imaging: views from neuroanatomy. Front Neuroinform. 2011; 5:28. [PubMed: 22110430]
Basser PJ, Mattiello J, et al. MR diffusion tensor spectroscopy and imaging. Biophys J. 1994; 66:259–267. [PubMed: 8130344]
Behrens TE, Woolrich MW, et al. Characterization and propagation of uncertainty in diffusion-weighted MR imaging. Magn Reson Med. 2003; 50(5):1077–1088. [PubMed: 14587019]
Carpenter, M. Human neuroanatomy. Baltimore: Williams & Wilkins; 1976.
Chen X, Weigel D, et al. Diffusion tensor imaging and white matter tractography in patients withbrainstem lesions. Acta Neurochir (Wien). 2007; 149(11):1117–1131. [PubMed: 17712509]
Donaldson SS, Laningham F, et al. Advances toward an understanding of brainstem gliomas. J ClinOncol. 2006; 24(8):1266–1272. [PubMed: 16525181]
Aggarwal et al. Page 9
Neuroimage. Author manuscript; available in PMC 2014 July 01.
NIH
-PA Author Manuscript
NIH
-PA Author Manuscript
NIH
-PA Author Manuscript
Fatterpekar GM, Naidich TP, et al. Cytoarchitecture of the human cerebral cortex: MR microscopy ofexcised specimens at 9.4 Tesla. AJNR Am J Neuroradiol. 2002; 23(8):1313–1321. [PubMed:12223371]
Fonov V, Evans AC, et al. Unbiased average age-appropriate atlases for pediatric studies. Neuroimage.2011; 54(1):313–327. [PubMed: 20656036]
Guilfoyle DN, Helpern JA, et al. Diffusion tensor imaging in fixed brain tissue at 7.0 T. NMR Biomed.2003; 16(2):77–81. [PubMed: 12730948]
Helton KJ, Weeks JK, et al. Diffusion tensor imaging of brainstem tumors: axonal degeneration ofmotor and sensory tracts. J Neurosurg Pediatr. 2008; 1(4):270–276. [PubMed: 18377301]
Jiang H, van Zijl PCM, et al. DtiStudio: resource program for diffusion tensor computation and fiberbundle tracking. Computer Methods and Programs in Biomedicine. 2006; 81(2):106–116.[PubMed: 16413083]
Jones DK. The effect of gradient sampling schemes on measures derived from diffusion tensor MRI: AMonte Carlo study. Magn Reson Med. 2004; 51:807–815. [PubMed: 15065255]
Lui YW, Law M, et al. Brainstem corticospinal tract diffusion tensor imaging in patients with primaryposterior fossa neoplasms stratified by tumor type: a study of association with motor weakness andoutcome. Neurosurgery. 2007; 61(6):1199–1207. [PubMed: 18162899]
McNab JA, Jbabdi S, et al. High resolution diffusion-weighted imaging in fixed human brain usingdiffusion-weighted steady state free precession. Neuroimage. 2009; 46(3):775–785. [PubMed:19344686]
Miller KL, Stagg CJ, et al. Diffusion imaging of whole, post-mortem human brains on a clinical MRIscanner. Neuroimage. 2011; 57(1):167–181. [PubMed: 21473920]
Miller MI, Trouve A, et al. On the metrics and Euler-Lagrange equations of computational anatomy.Annu Rev Biomed Eng. 2002; 4:375–405. [PubMed: 12117763]
Mori S, Crain BJ, et al. Three dimensional tracking of axonal projections in the brain by magneticresonance imaging. Annals of Neurology. 1999; 45:265–269. [PubMed: 9989633]
Mori S, Oishi K, et al. Stereotaxic white matter atlas based on diffusion tensor imaging in an ICBMtemplate. NeuroImage. 2008; 40(2):570–582. [PubMed: 18255316]
Mori S, van Zijl PC. Fiber tracking: principles and strategies - a technical review. NMR Biomed. 2002;15(7–8):468–480. [PubMed: 12489096]
Nagae-Poetscher LM, Jiang H, et al. High-resolution diffusion tensor imaging of the brain stem at 3 T.American Journal of Neuroradiology. 2004; 25(8):1325–1330. [PubMed: 15466326]
Naidich, TP.; Duvernoy, HM., et al. Duvernoy’s Atlas of the Human Brain Stem and Cerebellum.Springer-Verlag; 2009.
Niemann K, van den Boom R, et al. A brainstem stereotactic atlas in a three-dimensional magneticresonance imaging navigation system: first experiences with atlas-to-patient registration. JNeurosurg. 1999; 90(5):891–901. [PubMed: 10223456]
Nieuwenhuys, R.; Voogd, J., et al. The Human Central Nervous System: A Synopsis and Atlas.Springer-Verlag; 1983.
Nolte, J. The Human Brain: An Introduction to its Functional Anatomy. Mosby; 2008.
Nolte, J.; Angevine, JB. The human brain: In photographs and Diagrams. St. Louis: Mosby; 2000.
Oishi, K.; Faria, AV., et al. MRI Atlas of Human White Matter. Academic Press; 2011.
Pajevic S, Pierpaoli C. Color schemes to represent the orientation of anisotropic tissues from diffusiontensor data: application to white matter fiber tract mapping in the human brain. Magn Reson Med.1999; 42:526–540. [PubMed: 10467297]
Parvizi J, Damasio AR. Neuroanatomical correlates of brainstem coma. Brain. 2003; 126(Pt 7):1524–1536. [PubMed: 12805123]
Paxinos, G.; Huang, X. Atlas of the Human Brainstem. Academic Press; 1995.
Prats-Galino A, Soria G, et al. Functional anatomy of subcortical circuits issuing from or integrating atthe human brainstem. Clin Neurophysiol. 2012; 123(1):4–12. [PubMed: 22055838]
Salamon N, Sicotte N, et al. Analysis of the brain-stem white-matter tracts with diffusion tensorimaging. Neuroradiology. 2005; 47(12):895–902. [PubMed: 16158279]
Aggarwal et al. Page 10
Neuroimage. Author manuscript; available in PMC 2014 July 01.
NIH
-PA Author Manuscript
NIH
-PA Author Manuscript
NIH
-PA Author Manuscript

Schmierer K, Wheeler-Kingshott CA, et al. Quantitative magnetic resonance of postmortem multiplesclerosis brain before and after fixation. Magn Reson Med. 2008; 59(2):268–277. [PubMed:18228601]
Shepherd TM, Ozarslan E, et al. Diffusion tensor microscopy indicates the cytoarchitectural basis fordiffusion anisotropy in the human hippocampus. AJNR Am J Neuroradiol. 2007; 28(5):958–964.[PubMed: 17494678]
Soria G, De Notaris M, et al. Improved assessment of ex vivo brainstem neuroanatomy with high-resolution MRI and DTI at 7 Tesla. Anat Rec (Hoboken). 2011; 294(6):1035–1044. [PubMed:21542138]
Stieltjes B, Kaufmann WE, et al. Diffusion tensor imaging and axonal tracking in the humanbrainstem. NeuroImage. 2001; 14:723–735. [PubMed: 11506544]
Sun SW, Neil JJ, et al. Formalin fixation alters water diffusion coefficient magnitude but notanisotropy in infarcted brain. Magn Reson Med. 2005; 53(6):1447–1451. [PubMed: 15906292]
Tisdall, MD.; Witzel, T., et al. Improving SNR in high b-value diffusion imaging using Gmax=300MT/m human gradients. Proceedings of International Society for Magnetic Resonance in Imaging;2012.
Tournier JD, Calamante F, et al. MRtrix: Diffusion tractography in crossing fiber regions. InternationalJournal of Imaging Systems and Technology. 2012; 22(1):53–66.
Tuch DS, Reese TG, et al. Diffusion MRI of complex neural architecture. Neuron. 2003; 40(5):885–895. [PubMed: 14659088]
Vandersteen M, Beuls E, et al. High field magnetic resonance imaging of normal and pathologichuman medulla oblongata. Anat Rec. 1994; 238(2):277–286. [PubMed: 8154612]
Virta A, Barnett A, et al. Visualizing and characterizing white matter fiber structure and architecture inthe human pyramidal tract using diffusion tensor MRI. Magn Reson Imaging. 1999; 17:1121–1133. [PubMed: 10499674]
Yoshiura T, Wu O, et al. Highly diffusion-sensitized MRI of brain: dissociation of gray and whitematter. Magn Reson Med. 2001; 45(5):734–740. [PubMed: 11323798]
Aggarwal et al. Page 11
Neuroimage. Author manuscript; available in PMC 2014 July 01.
NIH
-PA Author Manuscript
NIH
-PA Author Manuscript
NIH
-PA Author Manuscript
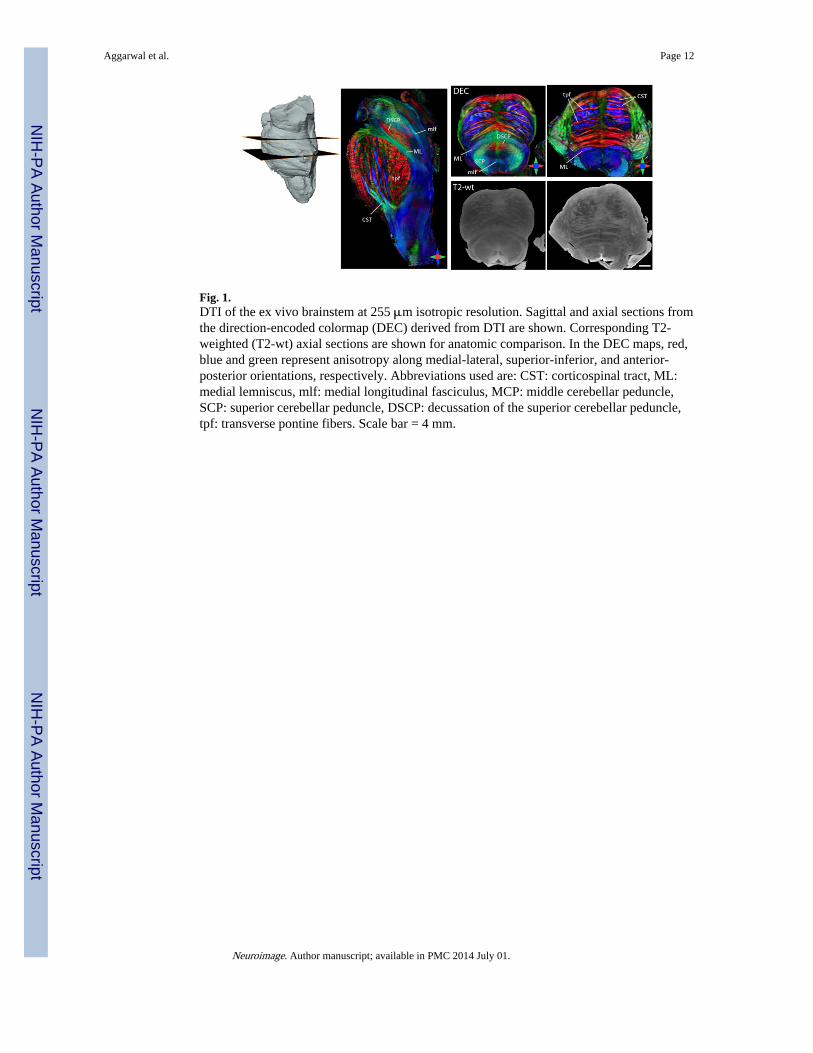
Fig. 1.DTI of the ex vivo brainstem at 255 μm isotropic resolution. Sagittal and axial sections fromthe direction-encoded colormap (DEC) derived from DTI are shown. Corresponding T2-weighted (T2-wt) axial sections are shown for anatomic comparison. In the DEC maps, red,blue and green represent anisotropy along medial-lateral, superior-inferior, and anterior-posterior orientations, respectively. Abbreviations used are: CST: corticospinal tract, ML:medial lemniscus, mlf: medial longitudinal fasciculus, MCP: middle cerebellar peduncle,SCP: superior cerebellar peduncle, DSCP: decussation of the superior cerebellar peduncle,tpf: transverse pontine fibers. Scale bar = 4 mm.
Aggarwal et al. Page 12
Neuroimage. Author manuscript; available in PMC 2014 July 01.
NIH
-PA Author Manuscript
NIH
-PA Author Manuscript
NIH
-PA Author Manuscript
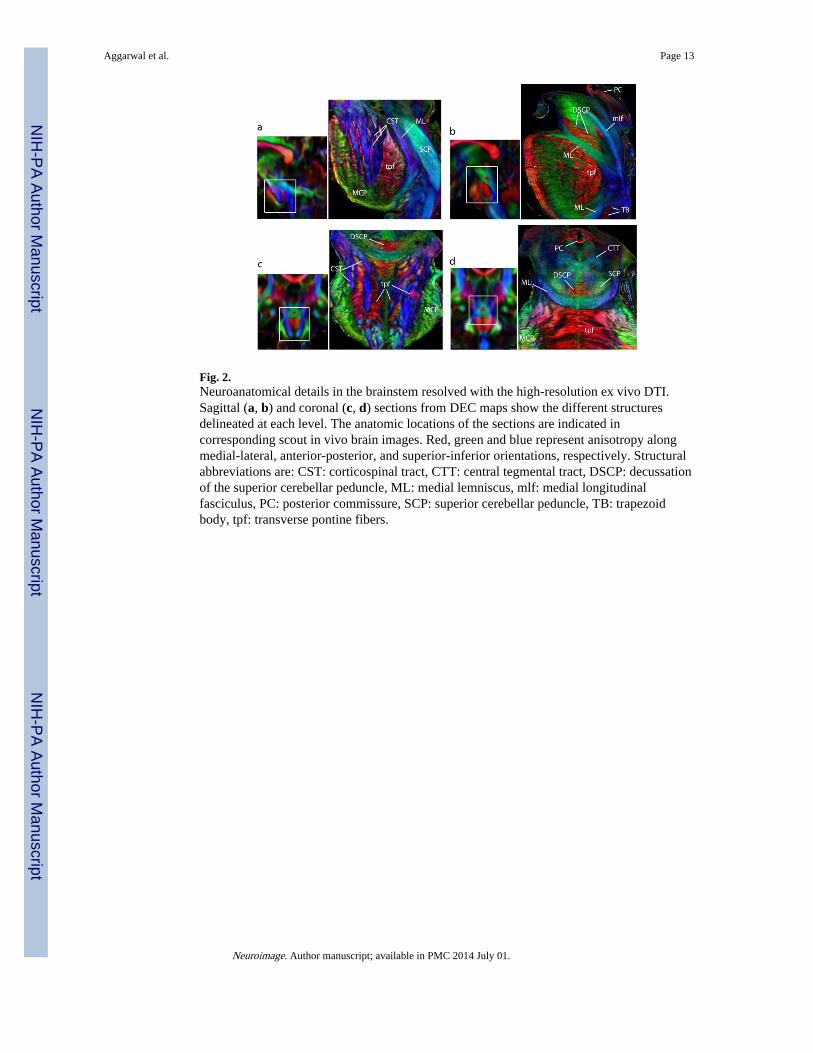
Fig. 2.Neuroanatomical details in the brainstem resolved with the high-resolution ex vivo DTI.Sagittal (a, b) and coronal (c, d) sections from DEC maps show the different structuresdelineated at each level. The anatomic locations of the sections are indicated incorresponding scout in vivo brain images. Red, green and blue represent anisotropy alongmedial-lateral, anterior-posterior, and superior-inferior orientations, respectively. Structuralabbreviations are: CST: corticospinal tract, CTT: central tegmental tract, DSCP: decussationof the superior cerebellar peduncle, ML: medial lemniscus, mlf: medial longitudinalfasciculus, PC: posterior commissure, SCP: superior cerebellar peduncle, TB: trapezoidbody, tpf: transverse pontine fibers.
Aggarwal et al. Page 13
Neuroimage. Author manuscript; available in PMC 2014 July 01.
NIH
-PA Author Manuscript
NIH
-PA Author Manuscript
NIH
-PA Author Manuscript
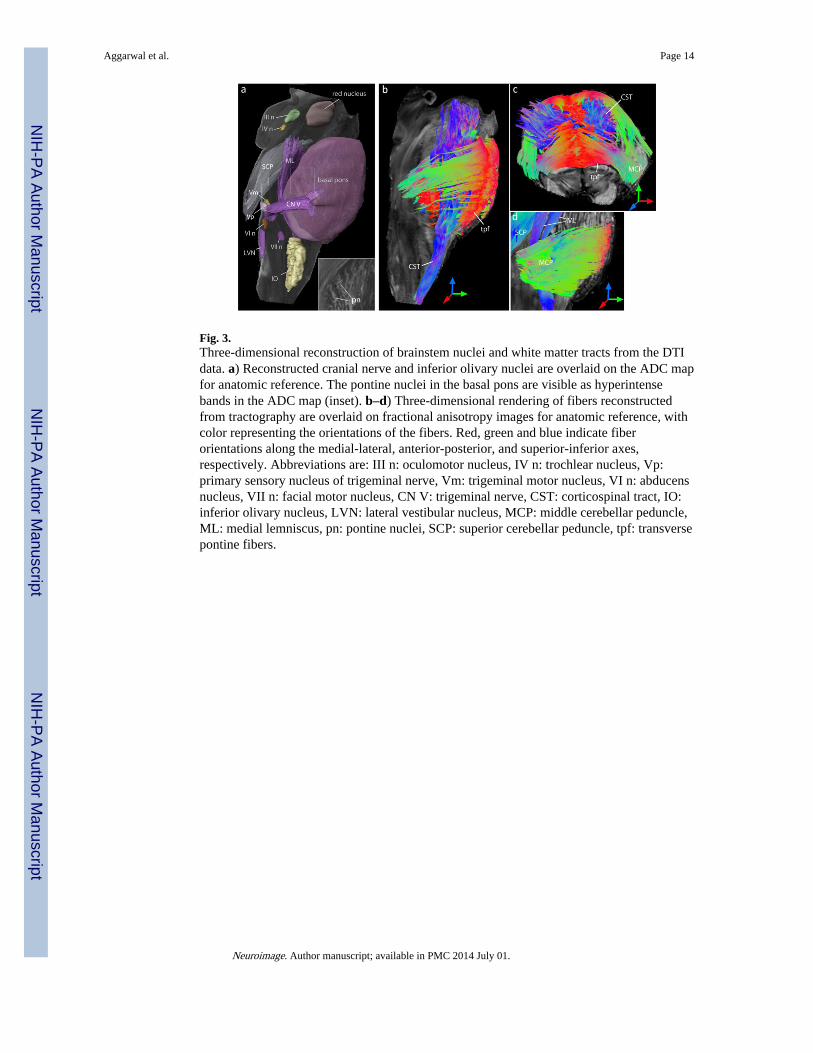
Fig. 3.Three-dimensional reconstruction of brainstem nuclei and white matter tracts from the DTIdata. a) Reconstructed cranial nerve and inferior olivary nuclei are overlaid on the ADC mapfor anatomic reference. The pontine nuclei in the basal pons are visible as hyperintensebands in the ADC map (inset). b–d) Three-dimensional rendering of fibers reconstructedfrom tractography are overlaid on fractional anisotropy images for anatomic reference, withcolor representing the orientations of the fibers. Red, green and blue indicate fiberorientations along the medial-lateral, anterior-posterior, and superior-inferior axes,respectively. Abbreviations are: III n: oculomotor nucleus, IV n: trochlear nucleus, Vp:primary sensory nucleus of trigeminal nerve, Vm: trigeminal motor nucleus, VI n: abducensnucleus, VII n: facial motor nucleus, CN V: trigeminal nerve, CST: corticospinal tract, IO:inferior olivary nucleus, LVN: lateral vestibular nucleus, MCP: middle cerebellar peduncle,ML: medial lemniscus, pn: pontine nuclei, SCP: superior cerebellar peduncle, tpf: transversepontine fibers.
Aggarwal et al. Page 14
Neuroimage. Author manuscript; available in PMC 2014 July 01.
NIH
-PA Author Manuscript
NIH
-PA Author Manuscript
NIH
-PA Author Manuscript
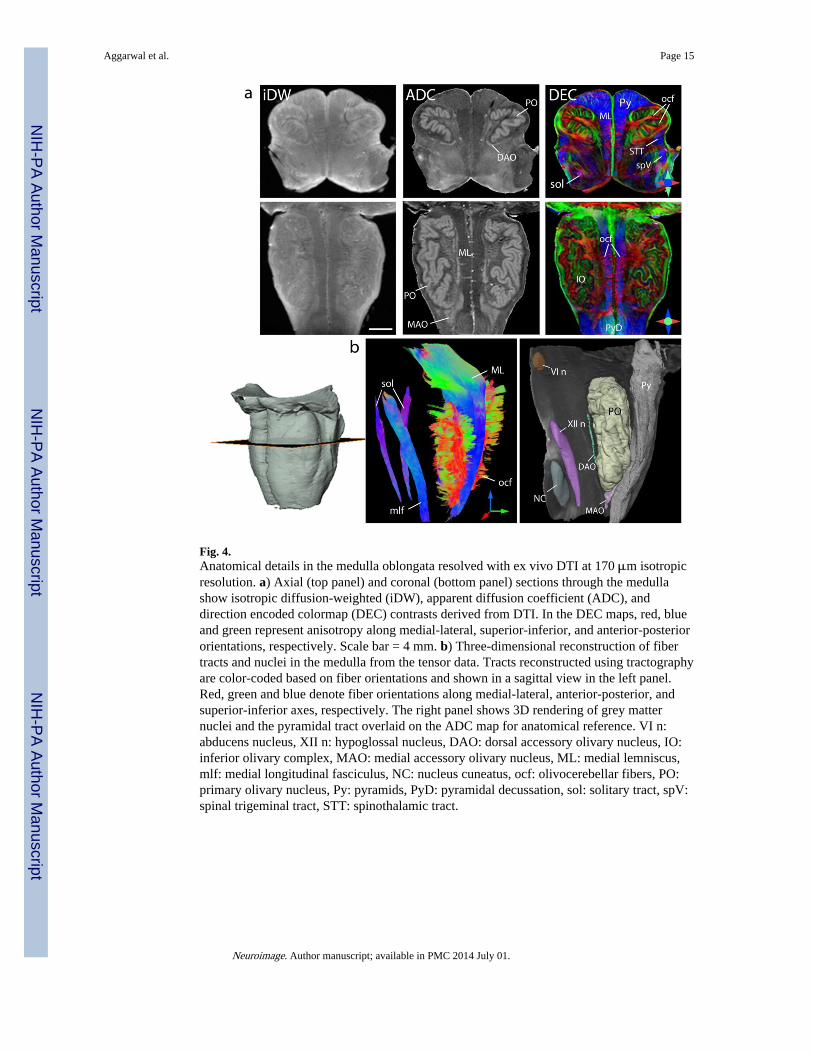
Fig. 4.Anatomical details in the medulla oblongata resolved with ex vivo DTI at 170 μm isotropicresolution. a) Axial (top panel) and coronal (bottom panel) sections through the medullashow isotropic diffusion-weighted (iDW), apparent diffusion coefficient (ADC), anddirection encoded colormap (DEC) contrasts derived from DTI. In the DEC maps, red, blueand green represent anisotropy along medial-lateral, superior-inferior, and anterior-posteriororientations, respectively. Scale bar = 4 mm. b) Three-dimensional reconstruction of fibertracts and nuclei in the medulla from the tensor data. Tracts reconstructed using tractographyare color-coded based on fiber orientations and shown in a sagittal view in the left panel.Red, green and blue denote fiber orientations along medial-lateral, anterior-posterior, andsuperior-inferior axes, respectively. The right panel shows 3D rendering of grey matternuclei and the pyramidal tract overlaid on the ADC map for anatomical reference. VI n:abducens nucleus, XII n: hypoglossal nucleus, DAO: dorsal accessory olivary nucleus, IO:inferior olivary complex, MAO: medial accessory olivary nucleus, ML: medial lemniscus,mlf: medial longitudinal fasciculus, NC: nucleus cuneatus, ocf: olivocerebellar fibers, PO:primary olivary nucleus, Py: pyramids, PyD: pyramidal decussation, sol: solitary tract, spV:spinal trigeminal tract, STT: spinothalamic tract.
Aggarwal et al. Page 15
Neuroimage. Author manuscript; available in PMC 2014 July 01.
NIH
-PA Author Manuscript
NIH
-PA Author Manuscript
NIH
-PA Author Manuscript
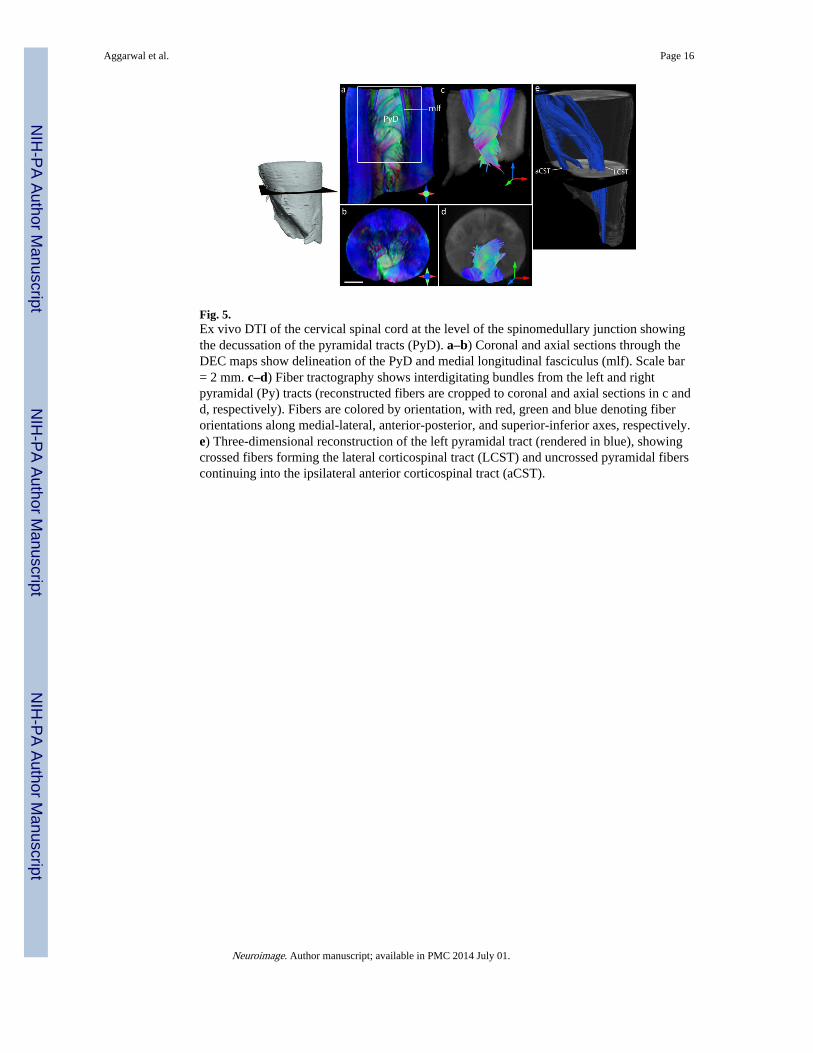
Fig. 5.Ex vivo DTI of the cervical spinal cord at the level of the spinomedullary junction showingthe decussation of the pyramidal tracts (PyD). a–b) Coronal and axial sections through theDEC maps show delineation of the PyD and medial longitudinal fasciculus (mlf). Scale bar= 2 mm. c–d) Fiber tractography shows interdigitating bundles from the left and rightpyramidal (Py) tracts (reconstructed fibers are cropped to coronal and axial sections in c andd, respectively). Fibers are colored by orientation, with red, green and blue denoting fiberorientations along medial-lateral, anterior-posterior, and superior-inferior axes, respectively.e) Three-dimensional reconstruction of the left pyramidal tract (rendered in blue), showingcrossed fibers forming the lateral corticospinal tract (LCST) and uncrossed pyramidal fiberscontinuing into the ipsilateral anterior corticospinal tract (aCST).
Aggarwal et al. Page 16
Neuroimage. Author manuscript; available in PMC 2014 July 01.
NIH
-PA Author Manuscript
NIH
-PA Author Manuscript
NIH
-PA Author Manuscript
Aggarwal et al. Page 17
Neuroimage. Author manuscript; available in PMC 2014 July 01.
NIH
-PA Author Manuscript
NIH
-PA Author Manuscript
NIH
-PA Author Manuscript
Fig. 6.Fig. 6a. Comparison of DTI contrasts in the brainstem with myelin-stained histology. Theleft panel shows DEC maps of axial sections at the level of the caudal medulla (a), rostralmedulla (b), and caudal pons (c). Corresponding histology sections from Nolte’s humanbrain atlas (Nolte, 2008) are shown in the right panel (reproduced with permission).Structural abbreviations are: 4V: fourth ventricle, XII N: hypoglossal nucleus, cc: centralcanal, CN XII: hypoglossal nerve, CST: corticospinal tract, CTT: central tegmental tract,FC: fasciculus cuneatus, iaf: internal arcuate fibers, ICP: inferior cerebellar peduncle, IO:inferior olivary nucleus, LNC: lateral cuneatus nucleus, MAO: medial accessory olivarynucleus, MCP: middle cerebellar peduncle, ML: medial lemniscus, mlf: medial longitudinalfasciculus, NC: nucleus cuneatus, NG: nucleus gracilis, ocf: olivocerebellar fibers, Py:pyramid, RF: reticular formation, RN: raphe nuclei, SO: superior olivary nucleus, sol:solitary tract, SpV: spinal trigeminal tract, STT: spinothalamic tract, TB: trapezoid body,tpf: transverse pontine fibers, vsc: ventral spinocerebellar tract.Fig. 6b. Comparison of DTI contrasts in the brainstem with myelin-stained histology. Theleft panel shows DEC maps of axial sections at the level of the midpons (d), rostral pons (e),and caudal midbrain (f). Corresponding histology sections from Nolte’s human brain atlas(Nolte, 2008) are shown in the right panel (reproduced with permission). Structuralabbreviations are: CN V: trigeminal nerve, CP: cerebral peduncle, CST: corticospinal tract,CTT: central tegmental tract, dlf: dorsal longitudinal fasciculus, DRN: dorsal raphe nucleus,DSCP: decussation of the superior cerebellar peduncles, LL: lateral lemniscus, MCP: middlecerebellar peduncle, ML: medial lemniscus, mlf: medial longitudinal fasciculus, RF:reticular formation, RN: raphe nuclei, SCP: superior cerebellar peduncle, tpf: transversepontine fibers.
Aggarwal et al. Page 18
Neuroimage. Author manuscript; available in PMC 2014 July 01.
NIH
-PA Author Manuscript
NIH
-PA Author Manuscript
NIH
-PA Author Manuscript
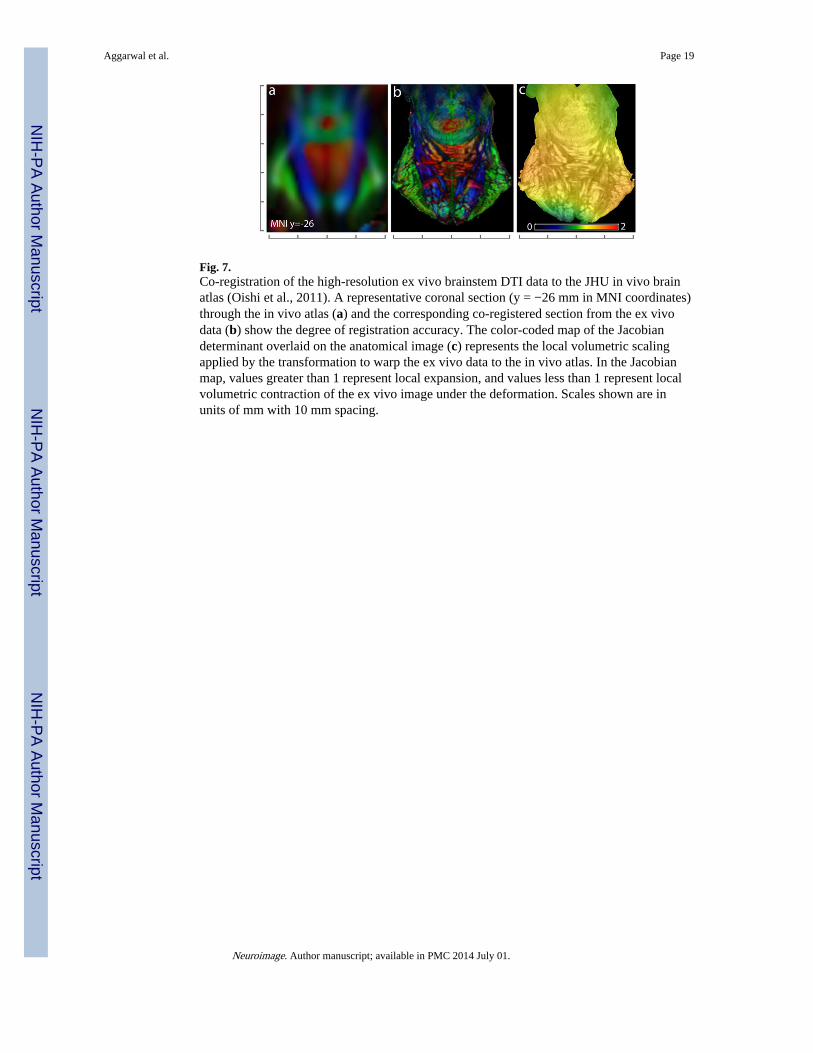
Fig. 7.Co-registration of the high-resolution ex vivo brainstem DTI data to the JHU in vivo brainatlas (Oishi et al., 2011). A representative coronal section (y = −26 mm in MNI coordinates)through the in vivo atlas (a) and the corresponding co-registered section from the ex vivodata (b) show the degree of registration accuracy. The color-coded map of the Jacobiandeterminant overlaid on the anatomical image (c) represents the local volumetric scalingapplied by the transformation to warp the ex vivo data to the in vivo atlas. In the Jacobianmap, values greater than 1 represent local expansion, and values less than 1 represent localvolumetric contraction of the ex vivo image under the deformation. Scales shown are inunits of mm with 10 mm spacing.
Aggarwal et al. Page 19
Neuroimage. Author manuscript; available in PMC 2014 July 01.
NIH
-PA Author Manuscript
NIH
-PA Author Manuscript
NIH
-PA Author Manuscript
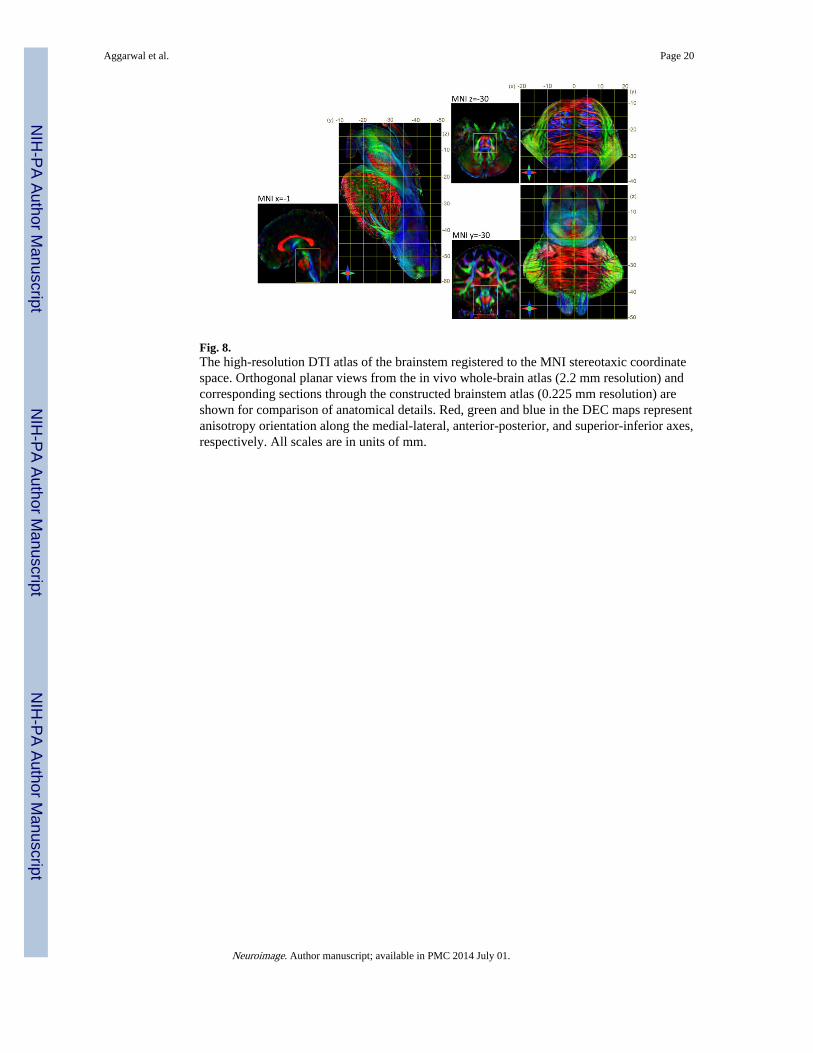
Fig. 8.The high-resolution DTI atlas of the brainstem registered to the MNI stereotaxic coordinatespace. Orthogonal planar views from the in vivo whole-brain atlas (2.2 mm resolution) andcorresponding sections through the constructed brainstem atlas (0.225 mm resolution) areshown for comparison of anatomical details. Red, green and blue in the DEC maps representanisotropy orientation along the medial-lateral, anterior-posterior, and superior-inferior axes,respectively. All scales are in units of mm.
Aggarwal et al. Page 20
Neuroimage. Author manuscript; available in PMC 2014 July 01.
NIH
-PA Author Manuscript
NIH
-PA Author Manuscript
NIH
-PA Author Manuscript