Facile combustion synthesis of ZnO nanoparticles using Cajanus cajan (L.) and its multidisciplinary...
10
Facile combustion synthesis of ZnO nanoparticles using Cajanus cajan (L.) and its multidisciplinary applications K. Manjunath a , T.N. Ravishankar a , Dhanith Kumar b , Priyanka K.P c , Thomas Varghese c , H.Raja Naika d , H. Nagabhushana e , S.C. Sharma f , J. Dupont g , T. Ramakrishnappa a , G. Nagaraju b, * a Centre for Nano and Material Sciences, Jain University, Jakkasandra, Kanakapura Talluk, India b Department of Chemistry, B.M.S. Instsitute of Technology, Yelahanka, Bangalore, India c Nanoscience Research Centre, Department of Physics, Nirmala College, Muvattupuzha, Kerala, India d Department of Studies and Research in Environmental Science, Tumkur University, Tumkur, India e CNR Rao Center for Advanced Materials, Tumkur University, Tumkur, India f Chattisgarh Swami Vivekananda Technical University, Bhilai, India g Institute of Chemistry, Laboratory of Molecular Catalysis, UFRGS, Porto Alegre, Brazil A R T I C L E I N F O Article history: Received 26 December 2013 Received in revised form 4 June 2014 Accepted 10 June 2014 Available online 12 June 2014 Keywords: A. Semiconductors B. Chemical synthesis C. X-ray diffraction D. Catalytic properties D. Dielectric properties A B S T R A C T Zinc oxide nanoparticles (ZnO Nps) were successfully synthesized by solution combustion method (SCM) using pigeon pea as a fuel for the first time. X-Ray diffraction pattern reveals that the product belongs to hexagonal system. FTIR spectrum of ZnO Nps shows the band at 420 cm 1 associated with the characteristic vibration of Zn–O. TEM images show that the nanoparticles are found to be 40–80 nm. Furthermore, the as-prepared ZnO Nps exhibits good photocatalytic activity for the photodegradation of methylene blue (MB), indicating that they are indeed a promising photocatalytic semiconductor. The antibacterial properties of ZnO nanopowders were investigated by their bactericidal activity against four bacterial strains. ã 2014 Elsevier Ltd. All rights reserved. 1. Introduction In recent years, nanomaterials have been extensively studied because of their interesting physical and chemical properties compared to their bulk materials [1]. Amongst nanomaterials of transition metal oxides, ZnO is considered as an important material for a variety of applications including optical, electrical, electro- chemical sensing, magnetic, catalytic properties and biological properties. These properties make ZnO a multifunctional material that finds applications in field effect transistors, biosensors, light emitting diodes, diluted and ferromagnetic material for spinc- tronics solar cells, photocatalysts and antibacterial activity etc. [2]. Dopamine is one of the important catecholamine neurotransmit- ters present in the mammalian central nervous system in the presence of several other substances including ascorbic acid (AA), uric acid (UA), which plays an important role in the nervous system [3].Therefore we have opted dopamine as a model system to check the applicability of the synthesized ZnO nanoparticles as an electrochemical sensor. ZnO is a well known n-type wide band gap oxide semiconductor (3.37 eV) with high exciton binding energy (60 m eV) [4,5]. It is one of the ‘hardest’ materials in the II–VI compound family. As a result, ZnO devices do not suffer from dislocation degradation during operation [6]. ZnO has various kinds of nanostructures such as nanoneedles, nanobelts, nano- flowers, nanorods, nanobows, nanonails, nanoparticles and nano- wires [7,8]. Various methods have been employed by several workers to synthesize ZnO nano/micro-crystals such as solvo- thermal, hydrothermal, direct precipitation, sol-gel and so on [9– 16]. Most of these methods require expensive substrates, tedious procedures, sophisticated equipments, longer experimental dura- tion and rigorous experimental conditions. Solution combustion synthesis (SCS) is an adaptation of a simple and easier synthesis approach bestowed with time and energy saving prospect. In this direction, combustion method is preferred as it ensures uniform distribution and atomic level mixing of reactants with a combustible fuel to produce phase pure * Corresponding author at: BMS Institute of Technology, Department of Chemistry, Avalahalli, Yelahanka, Bangalore 560 064, India. Tel.: +91 80 28561576; fax: +91 80 28567186. E-mail address: [email protected] (G. Nagaraju). http://dx.doi.org/10.1016/j.materresbull.2014.06.010 0025-5408/ ã 2014 Elsevier Ltd. All rights reserved. Materials Research Bulletin 57 (2014) 325–334 Contents lists available at ScienceDirect Materials Research Bulletin journal homepage: www.else vie r.com/locat e/mat resbu
-
Upload
independent -
Category
Documents
-
view
0 -
download
0
Transcript of Facile combustion synthesis of ZnO nanoparticles using Cajanus cajan (L.) and its multidisciplinary...
Materials Research Bulletin 57 (2014) 325–334
Facile combustion synthesis of ZnO nanoparticles using Cajanus cajan(L.) and its multidisciplinary applications
K. Manjunath a, T.N. Ravishankar a, Dhanith Kumar b, Priyanka K.P c, Thomas Varghese c,H.Raja Naika d, H. Nagabhushana e, S.C. Sharma f, J. Dupont g, T. Ramakrishnappa a,G. Nagaraju b,*aCentre for Nano and Material Sciences, Jain University, Jakkasandra, Kanakapura Talluk, IndiabDepartment of Chemistry, B.M.S. Instsitute of Technology, Yelahanka, Bangalore, IndiacNanoscience Research Centre, Department of Physics, Nirmala College, Muvattupuzha, Kerala, IndiadDepartment of Studies and Research in Environmental Science, Tumkur University, Tumkur, IndiaeCNR Rao Center for Advanced Materials, Tumkur University, Tumkur, IndiafChattisgarh Swami Vivekananda Technical University, Bhilai, Indiag Institute of Chemistry, Laboratory of Molecular Catalysis, UFRGS, Porto Alegre, Brazil
A R T I C L E I N F O
Article history:Received 26 December 2013Received in revised form 4 June 2014Accepted 10 June 2014Available online 12 June 2014
Keywords:A. SemiconductorsB. Chemical synthesisC. X-ray diffractionD. Catalytic propertiesD. Dielectric properties
A B S T R A C T
Zinc oxide nanoparticles (ZnO Nps) were successfully synthesized by solution combustion method (SCM)using pigeon pea as a fuel for the first time. X-Ray diffraction pattern reveals that the product belongs tohexagonal system. FTIR spectrum of ZnO Nps shows the band at 420 cm�1 associated with thecharacteristic vibration of Zn–O. TEM images show that the nanoparticles are found to be �40–80 nm.Furthermore, the as-prepared ZnO Nps exhibits good photocatalytic activity for the photodegradation ofmethylene blue (MB), indicating that they are indeed a promising photocatalytic semiconductor. Theantibacterial properties of ZnO nanopowders were investigated by their bactericidal activity against fourbacterial strains.
ã 2014 Elsevier Ltd. All rights reserved.
Contents lists available at ScienceDirect
Materials Research Bulletin
journal homepage: www.else vie r .com/ locat e/mat resbu
1. Introduction
In recent years, nanomaterials have been extensively studiedbecause of their interesting physical and chemical propertiescompared to their bulk materials [1]. Amongst nanomaterials oftransition metal oxides, ZnO is considered as an important materialfor a variety of applications including optical, electrical, electro-chemical sensing, magnetic, catalytic properties and biologicalproperties. These properties make ZnO a multifunctional materialthat finds applications in field effect transistors, biosensors, lightemitting diodes, diluted and ferromagnetic material for spinc-tronics solar cells, photocatalysts and antibacterial activity etc. [2].Dopamine is one of the important catecholamine neurotransmit-ters present in the mammalian central nervous system in thepresence of several other substances including ascorbic acid (AA),
* Corresponding author at: BMS Institute of Technology, Department ofChemistry, Avalahalli, Yelahanka, Bangalore 560 064, India. Tel.: +91 8028561576; fax: +91 80 28567186.
E-mail address: [email protected] (G. Nagaraju).
http://dx.doi.org/10.1016/j.materresbull.2014.06.0100025-5408/ã 2014 Elsevier Ltd. All rights reserved.
uric acid (UA), which plays an important role in the nervous system[3].Therefore we have opted dopamine as a model system to checkthe applicability of the synthesized ZnO nanoparticles as anelectrochemical sensor. ZnO is a well known n-type wide band gapoxide semiconductor (�3.37 eV) with high exciton binding energy(60 m eV) [4,5]. It is one of the ‘hardest’ materials in the II–VIcompound family. As a result, ZnO devices do not suffer fromdislocation degradation during operation [6]. ZnO has variouskinds of nanostructures such as nanoneedles, nanobelts, nano-flowers, nanorods, nanobows, nanonails, nanoparticles and nano-wires [7,8]. Various methods have been employed by severalworkers to synthesize ZnO nano/micro-crystals such as solvo-thermal, hydrothermal, direct precipitation, sol-gel and so on [9–16]. Most of these methods require expensive substrates, tediousprocedures, sophisticated equipments, longer experimental dura-tion and rigorous experimental conditions.
Solution combustion synthesis (SCS) is an adaptation of asimple and easier synthesis approach bestowed with time andenergy saving prospect. In this direction, combustion method ispreferred as it ensures uniform distribution and atomic levelmixing of reactants with a combustible fuel to produce phase pure
326 K. Manjunath et al. / Materials Research Bulletin 57 (2014) 325–334
final product in the form of ultrafine powder with reduced particlesize. Again, the role of combustible fuel is very important as it isresponsible for the liberation of energy to produce fluffy mass incombustion method. It involves an aqueous mixture containingsuitable metal salts as the precursor and a proper sacrificial fuelacting as a reducing agent. Generally, metal nitrates are preferredto other salts due to their solubility, thus giving a highlyhomogeneous solution. SCS method is an exothermic redoxreaction between metal nitrates (oxidizer agents) and anappropriate fuel (reducing agent) and had been successfully usedto synthesize nanocrystalline metal oxides [17–19]. Manyresearchers have used commercially available carbohydrates andamines as a fuel to prepare ZnO [20,21]. Sumana et al. [20] havesynthesized ZnO nanopowders using sugar as a fuel. Rasouli et al.[21] have used urea as a fuel to prepare nanocrystalline ZnO.
Quite different from the conventional approaches people haveused naturally occurring compounds as a combustible fuel for thepreparation of nanocrystalline metal oxides. For.eg. Kalyani andco-workers [22,23] synthesized LiCoO2, LiMn2O4 and LiNiVO4
using rice-starch as fuel. Gangulibabu et al. [24] used corn-starchas a fuel to synthesize LiMnxCoyNizO2. They observed thatcombustible product shows good performance than sol–gelderived products.
We are the first to report the synthesis of nanocrystalline ZnOvia combustible method using pigeon pea (Cajanus cajan) as fuel.Pigeon pea belongs to Fabaceae family that could play an importantrole as a combustible fuel. It contains high levels of protein andsome important amino acids like metheonine, lysine and trypto-phan. Glycine, an amino acid that falls under the category ofstandard amino acid has been used as a fuel for combustionmethod for the synthesis of many metal oxides [25,26]. By takingthis into an account a novel attempt to exploit naturally occurringpigeon pea as fuel has been proposed to synthesize ZnO Nps. Thisprocess involves a self sustained reaction in homogeneous solutionof zinc nitrates as an oxidizer and pigeon pea as a fuel.
2. Experimental
In this method 1:1 weight ratio of zinc nitrate and pigeon peaground powder were dissolved in double distilled water withstirring for 10 min to get a homogeneous solution. The solution washeated at 120 �C for 1 h to get a foamy mass. The foamy mass wasintroduced in to pre-heated muffle furnace at 300 �C. Smolderingof the gel was observed and within 3–4 min the reaction precededto completion, finally nanocrystalline ZnO was obtained. Theobtained product was subjected to calcination at 400 �C for 2 h toremove the impurities and finally milky-white ZnO Nps wereobtained.
2.1. Characterization
Powder X-ray diffraction data recorded on Philip's X'pert PROX-ray diffractometer with graphite monochromatized Cu-Ka(1.5418 Å) radiation. The Fourier transform infrared spectrum ofthe sample was collected using Bruker Alpha-P spectrometer. Theabsorption spectrum of the sample was measured on a ShimadzuUV-1800 UV–vis spectrophotometer. Photoluminescence studieswere carried-out on a PerkinElmer LS-55 luminescence spec-trometer using Xe-lamp with excitation wavelength of 350 nm atroom temperature. The surface morphology was performed byCarl Zeiss Ultra 55. Cyclic voltammetry experiments wereperformed using CH Instruments electrochemical work station(Model CHI 619B, CH Instruments, TX, USA) in a standard threeelectrode cell. A glassy carbon electrode as a working electrode, Ptwire as the counter electrode and Ag/AgCl served as the referenceelectrode.
2.2. Photocatalytic activity
Photocatalytic experiments were carried out in a 150 � 75 mmbatch reactor. A catalytic load of 0.1 g in 100 mL of the dye wasprepared by adjusting the pH of the solution by addition of either0.5 M NaOH or 0.5 M H2SO4. The slurry composed of dye solutionand catalyst was placed in the reactor and stirred magnetically foragitation with simultaneous exposure to sun light or UV rays.Known volume of the slurry was withdrawn at specific interval oftime, centrifuged to remove the interference of the catalyst andassessed using spectrophotometer (665 nm) for rate of degrada-tion. The % of degradation of the dye can be determined using thefollowing formula.
%ofdegradation ¼ Ci � Cf
Ci� 100
Ci and Cf are the initial and final dye concentrations respectively.The experiment was carried out by varying various pararmeterslike concentration of dye, catalytic load, irradiation time, and pH.
2.3. Evaluation of antibacterial activity
Antibacterial activity was screened by agar well diffusionmethod [27] and broth micro-dilution method [28,29] against aGram –ve bacteria Klebsiella aerogenesNCIM-2098, Escherichia coliNCIM-5051, Pseudomonas aeruginosa NCIM-2242 and Gram +vebacteria Staphylococcus aureusNCIM-5022. Nutrient agar plateswere prepared under sterile condition and spread plate methodwas done using sterile L-shaped glass rod with 100 mL of 24 h oldbroth culture of respective bacterial strains. Using the sterile corkborer, the well (6 mm) was made into the each Petri-plate. Variousconcentrations of ZnO NPs (500, 750 and 1000 mg/well) were usedto assess the dose dependent activity of the compounds. Thecompounds were prepared in sterile water added into the wells byusing sterile micropipettes. Simultaneously the standard anti-biotics (as positive control) were tested against the pathogens.Ciprofloxacin (Hi Media, India) was used as positive control. Thenthe plates were incubated at 37 �C for 36 h. After the incubationperiod, the zone of inhibition of each well was measured and thevalues were noted. Triplicates were maintained in each compoundand the average values were calculated for the eventualantibacterial activity.
The broth micro-dilution method also performed for antibac-terial activity. The nanomaterial (ZnO) was diluted with sterilewater to get two different concentrations of the sample solutions(i.e. 200 and 400 mg/mL). Then these sample solutions were addedinto sterile tubes containing nutrient broth and 0.1 mL of bacterialsuspension (�108 CFU/mL) was added into each tube. In addition,positive control tubes containing the same amount of bacterial celland nutrient broth and negative control tubes containing onlynutrient broth were prepared, respectively. All the tubes wereincubated in a reciprocal shaker (Tarson, Mumbai) with a shakingspeed of about 200 rpm at 37 �C for 24 h. The MIC was determinedas the minimum concentration at which there is no visible changein the turbidity of the medium. To evaluate the bactericidal efficacyof the samples, 0.025 mL each of the bacterial solution with 200and 400 mg/mL samples were taken and plated in sterile nutrientagar plates. Then the plates were incubated at 37 �C for another24 h and the number of bacterial colonies were counted. Thebactericidal rate (K) could be calculated according to the followingequation [30].
K ¼ A � BB
� 100
where A and B are the number of bacterial colonies correspondingto the positive control group and the sample group, respectively.
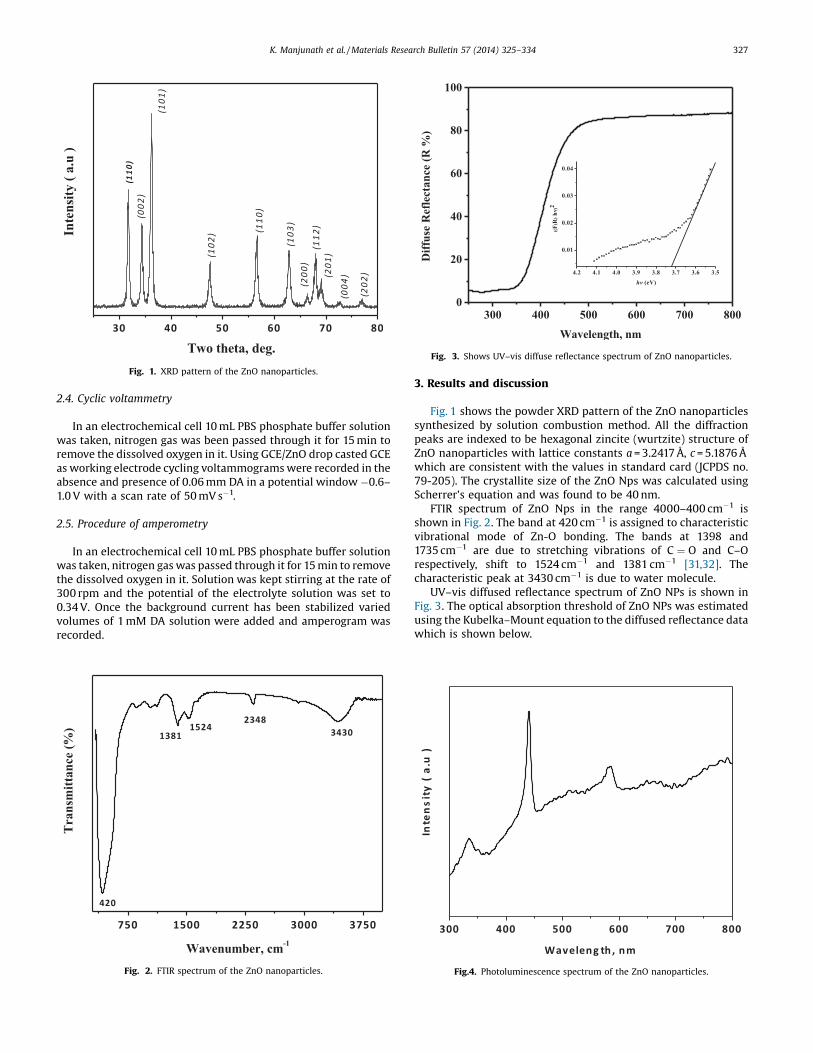
Fig. 1. XRD pattern of the ZnO nanoparticles.
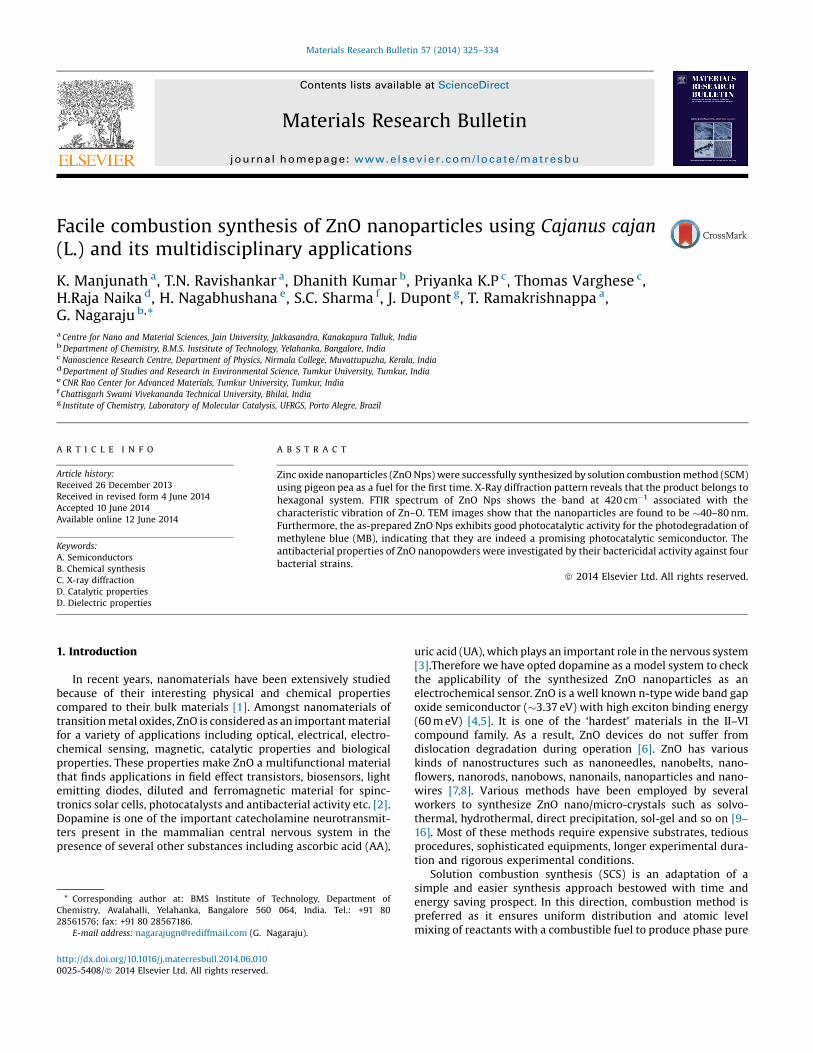
Fig. 3. Shows UV–vis diffuse reflectance spectrum of ZnO nanoparticles.
K. Manjunath et al. / Materials Research Bulletin 57 (2014) 325–334 327
2.4. Cyclic voltammetry
In an electrochemical cell 10 mL PBS phosphate buffer solutionwas taken, nitrogen gas was been passed through it for 15 min toremove the dissolved oxygen in it. Using GCE/ZnO drop casted GCEas working electrode cycling voltammograms were recorded in theabsence and presence of 0.06 mm DA in a potential window �0.6–1.0 V with a scan rate of 50 mV s�1.
2.5. Procedure of amperometry
In an electrochemical cell 10 mL PBS phosphate buffer solutionwas taken, nitrogen gas was passed through it for 15 min to removethe dissolved oxygen in it. Solution was kept stirring at the rate of300 rpm and the potential of the electrolyte solution was set to0.34 V. Once the background current has been stabilized variedvolumes of 1 mM DA solution were added and amperogram wasrecorded.
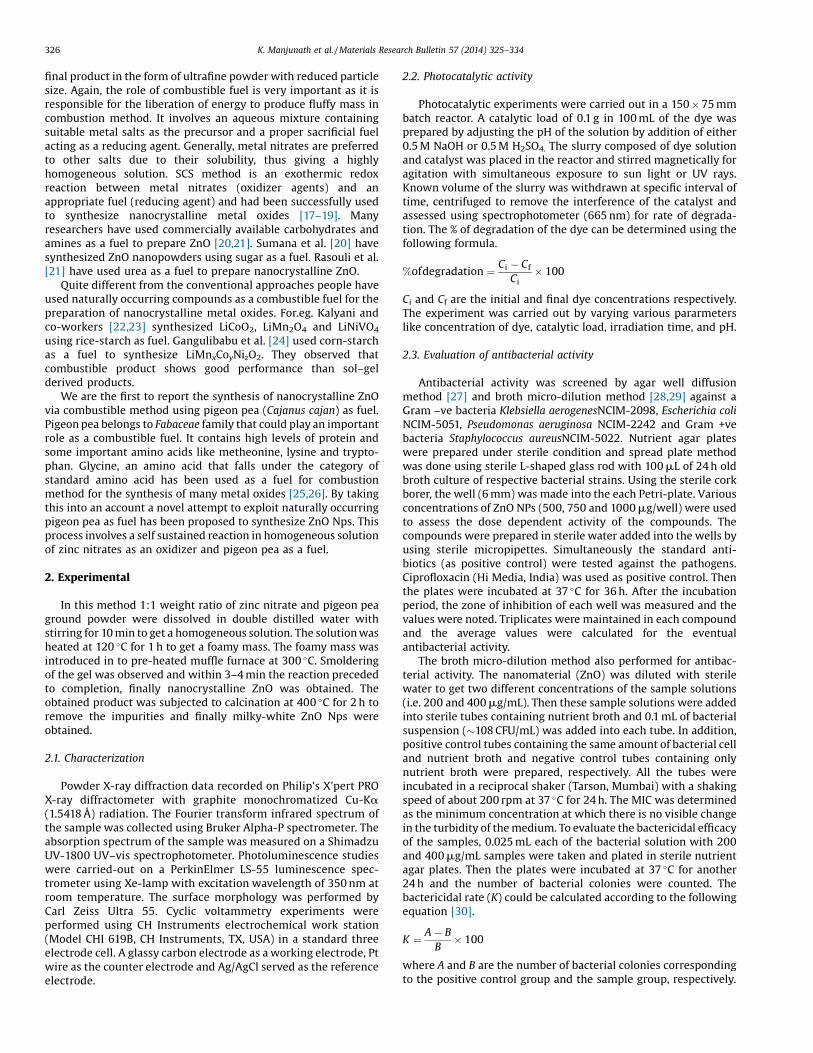
Fig. 2. FTIR spectrum of the ZnO nanoparticles.
3. Results and discussion
Fig. 1 shows the powder XRD pattern of the ZnO nanoparticlessynthesized by solution combustion method. All the diffractionpeaks are indexed to be hexagonal zincite (wurtzite) structure ofZnO nanoparticles with lattice constants a = 3.2417 Å, c = 5.1876 Åwhich are consistent with the values in standard card (JCPDS no.79-205). The crystallite size of the ZnO Nps was calculated usingScherrer’s equation and was found to be 40 nm.
FTIR spectrum of ZnO Nps in the range 4000–400 cm�1 isshown in Fig. 2. The band at 420 cm�1 is assigned to characteristicvibrational mode of Zn-O bonding. The bands at 1398 and1735 cm�1 are due to stretching vibrations of C ¼ O and C–Orespectively, shift to 1524 cm�1 and 1381 cm�1 [31,32]. Thecharacteristic peak at 3430 cm�1 is due to water molecule.
UV–vis diffused reflectance spectrum of ZnO NPs is shown inFig. 3. The optical absorption threshold of ZnO NPs was estimatedusing the Kubelka–Mount equation to the diffused reflectance datawhich is shown below.
Fig.4. Photoluminescence spectrum of the ZnO nanoparticles.
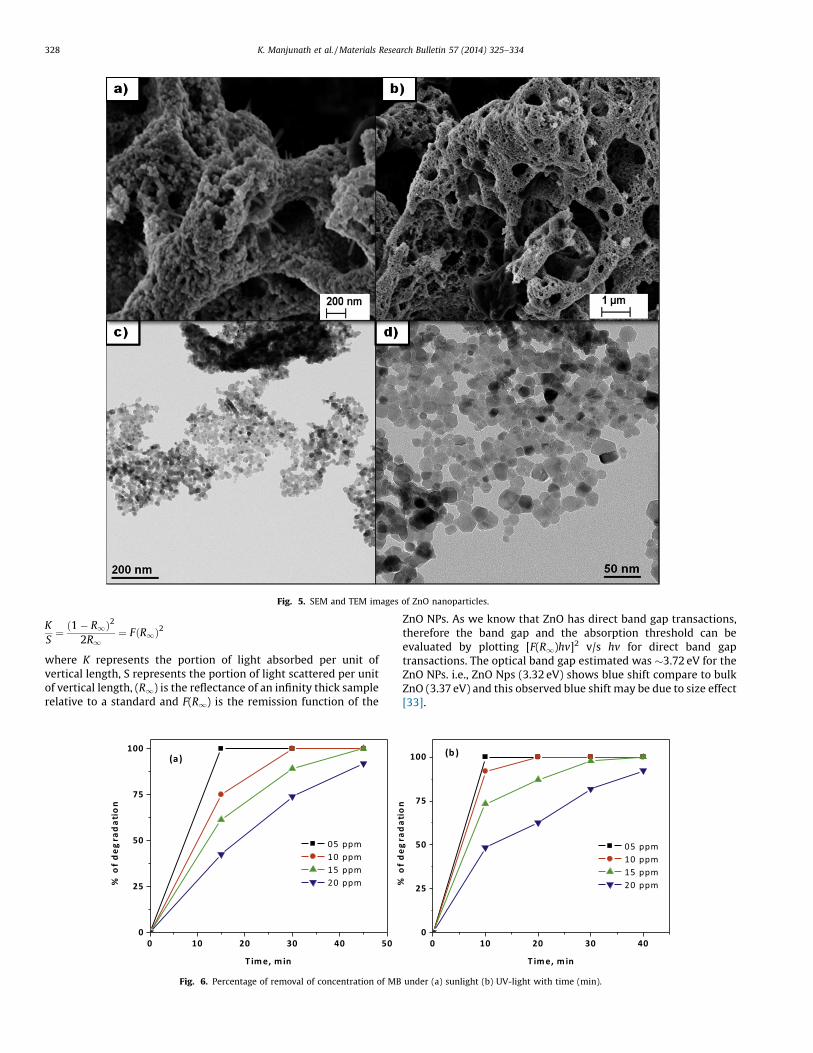
Fig. 5. SEM and TEM images of ZnO nanoparticles.
328 K. Manjunath et al. / Materials Research Bulletin 57 (2014) 325–334
KS¼ 1 � R1ð Þ2
2R1¼ F R1ð Þ2
where K represents the portion of light absorbed per unit ofvertical length, S represents the portion of light scattered per unitof vertical length, (R1) is the reflectance of an infinity thick samplerelative to a standard and F(R1) is the remission function of the
Fig. 6. Percentage of removal of concentration of MB
ZnO NPs. As we know that ZnO has direct band gap transactions,therefore the band gap and the absorption threshold can beevaluated by plotting [F(R1)hv]2 v/s hv for direct band gaptransactions. The optical band gap estimated was �3.72 eV for theZnO NPs. i.e., ZnO Nps (3.32 eV) shows blue shift compare to bulkZnO (3.37 eV) and this observed blue shift may be due to size effect[33].
under (a) sunlight (b) UV-light with time (min).
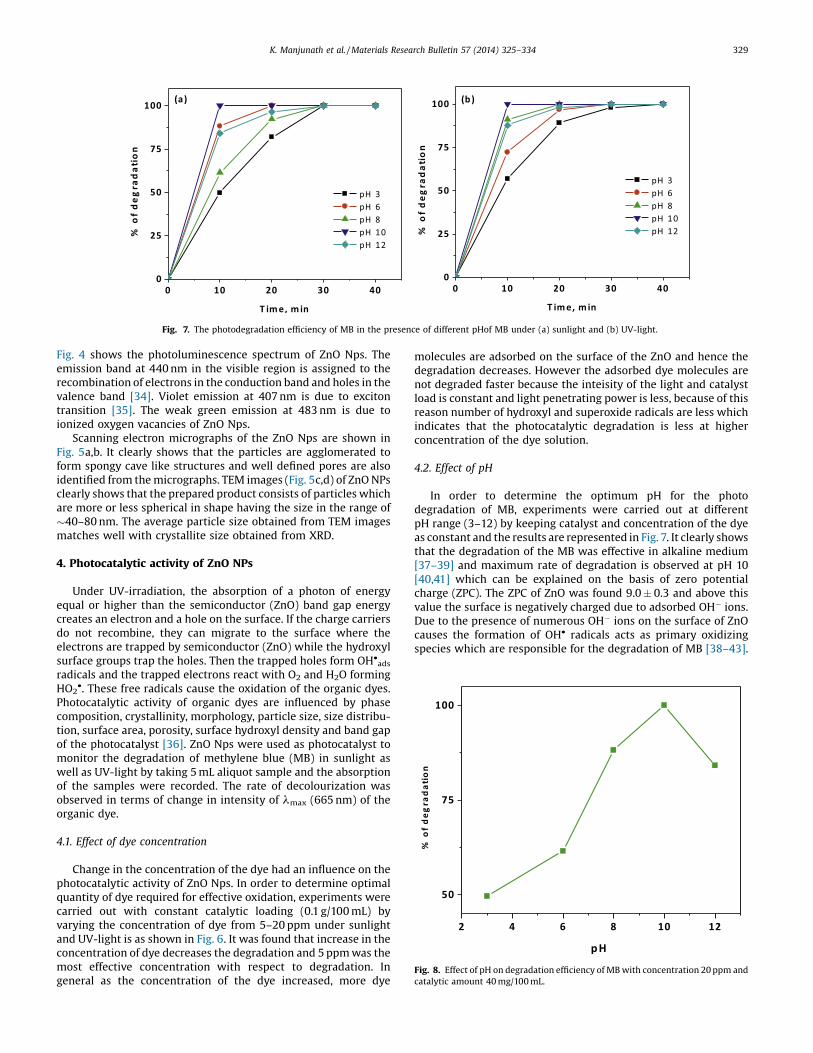
Fig. 7. The photodegradation efficiency of MB in the presence of different pHof MB under (a) sunlight and (b) UV-light.
Fig. 8. Effect of pH on degradation efficiency of MB with concentration 20 ppm andcatalytic amount 40 mg/100 mL.
K. Manjunath et al. / Materials Research Bulletin 57 (2014) 325–334 329
Fig. 4 shows the photoluminescence spectrum of ZnO Nps. Theemission band at 440 nm in the visible region is assigned to therecombination of electrons in the conduction band and holes in thevalence band [34]. Violet emission at 407 nm is due to excitontransition [35]. The weak green emission at 483 nm is due toionized oxygen vacancies of ZnO Nps.
Scanning electron micrographs of the ZnO Nps are shown inFig. 5a,b. It clearly shows that the particles are agglomerated toform spongy cave like structures and well defined pores are alsoidentified from the micrographs. TEM images (Fig. 5c,d) of ZnO NPsclearly shows that the prepared product consists of particles whichare more or less spherical in shape having the size in the range of�40–80 nm. The average particle size obtained from TEM imagesmatches well with crystallite size obtained from XRD.
4. Photocatalytic activity of ZnO NPs
Under UV-irradiation, the absorption of a photon of energyequal or higher than the semiconductor (ZnO) band gap energycreates an electron and a hole on the surface. If the charge carriersdo not recombine, they can migrate to the surface where theelectrons are trapped by semiconductor (ZnO) while the hydroxylsurface groups trap the holes. Then the trapped holes form OH�
ads
radicals and the trapped electrons react with O2 and H2O formingHO2
�. These free radicals cause the oxidation of the organic dyes.Photocatalytic activity of organic dyes are influenced by phasecomposition, crystallinity, morphology, particle size, size distribu-tion, surface area, porosity, surface hydroxyl density and band gapof the photocatalyst [36]. ZnO Nps were used as photocatalyst tomonitor the degradation of methylene blue (MB) in sunlight aswell as UV-light by taking 5 mL aliquot sample and the absorptionof the samples were recorded. The rate of decolourization wasobserved in terms of change in intensity of lmax (665 nm) of theorganic dye.
4.1. Effect of dye concentration
Change in the concentration of the dye had an influence on thephotocatalytic activity of ZnO Nps. In order to determine optimalquantity of dye required for effective oxidation, experiments werecarried out with constant catalytic loading (0.1 g/100 mL) byvarying the concentration of dye from 5–20 ppm under sunlightand UV-light is as shown in Fig. 6. It was found that increase in theconcentration of dye decreases the degradation and 5 ppm was themost effective concentration with respect to degradation. Ingeneral as the concentration of the dye increased, more dye
molecules are adsorbed on the surface of the ZnO and hence thedegradation decreases. However the adsorbed dye molecules arenot degraded faster because the inteisity of the light and catalystload is constant and light penetrating power is less, because of thisreason number of hydroxyl and superoxide radicals are less whichindicates that the photocatalytic degradation is less at higherconcentration of the dye solution.
4.2. Effect of pH
In order to determine the optimum pH for the photodegradation of MB, experiments were carried out at differentpH range (3–12) by keeping catalyst and concentration of the dyeas constant and the results are represented in Fig. 7. It clearly showsthat the degradation of the MB was effective in alkaline medium[37–39] and maximum rate of degradation is observed at pH 10[40,41] which can be explained on the basis of zero potentialcharge (ZPC). The ZPC of ZnO was found 9.0 � 0.3 and above thisvalue the surface is negatively charged due to adsorbed OH� ions.Due to the presence of numerous OH� ions on the surface of ZnOcauses the formation of OH� radicals acts as primary oxidizingspecies which are responsible for the degradation of MB [38–43].
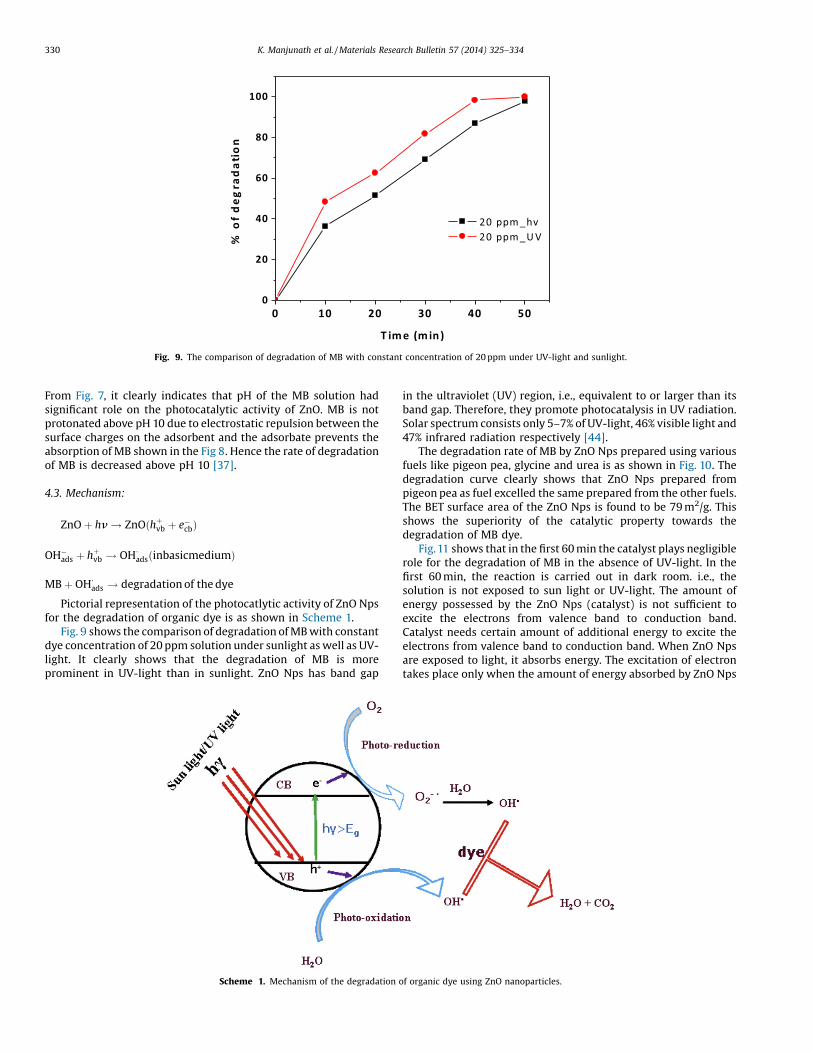
Fig. 9. The comparison of degradation of MB with constant concentration of 20 ppm under UV-light and sunlight.
330 K. Manjunath et al. / Materials Research Bulletin 57 (2014) 325–334
From Fig. 7, it clearly indicates that pH of the MB solution hadsignificant role on the photocatalytic activity of ZnO. MB is notprotonated above pH 10 due to electrostatic repulsion between thesurface charges on the adsorbent and the adsorbate prevents theabsorption of MB shown in the Fig 8. Hence the rate of degradationof MB is decreased above pH 10 [37].
4.3. Mechanism:
ZnO þ hn ! ZnOðhþvb þ e�cbÞ
OH�ads þ hþ
vb ! OH�adsðinbasicmediumÞ
MB þ OH�ads ! degradation of the dye
Pictorial representation of the photocatlytic activity of ZnO Npsfor the degradation of organic dye is as shown in Scheme 1.
Fig. 9 shows the comparison of degradation of MB with constantdye concentration of 20 ppm solution under sunlight as well as UV-light. It clearly shows that the degradation of MB is moreprominent in UV-light than in sunlight. ZnO Nps has band gap
Scheme 1. Mechanism of the degradation o
in the ultraviolet (UV) region, i.e., equivalent to or larger than itsband gap. Therefore, they promote photocatalysis in UV radiation.Solar spectrum consists only 5–7% of UV-light, 46% visible light and47% infrared radiation respectively [44].
The degradation rate of MB by ZnO Nps prepared using variousfuels like pigeon pea, glycine and urea is as shown in Fig. 10. Thedegradation curve clearly shows that ZnO Nps prepared frompigeon pea as fuel excelled the same prepared from the other fuels.The BET surface area of the ZnO Nps is found to be 79 m2/g. Thisshows the superiority of the catalytic property towards thedegradation of MB dye.
Fig.11 shows that in the first 60 min the catalyst plays negligiblerole for the degradation of MB in the absence of UV-light. In thefirst 60 min, the reaction is carried out in dark room. i.e., thesolution is not exposed to sun light or UV-light. The amount ofenergy possessed by the ZnO Nps (catalyst) is not sufficient toexcite the electrons from valence band to conduction band.Catalyst needs certain amount of additional energy to excite theelectrons from valence band to conduction band. When ZnO Npsare exposed to light, it absorbs energy. The excitation of electrontakes place only when the amount of energy absorbed by ZnO Nps
f organic dye using ZnO nanoparticles.
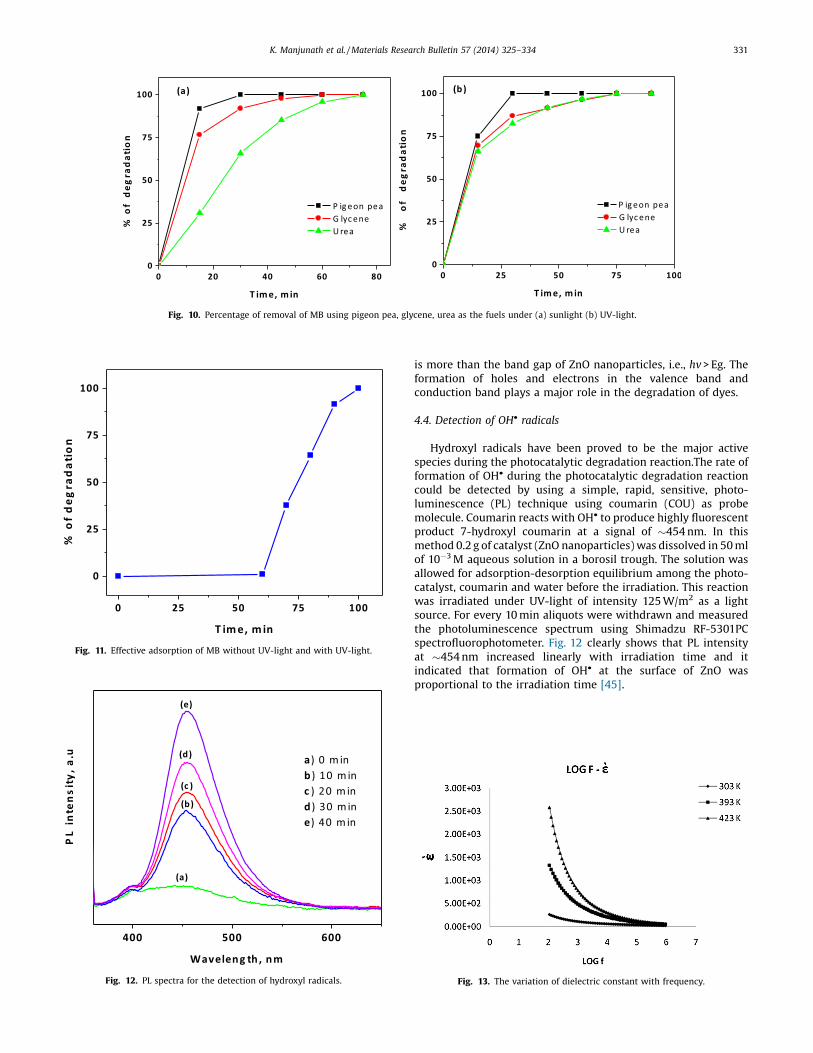
Fig. 10. Percentage of removal of MB using pigeon pea, glycene, urea as the fuels under (a) sunlight (b) UV-light.
Fig. 11. Effective adsorption of MB without UV-light and with UV-light.
Fig. 12. PL spectra for the detection of hydroxyl radicals.
K. Manjunath et al. / Materials Research Bulletin 57 (2014) 325–334 331
is more than the band gap of ZnO nanoparticles, i.e., hv > Eg. Theformation of holes and electrons in the valence band andconduction band plays a major role in the degradation of dyes.
4.4. Detection of OH� radicals
Hydroxyl radicals have been proved to be the major activespecies during the photocatalytic degradation reaction.The rate offormation of OH� during the photocatalytic degradation reactioncould be detected by using a simple, rapid, sensitive, photo-luminescence (PL) technique using coumarin (COU) as probemolecule. Coumarin reacts with OH� to produce highly fluorescentproduct 7-hydroxyl coumarin at a signal of �454 nm. In thismethod 0.2 g of catalyst (ZnO nanoparticles) was dissolved in 50 mlof 10�3M aqueous solution in a borosil trough. The solution wasallowed for adsorption-desorption equilibrium among the photo-catalyst, coumarin and water before the irradiation. This reactionwas irradiated under UV-light of intensity 125 W/m2 as a lightsource. For every 10 min aliquots were withdrawn and measuredthe photoluminescence spectrum using Shimadzu RF-5301PCspectrofluorophotometer. Fig. 12 clearly shows that PL intensityat �454 nm increased linearly with irradiation time and itindicated that formation of OH� at the surface of ZnO wasproportional to the irradiation time [45].
Fig. 13. The variation of dielectric constant with frequency.

Fig. 14. The variation of tand of sample as a function of frequency andtemperature.
Fig. 15. The variation of ac electrical conductivity as a function of frequency.
Fig. 16. Representative photograph showing antibacterial activity in broth dilutionmethod (A: negative control: B: positive control; C: Staphylococcus aureus treatedwith 200 mg/mL ZnO; D: Staphylococcus aureus treated with 400 mg/mL ZnO).
Fig.17. Representative photograph showing antibacterial activity in broth dilutionmethod (A: negative control: B: positive control; C: Klebsiella aerogenes treated with200 mg/ml ZnO; D: Klebsiella aerogenes treated with 400 mg/mL ZnO).
332 K. Manjunath et al. / Materials Research Bulletin 57 (2014) 325–334
5. Dielectric studies of ZnO nanoparticles
5.1. Variation of dielectric constant
Fig.13 shows the variation of dielectric constant with frequencyfrom 303 K to 423 K of sample. It can be seen that the real part ofdielectric constant e0 for all temperatures has high values at lowfrequencies which decreases rapidly as frequency increases andattains a constant value at higher frequencies.In dielectricnanostructured materials, interfaces with large volume fractionscontain a large number of defects, such as dangling bonds,vacancies, vacancy clusters, and microporosities, which can cause achange of positive and negative space charge distribution ininterfaces. When subjected to an electric field these space chargesmove. When they are trapped by defects, a lot of dipole momentsare formed. At low frequency region these dipole moments areeasy to follow the variation of electric field [46,47]. So the dielectricloss and hence the dielectric constant shows large values at lowfrequency. As temperature is increased more and more dipoles areoriented, resulting in an increase in the value of dielectric constantfor a given value of frequency [48]. At very high frequencies (MHz)region the charge carriers would have started to move before the
Fig. 18. Representative photograph showing antibacterial activity in agar welldiffusionmethod (A: Gram –ve bacteria Klebsiella aerogenes with the concentration500, 750 and 1000 mg per well: B: Gram +ve bacteria Staphylococcus aureus withtheconcentration 500, 750 and 1000 mg per well).
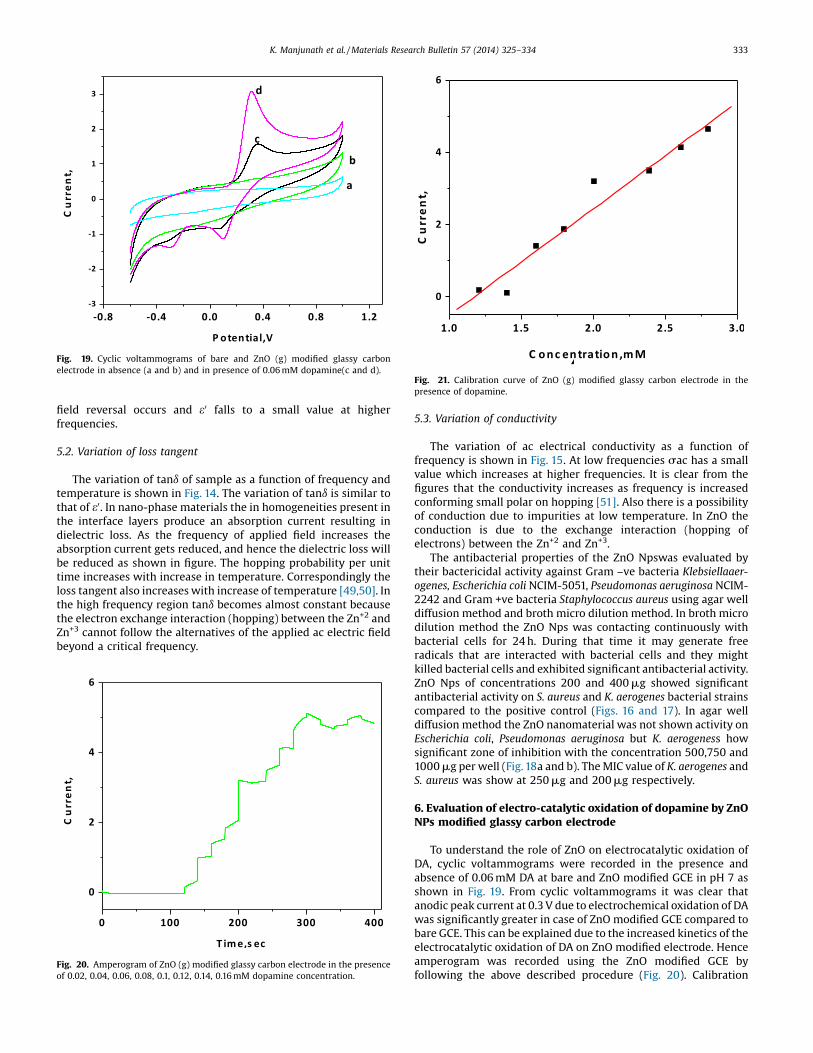
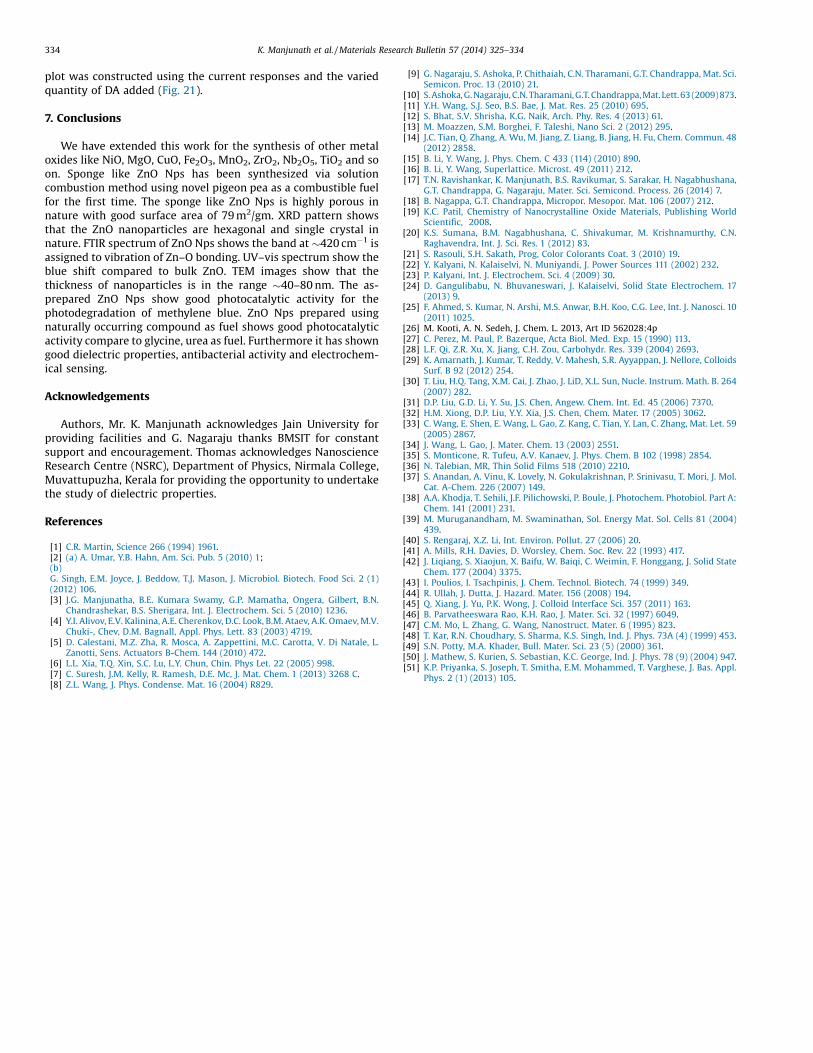
Fig. 21. Calibration curve of ZnO (g) modified glassy carbon electrode in thepresence of dopamine.
Fig. 19. Cyclic voltammograms of bare and ZnO (g) modified glassy carbonelectrode in absence (a and b) and in presence of 0.06 mM dopamine(c and d).
K. Manjunath et al. / Materials Research Bulletin 57 (2014) 325–334 333
field reversal occurs and e0 falls to a small value at higherfrequencies.
5.2. Variation of loss tangent
The variation of tand of sample as a function of frequency andtemperature is shown in Fig. 14. The variation of tand is similar tothat of e0. In nano-phase materials the in homogeneities present inthe interface layers produce an absorption current resulting indielectric loss. As the frequency of applied field increases theabsorption current gets reduced, and hence the dielectric loss willbe reduced as shown in figure. The hopping probability per unittime increases with increase in temperature. Correspondingly theloss tangent also increases with increase of temperature [49,50]. Inthe high frequency region tand becomes almost constant becausethe electron exchange interaction (hopping) between the Zn+2 andZn+3 cannot follow the alternatives of the applied ac electric fieldbeyond a critical frequency.
Fig. 20. Amperogram of ZnO (g) modified glassy carbon electrode in the presenceof 0.02, 0.04, 0.06, 0.08, 0.1, 0.12, 0.14, 0.16 mM dopamine concentration.
5.3. Variation of conductivity
The variation of ac electrical conductivity as a function offrequency is shown in Fig. 15. At low frequencies sac has a smallvalue which increases at higher frequencies. It is clear from thefigures that the conductivity increases as frequency is increasedconforming small polar on hopping [51]. Also there is a possibilityof conduction due to impurities at low temperature. In ZnO theconduction is due to the exchange interaction (hopping ofelectrons) between the Zn+2 and Zn+3.
The antibacterial properties of the ZnO Npswas evaluated bytheir bactericidal activity against Gram –ve bacteria Klebsiellaaer-ogenes, Escherichia coli NCIM-5051, Pseudomonas aeruginosa NCIM-2242 and Gram +ve bacteria Staphylococcus aureus using agar welldiffusion method and broth micro dilution method. In broth microdilution method the ZnO Nps was contacting continuously withbacterial cells for 24 h. During that time it may generate freeradicals that are interacted with bacterial cells and they mightkilled bacterial cells and exhibited significant antibacterial activity.ZnO Nps of concentrations 200 and 400 mg showed significantantibacterial activity on S. aureus and K. aerogenes bacterial strainscompared to the positive control (Figs. 16 and 17). In agar welldiffusion method the ZnO nanomaterial was not shown activity onEscherichia coli, Pseudomonas aeruginosa but K. aerogeness howsignificant zone of inhibition with the concentration 500,750 and1000 mg per well (Fig. 18a and b). The MIC value of K. aerogenes andS. aureus was show at 250 mg and 200 mg respectively.
6. Evaluation of electro-catalytic oxidation of dopamine by ZnONPs modified glassy carbon electrode
To understand the role of ZnO on electrocatalytic oxidation ofDA, cyclic voltammograms were recorded in the presence andabsence of 0.06 mM DA at bare and ZnO modified GCE in pH 7 asshown in Fig. 19. From cyclic voltammograms it was clear thatanodic peak current at 0.3 V due to electrochemical oxidation of DAwas significantly greater in case of ZnO modified GCE compared tobare GCE. This can be explained due to the increased kinetics of theelectrocatalytic oxidation of DA on ZnO modified electrode. Henceamperogram was recorded using the ZnO modified GCE byfollowing the above described procedure (Fig. 20). Calibration
334 K. Manjunath et al. / Materials Research Bulletin 57 (2014) 325–334
plot was constructed using the current responses and the variedquantity of DA added (Fig. 21).
7. Conclusions
We have extended this work for the synthesis of other metaloxides like NiO, MgO, CuO, Fe2O3, MnO2, ZrO2, Nb2O5, TiO2 and soon. Sponge like ZnO Nps has been synthesized via solutioncombustion method using novel pigeon pea as a combustible fuelfor the first time. The sponge like ZnO Nps is highly porous innature with good surface area of 79 m2/gm. XRD pattern showsthat the ZnO nanoparticles are hexagonal and single crystal innature. FTIR spectrum of ZnO Nps shows the band at �420 cm�1 isassigned to vibration of Zn–O bonding. UV–vis spectrum show theblue shift compared to bulk ZnO. TEM images show that thethickness of nanoparticles is in the range �40–80 nm. The as-prepared ZnO Nps show good photocatalytic activity for thephotodegradation of methylene blue. ZnO Nps prepared usingnaturally occurring compound as fuel shows good photocatalyticactivity compare to glycine, urea as fuel. Furthermore it has showngood dielectric properties, antibacterial activity and electrochem-ical sensing.
Acknowledgements
Authors, Mr. K. Manjunath acknowledges Jain University forproviding facilities and G. Nagaraju thanks BMSIT for constantsupport and encouragement. Thomas acknowledges NanoscienceResearch Centre (NSRC), Department of Physics, Nirmala College,Muvattupuzha, Kerala for providing the opportunity to undertakethe study of dielectric properties.
References
[1] C.R. Martin, Science 266 (1994) 1961.[2] (a) A. Umar, Y.B. Hahn, Am. Sci. Pub. 5 (2010) 1;(b)G. Singh, E.M. Joyce, J. Beddow, T.J. Mason, J. Microbiol. Biotech. Food Sci. 2 (1)(2012) 106.[3] J.G. Manjunatha, B.E. Kumara Swamy, G.P. Mamatha, Ongera, Gilbert, B.N.
Chandrashekar, B.S. Sherigara, Int. J. Electrochem. Sci. 5 (2010) 1236.[4] Y.I. Alivov, E.V. Kalinina, A.E. Cherenkov, D.C. Look, B.M. Ataev, A.K. Omaev, M.V.
Chuki-, Chev, D.M. Bagnall, Appl. Phys. Lett. 83 (2003) 4719.[5] D. Calestani, M.Z. Zha, R. Mosca, A. Zappettini, M.C. Carotta, V. Di Natale, L.
Zanotti, Sens. Actuators B-Chem. 144 (2010) 472.[6] L.L. Xia, T.Q. Xin, S.C. Lu, L.Y. Chun, Chin. Phys Let. 22 (2005) 998.[7] C. Suresh, J.M. Kelly, R. Ramesh, D.E. Mc, J. Mat. Chem. 1 (2013) 3268 C.[8] Z.L. Wang, J. Phys. Condense. Mat. 16 (2004) R829.
[9] G. Nagaraju, S. Ashoka, P. Chithaiah, C.N. Tharamani, G.T. Chandrappa, Mat. Sci.Semicon. Proc. 13 (2010) 21.
[10] S. Ashoka, G. Nagaraju, C.N. Tharamani, G.T. Chandrappa, Mat. Lett. 63(2009) 873.[11] Y.H. Wang, S.J. Seo, B.S. Bae, J. Mat. Res. 25 (2010) 695.[12] S. Bhat, S.V. Shrisha, K.G. Naik, Arch. Phy. Res. 4 (2013) 61.[13] M. Moazzen, S.M. Borghei, F. Taleshi, Nano Sci. 2 (2012) 295.[14] J.C. Tian, Q. Zhang, A. Wu, M. Jiang, Z. Liang, B. Jiang, H. Fu, Chem. Commun. 48
(2012) 2858.[15] B. Li, Y. Wang, J. Phys. Chem. C 433 (114) (2010) 890.[16] B. Li, Y. Wang, Superlattice. Microst. 49 (2011) 212.[17] T.N. Ravishankar, K. Manjunath, B.S. Ravikumar, S. Sarakar, H. Nagabhushana,
G.T. Chandrappa, G. Nagaraju, Mater. Sci. Semicond. Process. 26 (2014) 7.[18] B. Nagappa, G.T. Chandrappa, Micropor. Mesopor. Mat. 106 (2007) 212.[19] K.C. Patil, Chemistry of Nanocrystalline Oxide Materials, Publishing World
Scientific, 2008.[20] K.S. Sumana, B.M. Nagabhushana, C. Shivakumar, M. Krishnamurthy, C.N.
Raghavendra, Int. J. Sci. Res. 1 (2012) 83.[21] S. Rasouli, S.H. Sakath, Prog, Color Colorants Coat. 3 (2010) 19.[22] Y. Kalyani, N. Kalaiselvi, N. Muniyandi, J. Power Sources 111 (2002) 232.[23] P. Kalyani, Int. J. Electrochem. Sci. 4 (2009) 30.[24] D. Gangulibabu, N. Bhuvaneswari, J. Kalaiselvi, Solid State Electrochem. 17
(2013) 9.[25] F. Ahmed, S. Kumar, N. Arshi, M.S. Anwar, B.H. Koo, C.G. Lee, Int. J. Nanosci. 10
(2011) 1025.[26] M. Kooti, A. N. Sedeh, J. Chem. L. 2013, Art ID 562028:4p[27] C. Perez, M. Paul, P. Bazerque, Acta Biol. Med. Exp. 15 (1990) 113.[28] L.F. Qi, Z.R. Xu, X. Jiang, C.H. Zou, Carbohydr. Res. 339 (2004) 2693.[29] K. Amarnath, J. Kumar, T. Reddy, V. Mahesh, S.R. Ayyappan, J. Nellore, Colloids
Surf. B 92 (2012) 254.[30] T. Liu, H.Q. Tang, X.M. Cai, J. Zhao, J. LiD, X.L. Sun, Nucle. Instrum. Math. B. 264
(2007) 282.[31] D.P. Liu, G.D. Li, Y. Su, J.S. Chen, Angew. Chem. Int. Ed. 45 (2006) 7370.[32] H.M. Xiong, D.P. Liu, Y.Y. Xia, J.S. Chen, Chem. Mater. 17 (2005) 3062.[33] C. Wang, E. Shen, E. Wang, L. Gao, Z. Kang, C. Tian, Y. Lan, C. Zhang, Mat. Let. 59
(2005) 2867.[34] J. Wang, L. Gao, J. Mater. Chem. 13 (2003) 2551.[35] S. Monticone, R. Tufeu, A.V. Kanaev, J. Phys. Chem. B 102 (1998) 2854.[36] N. Talebian, MR, Thin Solid Films 518 (2010) 2210.[37] S. Anandan, A. Vinu, K. Lovely, N. Gokulakrishnan, P. Srinivasu, T. Mori, J. Mol.
Cat. A-Chem. 226 (2007) 149.[38] A.A. Khodja, T. Sehili, J.F. Pilichowski, P. Boule, J. Photochem. Photobiol. Part A:
Chem. 141 (2001) 231.[39] M. Muruganandham, M. Swaminathan, Sol. Energy Mat. Sol. Cells 81 (2004)
439.[40] S. Rengaraj, X.Z. Li, Int. Environ. Pollut. 27 (2006) 20.[41] A. Mills, R.H. Davies, D. Worsley, Chem. Soc. Rev. 22 (1993) 417.[42] J. Liqiang, S. Xiaojun, X. Baifu, W. Baiqi, C. Weimin, F. Honggang, J. Solid State
Chem. 177 (2004) 3375.[43] I. Poulios, I. Tsachpinis, J. Chem. Technol. Biotech. 74 (1999) 349.[44] R. Ullah, J. Dutta, J. Hazard. Mater. 156 (2008) 194.[45] Q. Xiang, J. Yu, P.K. Wong, J. Colloid Interface Sci. 357 (2011) 163.[46] B. Parvatheeswara Rao, K.H. Rao, J. Mater. Sci. 32 (1997) 6049.[47] C.M. Mo, L. Zhang, G. Wang, Nanostruct. Mater. 6 (1995) 823.[48] T. Kar, R.N. Choudhary, S. Sharma, K.S. Singh, Ind. J. Phys. 73A (4) (1999) 453.[49] S.N. Potty, M.A. Khader, Bull. Mater. Sci. 23 (5) (2000) 361.[50] J. Mathew, S. Kurien, S. Sebastian, K.C. George, Ind. J. Phys. 78 (9) (2004) 947.[51] K.P. Priyanka, S. Joseph, T. Smitha, E.M. Mohammed, T. Varghese, J. Bas. Appl.
Phys. 2 (1) (2013) 105.