Why is the influence of soil macrofauna on soil structure only considered by soil ecologists?
Upload
independentCategory
view
1download
0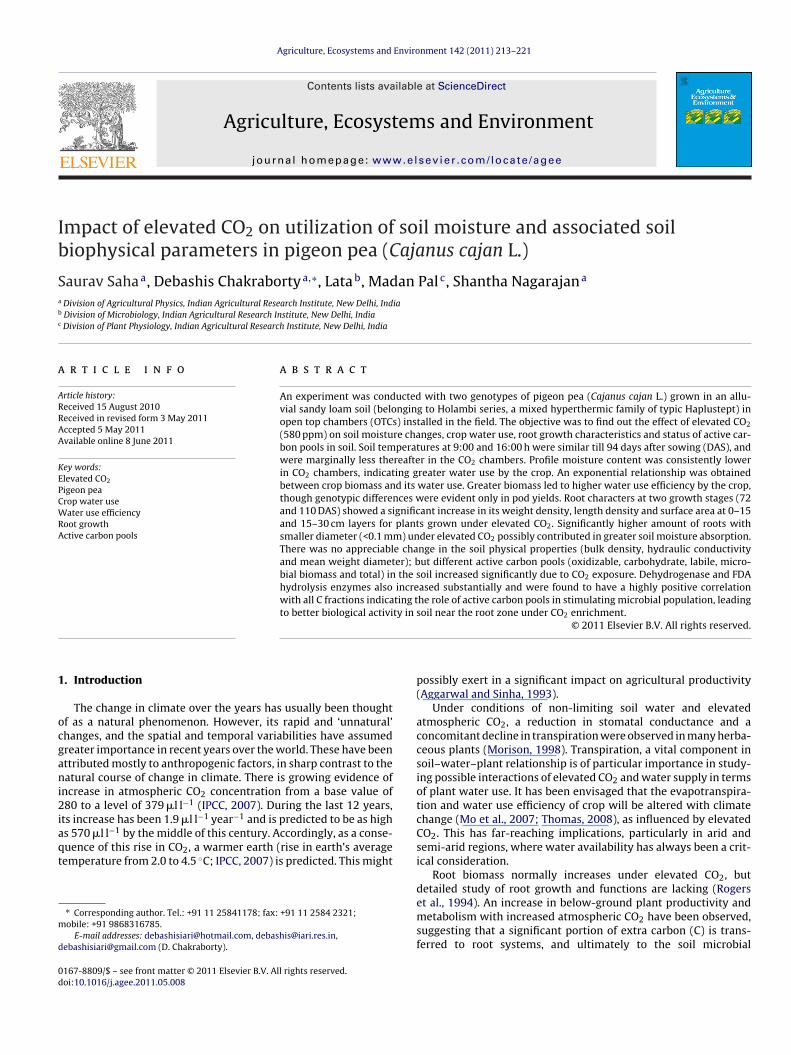
Ib
Sa
b
c
a
ARRAA
KEPCWRA
1
ocgani2iaqt
m
d
0d
Agriculture, Ecosystems and Environment 142 (2011) 213– 221
Contents lists available at ScienceDirect
Agriculture, Ecosystems and Environment
jo ur n al homepage: www.elsev ier .com/ lo cate /agee
mpact of elevated CO2 on utilization of soil moisture and associated soiliophysical parameters in pigeon pea (Cajanus cajan L.)
aurav Sahaa, Debashis Chakrabortya,∗, Latab, Madan Palc, Shantha Nagarajana
Division of Agricultural Physics, Indian Agricultural Research Institute, New Delhi, IndiaDivision of Microbiology, Indian Agricultural Research Institute, New Delhi, IndiaDivision of Plant Physiology, Indian Agricultural Research Institute, New Delhi, India
r t i c l e i n f o
rticle history:eceived 15 August 2010eceived in revised form 3 May 2011ccepted 5 May 2011vailable online 8 June 2011
ey words:levated CO2
igeon pearop water useater use efficiency
oot growthctive carbon pools
a b s t r a c t
An experiment was conducted with two genotypes of pigeon pea (Cajanus cajan L.) grown in an allu-vial sandy loam soil (belonging to Holambi series, a mixed hyperthermic family of typic Haplustept) inopen top chambers (OTCs) installed in the field. The objective was to find out the effect of elevated CO2
(580 ppm) on soil moisture changes, crop water use, root growth characteristics and status of active car-bon pools in soil. Soil temperatures at 9:00 and 16:00 h were similar till 94 days after sowing (DAS), andwere marginally less thereafter in the CO2 chambers. Profile moisture content was consistently lowerin CO2 chambers, indicating greater water use by the crop. An exponential relationship was obtainedbetween crop biomass and its water use. Greater biomass led to higher water use efficiency by the crop,though genotypic differences were evident only in pod yields. Root characters at two growth stages (72and 110 DAS) showed a significant increase in its weight density, length density and surface area at 0–15and 15–30 cm layers for plants grown under elevated CO2. Significantly higher amount of roots withsmaller diameter (<0.1 mm) under elevated CO2 possibly contributed in greater soil moisture absorption.
There was no appreciable change in the soil physical properties (bulk density, hydraulic conductivityand mean weight diameter); but different active carbon pools (oxidizable, carbohydrate, labile, micro-bial biomass and total) in the soil increased significantly due to CO2 exposure. Dehydrogenase and FDAhydrolysis enzymes also increased substantially and were found to have a highly positive correlationwith all C fractions indicating the role of active carbon pools in stimulating microbial population, leadingto better biological activity in soil near the root zone under CO2 enrichment.. Introduction
The change in climate over the years has usually been thoughtf as a natural phenomenon. However, its rapid and ‘unnatural’hanges, and the spatial and temporal variabilities have assumedreater importance in recent years over the world. These have beenttributed mostly to anthropogenic factors, in sharp contrast to theatural course of change in climate. There is growing evidence of
ncrease in atmospheric CO2 concentration from a base value of80 to a level of 379 �l l−1 (IPCC, 2007). During the last 12 years,
ts increase has been 1.9 �l l−1 year−1 and is predicted to be as high
s 570 �l l−1 by the middle of this century. Accordingly, as a conse-uence of this rise in CO2, a warmer earth (rise in earth’s averageemperature from 2.0 to 4.5 ◦C; IPCC, 2007) is predicted. This might∗ Corresponding author. Tel.: +91 11 25841178; fax: +91 11 2584 2321;obile: +91 9868316785.
E-mail addresses: [email protected], [email protected],[email protected] (D. Chakraborty).
167-8809/$ – see front matter © 2011 Elsevier B.V. All rights reserved.oi:10.1016/j.agee.2011.05.008
© 2011 Elsevier B.V. All rights reserved.
possibly exert in a significant impact on agricultural productivity(Aggarwal and Sinha, 1993).
Under conditions of non-limiting soil water and elevatedatmospheric CO2, a reduction in stomatal conductance and aconcomitant decline in transpiration were observed in many herba-ceous plants (Morison, 1998). Transpiration, a vital component insoil–water–plant relationship is of particular importance in study-ing possible interactions of elevated CO2 and water supply in termsof plant water use. It has been envisaged that the evapotranspira-tion and water use efficiency of crop will be altered with climatechange (Mo et al., 2007; Thomas, 2008), as influenced by elevatedCO2. This has far-reaching implications, particularly in arid andsemi-arid regions, where water availability has always been a crit-ical consideration.
Root biomass normally increases under elevated CO2, butdetailed study of root growth and functions are lacking (Rogers
et al., 1994). An increase in below-ground plant productivity andmetabolism with increased atmospheric CO2 have been observed,suggesting that a significant portion of extra carbon (C) is trans-ferred to root systems, and ultimately to the soil microbial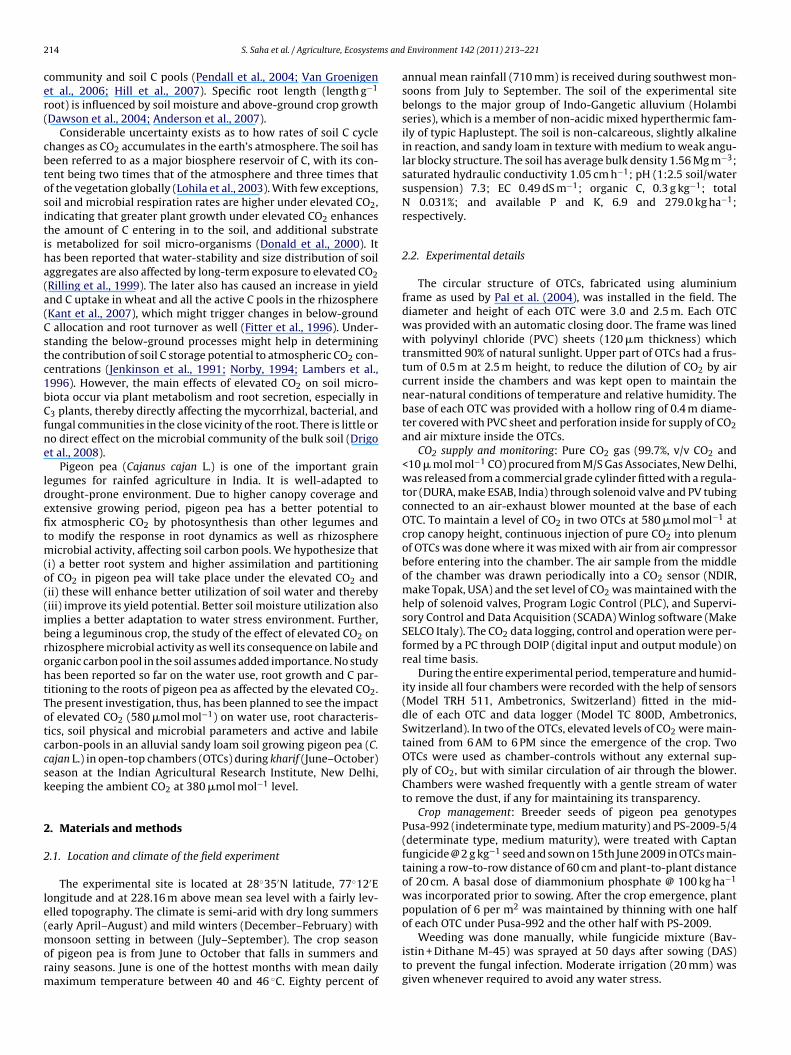
2 s and
cer(
cbtositiha(a(Cstc1bCfne
ldefitm(o((ibrohtTotccsk
2
2
le(morm
14 S. Saha et al. / Agriculture, Ecosystem
ommunity and soil C pools (Pendall et al., 2004; Van Groenigent al., 2006; Hill et al., 2007). Specific root length (length g−1
oot) is influenced by soil moisture and above-ground crop growthDawson et al., 2004; Anderson et al., 2007).
Considerable uncertainty exists as to how rates of soil C cyclehanges as CO2 accumulates in the earth’s atmosphere. The soil haseen referred to as a major biosphere reservoir of C, with its con-ent being two times that of the atmosphere and three times thatf the vegetation globally (Lohila et al., 2003). With few exceptions,oil and microbial respiration rates are higher under elevated CO2,ndicating that greater plant growth under elevated CO2 enhanceshe amount of C entering in to the soil, and additional substrates metabolized for soil micro-organisms (Donald et al., 2000). Itas been reported that water-stability and size distribution of soilggregates are also affected by long-term exposure to elevated CO2Rilling et al., 1999). The later also has caused an increase in yieldnd C uptake in wheat and all the active C pools in the rhizosphereKant et al., 2007), which might trigger changes in below-ground
allocation and root turnover as well (Fitter et al., 1996). Under-tanding the below-ground processes might help in determininghe contribution of soil C storage potential to atmospheric CO2 con-entrations (Jenkinson et al., 1991; Norby, 1994; Lambers et al.,996). However, the main effects of elevated CO2 on soil micro-iota occur via plant metabolism and root secretion, especially in3 plants, thereby directly affecting the mycorrhizal, bacterial, andungal communities in the close vicinity of the root. There is little oro direct effect on the microbial community of the bulk soil (Drigot al., 2008).
Pigeon pea (Cajanus cajan L.) is one of the important grainegumes for rainfed agriculture in India. It is well-adapted torought-prone environment. Due to higher canopy coverage andxtensive growing period, pigeon pea has a better potential tox atmospheric CO2 by photosynthesis than other legumes ando modify the response in root dynamics as well as rhizosphere
icrobial activity, affecting soil carbon pools. We hypothesize thati) a better root system and higher assimilation and partitioningf CO2 in pigeon pea will take place under the elevated CO2 andii) these will enhance better utilization of soil water and therebyiii) improve its yield potential. Better soil moisture utilization alsomplies a better adaptation to water stress environment. Further,eing a leguminous crop, the study of the effect of elevated CO2 onhizosphere microbial activity as well its consequence on labile andrganic carbon pool in the soil assumes added importance. No studyas been reported so far on the water use, root growth and C par-itioning to the roots of pigeon pea as affected by the elevated CO2.he present investigation, thus, has been planned to see the impactf elevated CO2 (580 �mol mol−1) on water use, root characteris-ics, soil physical and microbial parameters and active and labilearbon-pools in an alluvial sandy loam soil growing pigeon pea (C.ajan L.) in open-top chambers (OTCs) during kharif (June–October)eason at the Indian Agricultural Research Institute, New Delhi,eeping the ambient CO2 at 380 �mol mol−1 level.
. Materials and methods
.1. Location and climate of the field experiment
The experimental site is located at 28◦35′N latitude, 77◦12′Eongitude and at 228.16 m above mean sea level with a fairly lev-lled topography. The climate is semi-arid with dry long summersearly April–August) and mild winters (December–February) with
onsoon setting in between (July–September). The crop seasonf pigeon pea is from June to October that falls in summers andainy seasons. June is one of the hottest months with mean dailyaximum temperature between 40 and 46 ◦C. Eighty percent of
Environment 142 (2011) 213– 221
annual mean rainfall (710 mm) is received during southwest mon-soons from July to September. The soil of the experimental sitebelongs to the major group of Indo-Gangetic alluvium (Holambiseries), which is a member of non-acidic mixed hyperthermic fam-ily of typic Haplustept. The soil is non-calcareous, slightly alkalinein reaction, and sandy loam in texture with medium to weak angu-lar blocky structure. The soil has average bulk density 1.56 Mg m−3;saturated hydraulic conductivity 1.05 cm h−1; pH (1:2.5 soil/watersuspension) 7.3; EC 0.49 dS m−1; organic C, 0.3 g kg−1; totalN 0.031%; and available P and K, 6.9 and 279.0 kg ha−1;respectively.
2.2. Experimental details
The circular structure of OTCs, fabricated using aluminiumframe as used by Pal et al. (2004), was installed in the field. Thediameter and height of each OTC were 3.0 and 2.5 m. Each OTCwas provided with an automatic closing door. The frame was linedwith polyvinyl chloride (PVC) sheets (120 �m thickness) whichtransmitted 90% of natural sunlight. Upper part of OTCs had a frus-tum of 0.5 m at 2.5 m height, to reduce the dilution of CO2 by aircurrent inside the chambers and was kept open to maintain thenear-natural conditions of temperature and relative humidity. Thebase of each OTC was provided with a hollow ring of 0.4 m diame-ter covered with PVC sheet and perforation inside for supply of CO2and air mixture inside the OTCs.
CO2 supply and monitoring: Pure CO2 gas (99.7%, v/v CO2 and<10 � mol mol−1 CO) procured from M/S Gas Associates, New Delhi,was released from a commercial grade cylinder fitted with a regula-tor (DURA, make ESAB, India) through solenoid valve and PV tubingconnected to an air-exhaust blower mounted at the base of eachOTC. To maintain a level of CO2 in two OTCs at 580 �mol mol−1 atcrop canopy height, continuous injection of pure CO2 into plenumof OTCs was done where it was mixed with air from air compressorbefore entering into the chamber. The air sample from the middleof the chamber was drawn periodically into a CO2 sensor (NDIR,make Topak, USA) and the set level of CO2 was maintained with thehelp of solenoid valves, Program Logic Control (PLC), and Supervi-sory Control and Data Acquisition (SCADA) Winlog software (MakeSELCO Italy). The CO2 data logging, control and operation were per-formed by a PC through DOIP (digital input and output module) onreal time basis.
During the entire experimental period, temperature and humid-ity inside all four chambers were recorded with the help of sensors(Model TRH 511, Ambetronics, Switzerland) fitted in the mid-dle of each OTC and data logger (Model TC 800D, Ambetronics,Switzerland). In two of the OTCs, elevated levels of CO2 were main-tained from 6 AM to 6 PM since the emergence of the crop. TwoOTCs were used as chamber-controls without any external sup-ply of CO2, but with similar circulation of air through the blower.Chambers were washed frequently with a gentle stream of waterto remove the dust, if any for maintaining its transparency.
Crop management: Breeder seeds of pigeon pea genotypesPusa-992 (indeterminate type, medium maturity) and PS-2009-5/4(determinate type, medium maturity), were treated with Captanfungicide @ 2 g kg−1 seed and sown on 15th June 2009 in OTCs main-taining a row-to-row distance of 60 cm and plant-to-plant distanceof 20 cm. A basal dose of diammonium phosphate @ 100 kg ha−1
was incorporated prior to sowing. After the crop emergence, plantpopulation of 6 per m2 was maintained by thinning with one halfof each OTC under Pusa-992 and the other half with PS-2009.
Weeding was done manually, while fungicide mixture (Bav-istin + Dithane M-45) was sprayed at 50 days after sowing (DAS)to prevent the fungal infection. Moderate irrigation (20 mm) wasgiven whenever required to avoid any water stress.
s and
2
icaftrwpt
2
1so
ataHcdmrca
daoaWra
2
csabtpdauetc
st6s
2
t
S. Saha et al. / Agriculture, Ecosystem
.3. Weather during crop growth
Daily maximum, minimum temperature, mean relative humid-ty, bright sunshine hours and rainfall outside and inside thehambers were recorded (data not presented). Maximum temper-tures inside the OTCs were 3–7 ◦C greater than outside except aew days following rainfall, though no clear trend between the con-rol and CO2 chambers were recorded. The minimum temperaturesemained nearly the same. In case of relative humidity, the trendas reverse and this was always lower inside the chambers com-ared to the open field. Except for the first 40 DAS, humidity insidehe CO2 chambers was higher on most days.
.4. Soil temperature and moisture monitoring
Soil temperature was recorded by glass thermometers at 7,4, 21, and 28 cm depth on every 3-day intervals throughout thetudy period. The temperature data were recorded at 9 and 16 h forbtaining minimum and maximum temperature, respectively.
Neutron probe access tubes were installed to a depth of 1.5 mt the centre of each of the four OTC to monitor the soil mois-ure. Moisture content was monitored at a counting rate of 60 st weekly intervals using the neutron moisture meter (CPN 503 DRydroprobe Moisture Gauge, International Inc., USA) for each 30-m layer increments (0–30, 30–60, 60–90, 90–120 and 120–150 cmepth). For preparation of standard curve, a plot of 4 m × 4 m wasade by the side of the main site and subjected to profile satu-
ation prior to subsequent measurements. The neutron probe wasalibrated against soil water content determined gravimetricallynd bulk density of the soil (Zhang et al., 2000).
Soil moisture content (v/v, %) was converted to cm m−1 of soilepth and the crop water use was computed using field water bal-nce equation. Root water uptake was computed from the depletionf moisture from 0 to 90 cm soil, assuming no drainage occurreds the soil moisture regime was relatively dry during this period.ater use efficiency (WUE) of the crop was calculated from the
egression between periodic biomass (72, 110 and 140 DAS) andmount of water used (cm) during these periods.
.5. Monitoring of soil carbon dioxide flux
Carbon dioxide was sampled and analysed using Infra-red basedontinuous flux analyser (LI-8100 system) with a 20 cm short-termurvey chamber. The closed chamber was placed on the soil surfacend the rate of increase of the CO2 concentration inside the cham-er was used to determine the soil CO2 flux (CO2 diffusion out ofhe soil in response to the concentration gradient between the soilores and the atmosphere). The desired value of the soil flux wasetermined when the chamber CO2 concentration was the sames the ambient atmospheric concentration. The flux was estimatedsing the initial slope of a fitted exponential curve at the ambi-nt CO2 concentration. This was done to minimize the impact ofhe altered CO2 concentration gradient across the soil surface afterhamber was closed.
Instantaneous CO2 flux from the soil inside the crop canopy isimilar in pattern though always higher under elevated CO2 for bothhe genotypes. This reached to peak (8–10 kg ha−1 day−1) during0–90 DAS following a steady decrease thereafter (data not pre-ented).
.6. Soil physical properties
Soil physical properties were determined before the sowing ofhe crop taking two samples from each OTC. Again two samples
Environment 142 (2011) 213– 221 215
each from the cropped area of the two genotypes were collectedfrom the four OTCs and analysed:
1. Bulk density (BD): The core sampler was pushed into the soilto the desired depth in such a way that soil core is collectedfrom the centre of the depth (0–15 and 15–30 cm). Samples wereoven-dried at 105 ◦C for 48 h and the bulk density (Mg m−3) wascalculated by dividing dry soil weight by the volume of core used(Veihmeyer and Hendrickson, 1948).
2. Saturated hydraulic conductivity: This was measured in the lab-oratory by using Darcy’s equation to a saturated soil columnof uniform cross sectional area (Klute and Dirksen, 1986). Ahydraulic head of 2.45 cm was imposed on the soil column andthe resulting, constant flux of water was measured. The saturatedhydraulic conductivity was calculated by the equation:
Ks = V · L
A · t(H2 − H1)
where Ks = saturated hydraulic conductivity (cm h−1), V = volumeof water (cm3) that flows through the sample of length L (cm)and sectional area A (cm2) in time t, H2 − H1 = hydraulic headdifference imposed across the sample of length L (cm).
3. Mean weight diameter (MWD): The aggregation status of soil wascalculated as a single value of MWD by Yoder’s apparatus (VanBavel, 1949):
MWD =n∑
i=1
diwi
where n = number of size fraction, di = mean diameter of each sizerange and wi = fraction weight of aggregates in that size range oftotal dry weight of analysed sample.
2.7. Root sampling and analysis
Six root samples from each OTC (three for each genotype) werecollected at 50% flowering and 50% pod formation stages. Beforesampling, the above-ground plant part was removed and the soilsurface was cleaned. The core of the auger was placed so as tokeep the base of the stem at the centre and the soil core was exca-vated from each 15 cm depth down to a 45 cm depth of the profile.After the excavation, the soil cores were sealed in polythene bagsand stored in cold room (maintained at 10 ◦C) until the roots werewashed and processed.
The root samples were soaked overnight in water contain-ing small amount of sodium hexametaphosphate (Aggarwal andSharma, 2002). The water on top with floating roots was decantedand roots were separated by carefully passing it over a fine 35-meshsieve. The procedure was repeated 3–4 times for complete separa-tion of roots from soils. The roots were air-dried to make themready for scanning using a root scanner (LA 1600). The morphologyand architecture (total root length, root surface area, root thicknessand root volume) were measured through WinRHIZO programme(Regent Instruments Inc., Canada).
The cleaned root samples were dried in an oven at 65 ◦C for 48 h,and weighed. The root dry weight, length and surface area weredivided by the volume of the soil core, from which the roots wereextracted to obtain the respective densities for each depth of soil.
2.8. Above ground dry matter and grain yield at harvest
The above ground portion of five plants of each genotype fromeach OTCs were cut above the surface and separated as stem, leavesand pods. The numbers of pods were counted. The leaves, stems
2 s and Environment 142 (2011) 213– 221
atsw
2C
dhciwaa3fidtat
2h
ozTuatWtv
2
cvdU
3
3
aaNvtwhp
3
1f
Fig. 1. Soil moisture content in 0–90 cm profile during the crop growth period (a)
ciency of the crop varied with the crop growth and the final value(at harvest stage) of 15.84 g m−2 cm−1 obtained under elevated CO2
y = 0.253e0.148x
R² = 0.99 5
y = 0.104e0.159x
R² = 0.99 6
0
200
400
600
800
1000
30 35 40 45 50 55
Bio
mas
s (g
m- 2
)
Elevated CO2
Ambient CO2
16 S. Saha et al. / Agriculture, Ecosystem
nd pods were initially shade-dried and later oven-dried at 65 ◦Cill constant weight. Pods were hand-threshed and the seeds wereeparated and the dried parts were weighed. Grains from each plantere weighed to estimate the grain yield.
.9. Estimation of soil carbon pools (oxidizable and total organic, labile C, carbohydrate C and microbial biomass C)
Soil cores were collected from a depth of 0 to 30 cm at three ran-om places in each OTC before the sowing of the crop and after finalarvest and preserved at 10 ◦C till the analysis. Oxidizable organic Content (soil passed through 0.2 mm sieve) was determined follow-ng Walkley and Black (1934). Total organic C was determined by
et digestion with potassium dichromate along with 3:2 H2SO4nd 85% H3PO4 digestion mixture as recommended by Syndernd Trofymow (1984). The amount of oxidizable carbon in soil by33 mM KMnO4, considered as labile carbon, was determined byollowing the procedure of Blair et al. (1995). Carbohydrate carbonn soil sample was determined by anthrone blue colour method asescribed by Brink et al. (1959) and the microbial biomass carbon inhe soil was estimated by fumigation extraction method (Jenkinsonnd Powlson, 1976). The carbon estimation of the extract was donehrough persulphate digestion method (Horwath and Paul, 1994).
.10. Microbial activity by dehydrogenase enzyme assay and FDAydrolysis in soil
Dehydrogenase activity was estimated by monitoring the ratef production of triphenyl formazon (TPF) from tri-phenyl tetra-olium chloride used as an electron acceptor (Casida et al., 1964).he FDA (fluorescein diacetate) hydrolysis assay was carried outsing 1 g soil, suspended in potassium phosphate buffer (pH 7.6)nd FDA (0.5 mg ml−1). After incubation for 2 h at 37 ◦C, the reac-ion was stopped using acetone. The solution was filtered through
hatman No. 1 filter paper and the absorbance of the supernatantaken at 490 nm using fluorescein standard (Green et al., 2006). Thealues were represented as �g fluorescein released g−1 soil h−1.
.11. Statistical analysis
The data sets were processed for analysis of variance as appli-able to split plot design, to test differences among the treatments,arieties and their interactions using statistical programme SAS 9.1,eveloped by, SAS Institute Inc., SAS Campus Drive, Cary, NC 27513,SA.
. Results
.1. Soil temperature
Average soil temperatures at different depths were 32 and 35 ◦Ct 9 and 16 h, respectively, till 80 DAS. Thereafter the temperaturest 9 h declined sharply, but the same at 16 h decreased gradually.o consistent difference was observed between control and ele-ated CO2 chambers till 94 DAS after which soil temperatures inhe CO2 chambers became marginally less at both hours. This effectas noticed up to 21 cm soil depth. The seasonal fluctuations wereigher at surface and progressively less down the profile (data notresented).
.2. Soil moisture
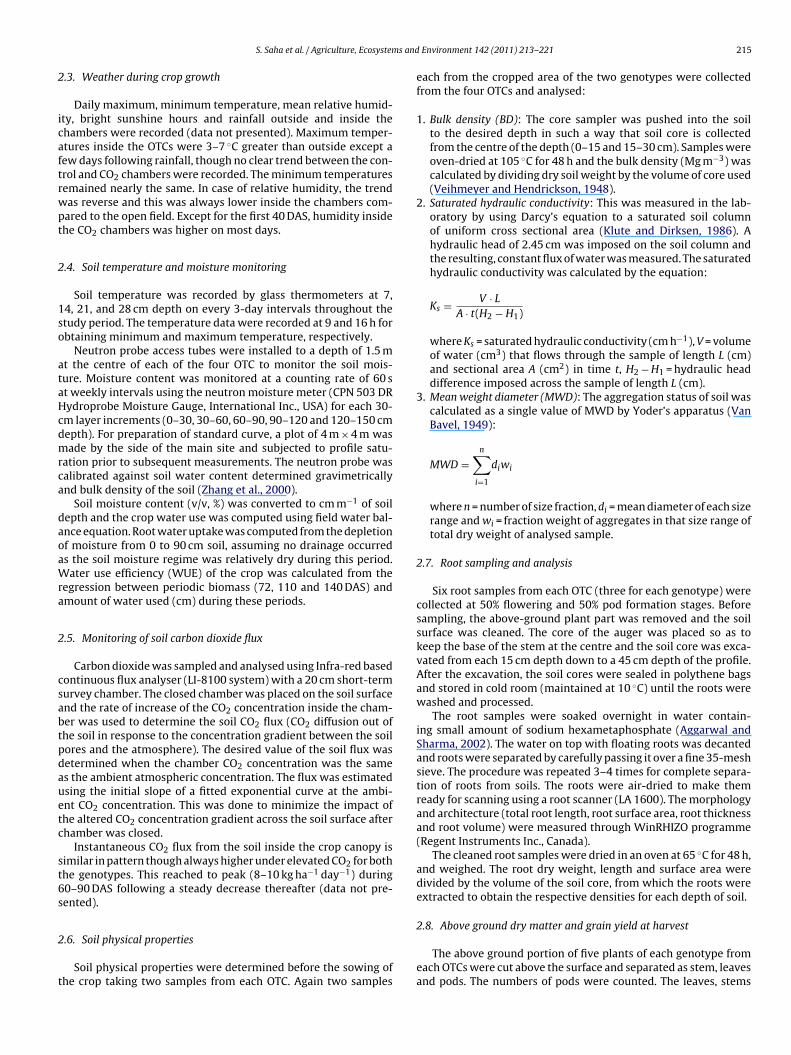
Soil moisture content varied between 27–32, 15–20, 14–16 and5–17% at 0–30, 30–45, 45–60 and 60–90 cm depths, respectively,or the entire growing period. However, the pattern of moisture
and cumulative crop water use (b) in pigeon pea crop under elevated and ambientCO2 levels.
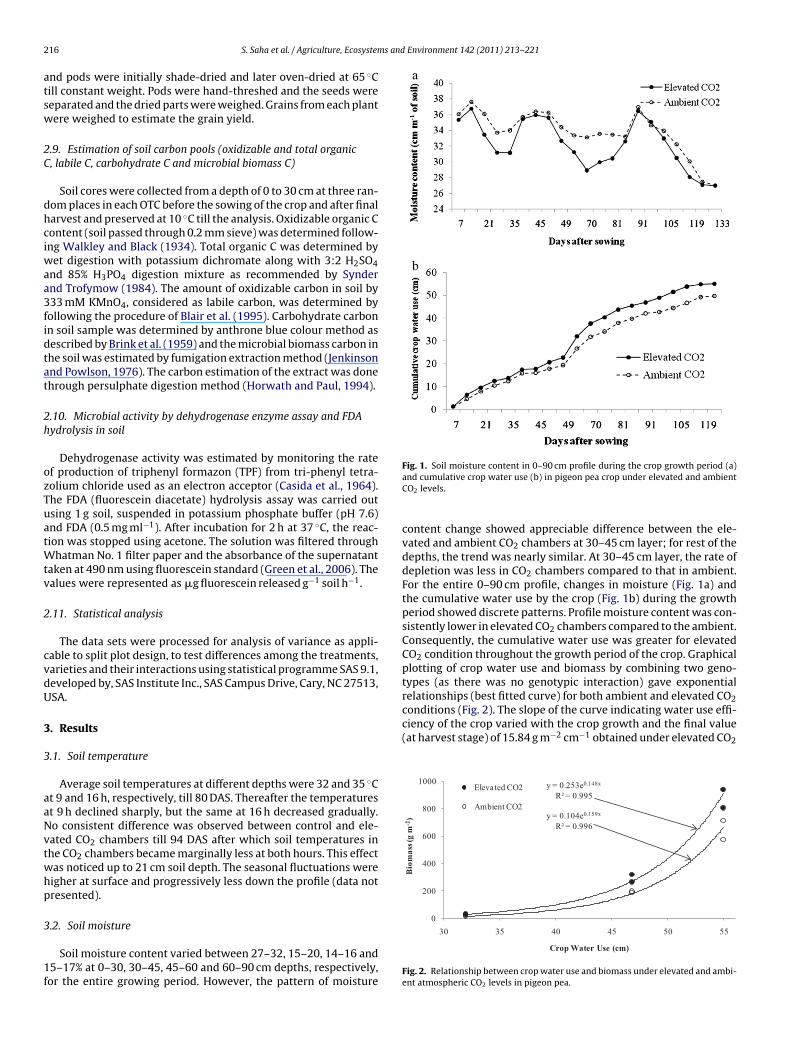
content change showed appreciable difference between the ele-vated and ambient CO2 chambers at 30–45 cm layer; for rest of thedepths, the trend was nearly similar. At 30–45 cm layer, the rate ofdepletion was less in CO2 chambers compared to that in ambient.For the entire 0–90 cm profile, changes in moisture (Fig. 1a) andthe cumulative water use by the crop (Fig. 1b) during the growthperiod showed discrete patterns. Profile moisture content was con-sistently lower in elevated CO2 chambers compared to the ambient.Consequently, the cumulative water use was greater for elevatedCO2 condition throughout the growth period of the crop. Graphicalplotting of crop water use and biomass by combining two geno-types (as there was no genotypic interaction) gave exponentialrelationships (best fitted curve) for both ambient and elevated CO2conditions (Fig. 2). The slope of the curve indicating water use effi-
Crop Water Use (cm)
Fig. 2. Relationship between crop water use and biomass under elevated and ambi-ent atmospheric CO2 levels in pigeon pea.
S. Saha et al. / Agriculture, Ecosystems and Environment 142 (2011) 213– 221 217
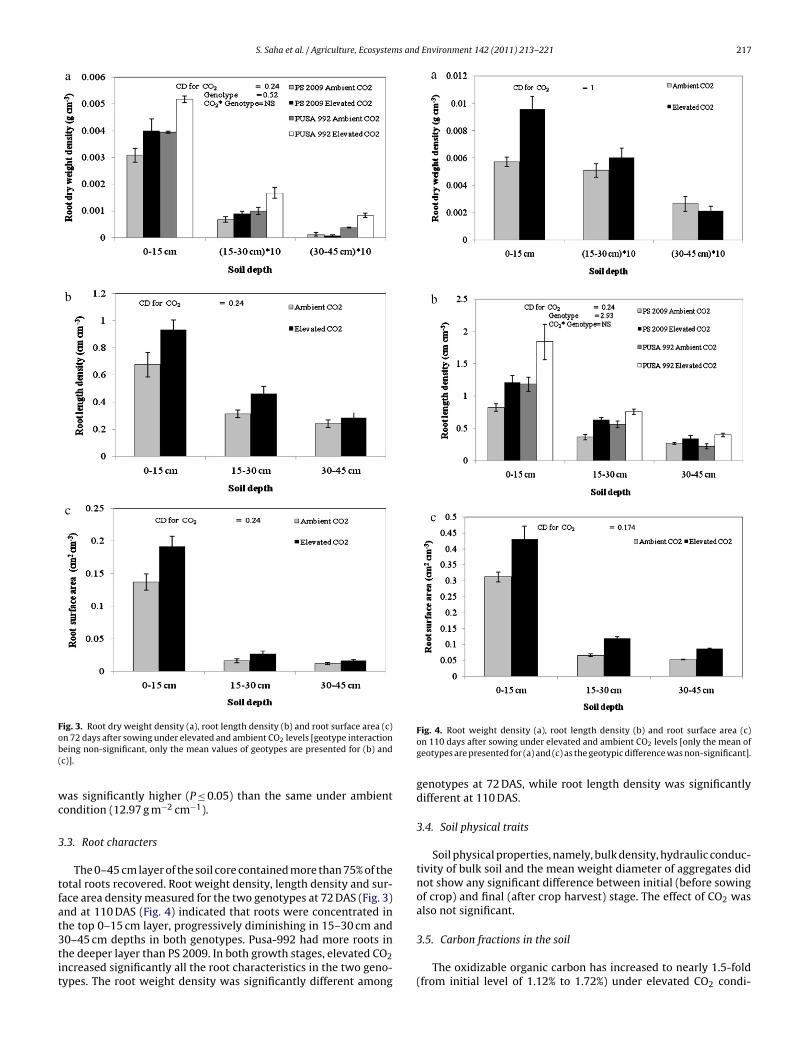
Fig. 3. Root dry weight density (a), root length density (b) and root surface area (c)ob(
wc
3
tfat3tit
n 72 days after sowing under elevated and ambient CO2 levels [geotype interactioneing non-significant, only the mean values of geotypes are presented for (b) andc)].
as significantly higher (P ≤ 0.05) than the same under ambientondition (12.97 g m−2 cm−1).
.3. Root characters
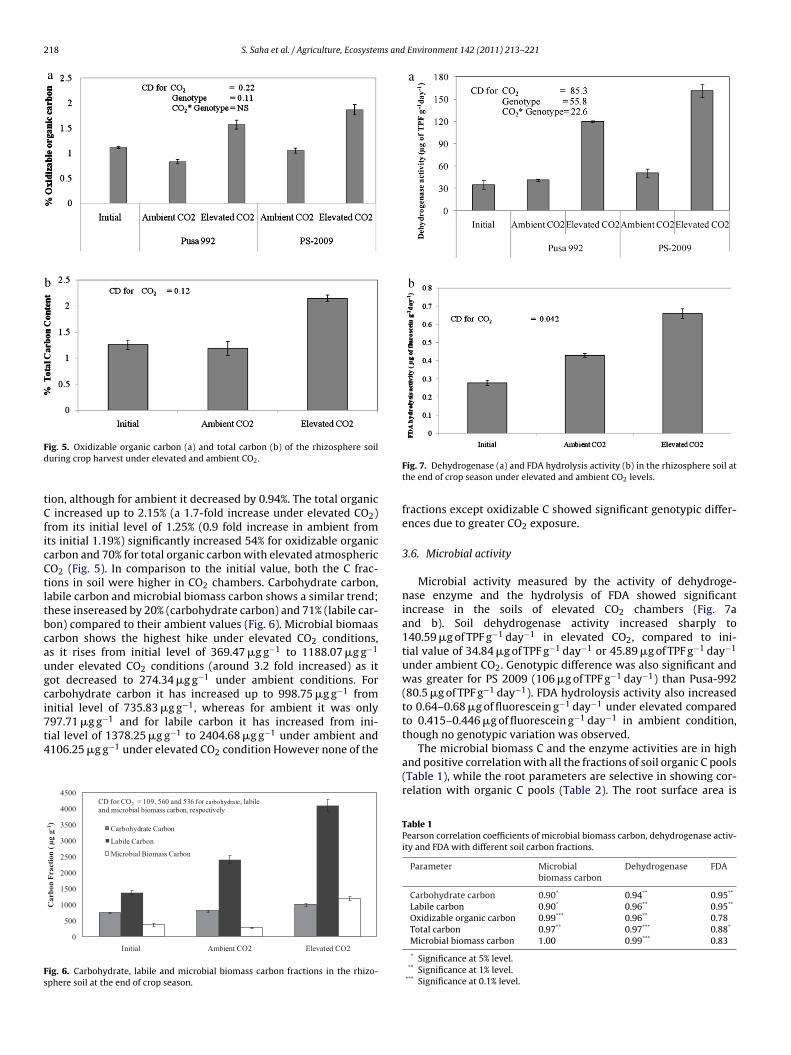
The 0–45 cm layer of the soil core contained more than 75% of theotal roots recovered. Root weight density, length density and sur-ace area density measured for the two genotypes at 72 DAS (Fig. 3)nd at 110 DAS (Fig. 4) indicated that roots were concentrated inhe top 0–15 cm layer, progressively diminishing in 15–30 cm and
0–45 cm depths in both genotypes. Pusa-992 had more roots inhe deeper layer than PS 2009. In both growth stages, elevated CO2ncreased significantly all the root characteristics in the two geno-ypes. The root weight density was significantly different amongFig. 4. Root weight density (a), root length density (b) and root surface area (c)on 110 days after sowing under elevated and ambient CO2 levels [only the mean ofgeotypes are presented for (a) and (c) as the geotypic difference was non-significant].
genotypes at 72 DAS, while root length density was significantlydifferent at 110 DAS.
3.4. Soil physical traits
Soil physical properties, namely, bulk density, hydraulic conduc-tivity of bulk soil and the mean weight diameter of aggregates didnot show any significant difference between initial (before sowingof crop) and final (after crop harvest) stage. The effect of CO2 wasalso not significant.
3.5. Carbon fractions in the soil
The oxidizable organic carbon has increased to nearly 1.5-fold(from initial level of 1.12% to 1.72%) under elevated CO2 condi-
218 S. Saha et al. / Agriculture, Ecosystems and Environment 142 (2011) 213– 221
Fd
tCficCtltbcaugci7t4
Fs
ig. 5. Oxidizable organic carbon (a) and total carbon (b) of the rhizosphere soiluring crop harvest under elevated and ambient CO2.
ion, although for ambient it decreased by 0.94%. The total organic increased up to 2.15% (a 1.7-fold increase under elevated CO2)rom its initial level of 1.25% (0.9 fold increase in ambient fromts initial 1.19%) significantly increased 54% for oxidizable organicarbon and 70% for total organic carbon with elevated atmosphericO2 (Fig. 5). In comparison to the initial value, both the C frac-ions in soil were higher in CO2 chambers. Carbohydrate carbon,abile carbon and microbial biomass carbon shows a similar trend;hese insereased by 20% (carbohydrate carbon) and 71% (labile car-on) compared to their ambient values (Fig. 6). Microbial biomaasarbon shows the highest hike under elevated CO2 conditions,s it rises from initial level of 369.47 �g g−1 to 1188.07 �g g−1
nder elevated CO2 conditions (around 3.2 fold increased) as itot decreased to 274.34 �g g−1 under ambient conditions. Forarbohydrate carbon it has increased up to 998.75 �g g−1 fromnitial level of 735.83 �g g−1, whereas for ambient it was only97.71 �g g−1 and for labile carbon it has increased from ini-
ial level of 1378.25 �g g−1 to 2404.68 �g g−1 under ambient and106.25 �g g−1 under elevated CO2 condition However none of the0
500
1000
1500
2000
2500
3000
3500
4000
4500
Initial Ambient CO2 Elevated CO2
Car
bon
Frac
tion
( µg
g-1)
Carbohydrate Carbon
Labil e Carbon
Microbial Biomass Carbon
CD for CO = 10 9, 560 and 536 for ca rbo hydrate, labil e and microbial biomass carbon, respecti vely
ig. 6. Carbohydrate, labile and microbial biomass carbon fractions in the rhizo-phere soil at the end of crop season.
Fig. 7. Dehydrogenase (a) and FDA hydrolysis activity (b) in the rhizosphere soil atthe end of crop season under elevated and ambient CO2 levels.
fractions except oxidizable C showed significant genotypic differ-ences due to greater CO2 exposure.
3.6. Microbial activity
Microbial activity measured by the activity of dehydroge-nase enzyme and the hydrolysis of FDA showed significantincrease in the soils of elevated CO2 chambers (Fig. 7aand b). Soil dehydrogenase activity increased sharply to140.59 �g of TPF g−1 day−1 in elevated CO2, compared to ini-tial value of 34.84 �g of TPF g−1 day−1 or 45.89 �g of TPF g−1 day−1
under ambient CO2. Genotypic difference was also significant andwas greater for PS 2009 (106 �g of TPF g−1 day−1) than Pusa-992(80.5 �g of TPF g−1 day−1). FDA hydroloysis activity also increasedto 0.64–0.68 �g of fluorescein g−1 day−1 under elevated comparedto 0.415–0.446 �g of fluorescein g−1 day−1 in ambient condition,though no genotypic variation was observed.
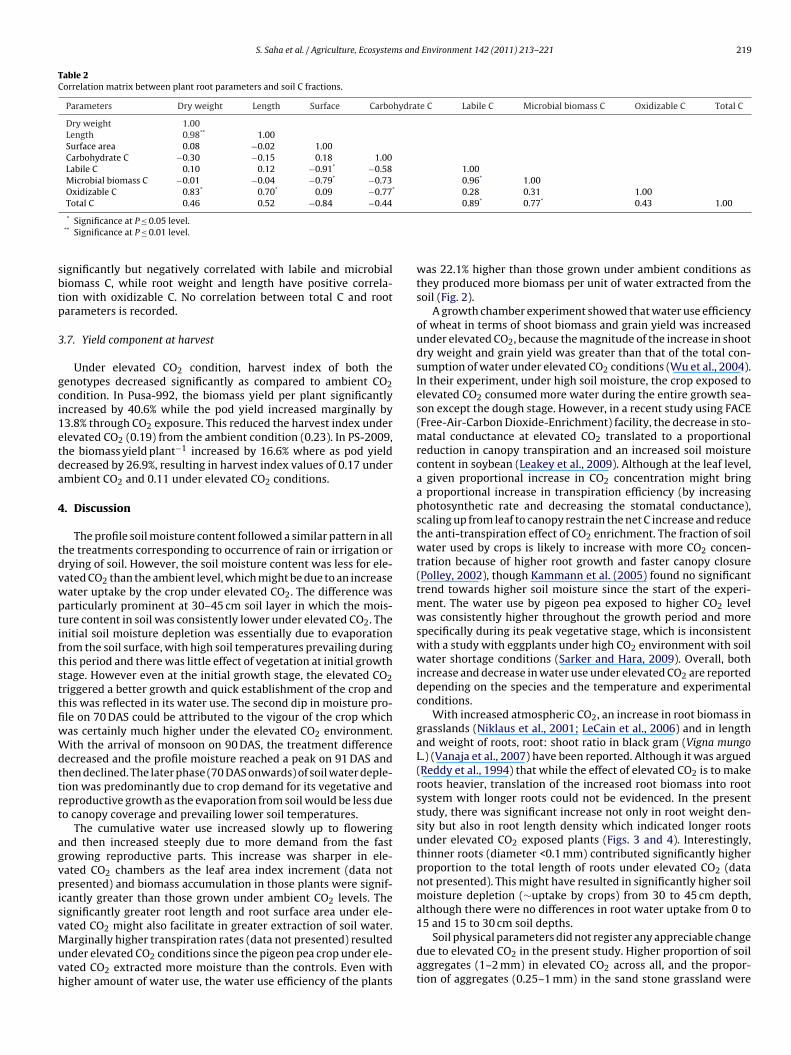
The microbial biomass C and the enzyme activities are in highand positive correlation with all the fractions of soil organic C pools(Table 1), while the root parameters are selective in showing cor-relation with organic C pools (Table 2). The root surface area is
Table 1Pearson correlation coefficients of microbial biomass carbon, dehydrogenase activ-ity and FDA with different soil carbon fractions.
Parameter Microbialbiomass carbon
Dehydrogenase FDA
Carbohydrate carbon 0.90* 0.94** 0.95**
Labile carbon 0.90* 0.96** 0.95**
Oxidizable organic carbon 0.99*** 0.96** 0.78Total carbon 0.97** 0.97*** 0.88*
Microbial biomass carbon 1.00 0.99*** 0.83
* Significance at 5% level.** Significance at 1% level.
*** Significance at 0.1% level.
S. Saha et al. / Agriculture, Ecosystems and Environment 142 (2011) 213– 221 219
Table 2Correlation matrix between plant root parameters and soil C fractions.
Parameters Dry weight Length Surface Carbohydrate C Labile C Microbial biomass C Oxidizable C Total C
Dry weight 1.00Length 0.98** 1.00Surface area 0.08 −0.02 1.00Carbohydrate C −0.30 −0.15 0.18 1.00Labile C 0.10 0.12 −0.91* −0.58 1.00Microbial biomass C −0.01 −0.04 −0.79* −0.73 0.96* 1.00Oxidizable C 0.83* 0.70* 0.09 −0.77* 0.28 0.31 1.00Total C 0.46 0.52 −0.84 −0.44 0.89* 0.77* 0.43 1.00
sbtp
3
gci1etda
4
tdvwptiftsttfiwWdttrt
agvpisvMuvh
* Significance at P ≤ 0.05 level.** Significance at P ≤ 0.01 level.
ignificantly but negatively correlated with labile and microbialiomass C, while root weight and length have positive correla-ion with oxidizable C. No correlation between total C and rootarameters is recorded.
.7. Yield component at harvest
Under elevated CO2 condition, harvest index of both theenotypes decreased significantly as compared to ambient CO2ondition. In Pusa-992, the biomass yield per plant significantlyncreased by 40.6% while the pod yield increased marginally by3.8% through CO2 exposure. This reduced the harvest index underlevated CO2 (0.19) from the ambient condition (0.23). In PS-2009,he biomass yield plant−1 increased by 16.6% where as pod yieldecreased by 26.9%, resulting in harvest index values of 0.17 undermbient CO2 and 0.11 under elevated CO2 conditions.
. Discussion
The profile soil moisture content followed a similar pattern in allhe treatments corresponding to occurrence of rain or irrigation orrying of soil. However, the soil moisture content was less for ele-ated CO2 than the ambient level, which might be due to an increaseater uptake by the crop under elevated CO2. The difference wasarticularly prominent at 30–45 cm soil layer in which the mois-ure content in soil was consistently lower under elevated CO2. Thenitial soil moisture depletion was essentially due to evaporationrom the soil surface, with high soil temperatures prevailing duringhis period and there was little effect of vegetation at initial growthtage. However even at the initial growth stage, the elevated CO2riggered a better growth and quick establishment of the crop andhis was reflected in its water use. The second dip in moisture pro-le on 70 DAS could be attributed to the vigour of the crop whichas certainly much higher under the elevated CO2 environment.ith the arrival of monsoon on 90 DAS, the treatment difference
ecreased and the profile moisture reached a peak on 91 DAS andhen declined. The later phase (70 DAS onwards) of soil water deple-ion was predominantly due to crop demand for its vegetative andeproductive growth as the evaporation from soil would be less dueo canopy coverage and prevailing lower soil temperatures.
The cumulative water use increased slowly up to floweringnd then increased steeply due to more demand from the fastrowing reproductive parts. This increase was sharper in ele-ated CO2 chambers as the leaf area index increment (data notresented) and biomass accumulation in those plants were signif-
cantly greater than those grown under ambient CO2 levels. Theignificantly greater root length and root surface area under ele-ated CO2 might also facilitate in greater extraction of soil water.
arginally higher transpiration rates (data not presented) resultednder elevated CO2 conditions since the pigeon pea crop under ele-ated CO2 extracted more moisture than the controls. Even withigher amount of water use, the water use efficiency of the plants
was 22.1% higher than those grown under ambient conditions asthey produced more biomass per unit of water extracted from thesoil (Fig. 2).
A growth chamber experiment showed that water use efficiencyof wheat in terms of shoot biomass and grain yield was increasedunder elevated CO2, because the magnitude of the increase in shootdry weight and grain yield was greater than that of the total con-sumption of water under elevated CO2 conditions (Wu et al., 2004).In their experiment, under high soil moisture, the crop exposed toelevated CO2 consumed more water during the entire growth sea-son except the dough stage. However, in a recent study using FACE(Free-Air-Carbon Dioxide-Enrichment) facility, the decrease in sto-matal conductance at elevated CO2 translated to a proportionalreduction in canopy transpiration and an increased soil moisturecontent in soybean (Leakey et al., 2009). Although at the leaf level,a given proportional increase in CO2 concentration might bringa proportional increase in transpiration efficiency (by increasingphotosynthetic rate and decreasing the stomatal conductance),scaling up from leaf to canopy restrain the net C increase and reducethe anti-transpiration effect of CO2 enrichment. The fraction of soilwater used by crops is likely to increase with more CO2 concen-tration because of higher root growth and faster canopy closure(Polley, 2002), though Kammann et al. (2005) found no significanttrend towards higher soil moisture since the start of the experi-ment. The water use by pigeon pea exposed to higher CO2 levelwas consistently higher throughout the growth period and morespecifically during its peak vegetative stage, which is inconsistentwith a study with eggplants under high CO2 environment with soilwater shortage conditions (Sarker and Hara, 2009). Overall, bothincrease and decrease in water use under elevated CO2 are reporteddepending on the species and the temperature and experimentalconditions.
With increased atmospheric CO2, an increase in root biomass ingrasslands (Niklaus et al., 2001; LeCain et al., 2006) and in lengthand weight of roots, root: shoot ratio in black gram (Vigna mungoL.) (Vanaja et al., 2007) have been reported. Although it was argued(Reddy et al., 1994) that while the effect of elevated CO2 is to makeroots heavier, translation of the increased root biomass into rootsystem with longer roots could not be evidenced. In the presentstudy, there was significant increase not only in root weight den-sity but also in root length density which indicated longer rootsunder elevated CO2 exposed plants (Figs. 3 and 4). Interestingly,thinner roots (diameter <0.1 mm) contributed significantly higherproportion to the total length of roots under elevated CO2 (datanot presented). This might have resulted in significantly higher soilmoisture depletion (∼uptake by crops) from 30 to 45 cm depth,although there were no differences in root water uptake from 0 to15 and 15 to 30 cm soil depths.
Soil physical parameters did not register any appreciable changedue to elevated CO2 in the present study. Higher proportion of soilaggregates (1–2 mm) in elevated CO2 across all, and the propor-tion of aggregates (0.25–1 mm) in the sand stone grassland were
2 s and
rtetcortc2sbbeeiGsaKoc
raZipmbeemo
b2ieiimTpaAtcm
(Coi(brri2usefi
h
20 S. Saha et al. / Agriculture, Ecosystem
eported for six growing seasons (Rilling et al., 1999). Change inhe soil physical characteristics is slow and the time period in ourxperiment was perhaps too short for any perceptible change toake place. But due to increased soil CO2 flux in the elevated CO2hambers, a significant change was recorded in different fractionsf soil C (Figs. 5 and 6). This demonstrated that part of the CO2eleased inside the OTC had been sequestered into the soil. Resul-ant effect of elevated atmospheric CO2 on the increase in soilarbon stocks has been reported (Jastrow et al., 2005; Luo et al.,006). Both the oxidizable and total organic C fractions in soil wereignificantly higher in elevated CO2 chambers (Fig. 5). The increasedelow-ground carbon allocation and greater root production coulde direct contributors to soil C accrual under CO2-enrichment (Luot al., 2006; De Graaff et al., 2006). Meta-analyses indicated thatlevated atmospheric CO2 could produce small but measurablencrement in soil C stock, but contradictory results also exist (Deraaff et al., 2006). After a decade of exposure, elevated atmo-pheric CO2 had no effect on soil carbon stocks in Lolium perennend Trifolium repens grasslands at the Swiss FACE experiment (Vanessel et al., 2006), while an 8-year open-top chamber experimentn native tall grass prairie in Kansas (USA) indicated increasing soilarbon stocks under elevated CO2 (Jastrow et al., 2000).
Labile, carbohydrate and microbial biomass C fractions in thehizosphere of pigeon pea were greater under elevated than undermbient CO2 conditions (Fig. 6). Similar findings were reported byak et al. (1993, 1996). In wheat, both carbohydrate and labile Cncreased due to exposure to elevated CO2 (Kant et al., 2007). Pigeonea is a leguminous crop and the root weight being significantlyore in elevated CO2 conditions, the substantial increase in micro-
ial biomass carbon could be expected. The activities of the relatednzymes, dehydrogenase and FDA are also explainable. When thentire data were pooled, the activities of these two enzymes andicrobial biomass carbon showed significant correlation with most
f the active C fractions.Microbial population, an essential part of soil food web, may
e used as a potential measure of ecosystem functioning (NEERI,002). Similarly, soil enzymes contribute to the soil biological activ-
ties and may be used as a tool for assessing the influence ofxtraneous matter, if any to soil components. Soil dehydrogenases widely used as an indicator of soil microbial activities, becauset occurs intra-cellular in living microbial cells and is linked with
icrobial oxidation–reduction process (Nannipiere et al., 2007).he FDA hydrolysis is carried out by a number of enzymes such as,rotease, lipase and esterase (Green et al., 2006) secreted by a widerray of primary decomposing bacteria and fungi (Lundgren, 1981).
combination of microbial biomass carbon and soil enzyme activi-ies permit valid interpretation of effect of any change in microbialommunity, root exudation pattern (Kassem et al., 2008) and cropanagement practices (Stark et al., 2007).In the present study, higher microbial biomass C
977–1756 �g g−1of soil) was recorded in soil under enrichedO2 environment in both the genotypes. This might be becausef higher photosynthetic rate and more root biomass resultingn better root exudation in soil under enriched CO2 environmentKassem et al., 2008). High positive correlation (r = 0.94–0.98)etween different C fractions and microbial biomass C indicatedole of microflora in carbon cycling. Increased rhizosphere respi-ation in forest ecosystem due to C flux from plant to soil resultedn higher microbial respiration under elevated CO2 (Lin et al.,001). We found a greater CO2 concentration and flux in the soilnder elevated CO2 conditions, part of which must have beenequestered in soil. The present study also showed that soil CO2
fflux can be highly variable on temporal scales within a singleeld experiment (Nakayama et al., 1994; Xu and Qi, 2001).Higher dehydrogenase activity under elevated CO2 (2–3 timesigher than ambient) in our study is in conformity with the findings
Environment 142 (2011) 213– 221
of Dhillion et al. (1996). Higher dehydrogenase activity indicatesinvolvement of larger microbial biomass in oxidation–reductionand C cycling in soil environment. An increasing number of stud-ies point to below ground system as sink in carbon cycling(Norby, 1994; O’Neill, 1994). Higher positive correlation coefficient(r = 0.94–0.99) was also observed between dehydrogenase and dif-ferent C fractions in soil. This indicates role of active carbon poolsin stimulation of microbial population leading to better dehydro-genase activity in soil.
Total microbial activity in terms of fluorescein diacetate (3,6′-diacetyl fluorescien) has been used to determine amount of activemicroflora producing extracellular enzymes (Adam and Duncan,2001). These enzymes can persist in soil as part of inorganic com-plexes or when associated with organic colloids (Nannipiere et al.,2002). In case of FDA hydrolysis similar response was recorded asobserved in microbial biomass and dehydrogenase activity. Nearly1.5-fold increase in FDA hydrolysis under enriched CO2 environ-ment might indicate change in quality and quantity of root exudatesthat increased the production of enzymes involved in FDA hydroly-sis. Higher microbial biomass exude more extracellular enzyme todegrade rhizospheric macromolecules available in soil. The higherlevel of enzymes release more fluorescien from the substrate FDA.Unlike dehydrogenase which had high positive correlation withall carbon fractions, FDA showed significant correlation with onlycarbohydrate carbon and labile carbon.
5. Conclusions
Under elevated CO2 levels, pigeon pea used significantly greateramount water than under ambient condition, indicating its higherdemand for water in elevated atmospheric CO2. This is evidencedby higher root length density and surface area that enabled bet-ter extraction of moisture from soil. Genotypic differences wereobserved in both the biological and pod yields of the crop, influ-encing the harvest index. Elevated levels of CO2 brought significantincrease in active carbon pools e.g. oxidizable organic carbon, car-bohydrate carbon, labile carbon, microbial biomass carbon andtotal organic carbon. Activities of the dehydrogenase and FDAhydrolysis increased, but no perceptible change in rhizosphere soilphysical properties were recorded. Results indicated a more bio-logically active soil with part of the CO2 flux being sequestered indifferent carbon pools at the end of the season in pigeon pea underelevated CO2 levels.
Acknowledgements
Authors are grateful to Dr. S.P. Dutta, Dr. (Mrs.) Pramila Aggar-wal, Dr. (Mrs.) Arti Bhatia and Dr. Raje for their help and guidanceduring the study period; Mr. Sandipan Samanta for the statisticalanalysis; Dr. D.K. Das for his critical reviews and suggestions regard-ing the preparation of the manuscript; and Mr. David Franchinofor the English editing of the manuscript. The financial assistancefor this research programme by the Indian Agricultural ResearchInstitute in the form of Fellowship is duly acknowledged.
References
Adam, G., Duncan, H., 2001. Development of a sensitive and rapid method for themeasurement of total microbial activity using Fluorescein diacetate (FDA) in arange of soils. Soil Biol. Biochem. 33, 943–951.
Aggarwal, P., Sharma, N.K., 2002. Water uptake and yield of rainfed wheat in relationto tillage and mulch. Indian J. Soil Conserv. 30, 155–160.
Aggarwal, P.K., Sinha, S.K., 1993. Effect of probable increase in carbon dioxide andtemperature on productivity of wheat in India. J. Agric. Meteorol. 48, 811–814.
Anderson, T.M., Starmer, W.T., Thorne, M., 2007. Bimodal root diameter distributionsin Serengeti grasses exhibit plasticity in response to defoliation and soil texture:implications for nitrogen uptake. Funct. Ecol. 21, 50–60.
s and
B
B
C
D
D
D
D
D
F
G
H
H
I
J
J
J
J
K
K
K
K
L
L
L
L
L
L
L
M
S. Saha et al. / Agriculture, Ecosystem
lair, G.J., Leroy, R.D.B., Lisle, L., 1995. Soil carbon fractions based on their degree ofoxidation, and the development of a carbon management index for agriculturalsystems. Aust. J. Agric. Res. 46, 1459–1466.
rink, R.H., Dubach, P., Lynch, D.L., 1959. Measurement of carbohydrates inhydrolyzates with anthrone. Soil Sci. 89, 157–166.
asida, L.E., Klein, D.A., Santoro, T., 1964. Soil dehydrogenase activity. Soil Sci. 98,371–376.
awson, L.A., Thornton, B., Pratt, S.M., Paterson, E., 2004. Morphological and topo-logical responses of roots to defoliation and nitrogen supply in Lolium perenneand Festuca ovina. New Phytol. 161, 811–818.
e Graaff, M.A., Van Groenigen, K.J., Six, J., Hungate, B., Van Kessel, C., 2006. Inter-actions between plant growth and soil nutrient cycling under elevated CO2: ameta-analysis. Global Change Biol. 12, 2077–2091.
hillion, S.S., Roy, J., Abrams, M., 1996. Assessing the impact of elevated CO2 on soilmicrobial activity in Mediterranean model ecosystem. Plant Soil 187, 333–342.
onald, R.Z., Kurt, S.P., John, S.K., William, E.H., 2000. Elevated atmospheric CO2 fineroots and the response of soil microorganisms: a review and hypothesis. NewPhytol. 147, 201–222.
rigo, B., Kowalchuk, G.A., van Veen, J.A., 2008. Climate change goes underground:effects of elevated atmospheric CO2 on microbial community structure andactivities in the rhizosphere. Biol. Fertil. Soils 44, 667–679.
itter, A.H., Self, G.K., Wolfenden, J., van Vuuren, M.M.I., Brown, T.K., Williamson, L.,Graves, J.D., Robinson, D., 1996. Root production and mortality under elevatedatmospheric carbon dioxide. Plant Soil 187, 299–306.
reen, V.S., Statt, D.E., Diack, M., 2006. Assay for fluorscein di acetate hydrolyticactivity: optimization for soil samples. Soil Biol. Biochem. 38, 693–701.
ill, P.W., Marshall, C., Williams, G.G., Blum, H., Harmens, H., Jones, D.L., Farrar, J.F.,2007. The fate of photosynthetically fixed carbon in Lolium perenne grassland asmodified by elevated CO2 and sward management. New Phytol. 173, 766–777.
orwath, W.R., Paul, E.A., 1994. Microbial biomass. In: Methods of Soil Analysis, Part2. Microbial and Biochemical Properties – SSSA Book Series No. 5. Soil Sci. Soc.Am., Madison, WI, USA, pp. 753–773.
PCC, 2007. Climate Change 2007: The Physical Science Basis, Contribution of Work-ing Group-I to the Fourth Assessment Report of the Intergovernmental Panel onClimate Change. Cambridge University Press, Cambridge.
astrow, J.D., Miller, R.M., Owensby, C.E., 2000. Long-term effects of elevated atmo-spheric CO2 on below-ground biomass and transformations to soil organicmatter in grassland. Plant Soil 224, 85–97.
astrow, J.D., Miller, R.M., Matamala, R., Norby, R.J., Boutton, T.W., Rice, C.W.,Owensby, C.E., 2005. Elevated atmospheric carbon dioxide increases soil carbon.Global Change Biol. 11, 2057–2064.
enkinson, D.S., Adams, D.E., Wild, A., 1991. Model estimates of CO2 emissions fromsoil in response to global warming. Nature 351, 304–306.
enkinson, D.S., Powlson, D.S., 1976. The effects of biological treatments onmetabolism in soil. V. A method for measuring soil biomass. Soil Biol. Biochem.8, 209–213.
ammann, C., Grünhage, L., Grüters, U., Janze, S., Jäger, H.J., 2005. Response ofaboveground grassland biomass and soil moisture to moderate long-term CO2
enrichment. Basic Appl. Ecol. 6, 351–365.ant, P.C.B., Bhadraray, S., Purakayastha, T.J., Jain, V., Pal, M., Datta, S.C., 2007. Active
carbon-pools in rhizophere of wheat (Triticum aestivum L.) grown under elevatedatmosphere carbon dioxide concentration in a Typic Haplustept in sub-tropicalIndia. Environ. Poll. 147, 273–281.
assem, I.I., Joshi, P., Sigler, V., Heckathorn, S., Qi, W., 2008. Effect of Elevated CO2
and drought on soil microbial communities associated with Andropogon gerardii.J. Integr. Plant Biol. 50, 1406–1415.
lute, A., Dirksen, C., 1986. Hydraulic Conductivity and Diffusivity: Laboratory Meth-ods. Cambridge University Press, Cambridge, pp. 687–734.
ambers, H., Stulen, I., Van der Werf, A., 1996. Carbon use in root respiration asaffected by elevated atmospheric CO2: a comparison of natural and managedsystems. Plant Soil 187, 251–263.
eakey, A.D.B., Ainsworth, E.A., Bernacchi, C.J., Rogers, A., Long, S.P., Ort, D.R., 2009.Elevated CO2 effects on plant carbon, nitrogen, and water relations: six impor-tant lessons from FACE. J. Exp. Bot. 60, 2859–2876.
eCain, D.R., Morgan, J.A., Milchunas, D.G., Mosier, A.R., Nelson, J.A., Smith, D.P., 2006.Root biomass of individual species, and root size characteristics after five yearsof CO2 enrichment on native short grass steppe. Plant Soil 279, 219–228.
in, G., Rygiewicz, P.T., Ehleringer, J.R., Johnson, M.G., Tingey, D.T., 2001. Time depen-dent responses of soil CO2 efflux components to elevated atmospheric CO2 andtemperature in experimental forest mesocosms. Plant Soil 229, 259–270.
ohila, A., Aurela, M., Regina, K., Laurila, T., 2003. Soil and total ecosystem respirationin agricultural fields: effect of soil and crop type. Plant Soil 251, 303–317.
undgren, B., 1981. Fluorescein diacetate as a stain of microbiologically active bac-
teria in soil. Oikos 36, 17–22.uo, Y., Hui, D., Zhang, D., 2006. Elevated CO2 stimulates net accumulations of carbonand nitrogen in land ecosystems: a meta-analysis. Ecology 87, 53–63.
o, X.G., Lin, Z.H., Liu, S.X., 2007. Climate change impacts on the ecohydrologicalprocesses in the Wuding River basin. Acta Ecol. Sin. 27, 4999–5007.
Environment 142 (2011) 213– 221 221
Morison, J., 1998. Stomatal response to increased CO2 concentration. J. Exp. Bot. 49,443–452.
Nakayama, F.S., Huluka, G., Kimball, B.A., Lewin, K.F., Nagy, J., Hendrey, G.R., 1994. Soilcarbon dioxide fluxes in natural and CO2-enriched systems. Agric. For. Meteorol.70, 131–140.
Nannipiere, P., Kandeler, E., Ruggiero, P., 2002. Enzyme activities, microbiologicaland biochemical processes in soil. In: Burns, R.G., Dick, R.P. (Eds.), Enzymes inthe Environment. Marcel Dekker, New York, USA, p. 133.
Nannipiere, P., Ascher, J., Ceccherini, M.T., Landi, L., Pietramellara, G., Renella, G.,Valori, F., 2007. Microbial diversity and microbial activity in the rhizosphere.Cl.Suelo (Argentina) 25, 89–97.
NEERI, 2002. Microorganisms as indicators of soil health. NEERI Technical ReportNo. 388, 44–56.
Niklaus, P.A., Glöckler, E., Siegwolf, R., Körner, C., 2001. Carbon allocation in calcare-ous grassland under elevated CO2: a combined 13C pulse-labelling/soil physicalfractionation study. Funct. Ecol. 15, 43–50.
Norby, R.J., 1994. Issues and perspectives for investigating root responses to elevatedatmospheric carbon dioxide. Plant Soil 165, 9–20.
O’Neill, E.G., 1994. Responses of soil biota to elevated atmospheric carbon dioxide.Plant Soil 165, 55–65.
Pal, M., Karthikeyapandian, V., Jain, V., Srivastava, A.C., Raj, A., Sengupta, U.K., 2004.Biomass production and nutritional levels of berseem (Trifolium alexandrium)grown under elevated CO2. Agric. Ecosyst. Environ. 101, 31–38.
Pendall, E., Mosier, A.R., Morgan, J.A., 2004. Rhizodeposition stimulated by elevatedCO2 in a semiarid grassland. New Phytol. 162, 447–458.
Polley, H.W., 2002. Implications of atmospheric and climatic change for crop yieldand water use efficiency. Crop Sci. 42, 131–140.
Reddy, V.R., Reddy, K.R., Acock, M.C., Trent, A., 1994. Carbon dioxide enrich-ment and temperature effects on root growth in cotton. Biotronics 23,47–57.
Rilling, M.C., Wright, S.F., Allen, M.F., Field, C.B., 1999. Rise in carbon dioxide changessoil structure. Nature 400, 628.
Rogers, H.H., Runion, G.B., Krupa, S.V., 1994. Plant responses to atmospheric CO2
enrichment with emphasis on root and the rhizosphere. Environ. Poll. 83,155–189.
Sarker, B.C., Hara, M., 2009. Effects of elevated CO2 and water stress on root struc-ture and hydraulic conductance of Solanum melongena L. Bangladesh J. Bot. 38,55–63.
Stark, C., Condron, L.M., Stewart, A., Di, H.J., O’Callaghan, M., 2007. Effects of past andcurrent crop management on soil microbial biomass and activity. Biol. Fertil.Soils 43, 531–540.
Synder, J.D., Trofymow, J.A., 1984. A rapid accurate wet oxidation diffusion procedurefor determining organic and inorganic carbon in pot and soil samples. Commun.Soil Sci. Plant Anal. 15, 587–597.
Thomas, A., 2008. Agriculture irrigation demand under present and future climatescenarios in China. Global Planet. Change 60, 306–326.
Van Bavel, C.H.M., 1949. Mean weight diameter of soil aggregates as a statisticalindex of aggregation. Soil Sci. Soc. Am. Proc. 14, 20–23.
Van Groenigen, K.J., Six, J., Hungate, B.A., de Graaff, M.A., Van Breemen, N., Van Kessel,C., 2006. Element interactions limit soil carbon storage. Proc. Natl. Acad. Sci. 103,6571–6574.
Van Kessel, C., Boots, B., De Graaff, M.A., Harris, D., Blum, H., Six, J., 2006. Total soil Cand N sequestration in a grassland following 10 years of free air CO2 enrichment.Global Change Biol. 12, 2187–2199.
Vanaja, M., Reddy, P.R., Lakshmi, N.J., Maheswari, M., Vagheera, P., Ratnakumar, P.,Jyothi, M., Yadav, S.K., Venkateswarlu, B., 2007. Effect of elevated atmosphericCO2 concentrations on growth and yield of blackgram (Vigna mungo L.)—a rain-fed pulse crop. Plant Soil Environ. 53, 81–88.
Veihmeyer, J., Hendrickson, A.H., 1948. Soil density and root penetration. Soil Sci.65, 487–493.
Walkley, A.J., Black, C.A., 1934. An estimation of the Degtjareff method for determin-ing soil organic matter and a proposed modification of the chromic acid titrationmethod. Soil Sci. 37, 29–38.
Wu, D.X., Wang, G.X., Bai, Y.F., Liao, J.X., 2004. Effects of elevated CO2 concentrationon growth, water use, yield and grain quality of wheat under two soil waterlevels. Agric. Ecosyst. Environ. 104, 493–507.
Xu, M., Qi, Y., 2001. Soil-surface CO2 efflux and its spatial and temporal variations ina young ponderosa pine plantation in northern California. Global Change Biol.7, 667–677.
Zak, D.R., Pregitzer, K.S., Curtis, P.S., Teeri, J.A., Fogel, R., Randlett, D.L., 1993. Elevatedatmospheric CO2 and feedback between carbon and nitrogen cycles. Plant Soil151, 105–117.
Zak, D.R., Ringelberg, D.B., Pregitzer, K.S., Randlett, D.L., White, D.C., Curtis, P.S.,
1996. Soil microbial community beneath the Populus grandidentata grown underelevated atmospheric CO2. Ecol. Appl. 6, 257–262.Zhang, H., Pala, M., Oweis, T., Harris, H., 2000. Water use and water-use efficiencyof chickpea and lentil in a Mediterranean environment. Aust. J. Agric. Res. 51,295–304.
Copyright © 2022 FDOKUMEN