Soil microbial community response to differences in soil managements and seasonal changes
14
Soil Bacterial Community Response to Differences in Agricultural Management along with Seasonal Changes in a Mediterranean Region Annamaria Bevivino 1 *, Patrizia Paganin 1 , Giovanni Bacci 2,3 , Alessandro Florio 2 , Maite Sampedro Pellicer 1 , Maria Cristiana Papaleo 3 , Alessio Mengoni 3 , Luigi Ledda 4 , Renato Fani 3 , Anna Benedetti 2 , Claudia Dalmastri 1 1 ENEA (Italian National Agency for New Technologies, Energy and Sustainable Economic Development) Casaccia Research Center, Technical Unit for Sustainable Development and Innovation of Agro-Industrial System, Rome, Italy, 2 Consiglio per la Ricerca e la Sperimentazione in Agricoltura - Research Centre for the Soil-Plant System, Rome, Italy, 3 Laboratory of Microbial and Molecular Evolution, Department of Biology, University of Florence, Florence, Italy, 4 Dipartimento di Agraria, University of Sassari, Sassari, Italy Abstract Land-use change is considered likely to be one of main drivers of biodiversity changes in grassland ecosystems. To gain insight into the impact of land use on the underlying soil bacterial communities, we aimed at determining the effects of agricultural management, along with seasonal variations, on soil bacterial community in a Mediterranean ecosystem where different land-use and plant cover types led to the creation of a soil and vegetation gradient. A set of soils subjected to different anthropogenic impact in a typical Mediterranean landscape, dominated by Quercus suber L., was examined in spring and autumn: a natural cork-oak forest, a pasture, a managed meadow, and two vineyards (ploughed and grass covered). Land uses affected the chemical and structural composition of the most stabilised fractions of soil organic matter and reduced soil C stocks and labile organic matter at both sampling season. A significant effect of land uses on bacterial community structure as well as an interaction effect between land uses and season was revealed by the EP index. Cluster analysis of culture-dependent DGGE patterns showed a different seasonal distribution of soil bacterial populations with subgroups associated to different land uses, in agreement with culture-independent T-RFLP results. Soils subjected to low human inputs (cork-oak forest and pasture) showed a more stable bacterial community than those with high human input (vineyards and managed meadow). Phylogenetic analysis revealed the predominance of Proteobacteria, Actinobacteria, Bacteroidetes, and Firmicutes phyla with differences in class composition across the site, suggesting that the microbial composition changes in response to land uses. Taken altogether, our data suggest that soil bacterial communities were seasonally distinct and exhibited compositional shifts that tracked with changes in land use and soil management. These findings may contribute to future searches for bacterial bio-indicators of soil health and sustainable productivity. Citation: Bevivino A, Paganin P, Bacci G, Florio A, Pellicer MS, et al. (2014) Soil Bacterial Community Response to Differences in Agricultural Management along with Seasonal Changes in a Mediterranean Region. PLoS ONE 9(8): e105515. doi:10.1371/journal.pone.0105515 Editor: Jack Anthony Gilbert, Argonne National Laboratory, United States of America Received May 24, 2014; Accepted July 23, 2014; Published August 21, 2014 Copyright: ß 2014 Bevivino et al. This is an open-access article distributed under the terms of the Creative Commons Attribution License, which permits unrestricted use, distribution, and reproduction in any medium, provided the original author and source are credited. Data Availability: The authors confirm that all data underlying the findings are fully available without restriction. All relevant data are within the paper and its Supporting Information files. Accession numbers of phylogenetic assignment of bacterial isolates are available from GenBank database and are the reported in Table S5. Funding: This research was funded by MIUR (Integrated Special Fund for Research - FISR) in the frame of the Italian National Project SOILSINK ‘‘Climate change and agro-forestry systems, impacts on soil carbon sink and microbial diversity’’, and partially supported by MIUR (Research Department of Italian Government) in the framework of the Agreement Program ENEA-CNR (Articolo 2, comma 44, Legge 23.12.2009 n. 191 - Legge Finanziaria 2010). The funders had no role in study design, data collection and analysis, decision to publish, or preparation of the manuscript. Competing Interests: The authors have declared that no competing interests exist. * Email: [email protected] Introduction Soil microorganisms play an important role as regulators of major biogeochemical cycles and can significantly affect the ecosystem functioning [1], being involved in organic matter dynamics, nutrient cycling and decomposition processes [2]. The anthropogenic activities affect the diversity of natural habitats modifying the number of species occurring in the environment at the landscape scale. Soil management strongly influences soil biodiversity in agricultural ecosystems. Different practices can alter the below-ground ecosystem, often leading to depletion of soil carbon and loss of biodiversity, and thus affecting the structure of the resident microbial communities [3]. Therefore, characterizing genetic and functional diversity of soil bacterial communities in response to agricultural practices and/or climate is fundamental to better understand and manage the ecosystem processes. The Mediterranean area is one of the most important biodiversity hotspots in the world and is increasingly threatened by intensive land use [4]. The high environmental diversity that characterizes the Mediterranean region is related to the integra- tion of natural ecosystems and traditional human activities such as the agroforestry practices [5]. The collapse of the traditional agro- silvo-pastoral system that occurred during the past century has led to major changes in the extension of woodlands dominated by PLOS ONE | www.plosone.org 1 August 2014 | Volume 9 | Issue 8 | e105515
-
Upload
independent -
Category
Documents
-
view
3 -
download
0
Transcript of Soil microbial community response to differences in soil managements and seasonal changes

Soil Bacterial Community Response to Differences inAgricultural Management along with Seasonal Changesin a Mediterranean RegionAnnamaria Bevivino1*, Patrizia Paganin1, Giovanni Bacci2,3, Alessandro Florio2,
Maite Sampedro Pellicer1, Maria Cristiana Papaleo3, Alessio Mengoni3, Luigi Ledda4, Renato Fani3,
Anna Benedetti2, Claudia Dalmastri1
1 ENEA (Italian National Agency for New Technologies, Energy and Sustainable Economic Development) Casaccia Research Center, Technical Unit for Sustainable
Development and Innovation of Agro-Industrial System, Rome, Italy, 2 Consiglio per la Ricerca e la Sperimentazione in Agricoltura - Research Centre for the Soil-Plant
System, Rome, Italy, 3 Laboratory of Microbial and Molecular Evolution, Department of Biology, University of Florence, Florence, Italy, 4 Dipartimento di Agraria, University
of Sassari, Sassari, Italy
Abstract
Land-use change is considered likely to be one of main drivers of biodiversity changes in grassland ecosystems. To gaininsight into the impact of land use on the underlying soil bacterial communities, we aimed at determining the effects ofagricultural management, along with seasonal variations, on soil bacterial community in a Mediterranean ecosystem wheredifferent land-use and plant cover types led to the creation of a soil and vegetation gradient. A set of soils subjected todifferent anthropogenic impact in a typical Mediterranean landscape, dominated by Quercus suber L., was examined inspring and autumn: a natural cork-oak forest, a pasture, a managed meadow, and two vineyards (ploughed and grasscovered). Land uses affected the chemical and structural composition of the most stabilised fractions of soil organic matterand reduced soil C stocks and labile organic matter at both sampling season. A significant effect of land uses on bacterialcommunity structure as well as an interaction effect between land uses and season was revealed by the EP index. Clusteranalysis of culture-dependent DGGE patterns showed a different seasonal distribution of soil bacterial populations withsubgroups associated to different land uses, in agreement with culture-independent T-RFLP results. Soils subjected to lowhuman inputs (cork-oak forest and pasture) showed a more stable bacterial community than those with high human input(vineyards and managed meadow). Phylogenetic analysis revealed the predominance of Proteobacteria, Actinobacteria,Bacteroidetes, and Firmicutes phyla with differences in class composition across the site, suggesting that the microbialcomposition changes in response to land uses. Taken altogether, our data suggest that soil bacterial communities wereseasonally distinct and exhibited compositional shifts that tracked with changes in land use and soil management. Thesefindings may contribute to future searches for bacterial bio-indicators of soil health and sustainable productivity.
Citation: Bevivino A, Paganin P, Bacci G, Florio A, Pellicer MS, et al. (2014) Soil Bacterial Community Response to Differences in Agricultural Management alongwith Seasonal Changes in a Mediterranean Region. PLoS ONE 9(8): e105515. doi:10.1371/journal.pone.0105515
Editor: Jack Anthony Gilbert, Argonne National Laboratory, United States of America
Received May 24, 2014; Accepted July 23, 2014; Published August 21, 2014
Copyright: � 2014 Bevivino et al. This is an open-access article distributed under the terms of the Creative Commons Attribution License, which permitsunrestricted use, distribution, and reproduction in any medium, provided the original author and source are credited.
Data Availability: The authors confirm that all data underlying the findings are fully available without restriction. All relevant data are within the paper and itsSupporting Information files. Accession numbers of phylogenetic assignment of bacterial isolates are available from GenBank database and are the reported inTable S5.
Funding: This research was funded by MIUR (Integrated Special Fund for Research - FISR) in the frame of the Italian National Project SOILSINK ‘‘Climate changeand agro-forestry systems, impacts on soil carbon sink and microbial diversity’’, and partially supported by MIUR (Research Department of Italian Government) inthe framework of the Agreement Program ENEA-CNR (Articolo 2, comma 44, Legge 23.12.2009 n. 191 - Legge Finanziaria 2010). The funders had no role in studydesign, data collection and analysis, decision to publish, or preparation of the manuscript.
Competing Interests: The authors have declared that no competing interests exist.
* Email: [email protected]
Introduction
Soil microorganisms play an important role as regulators of
major biogeochemical cycles and can significantly affect the
ecosystem functioning [1], being involved in organic matter
dynamics, nutrient cycling and decomposition processes [2]. The
anthropogenic activities affect the diversity of natural habitats
modifying the number of species occurring in the environment at
the landscape scale. Soil management strongly influences soil
biodiversity in agricultural ecosystems. Different practices can alter
the below-ground ecosystem, often leading to depletion of soil
carbon and loss of biodiversity, and thus affecting the structure of
the resident microbial communities [3]. Therefore, characterizing
genetic and functional diversity of soil bacterial communities in
response to agricultural practices and/or climate is fundamental to
better understand and manage the ecosystem processes.
The Mediterranean area is one of the most important
biodiversity hotspots in the world and is increasingly threatened
by intensive land use [4]. The high environmental diversity that
characterizes the Mediterranean region is related to the integra-
tion of natural ecosystems and traditional human activities such as
the agroforestry practices [5]. The collapse of the traditional agro-
silvo-pastoral system that occurred during the past century has led
to major changes in the extension of woodlands dominated by
PLOS ONE | www.plosone.org 1 August 2014 | Volume 9 | Issue 8 | e105515

typical Mediterranean species, i.e. cork oak (Quercus suber) and/
or holm oak (Quercus ilex) woodlands [6], [7]. Research on the
influence of management practices on the biodiversity of these
agro-silvo-pastoral systems is increasing but it has focused mostly
on plants [8] and vertebrates [5], [9]. In the frame of the Italian
Project SOILSINK (Climatic changes and agricultural and forest
systems: impact on C reservoirs and on soil microbial diversity), a
hilly basin in Gallura (Berchidda site, Sardinia, Italy) was selected
as a reference Mediterranean site for studying the influence of
land-use changes on diversity, function and seasonal variations of
soil microbial communities [10], [11]. The site is within an area of
about 1,450 ha and is characterised by extensive agro-silvo-
pastoral systems, typical of north-eastern Sardinia (Italy) and
similar areas of the Mediterranean basin [12]. The chosen site
represents a sustainable balance between human activities and
natural resources that have created a landscape of high
heterogeneity and cultural value, whose importance has been
recognized at the European level [13], [14]. Indeed, it is
considered climatically (Mediterranean zone) and pedologically
homogeneous with vegetation patterns similar to those called
dehesas or montados of the south-western Iberian Peninsula [15],
[16], [17]. In the past, this area was covered by cork-oak forests,
which gradually were subjected to increasing under-storey grazing
and usage for the extraction of cork. Today, there are different
land-use and plant cover types that lead to a soil and vegetation
gradient with an ecological progression: from a cork-oak forest
undergoing minimum disturbance to managed vineyards with an
intensive agricultural practice (grass covered and ploughed),
passing through areas with temporary grassland, and pasture.
The different land uses altered soil potential, making possible to
discriminate the role of human management on soil functioning.
When forests are converted to grasslands, and grasslands turned
into agricultural lands, a sharp switch from one type of soil
microbial community to another one occurs. Since the ability of an
ecosystem to withstand serious disturbances may partly depend on
its microbial component(s), characterizing bacterial community
composition and/or structure might help to better understand and
manipulate ecosystem processes. The aim of the present study was
to investigate the effects of soil characteristics and different
agricultural managements on soil bacterial community in two
seasons. Sampling was carried out in spring and autumn 2007,
when the plant cover-growing season usually starts and ends. A
combination of culture-based and molecular techniques along with
statistical analysis of data obtained was applied to interrogate the
diversity, function, and ecology of soil bacterial communities. The
results obtained in the present study, along with the other ones
obtained within the SOILSINK Project [11], [18], [19], [20],
provide useful data on the impact of soil type, cover vegetation,
and human activities on the distribution of the bacterial genetic
resources in soil communities for this Mediterranean region. Our
results confirm that the environments with low inputs (cork-oak
forest and pasture) show a more stable soil microbial community
than those subjected to increasing human input (vineyards and
managed meadow) and suggest that soil bacterial communities are
seasonally distinct with compositional shifts that track with
changes in land use and soil management.
Materials and Methods
Ethics StatementWe carried out the study on the hilly basin in Gallura (Olbia-
Tempio municipalities, Sardinia, Italy). Five soils uses were
identified in private farms within Berchidda site (40u499 150N,
9u179 320 E) and were obtained. The soil sampling was carried out
in the frame of a national research project (SOILSINK Project)
and soils used in this study were collected under consent of the
landowners. The responsible of the study site was Prof. P.P.
Roggero (University of Sassari, Italy). We confirm that our study
did not harm the environment and did not involve endangered or
protected species. Specific geographic coordinates (referred to
World Geodetic System, 1984) of our study area are reported in
Table S1.
Sampling siteThe study area (Olbia-Tempio) is representative of the climate,
vegetation type and management of some of the most common
agro-forestry systems in the Mediterranean basin [16].
The Berchidda site is made up of hydromorphic and granitic
soil with a loamy sand texture. The altitude ranges from 275 m to
300 msl. This area is referred to as a meso-thermo Mediterranean,
subhumid phytoclimatic belt with a mean annual rainfall of
862 mm and the mean annual temperature of 13.8uC [10]. In the
Figure 1. Long-term effects of different land-use with increasing level of intensification in spring and autumn. Both pasture andmanaged meadow included spotted cork oak trees, which are key components of the Dehesatype landscape typical of this area of Sardinia. The cork-oak formation, pasture, and managed meadow have been converted to the current use and maintained unchanged for more than 30 years, whereasthe non-tilled cover cropped vineyard and the tilled one were planted in 1985 and 1994, respectively. From the left to right: cork-oak forest (CO),hayland pasture rotation (PA), managed meadow (MM), grass covered vineyard (CV), tilled vineyard (TV).doi:10.1371/journal.pone.0105515.g001
Soil Biodiversity in a Mediterranean Region
PLOS ONE | www.plosone.org 2 August 2014 | Volume 9 | Issue 8 | e105515

past, the Berchidda area was covered by cork-oak forests
(dominated by Quercus Suber L.), which were subjected to intense
usage for the extraction of cork. Today, there are five main
different land-use units close together: cork-oak forest (CO),
hayland-pasture rotation (PA), managed meadow (MM), and tilled
(TV) and grass covered vineyard (CV). The cork-oak formation,
pasture, and managed meadow have been converted to the
current use and maintained unchanged for more than 30 years,
Figure 2. Effect of land-use and season on soil physical-chemical and biological parameters. A) Heat map with hierarchal clustering ofphysical-chemical and biological parameters across the five Sardinia soils with different land uses at the two different sampling time points (May andNovember). The heat map was constructed using a maximum-minimum normalization of the data in order to represent each value in a rangebetween 0 and 1. Higher values are represented by darker colors whereas lower ones are represented by lighter colors. CO = cork-oak forest;PA = hayland-pasture rotation; MM = managed meadow; TV = tilled vineyard; CV = grass covered vineyard. B) PCA ordination of data (axes 1 and 2)generated from physical-chemical and biological properties of the different types of land use in May and November.doi:10.1371/journal.pone.0105515.g002
Soil Biodiversity in a Mediterranean Region
PLOS ONE | www.plosone.org 3 August 2014 | Volume 9 | Issue 8 | e105515

whereas the non-tilled cover cropped vineyard and the tilled one
were planted in 1985 and 1994, respectively. The five soils are
located inside an area of 161.5 km2. Detailed characteristic and
management of the five soils have been previously described [12],
[20], [21], [22], [23].
Figure 3. Effect of land-use and season on Eco-Physiological (EP) index of culturable bacteria (A) and diversity indices from CD-DGGE profiles (B).doi:10.1371/journal.pone.0105515.g003
Soil Biodiversity in a Mediterranean Region
PLOS ONE | www.plosone.org 4 August 2014 | Volume 9 | Issue 8 | e105515
Pedological characterization of the study areaThe pedogenic substrate of the study area consists of medium-
grained granite, affected by localized presence of veins of quartz
and porphyry. The morphology of the Berchidda area varies from
flat to undulating. The processes of soil erosion by water
channeled are evident only in the short-term forage crops made
on soil with more than 15% of slope. All profiles have a horizons
sequence of the type A-Bw-C or A-Bw-BC-C or more rarely, A-
Bw-C-R (Table S1). The power of the profiles, limited to horizons
A and Bw, varies from a minimum of 38 cm to a maximum of
100 cm. In three soil profiles in TV, the sequence between the
horizon A and Bw and the substrate is gradually altered by the
presence of a horizon BC, characterised by coarse texture, the
power of which varies from about 30 cm to 90 cm. Direct contact
with the unaltered rock, R horizon, was observed only in one
profile in CV. The prevailing textural classes are sandy and sandy
loam. The content of organic substance in the horizons A is never
very high, with average value around to about 3%. The maximum
values of 11.8% and 8.6% were observed on the A horizons in two
soil profiles in CO. The exchange complex, in agreement with the
reduced content in clays, is never high. The degree of base
saturation is predominantly less than 60% (Dystric conditions of
the USDA Soil Taxonomy). The profiles with the exchange
complex with a degree of base saturation below 60% in all
horizons between 25 and 75 cm (TV, CV, MM, and PA) were
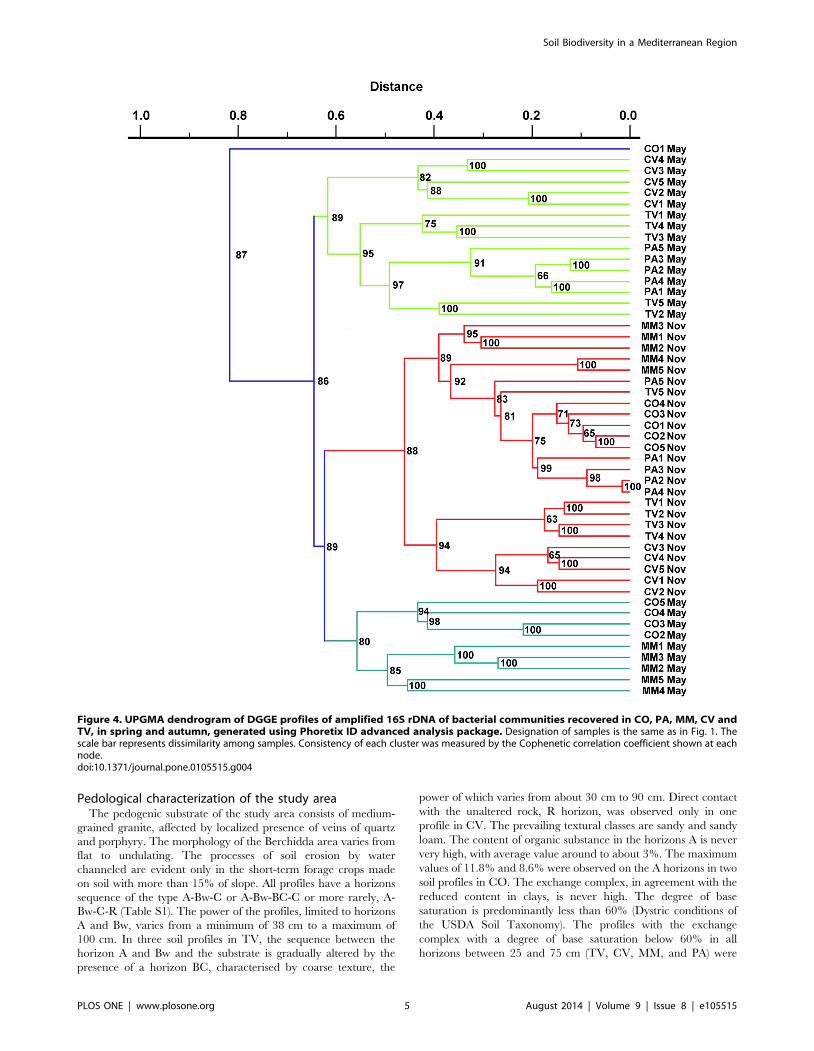
Figure 4. UPGMA dendrogram of DGGE profiles of amplified 16S rDNA of bacterial communities recovered in CO, PA, MM, CV andTV, in spring and autumn, generated using Phoretix ID advanced analysis package. Designation of samples is the same as in Fig. 1. Thescale bar represents dissimilarity among samples. Consistency of each cluster was measured by the Cophenetic correlation coefficient shown at eachnode.doi:10.1371/journal.pone.0105515.g004
Soil Biodiversity in a Mediterranean Region
PLOS ONE | www.plosone.org 5 August 2014 | Volume 9 | Issue 8 | e105515

classified as Typic Dystroxerepts [24]. The other one (CO) was
classified as Lithic Xerorthents.
Soil samplingFive soil replicates were collected from bulk soil of the five
different managements (CO, PA, MM, CV, and TV) (Fig. 1). Soils
were collected in May and November 2007. After removal of litter
layer, soil core samples (50 to 100 g; diameter, 5 cm) were taken
from each of the five locations, using a 5-on-dice sampling pattern
with ca. 70 m distance between each sampling point. Sampling
was performed at 20 cm depth, where most microbial activity is
known to occur [25], [26]. In the vineyard soils, samples from
along the rows and between the rows were pooled together to form
a field replicate. The other soil samples (CO, PA, MM) were
collected out of trees influence. At each season and for each soil
type, five randomly field replicates were collected for a total of 25
soil samples (5 replicates 6 5 land uses), each one being a
composite sample of five soil cores. A total of 50 composite
samples were taken for the two seasons. Soil samples were
immediately sieved (,2 mm) to remove fine roots and large
organic debris, air dried, and transported to the labs for
microbiological analysis. The moisture content was adjusted to
60% of their water holding capacity (WHC) and soil samples were
then left to equilibrate at room temperature in the dark for one
day prior to analyses, in order to restore, within limits [27], the
microbial activity of air- dried soils to that of soils in the field.
Chemical and biochemical analyses of soil samplesThe chemical and biochemical analyses were performed on
three replicates for each land use for a total of 15 soil samples (3
replicates 6 5 land uses), each one being a composite sample of
five soil cores. Total organic carbon (Corg) was estimated after
oxidation with K2Cr2O7 and subsequent titration of unreduced
Cr2O722 with Fe(NH4)2(SO4)2, as reported by Springer and Klee
[28]. Soil Organic Matter (SOM) was determined by Corg
multiplied by 1.724 van Belem coefficient. The Corg fractionation
was set up as reported by Ciavatta and co-workers [29]. In
particular, solid samples were extracted at 65uC for 24 h using
0.1 mol l21 NaOH plus 0.1 mol l21 Na4P2O7 solution (1:50,
solid:liquid ratio). The samples were then centrifuged at 50006gand the supernatants were filtered through a 0.20-mm Millipore
filter (Millipore, Billerica, MA) (total extractable C, Cext). The
humic-like acid (HA) fraction was separated from the fulvic-like
acid (FA) and the non-humified carbon fractions (NHC) by
precipitation after acidification of the alkaline solution (superna-
tant) to pH,2. Chromatography on a column of polyvinylpyrrol-
idone (PVP, Aldrich, Germany) was used to separate the NHC
from the FA. The FA was then combined with the HA to obtain
total humified fraction (HA+FA). Total extractable C (Cext %),
humic and fluvic acid C (CHA+FA %) were determined by the
dichromate oxidation method. The non-humified carbon (CNH)
was determined as the difference between Cext and CHA+FA.
Humification indexes HI, DH, and HR were determined
according to previous works [29], [30].
Microbial biomass C (Cmic) was determined by the fumigation-
extraction method of Vance and co-workers [31] with some slight
modifications. The measurements were performed on air-dried
soils, pre-conditioned by a 10-d incubation in open glass jars, at –
33 kPa water tension, and 30uC. The incubation was employed for
restoring, within limits [27], the microbial activity of air-dried soils
to that of soils in the field. Four replicates of each soil sample were
used. Average values are given in mg C kg–1 of soil. For measuring
microbial respiration, 20 g (oven-dry basis) of moist sample were
placed in 1 L stoppered glass jars. The CO2 evolved was trapped,
after 1, 2, 4, 7, 10, 14, 21, 28 days of incubation, in 2 ml 1 M
NaOH and determined by titration of the excess NaOH with
0.1 M HCl [32].
Non-linear least square regression analysis was used to calculate
parameters affecting C mineralization from daily CO2 evolution
data (Stat Win 4.0 for Windows). The best fit was obtained with
the exponential model of CO2-C accumulation according to the
negative exponential decay model:
Cm~C0 1{e{kt� �
,
where Cm is the cumulative value of mineralized C during t days, kis the rate constant, and Co is the potentially mineralizable C [33].
The CO2 emitted in 28 days of incubation was used as cumulative
respiration (Ccum). The CO2 evolved during the 28th day of
incubation was used as the basal respiration value (Cbas). Microbial
indices were calculated as follows [34], [35], [36]:
qCO2~½ mg CO2{Cbas|mg{1Cmic
� �h{1�103,
qMcum~ mg CO2{C0|mg{1Corg
� �,
qMbas~(mg CO2{Cbas|mg{1CorgÞ
Figure 5. Relative abundances of major taxonomic groups across land use systems in spring and autumn. Detailed data of each classare listed in Additional file 1: Table S6. CO = cork-oak forest; PA = hayland-pasture rotation; MM = managed meadow; TV = tilled vineyard; CV = grasscovered vineyard. Values presented are the mean percent.doi:10.1371/journal.pone.0105515.g005
Soil Biodiversity in a Mediterranean Region
PLOS ONE | www.plosone.org 6 August 2014 | Volume 9 | Issue 8 | e105515

Recovery of cultured bacterial cells from soil samplesSoil bacterial community analysis was performed on five soil
replicates for each land use, as described above. Bacterial cell
extraction was performed according to the recommendations of
Smalla et al. [37] with minor modifications. Briefly, 1 g of soil was
placed in a sterile 15 ml plastic tube containing 10 ml of
phosphate buffered saline (PBS, pH 7.0). This mixture was
homogenized for 300 at low speed by using the Ultra-Turrax
Thyristor Regle 50 (Janke & Kunkel IKA-Labortechnik). After
homogenization, suspension was placed into a Erlenmeyer flask
(100 ml) containing 10 g of glass beads (0,2 mm) and shaken for
1 h at 180 r.p.m. and 28uC to disperse bacteria. The flasks and
glass beads were autoclaved for 20 min at 121uC before use. The
soil suspension was transferred into a sterile 15 ml plastic tube and
serially diluted with sterile saline solution (9 g l21NaCl) from 1021
up to 1027. The, 100 ml aliquots of serially diluted soil suspensions
were plated in triplicate on 0.1 Triptic Soy Broth (TSB; Difco)
amended with 15 g l21 agar (0.1 TSA) and 100 g ml21 of
cycloheximide (Sigma) to inhibit fungal growth. Plates were
incubated at 28uC for 6 days.
Figure 6. Plot of the taxonomic composition of total bacterial community as inferred from taxonomic interpretation of T-RFLPprofiles.doi:10.1371/journal.pone.0105515.g006
Soil Biodiversity in a Mediterranean Region
PLOS ONE | www.plosone.org 7 August 2014 | Volume 9 | Issue 8 | e105515

Growth strategy and total bacterial populationsTo determine the changes in the structure of culturable fraction
of soil bacteria, the r/K-strategy concept proposed by De Leij and
co-workers [38] was used. Bacterial colonies appearing within
48 h were designated as r-strategists, and the remaining as K-
strategists. Colonies were enumerated at 1, 2 and 6 days of growth
on 0.1 TSA; in this way, three counts (or classes) were generated
per sample. Plates containing between 30 and 300 colonies were
then selected for enumeration. Total bacterial counts obtained
were expressed as colony forming units (CFU) per gram of soil.
Distribution of bacteria in each class as a percentage of the total
counts gave insight into the distribution of r- and K-strategists in
each sample.
To evaluate the changes in the biodiversity of bacterial
populations in soils, the eco-physiological (EP) index [38] was
used. The EP index of each soils tested was calculated using the
equation:
H,~{
XPi)(logePið Þ,
where Pi represents the CFU on each day (1, 2 and 6 days of
incubation) as a proportion of the total CFU in that sample after 6
days incubation, i.e., the proportion of colonies appearing on
counting day i (i = 1, 2, 6) with EPmin = 0. Higher values of EP
index imply a more even distribution of proportions of bacteria
developing on different days (i.e., different classes of bacteria).
Terminal-Restriction Fragment Length Polymorphism (T-RFLP)
DNA was extracted from soil samples by using the FastDNA
SPIN Kit for Soil (QBiogene). Terminal-Restriction Fragment
Length Polymorphism (T-RFLP) was performed on 16SrRNA
genes amplified from extracted DNA with primer pairs P0 and P6
as previously reported [39], [40]. Purified amplification products
were digested separately with restriction enzymes RsaI and MspI
and digestions were resolved by capillary electrophoresis on an
ABI310 Genetic Analyzer (Applied Biosystems, Foster City, CA,
USA) using LIZ 500 (Applied Biosystems) as size standard. T-
RFLP analysis was performed as previously reported [41].
Diversity indices were calculated with PAST software [42] as
previously reported [19], taking into account peak intensities of T-
RFLP fragments. Taxonomic interpretation of T-RFLP profiles
was performed by querying the Ribosomal Database Project
Database by using MiCA3 web tool (http://mica.ibest.uidaho.
edu/), as previously described [40].
Culture-dependent DGGE (CD DGGE) analysisCulture-dependent DGGE (CD DGGE) fingerprinting of 16S
rRNA gene was used to characterize mixed bacterial communities
recovered on agar plates.
Collection of cultured bacterial communities for DGGE analysis.Cultured bacterial communities were collected following proce-
dure proposed by Duineveld and co-workers [43] with minor
modifications. Briefly, after one week of incubation at 28uC,
colonies were removed from plates containing between 100 and
1000 colonies by adding 3.0 ml sterile physiological solution (0.9%
NaCl) on each plate and scraping off all grown colonies with a
sterile Drigalski spatula. The cell suspensions thus obtained were
aliquoted into 1.5 ml Eppendorf tubes and centrifuged at
8,000 r.p.m. for 10 minutes. The pellets were stored at 280uCfor subsequent DNA extraction and PCR-DGGE analysis.
DNA extraction and PCR amplification of 16S rRNA genes.Genomic DNA was extracted with sodium dodecyl sulfate-
proteinase K lysis buffer, followed by a treatment with cetyl-
trimethylammonium bromide (CTAB) as described in CurrentProtocols for Molecular Biology [44]. Briefly, the pellet was
resuspended in 567 ml of TE [10 mM Tris-HCl - 1 mM EDTA
(pH 8.0)] buffer, and glass beads 0.3 mm in diameter (250 mg)
were added, followed by bead beating for 20 s. Then, 30 ml of
10% sodium dodecyl sulfate and 3 ml proteinase K 20 mg/ml
(Sigma) were added and samples were incubated at 37uC for 1 h.
Glass beads were removed by centrifugation 2 min at 2,800 rpm
and samples were then incubated at 65uC for 109 with100 ml of
5 M NaCl prepared with sterile water and 80 ml of CTAB/NaCl
(10% CTAB in 0.7 M NaCl). Following incubation, extracts were
purified by using phenol/phenol-chloroform/isoamyl alcohol
(49.5:49.5:1) extraction and DNA was recovered by isopropanol
precipitation at 4uC o/n. Pelleted DNA was washed twice with
cold 70% ethanol, allowed to air dry, and re-suspended in 50 ml of
sterile water. Quantity and purity of DNA were checked by
NanoDrop (NanoDrop Technologies, USA) and gel electropho-
resis. The DNA samples were stored at –20uC until required for
use.
The 16S rRNA gene was amplified using 20 ng of lysate
suspension and the universal bacterial primers P0 and P6 [45].
Dilutions 1:100 (2 ml) of the1450 bp PCR products were then used
as template for the second PCR amplification with the forward
primer 63F (59- AGGCCTAACACATGCAAGTC -39), with a
GC clamp (59-CGCCCGCCGCGCGCGGCGGGCGGGGCG-
GGGGCACGGGGGG -39) incorporated at the 59 end, and the
reverse primer 518R (59-ATTACCGCGGCTGCTGG-39), to
produce 495 bp fragments suitable for DGGE analysis [46]. Both
PCR reactions were performed in Qiagen Taq buffer (10X)
containing 1.5 mM MgCl2, with 150 ng of each primer, 250 mM
(each) deoxynucleoside triphosphates, and 0.5 U of Taq DNA
polymerase (Qiagen, Hilden, Germany) in a 25 ml reaction
volume. Cycle parameters for PCR with the primer pairs P0–P6
and 63F-GC and 518R were previously described by Di Cello
and co-workers [45] and El Fantroussi and co-workers [46],
respectively.
Denaturing Gradient Gel Electrophoresis. 16S rRNA gene
amplicons were separated by double gradient denaturing gradient
gel electrophoresis (DG-DGGE) as described by Cremonesi et al.
[47], in a DCode universal mutation detection system (Bio-Rad,
CA, USA). Separation of purified PCR products (700 ng) was
achieved in6%–12% polyacrylamide (acrylamide: N,N-methyle-
nebisacrylamide, 37.5:1) gels containing an increasing linear
gradient of denaturants ranging from 30% to 60% (100%
denaturant corresponds to 7 M urea and40% deionized formam-
ide). Each gel also included marker lanes represented by DGGE
profiles containing a large number of discrete bands spanning the
entire gradient, suitable for within- and between-gel alignment.
Electrophoresis were carried out for 16 h at 75 mV in 1X TAE
buffer at 60uC, stained with 50 mg/ml ethidium bromide for
30 min, destained in water and photographed with the UVIpro
Platinum Gel Documentation System (GAS7500/7510; Eppen-
dorf, Cambridge,UK).
Cluster analysis and diversity indicesQuantity One software package (Bio-Rad) and Phoretix 1D
PRO software (Phoretix International, Newcastle upon Tyne,
United Kingdom) were used for CD-DGGE profile analysis. The
cluster analysis and dendrogram generation were carried out by
using the Phoretix 1D Pro software according to the manufactur-
er’s instructions (Phoretix International, Newcastle upon Tyne,
Soil Biodiversity in a Mediterranean Region
PLOS ONE | www.plosone.org 8 August 2014 | Volume 9 | Issue 8 | e105515
United Kingdom). Bands of CD-DGGE patterns were aligned and
normalized using reference lanes. Background noise was subtract-
ed by rolling ball algorithm with a radius of 50 pixels; the
automatic band detection was performed with a minimum slope of
200 and a noise reduction of 10, and peaks smaller than 2% of the
maximum peak were discarded. Bands were manually corrected
and matched to create an absent/present binary matrix. The
similarity between the band patterns was calculated using the Dice
coefficient and the clustering analysis was performed with the
unweighted pair group method with arithmetic averages (UP-
GMA) to generate a dendrogram by using mathematic averages
algorithm programs integral to the Phoretix 1D Pro software.
Coefficient of cophenetic correlation was used to measure the
consistency of clusters.
DGGE banding data were used to estimate three diversity
indices by treating each band as an individual operational
taxonomic unit (OTU). The number of DGGE bands present in
each sample was used to measure the Richness index (R). The
Shannon-Weaver index of general diversity (H9) [48] and the
Simpson index of dominance (D) [49] were calculated from the
number of bands present and the relative intensities of each band
(Pi) in each lane. Relative signal intensities of detected bands, in
each gel track, were determined by using the Quantity One
software package (Bio-Rad) and calculated from the peak area of
the densitometric curves.
The Shannon-Weaver diversity (H’) was calculated using the
following equation:
H,~{
XPið Þ(logePi),
where Pi (the proportion of abundances of the ith band) is
measured as:
Pi~ni=N,
where ni is the peak height of a band, and N is the sum of all peak
heights in the densitometry profiles.
The Simpson index (D) was calculated with the formula:
D~X
(PixPi);
it measures the strength of dominance because it weights towards
the abundance of the OTUs and varies inversely with species
diversity [50].
Bacterial isolation and identificationA total of 100 bacterial colonies were randomly picked up for
each soil sample from 0.1 TSA plates (containing approximately
50 to 500 colonies), previously used for the determination of the
CFU counts and EPI-index, and repeatedly streaked onto 0.1 TSA
fresh plates to obtain pure cultures. Isolated colonies were then
grown overnight (o/n) in TSB medium at 28uC and 200 r.p.m.,
and stored at 280uC in 30% glycerol until further analysis. From
all five soil samples, 500 colonies were isolated in each season, for a
total of 1000 bacterial colonies. A total of 203 colonies with
different morphologies (about 20 colonies per each sample) were
taken up to investigate their taxonomic affiliation.
Genomic DNA and PCR amplification of the 16S rRNA gene
were performed as described above. Sequencing reactions were
prepared from PCR products using an Applied Biosystem Big Dye
Terminator sequencing kit version 3.1, according to the manu-
facturer’s instructions and analysed using a 3730 DNA Analyzer
Applied Biosystem apparatus. The sequences were compared with
those in the GenBank databases by using the BLAST program and
Seqmatch tool of the RDP (http://www.ncbi.nlm.nih.gov/
BLAST/and http://rdp.cme.msu.edu/, respectively) and aligned
with the closest relatives with the Clustal W function of the BioEdit
package [51]. Bacterial identification by 16S rRNA gene
sequences assignment was performed using the RDP Classification
Algorithm (http://rdp.cme.msu.edu/classifier/classifier.jsp).
Statistical analysisBacterial population data (CFU/g of soil) were log transformed
and subsequently analysed by one-way ANOVA (STATISTICA,
Release 3.0b, Copyright StatSoft Inc., CA, USA). Percentage data
of EP index value were logit-transformed, as follows:
Logit pð Þ~log p= 1{pð Þ½ �
for the proportion p, and compared using one-way ANOVA
(STATISTICA, Release3.0b, Copyright StatSoft Inc., CA, USA).
Analyses of variance (ANOVA) on biodiversity indexes
(Shannon-Weaver, Richness and Simpson), principal component
analysis (PCA) and clustering analysis on biochemical data were
performed using R packages ‘‘stats’’ and ‘‘vegan’’ (http://cran.r-
project.org/and http://cran.r-project.org/web/packages/vegan/
index.html). All data clustering were performed using the
‘‘UPGMA’’ algorithm implemented in the ‘‘hclust’’ function of
the R ‘‘stats’’ package. Distances among samples were calculated
using ‘‘Bray-Curtis’’ distance implemented in ‘‘vegan’’ package as:
i~sample i ; j~sample j , BCij~2Cij= SizSj
� �,
where Cij = sum of the smaller value for species in common
between samples i and j, and Si and Sj = total number of species in
samples i and j, respectively [52]. Variation of biodiversity indexes
of cultured bacteria was inspected using ANOVA analysis.
Biodiversity indexes were first divided into groups depending on
sampling season and different managements of soils and then the
analysis was performed. Clustering analysis (UPGMA) on
biochemical parameters was performed. Each parameter was first
divided in groups, in the same way of previous ANOVA analysis,
and averaged. Then, each result obtained was normalized using
the maximum-minimum normalization technique in order to
make the data comparable. PCA analysis using each biochemical
data was performed.
Results and Discussion
Effect of land use on soil chemical and biochemicalproperties
Soil organic matter (SOM) represents a dynamic system
influenced by several factors, including climate, clay content,
mineralogy and soil management, which all affect the processes of
organic matter transformation and evolution in soil [53], [54].
Both soil fertility and stability are related to the organic matter
content of soil. Many functions of SOM are due to its more
stabilised fractions, humified materials and balance between the
labile and the stabilised fractions [55]. Changes in SOM content
are related to changes in microbial biomass turnover, because they
reflect the balance between rates of microbial organic matter
accumulation and rates of organic matter degradation. The extent
of organic matter’s organization not only impacts the amount of
carbon mineralized but also the type of carbon that is consumed
by the microorganisms.
Soil Biodiversity in a Mediterranean Region
PLOS ONE | www.plosone.org 9 August 2014 | Volume 9 | Issue 8 | e105515

In this study two categories of soil quality indicators were used:
organic matter quality indicators and microbial biomass activity
indicators (Tables S2 and S3). Our results (Fig. S1) revealed that
both land use and sampling season affect the chemical and
structural composition of the most stabilised fractions of SOM. A
higher content of Corg occurred in CO soil in May, and Cext and
CHA+FA showed the same pattern, whereas the average values of
these parameters were slightly higher in PA soil in November.
These results were reflected in the humification parameters, where
the humification rate (HR%) can provide quantitative information
about the humic substances content normalised with respect to
total SOM, while the degree of humification (DH%) provides the
amount of the humified carbon in the extracted organic fraction
and the humification index (HI) can be considered as an index of
soil humification activity as well as of availability of non humified
labile fractions [29]. Overall, land use change reduced soil C
stocks and labile organic matter at both sampling times except for
PA in November. Pasture has a great potential soil organic C stock
and, in the long term, grass management systems have nearly
equivalent potential to store soil organic C as forest [56].
Potentially mineralizable C (C0), which indicates the amount of
C in the labile fraction of soil organic matter, decreased over
sampling time in all soils, and Cmic similarly declined. Cultivated
soils are characterised by low microbial activity, mainly due to the
disappearance of easily decomposable organic compounds
through tillage and soil disturbance. As previously found for
chemical properties, the metabolic activity responds to the
different land uses; in both May and November samplings,
qCO2 was higher in CO soil when compared to the others,
resulting in increases stress. Hence, unfavourable conditions result
in a decrease in the size of the microbial biomass and the efficiency
of C substrates degradation, conducting to an increase in
respiration rate per unit of microbial biomass [57].
As beneficial and negative effects of soil management practices
are strongly linked to microbial activities and regulate soil quality
and functioning [58] the relationship existing between soil
management practices and variation in chemical and biochemical
parameters was evaluated, by performing a clustering analysis
(UPGMA) as reported in Tables S2 and S3. The dendrogram
obtained was linked to a heat-map representing all the biochemical
parameters variation (Fig. 2A). Data analysis revealed that
chemical and biochemical parameters clustered in two different
groups each of which corresponding to one of the two parameters
analyzed (chemical and biochemical). In both sampling times, TV
and CV clustered together, suggesting that seasonal change rather
than management regime was a major driving force contributing
to vineyard soil fertility. Furthermore, according to the UPGMA
clustering, CO formed a separate cluster from that of the other soil
uses (Fig. 2A). Interestingly, the chemical and biochemical
parameters clustered together in both CO and PA, regardless of
the season, in contrast to MM, CV and TV, where they clustered
separately in relation to the sampling season. This finding suggests
that soils subjected to low human inputs (pasture and cork-oak
forest) showed a more stable chemical and biochemical soil
composition than those with high human input (managed meadow
and vineyard).
The different positions of the variables in the plane of the first
two principal components, as revealed by PCA analysis (Fig. 2B),
indicated that chemical and biochemical parameters were
differentially affected by the various land use types. The first and
the second principal components (PC1 and PC2) accounted for
44.59% and 24.47% of the total variance in the data, respectively
(Fig. 2B). Both chemical and biochemical parameters were
positively affected by PC1 except for HR and DH, whereas PC2
was able to discriminate between the two variable sets, with the
most of chemical and biochemical parameters being positively and
negatively affected, respectively. The above analyses revealed an
important effect of land uses on both chemical and biochemical;
on the contrary, only biochemical parameters were affected by
seasons.
Influence of land use on soil bacterial communityCommunity structure analysis by EP-index and r-K
strategy. Environmental conditions select organisms that either
grow rapidly in uncrowded, nutrient-rich conditions (r-strategists),
or can efficiently exploit resources in crowded conditions (K-
strategists). In this work, we applied the method developed by De
Leij et al. [38], who used the r/K-strategy concept for the
characterization of soil bacterial communities. First, we compared
the microbial community structures found in the different land
uses during each of the two seasons. Since sampling was performed
at 20 cm depth, where most microbial activity is known to occur
[26], the main changes are expected through conversion from one
soil management system to another one [59]. Microbial commu-
nity structure found in the different land uses during each of the
two seasons was investigated by means of EP index that is a
measure of both richness (i.e. total number of species in the
community) and evenness (i.e. how evenly individuals in the
community are distributed over the different species) of groups of
microorganisms with similar developmental characteristics.
The cultured bacteria belonging to fast-growing organisms,
especially the r-strategists detected on day 2, dominated in all land
uses and in both seasons (Table S4). The MM soil exhibited a
lower EP index and a lower percentage of r-strategists in both
seasons, possibly due to amensalism from a dominant bacterial
group in the community. Variation of EP index of cultured
bacteria was inspected using an ANOVA analysis of variance
(Fig. 3A). Interestingly, statistical analysis revealed a significant
effect of land uses on bacterial community structure (P,0.001) as
well as an interaction effect between land uses and season change
(P,0.001) on EP index. Variation of EP index due to seasonal
changes was significant in the soil with higher human impact (TV)
when compared with the other soils. Total bacterial concentra-
tions varied significantly in respect of season (P,0.001) being
higher in spring than in autumn (Table S2) in all but CO soils,
with significant differences between CO and PA in spring, and
between CO and MM, and MM and PA in autumn.
Overall results suggest that land uses affected cultured bacterial
communities. Soils with low human impact (cork-oak forest) have
a more stable bacterial density and show a less variation of
bacterial community structure across seasons than soils subjected
to high human impact such as tilled vineyard.
Bacterial community profiling by CD-DGGE and T-RFLP
analyses. Culture dependent DGGE (CD-DGGE) fingerprint-
ing of the 16S rRNA was used to characterize mixed bacterial
communities recovered on agar plates. CD-DGGE represents a
useful technique to follow the dynamics of distinct culturable
fractions of the soil bacterial community in relation to physical,
chemical and biological changes in the soil environment [60].
Since culture-dependent and culture-independent methods likely
profile distinct fractions of the soil bacterial community with
unique ecological roles [61], culturable bacteria may provide an
ecologically relevant complement to culture-independent commu-
nity characterization [62].
By pooling the bacterial cells growing on individual agar plates,
we obtained a culture-dependent bacterial community. The
analysis of DGGE profiles revealed clear banding patterns for
each land-use and plant-cover types of sufficient complexity to
Soil Biodiversity in a Mediterranean Region
PLOS ONE | www.plosone.org 10 August 2014 | Volume 9 | Issue 8 | e105515

investigate differences in soil microbial communities and identified
stable communities with highly reproducible profiles (Fig. S2). A
different community composition among land-use types was found
as evidenced by the presence of different dominant signals; this
finding indicated a compositional shift among soils examined in
spring and autumn and subjected to different anthropogenic
impact. Bacterial diversity was investigated through richness (R),
Shannon-Weaver (H’), and Simpson (D) indices. Analysis of
variance (ANOVA) confirmed the differences in the distribution of
bacterial species due to land uses and sampling seasons (P,0.001).
Both R and H’ indices decreased from May to November in MM
samples and increased in TV and CV samples, and the
complementary opposite trend was observed for D index (Fig. 3B).
Otherwise, cultured bacterial community in CO and PA soils did
not vary significantly over seasons. Most likely, these results reflect
the impact of both land-use and vegetation type and coverage on
soil microbial communities. In particular, the low shift of
biodiversity indices observed in CO and PA seems to be correlated
to a higher stability of bacterial populations in natural habitats
with low human impact, whereas populations inhabiting more
anthropogenic areas tend to be more variable. Land-use type and,
in particular, differences in vegetation dynamics may have a large
role in modulating the temporal variability in soil bacterial
communities. As observed by Lauber and co-workers [3], soils
from the different land-use types did not exhibit identical temporal
dynamics even though all the soils were located in close proximity
and exposed to the same climatic conditions. Diversity indices
obtained from T-RFLP analysis performed on total bacterial DNA
(Fig. S3) partially confirmed the trends of diversity shown by CD-
DGGE, though observed differences were not statistically signif-
icant (Table S5).
The unweighted pair-group method using arithmetic averages
(UPGMA) of bacterial community profiling by CD-DGGE
revealed a high diversity of the bacterial communities in each
land-use and plant-cover soils. The similarity between the DGGE
patterns of the soil bacterial communities revealed three distinct
clusters (Fig. 4). Samples collected in autumn grouped into a
separate cluster with about 52% similarity, whereas samples
collected in spring grouped into two separate clusters, each of
which composed by samples sharing about 40% similarity. The
highest similarity values were shown by clusters based on soil land
uses, suggesting a low bacterial variation within each soil type.
This finding is consistent with previous reports showing that land-
use type was the most important factor in determining the
composition of soil microbial community [3].
The clustering results based on CD-DGGE were in agreement
with culture-independent T-RFLP analysis that confirmed a
different seasonal distribution of soil bacterial populations with
subgroups associated to different land uses. Most of samples
retrieved from the same soil (CO, PA, and MM) clustered
together, whereas samples retrieved from TV and CV were often
intermixed in the UPGMA dendrogram (Fig. S4). As culture-
dependent and culture-independent profiles can separately resolve
unique, diverse, and equally complex fractions of the soil bacterial
community [60], our combined results from both CD-DGGE and
T-RFLP methods, applied on culturable and total fractions,
respectively, revealed an interaction effect between land uses and
season change in affecting soil bacterial communities.
Taxa responses to land use determined by phylogenetic
affiliation of soil bacterial isolates. Taxonomic affiliation
was investigated on a total of 203 bacterial isolates. In detail, 20–
21 colonies recovered from each soil sample at each season and
showing different morphologies (for a total of 101 bacterial isolates
in spring and 102 in autumn) were subjected to DNA extraction
and PCR amplification of 16S rRNA gene. An amplicon of the
expected size (about 1500 bp) was obtained from each isolate, and
its nucleotide sequence was determined and submitted to
GenBank (Table S6). Although it is generally accepted that not
all bacteria, including types of soil bacteria, are culturable, the
isolation of bacteria by agar plate cultivation and subsequent
phylogenetic analysis permit to isolate and identify previously
uncultured representatives or even new members of certain
bacterial species for further analysis of their metabolic function.
Therefore, even if the metagenome sequencing is becoming the
most powerful tool to investigate microbial communities, the
ability to isolate indigenous strains actually remains the unique
way to further characterize and select soil bacteria showing
interesting properties. Additionally, standard cultivation tech-
niques have been shown to be able to capture members of the soil
rare biosphere which could not be detected by metagenome
sequencing [63].
The 203 sequences obtained were compared with those present
in the GenBank databases by using the BLAST [64] program.
Results showed that most of 16S rRNA gene sequences matched
NCBI database sequences at 99–100% of similarity at the genus
level, with Arthrobacter, Bacillus, Stenotrophomonas, Pseudomonasand Burkholderia as the most representative genera. So, identi-
fication at the genus level was achieved in 103 isolates and at the
species level in 72 isolates, while 12 isolates were only affiliated to
taxa level higher than genus and 16 remained unidentified (Table
S6). Further comparison with GenBank databases by using the
Seqmatch tool of the RDP indicated that 16S rRNA gene
sequences were affiliated to four phyla: Proteobacteria (classes a, band c), Bacteroidetes (classes Flavobacteria and Sphingobacteria),
Actinobacteria and Firmicutes. Even though the RDP analysis does
not permit to affiliate a bacterial isolate to a given species, it
allowed to assess the genus of almost all isolates, including those
not identified through the BLAST search. In fact, a boostrap value
of at least 80% is satisfactory for RDP requirement. Almost all our
sequences gave rise to 100% boostrap, 12 ranged from 89% to
99%, and only two of them only resulted in low values (24 and
54% respectively, referred to two spring isolates).
Data obtained from both approaches allowed to assess that
Berchidda soil is colonized by bacteria included in the classes of c-
Proteobacteria (with a prevalence of Pseudomonas and Stenotro-phomonas genera), Actinobacteria (in particular, the genus
Arthrobacter), b-Proteobacteria (with a prevalence of Burkholderiagenus), Bacilli (with the genus Bacillus as the dominant one),
Flavobacteria and Sphingobacteria. The relative abundances of
the different classes identified by RDP across the different samples
related to soil uses and season are represented in Figure 5. A
putative taxonomic description of total bacterial community,
derived from the interpretation of T-RFLP data (Fig. S3) is
reported in Figure 6, in which the largest fraction of the
community is represented by members of Proteobacteria, with a-
Proteobacteria as the most abundant class.
Differences in class composition across the site were observed
suggesting that the microbial composition changes in response to
land uses. In fact, all the seven classes (a, b and c Proteobacteria,
Sphingobacteria Flavobacteria, Actinobacteria and Bacilli) were
present in CV, PA, and CO soils, while all classes but a-
Proteobacteria in TV and all classes but Sphingobacteria in MM
were found. The observed large diffusion of Proteobacteria in all
soil-uses is in agreement with previously reported data concerning
soil bacterial communities in different land-use systems [65].
Within Proteobacteria, the majority of the isolates fell into the
gamma subgroup, which showed higher relative abundance
compared to that of any other taxa at the class level while a few
Soil Biodiversity in a Mediterranean Region
PLOS ONE | www.plosone.org 11 August 2014 | Volume 9 | Issue 8 | e105515

were alfa proteobacteria, especially in vineyards and pasture. In all
soil-uses, were also found Actinobacteria, in agreement with
previous work [65], and b-Proteobacteria, like Burkholderia sp.,
previously detected by Pastorelli and co-workers [19] who
analysed the denitrifying bacterial communities present in the
same Berchidda soil samples. Among Bacteroidetes, it has to be
noted the relative abundance of the genera Chryseobacterium sp.
(in all soil uses) and Flavobacterium sp. (in all soil uses, but MM),
which include isolates already observed in Korea soils [66], and
bacteria with plant growth promoting properties recovered in Iran
soil [67], respectively. As already pointed out by Fierer and co-
workers [68], the b-Proteobacteria and Bacteroidetes follow
copiotrophic lifestyles and their relative abundance were highest
in soils with high C availability. In general, copiotrophic bacteria
should have higher growth rates and traditional culturing methods
are likely to select for microorganisms that can grow rapidly in
high resource environments.
Strong differences in class composition were observed in each
soil when sampled in the two seasons: for instance, Bacilli and
Actinobacteria dominate in spring (particularly, Bacilli in CV and
CO, while Actinobacteria in MM and PA), whilst b-Proteobacteriatend to dominate in autumn. Six out of the seven identified classes
(b and c-Proteobacteria, Flavobacteria, Actinobacteria and Bacilli)were recovered in both seasons whilst Sphingobacteria were
recovered only in autumn. In all soils, Actinobacteria were
prevalent in spring, b Proteobacteria predominated in autumn,
while b and c-Proteobacteria in both spring and autumn. When
genera composition was used to infer the diversity indices of
cultured bacteria (Table S7) an increase of diversity (estimated as
Shannon H and Evenness) from May to November was present for
all soils, but CO, where Shannon H was slightly higher in May
than in November. In particular, MM soil showed the highest
increases for most indices, especially for alpha diversity (i.e. the
species richness and evenness within a sample) that has often been
correlated with ecosystem stability and functionality [69]. It must
be noted that cultivated bacterial populations did not fluctuate
with seasonal changes in soils with low human input (cork-oak
forest). The bacterial communities of the cork-oak forest soil were
similar in richness and composition, furthering the point that in a
community with moderate disturbance, new individuals and
groups could be introduced in a manner that promotes
competition and diversity of the community, thus establishing a
more stable community [65].
These data suggest that shifts from forest to managed meadow
and vineyard result in changes of bacterial communities compo-
sition. Previous studies have also shown that shifts from forest to
grassland soil [70], from cultivated system to pasture [71] and
from grazed pine forest to cultivated crop and grazed pasture [65]
resulted in significant changes in bacterial community composi-
tion. Our results suggest that the use of culture-dependent 16S
rRNA gene sequencing along with traditional analysis of soil
physiochemical properties may provide insight into the ecological
relevance of soil bacterial taxa.
Conclusion
Overall, data obtained in this work revealed an important effect
of land uses on both chemical and biochemical soil parameters.
Soil bacterial communities were seasonally distinct and exhibited
compositional shifts that tracked with changes in land use and soil
management. This study, combining the pedological and bio-
chemical data with microbiological and molecular analysis,
furnishes a good methodological approach to describe the
influence of different soil managements on soil microbial
community structure. In fact, the results demonstrate that, in the
same pedological conditions, long-term soil management influence
the community structure; i.e., soils subjected to low human inputs
(cork-oak forest and pasture) showed a more stable chemical and
biochemical soil composition as well as bacterial community than
those with high human input (vineyards and managed meadow).
Further research is required to determine whether the observed
shifts in bacterial community composition produce parallel
changes in the functional attributes of these communities across
soil types under different long-term management regimes. The use
of culture-independent approaches, like metabarcoding and
metagenome sequencing, will make it possible to identify the
specific drivers of land-use dynamics exhibited by soil bacterial
communities and to give a complete picture of the bacterial
communities in a typical Mediterranean agro-silvo-pastoral system.
Supporting Information
Figure S1 Box-plot analysis showing the frequencydistribution of physical-chemical and biological proper-ties of the five Sardinia soils.(TIFF)
Figure S2 Examples of CD-DGGE profiles of the soilbacterial communities associated to the different landuses in May and November. A) From the left to right: hayland
pasture rotation (PA), tilled vineyard (TV), grass covered vineyard
(CV) in May; B) managed meadow (MM), cork-oak forest (CO),
hayland pasture rotation (PA) in May; C) grass covered vineyard
(CV) in May, grass covered vineyard (CV) in November, tilled
vineyard (TV) in May; D) cork-oak forest (CO), hayland pasture
rotation (PA), managed meadow (MM) in November.
(TIFF)
Figure S3 Examples of T-RFLP profiles obtained afterdigestion with MspI (A) and RsaI (B) restriction enzymesof amplified of 16S rRNA gene sequences.(PDF)
Figure S4 Cluster analysis of T-RFLP patterns generat-ed by MspI and RsaI digestion of 16S rRNA genesequences. The UPGMA cluster analysis based on Jaccard
similarity matrix was calculated for each set of samples using the
‘‘hclust’’ function of the R ‘‘stats’’ package. The scale bar
represents the percent of dissimilarity.
(TIF)
Table S1 Pedological profiles and classification of thesoils investigated.(DOCX)
Table S2 Determination of total organic carbon soil(Corg), extractable carbon (Cext), humified carbon(CHA+FA), non humified carbon (CNH) and humificationparameters of the five Sardinian soils.(DOCX)
Table S3 Biochemical parameters measured in the fiveSardinian soils.(DOCX)
Table S4 r/k bacterial strategists, total culturablebacteria and EPI index measured in soils underdifferent long-term management practices.(DOCX)
Table S5 Diversity indices of total bacterial communi-ties as inferred from T-RFLP profiles.(DOCX)
Soil Biodiversity in a Mediterranean Region
PLOS ONE | www.plosone.org 12 August 2014 | Volume 9 | Issue 8 | e105515

Table S6 Phylogenetic affiliations of 203 randomlyselected soil bacterial isolates based on comparativeanalysis of their 16S rRNA gene sequences.(DOCX)
Table S7 The ratio of diversity indices related to theabundance of the different genera detected in culturedisolates between November and May.(DOCX)
Acknowledgments
We are grateful to P.P. Roggero (University of Sassari) and his team (G.
Seddaiu, G. Urracci and L. Doro) for their contribution to collect the
Sardinian soils and for providing data on experimental area. The
experimental site was chosen on the basis of vegetation and soil surveys
made in collaboration with S. Madrau, S. Bagella, R. Filigheddu, M.C.
Caria, and E. Farris (University of Sassari). We thank R. Pastorelli for her
help in soil sampling, S. Tabacchioni and L. Chiarini for bacterial
isolation, C. Cantale and M. Sperandei for figure preparation, M.T.
Rubino for chemical-biochemical analysis, and S. Cesarini and L. Pirone
for their valuable suggestions. The research was carried out in the context
of the FISR SOILSINK research project coordinated by R. Francaviglia
(CRA-RPS, Rome) (?http://soilsink.entecra.it).
Author Contributions
Conceived and designed the experiments: A. Bevivino RF CD A.
Benedetti. Performed the experiments: A. Bevivino PP MSP MCP CD
LL. Analyzed the data: A. Bevivino PP GB AF AM CD LL. Contributed
reagents/materials/analysis tools: A. Bevivino PP GB AF MSP AM LL
MCP RF CD A. Benedetti. Contributed to the writing of the manuscript:
A. Bevivino RF GB AF CD LL A. Benedetti.
References
1. Tiedje JM, Asuming-Brempong S, Nusslein K, Marsh TL, Flynn SJ (1999)
Opening the black box of soil microbial diversity. Appl Soil Ecol 13: 109–122.
doi:10.1016/S0929-1393(99)00026-8.
2. Nannipieri P, Ascher J, Ceccherini MT, Landi L, Pietramellara G, et al. (2003)
Microbial diversity and soil functions. Eur J Soil Sci 54: 655–670. doi:10.1046/
j.1365-2389.2003.00556.x.
3. Lauber CL, Ramirez KS, Aanderud Z, Lennon J, Fierer N (2013) Temporal
variability in soil microbial communities across land-use types. ISME J 7: 1641–
1650. doi:10.1038/ismej.2013.50.
4. Myers N, Mittermeier RA, Fonseca GAB, Fonseca GAB, Kent J (2000)
Biodiversity hotspots for conservation priorities. Nature 403: 853–858.
doi:10.1038/35002501.
5. Puddu G, Falcucci A, Maiorano L (2011) Forest changes over a century in
Sardinia: implications for conservation in a Mediterranean hotspot. Agrofor Syst
85: 319–330. doi:10.1007/s10457-011-9443-y.
6. Medail F, Quezel P (1999) Biodiversity Hotspots in the Mediterranean Basin:
Setting Global Conservation Priorities. Conserv Biol 13: 1510–1513.
doi:10.1046/j.1523-1739.1999.98467.x.
7. Blondel J, Aronson J (1999) Biology and wildlife of the Mediterranean region.
Oxford University Press, Oxford.
8. Salis L, Marrosu M, Bagella S, Sitzia M RP (2010) Grassland management,
forage production and plant biodiversity in a Mediterranean grazing system. In:
Porqueddu C, Rıos S, editors. The contributions of grasslands to the
conservation of Mediterranean biodiversity. Zaragoza: CIHEAM/CIBIO/
FAO/SEEP, Vol. 185. 181–185.
9. Goncalves P, Alcobia S, Simoes L, Santos-Reis M (2012) Effects of management
options on mammal richness in a Mediterranean agro-silvo-pastoral system.
Agrofor Syst 85: 383–395. doi:10.1007/s10457-011-9439-7.
10. Bacchetta G, Bagella S, Biondi E, Farris E, Filigheddu R, et al. (2004) A
contribution to the knowledge of the order Quercetalia ilicis Br. -Bl. ex Molinier
1934 of Sardinia. Fitosociologia 41: 29–51.
11. Orgiazzi A, Lumini E, Nilsson RH, Girlanda M, Vizzini A, et al. (2012)
Unravelling soil fungal communities from different Mediterranean land-use
backgrounds. PLoS One 7: e34847. doi:10.1371/journal.pone.0034847.
12. Francaviglia R, Benedetti A, Doro L, Madrau S, Ledda L (2014) Influence of
land use on soil quality and stratification ratios under agro-silvo-pastoral
Mediterranean management systems. Agric Ecosyst Environ 183: 86–92.
13. Council of the European Communities (1992) Council Directive 92/43/EEC of
21 May 1992 on the conservation of natural habitats and of wild fauna and flora.
Off J Eur Communities 35: 7–50.
14. Council of the European Communities (2001) Commission Regulation (EC)
No 1808/2001 of 30 August 2001 laying down detailed rules concerning the
implementation of Council Regulation (EC) No 338/97 on the protection of
species of wild fauna and flora by regulating trade therein. Off J Eur
Communities L250: 1–43.
15. Aru A, Baldaccini P, Delogu G, Dessena M, Madrau S, et al. (1990) Carta dei
Suoli della Sardegna, scala 1/250.000. Assessorato alla programmazione e
all’assestamento del territorio, Centro Regionale Programmazione, Dip. Sc.
della Terra, Universita di Cagliari, Italy.
16. Bacchetta G, Bagella S, Biondi E, Farris E, Filigheddu R, et al. (2009) Forest
vegetation and serial vegetation of Sardinia (with map at the scale 1:350,000).
Fitosociologia 46: 3–82.
17. Bagella S, Caria MC (2011) Vegetation series: a tool for the assessment of
grassland ecosystem services in Mediterranean large-scale grazing systems.
Fitosociologia 48: 47–54.
18. Lumini E, Orgiazzi A, Borriello R, Bonfante P, Bianciotto V (2010) Disclosing
arbuscular mycorrhizal fungal biodiversity in soil through a land-use gradient
using a pyrosequencing approach. Environ Microbiol 12: 2165–2179.
doi:10.1111/j.1462-2920.2009.02099.x.
19. Pastorelli R, Landi S, Trabelsi D, Piccolo R, Mengoni A, et al. (2011) Effects of
soil management on structure and activity of denitrifying bacterial communities.
Appl Soil Ecol 49: 46–58. doi:10.1016/j.apsoil.2011.07.002.
20. Lagomarsino A, Benedetti A, Marinari S, Pompili L, Moscatelli MC, et al.
(2011) Soil organic C variability and microbial functions in a Mediterranean
agro-forest ecosystem. Biol Fertil Soils 47: 283–291. doi:10.1007/s00374-010-
0530-4.
21. Francaviglia R, Coleman K, Whitmore AP, Doro L, Urracci G, et al. (2012)
Changes in soil organic carbon and climate change - Application of the RothC
model in agro-silvo-pastoral Mediterranean systems. Agric Syst 112: 48–54.
22. Seddaiu G, Porcu G, Ledda L, Roggero PP, Agnelli A, et al. (2013) Soil organic
matter content and composition as influenced by soil management in a semi-arid
Mediterranean agro-silvo-pastoral system. Agric Ecosyst Environ 167: 1–11.
doi:http://dx.doi.org/10.1016/j.agee.2013.01.002.
23. Lai R, Lagomarsino A, Ledda L, Roggero PP (2014) Variation in soil C and
microbial functions across tree canopy projection and open grassland
microenvironments. Turkish J Agric For 38: 62–69. doi:10.3906/tar-1303-82.
24. Soil Survey Staff (2006) Keys to soil taxonomy. In: United States Department of
Agriculture NRCS, editor. Natural Resoiurces Concervation Service.
25. Doran JW, Elliott ET, Paustian K (1998) Soil microbial activity, nitrogen
cycling, and long-term changes in organic carbon pools as related to fallow
tillage management. Soil Tillage Res 49: 3–18.
26. O’Brien HE, Parrent JL, Jackson JA, Moncalvo J-M, Vilgalys R (2005) Fungal
community analysis by large-scale sequencing of environmental samples. Appl
Environ Microbiol 71: 5544–5550.
27. Stotzky G, Goos RD, Timonin MI (1962) Microbial changes occurring in soil as
a result of storage. Plant Soil 16: 1–18. doi:10.1007/BF01378154.
28. Springer U KJ (n.d.) Prufung der Leistungsfahigkeit von einigen wichtigeren
Verfahren zur Bestimmung des Kohlenstoffs mittels Chromschwefelsaure sowie
Vorschlag einer neuen Schnellmethode. J Plant Nutr Soil Sci 64: 1–26 (in
German).
29. Ciavatta C, Govi M, Vittori Antisari L, Sequi P (1990) Characterization of
humified compounds by extraction and fractionation on solid polyvinylpyrrol-
idone. J Chromatogr 509: 141–146.
30. Sequi P, De Nobili M, Leita L, Cercignani G (1986) A new index of
humification. Agrochimica 30: 175–179.
31. Vance ED, Brookes PC, Jenkinson DS (1987) An extraction method for
measuring soil microbial biomass C. Soil Biol Biochem 19: 703–707.
doi:10.1016/0038-0717(87)90052-6.
32. Badalucco L, Grego S, Dell’Orco S, Nannipieri P (1992) Effect of liming on
some chemical, biochemical, and microbiological properties of acid soils under
spruce (Picea abies L.). Biol Fertil Soils 14: 76–83. doi:10.1007/BF00336254.
33. Riffaldi R, Saviozzi A, Levi-Minzi R (1996) Carbon mineralization kinetics as
influenced by soil properties. Biol Fertil Soils 22: 293–298. doi:10.1007/
BF00334572.
34. Dilly O, Munch J-C (1998) Ratios between estimates of microbial biomass
content and microbial activity in soils. Biol Fertil Soils 27: 374–379.
doi:10.1007/s003740050446.
35. Anderson T-H, Domsch KH (1989) Ratios of microbial biomass carbon to total
organic carbon in arable soils. Soil Biol Biochem 21: 471–479. doi:10.1016/
0038-0717(89)90117-X.
36. Pinzari F, Trinchera A, Benedetti A, Sequi P (1999) Use of biochemical indices
in the mediterranean environment: Comparison among soils under different
forest vegetation. J Microbiol Methods 36: 21–28.
37. Smalla K, Wieland G, Buchner A, Zock A, Parzy J, et al. (2001) Bulk and
Rhizosphere Soil Bacterial Communities Studied by Denaturing Gradient Gel
Electrophoresis: Plant-Dependent Enrichment and Seasonal Shifts Revealed. 67:
4742–4751. doi:10.1128/AEM.67.10.4742.
Soil Biodiversity in a Mediterranean Region
PLOS ONE | www.plosone.org 13 August 2014 | Volume 9 | Issue 8 | e105515

38. De Leij FAAM, Whipps JM, Lynch JM (1994) The use of colony development
for the characterization of bacterial communities in soil and on roots. MicrobEcol 27: 81–97.
39. Grifoni A, Bazzicalupo M, Di Serio C, Fancelli S, Fani R (1995) Identification of
Azospirillum strains by restriction fragment length polymorphism of the 16SrDNA and of the histidine operon. FEMS Microbiol Lett 127: 85–91.
doi:10.1016/0378-1097(95)00042-4.40. Trabelsi D, Mengoni A, Elarbi Aouani M, Mhamdi R, Bazzicalupo M (2009)
Genetic diversity and salt tolerance of bacterial communities from two Tunisian
soils. Ann Microbiol 59: 25–32. doi:10.1007/BF03175594.41. Mengoni A, Tatti E, Decorosi F, Viti C, Bazzicalupo M, et al. (2005)
Comparison of 16S rRNA and 16S rDNA T-RFLP approaches to studybacterial communities in soil microcosms treated with chromate as perturbing
agent. Microb Ecol 50: 375–384. doi:10.1007/s00248-004-0222-4.42. Hammer Ø, Harper DAT, Ryan PD (2001) Past: Paleontological Statistics
Software Package for Education and Data Analysi. Palaeontol Electron 4: 1–9.
doi:10.1016/j.bcp.2008.05.025.43. Duineveld B, Kowalchuk G, Keijzer A, van Elsas J, van Veen J (2001) Analysis
of bacterial communities in the rhizosphere of chrysanthemum via denaturinggradient gel electrophoresis of PCR-amplified 16S rRNA as well as DNA
fragments coding for 16S rRNA. Appl Environ Microbiol 67: 172–178.
44. Ausubel FM, Brent R, Kingston RE, Moore DD, Seidman JG, et al. (1987) Unit2.4 Preparation of genomic DNA from bacteria. Curr Protoc Mol Biol: 2.4.1–
2.4.2.45. Di Cello F, Pepi M, Baldi F, Fani R (1997) Molecular characterization of an n-
alkane-degrading bacterial community and identification of a new species,Acinetobacter venetianus. Res Microbiol 148: 237–249.
46. El Fantroussi S, Verschuere L, Verstraete W, Top EM (1999) Effect of
phenylurea herbicides on soil microbial communities estimated by analysis of16S rRNA gene fingerprints and community-level physiological profiles. Appl
Environ Microbiol 65: 982–988.47. Cremonesi L, Firpo S, Ferrari M, Righetti PG, Gelfi C (1997) Double-gradient
DGGE for optimized detection of DNA point mutations. Biotechniques 22: 326–
330.48. Shannon C, Weaver W (1963) The mathematical theory of communication.
University of Illinois Press, Urbana. doi:10.1145/584091.584093.49. Simpson E (1949) Measurement of diversity. Nature 163: 688–688. doi:10.1038/
163688a0.50. Whittaker RH (1972) Evolution and measurement of species diversity. Taxon
21: 213. doi:10.2307/1218190.
51. Hall TA (1999) BioEdit: a user-friendly biological sequence alignment editor andanalysis program for Windows 95/98/NT. Nucleic Acids Symp 41: 95–98.
doi:citeulike-article-id:691774.52. Bray J, Curtis J (1957) An ordination of the upland forest communities of
southern Wisconsin. Ecol Monogr 27: 325–349.
53. Haider K (1992) Problems related to the humification processes in soils oftemperate climates. In: Stotzky G, Bollag J-M, editors. Soil Biochemistry. Marcel
Dekker, New York. 55–94.54. Oades JM (1995) An overview of processes affecting the cycling of organic
carbon in soils. In: Zepp R, Sonntag C, editors. Role of non living organicmatter in the earth’s carbon cycle. John Wiley, New York. 293–303.
55. Stevenson FJ, Cole MA (1999) Cycles of soil: carbon, nitrogen, phosphorus,
sulfur, micronutrients. 2nd ed. John Wiley, New York.56. Franzluebbers AJ, Stuedemann JA, Schomberg HH, Wilkinson SR (2000) Soil
organic C and N pools under long-term pasture management in the Southern
Piedmont USA. Soil Biol Biochem 32: 469–478. doi:10.1016/S0038-
0717(99)00176-5.
57. Anderson T, Domsch KH (1993) The metabolic quotient for CO2 (qCO2) as a
specific activity parameter to assess the effects of environmental conditions, such
as pH, on the microbial biomass of forest soils. Soil Biol Biochem 25: 393–395.
58. Benedetti A, Brookes P, Lynch J (2005) Conclusive remarks. Part I: Approaches
to defining, monitoring, evaluating and managing soil quality. In: Bloem J,
Hopkins D, Benedetti A, editors. Soil Quality. CABI; Wallingford. 63–70.
59. Conant RT, Paustian K, Elliott ET (2001) Grassland management and
conversion into grassland: effects on soil carbon. Ecol Appl 11: 343–355.
doi:10.1890/1051-0761(2001)011[0343:GMACIG]2.0.CO;2.
60. Edenborn SL, Sexstone AJ (2007) DGGE fingerprinting of culturable soil
bacterial communities complements culture-independent analyses. Soil Biol
Biochem 39: 1570–1579.
61. Garland JL (1999) Potential and limitations of BIOLOG for microbial
community analysis. In: Bell C, Brylinsky M, Johnson-Green P, editors.
Microbial Biosystems: new frontiers. Proceedings of the 8th international
symposium on microbial ecology. Atlantic Canada Society for Microbial
Ecology. Halifax, Canada. 1–7.
62. Ellis RJ, Morgan P, Weightman AJ, Fry JC (2003) Cultivation-dependent and -
independent approaches for determining bacterial diversity in heavy-metal-
contaminated soil. Appl Environ Microbiol 69: 3223–3230. doi:10.1128/
AEM.69.6.3223.
63. Shade A, Hogan CS, Klimowicz AK, Linske M, McManus PS, et al. (2012)
Culturing captures members of the soil rare biosphere. Environ Microbiol 14:
2247–2252. doi:10.1111/j.1462-2920.2012.02817.x.
64. Altschul SF, Madden TL, Schaffer AA, Zhang J, Zhang Z, et al. (1997) Gapped
BLAST and PSI-BLAST: a new generation of protein database search
programs. Nucleic Acids Res 25: 3389–3402.
65. Shange RS, Ankumah RO, Ibekwe AM, Zabawa R, Dowd SE (2012) Distinct
soil bacterial communities revealed under a diversely managed agroecosystem.
PLoS One 7: e40338. doi:10.1371/journal.pone.0040338.
66. Weon H-Y, Kim B-Y, Yoo S-H, Kwon S-W, Stackebrandt E, et al. (2008)
Chryseobacterium soli sp. nov. and Chryseobacterium jejuense sp. nov., isolated
from soil samples from Jeju, Korea. Int J Syst Evol Microbiol 58: 470–473.
doi:10.1099/ijs.0.65295-0.
67. Soltani A, Khavazi K, Asadi-Rahmani H, Omidvari M, Abaszadeh Dahaji P
(2010) Plant growth promoting characteristics in some Flavobacterium spp.
isolated from soils of Iran. J Agri Sci 2: 106–115. Available: http://www.ccsenet.
org/journal/index.php/jas/article/view/8404/6221.
68. Fierer N, Bradford MA, Jackson RB (2007) Toward an ecological classification
of soil bacteria. Ecology 88: 1354–1364. doi:10.1890/05-1839.
69. Girvan MS, Campbell CD, Killham K, Prosser JI, Glover LA (2005) Bacterial
diversity promotes community stability and functional resilience after perturba-
tion. Environ Microbiol 7: 301–313. doi:10.1111/j.1462-2920.2005.00695.x.
70. Nacke H, Thurmer A, Wollherr A, Will C, Hodac L, et al. (2011)
Pyrosequencing-based assessment of bacterial community structure along
different management types in German forest and grassland soils. PLoS One
6: e17000. doi:10.1371/journal.pone.0017000.
71. Acosta-Martınez V, Dowd S, Sun Y, Allen V (2008) Tag-encoded pyrose-
quencing analysis of bacterial diversity in a single soil type as affected by
management and land use. Soil Biol Biochem 40: 2762–2770. doi:10.1016/
j.soilbio.2008.07.022.
Soil Biodiversity in a Mediterranean Region
PLOS ONE | www.plosone.org 14 August 2014 | Volume 9 | Issue 8 | e105515