Seasonal photoperiod, gender, and P300
21
Seasonal photoperiod, gender, and P300 Phillip P. Shelton, Anita M. Hartmann *, James Allen Department of Psychology, University of Alaska Fairbanks, P.O. Box 756480, Fairbanks, AK 99775-6480, USA Received 28 March 2000; accepted 12 June 2002 Abstract The photoperiod model of seasonal affective disorder (SAD) suggests that SAD is caused by abnormal responses to seasonal changes in day length. Clarifying the utility of event-related brain potentials (ERPs) as diagnostic aids or measures of therapeutic efficacy in SAD requires understanding the range of naturally occurring seasonal patterns of variation in human responses. This investigation studied ERPs from non-patients (402 from men, 415 from women) during the pronounced photoperiod variation of the Alaskan subarctic where light availability ranges from 3.20 h in winter to 21.98 h in summer. ANOVA showed significant (P /0.03) main effect of photoperiod in the amplitude and latency of P300 responses, as well as a main effect of sensory modality (P /0.002). There was neither a main effect of gender, nor any significant gender-interactive effect in ERP responses. In clients with SAD, the ERP variability attributed to seasonal photoperiod remains to be clarified. # 2002 Elsevier Science B.V. All rights reserved. Keywords: Event-related brain potentials; P300; Season; Gender; Seasonal affective disorder 1. Introduction The P300 component of event-related brain potentials (ERPs) was first reported in the 1960s (Sutton et al., 1965). Since its discovery, P300 has become considered a * Corresponding author. Tel.: /1-907-474-1989; fax: /1-907-474-5781 E-mail address: [email protected] (A.M. Hartmann). Biological Psychology 60 (2002) 151 /171 www.elsevier.com/locate/biopsycho 0301-0511/02/$ - see front matter # 2002 Elsevier Science B.V. All rights reserved. PII:S0301-0511(02)00046-7
-
Upload
independent -
Category
Documents
-
view
2 -
download
0
Transcript of Seasonal photoperiod, gender, and P300

Seasonal photoperiod, gender, and P300
Phillip P. Shelton, Anita M. Hartmann *, James Allen
Department of Psychology, University of Alaska Fairbanks, P.O. Box 756480, Fairbanks, AK 99775-6480,
USA
Received 28 March 2000; accepted 12 June 2002
Abstract
The photoperiod model of seasonal affective disorder (SAD) suggests that SAD is caused by
abnormal responses to seasonal changes in day length. Clarifying the utility of event-related
brain potentials (ERPs) as diagnostic aids or measures of therapeutic efficacy in SAD requires
understanding the range of naturally occurring seasonal patterns of variation in human
responses. This investigation studied ERPs from non-patients (402 from men, 415 from
women) during the pronounced photoperiod variation of the Alaskan subarctic where light
availability ranges from 3.20 h in winter to 21.98 h in summer. ANOVA showed significant
(P�/0.03) main effect of photoperiod in the amplitude and latency of P300 responses, as well
as a main effect of sensory modality (P�/0.002). There was neither a main effect of gender,
nor any significant gender-interactive effect in ERP responses. In clients with SAD, the ERP
variability attributed to seasonal photoperiod remains to be clarified. # 2002 Elsevier Science
B.V. All rights reserved.
Keywords: Event-related brain potentials; P300; Season; Gender; Seasonal affective disorder
1. Introduction
The P300 component of event-related brain potentials (ERPs) was first reported in
the 1960s (Sutton et al., 1965). Since its discovery, P300 has become considered a
* Corresponding author. Tel.: �/1-907-474-1989; fax: �/1-907-474-5781
E-mail address: [email protected] (A.M. Hartmann).
Biological Psychology 60 (2002) 151�/171
www.elsevier.com/locate/biopsycho
0301-0511/02/$ - see front matter # 2002 Elsevier Science B.V. All rights reserved.
PII: S 0 3 0 1 - 0 5 1 1 ( 0 2 ) 0 0 0 4 6 - 7
‘cognitive’ neuroelectric event because it is generated in psychological tasks that
require discrimination of sensory stimuli along a perceptual dimension (Loveless,
1983; Squires et al., 1977). The allocation capacity model of attention and
immediate memory explains the role of the P300 component during psychological
tasks, through the model’s basic information-processing mechanisms (cf. Polich and
Kok, 1995). Although P300 is usually viewed within a cognitive context, a growing
body of literature notes that a substantial portion of variability in P300characteristics appears related to the biological arousal state of the subject. These
state fluctuations can be induced by environmental factors, or ‘biological determi-
nants’, in that they affect the organism’s physiological state as a whole, and
therefore, affect its capability to engage in cognitive operations (Polich and Kok,
1995).
1.1. Background to the problem
Evaluation of P300 within a cognitive context requires consideration of whether
changes observed in P300 characteristics occur due to cognitive events, or are instead
related to biological determinants. Polich and Kok (1995) define some biological
determinants as general , meaning the effects are not restricted to the population of
neurons influenced by P300 task-specific variables. Other biological determinants are
defined as specific , meaning they effect the same population of neurons influenced
by P300-specific task variables. Biological determinants that influence P300
responses are also organized into natural or environmentally induced categories.Natural determinants that influence the P300 response include circadian and
ultradian rhythms, food ingestion, preferred time of activities, menstrual cycle,
and season. Environmental determinants, or stressors, include exercise, sleep
deprivation, and psychoactive substances (e.g. caffeine, nicotine, alcohol). The
present investigation contributes to a better understanding of how the general,
natural biological determinant of seasonality affects P300 responses in an extreme
northern population.
1.2. Relevant prior studies
Previous research on seasonality and P300 was prompted by initial findings that
visual, but not auditory P300 amplitude enhanced in patients receiving light therapy
for seasonal affective disorder (SAD) (Duncan and Rosenthal, 1986; Deldin,
1990Duncan et al., 1990Duncan et al., 1991). In one study, an increase in
visual P300 amplitude was observed in a clinical SAD group (n�/7) but not in a
non-clinical control group, and the increase in visual P300 amplitude was
directly proportional to the anti-depressant effects of light therapy (Duncan andRosenthal, 1986). Subsequent studies have explored the relationship between
season and P300 responses in healthy subjects, and are reviewed here in
chronological order.
Deldin et al. (1989a,b, 1994) and Deldin (1990) studied archival data from 88
normal subjects (48 women) in metropolitan Washington, DC. Each subject was
P.P. Shelton et al. / Biological Psychology 60 (2002) 151�/171152

tested one time, and testing occurred at different times of the year, using both an
auditory and a visual ERP oddball protocol. Season was defined on a solar-basis as
‘‘average amount of sunlight per month’’ (Deldin et al., 1994). Another natural
determinant, recent sunlight, was also included in an attempt to distinguish long-
term from short-term sunlight influences. The solar-based definition of sunlight was
‘‘minutes of sunlight, sunrise to sunset, minus minutes of cloud cover’’ (Deldin et al.,
1994). In a regression analysis, both gender and minutes of daylight predicted visual
P300 amplitude. The authors concluded that (1) visual P300 varied with light and
amplitude was larger in summer and winter, and (2) visual P300 amplitude was
larger in women compared to men. They found no interactive effects for sensory
modality with either gender or season, and no main effects for P300 latency. The
unanticipated finding of greater P300 amplitude in winter, the season of photoperiod
minima, led the authors to speculate that some characteristic of seasonality other
than simply the amount of sunlight had a mediating effect on the P300 response.
They speculated that ‘‘if P300 can respond to light exposure in normal subjects, it
apparently requires longer time length of season, suggesting that normal subjects
may be better protected against short-term light changes than patients’’ (Deldin et
al., 1994).
Polich and Geisler (1991) used archival data collected in San Diego using a cross-
sectional sample of subjects, not screened for psychiatric disorder, each of whom was
tested once, using only an auditory discrimination protocol. Auditory P300
amplitude was greater in spring, and in women; there was no effect on latency.
Average sunlight for seasons was not reported and the variable season was defined
differently, overlapping with season as defined by earlier researchers (Deldin et al.,
1989a,b).Bush (1993) tested a small non-clinical sample (n�/4 women, four men) living in
the Alaskan subarctic monthly for 12 months. Using an auditory and a visual
discrimination paradigm, a main effect for month emerged on both P300 amplitude
and latency in a repeated measures ANOVA. With season defined using 1-month
windows around equinoxes and solstices, an unrotated principal components
analysis suggested that photoperiod was not as heavily weighted as the geomagnetic
field characteristics.
Kosmidis et al. (1998) tested 32 normal people living in the metropolitan
Washington, DC area (n�/15 women), who were screened for psychiatric disorder
by a clinical psychologist. Each was tested in two seasons, using both auditory and
visual discrimination protocols. The solar-based definition of seasons used corre-
sponded to that of Deldin et al. (1994) and Bush (1993). Unfortunately, no fall
season data were included due to small sample sizes. Recent sunlight was analyzed as
a potential explanatory factor. Data were analyzed using a modality�/specificity
model employing a series of seasonal pairwise comparisons. P300 amplitude varied
with season, and seasonal variation was greater in women. The finding that P300
amplitude did not correlate with recent sunlight again suggests that factors other
than recent sunlight may account for the seasonal variation in amplitude. The
researchers speculated that the lack of a relationship between recent sunlight and
P.P. Shelton et al. / Biological Psychology 60 (2002) 151�/171 153

P300 responses might reflect a fundamental, autonomous built-in compensatory
mechanism to ensure constancy of behavioral competence in non-hibernating
species.
1.3. Present study
Studies of the relationship of event-related responses to biological determinants
are needed (Polich and Kok, 1995). The current study extends this line of
inquiry using general, natural biological determinants as independent variables. It
replicates studies (Deldin et al., 1994) on seasonality and P300 using a larger sampleand data spanning all four solar-based seasons (Kosmidis et al., 1998). Importantly,
the ERP recordings were obtained from a non-clinical sample in the Alaskan
subarctic, where extreme variation in seasonal photoperiod ranges from 3.20 h at
winter solstice to 21.98 h at summer solstice. This affords study of the impact of large
seasonal variation in light on P300 and of human adaptation in extreme
environments.
2. Methods
2.1. Subjects
Subjects were 442 university students, staff, and faculty residing in Fairbanks, AK,at 648 north latitude, during 1988�/1999. All subjects were recorded during their
normal workday. Earlier samples from this Alaskan subarctic population (Bush and
Emery, 1985, 1987) displayed no significant change in P300 amplitude or latency
after an 8-h or 12-h work shift.
Inclusion criteria for the study were age 18�/38, functionally normal vision and
hearing, and self-report of absence of psychiatric disorder, of good general physical
health, and of not currently using psychoactive substances. Handedness and
ethnicity were not reliably coded in the archives and could not be included asvariables.
The data analyzed were extracted from archived ERP recordings of individuals
who met the inclusion criteria. Archives contained 229 female auditory ERPs (age
M�/24.25, SD�/5.7), 213 male auditory ERPs (age M�/23.54, SD�/4.98), 186
female visual ERPs (age M�/24.19, SD�/6.16), and 189 male visual ERPs (age M�/
23.81, SD�/5.02).
Only ages 18�/38 years were selected for analysis, as the P300 latency-to-age
relationship appears to be a quadratic function, with shortest latency in early teensand marked increase in latency in older adults (Polich et al., 1985). Mean ages in this
sample were similar in mean age to the ‘younger group’ sample (22.8 years) in
previous research of age-related changes in event-related potentials (Ford et al.,
1979) and to subjects in previous studies of seasonality and P300 (e.g. Deldin et al.,
1994; Kosmidis et al., 1998).
P.P. Shelton et al. / Biological Psychology 60 (2002) 151�/171154

Although subjects were sampled across all four seasons, sample size varied
significantly across the four photoperiods (x2�/33.277, df�/3, P B/0.05)1, ranging
from 143 records during photoperiod minima (Nov�/Dec�/Jan) to 258 records during
rising photoperiod (Feb�/Mar�/Apr)2.
2.2. Design
Two 2X4X2 (sensory modality X photoperiod X gender) between groups ANOVA’s
tested P300 amplitude (P300 Amp) and P300 latency (P300 Lat) as dependent
variables. Cell sizes were not equal.
2.3. Independent variables
Independent variables included one fixed factor, sensory modality, and tworandom factors, photoperiod and gender. At 648 north latitude, photoperiod
(defined as length of possible daylight between sunrise and sunset) varies from
3.20 h at winter solstice to 21.98 h at summer solstice. In this study, the four seasons
were defined using solar-based photoperiods:
1) Minima (winter solstice, 9/1 calendar month; U-shaped): 3.20�/8.13 h.
2) Rising (vernal equinox, 9/1 calendar month; /-shaped): 8.13�/17.78 h.
3) Maxima (summer solstice, 9/1 calendar month; þ-shaped): 17.78�/21.98 h.
4) Declining (autumnal equinox, 9/1 calendar month; \-shaped): 8.13�/17.78 h.
In prior work at this latitude with samples of individuals with SAD (Booker and
Hellekson, 1992; Hellekson, 1989; Hellekson and Rosenthal, 1987) the photoperiod
shape and direction of change were suspected to have a role in temporally relatedchanges in SAD symptomatology and in seasonal pattern of suicidal behavior
observed. Therefore, rising and declining photoperiods were considered separately.
Sensory modality refers to the type of discrimination task performed at the time of
ERP recording. The auditory modality required the subject to discriminate and
detect a sound, while the visual modality required the subject to discriminate and
detect a visual pattern.
1 Cell sizes varied for each of the two dependent variables, P3A and P3L (32 cells), with gender treated
as a within-factor. While the k-group MANOVA is preferred (Stevens, 1979, 1986), with unequal cell sizes
robustness is not guaranteed. The largest cell (declining photoperiod, auditory mode, female�/84)
compared to the smallest cell (declining photoperiod, visual mode, male�/28) yields a size ratio of 3.0.
However, such crossed intraphotoperiod contrasts (male visual to female auditory) are not part of the
analytical model.2 The intra-cell size ratios range from 1 (rising photoperiod, visual 64/64) to 1.61 (declining
photoperiod, auditory 84/52). The ratio of 1.61 is slightly greater than the ‘less than 1.5’ guideline
recommended by Stevens (1986) for the customary MANOVA. Based on the smallest n�/28 cell size, the
minimum detectable differences achievable, at 95% confidence, are: d�/2.85 mV P300 amplitude and d�/
24.94 ms P300 latency (Salkind, 1997).
P.P. Shelton et al. / Biological Psychology 60 (2002) 151�/171 155
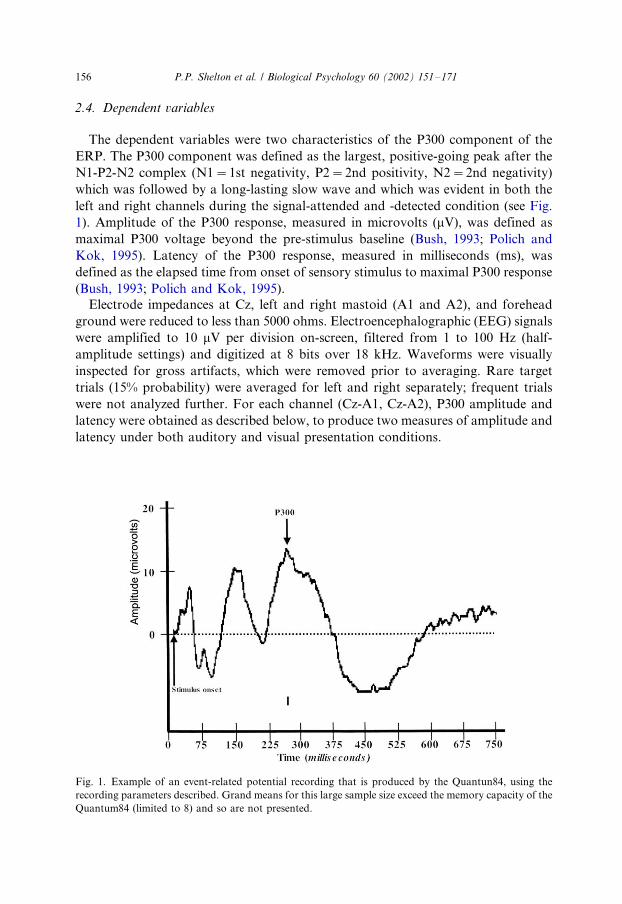
2.4. Dependent variables
The dependent variables were two characteristics of the P300 component of the
ERP. The P300 component was defined as the largest, positive-going peak after the
N1-P2-N2 complex (N1�/1st negativity, P2�/2nd positivity, N2�/2nd negativity)
which was followed by a long-lasting slow wave and which was evident in both the
left and right channels during the signal-attended and -detected condition (see Fig.
1). Amplitude of the P300 response, measured in microvolts (mV), was defined as
maximal P300 voltage beyond the pre-stimulus baseline (Bush, 1993; Polich and
Kok, 1995). Latency of the P300 response, measured in milliseconds (ms), was
defined as the elapsed time from onset of sensory stimulus to maximal P300 response
(Bush, 1993; Polich and Kok, 1995).
Electrode impedances at Cz, left and right mastoid (A1 and A2), and forehead
ground were reduced to less than 5000 ohms. Electroencephalographic (EEG) signals
were amplified to 10 mV per division on-screen, filtered from 1 to 100 Hz (half-
amplitude settings) and digitized at 8 bits over 18 kHz. Waveforms were visually
inspected for gross artifacts, which were removed prior to averaging. Rare target
trials (15% probability) were averaged for left and right separately; frequent trials
were not analyzed further. For each channel (Cz-A1, Cz-A2), P300 amplitude and
latency were obtained as described below, to produce two measures of amplitude and
latency under both auditory and visual presentation conditions.
Fig. 1. Example of an event-related potential recording that is produced by the Quantun84, using the
recording parameters described. Grand means for this large sample size exceed the memory capacity of the
Quantum84 (limited to 8) and so are not presented.
P.P. Shelton et al. / Biological Psychology 60 (2002) 151�/171156

2.5. Waveform analysis
One second of time-captured 4-channel EEG recording began 15 ms prior to the
onset of each sensory stimulus. The data were signal-averaged via average
summation method (Fujikake et al., 1989) over each sensory attention and signal
detection task. The task consisted of 350 sensory signal presentations of which 85%
were to be ignored and 15% were to be detected. This produces one signal-averagedwaveform for each of the four possible channels previously described. Using
unlinked mastoids permits treating left and right waveforms as replicates rather
than as split-halves, and avoids the error of pseudoreplication (Hurlburt, 1984) from
using interconnected units.
At archiving, the amplitude and latency characteristics of each signal-averaged
P300 component obtained during the sensory discrimination trials were recorded.
The P300 component was identified via visual inspection, applying P300 defining
criteria to the recordings from the signal-detected condition.P300 amplitude was measured with two on-screen cursors: the first cursor
identified the pre-stimulus baseline as time-zero; the second cursor applied the first
derivative test for relative extrema (Kohlman and Denlinger, 1988). Earlier research
with extreme northern samples found measuring amplitude from a defined pre-
stimulus baseline to the relative maxima of the averaged waveform maximized
analytical power and reduced probability of type I error (Bush, 1993). The 15 ms of
recording prior to stimulus onset was the designated pre-stimulus baseline, and on-
screen baseline offset correction was achieved through individual visual inspection ofwaveform. The baseline used in the current recordings is comparable to the 20 ms
pre-stimulus baseline used by Giard et al. (1988) in topographic analysis of auditory
attention-related waveforms.
P300 latency was measured via two on-screen cursors: the first cursor identified
the sensory signal onset as time-zero; the second cursor measured elapsed time to
P300 peak amplitude. This approach has been judged well suited for evaluating
waveforms from normal, non-patient subjects (Bush, 1993; Picton et al., 1984a). The
definition of the P300 component used for these recordings uses a wide latencywindow since P300 latencies of B/250 ms have been reported for this age-group of
subjects (Picton et al., 1984b; Polich, 1989), and early latency windows, beginning at
B/250 ms, have previously been used (Giedke et al., 1981; Kutas et al., 1977).
Grand averages are not presented because the Quantum84 cannot export data to
ASCII files for analysis, and the Quantum84’s internal grand average procedure is
limited to eight waveforms (Cadwell Laboratories, 1988). This data set exceeds this
capacity.
2.6. Sensory signal detection tasks
The auditory oddball detection paradigm used required a subject to listen
binaurally, via balanced audiometric headphones (Amplivox† Audiocups), to a
sequence of 350 randomly generated tones presented at a rate of one per second, and
to maintain a silent running count of the number of target tones (2000 Hz, 15% of
P.P. Shelton et al. / Biological Psychology 60 (2002) 151�/171 157

trials) detected amid the tones to be ignored (1000 Hz, 85% of trials). Each tone had
duration of 0.3 s and was cosine-ramped with equal rise, plateau and decay times of
0.1 s. Tones were presented binaurally at 80 dB, which is slightly louder than a
normal conversational tone of 65 dB. All subjects received the same number of trials.
During a two-tone pre-test trial, all subjects reported being able to hear the tones
equally well in both ears, and could distinguish the target tone. All subjects
performed the auditory signal detection task accurately 9/1 target.The visual oddball detection paradigm required a subject to watch (via eye-level 49
cm monitor at a distance of 0.6 m) a series of 350 pattern-reversing black and white
checkerboard patterns, and to maintain a silent running count of the number of
target patterns detected. Using the trigonometric functions of right triangles (Smith,
1986) and the method described by Hubel (1988), the entire visual screen subtended
30.518 of visual arc. The pattern to be ignored (‘large’, 5-cm squares, 85% of trials)
subtended 6.58 of visual arc, and the target pattern (‘small’, 2.5-cm squares, 15% of
trials) subtended 2.68 of visual arc. During a two-screen pre-test trial all subjectsreported being able to easily see the difference in the two screen patterns and
affirmed that the screen of ‘small squares’ was the target. All subjects received the
same number of trials, and all subjects performed the task accurately 9/1 target.
The auditory and visual oddball detection tasks produce similar ERP responses
(see Fig. 2). However, Bush (1993) found sensory modality effects in an extreme
northern sample. On the basis of these findings greater visual than auditory P300
amplitude was anticipated and greater visual than auditory P300 latency was
anticipated. Therefore, P300 responses are analyzed separately for each sensorymodality.
2.7. Procedures
All recordings followed IRB approved protocols, and were obtained from
volunteers solicited from university faculty, staff and students. Students were
recruited from psychology courses, including upper division courses as well as
introductory courses, and some received modest course credit for participating.
None received monetary compensation. Original recruitment purposes varied (Bush,1993; Bush et al., 1991; Grubb et al., 1998; Zamora et al., 1992) and included
unpublished undergraduate Experimental Psychology course projects. All were
investigations of non-clinical populations. Each subject gave fully informed consent.
The experimenter greeted subjects in the psychology laboratory. The purposes and
procedures were explained, and the subjects had opportunity to have all questions
fully answered prior to signing consent. A registered nurse with board certification in
clinical neuroscience then interviewed subjects, for functionally normal hearing and
vision, and for subjective wakefulness, quality of last sleep epoch, or other factorsthat might warrant exclusion from normative investigation. Subjects were then taken
to the neuroelectrophysiological cubicle where all jewelry was removed, electrodes
were placed and impedances verified. The subject remained comfortably seated on an
anti-static chair, in the recording cubicle, along with all the recording equipment and
the recording technician. Overhead fluorescent lights were extinguished and a single
P.P. Shelton et al. / Biological Psychology 60 (2002) 151�/171158

100 W incandescent bulb in a shielded table lamp located away from the subject and
equipment lighted the room. The auditory detection task preceded the visual
detection task, and both recordings occurred within 10 min of each other (cf. Bush,
1993). Live recordings were stored electronically for post hoc waveform analysis.
After debriefing, subjects were assisted in removal of the EEG paste and gel, given a
final opportunity to have questions answered, then thanked for their participation.
Fig. 2. The auditory and visual oddball detection tasks produce similar event-related potential recordings.
Within individuals, the visual P300 component is normally of greater amplitude and longer latency than
the similar auditory P300 component. In each modality, P300 latency was measured from stimulus onset,
and P300 amplitude was measured from a defined pre-stimulus baseline.
P.P. Shelton et al. / Biological Psychology 60 (2002) 151�/171 159

3. Results
3.1. Data analysis
Based on the smallest cell size, n�/28, the minimum detectable differences at 95%
confidence level are d�/2.85 mV for P300 amplitude and d�/24.94 ms for P300latency (Salkind, 1997). The option to equalize cell sizes by random deletion of cases
(Tabachnick and Fidell, 1996) was not exercised in order to maximally utilize the
available data. The distribution of P300 amplitude data was best normalized with
Kirk square root transform (SQRT (X�/1)) (Kirk, 1968), and the conventional
square root transform best normalized the distribution of P300 latency data. The
transformed data were used in the parametric analyses and the raw, untransformed
data, are presented in the graphs.
A general linear model k-group MANOVA using Pillai’s criterion and pooledeffect variances3 (Olson, 1974, 1976, 1979) was performed on normalized data using
SYSTAT 6.0 GLM (Tabachnick and Fidell, 1996). Post hoc univariate ANOVA
followed for the three main effects: photoperiod, sensory modality, gender. Each
ANOVA was followed by pairwise comparisons, with pairwise comparison probabil-
ities, using Tukey’s Honestly Significant Difference multiple comparison procedure.
3.2. P300 amplitude
A significant main effect of photoperiod was noted in P300 amplitudes for pooled
genders across modalities (F3, 813�/51.19, P B/0.01); HSD pairwise comparison by
least square means using model MSE of 3.103 noted that photoperiod maxima
(‘summer’) differed significantly (a�/�/0.523, P�/0.01) from declining photoperiod
(‘fall’). No significant main effect of gender was observed in pooled modalities
(F1, 815�/0.154, P�/0.69). The expected significant main effect of sensory modality
(F1, 815�/18.263, P B/0.01) was observed in ERP amplitude, and so are profiledseparately. A descriptive profile of auditory P300 amplitude by gender across
photoperiods is presented in Fig. 3; a descriptive profile of visual P300 amplitude by
gender across photoperiods is presented in Fig. 4.
As can be seen in Fig. 3, for the auditory modality alone, P300 amplitude showed
a significant main effect of photoperiod (F3, 434�/57.39, P B/0.01), a significant main
3 Since parametric analyses assume normally distributed data (Stevens, 1986; Tabachnick & Fidell,
1996), raw data distribution was assessed at the cell level using gamma statistics for skewness (G1) and
kurtosis (G2), following the criteria that if the interval of G1 or G29/2 standard errors does not include
zero, then the measure is considered extreme. If jG1j or jG2j�/1.0, then it is extreme enough for rejection
of normality assumption (Hurlburt, 1994). Of the 32 data cells, five P300 amplitude cells (15.6%) were
extreme, and four P300 latency cells (12.5%) were extreme. In all but one cell (rising photoperiod, auditory
modality, male subjects) the extreme cells differed in season and gender. Standard data transformations
were explored (Tabachnick & Fidell, 1996) for amplitude and latency responses separately and the final
transforms selected were those that minimized the number of non-normal cells.
P.P. Shelton et al. / Biological Psychology 60 (2002) 151�/171160

Fig. 3. Seasonal profile of auditory P300 amplitudes, by gender across photoperiods using mean9/1
standard error of the mean, S.E.M.
Fig. 4. Seasonal profile of visual P300 amplitudes, by gender across photoperiods using mean9/1 standard
error of the mean, S.E.M.
P.P. Shelton et al. / Biological Psychology 60 (2002) 151�/171 161

effect of gender (F1, 434�/4.154, P B/0.05), and a significant interactive effect of
photoperiod and gender (F3, 434�/3.800, P�/0.01). For both males and females, the
mean auditory P300 amplitude was lowest during rising photoperiod (‘spring’) and
highest during photoperiod maxima (‘summer’). Within the auditory modality, the
differences in mean P300 amplitude between females and males were greatest during
photoperiod maxima (‘summer’, d�/2.93 mV) and photoperiod minima (‘winter’,
d�/2.00 mV); in both seasons, the mean auditory P300 amplitude was greater in
males.
As can be seen in Fig. 4, for visual modality alone, the P300 amplitude
demonstrated a significant main effect of photoperiod (F3, 367�/7.522, P B/0.01)
but no significant effect of gender (F1, 367�/2.429, P�/0.12), and no significant
interactive effect of photoperiod with gender (F3, 367�/1.417, P�/0.24). For both
males and females, the mean visual P300 amplitude was lowest during rising
photoperiod (‘spring’) and highest during photoperiod maxima (‘summer’). Within
the visual modality, the difference in mean P300 amplitude between females and
males was greatest during declining photoperiod (‘fall’, d�/2.55 mV); the mean P300
amplitude of females was greater than that of males.
3.3. P300 latency
No significant main effect of photoperiod was observed in latency of P300
component in pooled modalities and genders (F3, 813�/1.946, P�/0.12). However, a
significant main effect for gender was noted (F1, 815�/4.735, P B/0.05) as well as a
significant main effect of sensory modality (F1, 815�/492.01, P B/0.01). A descriptive
profile of auditory P300 latency by gender across photoperiods is presented in Fig. 5.
A descriptive profile of visual P300 latency by gender across photoperiods is
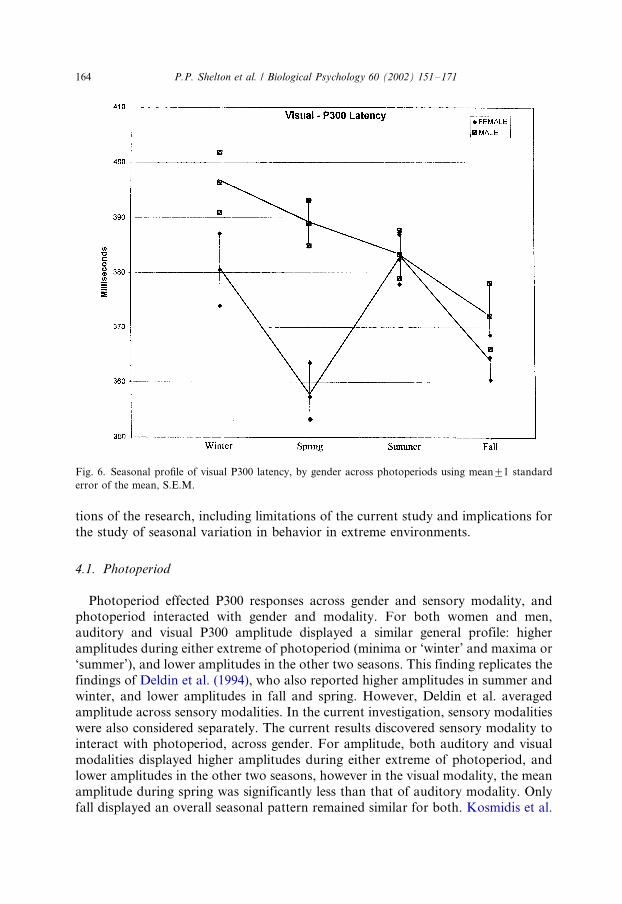
presented in Fig. 6.
As can be seen in Fig. 5 for auditory P300 latency alone, a significant main effect
of photoperiod was observed (F3, 424�/4.20, P B/0.05). For both males and females,
mean auditory P300 latency was shortest during photoperiod maxima (‘summer’).
There was no significant gender effect (F1, 434�/0.042, P�/0.83) nor was there a
significant interactive effect of photoperiod with gender (P�/0.30). The greatest
difference in mean auditory P300 latency between females and males was during
photoperiod minima (‘winter’, d�/11.20 ms); mean auditory P300 latency for
females was shorter than that of males.
As seen in Fig. 6 for visual P300 latency alone, a significant main effect of
photoperiod was observed (F3, 367�/3.868, P B/0.01) as well as a significant main
effect of gender (F1, 367�/14.587, P B/0.01) and also a significant interactive effect of
photoperiod with gender (F3, 367�/4.100, P B/0.01). For both females and males, the
mean visual P300 latency was longest during photoperiod minima (‘winter’). The
greatest difference in mean visual P300 latency responses between females and males
occurred during rising photoperiod (‘spring’, d�/31.60 ms).
P.P. Shelton et al. / Biological Psychology 60 (2002) 151�/171162

4. Discussion
This research investigated the effects of photoperiod, gender, and sensory
modality on the P300 component of ERPs in a sample living in the extreme north,
which is an area of pronounced seasonal natural light variation. The major finding
of this study was that photoperiod functioned as a potent general, natural biological
determinant of characteristics of the P300 wave induced through environmental
variation. This finding replicates previous research with smaller samples at lower
latitudes, and extends this research by exploring more fully the interaction of
photoperiod with gender and sensory modality. The current findings have implica-
tions for the study of P300, of human adaptation to environments marked by
extreme seasonal variation in photoperiod, and of our understanding of mechanisms
that accompany seasonal behavior variation at extreme latitudes, including SAD. In
addition, the current findings replicate and extend the findings of gender effects
observed in previous research with P300. We interpret these results below beginning
with main effects, first discussing photoperiod effects, then gender effects, and then
sensory modality effects. We then speculate on the meaning of selected interaction
effects, and conclude with a discussion of theoretical and methodological implica-
Fig. 5. Seasonal profile of auditory P300 latency, by gender across photoperiods using mean9/1 standard
error of the mean, S.E.M.
P.P. Shelton et al. / Biological Psychology 60 (2002) 151�/171 163
tions of the research, including limitations of the current study and implications for
the study of seasonal variation in behavior in extreme environments.
4.1. Photoperiod
Photoperiod effected P300 responses across gender and sensory modality, andphotoperiod interacted with gender and modality. For both women and men,
auditory and visual P300 amplitude displayed a similar general profile: higher
amplitudes during either extreme of photoperiod (minima or ‘winter’ and maxima or
‘summer’), and lower amplitudes in the other two seasons. This finding replicates the
findings of Deldin et al. (1994), who also reported higher amplitudes in summer and
winter, and lower amplitudes in fall and spring. However, Deldin et al. averaged
amplitude across sensory modalities. In the current investigation, sensory modalities
were also considered separately. The current results discovered sensory modality tointeract with photoperiod, across gender. For amplitude, both auditory and visual
modalities displayed higher amplitudes during either extreme of photoperiod, and
lower amplitudes in the other two seasons, however in the visual modality, the mean
amplitude during spring was significantly less than that of auditory modality. Only
fall displayed an overall seasonal pattern remained similar for both. Kosmidis et al.
Fig. 6. Seasonal profile of visual P300 latency, by gender across photoperiods using mean9/1 standard
error of the mean, S.E.M.
P.P. Shelton et al. / Biological Psychology 60 (2002) 151�/171164

(1998) lacked fall data needed to present an annualized seasonal profile, and Polich
and Geisler (1991) used different seasonal cut points in their research. Nonetheless,
Polich and Kok’s (1995) results also indicated a summer peak in P300 amplitude.
Previous research (Deldin et al., 1994; Polich and Geisler, 1991; Polich and Kok,
1995) has not identified a photoperiod effect on P300 latency, although Kosmidis et
al. (1998) did find some seasonal latency changes in the pairwise comparisons they
reported. The present investigation found that photoperiod had a significant maineffect for both auditory and visual P300 latency. One explanation for the current
finding regarding latency may relate to larger sample sizes and enhanced analytic
power. Alternatively, this finding may be due to the impact of extreme photoperiod
variation found at high latitudes. Further research is needed.
4.2. Gender effects
P300 amplitude and latency differed by gender in the current sample. The current
findings of greater auditory P300 latency in men replicated previous findings ofGolgeli et al. (1999) and Polich et al. (1988). In the current study, P300 visual latency
was also greater for men. These latency findings are also consistent with Deldin et al.
(1994) and Taylor et al. (1990), who reported greater latency among men across
modalities. The current findings that visual P300 amplitude in women was also larger
is consistent with the findings of Hoffman and Polich (1999), Osterhout et al. (1997)
and Taylor et al. (1990) who reported smaller P300 components in men.
The findings regarding amplitude are more complex. Consistent with the findings
of Golgeli et al. (1999) and Polich et al. (1988), the current data found visual P300amplitude larger for women. Deldin et al. (1994), Polich and Geisler (1991) also
reported greater P300 amplitude for women across sensory modalities. However, the
current study found greater auditory P300 amplitude for men. Further research is
needed to explore this gender by modality interaction effect.
With respect to the three other seasonal investigations being compared, Deldin et
al. (1994) did not observe an interaction of gender with photoperiod for P300
amplitude however, in the present investigation, gender was a significant interactive
effect with photoperiod for both auditory and visual P300 amplitude, and visualP300 latency but not for auditory P300 latency. This provides general support for the
Sex�/X�/Season interactions reported by Kosmidis et al. (1998) and Polich and
Geisler (1991). It should be noted however that the Kosmidis et al. study lacked fall
season data and the Polich and Geisler study used different seasonal cut points than
this study or that of Deldin et al. (1994). However, in this investigation and in
contrast to the findings of Kosmidis et al. (1998) gender was not a significant
interactive factor with photoperiod for the auditory P300 latencies. Further research
is needed for this complex interaction.Hormonal levels, menstrual cycling, and contraceptives are all potential con-
founds with the variable of gender in this study, which could potentially effect P300.
The current study included no measurement of hormone levels, or inquiry regarding
menstrual phase or contraceptive use of female subjects. However, no effects of
menstruation on P300 amplitude or latency have been found (Fleck and Polich,
P.P. Shelton et al. / Biological Psychology 60 (2002) 151�/171 165

1988). In a recent integrative review (Polich and Kok, 1995) of data from both
spontaneously cycling women as well as oral contraceptive users, P300 values from
an oddball task were consistent during bodily changes due to menstruation.
Kosmidis et al. (1998) also concluded that gender effects in ERP data are likely
due to factors other than gonadal hormones, and speculate on a relationship of ERP
to other gender-specific hormones or circannual biological processes that remain as
yet unidentified. These gender effects in the seasonal patterns of P300 responses mayhave implications for an understanding of gender differences in vulnerability to
SAD.
4.3. Sensory modality effects
This study replicated a consistent finding in the literature of greater visual than
auditory P300 amplitude (Bush, 1993; Clifford and Willison, 1992; Hillyard and
Kutas, 1983; Luo and Wei, 1999; Picton et al., 1984b; Roth et al., 1984; Teder-Salajearvi et al., 1999). The study also replicated earlier findings of longer visual than
auditory P300 latency (Deldin et al., 1994; Roth et al., 1984). This visual�/auditory
latency difference has been explained as due to volume�/conductor effects (Picton et
al., 1984b).
4.4. Limitations
This study explored the effect of photoperiod on auditory and visual P300
responses in a general university community sample living in the extreme north. Allfour photoperiod seasons were represented in the data, and gender and two sensory
modalities were evaluated separately. However, a number of significant limitations
exist.
Major technical limitations were associated with ERP recording methodology
used in this study, rendering these archival data severely limited by contemporary
recording standards (Picton et al., 2000). The Quantum84 system used in the study
had significant technological limitations. A limited number of recording channels
eliminated the possibility of monitoring extra-ocular movements. Eye blink artifactscan augment the P300 amplitude at Cz, and the degree to which these data are
contaminated by ocular artifact is unknown. Although a seasonal pattern in normal,
spontaneous eye blink rates has not been reported, Barbato et al. (1993) found that
spontaneous eye blink rates did not change in response to light therapy for either a
winter SAD clinical sample or normal controls. Additionally, the recording system’s
limited capabilities in real time common mode rejection may have yielded
artifactually shorter P300 latencies and/or higher amplitudes. Finally, the equip-
ment’s broader bandpass may have clipped P300 waveforms, yielding earlier andsmaller components. In addition, the use of Cz as a common referent, and the use of
gold-plated electrodes may have reduced P300 amplitudes. Finally, the short pre-
stimulus baseline used in this study may have been inadequate. Though subjects self-
reported absence of medical or psychiatric conditions, there was no structured
screening for medical or psychiatric disorder, therefore it is possible that some
P.P. Shelton et al. / Biological Psychology 60 (2002) 151�/171166

individuals in the current sample were experiencing medical or psychiatric condi-
tions, including SAD or subsyndromal-SAD conditions. In addition, data on
ethnicity or handedness was not available in this archival sample. Finally, inquiries
about food ingestion or activity pattern were not made, nor measurement of core
temperature or other physiological variables that may have introduced extraneous
variance in the P300 measures (Polich and Kok, 1995).
Unequal subject cell sizes in the design resulted from the university academiccalendar and subject recruitment strategies. However, the smallest cell size, n�/28, is
sufficiently large under Central Limit Theorem (Hurlburt, 1998; Tabachnick and
Fidell, 1996) to estimate the population mean. Moreover, the most appropriate
analytical approaches to unbalanced designs were used. Nonetheless, the possibility
of selection bias remains.
Despite these many technical and methodological limitations, the current findings
converge with similar patterns of seasonal P300 responses reported in the existing
literature. Future studies using longitudinal within-subject designs are needed toaddress these methodological and technical limitations.
4.5. Relation of seasonal P300 variation to seasonal behavioral variation
SAD is an extreme form of seasonal behavior variation characterized by
depression with an onset and recovery that is temporally related to change in season
that is more prevalent among women than men (American Psychiatric Association,
1994; Lee et al., 1998). SAD symptoms have been investigated for their relationship
to the duration and intensity of light (Rosenthal et al., 1984, 1987). The P300 iswidely used to study human information processing and clinical conditions such as
schizophrenia and major depression, and one clinical study (Duncan et al., 1990)
suggested that the P300 response is sensitive to light. Duncan et al. (1990) recorded
the ERPs of SAD patients being treated with brief light therapy. They reported a
positive relationship between increased amplitude in visual P300 and degree of
clinical improvement, while auditory P300 amplitude is unaffected by light therapy.
This suggests sensory modality�/specificity in the underlying psychophysiological
responses. Similarly, the gender differences found in P300 responses to photoperiodand modality in the current study may have implications in our understanding of the
differential gender prevalence rates for SAD.
Although Duncan et al. (1990), Deldin et al. (1989a) observed P300 to vary with
light therapy in individuals with SAD, the research findings on the pattern of P300
response to natural light variation among non-clinical samples have been less clear.
Deldin et al. (1994) evaluated the impact on P300 for normal subjects of recent
sunlight (minutes of available sunlight minus minutes of cloud cover) separately
from photoperiod. They could not determine from this data what seasonalcharacteristic was responsible for seasonal P300 variation, concluding that some
correlate of season other than recent sunlight varied with P300. An earlier (Bush,
1993) 12 month longitudinal study of eight normal subjects in the Alaskan subactiv
concluded that month-by-month changes in the P300 could not be reasonably
explained by photoperiod.
P.P. Shelton et al. / Biological Psychology 60 (2002) 151�/171 167
Other studies have also suggested that recent sunlight alone is not the important
factor in seasonal variation. Kosmidis et al. (1998) also failed to support their
hypothesis that sunlight determined seasonal P300 variation. They draw from Polich
and Kok’s (1995) suggestion regarding seasons with increased light, activity level,
and arousal, and suggest that the seasonal effects on P300 may reflect fundamental,
autonomous built-in compensatory mechanisms that ensure constancy of behavioral
competence in non-hibernating species. Alternatively, Deldin et al. (1994) suggesteda yet unidentified factor, and Bush (1993) found that two measures of ambient
geomagnetic field were more heavily weighted factors than photoperiod in a
principal components analysis of ERP responses.
The current data suggests that the relationship of P300 responses to seasonality is
complex and mediated by both interactive sensory modality and gender effects. The
inconsistent findings for P300 and photoperiod in the existing research may reflect
the lack of control for these variables in the designs of previous studies.
Finally, the connection between the P300 component and its underlyingneurophysiological mechanisms is not yet clearly understood. One explanation for
seasonal behavior variation explores arousal level. Demonstration of such a direct
relationship between arousal and ERPs may prove difficult as arousal reflects tonic
changes while ERPs are phasic in origin (Polich and Kok, 1995).
4.6. Conclusion
The current research raises a number of important questions, most prominentlywhether cognitive processes related to P300 might also be sensitive to seasonal
variation (Deldin et al., 1994; Picton and Cohen, 1984; Polich and Kok, 1995). If this
is the case, P300 may function as a marker variable for the study of various aspects
of seasonal behavior variation. P300 may also have relevance in clinical research, in
that it may function as a marker for cognitive processes associated with SAD. The
current research can also provide preliminary baseline data with which to compare
the P300 seasonal profiles of a SAD clinical sample. Finally, in applied and clinical
research using between subjects designs, measurement of important biologicalvariables such as P300 may serve to reduce artifactual inter-group variability that
affects hypothesis-testing error rates (Hurlburt, 1998; Polich and Kok, 1995).
Despite the apparent complexity, clarifying the relationship of P300 to photoperiod
and other biological determinants remains an important challenge.
Acknowledgements
Portions of this work were the basis for a thesis submitted by Phillip Shelton inpartial fulfillment of the requirements of the M.A. degree in Community Psychology
from the University of Alaska, Fairbanks. Preliminary report of a portion of the
thesis work was presented via poster at the annual meeting of the American
Association for the Advancement of Science-Arctic Division, Fairbanks, AK
(September, 1998).
P.P. Shelton et al. / Biological Psychology 60 (2002) 151�/171168

References
American Psychiatric Association, 1994. Diagnostic and Statistical Manual of Mental Disorders, vol. 4e.
American Psychiatric Association, Washington DC.
Barbato, G., Moul, D.E., Schwartz, P., Rosenthal, N.E., Oren, D.A., 1993. Spontaneous eye blink rate in
winter seasonal affective disorder. Psychiatry Research, 42 (1) 79�/85.
Booker, J.M., Hellekson, C.J., 1992. Prevalence of seasonal affective disorder in Alaska. Am. J. Psychiatry
149 (9), 1176�/1182.
Bush, A.M., 1993. Effect of high latitude on the variability of human auditory and visual event-related
brain potentials. Ph.D. Dissertation, University of Alaska Fairbanks, May 1993.
Bush, A.M., Emery, S., 1985. Circadian and arousal related influences on the auditory P300 event-related
potential. In: Technology and the Scientist. Proceedings of the 1985 Arctic Science Conference. AAAS-
Arctic Division, UAF, Fairbanks, AK p. 12
Bush, A.M., Emery, S., 1987. P300 AERP: Objective measurement of attentional fatigue in nurses working
eight and twelve hour shifts. Heart and Lung (3): 337.
Bush, A.M., Geist, C.R., Emery, S., 1991. Latency of auditory event-related potential P3 correlates with
forward digit span in an Alaskan subarctic sample. Perceptual and Motor Skills 72, 820�/822.
Cadwell Laboratories 1988. Quantum-84 Operator’s Manual. Kennewick, WA: Cadwell Laboratories,
Inc.
Clifford, J.O, Jr., Willison, J.S. 1992. Three dimensional vector analysis of the spatial components and
voltage magnitudes of the P300 response during different attentional states and stimulus modalities.
International Journal of Psychophysiology 12 (1) 1�/10.
Deldin, P., 1990. Light, gender and P300. Master’s Thesis, University of Illinois and Urbana-Champaign,
1990.
Deldin, P., Duncan, C., Miller, A., 1989a. Effects of gender and daylight exposure on P300. In:
Proceedings of the Annual Meeting of the Society for Psychophysiological Research, New Orleans,
LA.
Deldin, P., Duncan, C., Miller, A., 1989b. Evidence for seasonal effects on P300. In: Proceedings of the
EPIC IX: Ninth International Conference on Event-Related Potentials of the Brain, Noordwijk,
Netherlands.
Deldin, P., Duncan, C., Miller, A., 1994. Season, gender and P3. Biol. Psychol. 39, 15�/28.
Duncan, C., Rosenthal, N., 1986. Effects of phototherapy on brain potentials in patients with seasonal
affective disorder: a pilot study. Society for Psychological Research, 26th Annual Meeting, October
16�/19, 1986, Montreal, Canada.
Duncan, C., Mirsky, A., Deldin, P., Skwere, R., Jacobsen, F., Rosenthal, N., 1990. P3 as an index of
treatment response in seasonal affective disorder. In: Stefanis, C. (Ed.), Psychiatry: A World
Perspective, vol. 2. Elsevier, Amsterdam, pp. 398�/401.
Duncan, C.C., Mirsky, A.F., Deldin, P.J., Skwerer, R.G., Jacobsen, F.M., Rosenthal, N.E., 1991. Brain
potentials index treatment response in seasonal affective disorder. In: Ansseau, M. von Frenckell, R.,
Franck, G. (Eds.). Biological Markers of Depression: State of the Art. Elsevier Science Publishers, B.V.
Amsterdam, pp. 117�/120.
Fleck, K.M., Polich, J., 1988. P300 and the menstrual cycle. Electroencephalography and Clinical
Neurophsiology 71, 157�/160.
Ford, J.M., Roth, W.T., Mohs, R.C., Hopskins, W.R. III, Kopell, B.S., 1979. Event-related potentials
recorded from young and old adults during a memory retrieval task. Electroencophalography and
Clinical Neurophysiology. 47 (4) 450�/459.
Fujikake, N., Ninomija, S.P., Fujita, H., 1989. Statistical approaches to nonstationary EEGs for the
detection of slow vertex responses. Journal of Medical Systems 13 (3) 111�/129.
Giedke, H., Their, P., Bolz, J., 1981. The relationship between P3-latency and reaction time in depression.
Biological Psychology 13, 31�/49.
Giard, M.H., Perrin, F., Pernier, I., Peronnet, F., 1988. Several attention-related wave forms in auditory
areas: a topgraphic study. Electroencephalography and Clinical Neurophysiology 69 (4) 371�/384.
P.P. Shelton et al. / Biological Psychology 60 (2002) 151�/171 169

Golgeli, A., Suer, C., Ozesmi, C., Dolu, N. Ascioglu, M., Sahin, O., 1999. The effect of sex differences on
event-related potentials in young adults. International Journal of Neuroscience 99 (1�/4) 69�/77.
Grubb, J.D., Bush, A.M., Geist, C.R., 1998. Effect of second language study on phonemic discrimination
and auditory event-related potentials in adults. Perceptual and Motor Skills 87, 447�/456.
Hellekson, C., 1989. Phenomenology of seasonal affective disorder: an Alaskan perspective. In: Rosenthal,
N.E., Blehar, M.C. (Eds.), Seasonal Affective Disorders and Phototherapy. The Guilford Press, New
York, pp. 33�/44.
Hellekson, C., Rosenthal, N.E., 1987. New light on seasonal mood changes. Ment. Health Lett. 3 (10), 1�/
6.
Hillyard, S., Kutas, M., 1983. Electrophysiology of cognitive processing. Annual Review in Psychology 34,
33�/61.
Hoffman, L.D., Polich, J., 1999. P300, handedness, and corpus callosal size: gender, modality and task.
International Journal of Psychophysiology 31 (2) 163�/174.
Hubel, D.H., 1988. Eye, Brain and Vision. Scientific American Library, New York.
Kirk, R.E., 1968. Experimental Design: Procedures for the Behavioral Sciences. Brooks/Cole, Belmont,
CA.
Kohlman, B., Denlinger, C.G., 1988. Calculus for the Management, Life, and Social Sciences, (2nd ed)
New York, NY: Harcourt Brace Jovanovich, Publishers.
Kosmidis, M.H., Duncan, C.C., Mirsky, A.F., 1998. Sex differences in seasonal variations in P300.
Biological Psychology 49, 249�/268.
Kutas, M., McCarthy, G., Donctun, E., 1977. Augmenting mental chronometry: the P300 as a measure of
stimulus evaluation time. Science 197, 792�/795.
Lee, T.M.C., Chen, E.Y.H., Chan, C.C.H., Paterson, J.G., Janzen, H.L., Blashko, C.A., 1998. Seasonal
affective disorder. Clin. Psychol. Sci. Pract. 5, 275�/290.
Loveless, N., 1983. Event-related potentials and human performance. In: Physiological Correlates of
Human Behavior. London: Academic Press.
Luo, Y.J., Wei, J.H., 1999. Cross-modal selective attention to visual and auditory stimuli modulates
endogenous ERP components. Brain Research 842 (1) 30�/38.
Olson, C.L., 1974. Comparative robustness of six tests in multivariate analysis of variance. J. Am. Stat.
Assoc. 69, 894�/908.
Olson, C.L., 1976. On choosing a test statistic in MANOVA. Psychol. Bull. 83 (4), 579�/586.
Olson, C.L., 1979. Practical considerations in choosing a test statistic in MANOVA: a rejoinder to
Stevens. Psychol. Bull. 86, 11350�/11352.
Osterhout, L., Bersick, M., McLaughlin, J., 1997. Brain potentials reflect violations of gender stereotypes.
Memory Cognition 25 (3) 273�/285.
Picton, T.W., Cohen, J., 1984. Event-related potentials: Whence? Where? Whither? Annals of the New
York Academy of Sciences 425, 7530765.
Picton, T.W., Hink, R.F., Perez-Abalo, M., Dean, R., Wiens, L., Wiens, A.S., 1984. Evoked potentials:
how now? J. Electrophysiol. Technol. 10, 177�/221.
Picton, T.W., Stuss, D.T., Champagne, S.C., Nelson, R.F., 1984. The effects of age on human event-
related potentials. Psychophysiology 21 (3), 312�/325.
Picton, T.W., Bentin, S., Berg, P., Donchin, F., Hillyard, S.A., Johnson, R., Miller, G.A., Ritter, W.,
Ruchkin, D.S., Rugg, M.D., Taylor, M.J., 2000. Guidelines for using human event-related po-
tentials to study cognition: recording standards and publication criteria. Psychophysiology 37 (2) 127�/
152.
Polich, J., 1989. Frequency, intensity, and duration as determinants of P300 from auditory stimuli. Journal
of Clinical Neurophysiology 6, 277�/286.
Polich, J., Geisler, M.W., 1991. P300 seasonal variation. Biol. Psychol. 32, 173�/179.
Polich, J., Kok, A., 1995. Cognitive and biological determinants of P300: An integrative review. Biological
Psychology 41, 103�/146.
Polich, J., Howard, L., Starr, A., 1985. Effects of age on the P300 component of the event-related potential
from auditory stimuli: peak definition, variation, and measurement. Journal of Gerontology 40 (6)
721�/726.
P.P. Shelton et al. / Biological Psychology 60 (2002) 151�/171170
Polich, J., Burns, T., Bloom, F.E., 1988. P300 and risk for alcoholism: family history, task difficulty, and
gender. Alcohol Clinical and Experimental Research 12 (2) 248�/254.
Rosenthal, N., Sack, D., Gillin, C., Lewy, A., Goodwin, F., Davenport, Y., Mueller, P., Newsome, D.,
Wehr, T., 1984. Seasonal affective disorder: a description of the syndrome and preliminary findings
with light therapy. Arch. Gen. Psychiatry 41, 72�/80.
Rosenthal, N., Sack, D., Wehr, T., 1987. Seasonal variation in affective disorders. In: Wehr, T., Goodwin,
F. (Eds.), Circadian Rhythms in Psychiatry. Boxwood Press, Pacific Grove, CA, pp. 185�/201.
Roth, W.T., Tecce, J.J., Pfefferbaum, A., Rosenbloom, M., Callaway, E., 1984. ERPs and psychopathol-
ogy. I. Behavioral process issues. Annals of the New York Academy of Sciences 425, 496�/522.
Salkind, N.J., 1997. Exploring Research, 3rd ed.. MacMillan Publishing, New York.
Smith, K.J., 1986. Analytical trigonometry. In: Precalculus Mathematics: A Functional Approach, 3rd
ed.. Brooks/Cole, Monterey, CA.
Squires, N.K., Donchin, E., Squires, K.C., Grossberg, S., 1977. Bisensory stimulation: inferring decision-
related processes from the P300 component. J. Exp. Psychol. Hum. Percept. Perform. 3 (2), 299�/315.
Stevens, J., 1979. Comment on Olson: choosing a test statistic in multivariate analysis of variance. Psychol.
Bull. 86, 355�/360.
Stevens, J., 1986. Applied Multivariate Statistics for the Social Sciences. Lawrence Erlbaum Associates,
Hillsdale, NJ.
Sutton, S., Braren, M., Zubin, J., John, E.R., 1965. Evoked potential correlates of stimulus uncertainty.
Science 150, 1187�/1188.
Tabachnick, B.G., Fidell, L.S., 1996. Using Multivariate Statistics, 3rd ed.. Harper Collins, New York.
Taylor, M.J., Smith, M.L., Iron, K.S., 1990. Event-related potential evidence of sex differences in verbal
and nonverbal memory tasks. Neuropsychologia 28 (7) 691�/705.
Teder-Salajearvi, W.A., Munte, T.F. Sperlich, F., Hillyard, S.A., 1999. Intra-modal and crossmodal
spatial attention to auditory and visual stimuli. An event-related brain potential study. Brain Research
and Cognitive Brain Research 8 (3) 327�/343.
Zamora, E.A., Bush, A.M., Geist, C.R., 1992. Effects of a moderate dose of caffeine on event-related brain
potentials. Presented at the September 1992 Arctic Science Conference, Valdez, AK: American
Association for the Advancement of Science.
P.P. Shelton et al. / Biological Psychology 60 (2002) 151�/171 171