Abnormalities of auditory P300 cortical current density in patients with schizophrenia using high...
11
International Journal of Psychophysiology 47 (2003) 243–253 0167-8760/03/$ - see front matter 2002 Elsevier Science B.V. All rights reserved. PII: S0167-8760 Ž 02 . 00157-5 Abnormalities of auditory P300 cortical current density in patients with schizophrenia using high density recording Jijun Wang*, Ken-Ichi Hiramatsu, Hiroto Hokama, Hiroshi Miyazato, Chikara Ogura Department of Neuropsychiatry, Faculty of Medicine, University of the Ryukyus, 207 Uehara, Nishihara, Okinawa 903-0215, Japan Received 8 January 2002; received in revised form 12 November 2002; accepted 18 November 2002 Abstract While P300 current density analysis has been performed in schizophrenic patients, the event-related potential data have never been obtained using a high density recording, nor have their cortical images been well demonstrated. In this study, the auditory P300 elicited by an oddball paradigm was recorded using a high density recording system of 128 channels. Thirteen male patients who met DSM-IV criteria for schizophrenia were compared with 20 healthy male controls. The cortical current density analysis of low resolution electromagnetic tomography (LORETA) was applied to the P300 component, and this resulted in the values of 6222 current density points over the surface of a cortex model. The inter-group difference of P300 current density was assessed using a point-by-point comparison by t-test. While the normal controls demonstrated the cortical activation of bilateral frontal, temporal and parietal cortex during the oddball paradigm, visual inspection suggested that in the schizophrenic patients these areas were less activated. The inter-group significance of P300 current density was dominant over the left hemisphere, and particularly over the left prefrontal area. It is concluded that the LORETA current density analysis localizes the neural activity from the cortical fronto-temporo-parietal network as the neural substrates of the scalp recorded P300. The dysfunction of such a network, especially over the left hemisphere, possibly subserves the scalp recorded P300 abnormality in schizophrenia. 2002 Elsevier Science B.V. All rights reserved. Keywords: P300 current density; Schizophrenia; High density recording; Left hemisphere; Cortical network 1. Introduction The P300 component of human event-related potentials (ERPs) is a physiological index of endogenous cognitive processes. The scalp record- ed P300 is a composite representation of the *Corresponding author. Tel.: q81-98-895-1157; fax: q81- 98-895-1419. E-mail address: [email protected] (J. Wang). activity of temporally overlapping but anatomically and functionally distinct neural generators. Using varied methodologies, researchers have revealed the brain structures that have been associated with P300; they are as follows: frontal regions (Mc- Carley and Wood, 1987; Neshige and Luders, 1992; Turetsky et al., 1998a,b; Anderer et al., 1998), temporal lobes (Stapleton and Halgren, 1987; Kiss et al., 1989), the superior temporal gyrus (STG) including the posterior STG (Knight
-
Upload
independent -
Category
Documents
-
view
0 -
download
0
Transcript of Abnormalities of auditory P300 cortical current density in patients with schizophrenia using high...

International Journal of Psychophysiology 47(2003) 243–253
0167-8760/03/$ - see front matter� 2002 Elsevier Science B.V. All rights reserved.PII: S0167-8760Ž02.00157-5
Abnormalities of auditory P300 cortical current density in patientswith schizophrenia using high density recording
Jijun Wang*, Ken-Ichi Hiramatsu, Hiroto Hokama, Hiroshi Miyazato, Chikara Ogura
Department of Neuropsychiatry, Faculty of Medicine, University of the Ryukyus, 207 Uehara, Nishihara, Okinawa 903-0215,Japan
Received 8 January 2002; received in revised form 12 November 2002; accepted 18 November 2002
Abstract
While P300 current density analysis has been performed in schizophrenic patients, the event-related potential datahave never been obtained using a high density recording, nor have their cortical images been well demonstrated. Inthis study, the auditory P300 elicited by an oddball paradigm was recorded using a high density recording system of128 channels. Thirteen male patients who met DSM-IV criteria for schizophrenia were compared with 20 healthymale controls. The cortical current density analysis of low resolution electromagnetic tomography(LORETA) wasapplied to the P300 component, and this resulted in the values of 6222 current density points over the surface of acortex model. The inter-group difference of P300 current density was assessed using a point-by-point comparison byt-test. While the normal controls demonstrated the cortical activation of bilateral frontal, temporal and parietal cortexduring the oddball paradigm, visual inspection suggested that in the schizophrenic patients these areas were lessactivated. The inter-group significance of P300 current density was dominant over the left hemisphere, and particularlyover the left prefrontal area. It is concluded that the LORETA current density analysis localizes the neural activityfrom the cortical fronto-temporo-parietal network as the neural substrates of the scalp recorded P300. The dysfunctionof such a network, especially over the left hemisphere, possibly subserves the scalp recorded P300 abnormality inschizophrenia.� 2002 Elsevier Science B.V. All rights reserved.
Keywords: P300 current density; Schizophrenia; High density recording; Left hemisphere; Cortical network
1. Introduction
The P300 component of human event-relatedpotentials (ERPs) is a physiological index ofendogenous cognitive processes. The scalp record-ed P300 is a composite representation of the
*Corresponding author. Tel.:q81-98-895-1157; fax:q81-98-895-1419.
E-mail address: [email protected](J. Wang).
activity of temporally overlapping but anatomicallyand functionally distinct neural generators. Usingvaried methodologies, researchers have revealedthe brain structures that have been associated withP300; they are as follows: frontal regions(Mc-Carley and Wood, 1987; Neshige and Luders,1992; Turetsky et al., 1998a,b; Anderer et al.,1998), temporal lobes(Stapleton and Halgren,1987; Kiss et al., 1989), the superior temporalgyrus(STG) including the posterior STG(Knight
244 J. Wang et al. / International Journal of Psychophysiology 47 (2003) 243–253
et al., 1989; Lovrich et al., 1988; Tarkka et al.,1995), the medial temporal lobe(O’Donnel et al.,1993; Tarkka et al., 1995), hippocampus(Halgrenet al., 1980, 1995b; Neshige and Luders, 1992),amygdala(Halgren et al., 1980; McCarley andWood, 1987), the temporo-basal area(Hegerl andFrodl-Bauch, 1997), the temporal parietal junction(Knight et al., 1989), bilateral parietal areas(Hal-gren et al., 1995a; Turetsky et al., 1998a,b; He etal., 2001), the lateral neocortex of the inferiorparietal area(Smith et al., 1990; Anderer et al.,1998) and the parieto-occipital region(Kiss et al.,1989; Anderer et al., 1998). However, it has alsobeen reported that some deep structures such asthe hippocampus and amygdala might have madeonly a minor contribution to the scalp P300(John-son and Fedio, 1987; Smith et al., 1990; Halgrenet al., 1995b). Therefore, Nielsen-Bohlman andKnight (1999) suggested that the scalp P300 meas-ures neural activity from multiple sources in ananterior–posterior association cortex networkengaged during stimulus detection and encoding.The P300, often obtained using an auditory
oddball paradigm in clinical studies, has beenapplied to study the mechanisms of schizophreniafor several decades. Reduction of the auditoryP300 amplitude in schizophrenia had been repli-cated consistently since the report by Roth andCannon(1972). This abnormality was regarded asone of the most robust biological findings inschizophrenia. Longitudinal studies confirmed that,although it tracked fluctuations in clinical state,the reduced auditory P300 amplitude is basicallya trait marker of schizophrenia with a good test–retest reliability (Manthalon et al., 2000). How-ever, this abnormality is non-specific toschizophrenia, as it has also been found in otherpsychiatric populations, such as in subjects withschizotypal personality disorder, depression andalcoholism (Mannan et al., 2001; Blackwood etal., 1987; Pfefferbaum et al., 1984, 1991).Efforts to better understand the P300 abnormal-
ity in schizophrenia have lead to relating the scalprecorded P300 to the underlying neural substratesamong these patients. Some interesting results havebeen obtained, but are inconsistent across studies.Studies of surface potential topography have foundthat the P300 amplitude reduction in schizophrenia
is not uniformly distributed across the scalp. Forinstance, the reduction is greater at electrodes overthe left temporal region than over the right tem-poral region(reviews in Bruder et al., 1996), afinding which was further correlated to the reduc-tion in volume of the left posterior STG in schizo-phrenic patients by McCarley et al.(1993) usingmagnetic resonance imaging. This kind of asym-metry was also supported by the results from ahigh density 64 channels recording(Potts et al.,1998). However, the P300 scalp topography is ablurred image of the neural activity during the taskdue to the volume conduction effect. Methodolog-ical improvements have been made in a few P300studies of schizophrenic populations in an effortto further clarify the neural substrates of P300abnormality in schizophrenia. Dipole source anal-ysis was performed to analyze the P300 abnor-malities in schizophrenia by Frodl-Bauch et al.(1999) using a 4-dipole model to explain thevariance of scalp recorded P300, in which a tem-poro-basal and a temporo-superior dipole per hem-isphere were reconstructed (Hegerl andFrodl-Bauch, 1997). They reported that schizo-phrenic patients showed reduced P300 amplitudesof the temporo-basal dipoles(Frodl-Bauch et al.,1999). From scalp recorded P300 data, Turetskyet al. (1998a,b) identified five subcomponentsusing current source density measures: frontal(P3f), bilateral temporal(P3tL P3tR) and bilateralparietal (P3pL, P3pR). In the schizophrenic sub-jects, the frontal(P3f), left temporal(P3tL) andright parietal (P3pR) subcomponents werereduced. The P300 cortical activity has been esti-mated in schizophrenic patients by Winterer et al.(2001) using the low resolution electromagnetictomography(LORETA) current density analysisperformed in 3D Talairach space. Their resultsrevealed that between 240 and 420 ms poststimu-lus, schizophrenic patients less activated their cor-tex mainly over the left hemisphere including theprefrontal cortex, posterior cingulum and the tem-poral lobe, as compared to the control subjects.However, these studies were done with low-densityelectrode arrays, thus resulting in the scalp ERPinformation collected being incomplete.The ability to relate the scalp recorded P300 to
the underlying neural activity, first, depends on a
245J. Wang et al. / International Journal of Psychophysiology 47 (2003) 243–253
full and accurate description of the signal. Mostprior ERP studies have been done with sparseelectrode arrays, sometimes as few as four midlineelectrodes. For instance, Turetsky et al.(1998a)recorded the auditory P300 from schizophrenicpatients using 16 electrodes, among which thenon-edge electrodes available for identifying theP300 subcomponents were 9. The large gapsbetween the electrodes would have led to anincomplete or perhaps a distorted description ofthe spatiotemporal characteristics of ERPs. Recent-ly, high density recording has been developed toimprove the spatial resolution of ERPs. In ERPstudies of schizophrenia, only Potts et al.(1998)have used a 64 channels recording system toinvestigate the P300 topographical abnormalitiesin schizophrenic patients. To our knowledge, nostudies have recorded auditory P300 in schizo-phrenic patients using a recording system of morethan 100 channels. The first aim of this study isto obtain detailed spatial information on the P300of schizophrenic patients using a recording systemof 128 channels.The actual linking of scalp recorded data to the
underlying neural generators requires solving aformal inverse problem, to which there is nounique solution. In electrophysiological studies,both dipole analysis and current density analysiswere used to estimate the electrical sources ofscalp recorded ERPs. In this study, the currentdensity analysis of LORETA was used. The advan-tage of current density analysis is that, unlikedipole analysis, it does not require a priori speci-fication of the number andyor locations of thepoint sources. LORETA only assumes that neigh-boring neurons are simultaneously and synchro-nously activated, and approximates the currentdensity distribution throughout the whole brain(Pascul-Marqui et al., 1994). Through the use ofLORETA, P300 sources were estimated to be overbilateral prefrontal cortex, the temporal lobe, thecingulum, the parieto-occipital junction, the infe-rior parietal cortex and the superior parietal cortex(Anderer et al., 1998; Winterer et al., 2001);results obtained are basically consistent withresults from intracranial recordings. So far, how-ever, LORETA has only produced low resolutionimages. This is due not only to a direct conse-
quence of the smoothness constraint, but also tothe insufficiency of available information from alimited number of scalp electrodes in previousstudies. In this study, the current density resultswill be mapped on the cortical surface of aapproximated general head model to obtain thecortical 3D maps of P300 current density, tryingto provide a vivid image of P300 neural activity.Because gender difference has been observed
not only in the P300 of normal controls(Johnson,1989; Polich et al., 1990; Segalowitz and Barnes,1993; van Beijsterveldt et al., 1998) but also inschizophrenic patients(Turetsky et al., 1998a),only male subjects were tested in this preliminarystudy.
2. Methods and materials
2.1. Subjects
This study was approved by the Ethics Com-mittee of the Faculty of Medicine, University ofthe Ryukyus, Okinawa, Japan. Informed consentwas obtained from each subject before the ERPtest was administered. Thirteen medicated schizo-phrenic patients were tested. They came from theOutpatient or Inpatient Department of the Affili-ated Hospital of University of the Ryukyus, Oki-nawa, Japan. All patients met the DSM-IV criteriafor schizophrenia(American Psychiatric Associa-tion 1994). Clinical symptoms were evaluatedusing the Positive and Negative Syndrome Scale(PANSS) (Kay et al., 1987; general means23.5,S.D.s6.1; positive scale means11.0, S.D.s4.8;negative scale means15.1, S.D.s5.2). The con-trol subjects were 20 healthy males, none of whomhad a history of psychiatric illnesses. All thesubjects, including the patients, were free of neu-rological disease, mental retardation, alcohol anddrug abuse, and physical illness that might affectcognitive function or produce hearing loss. Groupcharacteristics are shown in Table 1. The groupsdid not differ in age or handedness composition,but they differed in the marital status(x s10.59,2
Ps0.001) and in the years of education(F s1,31
28.76, P-0.001). All patients except one wereleading a life without the company of a femalepartner. The patients had accepted less education

246 J. Wang et al. / International Journal of Psychophysiology 47 (2003) 243–253
Table 1Basic characteristics of the patients and the controls
Patient group Control group
Cases 13 20Gender Male, 13 Male, 20Age (years) 32.3"10.6 34.6"8.4Education(years) 12.9"2.4 17.5"2.4Weight (kg) 60.5"7.7 65.7"5.9Height (cm) 164.5"5.1 168.2"3.6Handedness Right, 13 Right, 19; Bidexterous, 1Female partner(withywithout) 1y12 13y7Onset age(years) 25.1"7.4PANSS 49.3"13.7Medication(mgyday) 504.6"423.5a
Subtypes Undifferentiated 7; Paranoid, 6Illness duration(years) 7.2"7.6
Equivalent chlorpromazine dosage.a
than the controls. All subjects except one bidex-terous normal control were right-handed(Edin-burgh Handedness Inventory, Oldfield, 1971).
2.2. Stimuli and task
Stimuli were high(2 kHz, 80 dB SPL) and low(1 kHz, 80 dB SPL) tones of 90 ms duration(10ms rise and fall time) with an inter-stimulusinterval of 2.0"0.1 s. The tones were delivered tothe subjects binaurally through an insert NeuroScan earphone(Hernodon, Virginia 22070) in apseudorandom sequence. The low tones were des-ignated as standards and were presented in 80%of the trials; the high tones were designated astargets and presented in 20% of the trials. Therewere 800 trials presented in 4 blocks of 200 each.Subjects were instructed to count the high tonessilently. When one block ended, they rested for 5–10 min, then continued with the next block; thecount was reset at the beginning of each subse-quent block.
2.3. ERP recording procedures
Electroencephalographic(EEG) data were col-lected at 1 sample per second, referenced to thetip of the nose, using four linked 32 channels NECAmplifiers (NEC BIOTOP 6R12) and a 128 chan-nels Geodesic Sensor Net(Electrical Geodesics,Inc). The net was applied to the scalp according
to the anatomical markers of the vertex, leftmastoid, right mastoid and the middle pointbetween the two eyebrows(the ground electrode),which had been marked and included. All impe-dance was maintained below 50 kV. The analogfilter band-pass was 0.1–60 Hz. Averaging andartifact rejection were conducted offline. Epochswere 820 ms in length with a prestimulus baselineof 120 ms. The raw EEG data were passed througha computerized artifact detection algorithm andtrials with out of range data("50 mV) wereexcluded from further analysis. The data weredigitally low-pass filtered at 30 Hz to eliminateresidual electrical noise. The EEGs were averagedby stimulus type to create the ERP waveforms.The auditory P300 was elicited by the target tones.Only waveshapes based on at least 30 averageswere accepted and only those subjects who ful-filled these criteria were included into this study.No significant group difference in the number ofsweeps for the generation of the averaged ERPwaveshapes was observed. Grand average wave-forms were created by averaging together theindividual subject averages for each group.
2.4. Data analysis
The cortical source reconstruction of the P300component were made usingCURRY VER.4.01 Soft-ware (NURO SCAN LABS, Virginia, USA). TheGeodesic Sensor Net was first applied to a phan-
247J. Wang et al. / International Journal of Psychophysiology 47 (2003) 243–253
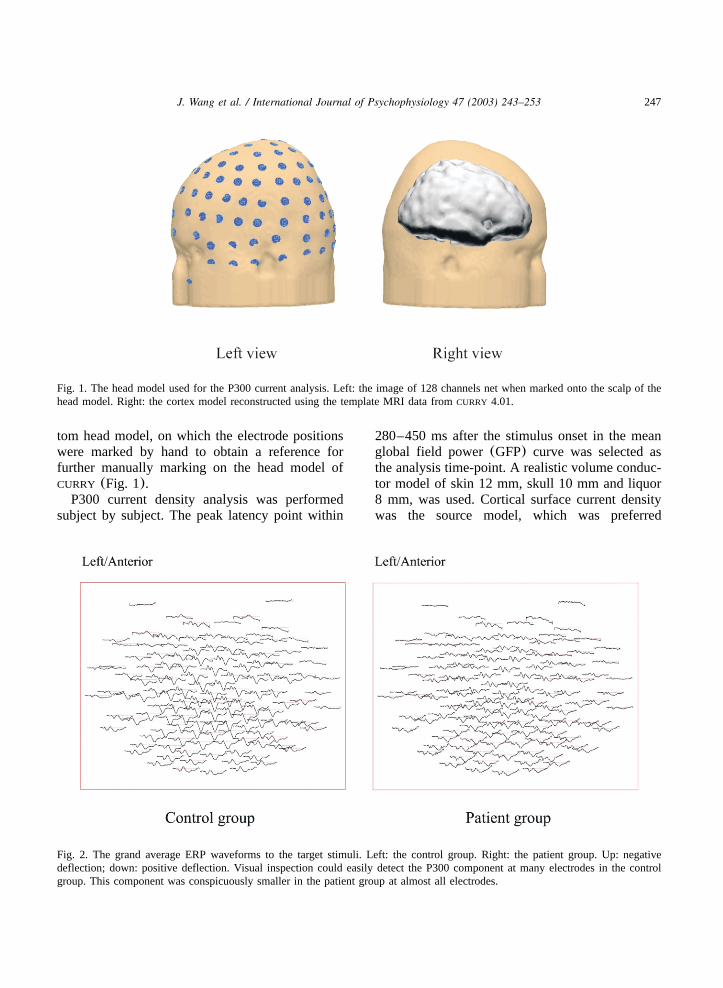
Fig. 1. The head model used for the P300 current analysis. Left: the image of 128 channels net when marked onto the scalp of thehead model. Right: the cortex model reconstructed using the template MRI data fromCURRY 4.01.
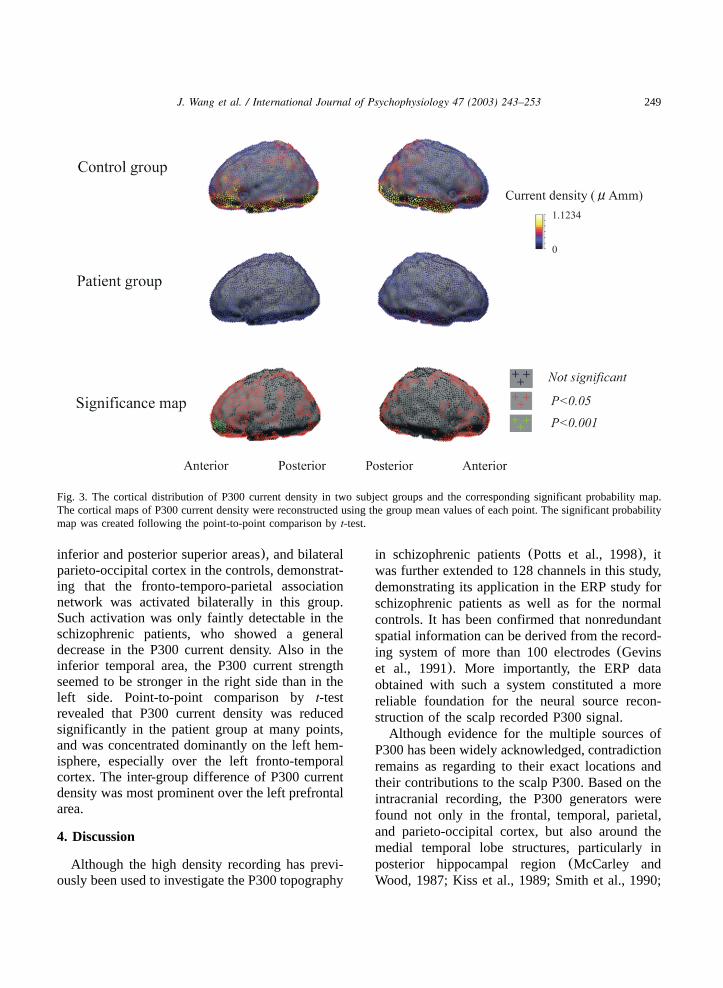
Fig. 2. The grand average ERP waveforms to the target stimuli. Left: the control group. Right: the patient group. Up: negativedeflection; down: positive deflection. Visual inspection could easily detect the P300 component at many electrodes in the controlgroup. This component was conspicuously smaller in the patient group at almost all electrodes.
tom head model, on which the electrode positionswere marked by hand to obtain a reference forfurther manually marking on the head model ofCURRY (Fig. 1).P300 current density analysis was performed
subject by subject. The peak latency point within
280–450 ms after the stimulus onset in the meanglobal field power(GFP) curve was selected asthe analysis time-point. A realistic volume conduc-tor model of skin 12 mm, skull 10 mm and liquor8 mm, was used. Cortical surface current densitywas the source model, which was preferred

248 J. Wang et al. / International Journal of Psychophysiology 47 (2003) 243–253
Table 2Mean P300 GFP measurements from ERP waveforms at 128 electrodes and mean current density values from 6222 dipole pointsfor the patients and controls
Patient group Control group F P
GFP peak latency(ms) 351.8"30.4 339.9"23.3 1.64 0.210GFP peak amplitude RMS(mV) 4.92"2.20 6.69"2.13 5.33 0.028Mean current density(mA mm) 0.26"0.19 0.54"0.32 8.14 0.008
RMS, root mean square, which is calculated using the P300 amplitudes at all recording electrodes according to the formula,wS(P300 amplitude) y128x .2 1y2
because the 3D cortical map was the aim. Thecurrent density was defined as dipole moment pervolume (unit: mA mmymm ). A current density3
distribution is discretized into a large number ofelementary dipoles. Each dipole represents thecurrent density in a given volume V. The dipolemoment is proportional to the current density thatit stands for. The distribution of current densitywas evaluated using LORETA approach in thisstudy. LORETA uses a Laplacian model, whichmeasures the second derivative of source strengths.The effect of this is that neighboring sources tendto have similar strengths, and that smooth currentdistributions are reconstructed. The results werethen mapped on a brain cortical model, which wasreconstructed using the generally averaged MRIdata provided by the software(Fig. 1).The reconstructed current density map consisted
of 6222 dipole points, each with a fixed positionwhose strength value(unit: mA mm) differedamong different individuals. These strength valueswere exported from every subject. The corticalactivation during the oddball paradigm was dem-onstrated using the group mean values of the P300current density strength, which was computed forevery point within each group. In order to inves-tigate the cortical areas over which P300 currentdensity differed between groups, a point-to-pointcomparison was made for all points usingt-test,and the correspondingP values were separatedinto 3 levels: not significant,P-0.05 andP-0.001. TheseP values were again mapped ontothe same cortex model. No corrections for multipletesting had been performed in this preliminarystudy, mainly because of that the goal was toobtain an approximate image of the spatial distri-bution of the inter-group difference.
3. Results
3.1. Performance
The counting error was 1.09"1.26% for thecontrol group, and 3.80"3.88% for the patientgroup. Schizophrenic patients showed a highererror than did the normal controls(F s8.50,1,31
Ps0.007).
3.1.1. ERP waveforms (Fig. 2)The grand average ERP waveforms of both
groups to the target stimuli are shown in Fig. 2.Visual inspection could detect a decrease in P300for the patient group at most electrodes of the 128scalp sites as compared to the control group. TheGFP amplitude root mean square(RMS) of theP300 component was reduced in the patients ascompared to controls(Table 2), but there was nosignificant difference in the GFP peak latencybetween the two groups.
3.2. P300 cortical current density (Fig. 3)
The mean P300 current density value of all6222 points was computed for each patient andcontrol. When ANOVA was applied to it with thediagnostic group as the factor(Table 2), a verysignificant group difference was obtained(F s1,31
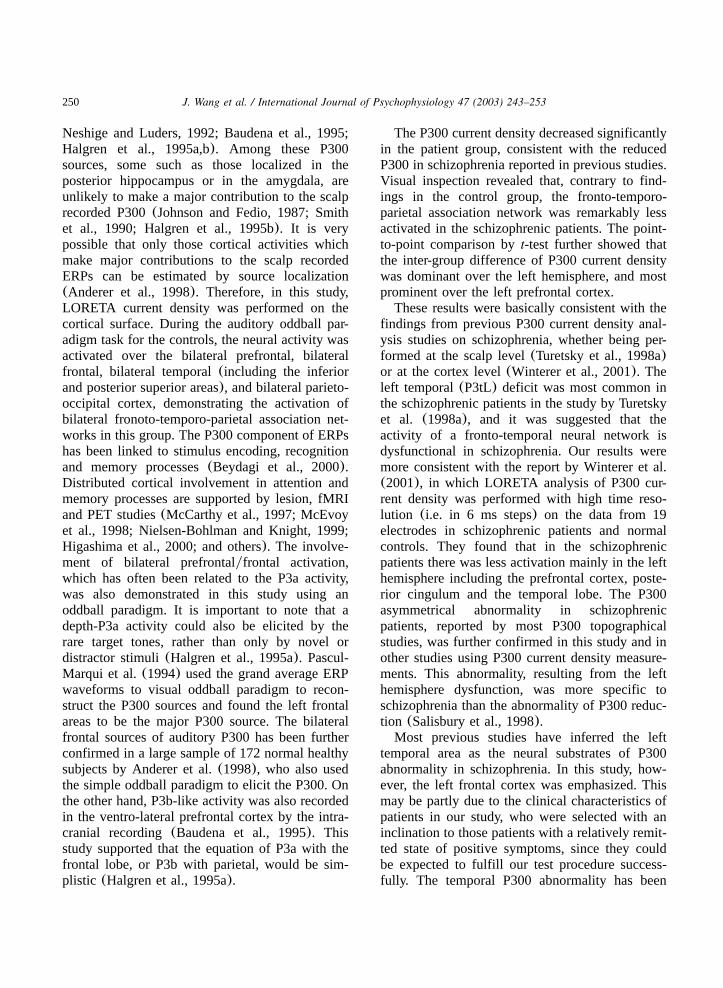
8.14,Ps0.008), revealing that the general strengthof P300 current density decreased significantly inthe schizophrenic patients.Fig. 3 shows the cortical distribution of P300
current density for the patients as well as forcontrols. During the oddball paradigm, the neuralactivity was activated over bilateral prefrontal,bilateral frontal, bilateral temporal(including the
249J. Wang et al. / International Journal of Psychophysiology 47 (2003) 243–253
Fig. 3. The cortical distribution of P300 current density in two subject groups and the corresponding significant probability map.The cortical maps of P300 current density were reconstructed using the group mean values of each point. The significant probabilitymap was created following the point-to-point comparison byt-test.
inferior and posterior superior areas), and bilateralparieto-occipital cortex in the controls, demonstrat-ing that the fronto-temporo-parietal associationnetwork was activated bilaterally in this group.Such activation was only faintly detectable in theschizophrenic patients, who showed a generaldecrease in the P300 current density. Also in theinferior temporal area, the P300 current strengthseemed to be stronger in the right side than in theleft side. Point-to-point comparison byt-testrevealed that P300 current density was reducedsignificantly in the patient group at many points,and was concentrated dominantly on the left hem-isphere, especially over the left fronto-temporalcortex. The inter-group difference of P300 currentdensity was most prominent over the left prefrontalarea.
4. Discussion
Although the high density recording has previ-ously been used to investigate the P300 topography
in schizophrenic patients(Potts et al., 1998), itwas further extended to 128 channels in this study,demonstrating its application in the ERP study forschizophrenic patients as well as for the normalcontrols. It has been confirmed that nonredundantspatial information can be derived from the record-ing system of more than 100 electrodes(Gevinset al., 1991). More importantly, the ERP dataobtained with such a system constituted a morereliable foundation for the neural source recon-struction of the scalp recorded P300 signal.Although evidence for the multiple sources of
P300 has been widely acknowledged, contradictionremains as regarding to their exact locations andtheir contributions to the scalp P300. Based on theintracranial recording, the P300 generators werefound not only in the frontal, temporal, parietal,and parieto-occipital cortex, but also around themedial temporal lobe structures, particularly inposterior hippocampal region(McCarley andWood, 1987; Kiss et al., 1989; Smith et al., 1990;
250 J. Wang et al. / International Journal of Psychophysiology 47 (2003) 243–253
Neshige and Luders, 1992; Baudena et al., 1995;Halgren et al., 1995a,b). Among these P300sources, some such as those localized in theposterior hippocampus or in the amygdala, areunlikely to make a major contribution to the scalprecorded P300(Johnson and Fedio, 1987; Smithet al., 1990; Halgren et al., 1995b). It is verypossible that only those cortical activities whichmake major contributions to the scalp recordedERPs can be estimated by source localization(Anderer et al., 1998). Therefore, in this study,LORETA current density was performed on thecortical surface. During the auditory oddball par-adigm task for the controls, the neural activity wasactivated over the bilateral prefrontal, bilateralfrontal, bilateral temporal(including the inferiorand posterior superior areas), and bilateral parieto-occipital cortex, demonstrating the activation ofbilateral fronoto-temporo-parietal association net-works in this group. The P300 component of ERPshas been linked to stimulus encoding, recognitionand memory processes(Beydagi et al., 2000).Distributed cortical involvement in attention andmemory processes are supported by lesion, fMRIand PET studies(McCarthy et al., 1997; McEvoyet al., 1998; Nielsen-Bohlman and Knight, 1999;Higashima et al., 2000; and others). The involve-ment of bilateral prefrontalyfrontal activation,which has often been related to the P3a activity,was also demonstrated in this study using anoddball paradigm. It is important to note that adepth-P3a activity could also be elicited by therare target tones, rather than only by novel ordistractor stimuli(Halgren et al., 1995a). Pascul-Marqui et al.(1994) used the grand average ERPwaveforms to visual oddball paradigm to recon-struct the P300 sources and found the left frontalareas to be the major P300 source. The bilateralfrontal sources of auditory P300 has been furtherconfirmed in a large sample of 172 normal healthysubjects by Anderer et al.(1998), who also usedthe simple oddball paradigm to elicit the P300. Onthe other hand, P3b-like activity was also recordedin the ventro-lateral prefrontal cortex by the intra-cranial recording(Baudena et al., 1995). Thisstudy supported that the equation of P3a with thefrontal lobe, or P3b with parietal, would be sim-plistic (Halgren et al., 1995a).
The P300 current density decreased significantlyin the patient group, consistent with the reducedP300 in schizophrenia reported in previous studies.Visual inspection revealed that, contrary to find-ings in the control group, the fronto-temporo-parietal association network was remarkably lessactivated in the schizophrenic patients. The point-to-point comparison byt-test further showed thatthe inter-group difference of P300 current densitywas dominant over the left hemisphere, and mostprominent over the left prefrontal cortex.These results were basically consistent with the
findings from previous P300 current density anal-ysis studies on schizophrenia, whether being per-formed at the scalp level(Turetsky et al., 1998a)or at the cortex level(Winterer et al., 2001). Theleft temporal(P3tL) deficit was most common inthe schizophrenic patients in the study by Turetskyet al. (1998a), and it was suggested that theactivity of a fronto-temporal neural network isdysfunctional in schizophrenia. Our results weremore consistent with the report by Winterer et al.(2001), in which LORETA analysis of P300 cur-rent density was performed with high time reso-lution (i.e. in 6 ms steps) on the data from 19electrodes in schizophrenic patients and normalcontrols. They found that in the schizophrenicpatients there was less activation mainly in the lefthemisphere including the prefrontal cortex, poste-rior cingulum and the temporal lobe. The P300asymmetrical abnormality in schizophrenicpatients, reported by most P300 topographicalstudies, was further confirmed in this study and inother studies using P300 current density measure-ments. This abnormality, resulting from the lefthemisphere dysfunction, was more specific toschizophrenia than the abnormality of P300 reduc-tion (Salisbury et al., 1998).Most previous studies have inferred the left
temporal area as the neural substrates of P300abnormality in schizophrenia. In this study, how-ever, the left frontal cortex was emphasized. Thismay be partly due to the clinical characteristics ofpatients in our study, who were selected with aninclination to those patients with a relatively remit-ted state of positive symptoms, since they couldbe expected to fulfill our test procedure success-fully. The temporal P300 abnormality has been
251J. Wang et al. / International Journal of Psychophysiology 47 (2003) 243–253
shown to relate to positive symptoms while thefrontal P300 abnormality appears to be related tonegative symptoms(Pfefferbaum et al., 1989;Egan et al., 1994; Frodl-Bauch et al., 1999; andothers). This difference, however, more likelyderived from our method of data analysis. In thestudy by Turetsky et al.(1998a), the P300 currentdensity was measured at the recording sites of thescalp, in a way similar to P300 amplitude meas-urements. On the other hand, the negative findingof the frontal P300 abnormality by Frodl-Bauch etal. (1999) may be attributed to the 4-dipole modelthey used. In their model, the position of P3asimilar temporo-superior dipole was relativelylocalized toward back, near the central sulcus.However, in the study by Winterer et al.(2001)using LORETA analysis, the P300 deficit in schiz-ophrenia was no longer limited to the temporallobe, but related to an extended cortical networkincluding the left prefrontal cortex. Brodmann area10, the area where the inter-group difference ofP300 current density in this study was mostremarkable, was also demonstrated a similar groupdifference in Winterer’s study. Recently, it hasbeen suggested that P300 amplitude is a possiblecorrelate of frontal degeneration in schizophrenia(Martin-Loeches et al., 2001). Despite the meth-odological limitations of LORETA analysis, ourresults were more consistent with other biologicalstudies of schizophrenia.Evidence for the direct dependence of intact
cognitive dysfunction upon the integrity of theprefrontal cortex in schizophrenia is overwhelm-ing. Deficient blood flow or metabolism in theprefrontal cortex of schizophrenic patients duringbehavioral performance has been consistentlyreported by PET and fMRI studies. Similarities ofimpairments observed in patients with schizophre-nia and in those with frontal lobe damage havebeen repeatedly highlighted in neuropsychologicaland neurophysiological observations. Evidence ofa more severe abnormality in the left as comparedto the right prefrontal cortex was reported byHirayasu et al.(2001), who found that prefrontalgray matter volume reduction was 9.2% on theleft as opposed to 7.7% on the right in first episodeschizophrenia as compared to first episode affec-tive disorder and normal controls. In the prefrontal
cortex, dopamine receptors are localized on thedistal dendrites and spines of glutamatergic pyram-idal cells and on gamma-aminobutyric acid(GABA)ergic interneurons, modulating the work-ing memory. In schizophrenia, the clinical featuresof negative symptoms and behavioral disorgani-zation can be understood as a failure in theworking memory functions of the prefrontal cortexby which information is updated on a moment-to-moment basis or retrieved from long-term stores,held in mind, and used to guide behaviors byideas, concepts, and stored knowledge(Patricia etal., 1997).In conclusion, this study demonstrated the appli-
cability of 128 channels ERP recording in studyingthe auditory P300 abnormalities of schizophrenicpatients. The cortical map of P300 current densitysupported that the fronto-temporo-parietal associ-ation cortex network is activated during the oddballparadigm in normal controls. This cortex networkwas far less activated in the schizophrenic patients.Furthermore, the group difference of P300 currentdensity was dominant over the left hemisphere,especially over the frontalyprefrontal area, sup-porting the assumption of a dysfunctional frontoyprefronto-temporal network in schizophrenia.
Acknowledgments
The authors sincerely thank the anonymousreferees and the editor ofInternational Journal ofPsychophysiology for their constructive comments.We also gratefully acknowledge Maxine Randallfor her editorial comments.
References
Anderer, P., Pascual-Marqui, R.D., Semlitsch, H.V., Saletu, B.,1998. Differential effects of normal aging on sources ofstandard N1, target N1 and target P300 auditory event-related brain potentials revealed by low resolution electro-magnetic tomography(LORETA). Electroencephalogr. Clin.Neurophysiol. 108, 160–174.
Baudena, P., Halgren, E., Heit, G., Clarke, J.M., 1995. Intra-cerebral potentials to rare target and distractor auditory andvisual stimuli. III Frontal cortex. Electroencephalogr. Clin.Neurophysiol. 94, 251–264.
Beydagi, H., Ozesmi, C., Yilmaz, A., Suer, C., Ergenoglu, T.,2000. The relation between event related potential and
252 J. Wang et al. / International Journal of Psychophysiology 47 (2003) 243–253
working memory in healthy subjects. Int. J. Neurosci. 105,77–85.
Blackwood, D.H.R., Whalley, L.Y., Christie, J.E., Blackburn,J.M., St-Clair, D.M., Mcinnes, A., 1987. Changes in auditoryP3 event-related potential in schizophrenia and depression.Br. J. Psychiatry 150, 154–160.
Bruder, G.E., Tenke, C.E., Rabinomicz, E., Towey, J.P., Mala-spina, D., Amador, T., 1996. Electrophysiological studies ofbrain activity in schizophrenia. In: Kaufmann, C.A., Gor-man, J.M.(Eds.), Schizophrenia: New Directions for Clin-ical Research and Treatment. Mar Ann Liebert, Lochmond,pp. 17–33.
Egan, M.F., Duncan, C.C., Suddath, R.L., Kirch, D.G., Mirsky,A.F., Wyatt, R.J., 1994. Event-related abnormalities correlatewith structural brain alterations and clinical features inpatients with chronic schizophrenia. Schizophr. Res. 11,259–271.
Frodl-Bauch, T., Gallinat, J., Meisenzahl, E.M., Moller, H.J.,Hegerl, U., 1999. P300 subcomponents reflect differentaspects of psychopathology in schizophrenia. Biol. Psychi-atry 45, 116–126.
Gevins, A., Le, J., Brickett, P., Reutter, B., Desmond, J., 1991.Seeing through the skull: advanced EEGs use MRIs toaccurately measure cortical activity from the scalp. BrainTopogr. 4, 125–131.
Halgren, E., Baudena, P., Clarke, J.M., et al., 1995a. Intracer-ebral potentials to rare target and distractor auditory andvisual stimuli. I. Superior temporal plane and parietal lobe.Electroencephalogr. Clin. Neurophysiol. 94, 191–220.
Halgren, E., Baudena, P., Clarke, J.M., et al., 1995b. Intracer-ebral potentials to rare target and distractor auditory andvisual stimuli. II. Medial, lateral and posterior temporallobe. Electroencephalogr. Clin. Neurophysiol. 94, 229–250.
Halgren, E., Squries, N.K., Wilson, C.L., Rohrbaugh, J.W.,Babb, T.L., Crandall, P.H., 1980. Endogenous potentialgenerated in the human hippocampal formation and amygalaby infrequent events. Science 210, 803–805.
He, B., Lian, J., Spencer, K.M., Dien, J., Donchin, E., 2001.A cortical potential imaging analysis of the P300 andnovelty P3 components. Hum. Brain Mapp. 12, 120–130.
Hegerl, U., Frodl-Bauch, T., 1997. Dipole source analysis ofP300 component of the auditory evoked potential: a meth-odological advance? Psychiatry Res. 74, 109–118.
Higashima, M., Kawasaki, Y., Urata, K., et al., 2000. Regionalcerebral blood flow in male schizophrenic patients perform-ing an auditory discrimination task. Schizophr. Res. 42,29–39.
Hirayasu, Y., Tanaka, S., Shenton, M.E., et al., 2001. Prefrontalgray matter volume reduction in first episode schizophrenia.Cerebral Cortex 11, 374–381.
Johnson, R., 1989. Developmental evidence for modality-dependent P300 generator. A normative study. Psychophys-iology 26, 651–667.
Johnson, R., Fedio, P., 1987. Task-related changes in P300scalp distribution in temporal lobectomy patients. Electroen-cephalogr. Clin. Neurophysiol. Suppl. 40, 699–704.
Kay, S.R., Fiszbein, A., Opler, L.A., 1987. The positive andnegative syndrome scale(PANSS) for schizophrenia. Schi-zophr. Bull. 13, 261–276.
Kiss, I., Dashieff, R.M., Lordeon, P., 1989. A parieto-occipitalgenerator for P300: evidence from human intracranialrecordings. Int. J. Neurosci. 49, 133–139.
Knight, R.T., Scabini, D., Woods, D.L., Clayworth, C.C., 1989.Contributions of temporal-parietal junction to human audi-tory P3. Brian Res. 502, 109–116.
Lovrich, D., Novick, B., Vaughan, H.J., 1988. Topographicanalysis of auditory event-related potentials associated withacoustic and semantic processing. Electroencephalogr. Clin.Neurophysiol. 71, 40–54.
Mannan, R., Hiramatsu, K., Hokama, H., Ohta, H., 2001.Abnormalities of auditory event-related potentials in stu-dents with schizotypal personality disorder. Psychiatry Clin.Neurosci. 55, 451–457.
Manthalon, D.H., Ford, J.M., Pfefferbaum, A., 2000. Trait andstate aspects of P300 amplitude reduction in schizophrenia:a retrospective longitudinal study. Biol. Psychiatry 47,434–449.
Martin-Loeches, M., Molina, V., Munoz, F., et al., 2001. P300amplitude as a possible correlate of frontal degeneration inschizophrenia. Schizophr. Res. 49, 121–128.
McCarley, G., Wood, C.C., 1987. Intracranial recordings ofendogenous ERPs in human. Electroencephalogr. Clin. Neu-rophysiol. Suppl. 39, 331–337.
McCarley, R.W., Shenton, M.E., O’Donnell, B.F., et al., 1993.Auditory P300 abnormalities and left posterior superiortemporal gyrus volume reduction in schizophrenia. Arch.Gen. Psychiatry 50, 190–197.
McCarthy, G., Luby, M., Gore, J., Goldman-Rakic, P., 1997.Infrequent events transiently activate human prefrontal andparietal cortex as measured by functional MRI. J. Neuro-physiol. 77, 1630–1634.
McEvoy, L.K., Smith, M.E., Gevins, A., 1998. Dynamiccortical networks of verbal and spatial working memory:effects of memory load and task practice. Cerebral Cortex8, 563–574.
Neshige, R., Luders, H., 1992. Recording of event-relatedpotentials(P300) from human cortex. J. Clin. Neurophysiol.9, 294–298.
Nielsen-Bohlman, L., Knight, R.T., 1999. Prefrontal corticalinvolvement in visual working memory. Brain Res. Cognit.Brain Res. 8, 299–310.
O’Donnel, B.F., Cohen, R.A., Hokama, H., et al., 1993.Electrical source analysis of auditory ERP abnormalities inmedial temporal lobe post-encephalitic amnestic syndrome.Electroencephalogr. Clin. Neurophysiol. 87, 394–402.
Oldfield, R.C., 1971. The assessment and analysis of handed-ness: the Edinburgh inventory. Neuropsychologia 9, 97–113.
Pascul-Marqui, R.D., Michel, C.M., Lehmann, D., 1994. Lowresolution electromagnetic tomography: a new method forlocalizing electrical activity in the brain. Int. J. Psychophy-siol. 18, 49–65.
253J. Wang et al. / International Journal of Psychophysiology 47 (2003) 243–253
Patricia, S., Goldman, R.akie, Selemon, L.D., 1997. Functionaland anatomical aspects of prefrontal pathology in schizo-phrenia. Schizophr. Bull. 23, 437–458.
Pfefferbaum, A., Enegrat, B., Ford, J.M., Roth, W.T., Kopell,B.S., 1984. Clinical application of event-related potentials.II. Dementia, depression and schizophrenia. Electroence-phalogr. Clin. Neurophysiol. 59, 104–124.
Pfefferbaum, A., Ford, J.M., White, P.M., Roth, W.T., 1989.P3 in schizophrenia is affected by stimulus modality,response requirements, medication status, and negativesymptoms. Arch. Gen. Psychiatry 46, 1035–1044.
Pfefferbaum, A., Ford, J.M., White, P.M., Mathalon, D.H.,1991. Event-related potentials in alcoholic men: P3 ampli-tude reflects family history but not alcohol consumption.Alcohol. Clin. Exp. Res. 15, 839–850.
Polich, J., Ladish, C., Burns, T., 1990. Normal variation ofP300 in children: age, memory span and head size. Int. J.Psychophysiol. 9, 237–248.
Potts, G.F., Hirayatsu, Y., O’Donnell, B.F., Shenton, M.E.,McCarley, R.W., 1998. High-density recording and topo-graphic analysis of the auditory oddball event-related poten-tial in patients with schizophrenia. Biol. Psychiatry 44,982–989.
Roth, W.T., Cannon, E.H., 1972. Some features of auditoryevoked response in schizophrenics. Arch. Gen. Psychiatry27, 466–471.
Salisbury, D.F., Shenton, M.E., Sherwood, A.R., Fischer, I.A.,Yurglun-Told, D.A., Tohen, M., 1998. First-episode schizo-phrenic psychosis differs from first affective psychosis andcontrols in P300 amplitude over left temporal lobe. Arch.Gen. Psychiatry 55, 173–180.
Segalowitz, S., Barnes, K., 1993. The reliability of ERPcomponents in the auditory oddball paradigm. Psychophys-iology 30, 451–459.
Smith, M.E., Halgren, E., Sokolik, M.E., et al., 1990. Theintracranical topography of the P3 event-related potentialselicited during auditory oddball paradigm. Electroencephal-ogr. Clin. Neurophysiol. 76, 235–248.
Stapleton, J.M., Halgren, E., 1987. Endogenous potentialsevoked in simple cognitive tasks: depth components andtask correlates. Electroencephalogr. Clin. Neurophysiol. 67,44–52.
Tarkka, I.M., Stokic, D.S., Basile, L.F.H., Papanicolaou, A.C.,1995. Electric source localization of the auditory P300agrees with magnetic sources localization. Electroencephal-ogr. Clin. Neurophysiol. 96, 538–845.
Turetsky, B.I., Colbath, E.A., Gur, R.E., 1998a. P300 subcom-ponent abnormalities in schizophrenia: I. Physiological evi-dence for gender and subtype specific differences in regionalpathology. Biol. Psychiatry 43, 84–96.
Turetsky, B.I., Colbath, E.A., Gur, R.E., 1998b. P300 subcom-ponent abnormalities in schizophrenia: II. Longitudinal sta-bility and relationship to symptom change. Biol. Psychiatry43, 331–339.
van Beijsterveldt, C.E.M., Molenaar, P.C.M., de Geus, E.J.C.,Boomsma, D.I., 1998. Individual difference in P300 ampli-tude: a genetic study in adolescent twin. Biol. Psychol. 47,176–179.
Winterer, G., Mulert, C., Mientus, S., et al., 2001. P300 andLORETA: comparison of normal subjects and schizophrenicpatients. Brain Topogr. 13, 299–313.