A new interpretation of P300 responses upon analysis of coherences
12
RESEARCH ARTICLE A new interpretation of P300 responses upon analysis of coherences Bahar Gu ¨ ntekin • Erol Bas ¸ar Received: 23 October 2009 / Revised: 13 January 2010 / Accepted: 26 January 2010 / Published online: 12 February 2010 Ó Springer Science+Business Media B.V. 2010 Abstract Previous studies on cognitive dynamics showed that oscillatory responses of P300 are composed of mainly delta and theta responses. In the present study, for the first time, the long-distance intra-hemispheric event related coherence (auditory oddball paradigm) and evoked coher- ence (simple sound) were compared in order to evaluate the effects of cognitive tasks on the long-distance coherences. Seventeen healthy subjects (8 female, 9 male) were included in the study. The coherence was analyzed for delta (1–3.5 Hz), theta (4–7.5 Hz) and alpha (8–13 Hz) frequency ranges for (F 3 -P 3 ,F 4 -P 4 ,F 3 -T 7 ,F 4 -T 8 ,F 3 -O 1, F 4 -O 2 ) electrode pairs. The coherence to target responses were higher than the non-target and simple auditory response coherence. This difference is significant for the delta coherence for both hemispheres and for theta coher- ences over the left hemisphere. The highest coherences were recorded at fronto-temporal locations for all fre- quency bands (delta, theta, alpha). Furthermore, fronto- parietal coherences were higher than the fronto-occipital coherences for all frequency bands (delta, theta, alpha).These results show that the fronto-temporal and fronto-parietal connections are most relevant for the iden- tification of the target signal. This analysis open the way for a new interpretation of dynamic localization results during cognitive tasks. Keywords Event related coherence Brain oscillations P300 Oddball Delta Theta Alpha Introduction The present report aims to fill an important gap in the analysis of P300-oddball paradigm, in order to establish the effect of electrical links between cognitive networks in the whole brain. The coherence function was first used four decades ago by Adey et al. (1960), as a pioneering work on theta rhythms of the cat limbic system during conditioning. These authors used spectral analysis and coherence func- tions to investigate how the rhythmic potentials of the cat brain were related to behavior. The use of the coherence function in comparing EEG activity in various nuclei of the cat brain was one of the essential steps in refuting the view that the EEG was an epiphenomenon (Adey 1989). Accordingly, the induced theta rhythm and the task-rele- vant increase of coherence in the limbic system is a milestone in EEG research. When carrying out a behavioral task, the cat hippocampal activity exhibits a transition from irregular activity to coherent induced rhythms. The findings of Adey et al. (1960) were the deciding factor in the choice of the hippocampus as a model for resonance processes in the brain for the Bas ¸ar et al. research group (1975a, b, c, 1979, 1980), Bas ¸ar (2004). Bas ¸ar (1980) further developed a model for excitability in neural tissues. This model suggested that if the brain receives a sensory stimulation, and if a neural structure has an intrinsic activity, then this structure would respond with its natural frequency. Several paradigms, including the P300-oddball para- digm, were used in order to analyze working memory and attention by means of EROs (Event Related Oscillations) (Bas ¸ar and Stampfer 1985; Bas ¸ar-Erog ˘ lu et al. 1992; Fru ¨nd et al. 2008) The first studies on Brain Oscillatory Dynamics in P300 included Bas ¸ar and Stampfer (1985), Bas ¸ar et al. (1984), Bas ¸ar-Erog ˘lu et al. (1992, 2001), Schu ¨rmann et al. B. Gu ¨ntekin E. Bas ¸ar (&) Brain Dynamics, Cognition and Complex Systems Research Center, Istanbul Kultur University, Istanbul, Turkey e-mail: [email protected] 123 Cogn Neurodyn (2010) 4:107–118 DOI 10.1007/s11571-010-9106-0
-
Upload
istmedipol -
Category
Documents
-
view
1 -
download
0
Transcript of A new interpretation of P300 responses upon analysis of coherences
RESEARCH ARTICLE
A new interpretation of P300 responses upon analysisof coherences
Bahar Guntekin • Erol Basar
Received: 23 October 2009 / Revised: 13 January 2010 / Accepted: 26 January 2010 / Published online: 12 February 2010
� Springer Science+Business Media B.V. 2010
Abstract Previous studies on cognitive dynamics showed
that oscillatory responses of P300 are composed of mainly
delta and theta responses. In the present study, for the first
time, the long-distance intra-hemispheric event related
coherence (auditory oddball paradigm) and evoked coher-
ence (simple sound) were compared in order to evaluate the
effects of cognitive tasks on the long-distance coherences.
Seventeen healthy subjects (8 female, 9 male) were
included in the study. The coherence was analyzed for
delta (1–3.5 Hz), theta (4–7.5 Hz) and alpha (8–13 Hz)
frequency ranges for (F3-P3, F4-P4, F3-T7, F4-T8, F3-O1,
F4-O2) electrode pairs. The coherence to target responses
were higher than the non-target and simple auditory
response coherence. This difference is significant for the
delta coherence for both hemispheres and for theta coher-
ences over the left hemisphere. The highest coherences
were recorded at fronto-temporal locations for all fre-
quency bands (delta, theta, alpha). Furthermore, fronto-
parietal coherences were higher than the fronto-occipital
coherences for all frequency bands (delta, theta,
alpha).These results show that the fronto-temporal and
fronto-parietal connections are most relevant for the iden-
tification of the target signal. This analysis open the way
for a new interpretation of dynamic localization results
during cognitive tasks.
Keywords Event related coherence � Brain oscillations �P300 � Oddball � Delta � Theta � Alpha
Introduction
The present report aims to fill an important gap in the
analysis of P300-oddball paradigm, in order to establish
the effect of electrical links between cognitive networks in
the whole brain.
The coherence function was first used four decades ago
by Adey et al. (1960), as a pioneering work on theta
rhythms of the cat limbic system during conditioning.
These authors used spectral analysis and coherence func-
tions to investigate how the rhythmic potentials of the cat
brain were related to behavior. The use of the coherence
function in comparing EEG activity in various nuclei of the
cat brain was one of the essential steps in refuting the view
that the EEG was an epiphenomenon (Adey 1989).
Accordingly, the induced theta rhythm and the task-rele-
vant increase of coherence in the limbic system is a
milestone in EEG research. When carrying out a behavioral
task, the cat hippocampal activity exhibits a transition from
irregular activity to coherent induced rhythms. The findings
of Adey et al. (1960) were the deciding factor in the choice
of the hippocampus as a model for resonance processes in
the brain for the Basar et al. research group (1975a, b, c,
1979, 1980), Basar (2004). Basar (1980) further developed
a model for excitability in neural tissues. This model
suggested that if the brain receives a sensory stimulation,
and if a neural structure has an intrinsic activity, then this
structure would respond with its natural frequency.
Several paradigms, including the P300-oddball para-
digm, were used in order to analyze working memory and
attention by means of EROs (Event Related Oscillations)
(Basar and Stampfer 1985; Basar-Eroglu et al. 1992; Frund
et al. 2008) The first studies on Brain Oscillatory Dynamics
in P300 included Basar and Stampfer (1985), Basar et al.
(1984), Basar-Eroglu et al. (1992, 2001), Schurmann et al.
B. Guntekin � E. Basar (&)
Brain Dynamics, Cognition and Complex Systems Research
Center, Istanbul Kultur University, Istanbul, Turkey
e-mail: [email protected]
123
Cogn Neurodyn (2010) 4:107–118
DOI 10.1007/s11571-010-9106-0

(2001), and Stampfer and Basar (1985). Another series of
studies on local oscillatory dynamics showed that the major
operating rhythms of P300 are mainly the delta and theta
oscillations (Basar et al. 2001; Basar-Eroglu et al. 1992;
Demiralp et al. 1999; Karakas et al. 2000; Kolev et al.
1997; Spencer and Polich 1999; Yordanova et al. 2000).
The prolongation of theta, delta and alpha oscillations were
described for the target stimuli (Basar-Eroglu et al. 1992;
Demiralp and Ademoglu 2001; Stampfer and Basar 1985;
Oniz and Basar 2009; Yordanova and Kolev 1998). Other
research groups have also studied oddball paradigm by
means of brain oscillations in EEG and MEG studies
(Anokhin et al. 2001; Bernat et al. 2007; Kawamata et al.
2007; Ishii et al. 2009; Mazaheri and Picton 2005).
Mazaheri and Picton (2005) reported that target stimuli
increased the frontal theta activity, decreased posterior and
central alpha and beta activity, and decreased central
gamma activity. Gamma band activity were also studied in
oddball paradigms (Basar-Eroglu and Basar 1991; Fell
et al. 1997; Gurtubay et al. 2001, 2004; Haig et al. 1999;
Kang et al. 2005; Tomberg and Desmedt 1998), the late
gamma activity was found to be related with target stimuli
(Basar-Eroglu and Basar 1991; Gurtubay et al. 2001,
2004). The methods described in the referenced studies
were mainly the amplitude and latency measures of aver-
aged filtered responses, spectral power of target response,
wavelet decomposition and phase locking factor of target
and non-target responses. However, the analysis of a long-
distance coherence upon application of an auditory oddball
paradigm was not performed in an extended manner in
most of the studies. Only a single study Kukleta et al.
(2009) analyzed event-related potentials (ERP) evoked by
non-target stimuli in a visual oddball experiment and
showed coherent oscillations in beta 2 frequency band in
the prestimulus period, recorded by means of intracranial
electrodes in humans. However, these authors did not
compare target vs. non-target response or target versus
simple sensory stimulation.
Several authors indicated the role of frontal, temporal
and parietal areas for the generation of P300 amplitude in
healthy subjects (Knight et al. 1989; Knight 1990; Polich
2003; Soltani and Knight 2000; Verleger et al. 1994;
Yamaguchi and Knight 1992). Decreased coherence values
of pathological subjects for frontal-temporal and/or fronto-
parietal has been also reported (Ford et al. 2002; Guntekin
et al. 2008; Winterer et al. 2003). Sauseng et al. (2005)
calculated the coherence function during a visuospatial
working memory task in a group of healthy subjects. Their
findings indicated that the involvement of prefrontal areas
in executive functions are reflected in a decrease of anterior
upper alpha short-range connectivity and a parallel increase
of fronto-parietal long distance coherence, mirroring the
activation of a fronto-parietal network. Based on the
findings of these previous studies, we focused our analysis
on long distance intrahemispheric coherence values (F3-P3,
F3-T7, F3-O1, F4-P4, F4-T8, F4-O2). Our hypothesis is as
follows: we will be able to differentiate more clearly sen-
sory and cognitive processes that are selectively distributed
in topologically various areas of the brains.
In order to analyze the role of brain oscillation in brain
function a ‘‘Brain Dynamics Research Program’’ was
proposed by Basar (1976, 1999). This program introduced
the necessity of applying several system theoretical tools
and conceptual paradigms in order to enrich the functional
interpretation of oscillations in neural systems. This
research program also indicates the necessity to introduce a
Darwinistic view by measuring oscillatory dynamics in
several species including invertebrate ganglia as Aplysia or
Helix Pomatia (Basar and Guntekin 2009; Bullock and
Basar 1988). Additionally, findings in pathological cases
help enormously in understanding the functional correlates
of brain oscillations and possible effects of transmitters
(Basar and Guntekin 2008). One of the most important
features of this program is the necessity to jointly apply the
increase of oscillatory responses together with evoked
coherences, indicating enhanced links between various
brain areas. In the last two decades a number of system
theoretical tools and method of thoughts were developed in
order to understand brain functions. However, in most of
the cases neuroscientist prefer to choose one or two of
currently most applied methods. Our research program is
suggesting to neuroscientist to look to a broad ensemble of
methods that can be useful to understand the problem
which will be studied. For example, applications of drugs,
application of several paradigms lead to obtain richer
amount of data. In the special case of our study we apply
different recordings as simple evoked oscillations and
event related oscillations by means of oddball paradigm.
The comparison of response adaptive filtering results gives
a good idea on the auditory signal processing. However,
additional to this, the study of event related and evoked
coherences establish links between various areas of the
brain that are activated differentially upon application of
sensory and cognitive paradigms.
Experimental procedure
Subjects
Seventeen subjects (8 females, 9 males), most of them
being university students and university members, volun-
teered for the experiment. Their ages ranged from 19 to
41 years. The mean age of subjects was 27.53 ± 6.08
years. All of the subjects were right handed. All subjects
had completed at least 10 years of education. All subjects
108 Cogn Neurodyn (2010) 4:107–118
123
were interviewed with a questionnaire for their family
history, demographic, medical profiles and drinking habits.
No subjects reported any current or past neurological or
psychiatric illness and all participants had normal or cor-
rected to normal vision. All subjects signed an approved
consent form.
Stimuli and paradigms
The subjects’ eyes were open and they were seated in a
dimly-lit isolated room.
Two types of stimuli were presented: simple auditory
stimuli for analyzing auditory evoked potentials (simple
auditory stimulation), and; auditory oddball paradigm for
analyzing auditory event related potentials (AERP). The
auditory stimuli had 16 ms rising time, 50 ms falling time
and a 1,000 ms duration and were presented by two loud-
speakers. Eye-movements were controlled by a fixation
cross on a screen.
• The auditory simple stimuli were tones of 80 dB and
1,500-Hz tones. The inter-stimulus intervals varied
randomly between 3 and 7 s. The total number of
stimuli was 60.
• A classical auditory oddball paradigm was used in the
experiments. Two types of stimuli were used: task-
relevant target and task- irrelevant non-target (stan-
dard). The total number of stimuli was 120 (40 target,
80 non-target). In the oddball paradigm the 80 dB,
1,600-Hz tones (target) and 1,500-Hz tones (non-target)
were presented in a random sequence. The interval
between tones varied randomly between 3 and 7 s. The
subjects were instructed to keep a mental count of the
number of 1,600-Hz tones (target). During the elicita-
tion period of event related oscillations, all the subjects
had displayed sufficient accuracy in the mental count of
the target stimuli.
The evoked coherence responses to the target, non-tar-
get and simple auditory stimulation stimuli were analyzed
and compared.
Electrophysiological recording
EEG was recorded with 30 Ag-AgCl electrodes mounted in
an elastic cap (Easy-cap) according to the international
10–20 system. Additionally, two linked earlobe electrodes
(A1 ? A2) served as references. The EOG from the medial
upper and lateral orbital rim of the right eye was also
registered. For the reference electrodes and EOG record-
ings, Ag-AgCl electrodes were used. All electrode
impedances were less than 10 kX. The EEG was amplified
by means of a BrainAmp 32-channels DC system machine
with band limits of 0.01–250 Hz. The EEG was digitized
on-line with a sampling rate of 500 Hz.
Artifacts were eliminated by manual off-line selective
averaging, taking into consideration the EOG recorded
from the right eye. The sweep numbers were equalized
randomly between the target, non-target and simple audi-
tory stimulation conditions. In the mean 20 sweeps per
modality were used.
Coherence
For the signal analysis, evaluation of oscillatory dynamics
and coherence analysis Brainvision Analyzer Software was
used. First, the Fast Fourier transform of each epoch with
0–800 ms duration was calculated, and then the coherence
analysis was performed with a 1.25 Hz resolution.
The choosing of the time interval 800 ms following the
stimulation is based on a rationale, which takes care of the
complex biological properties of the EEG. In engineering
studies the analyzer usually prefers an analysis period of
more than 1,000 ms for the delta band. However, in order
to optimize the time period of analysis we first performed a
power spectral analysis of EEG response and found a peak
around 1.5 Hz in the power spectrum of the EP and ERP
responses. Furthermore, we observed that the filtered ERP
in the delta frequency range is a dampened aperiodical
signal, which is almost completely flattening around 500–
600 ms. An analysis of coherence for longer periods would
include then unexpected artifacts and/or alpha after dis-
charges. In the theta band the second response window is
found around 400 ms (Basar-Eroglu et al. 1992; Demiralp
et al. 1999; Stampfer and Basar 1985; Yordanova et al.
2000). These were the chain of reasoning to choose the
period of 0–800 ms as the optimal time period for the
coherence analysis. We also extended our analysis to
1,000 ms; here similar results with minimal deviation were
found. We also recommend to brain research scientist to
develop controls and not to use strict formula presented in
some of the engineering textbooks. The method used was
the cross-spectrum/autospectrum and the mathematical
relations are described in the following:
Cohðc1; c2ÞðfÞ¼ jCSðc1; c2ÞðfÞj2= jCSðc1; c1ÞðfÞjjCSðc2; c2ÞðfÞjð Þ;
in conjunction with
CSðc1; c2ÞðfÞ ¼X
c1; iðfÞc2; iðfÞ�:
Then, Fisher’s Z transformation was used to normalize
the distribution of average coherence values.
Coherence was calculated for the target, non-target and
simple auditory stimuli for long-distance intrahemispheric
pairs for three different frequency bands (delta (1–3.5 Hz);
Cogn Neurodyn (2010) 4:107–118 109
123
theta (4–7.5 Hz); alpha (8–13 Hz)). The maximum coher-
ence value in each frequency range was included for the
purpose of statistical analysis as the coherence value of that
range. (If there was more than one peak, the peak with the
maximum coherence value was accepted as the coherence
value.) The long distance intrahemispheric pairs were
F3-P3, F3-T7, F3-O1, F4-P4, F4-T8, F4-O2.
The present study does not include coherence analysis
higher than alpha frequency band. In the analysis of
gamma frequency band authors mostly consider a wide
range between 30 and 70 Hz. This application is erroneous,
because most of the investigators do not perform spectral
analysis prior choosing the frequency channels to analyze
the coherence function. Accordingly, special care must
be applied to the higher frequency range in a future
publication.
In addition to foregoing methodological description of
coherence function we mention the publications by Srini-
vasan et al. (2007) and Nunez et al. (1999). According to
these authors the optimal distance between electrodes must
be around 10–20 cm in human EEG-recordings. They
assume that Laplacian measure is more suitable since the
limitation is around 5 cm (see Fig. 3; Srinivasan et al.
2007). Furthermore, these authors indicate that almost all
of volume conduction effects on coherence are removed by
the surface Laplacian; however, the Laplacian spatial filter
also removes large-scale source activity. In our study the
fronto-temporal distance is approximately 8 cm; accord-
ingly the correction of volume conduction has values that
can be neglected. On the other hand, in our present work
the comparisons of responses between target, non-target
and simple auditory stimuli are relevant and not the abso-
lute values. The target responses depict increases of
approximately 50% in comparison of single EPs and non-
target responses. These are crucial results eliminating the
necessity of corrections mentioned about.
Moreover, Basar et al. (2009) recently published results
on Alzheimer patients showing that the coherence values of
responses to simple visual stimuli can be as low as 0.3.
This indicates that volume conduction does not have con-
siderable correction necessity when the connectivity
between (F3P3, F4P4) is biologically impaired.
Volume conduction is important when two electrode
pairs (F3-T7 vs. F3-O1) are compared. But it could be
neglected in different conditions: (1) When two different
paradigms are compared for the same electrode pair (i.e.
Comparing target coherence value to simple auditory
coherence value for F3-T7 electrode pair. (2) When two
different groups of subjects are compared for same elec-
trode pair (i.e. comparing Alzheimer subjects’ coherence
values to healthy subjects’ coherence values for F3-T7
electrode pair). In these two conditions the volume con-
duction for F3-T7 is same; however the paradigm and group
change influences the coherence values (Basar et al. 2009;
Guntekin et al. 2008).
Statistics
Fisher’s Z transformation was used to normalize the dis-
tribution of coherence values. The Statistical Package for
Social Studies (SPSS) program was used for statistical
analysis. The differences between stimulus types were
assessed by means of a repeated measure ANOVA for each
frequency band, and for the intrahemispheric locations. In
the analysis of intrahemispheric coherence differences,
repeated measures of ANOVA included the between-sub-
jects factor as gender (male, female) (although the number
of subjects are not enough for gender comparison,
according to our groups’ previous results, including the
gender as a factor and controlling for the gender effects
seems crucial (Guntekin and Basar 2007a, b)); repeated
measure ANOVA included the within-subject factors as
stimulus types (target, non-target, simple auditory stimu-
lation); laterality (right, left) and location (F3/4-P3/4 vs. F3/
4-T7/8 vs. F3/4-O1/2). Post-hoc comparisons were analyzed
with t-tests. Differences between electrode pairs of
modalities were also analyzed with t-tests and the signifi-
cance level was set to P \ 0.05 for all post-hoc compari-
sons. Post-hoc comparisons were corrected using the
Bonferroni procedure.
Results
Description of coherence function
Figure 1 illustrates the grand average of coherence func-
tion in the 1–15 Hz frequency range for F3-T7 and F4-T8
electrode pairs. The red line represents the grand average
of coherence values for target response; the green line
represents the grand average of coherence values for non-
target response; the black line represents the grand average
of coherence values upon simple auditory stimulation. As
seen from Fig. 1 the grand average of coherence values for
target responses were higher than the non-target and simple
auditory stimulation responses in all frequency bands (2, 5,
8 Hz) and for both electrode pairs (F3-T7, F4-T8). This
difference is especially apparent for the left hemisphere
(F3-T7). However, in non-target responses alpha coherence
is the highest for F3-T7 and also for F4-T8. The grand
average of coherence values for target response reached
0.57 for F3-T7 theta response and reached 0.60 for F4-T8
delta response. However, the grand average of coherence
values for non-target and simple auditory stimulation
responses are between 0.35 and 0.45 for the left
110 Cogn Neurodyn (2010) 4:107–118
123

hemisphere (F3-T7) and between 0.40 and 0.50 for the right
hemisphere (F4-T8).
Figure 2 illustrates the grand averages of coherences
values for target, non-target and simple auditory stimula-
tion responses for left hemisphere electrode pairs (left
hemisphere: F3-T7, F3-P3, F3-O1) in the 1–15 Hz frequency
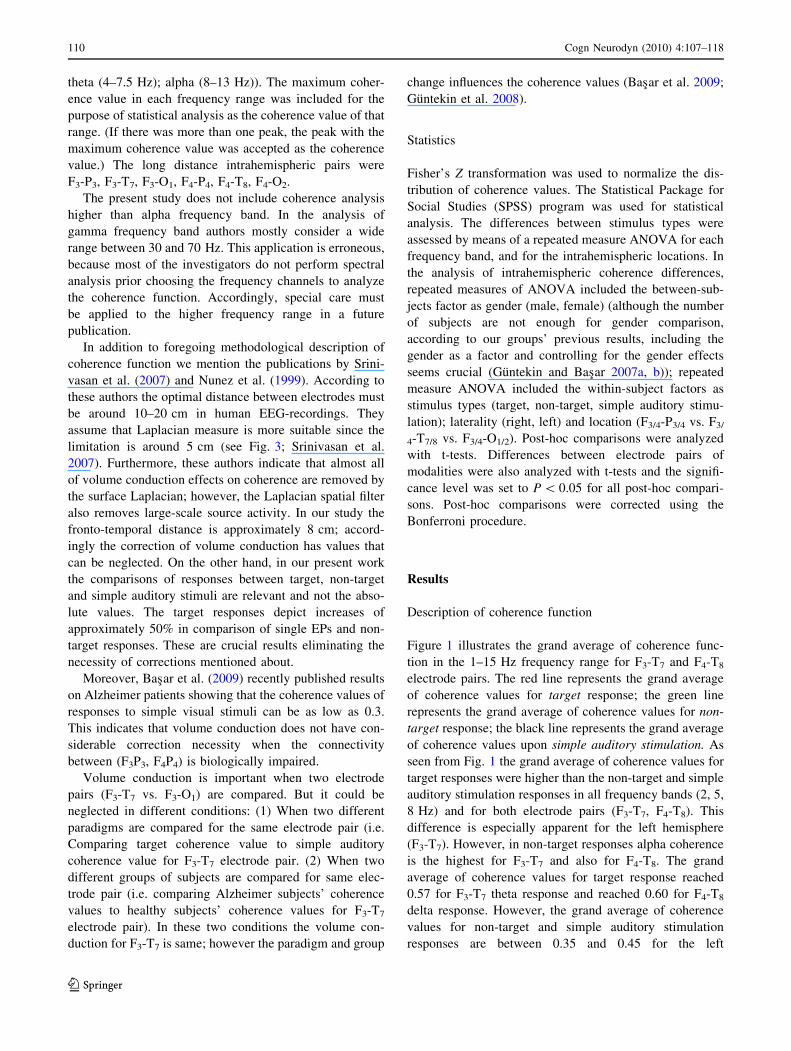
range. Figure 3 illustrates the grand averages of coherences
values for target, non-target and simple auditory stimulation
responses for right hemisphere electrode pairs (right
hemisphere: F4-T8, F4-P4, F4-O2) in the 1–15 Hz frequency
range. Blue lines represent the grand average of coherence
values for fronto-temporal electrode pairs; orange lines
represent the grand average of coherence values for fronto-
parietal electrode pairs; pink lines represent the grand
average of coherence values for fronto-occipital electrode
pairs. The grand averages of coherence values upon target
stimulation are illustrated in the upper part of the diagrams;
the grand averages of coherence values upon non-target
stimulation are illustrated in the middle part of the dia-
grams; the grand averages of coherence values upon simple
auditory stimulation are illustrated in the lower part of
the diagrams. As seen in Figs. 2 and 3, fronto-temporal
coherences were higher than the fronto-parietal and fronto-
occipital coherence values for all modalities (target, non-tar-
get, simple auditory stimulation). Furthermore, the fronto-
parietal coherence values are higher than fronto-occipital
coherence values for all modalities (target, non-target, simple
auditory stimulation). The peaks of delta, theta and alpha
frequency ranges of grand averages of coherence values for
target responses can easily be detected, and they are over 0.55
for fronto-temporal electrode pairs (F3-T7, F4-T8) (Figs. 2 and
3). However, the grand averages of coherence values for non-
target and simple auditory stimulation responses do not exceed
Fig. 1 Grand averages of coherences for target, non-target and simple
auditory stimulation responses of F3-T7 and F4-T8 electrode sites
Fig. 2 Grand averages of coherences for target, non-target and
simple auditory stimulation responses for left hemisphere electrode
pairs (left hemisphere: F3-T7, F3-P3, F3-O1) right hemisphere: F4-T8,
F4-P4, F4-O2)
Cogn Neurodyn (2010) 4:107–118 111
123
0.50 at any location and they are particularly low at the left
hemisphere (Fig. 3).
The descriptions of grand averages presented in section
‘‘Description of coherence function’’ are in accordance
with the statistical findings described below.
Statistical evaluation and results of coherence function
Delta (1–3.5 Hz) frequency range
In the analysis of intrahemispheric coherence differences,
the ANOVA of the delta coherence revealed a significant
effect between stimulus types (F(2,30) = 9.9; P \ 0.002).
Post-hoc comparisons showed that target delta coherences
were significantly higher than the non-target and simple
auditory stimulation delta coherences (P \ 0.0001;
P \ 0.0001). The ANOVA of delta coherence revealed
a significant effect for location (F(2,30) = 64.2; P \0.0001). Post-hoc comparisons showed that fronto-temporal
delta coherences were significantly higher than the fronto-
parietal and fronto-occipital delta coherences (P \ 0.0001;
P \ 0.0001). Furthermore, the fronto-parietal delta coher-
ences were significantly higher than the fronto-occipital
delta coherences (P \ 0.0001). These results indicate
higher connectivity in a cognitive network rather than a
sensory network (fronto-parietal hippocampal system ver-
sus sensory pathway). This point will be explained in the
subsequent Discussion section (see section ‘‘The signifi-
cance of fronto-parietal-hippocampal system in comparison
to sensory pathways’’). The differences between electrode
pairs between target-non-target, target-simple auditory
stimulation and non-target-simple auditory stimulation were
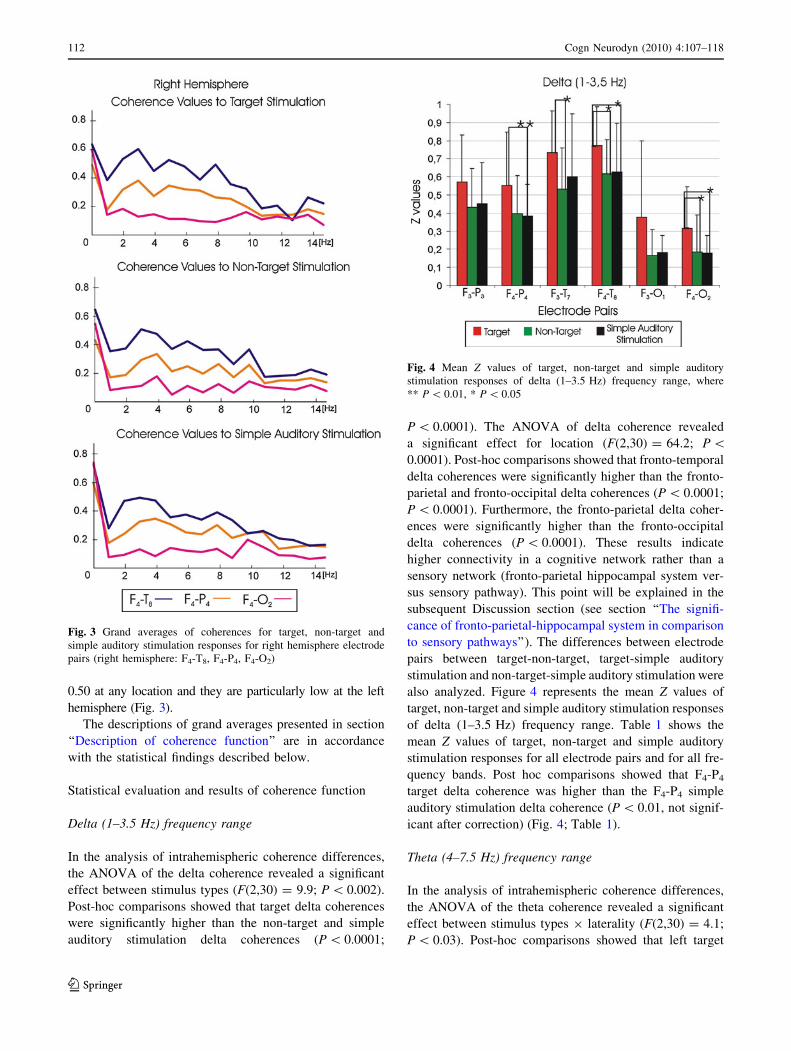
also analyzed. Figure 4 represents the mean Z values of
target, non-target and simple auditory stimulation responses
of delta (1–3.5 Hz) frequency range. Table 1 shows the
mean Z values of target, non-target and simple auditory
stimulation responses for all electrode pairs and for all fre-
quency bands. Post hoc comparisons showed that F4-P4
target delta coherence was higher than the F4-P4 simple
auditory stimulation delta coherence (P \ 0.01, not signif-
icant after correction) (Fig. 4; Table 1).
Theta (4–7.5 Hz) frequency range
In the analysis of intrahemispheric coherence differences,
the ANOVA of the theta coherence revealed a significant
effect between stimulus types 9 laterality (F(2,30) = 4.1;
P \ 0.03). Post-hoc comparisons showed that left target
Fig. 3 Grand averages of coherences for target, non-target and
simple auditory stimulation responses for right hemisphere electrode
pairs (right hemisphere: F4-T8, F4-P4, F4-O2)
Fig. 4 Mean Z values of target, non-target and simple auditory
stimulation responses of delta (1–3.5 Hz) frequency range, where
** P \ 0.01, * P \ 0.05
112 Cogn Neurodyn (2010) 4:107–118
123
theta coherences were significantly higher than the left
non-target theta coherences (P \ 0.005). The ANOVA
of theta coherence revealed a significant effect for loca-
tion (F(2,30) = 64.2; P \ 0.0001). Post-hoc comparisons
showed that fronto-temporal theta coherences were sig-
nificantly higher than the fronto-parietal and fronto-
occipital theta coherences (P \ 0.0001; P \ 0.0001).
Furthermore, the fronto-parietal theta coherences were
significantly higher than the fronto-occipital theta coher-
ences (P \ 0.0001). The differences between electrode
pairs between target-non-target, target-simple auditory
stimulation and non-target-simple auditory stimulation
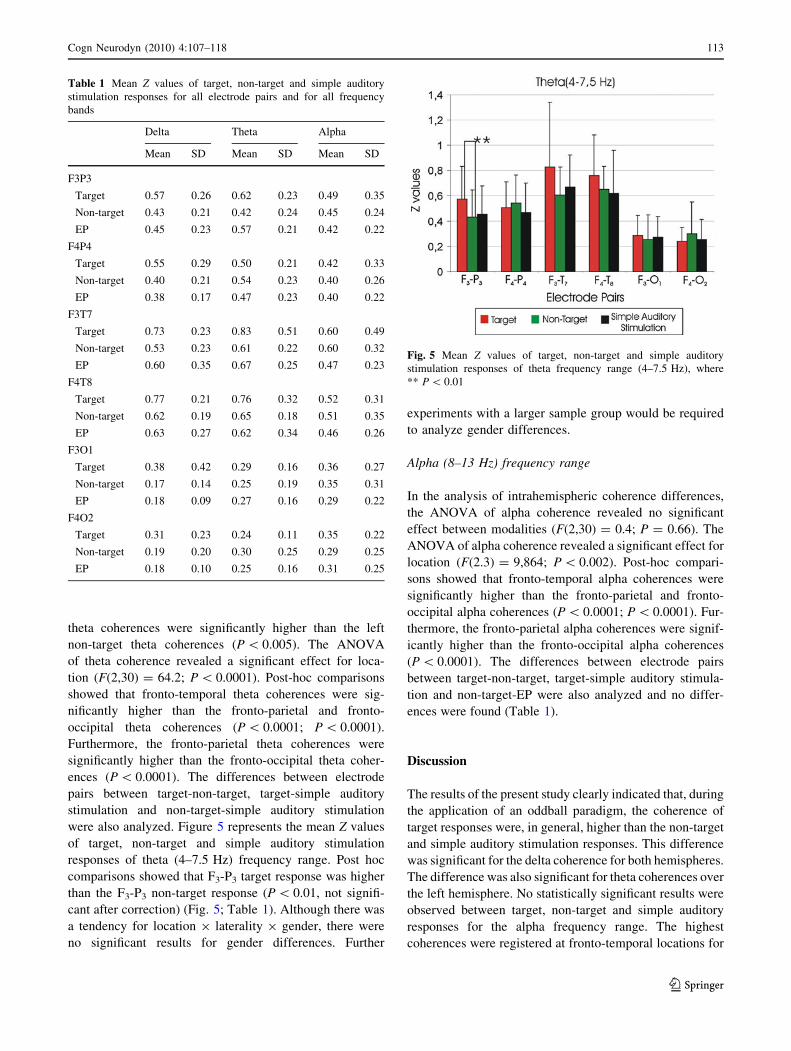
were also analyzed. Figure 5 represents the mean Z values
of target, non-target and simple auditory stimulation
responses of theta (4–7.5 Hz) frequency range. Post hoc
comparisons showed that F3-P3 target response was higher
than the F3-P3 non-target response (P \ 0.01, not signifi-
cant after correction) (Fig. 5; Table 1). Although there was
a tendency for location 9 laterality 9 gender, there were
no significant results for gender differences. Further
experiments with a larger sample group would be required
to analyze gender differences.
Alpha (8–13 Hz) frequency range
In the analysis of intrahemispheric coherence differences,
the ANOVA of alpha coherence revealed no significant
effect between modalities (F(2,30) = 0.4; P = 0.66). The
ANOVA of alpha coherence revealed a significant effect for
location (F(2.3) = 9,864; P \ 0.002). Post-hoc compari-
sons showed that fronto-temporal alpha coherences were
significantly higher than the fronto-parietal and fronto-
occipital alpha coherences (P \ 0.0001; P \ 0.0001). Fur-
thermore, the fronto-parietal alpha coherences were signif-
icantly higher than the fronto-occipital alpha coherences
(P \ 0.0001). The differences between electrode pairs
between target-non-target, target-simple auditory stimula-
tion and non-target-EP were also analyzed and no differ-
ences were found (Table 1).
Discussion
The results of the present study clearly indicated that, during
the application of an oddball paradigm, the coherence of
target responses were, in general, higher than the non-target
and simple auditory stimulation responses. This difference
was significant for the delta coherence for both hemispheres.
The difference was also significant for theta coherences over
the left hemisphere. No statistically significant results were
observed between target, non-target and simple auditory
responses for the alpha frequency range. The highest
coherences were registered at fronto-temporal locations for
Table 1 Mean Z values of target, non-target and simple auditory
stimulation responses for all electrode pairs and for all frequency
bands
Delta Theta Alpha
Mean SD Mean SD Mean SD
F3P3
Target 0.57 0.26 0.62 0.23 0.49 0.35
Non-target 0.43 0.21 0.42 0.24 0.45 0.24
EP 0.45 0.23 0.57 0.21 0.42 0.22
F4P4
Target 0.55 0.29 0.50 0.21 0.42 0.33
Non-target 0.40 0.21 0.54 0.23 0.40 0.26
EP 0.38 0.17 0.47 0.23 0.40 0.22
F3T7
Target 0.73 0.23 0.83 0.51 0.60 0.49
Non-target 0.53 0.23 0.61 0.22 0.60 0.32
EP 0.60 0.35 0.67 0.25 0.47 0.23
F4T8
Target 0.77 0.21 0.76 0.32 0.52 0.31
Non-target 0.62 0.19 0.65 0.18 0.51 0.35
EP 0.63 0.27 0.62 0.34 0.46 0.26
F3O1
Target 0.38 0.42 0.29 0.16 0.36 0.27
Non-target 0.17 0.14 0.25 0.19 0.35 0.31
EP 0.18 0.09 0.27 0.16 0.29 0.22
F4O2
Target 0.31 0.23 0.24 0.11 0.35 0.22
Non-target 0.19 0.20 0.30 0.25 0.29 0.25
EP 0.18 0.10 0.25 0.16 0.31 0.25
Fig. 5 Mean Z values of target, non-target and simple auditory
stimulation responses of theta frequency range (4–7.5 Hz), where
** P \ 0.01
Cogn Neurodyn (2010) 4:107–118 113
123
all frequency bands (delta, theta, alpha). Furthermore,
fronto-parietal coherences were higher than fronto-occipital
coherences for all frequency bands (delta, theta, alpha).
Fundamental analysis of the coherence function
According to Basar (2006), the coherence—i.e. the connec-
tivity between brain structures—is selective, depending on
cognitive load. This is manifested in the selective distribution
of the coherence functions over various brain structures with
varied degrees of coherence between 0 and 1. Demonstration
of the principle of selective connectivity requires the analysis
of oscillations in several neural populations and in several
frequency windows. Such analyses and the related findings
have been fundamental results for refinement of the concepts
of ‘‘whole brain’’ and ‘‘cooperation’’.
Many studies reported the successful use of EEG
coherence to measure functional connectivity (Bendat and
Piersol 1967; Lopes Da Silva et al. 1980; Petsche and Et-
linger 1998; Rappelsberger et al. 1982). According to these
studies, EEG coherence may be considered to be an
indispensable large-scale measure of functional relation-
ships between pairs of cortical regions (Nunez 1997).
It is also important to mention the studies of Bullock’s
research group: Bullock et al. (1995) clearly showed that
the connectivity (coherence) between neural groups is a
main factor for the evolution of cognitive processes.
According to Bullock and Basar (1988) and Bullock
et al. (1995), no significant coherences were found in the
neural networks of invertebrates, in contrast to the higher
coherences between distant structures that were recorded in
mammalian and human brains. The highest coherences
were found in the subdural structures of the human brain
(Bullock 2006).
Since coherence is, in essence, a correlation coefficient
per frequency band, it is used to describe the coupling or
relationship between signals for a certain frequency band.
According to Bullock et al. (2003), increased coherence
between two structures, namely A and B, can be caused by
the following processes: (1) Structures A and B are driven
by the same generator; (2) Structures A and B can mutually
drive each other; (3) One of the structures, A or B, drives
the other.
The implications following the analysis of coherence
function by several authors can be summarized as follows:
(1) In simple binding, there is temporal coherence
between cells in cortical columns. This has been
demonstrated by several authors (Eckhorn et al. 1988;
Gray and Singer 1989).
(2) The response susceptibility of the brain activates
resonant communications in the brain by facilitating
electrical processing between networks (Basar 2004;
Basar et al. 1997a, b). This could be also interpreted
as a general tuning process between neural popula-
tions and feature detectors (Sokolov 2001).
(3) Parallel processing in the brain shows selectivity. The
selectivity in parallel processing is produced by
variations in the degree of spatial coherences that
occur over long distances between brain structures/
neural assemblies (Basar 1980, 1983a, b; Basar et al.
1999a, b; Kocsis et al. 2001; Miltner et al. 1999;
Schurmann et al. 2000).
Fries (2005) hypothesized that neural communication is
mechanistically subserved by neural coherence. Activated
neural groups oscillate and thereby undergo rhythmic
excitability fluctuations that produce temporal windows for
communication. Only coherently activated neural groups
can interact effectively.
This hypothesis is in agreement with the general
hypothesis on ‘‘excitability of neural structures’’, ‘‘overall
coherency increase’’ and ‘‘complex matching’’ (Basar 2004).
In the P300 responses, the excitability is in delta and theta
frequency channels and, accordingly, the communication in
the brain occurs mostly in those frequency channels. Delta
and theta frequency channels show selective coherences
upon increased cognitive load (see Basar 2004).
The principle of superposition describes integration over
the temporal axis consisting of a relationship between the
amplitude and phases of oscillations in various frequency
bands. Furthermore, selectively distributed and selectively
coherent oscillatory activities in neural populations describe
integration over the spatial axis (Basar 1980). Consequently,
integrative activity is a function of the coherences among
spatial locations of the brain; these coherences vary
according to the type of sensory and/or cognitive event and
possibly the state of consciousness of the species (Basar
1998, 1999, 2004). The publications of Bressler and Kelso
(2001), Varela et al. (2001) and Von Stein and Sarnthein
(2000) clearly describe this trend, in which the concerted
activity of alpha, theta, and delta and beta oscillations in dis-
tributed structures as reticular formation (RF), hippocampus
(HI), thalamus and sensory cortices was emphasized.
Fundamental findings in studies of oddball paradigms
As Polich indicates in his review (2007), several authors
indicated the role of circuits between frontal, parietal,
temporal areas for the generation of P300 amplitude.
Moreover, P300 amplitude is affected by temporal–parietal
junction integrity, as its absence greatly reduces component
size over the parietal area (Knight et al. 1989; Verleger
et al. 1994; Yamaguchi and Knight 1992) and P3a and P3b
indicate a circuit pathway between frontal and temporal/
parietal brain areas (Knight 1990; Polich 2003; Soltani and
114 Cogn Neurodyn (2010) 4:107–118
123
Knight 2000). These authors performed their studies on
subjects who had temporal and/or parietal cortical lesions.
The findings of the present study support the mentioned
role of ‘‘frontal’’, ‘‘parietal’’ and ‘‘temporal’’ areas and also
the importance of ‘‘connectivity’’ between these areas in
the generation of P300 by applying coherence analysis. It
should also be mentioned that the paradigm used in the
present study was an auditory paradigm. It is likely that
analysis of coherence function upon application of a visual
oddball paradigm would depict higher fronto-occipital and
fronto-parietal coherences in comparison to the present
study.
The significance of fronto-parietal-hippocampal system
in comparison to sensory pathways
Why are the fronto-parietal delta, theta and alpha response
coherences higher in comparison to fronto-occipital
coherence? It is well known that cognitive-associative
mechanisms are processed in the fronto-parietal and hip-
pocampal system. In contrast, sensory signals are primarily
processed in sensory pathways. The paradigm used in the
present study involves the cognitive networks and auditory
networks; (Basar et al. 2001; Basar-Eroglu et al. 1992,
2001; Polich 2007). Accordingly, it is to be expected that
the fronto-occipital coherence will be weaker than the
fronto-parietal coherence. It is also to mention that the
distance between pairs of electrodes may play a small
deviation of results. Moreover, in the delta frequency range
the target coherence is approximately 40% higher than
non-target and sensory evoked response coherences (see
Fig. 1). Furthermore, the evoked coherences by means of
simple auditory stimuli are not highly different from non-
target responses.
According to all these results, it can be stated that
coherence values are highly increased during cognitive
processes in comparison to responses elicited by a simply
auditory stimuli. It should also be emphasized that fronto-
temporal (F3-T7, F4-T8) coherences are also significantly
high, thus indicating that fronto-temporal links are aug-
mented during cognitive processes.
In the alpha frequency range, fronto-parietal and fronto-
temporal alpha coherences are also significantly higher
than fronto-occipital alpha coherences. The results in all
frequency ranges can be interpreted such that the cognitive
processes depict more connectivity in fronto-parietal
pathways than fronto-occipital connectivity.
Comparison with clinical studies
In our previous study, during a visual oddball paradigm the
delta, theta and alpha coherences in the left fronto-parietal
electrode pair (F3-P3) of Alzheimer’s disease (AD) patients
was significantly decreased, thus indicating reduced con-
nectivity between frontal and parietal sites (Guntekin et al.
2008). Hogan et al. (2003) also reported reduced coherence
for AD patients when compared with normal controls dur-
ing a working memory paradigm. According to Hogan et al.
(2003) the AD patients had reduced upper alpha coherence
between the central and right temporal cortex. Winterer
et al. (2003) investigated schizophrenia patients and their
clinically unaffected siblings with an auditory oddball
paradigm and reported that schizophrenic patients and their
siblings showed a reduction of fronto-temporal coherence.
Ford et al. (2002) also reported reduced fronto-temporal
coherence for schizophrenia patients when talking.
In the present study, left hemisphere theta response was
higher for the target response when compared with non-
target response. Our earlier reports analyzing the oscilla-
tory dynamics of AD patients emphasized the left laterality
of abnormal phase locking of theta (Yener et al. 2007);
amplitude reduction in delta oscillatory activity over the
left frontocentral (Yener et al. 2008) and also lower values
of evoked coherence in ‘‘delta’’, ‘‘theta’’ and ‘‘alpha’’
bands in the left fronto-parietal electrode pairs in the
untreated AD group when compared to healthy subjects
upon appliance of a visual oddball paradigm (Guntekin
et al. 2008). Schack et al. (1999) reported higher left
hemisphere beta coherence within the left frontal and left
parietal areas for an incongruent situation compared to a
congruent situation upon appliance of the Stroop task.
According to these results, the dominance of the left
hemisphere during a cognitive task seems to be crucial.
No differences between coherence values of target, non-
target and simple auditory stimulation responses were
found for the alpha coherence. In contrast, our previous
study comparing the coherence values of elderly healthy
subjects and Alzheimer patients showed that the alpha
coherence of elderly healthy subjects was higher than the
alpha coherence of non-treated Alzheimer patients at F3-P3
electrode pairs. The treated AD patients had also higher
alpha coherence than the non-treated AD patients at F3-P3
electrode pairs. The subjects of the present study were
healthy young adults, which could affect the coherence
values between frontal electrode and other brain structures,
compared with other clinical or demographic groups.
Yordanova et al. (1996) showed that elderly subjects had
higher frontal alpha response then young adults. Future
research in this field could examine the target, non-target
and simple auditory stimulation coherence results of
elderly healthy subjects in order to establish the role of
alpha long distance networks upon application of an odd-
ball paradigm. Frontal alpha increases with age, so it is
possible that the coherence between frontal and other areas
could also increase.
Cogn Neurodyn (2010) 4:107–118 115
123
Concluding remarks
1. It was shown that the connectivity between distant
brain structures upon application of an auditory odd-
ball paradigm was mainly controlled by both hemi-
spheric delta and left hemispheric theta oscillations.
2. The results from healthy subjects upon application of
cognitive paradigms may be very important to under-
stand brains of those with cognitive impairments. The
results of the present report may provide a basis for
coherence analysis and, in parallel, for oddball para-
digm analysis.
3. The increase of response coherences and their func-
tional significance, and the difference between the
right and left hemisphere were not discussed in this
study. The presented results are only discussed glob-
ally, in order to show important differences among
target, non-target and simple auditory stimuli. Dis-
tances between electrodes higher than 6 cm are enough
to eliminate the errors due to volume conduction
according to the empirical criteria of Srinivasan et al.
(2007).
4. The most important conclusion of the present study is
the following: According to Luria (1966) there are no
anatomical centers for the psychological functions of
the mind. Mental functions, too, are the products of
complex systems, the component parts of which may
be distributed throughout the structures of the brain.
The task of neuroscience is therefore not to localize the
‘‘centers’’, but, rather, to identify the components of
the various complex systems that interact to generate
the mental functions. Luria called this task ‘‘dynamic
localization’’.
5. Mental functions, in short, are not localized in any of
the component structures, but rather between them.
Like the mental apparatus as a whole, they are virtual
entities (Solms and Turnbull 2002).
6. According to the present results the understanding of
whole brain function also requires the analysis of
functional coherences, i.e. the increased connectivity
between structures upon cognitive load, together with
enhanced temporal oscillatory responses. Furthermore,
in addition to Luria’s view, it seems that Brodmann’s
(1909) areas should be extended to a more dynamic
presentation, in which, sensory and cognitive areas
should be described as superposition of multiple
primary and secondary functions.
7. As a consequence of the above concluding remarks
(1–6), and especially the views of Luria and the
concept of dynamically linked Brodmann’s areas, we
propose that all sensory-cognitive paradigms (as is
here the case in P300-oddball) must be jointly
analyzed in terms of oscillatory responses and related
coherences. Only in this way, it is possible to open new
avenues for description of whole cortex organization.
Acknowledgments Authors are thankful to Elif Tulay and Bilge
Turp for technical assistance and for their help in data processing.
References
Adey WR (1989) Cell membranes, electromagnetic fields and
intercellular communication. In: Basar E, Bullock TH (eds)
Brain dynamics: progress and perspectives. Springer, Berlin, pp
26–42
Adey WR, Dunlop CW, Hendrix CE (1960) Hippocampal slow
waves: distribution and phase relationships in the course of
approach learning. Arch Neurol 3:74–90
Anokhin AP, van Baal GCM, van Beijsterveldt CEM (2001) Genetic
correlation between the P300 event-related brain potential and
the EEG power spectrum. Behav Genet 31(6):545–554
Basar E (1976) Biophysical and physiological systems analysis.
Addison-Wesley, Reading
Basar E (1980) EEG-Brain dynamics. Relation between EEG and
brain evoked potentials. Elsevier, Amsterdam
Basar E (1983a) Toward a physical approach to integrative physi-
ology I. Brain dynamics and physical causality. Am J Physiol
14:510–533
Basar E (1983b) Synergetics of neuronal populations: a survey of
experiments. In: Basar E, Flohr H, Haken H, Mandell A (eds)
Synergetics of the brain. Springer, Berlin
Basar E (1998) Brain functions and oscillations: I. Brain oscillations
principles and approaches. Springer, Berlin
Basar E (1999) Brain function and oscillations: II. _Integrative brain
function. Neurophysiology and cognitive processes. Springer,
Heidelberg
Basar E (2004) Memory and brain dynamics: oscillations integrating
attention, perception, learning and memory. CRC Press, Florida
Basar E (2006) The theory of the whole-brain-work. Int J Psycho-
physiol 60:133–138
Basar E, Guntekin B (2008) A review of brain oscillations in
cognitive disorders and the role of neurotransmitters. Brain Res
15:172–193
Basar E, Guntekin B (2009) Darwin’s evolution theory, brain
oscillations, and complex brain function in a new ‘‘Cartesian
view’’. Int J Psychophysiol 71:2–8
Basar E, Stampfer HG (1985) Important associations among EEG-
dynamics, event-relate potentials, short-term-memory, and learn-
ing. Int J Neurosci 26:161–180
Basar-Eroglu C, Basar E (1991) A compound P300–40 Hz response
of the cat hippocampus. Int J Neurosci 60(3–4):227–237
Basar E, Gonder A, Ozesmi C, Ungan P (1975a) Dynamics of brain
rhythmic and evoked potentials. I. Some computational methods
for the analysis of electrical signals from the brain. Biol Cybern
20:137–143
Basar E, Gonder A, Ozesmi C, Ungan P (1975b) Dynamics of brain
rhythmic and evoked potentials. II. Studies in the auditory
pathway, reticular formation, and hippocampus during the
waking stage. Biol Cybern 20:145–160
Basar E, Gonder A, Ozesmi C, Ungan P (1975c) Dynamics of brain
rhythmic and evoked potentials. III. Studies in the auditory
pathway, reticular formation, and hippocampus during sleep.
Biol Cybern 20:161–169
Basar E, Demir N, Gonder A, Ungan P (1979) Combined dynamics of
EEG and evoked potentials. I. Studies of simultaneously
recorded EEG-EPograms in the auditory pathway, reticular
116 Cogn Neurodyn (2010) 4:107–118
123
formation, and hippocampus of the cat brain during the waking
stage. Biol Cybern 34(1):1–19
Basar E, Gonder A, Ungan P (1980) Comparative frequency-analysis
of single EEG-evoked potential records. J Biomed Eng 2:9–14
Basar E, Basar-Eroglu C, Rosen B, Schutt A (1984) A new approach
to endogenous event-related potentials in man: relation between
EEG and P300-wave. Int J Neurosci 24:1–21
Basar E, Hari R, Lopes da Silva FH, Schurmann M (eds) (1997a)
Brain alpha activity—new aspects and functional correlates. Int J
Psychophysiol 26:1–482
Basar E, Schurmann M, Basar-Eroglu C, Karakas S (1997b) Alpha
oscillations in brain functioning: an integrative theory. In: Basar
E, Hari R, Lopes da Silva FH, Schurmann M (eds) Brain alpha
activity—new aspects and functional correlates, Int J Psycho-
physiol 26:5–29
Basar E, Basar-Eroglu C, Karakas S, Schurmann M (1999a) Are
cognitive processes manifested in event-related gamma, alpha,
theta and delta oscillations in the EEG? Neurosci Lett 15:165–168
Basar E, Basar-Eroglu C, Karakas S, Schurmann M (1999b)
Oscillatory brain theory: a new trend in neuroscience. IEEE
Eng Med Biol 18:56–66
Basar E, Guntekin B, Yener G (2009) Evoked coherence in
Alzheimer patients upon application of basic visual paradigm.
Biol Psychiatry 65(8):53S–53S
Basar E, Basar-Eroglu C, Karakas S, Schurmann M (2001) Gamma,
alpha, delta, and theta oscillations govern cognitive processes.
Int J Psychophysiol 39:241–248
Basar-Eroglu C, Basar E, Demiralp T, Schurmann M (1992) P300-
response: possible psychophysiological correlates in delta and
theta frequency channels: a review. Int J Psychophysiol 13:161–
179
Basar-Eroglu C, Demiralp T, Schurmann M, Basar E (2001)
Topological distribution of oddball ‘P300’ responses. Int J
Psychophysiol 39:213–220
Bendat JS, Piersol AG (1967) Measurement and analysis of random
data. Wiley, New York
Bernat EM, Malone SM, Williams WJ, Patrick CJ, Iacono WG (2007)
Decomposing delta, theta, and alpha time-frequency ERP
activity from a visual oddball task using PCA. Int J Psycho-
physiol 64(1):62–74
Bressler SL, Kelso JA (2001) Cortical coordination dynamics and
cognition. Trends Cogn Sci 1:26–36
Brodmann K (1909) Vergleichende lokalisationslehre der grosshirnr-
inde in ihren prinzipien dargestellt auf grund de zellenbaues. JA
Barth, Leipzig
Bullock TH (2006) How do brains evolve complexity? An essay. Int J
Psychophysiol 60:106–109
Bullock TH, Basar E (1988) Comparison of ongoing compound field
potentials in the brains of invertebrates and vertebrates. Brain
Res Rev 13:57–75
Bullock TH, McClune MC, Achimowicz JZ, Iragui-Madoz VJ,
Duckrow RB, Spencer SS (1995) EEG coherence has structure in
the millimeter domain: subdural and hippocampal recordings
from epileptic patients. Electroencephalogr Clin Neurophysiol
95:161–177
Bullock TH, Mcclune MC, Enright JT (2003) Are the electroenceph-
alograms mainly rhythmic? Assessment of periodicity in wide-
band time series. Neuroscience 121:233–252
Demiralp T, Ademoglu A (2001) Decomposition of event-related
brain potentials into multiple functional components using
wavelet transform. Clin Electroencephalogr 32:122–138
Demiralp T, Yordanova J, Kolev V, Ademoglu A, Devrim M, Samar
VJ (1999) Time–frequency analysis of single-sweep event-
related potentials by means of fast wavelet transform. Brain
Lang 66:129–145
Eckhorn R, Bauer R, Jordan R, Brosch W, Kruse M, Munk M,
Reitboeck HJ (1988) Coherent oscillations: a mechanism of
feature linking in the visual cortex? Biol Cybern 60:121–130
Fell J, Hinrichs H, Roschke J (1997) Time course of human 40 Hz
EEG activity accompanying P3 responses in an auditory oddball
paradigm. Neurosci Lett 235(3):121–124
Ford JM, Mathalon DH, Whitfield S, Faustman WO, Roth WT (2002)
Reduced communication between frontal and temporal lobes
during talking in schizophrenia. Biol Psychiatry 51:485–492
Fries P (2005) A mechanism for cognitive dynamics: neuronal
communication through neuronal coherence. Trends Cogn Sci
9:474–480
Frund I, Schadow J, Busch NA, Naue N, Korner U, Herrmann CS
(2008) Anticipation of natural stimuli modulates EEG dynamics:
physiology and simulation. Cogn Neurodyn 2(2):89–100 Epub
2008 May 7
Gray CM, Singer W (1989) Stimulus-specific neuronal oscillations in
orientation columns of cat visual cortex. Proc Natl Acad Sci
USA 86:1698–1702
Guntekin B, Basar E (2007a) Brain oscillations are highly influenced
by gender differences. Int J Psychophys 65:294–299
Guntekin B, Basar E (2007b) Gender differences influence brain’s
beta oscillatory responses in recognition of facial expressions.
Neurosci Lett 424(2):94–99
Guntekin B, Saatci E, Yener G (2008) Decrease of evoked delta, theta
and alpha coherences in Alzheimer patients during a visual
oddball paradigm. Brain Res 15:109–116
Gurtubay IG, Alegre M, Labarga A, Malanda A, Iriarte J, Artieda J
(2001) Gamma band activity in an auditory oddball paradigm
studied with the wavelet transform. Clin Neurophysiol
112(7):1219–1228
Gurtubay IG, Alegre M, Labarga A, Malanda A, Artieda J (2004)
Gamma band responses to target and non-target auditory stimuli
in humans. Neurosci Lett 367(1):6–9
Haig AR, De Pascalis V, Gordon E (1999) Peak gamma latency
correlated with reaction time in a conventional oddball para-
digm. Clin Neurophysiol 110(1):158–165
Hogan MJ, Swanwick GRJ, Kaiser J, Rowan M, Lawlor B (2003)
Memory-related EEG power and coherence reductions in mild
Alzheimer’s disease. Int J Psychophysiol 49:147–163
Ishii R, Canuet L, Herdman A, Gunji A, Iwase M, Takahashi H,
Nakahachi T, Hirata M, Robinson SE, Pantev C, Takeda M
(2009) Cortical oscillatory power changes during auditory
oddball task revealed by spatially filtered magnetoencephalog-
raphy. Clin Neurophysiol 120(3):497–504
Kang K, Williams LM, Hermens D, Gordon E (2005) Neurophysi-
ological markers of contextual processing: the relationship
between P3b and Gamma synchrony and their modulation by
arousal, performance and individual differences. Brain Res
25(2):472–483
Karakas S, Erzengin OU, Basar E (2000) A new strategy involving
multiple cognitive paradigms demonstrates that ERP compo-
nents are determined by the superposition of oscillatory
responses. Clin Neurophysiol 111:1719–1732
Kawamata M, Kirino E, Inoue R, Arai H (2007) Event-related
desynchronization of frontal-midline theta rhythm during pre-
conscious auditory oddball processing. Clin EEG Neurosci
38(4):193–202
Knight R (1990) Neural mechanisms of event-related potentials from
human lesion studies. In: Rohbraugh J, Parasuraman R, Johnson
R (eds) Event-related brain potentials: basic issues and applica-
tions. Oxford University Press, New York, pp 3–18
Knight RT, Scabini D, Woods D, Clayworth C (1989) Contributions
of temporal parietal junction to the human auditory P3. Brain
Res 502:109–116
Cogn Neurodyn (2010) 4:107–118 117
123
Kocsis B, Viana Di Prisco G, Vertes RP (2001) Theta synchronization
in the limbic system: The role of Gudden’s tegumental nuclei.
Eur J Neurosci 13:381–388
Kolev V, Demiralp T, Yordanova J, Ademoglu A, Isoglu-Alkac U
(1997) Time–frequency analysis reveals multiple functional
components during oddball P300. Neuroreport 8:2061–2065
Kukleta M, Brazdil M, Roman R, Bob P, Rektor I (2009) Cognitive
network interactions and beta 2 coherence in processing non-
target stimuli in visual oddball task. Physiol Res 58:139–148
Lopes da Silva FH, Vos JE, Mooibroek J, Van Rotterdam A (1980)
Relative contributions of intracortical and thalamo-cortical
processes in the generation of alpha rhythms, revealed by partial
coherence analysis. Electroencephalogr Clin Neurophysiol
50:449–456
Luria AR (1966) Higher cortical functions in man. Basic Books, New
York
Mazaheri A, Picton TW (2005) EEG spectral dynamics during
discrimination of auditory and visual targets. Brain Res Cogn
Brain Res 24(1):81–96
Miltner W, Braun C, Arnold M, Witte H, Taub E (1999) Coherence of
gamma-band EEG activity as a basis for associative learning.
Nature 397:434–436
Nunez PL (1997) EEG coherence measures in medical and cognitive
science: a general overview of experimental methods, computer
algorithms, and accuracy. In: Eselt M, Zwiener U, Witte H (eds)
Quantitative and topological EEG and MEG analysis. Univer-
sitatsverlag Druckhaus Mayer, Jena
Nunez PL, Silberstein RB, Shi Z, Carpenter MR, Srinivasan R,
Tucker DM, Doran SM, Cadusch PJ, Wijesinghe RS (1999) EEG
coherency II: experimental comparisons of multiple measures.
Clin Neurophysiol Mar 110(3):469–486
Oniz A, Basar E (2009) Prolongation of alpha oscillations in auditory
oddball paradigm. Int J Psychophysiol 71:235–241
Petsche H, Etlinger SC (1998) EEG and thinking: power and
coherence analysis of cognitive processes. Verlag Der Osterrei-
chischen Akademie Der Wissenscaften, Wien
Polich J (2003) Overview of P3a and P3b. In: Polich J (ed) Detection
of change: event-related potential and fMRI findings. Kluwer,
Boston, pp 83–98
Polich J (2007) Updating P300: an integrative theory of P3a and P3b.
Clin Neurophysiol 118:2128–2148
Rappelsberger P, Pockberger H, Petsche H (1982) The contribution of
the cortical layers to the generation of the EEG: field potential
and current source density analyses in the rabbit’s visual cortex.
Electroencephalogr Clin Neurophysiol 53:254–269
Sauseng P, Klimesch W, Schabus M, Doppelmayr M (2005) Fronto-
parietal EEG coherence in theta and upper alpha reflect central
executive functions of working memory. Int J Psychophysiol
57:97–103
Schack B, Chen AC, Mescha S, Witte H (1999) Instantaneous EEG
coherence analysis during the Stroop task. Clin Neurophysiol
110:1410–1426
Schurmann M, Demiralp T, Basar E, Basar-Eroglu C (2000)
Electroencephalogram alpha (8–15 Hz), responses to visual
stimuli in cat cortex, thalamus, and hippocampus: a distributed
alpha network? Neurosci Lett 292:175–178
Schurmann M, Basar-Eroglu C, Kolev V, Basar E (2001) Delta
responses and cognitive processing: single-trial evaluations of
human visual P300. Int J Psychophysiol 39:229–239
Sokolov EN (2001) Toward new theories of brain function and brain
dynamics. Int J Psychophysiol 39:87–89
Solms M, Turnbull O (2002) Emotion and motivation. In: Solms M,
Turnbull O (eds) The brain and the inner world. Other Press,
New York, pp 105–137
Soltani M, Knight RT (2000) Neural origins of the P300. Crit Rev
Neurobiol 14:199–224
Spencer KM, Polich J (1999) Poststimulus EEG spectral analysis and
P300: attention, task, and probability. Psychophysiology 36:220–232
Srinivasan R, Winter WR, Ding J, Nunez PL (2007) EEG and MEG
coherence: measures of functional connectivity at distinct spatial
scales of neocortical dynamics. J Neurosci Methods 166:41–52
Stampfer H, Basar E (1985) Does frequency-analysis lead to better
understanding of endogenous evoked-potentials. Int J Neurosci
29:189
Tomberg C, Desmedt JE (1998) Human perceptual processing:
inhibition of transient prefrontal-parietal 40 Hz binding at P300
onset documented in non-averaged cognitive brain potentials.
Neurosci Lett 255(3):163–166
Varela F, Lachaux JP, Rodriguez E, Martinerie J (2001) The
brainweb: phase syncronization and large-scale integration. Nat
Rev Neurosci 2:229–232
Verleger R, Heide W, Butt C, Kompf D (1994) Reduction of P3b in
patients with temporo-parietal lesions. Cogn Brain Res 2:103–
116
von Stein A, Sarnthein J (2000) Different frequencies for different
scales of cortical integration: from local gamma to long distance
alpha-theta synchronization. Int J Psychophysiol 38:301–313
Winterer G, Coppola R, Egan MF, Goldberg TE, Weinberger DR
(2003) Functional and effective frontotemporal connectivity and
genetic risk for schizophrenia. Biol Psychiatry 54:1181–1192
Yordanova J, Kolev V, Basar E (1996) Evoked brain rhythms are
altered markedly in middle-aged subjects: single-sweep analysis.
Int J Neurosci 85:155–163
Yamaguchi S, Knight RT (1992) Effects of temporal-parietal lesions
on the somatosensory P3 to lower limb stimulation. Electroen-
cephalogr Clin Neurophysiol 84:139–148
Yener GG, Guntekin B, Oniz A, Basar E (2007) Increased frontal
phase-locking of event-related theta oscillations in Alzheimer
patients treated with cholinesterase inhibitors. Int J Psychophys-
iol 64:46–52
Yener G, Guntekin B, Basar E (2008) Event related delta oscillatory
responses of Alzheimer patients. Eur J Neurol 15:540–547
Yordanova J, Kolev V (1998) A single-sweep analysis of the theta
frequency band during an auditory oddball task. Psychophysi-
ology 35:116–126
Yordanova J, Devrim M, Kolev V, Ademoglu A, Demiralp T (2000)
Multiple time-frequency components account for the complex
functional reactivity of P300. Neuroreport 11:1097–1103
118 Cogn Neurodyn (2010) 4:107–118
123