Electroencephalographic changes after one nigth of sleep deprivation
Upload
independentCategory
view
0download
0
INTERNATIONAL JOURNAL OF PSYCHOPHYSIOLOGY
ELSEVIER International Journal of Psychophysiology 19 (1995) 23-32
Electroencephalographic coherences discriminate between children with different pedagogical evaluation
Erzsebet Marosi * , Thalia Harmony, Jacqueline Becker, Alfonso Reyes, Jorge Bernal, Thalia FernBndez, Mario Rodriguez, Juan Silva, Vicente Guerrero
National University of Mexico, Enep Iztacala, Neurosciences, Estado de Mexico, Mexico
Received 8 March 1994; revised 30 August 1994; accepted 12 September 1994
Abstract
The relationship of reading-writing ability and EEG coherences was studied in 84 subjects from two age groups 7.0-8.9 and 9-11.2 years old. All children were divided into three groups according to their performance on a pedagogical test: pedl, normal children; ped2, children with mild problems; ped3, children with reading-writing disability. The following results were obtained: in general, children showed higher coherences in groups with poor performance in the delta, theta and beta bands. In the alpha band, higher coherence values were related to better performance. The exceptions to this general pattern were rare. Group ped2 had higher coherences in delta, theta and alpha bands than pedl and ped3, in left temporal leads. In older children the same tendency was observed, but group differences in the theta, alpha and beta bands were few. In this age range, the significant group differences were almost all interhemispheric coherences. The discriminant analysis that classified subjects by their coherence values gave very good results, fact that demonstrates, that EEG coherence is a highly sensitive measurement indicating not only the existence of a reading-writing problem, but also the degree of its severity.
Keywords: EEG coherences; Pedagogical evaluation; Reading-writing disability; EEG frequency analysis; Discrimi- nant analysis
1. Introduction
Theoretical considerations on the etiological factors which determine learning disability are multiple and not clearly defined. Electrophysio- logical studies may help to find out which cere- bral substrates are involved in learning disability. Coherence is a measure of the covariation of the
* Corresponding author. At: Apartado Postal 82, Atizapgn de Zaragoza, Estado de Mikico, C.P. 52971, Mexico.
spectra of two EEG signals. High coherence be- tween EEG signals has been interpreted as evi- dence of a structural or functional connection between cortical areas underlying the recording electrode (Fein et al. 1988). Thatcher et al. (1986) proposed that gross EEG cortical phenomena were produced by long range cortical fibers and showed that coherence reflected cortical differen- tiation, since coherence values were not the same for equal distances between cortical areas antero- posterior or posteroanterior directions.
On the other hand, developmental changes in the brain are mainly determined by myelination,
0167-8760/95/$09.50 0 1995 Elsevier Science B.V. All rights reserved SSDI 0167-8760(94)00059-X
24 E. Marosi et al. /International Journal of Psychophysiology 19 (1995) 23-32
which produces more efficient interconnections with Down’s syndrome. During an eyes closed between different cerebral regions and conse- condition the inter-hemispheric coherence in- quently, higher coherence values. Cortical myelo- creased in, all bands. As age effect was not con- genesis has a differential timetable and is not trolled in these studies and subjects were selected finished until the second decade of life (Yakovlev with different criteria, it is not surprising that the and Lecours, 1967). results obtained were not conclusive.
In a previous paper Marosi et al. (1992) ob- served that the maturation of EEG coherences in normal children was characterized by higher co- herence values between vertex and the posterior regions and by a decrease with age in the coher- ences of frontal inter-connections. Decreased frontal coherences with age may be related to an increase of cortical differentiation, as it was pointed out by Thatcher et al. (1986). Children with learning disability showed a different pattern of coherence maturation (Marosi et al. 19921 demonstrating that age is a very important vari- able that affects in a differential way the coher- ence of normal and learning disabled children.
This study seeks to evaluate whether and if so the degree of severity of reading-writing problems affects EEG coherences and, based on the ob- served effects, to assess the nature of the underly- ing cerebral mechanism that may be related to learning disabilities. A different pattern of coher- ences for the mildly and severely reading disabled group would suggest different cerebral function- ing or organization for the two groups. As read- ing disabled population is rather heterogeneous, the results may enable us to create more homoge- neous subgroups.
Learning disabled subjects had more delta and theta absolute and relative power than normal children of the same age (John et al. 1983). Based on EEG power values, we were able to differenti- ate between children with different degrees of learning difficulty (Harmony et al. 1990a). Rebert et al. (1978) studied power measurements and their asymmetry and found an excess of theta activity over the left gyrus angularis. The authors suggested that the left gyrus angularis is involved in reading. Such results suggested to us that EEG coherences may discriminate between children with different performance on a reading-writing test. The effect of learning problems on coher- ence values has been barely studied. Leisman and Ashkenazy (1980) observed higher alpha intra- hemispheric coherences in parietal and occipital regions in dyslexic subjects than controls and higher interhemispheric ones in controls than in dyslexics. Thatcher and Walker (1985) studied coherence related to intelligence and found an increase in coherences with a decrease in IQ. Their results were supported by a study of Gasser et al. (19871, who compared the coherences of normal and mentally retarded children. They ob- served a global increase of coherence values for the handicapped sample, in all bands. Schmid et al. (1992) calculated the coherences in children
Based on our previous papers we do expect to find significant differences in coherence values between controls and reading disabled groups at frontal regions in the delta, theta and alpha bands and at left temporal areas in the theta band. We also suppose to obtain different coherence values by age groups for the three performance groups probably at the frontal region in the theta band.
2. Material and methods
Subjects This study was carried out with 84 children in
two age groups. A pedagogical test, applied to all of them, considered reading-writing achievement as compared to the requirements of their school grade. Based on test performance on various subitems on reading and writing, exploring oral reading, reading comprehension, copying, dicta- tion and functional writing, subjects were classi- fied into three different groups. Group 1 con- sisted of children with good performance for their age and grade (pedl). Group 2 consisted of sub- jects with satisfactory performance having minor academic problems which could be overcome with a little extra help (ped2). The children in groups pedl and ped2 had no history of academic failure and had never repeated school years. Group 3 was comprised of children with poor perfor-
E. Marosi et al. /International Journal of Psychophysiology 19 (1995) 23-32 25
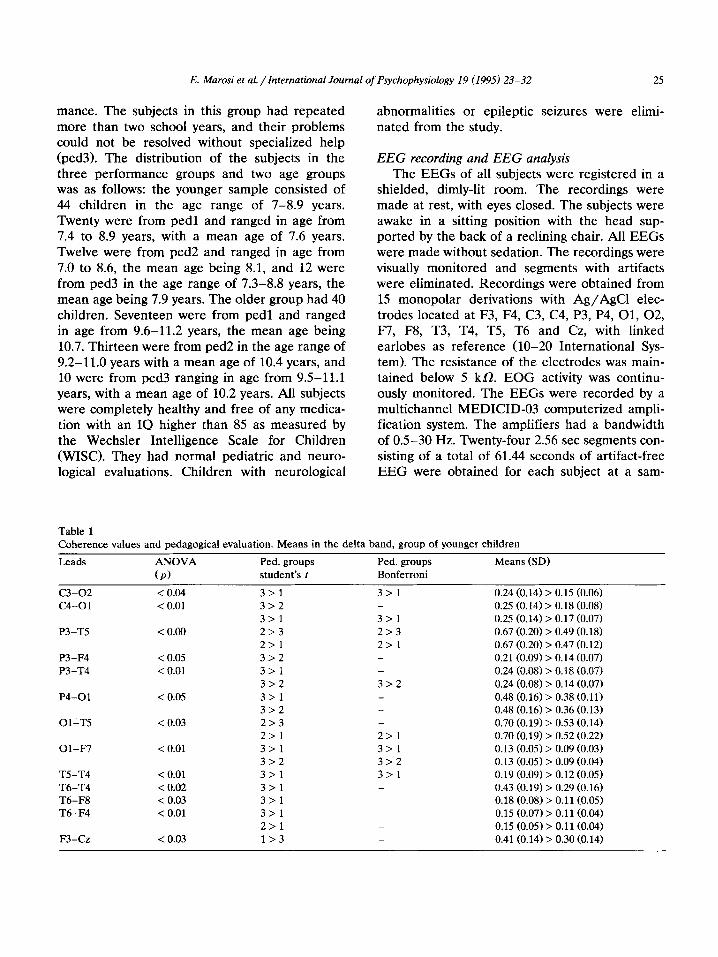
mance. The subjects in this group had repeated more than two school years, and their problems could not be resolved without specialized help (ped3). The distribution of the subjects in the three performance groups and two age groups was as follows: the younger sample consisted of 44 children in the age range of 7-8.9 years. Twenty were from pedl and ranged in age from 7.4 to 8.9 years, with a mean age of 7.6 years. Twelve were from ped2 and ranged in age from 7.0 to 8.6, the mean age being 8.1, and 12 were from ped3 in the age range of 7.3-8.8 years, the mean age being 7.9 years. The older group had 40 children. Seventeen were from pedl and ranged in age from 9.6-11.2 years, the mean age being 10.7. Thirteen were from ped2 in the age range of 9.2-11.0 years with a mean age of 10.4 years, and 10 were from ped3 ranging in age from 9.5-11.1 years, with a mean age of 10.2 years. All subjects were completely healthy and free of any medica- tion with an IQ higher than 85 as measured by the Wechsler Intelligence Scale for Children (WISC). They had normal pediatric and neuro- logical evaluations. Children with neurological
abnormalities or epileptic seizures were elimi- nated from the study.
EEG recording and EEG analysis The EEGs of all subjects were registered in a
shielded, dimly-lit room. The recordings were made at rest, with eyes closed. The subjects were awake in a sitting position with the head sup- ported by the back of a reclining chair. All EEGs were made without sedation. The recordings were visually monitored and segments with artifacts were eliminated. Recordings were obtained from 15 monopolar derivations with Ag/AgCl elec- trodes located at F3, F4, C3, C4, P3, P4, 01, 02, F7, F8, T3, T4, T5, T6 and Cz, with linked earlobes as reference (lo-20 International Sys- tem). The resistance of the electrodes was main- tained below 5 kR. EOG activity was continu- ously monitored. The EEGs were recorded by a multichannel MEDICID- computerized ampli- fication system. The amphfiers had a bandwidth of 0.5-30 Hz. Twenty-four 2.56 set segments con- sisting of a total of 61.44 seconds of artifact-free EEG were obtained for each subject at a sam-
Table 1 Coherence values and pedagogical evaluation. Means in the delta band, group of younger children
Leads ANOVA Ped. groups Ped. groups Means (SD)
(P) student’s t Bonferroni
C3-02 < 0.04 3>1 3>1 0.24 (0.14) > 0.15 (0.06) c4-01 < 0.01 3>2 0.25 (0.14) > 0.18 (0.08)
3>1 3>1 0.25 (0.14) > 0.17 (0.07) P3-T5 < 0.00 2>3 2>3 0.67 (0.20) > 0.49 (0.18)
2>1 2>1 0.67 (0.20) > 0.47 (0.12) P3-F4 < 0.05 3>2 0.21 (0.09) > 0.14 (0.07) P3-T4 < 0.01 3>1 _ 0.24 (0.08) > 0.18 (0.07)
3>2 3>2 0.24 (0.08) > 0.14 (0.07) P4-01 < 0.05 3>1 0.48 (0.16) > 0.38 (0.11)
3>2 0.48 (0.16) > 0.36 (0.13) Ol-T5 < 0.03 2>3 _ 0.70 (0.19) > 0.53 (0.14)
2>1 2>1 0.70 (0.19) > 0.52 (0.22) 01-w < 0.01 3>1 3>1 0.13 (0.05) > 0.09 (0.03)
3>2 3>2 0.13 (0.05) > 0.09 (0.04) TS-T4 < 0.01 3>1 3>1 0.19 (0.09) > 0.12 (0.05) T6-T4 < 0.02 3>1 _ 0.43 (0.19) > 0.29 (0.16) T6-F8 < 0.03 3>1 0.18 (0.08) > 0.11 (0.05) T6-F4 < 0.01 3>1 _ 0.15 (0.07) > 0.11 (0.04)
2>1 _ 0.15 (0.05) > 0.11 (0.04) F3-Cz < 0.03 1>3 _ 0.41 (0.14) > 0.30 (0.14)
26 E. Marosi et al. /International Journal of Psychophysiology 19 (1995) 23-32
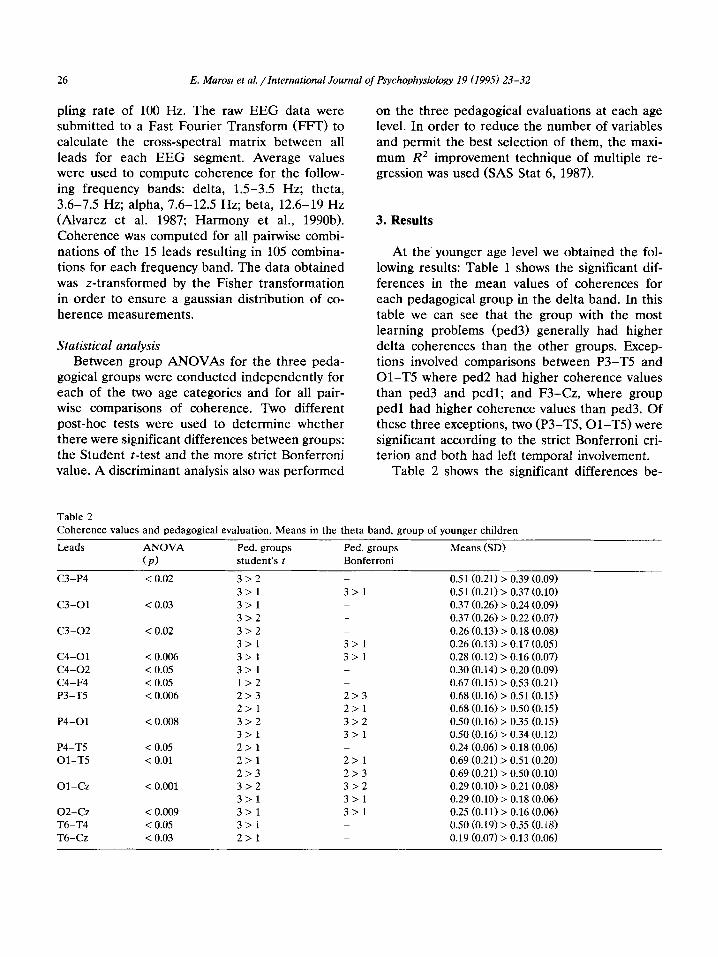
pling rate of 100 Hz. The raw EEG data were submitted to a Fast Fourier Transform (FFT) to calculate the cross-spectral matrix between all leads for each EEG segment. Average values were used to compute coherence for the follow- ing frequency bands: delta, 1.5-3.5 Hz; theta, 3.6-7.5 Hz; alpha, 7.6-12.5 Hz; beta, 12.6-19 Hz (Alvarez et al. 1987; Harmony et al., 1990b). Coherence was computed for all pair-wise combi- nations of the 15 leads resulting in 105 combina- tions for each frequency band. The data obtained was z-transformed by the Fisher transformation in order to ensure a gaussian distribution of co- herence measurements.
Statistical analysis Between group ANOVAs for the three peda-
gogical groups were conducted independently for each of the two age categories and for all pair- wise comparisons of coherence. Two different post-hoc tests were used to determine whether there were significant differences between groups: the Student t-test and the more strict Bonferroni value. A discriminant analysis also was performed
on the three pedagogical evaluations at each age level. In order to reduce the number of variables and permit the best selection of them, the maxi- mum R2 improvement technique of multiple re- gression was used @AS Stat 6, 1987).
3. Results
At the younger age level we obtained the fol- lowing results: Table 1 shows the significant dif- ferences in the mean values of coherences for each pedagogical group in the delta band. In this table we can see that the group with the most learning problems (ped3) generally had higher delta coherences than the other groups. Excep- tions involved comparisons between P3-T5 and Ol-T5 where ped2 had higher coherence values than ped3 and pedl; and F3-Cz, where group pedl had higher coherence values than ped3. Of these three exceptions, two (P3-T5, Ol-T5) were significant according to the strict Bonferroni cri- terion and both had left temporal involvement.
Table 2 shows the significant differences be-
Table 2 Coherence values and pedagogical evaluation. Means in the theta band, group of younger children
Leads Ped. groups Ped. groups student’s t Bonferroni
c3-P4 3>2 _ 3>1 3>1
c3-01 3>1 _ 3>2
c3-02 3>2 _ 3>1 3>1
c4-01 3>1 3>1 C4-02 3>1 _ C4-F4 1>2 _ P3-T5 2>3 2>3
2>1 2>1 P4-01 3>2 3>2
3>1 3>1 P4-T5 2>1 _ Ol-T5 2>1 2>1
2>3 2>3 Ol-cz 3>2 3>2
3>1 3>1 02-cz 3>1 3>1 T6-T4 3>1 _ T6-Cz 2>1 _
ANOVA
(P)
< 0.02
< 0.03
< 0.02
< 0.006 < 0.05 < 0.05 < 0.006
< 0.008
< 0.05 < 0.01
< 0.001
< 0.009 < 0.05 < 0.03
Means (SD)
0.51 (0.21) > 0.39 (0.09) 0.51 (0.21) > 0.37 (0.10) 0.37 (0.26) > 0.24 (0.09) 0.37 (0.26) > 0.22 (0.07) 0.26 (0.13) > 0.18 (0.08) 0.26 (0.13) > 0.17 (0.05) 0.28 (0.12) > 0.16 (0.07) 0.30 (0.14) > 0.20 (0.09) 0.67 (0.15) > 0.53 (0.21) 0.68 (0.16) > 0.51 (0.15) 0.68 (0.16) > 0.50 (0.15) 0.50 (0.16) > 0.35 (0.15) 0.50 (0.16) > 0.34 (0.12) 0.24 (0.06) > 0.18 (0.06) 0.69 (0.21) > 0.51 (0.20) 0.69 (0.21) > 0.50 (0.10) 0.29 (0.10) > 0.21 (0.08) 0.29 (0.10) > 0.18 (0.06) 0.25 (0.11) > 0.16 (0.06) 0.50 (0.19) > 0.35 (0.18) 0.19 (0.07) > 0.13 (0.06)
E. Marosi et al. /International Journal of Psychophysiology 19 (1995) 23-32 27
Table 3 Coherence values and pedagogical evaluation. Means in the alpha band, group of younger children
Leads ANOVA Ped. groups Ped. groups Means LSD)
(PI student’s t Bonferroni
C4-F4 < 0.02 1>2 I>2 0.67 (0.15) > 0.49 (0.20) P3-TS < 0.05 2>1 0.64 (0.21) > 0.51 (0.15)
2~3 0.64 (0.21) > 0.48 (0.18) P4-T6 < 0.02 2>1 0.60 (0.14) > 0.50 (0.14)
2>3 2>3 0.60 (0.14) > 0.44 (0.16) Ol-T5 < 0.05 2>1 - 0.76 (0.28) > 0.57 (0.22) 02-F3 < 0.03 2>3 2>3 0.15 (0.05) > 0.10 (0.04)
1>3 0.14 (0.05) > 0.10 (0.04) 02-F7 < 0.05 2>3 0.16 (0.07) > 0.11 (0.04) T5-F3 < 0.05 1>3 0.20 (0.13) > 0.12 (0.07) T5-F4 < 0.01 1>2 1>2 0.18 (0.08) > 0.11 (0.04)
1>3 1>3 0.18 (0.08) > 0.11 (0.06) T6-F4 < 0.02 2>3 2>3 0.16 (0.05) > 0.11 (0.02)
1>3 0.15 (0.05) > 0.11 (0.02) T6-Cz < 0.02 1>3 1>3 0.14 (0.06) > 0.09 (0.03)
2>3 0.14 (0.03) > 0.09 (0.03) F4-Cz < 0.04 1>3 0.57 (0.12) > 0.44 (0.14)
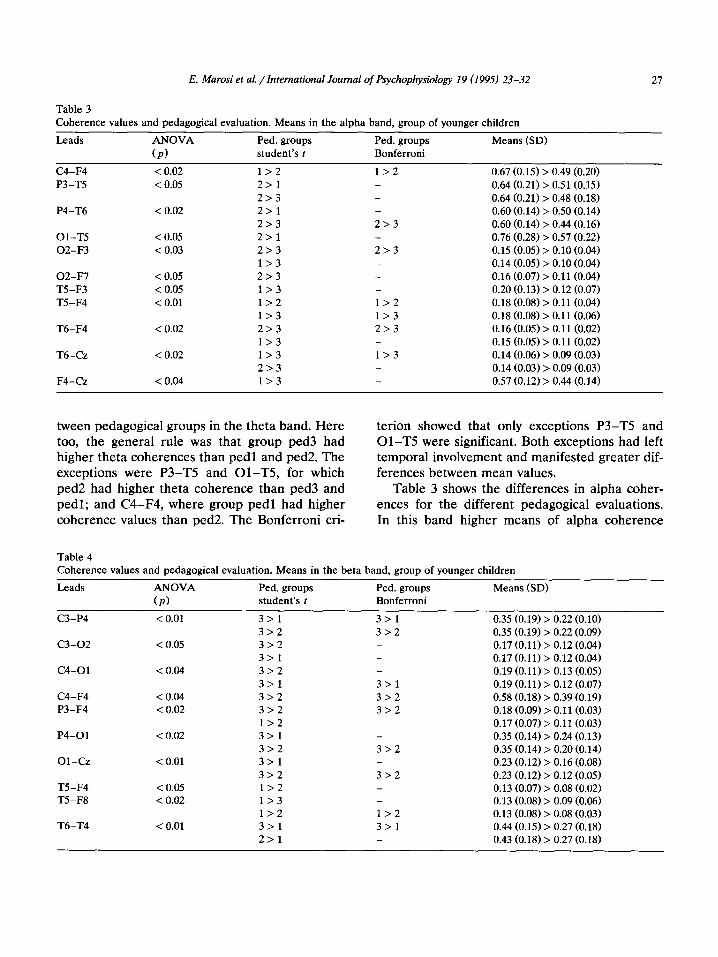
tween pedagogical groups in the theta band. Here terion showed that only exceptions P3-T5 and too, the general rule was that group ped3 had Ol-T5 were significant. Both exceptions had left higher theta coherences than pedl and ped2. The temporal involvement and manifested greater dif- exceptions were P3-T5 and Ol-T5, for which ferences between mean values. ped2 had higher theta coherence than ped3 and Table 3 shows the differences in alpha coher- pedl; and C4-F4, where group pedl had higher ences for the different pedagogical evaluations. coherence values than ped2. The Bonferroni cri- In this band higher means of alpha coherence
Table 4 Coherence values and pedagogical evaluation. Means in the beta band, group of younger children
Leads
c3-P4
C3-02
c4-01
C4-F4 P3-F4
P4-01
Ol-cz
T5-F4 T5-F8
T6-T4
ANOVA
(PI
< 0.01
< 0.05
< 0.04
< 0.04 < 0.02
< 0.02
< 0.01
< 0.05 < 0.02
< 0.01
Ped. groups student’s t
3>1 3>2 3>2 3>1 3>2 3>1 3>2 3>2 1>2 3>1 3>2 3>1 3>2 1>2 1>3 1>2 3>1 2>1
Ped. groups Bonferroni
3>1 3>2 _
3>1 3>2 3>2 _
3>2
3>2
1>2 3>1
Means (SD)
0.35 (0.19) > 0.22 (0.10) 0.35 (0.19) > 0.22 (0.09) 0.17 (0.11) > 0.12 (0.04) 0.17 (0.11) > 0.12 (0.04) 0.19 (0.11) > 0.13 (0.05) 0.19 (0.11) > 0.12 (0.07) 0.58 (0.18) > 0.39 (0.19) 0.18 (0.09) > 0.11 (0.03) 0.17 (0.07) > 0.11 (0.03) 0.35 (0.14) > 0.24 (0.13) 0.35 (0.14) > 0.20 (0.14) 0.23 (0.12) > 0.16 (0.08) 0.23 (0.12) > 0.12 (0.05) 0.13 (0.07) > 0.08 (0.02) 0.13 (0.08) > 0.09 (0.06) 0.13 (0.08) > 0.08 (0.03) 0.44 (0.15) > 0.27 (0.18) 0.43 (0.18) > 0.27 (0.18)
28 E. Marosi et al. /International Journal of Psychophysiology 19 (1995) 23-32
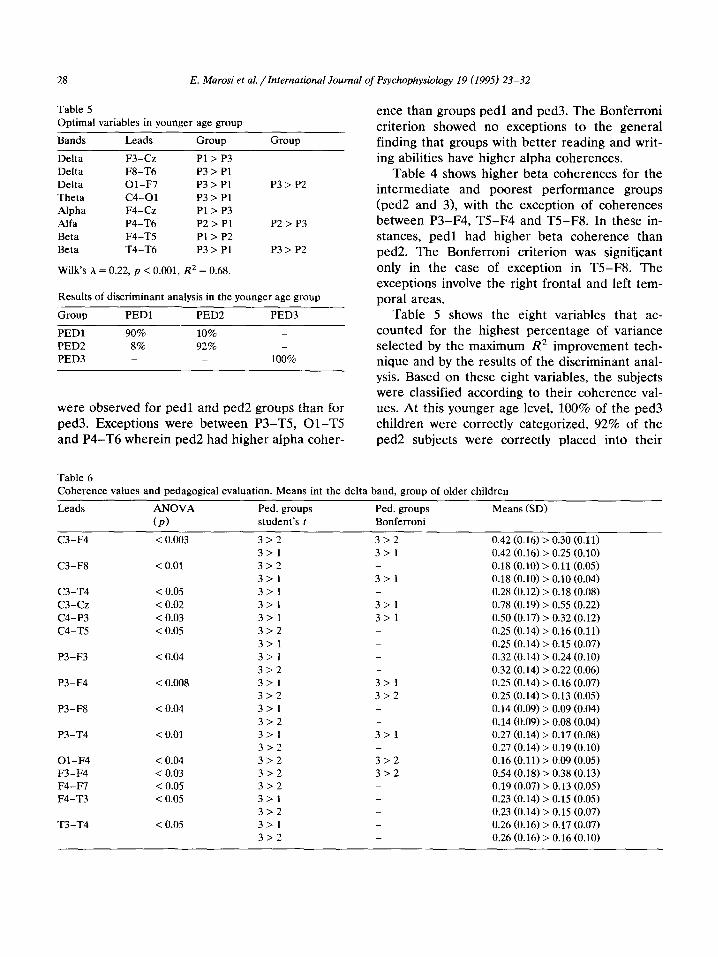
Table 5 Optimal variables in younger age group
Bands Leads Group
Delta F3-Cz Pl > P3 Delta F8-T6 P3>Pl Delta Ol-F7 P3.Pl Theta c4-01 P3>Pl Alpha F4-Cz Pl > P3 Alfa P4-T6 P2>Pl Beta F4-T5 Pl > P2 Beta T4-T6 P3>Pl
Wilk’s h = 0.22, p < 0.001, R2 = 0.68.
Group
P3> P2
P2 > P3
P3>P2
Results of discriminant analysis in the younger age group
Group PEDl PED2 PED3
PEDl 90% 10% _
PED2 8% 92% PED3 _ 100%
were observed for pedl and ped2 groups than for ped3. Exceptions were between P3-T5, Ol-T5 and P4-T6 wherein ped2 had higher alpha coher-
ence than groups pedl and ped3. The Bonferroni criterion showed no exceptions to the general finding that groups with better reading and writ- ing abilities have higher alpha coherences.
Table 4 shows higher beta coherences for the intermediate and poorest performance groups (ped2 and 3), with the exception of coherences between P3-F4, T5-F4 and T5-F8. In these in- stances, pedl had higher beta coherence than ped2. The Bonferroni criterion was significant only in the case of exception in T5-F8. The exceptions involve the right frontal and left tem- poral areas.
Table 5 shows the eight variables that ac- counted for the highest percentage of variance selected by the maximum R* improvement tech- nique and by the results of the discriminant anal- ysis. Based on these eight variables, the subjects were classified according to their coherence val- ues. At this younger age level, 100% of the ped3 children were correctly categorized, 92% of the ped2 subjects were correctly placed into their
Table 6 Coherence values and pedagogical evaluation. Means int the delta band, group of older children
Leads ANOVA Ped. groups Ped. groups Means (SD)
(P) student’s t Bonferroni
C3-F4 < 0.003
C3-F8 < 0.01
C3-T4 < 0.05
c3-cz < 0.02 c4-P3 < 0.03 C4-T5 < 0.05
P3-F3 < 0.04
P3-F4 < 0.008
P3-F8 < 0.04
P3-T4 < 0.01
Ol-F4 < 0.04 F3-F4 < 0.03 F4-F7 < 0.05 F4-T3 < 0.05
T3-T4 < 0.05
3>2 3>1 3>2 3>1 3>1 3>1 3>1 3>2 3>1 3>1 3>2 3>1 3>2 3>1 3>2 3>1 3>2 3>2 3>2 3>2 3>1 3>2 3>1 3>2
3>2 3>1
3>1
3>1 3>1
3>1 3>2
3>1
3>2 3>2
0.42 (0.16) > 0.30 (0.11) 0.42 (0.16) > 0.25 (0.10) 0.18 (0.10) > 0.11 (0.05) 0.18 (0.10) > 0.10 (0.04) 0.28 (0.12) > 0.18 (0.08) 0.78 (0.19) > 0.55 (0.22) 0.50 (0.17) > 0.32 (0.12) 0.25 (0.14) > 0.16 (0.11) 0.25 (0.14) > 0.15 (0.07) 0.32 (0.14) > 0.24 (0.10) 0.32 (0.14) > 0.22 (0.06) 0.25 (0.14) > 0.16 (0.07) 0.25 (0.14) > 0.13 (0.05) 0.14 (0.09) > 0.09 (0.04) 0.14 (0.09) > 0.08 (0.04) 0.27 (0.14) > 0.17 (0.08) 0.27 (0.14) > 0.19 (0.10) 0.16 (0.11) > 0.09 (0.05) 0.54 (0.18) > 0.38 (0.13) 0.19 (0.07) > 0.13 (0.05) 0.23 (0.14) > 0.15 (0.05) 0.23 (0.14) > 0.15 (0.07) 0.26 (0.16) > 0.17 (0.07) 0.26 (0.16) > 0.16 (0.10)
E. Marosi et al. /International Journal of Psychophysiology 19 (199.5) 23-32 29
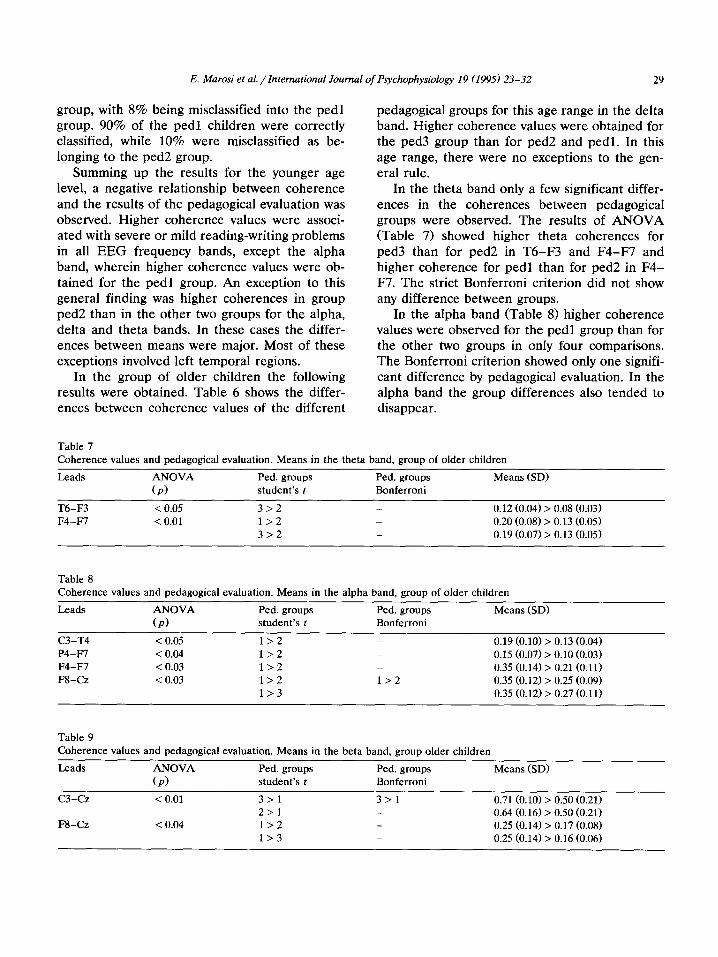
group, with 8% being misclassified into the pedl group. 90% of the pedl children were correctly classified, while 10% were misclassified as be- longing to the ped2 group.
Summing up the results for the younger age level, a negative relationship between coherence and the results of the pedagogical evaluation was observed. Higher coherence values were associ- ated with severe or mild reading-writing problems in all EEG frequency bands, except the alpha band, wherein higher coherence values were ob- tained for the pedl group. An exception to this general finding was higher coherences in group ped2 than in the other two groups for the alpha, delta and theta bands. In these cases the differ- ences between means were major. Most of these exceptions involved left temporal regions.
pedagogical groups for this age range in the delta band. Higher coherence values were obtained for the ped3 group than for ped2 and pedl. In this age range, there were no exceptions to the gen- eral rule.
In the theta band only a few significant differ- ences in the coherences between pedagogical groups were observed. The results of ANOVA (Table 7) showed higher theta coherences for ped3 than for ped2 in T6-F3 and F4-F7 and higher coherence for pedl than for ped2 in F4- F7. The strict Bonferroni criterion did not show any difference between groups.
In the group of older children the following results were obtained. Table 6 shows the differ- ences between coherence values of the different
In the alpha band (Table 8) higher coherence values were observed for the pedl group than for the other two groups in only four comparisons. The Bonferroni criterion showed only one signifi- cant difference by pedagogical evaluation. In the alpha band the group differences also tended to disappear.
Table 7
Coherence values and pedagogical evaluation. Means in the theta band, group of older children
Leads ANOVA Ped. groups Ped. groups Means (SD)
(PI student’s t Bonferroni
T6-F3 < 0.05 3>2 0.12 (0.04) > 0.08 (0.03)
F4-F7 < 0.01 1>2 _ 0.20 (0.08) > 0.13 (0.05)
3>2 _ 0.19 (0.07) > 0.13 (0.05)
Table 8 Coherence values and pedagogical evaluation. Means in the alpha band, group of older children
Leads ANOVA Ped. groups Ped. groups Means (SD)
(P) student’s t Bonferroni
C3-T4 < 0.05 1>2 _ 0.19 (0.10) > 0.13 (0.04)
P4-F7 < 0.04 1>2 0.15 (0.07) > 0.10 (0.03)
F4-F7 < 0.03 1>2 _ 0.35 (0.14) > 0.21 (0.11)
F8-Cz < 0.03 1>2 1>2 0.35 (0.12) > 0.25 (0.09)
1>3 _ 0.35 (0.12) > 0.27 (0.11)
Table 9
Coherence values and pedagogical evaluation. Means in the beta band, group older children
Leads ANOVA Ped. groups Ped. groups Means (SD)
(P) student’s t Bonferroni
c3-cz < 0.01 3>1 3>1 0.71 (0.10) > 0.50 (0.21)
2>1 0.64 (0.16) > 0.50 (0.21)
F8-Cz < 0.04 1>2 0.25 (0.14) > 0.17 (0.08)
1>3 _ 0.25 (0.14) > 0.16 (0.06)
30 E. Marosi et al. /International Journal of Psychophysiology 19 (1995) 23-32
In the beta band only two comparisons were significant; both of them included the vertex site (Table 9). The vertex compared with the left central region (C3-Cz) had higher coherence for the ped3 and ped2 groups than for pedl. The Bonferroni criterion was significant only in this comparison (3 > 1). The vertex compared with the right frontal region (F8-CZ) showed higher beta coherence for pedl than for the other two groups.
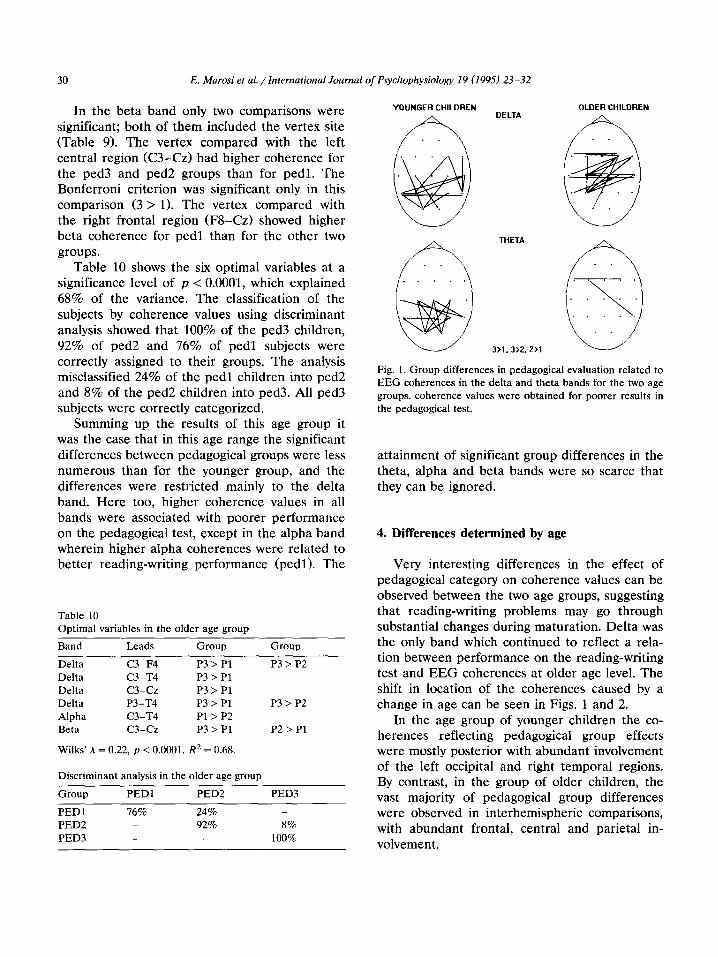
Table 10 shows the six optimal variables at a significance level of p < 0.0001, which explained 68% of the variance. The classification of the subjects by coherence values using discriminant analysis showed that 100% of the ped3 children, 92% of ped2 and 76% of pedl subjects were correctly assigned to their groups. The analysis misclassified 24% of the pedl children into ped2 and 8% of the ped2 children into ped3. All ped3 subjects were correctly categorized.
Summing up the results of this age group it was the case that in this age range the significant differences between pedagogical groups were less numerous than for the younger group, and the differences were restricted mainly to the delta band. Here too, higher coherence values in all bands were associated with poorer performance on the pedagogical test, except in the alpha band wherein higher alpha coherences were related to better reading-writing performance (pedl). The
Table 10 Optimal variables in the older age group
Band Leads Group Group
Delta C3-F4 P3>Pl P3 > P2
Delta C3-T4 P3>Pl
Delta c3-cz P3>Pl
Delta P3-T4 P3>Pl P3>P2
Alpha C3-T4 Pl > P2
Beta c3-cz P3>Pl P2 > Pl
Wilks’ A = 0.22, p < 0.0001, R* = 0.68.
Discriminant analysis in the older age group
Group
PEDl
PED2
PED3
PEDl
76% _
PED2
24% 92%
PED3
8%
100%
YOUNGER CHILDREN OLDER CHILDREN DELTA
/ \ / . \
THETA
. . . .-
3>1,3>2.2>1
Fig. 1. Group differences in pedagogical evaluation related to
EEG coherences in the delta and theta bands for the two age
groups. coherence values were obtained for poorer results in
the pedagogical test.
attainment of significant group differences in the theta, alpha and beta bands were so scarce that they can be ignored.
4. Differences determined by age
Very interesting differences in the effect of pedagogical category on coherence values can be observed between the two age groups, suggesting that reading-writing problems may go through substantial changes during maturation. Delta was the only band which continued to reflect a rela- tion between performance on the reading-writing test and EEG coherences at older age level. The shift in location of the coherences caused by a change in age can be seen in Figs. 1 and 2.
In the age group of younger children the co- herences reflecting pedagogical group effects were mostly posterior with abundant involvement of the left occipital and right temporal regions. By contrast, in the group of older children, the vast majority of pedagogical group differences were observed in interhemispheric comparisons, with abundant frontal, central and parietal in- volvement.
E. Marosi et al. /International Journal of Psychophysiology 19 (1995) 23-32 31
YOUNGER CHILDREN OLDER CHILDREN
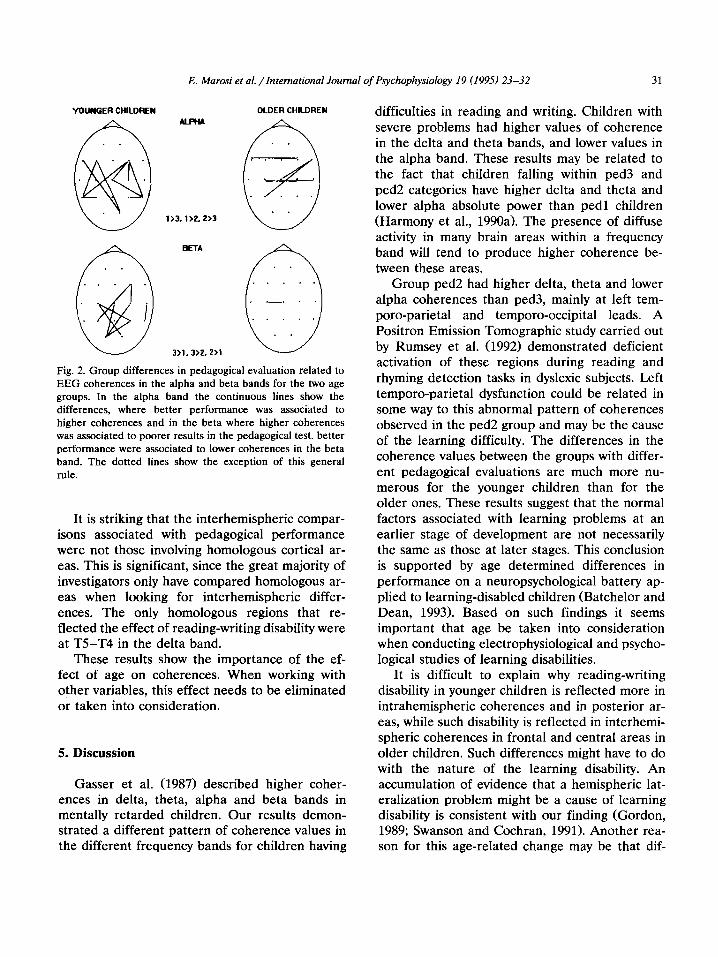
Fig. 2. Group differences in pedagogical evaluation related to
EEG coherences in the alpha and beta bands for the two age groups. In the alpha band the continuous lines show the
differences, where better performance was associated to
higher coherences and in the beta where higher coherences
was associated to poorer results in the pedagogical test. better
performance were associated to lower coherences in the beta band. The dotted lines show the exception of this general
rule.
It is striking that the interhemispheric compar- isons associated with pedagogical performance were not those involving homologous cortical ar- eas. This is significant, since the great majority of investigators only have compared homologous ar- eas when looking for interhemispheric differ- ences. The only homologous regions that re- flected the effect of reading-writing disability were at T5-T4 in the delta band.
These results show the importance of the ef- fect of age on coherences. When working with other variables, this effect needs to be eliminated or taken into consideration.
5. Discussion
Gasser et al. (1987) described higher coher- ences in delta, theta, alpha and beta bands in mentally retarded children. Our results demon- strated a different pattern of coherence values in the different frequency bands for children having
difficulties in reading and writing. Children with severe problems had higher values of coherence in the delta and theta bands, and lower values in the alpha band. These results may be related to the fact that children falling within ped3 and ped2 categories have higher delta and theta and lower alpha absolute power than pedl children (Harmony et al., 1990a). The presence of diffuse activity in many brain areas within a frequency band will tend to produce higher coherence be- tween these areas.
Group ped2 had higher delta, theta and lower alpha coherences than ped3, mainly at left tem- poro-parietal and temporo-occipital leads. A Positron Emission Tomographic study carried out by Rumsey et al. (1992) demonstrated deficient activation of these regions during reading and rhyming detection tasks in dyslexic subjects. Left temporo-parietal dysfunction could be related in some way to this abnormal pattern of coherences observed in the ped2 group and may be the cause of the learning difficulty. The differences in the coherence values between the groups with differ- ent pedagogical evaluations are much more nu- merous for the younger children than for the older ones. These results suggest that the normal factors associated with learning problems at an earlier stage of development are not necessarily the same as those at later stages. This conclusion is supported by age determined differences in performance on a neuropsychological battery ap- plied to learning-disabled children (Batchelor and Dean, 1993). Based on such findings it seems important that age be taken into consideration when conducting electrophysiological and psycho- logical studies of learning disabilities.
It is difficult to explain why reading-writing disability in younger children is reflected more in intrahemispheric coherences and in posterior ar- eas, while such disability is reflected in interhemi- spheric coherences in frontal and central areas in older children. Such differences might have to do with the nature of the learning disability. An accumulation of evidence that a hemispheric lat- eralization problem might be a cause of learning disability is consistent with our finding (Gordon, 1989; Swanson and Cochran, 1991). Another rea- son for this age-related change may be that dif-
32 E. Marosi et al. /International Journal of Psychophysiology 19 (1995) 23-32
ferent cerebral areas take part in reading and writing at older ages when automatization occurs. Bakker (1983) maintains that reading and writing are controlled at first by the right hemisphere and that only later, with automatization, does the left hemisphere take control. Nine to 11 years, the age range of our older group of subjects, may turn out to be the period in which such a transfer occurs.
Results obtained with the discriminant analysis demonstrate that children with different reading- writing performance evaluations have different patterns of EEG coherences at different ages. The patterns change with age, as manifested by the near disappearance of pedagogical group dif- ferences in the theta, alpha and beta bands. The variables which explained the higher amount of variance between pedagogical groups were also different for the two age groups. These results demonstrate the sensitivity of the coherence val- ues and support their use as a means for a more precisely categorizing learning and writing dis- abilities, since even the subjects with minor diffi- culties can be discriminated both from children with severe problems as well as from those with- out difficulties.
Acknowledgements
This project was supported in part by a schol- arship from the Government of the Estado de Mexico and in part by grant number IN 210193 from DGAPA, UNAM. The authors thank Sandor John for correcting the English.
References
Alvarez, A., Valdbs, P. and Pascual R. (1987) EEG develop- mental equations confirmed for Cuban schoolchildren. Electroenceph. clin. Neurophysiol., 67: 330-332.
Bakker, LA. (1983) Hemispheric specialization and specific reading retardation. In: M. Rutter (Ed.), Developmental
Neuropsychiatry, The Guilford Press, New York. Batchelor, E.S. and Dean, R.S. (19931 Empirical definition
and classification of subgroups of children with learning
disorders at separate age levels. Arch. Clin. Neuropsychol.,
8: l-15.
Fein, G., Raz, J., Brown, F.F. and Merrin, E.L. (1988) Com-
mon reference coherence data are confounded by power
and phase effects. Electroenceph. clin. Neurophysiol., 69: 581-584.
Gasser, Th., Jennen-Steinmetz, C. and Verleger, R. (1987)
EEG coherence at rest and during a visual task in two groups of children. Electroenceph. clin. Neurophysiol., 67:
151-158. Gordon, H.W. (1989) Hemisphericity and its validity for edu-
cation, vocation and cognitive style. Int. J. Neurosci., 47:
47-55.
Harmony, T., Marosi, E., Hinojosa, G., Becker, J., Rodriguez,
M., Reyes, A. and Rocha, C. (1990a) Correlation between
EEG spectral parameters and an educational evaluation.
Int. J. Neurosci., 54: 147-155.
Harmony, T., Marosi, E., Diaz de Len, A.E., Becker, J. and
Fernandez, T. (1990b) Effect of sex, psychosocial disad-
vantages and biological risk factors on EEG maturation.
Electroenceph. clin. Neurophysiol., 75: 482-491. John, E.R., Prichep, L., Ahn, H., Easton, P., Friedman, J.,
Kaye H. (19831 Neurometric evaluation of cognitive dys-
functions and neurological disorders in children. Prog. Neurobiol., 21: 239-290.
Leisman, G. and Ashkenazy M. (1980) Aetiological factors in
dyslexia. Neuroscience, 11: 157-167.
Marosi, E., Harmony, T., Sanchez, L., Becker, J., Bernal, J.,
Reyes, A., Diaz de Leon, A.E., Rodriguez, M. and
Fernandez, T. (19921 Maturation of the coherence of EEG activity in normal and learning disabled children. Elec-
troenceph. clin. Neurophysiol., 83/6: 350-357.
Rumsey, J.M., Andreason, P., Zametkin, A.J., Aquino, T.,
King, A.C., Hamburger, S.D., Pikus, A., Rapoport, J.L. and Cohen, R.M. (1992) Failure to activate the left tem-
poroparietal cortex in dyslexia. Arch. Neurol., 49: 527-534. SAS/Stat Guide for Personal Computers, Version 6, SAS
Institute Incorporation, 1987.
Schmid, R.G., Tirsch, W.S., Rappelsberger, P., Weinmann, H.M. and Poppl, S.J. (1992) Comparative coherence stud-
ies in healthy volunteers and Down’s syndrome patients
from childhood to adult age. Electroenceph. clin. Neuro-
physiol., 83: 112-123.
Swanson, H.L. and Cochran, K.F. (19911 Learning disabilities,
distinctive encoding and hemispheric resources. Brain
Lang., 40: 202-230. Thatcher, R.W. and Walker, R.A. (1985) EEG coherence and
intelligence in children. Electroenceph. clin. Neurophysiol., 61: S161.
Thatcher, R.W., Krause, P.J. and Hrybyk, M. (1986) Cortico- cortical associations and EEG coherence a two-compart- mental model. Electroenceph. clin. Neurophysiol. 64: 123-
145. Yakovlev, PI. and Lecours, A.R. (1967) The myelogenetic
cycles of regional maturation of the brain. In: A. Minkowski (Ed.), Regional Development of the Brain in Early Life,
Blackwell Scientific, Oxford, pp. 3-70.
Copyright © 2022 FDOKUMEN