Sleep deprivation: Effect on sleep stages and EEG power density in man
Upload
wwwuniroma1Category
view
0download
0
THE BOUNDARY BETWEEN WAKEFULNESS AND SLEEP:QUANTITATIVE ELECTROENCEPHALOGRAPHIC CHANGES DURING
THE SLEEP ONSET PERIOD
L. DE GENNARO,* M. FERRARA and M. BERTINIDepartment of Psychology, Section of Neuroscience, University of Rome `La Sapienza', Via dei Marsi 78, 00185 Rome, Italy
AbstractöMicrostructural electroencephalographic changes during the wakefulness^sleep transition have been investi-gated by comparing two de¢nitions of sleep onset: the ¢rst occurrence of stage 1 and of stage 2. Power values werecalculated across a 1^28-Hz frequency range in a 1-Hz bin resolution in the sleep recordings of 26 normal subjects.Quantitative changes were assessed after averaging individual time series, aligned with respect to the ¢rst occurrence ofstage 1 or of stage 2.
The time course of the single-Hz activity revealed a linear increase of power in the 1^6-Hz range and a linear decreasein the 9^12- and 16^28-Hz ranges during the stage 1 transition. During the stage 2 transition, electroencephalogrampower linearly increased in the 1^7- and 14^15-Hz ranges and decreased in the 18^28-Hz range, while the 8^12-Hz range¢tted a second-order polynomial curve. The two `switch' points were also compared in their ability to di¡erentiate Hz byHz wakefulness from sleep: a lower mean power was found after stage 1 onset in the 9^11-Hz and 20^28-Hz bins and ahigher one in the 1^5-Hz bins, while a higher power was found in the 1^8-Hz and 12^16-Hz bins and a lower one in 18^28-Hz bins after stage 2 onset. The time course of three electroencephalographic frequency ranges [delta/theta/sigma (1^7and 12^16 Hz); beta (17^28 Hz); alpha (8^11 Hz)], grouped on the basis of a principal component analysis, ¢tted a ¢rst-order polynomial curve for the ¢rst two ranges, and a second-order polynomial curve for the last, with a progressivedecrease during wakefulness, a minimum point during stage 1, and a subsequent increase during stage 2.
The uniformly increasing electroencephalographic power across the 1^16-Hz frequency range during stage 2 and theshift of functional meaning for the alpha power during stage 1 point to the start of stage 2 as a more reliable boundarybetween wakefulness and sleep. ß 2001 IBRO. Published by Elsevier Science Ltd. All rights reserved.
Key words: wakefulness^sleep transition, electroencephalogram, spectral analysis, alpha band.
Many e¡orts have been made over the last few decadesto assess physiological and behavioral changes occurringduring the sleep onset period. This transition has beendescribed as a process of gradual reduction of arousal(e.g., Davis et al., 1937; Dement and Kleitman, 1957),characterized by thalamic deactivation observed by neu-roimaging techniques (Maquet, 2000); a disappearanceof saccades, a reduction of endogenous blinking (e.g.,Santamaria and Chiappa, 1987) and an appearance ofslow eye movements, directly related to electroencephalo-graphic changes (De Gennaro et al., 2000); drops inelectromyographic amplitude (Hauri and Good, 1975);variations in skin potential activity (Hori, 1982); respi-ratory changes (Ogilvie et al., 1989); drops in body tem-perature (Van Den Heuvel et al., 1998); decreased heartrate variability (Burgess et al., 1999), and variations inintracerebral hemodynamics (Spielman et al., 2000).
Behavioral measures collected during the wakefulness^sleep transition have also revealed a decrease in respon-siveness to external sensory stimuli until the ¢nal cessa-tion of response (Ogilvie et al., 1991; Casagrande et al.,1995).
Notwithstanding these remarkable physiological andbehavioral changes, up to now, the electroencephalo-gram (EEG) remains the most commonly used measureto describe di¡erences between wakefulness and sleep.The standard manual for sleep scoring (Rechtscha¡enand Kales, 1968) considers sleep beginning with theonset of stage 1, while the guidelines for the MultipleSleep Latency Test (Carskadon et al., 1986) recommend1 min of continuous stage 1 as a criterion to assess sleepi-ness in clinical practice. However, others have consideredthe appearance of a sleep spindle or a K-complex inEEG recording, that is the criteria to score stage 2, asthe onset of a well-established sleep process (Johnson,1975; Webb, 1979; Wright et al., 1995).
Therefore, a description of quantitative EEG changesduring the wakefulness^sleep transition is of intrinsicinterest for understanding brain functioning duringwakefulness and sleep, and may also be useful to clini-cians working on insomnia or excessive daytime sleepi-ness. Furthermore, to our best knowledge, there are nostudies directly comparing the two most used de¢nitions
1
*Corresponding author. Tel. : +39-6-4991-7647; fax: +39-6-4451-667.E-mail address: [email protected] (L. De Gennaro).Abbreviations: ANOVA, analysis of variance; EEG, electroenceph-
alogram; EMG, electromyogram; EOG, electrooculogram;MANOVA, multivariate analysis of variance.
NSC 5150 25-10-01 Cyaan Magenta Geel Zwart
www.neuroscience-ibro.com
Neuroscience Vol. 107, No. 1, pp. 1^11, 2001ß 2001 IBRO. Published by Elsevier Science Ltd
Printed in Great Britain. All rights reservedPII: S 0 3 0 6 - 4 5 2 2 ( 0 1 ) 0 0 3 0 9 - 8 0306-4522 / 01 $20.00+0.00

of sleep onset, that is the ¢rst epoch of 1 or stage 2 onset,by means of quantitative EEG measures.
The aim of the present study was to provide a micro-structural description of EEG powers during the wake-fulness^sleep transition by considering changes in bothsingle-Hz bins and grouped frequency ranges (EEGbands). Moreover, the study assesses whether the ¢rstoccurrence of stage 1 or stage 2 can be considered amore reliable and discriminative boundary betweenwakefulness and sleep.
EXPERIMENTAL PROCEDURES
Subjects
Twenty-six normal right-handed male students (meanage = 23.0 years; S.E.M. 0.34) were selected as paid volunteersfor the study. They signed an informed consent form beforeparticipating in the study. The study protocol was approvedby the local ethical committee and was in accordance with theDeclaration of Helsinki.
The requirements for inclusion were: normal sleep durationand schedule, no daytime nap habits, no excessive daytimesleepiness, no other sleep, medical or psychiatric disorder, asassessed by a 1-week sleep log and by a clinical interview.
Procedure
Participants slept for at least two consecutive nights in asound-proof, temperature-controlled room, the ¢rst night foradaptation. Recordings started at about 23.30 h and endedafter 7.5 h of accumulated sleep.
An Esaote Biomedica VEGA 24 polygraph set at a paperspeed of 10 mm/s was used for polygraphic recordings. EEGsignals were high-pass-¢ltered with a time constant of 0.3 sand low-pass-¢ltered at 30 Hz (18 dB/octave); seven unipolarEEG channels (C3-A2, C4-A1, Fpz-A1, Fz-A1, Cz-A1, Pz-A1,Oz-A1) were applied using the international 10-20 system. Sub-mental electromyogram (EMG) was recorded with a time con-stant of 0.03 s. Bipolar horizontal and vertical eye movementswere recorded with a time constant of 1 s. Bipolar horizontalelectrooculogram (EOG) was recorded from electrodes placedabout 1 cm from the medial and lateral canthi of the dominanteye, and bipolar vertical EOG from electrodes located about3 cm above and below the right eye pupil. Electrode impedancewas kept below 5 k6.
Data analysis
Polysomnography and quantitative analysis of signals. Onlydata from baseline nights1 were used for the purposes of thepresent study. Left central EEG (C3-A2), EMG, and horizontaland vertical EOG were used to visually score sleep stages in 12-sepochs, according to the standard criteria (Rechtscha¡en andKales, 1968). Since the wakefulness^sleep transition is charac-terized by variable lengths in di¡erent subjects and by a discon-tinuity of the process with an alternating pattern of wake andstage 1 (Casagrande et al., 1992), then in order to make theindividual transitional states comparable, a period of 5 min(24 12-s epochs) before and 5 min after the ¢rst sleep spindleor K-complex was considered for the spectral analysis of sleeponset de¢ned as the ¢rst epoch of stage 2 sleep. Concerning theother sleep onset criterion, i.e., the start of stage 1, a period of
3 min (15 12-s epochs) before and 3 min after the ¢rst epoch ofstage 1 sleep was considered for spectral analysis. The di¡erentlengths of the two considered intervals (10 min vs. 6 min) aredue to the speci¢c characteristics of the wakefulness^sleep tran-sition: in fact, during presleep, relaxed wakefulness muscularand oculomotor artifacts occur at a higher rate as a functionof the distance from stage 1 onset. Consequently, a shorterinterval was considered for this transition to minimize artifactsand to average comparable physiological states. Both stage 1and stage 2 were scored according to standard criteria(Rechtscha¡en and Kales, 1968).
The EEG was digitized on-line with a storage sampling rate of128 Hz. After an o¡-line artifact rejection based on visualinspection2, digitized signal from the C3-A2 derivation3 wasanalyzed by the fast Fourier transform algorithm, using a 4-sresolution. Spectra from three consecutive 4-s epochs were thenaveraged to allow alignment with the visual scoring of sleepstages based on 12-s epochs. Power values were calculatedacross a 1^28-Hz frequency range in a 0.25-Hz resolution. Bycomputing the mean values over adjacent frequencies, the data
Table 1. Factor loadings of the principal component analysis(varimax rotated solution) carried out on the power values
calculated across a 1^28-Hz frequency range at 1-Hz resolutionduring the wakefulness^sleep transition in which the ¢rst epoch of
stage 2 de¢ned sleep onset
Variable Factor 1 Factor 2 Factor 3
1 Hz 30.558955 30.808438 0.0238982 Hz 30.548959 30.816616 30.0550453 Hz 30.565829 30.804861 30.0775694 Hz 30.570631 30.805270 30.0691835 Hz 30.508618 30.833704 30.0363506 Hz 30.449033 30.862582 0.1310507 Hz 30.424454 30.814810 0.3264468 Hz 30.240773 30.597667 0.6654449 Hz 0.341761 0.000693 0.90663210 Hz 0.360983 0.123590 0.87985711 Hz 30.111613 30.310709 0.90198012 Hz 30.395274 30.660302 0.58773613 Hz 30.510722 30.710053 0.44203114 Hz 30.462058 30.760329 0.41061115 Hz 30.343780 30.841314 0.29532316 Hz 0.232814 30.706160 0.40837417 Hz 0.845237 30.089204 0.34895618 Hz 0.891181 0.153850 0.03315919 Hz 0.867608 0.360639 0.03630620 Hz 0.811718 0.468265 0.14514121 Hz 0.807531 0.491430 30.01592722 Hz 0.802756 0.502496 30.07050623 Hz 0.870824 0.391979 30.00205924 Hz 0.800292 0.478031 30.02749325 Hz 0.823059 0.470328 0.01204326 Hz 0.853036 0.310056 30.02252527 Hz 0.707768 0.529531 30.02470628 Hz 0.718176 0.527006 30.039096Explained variance(R2)
0.402964 0.352089 0.141772
Percentage of explained variance by each factor (eigenvalues 1) isalso reported. When a variable (each single-Hz frequency) satu-rated a factor, the value is reported in italics.
1The second night was considered a baseline sleep since it wasundisturbed (subjects slept without any experimental treatment);subjects were previously adapted to the sleep lab, and their usualbedtime was respected.
2Percentage of 4-s epochs rejected was 40.14% (S.E.M. 2.24) dur-ing the wakefulness^stage 1 transition, and 33.79% (S.E.M. 2.30)during the stage 1^stage 2 transition. This di¡erence was not signi¢-cant (F = 2.95; P = 0.10).
3C3 (or C4) is the cortical lead recommended for the standardsleep scoring (Rechtscha¡en and Kales, 1968).
NSC 5150 25-10-01 Cyaan Magenta Geel Zwart
L. De Gennaro et al.2

were reduced to 1-Hz bin widths. Bins are referred to and plot-ted in this study by the lowest frequency included (e.g., the 8-Hzbin refers to the averaged values of 8.00^8.25, 8.25^8.50, 8.50^8.75 Hz). Absolute power was then log-transformed.
Individual time series of power values for each 1-Hz bin werealigned as a function of the sleep onset de¢ned as the ¢rst 12-sepoch of stage 1 or as the ¢rst 12-s epoch of stage 2, and werethen averaged between subjects.
Successively, to obtain the time course of power values acrosssleep stages, the entire wakefulness^sleep transition was dividedinto three intervals, that is wakefulness, stage 1 and stage 2.With speci¢c reference to the stage 1 interval, due to the oscil-lating pattern of wakefulness and stage 1 after the ¢rst occur-rence of stage 1, intervals after the ¢rst occurrence of stage1 could have been non-homogeneous with respect to the stage.Therefore, EEG power for the stage 1 interval was consideredonly on the 12-s epochs actually scored as stage 1.
Statistics. The temporal evolution of EEG power valuesduring the wakefulness^sleep transition (Fig. 1 for every fre-quency bin; Fig. 5 for three EEG frequency ranges, groupedon the basis of a principal component analysis) was modeledby linear least-squares regressions. The comparisons betweenchanges of mean power values within the 1-Hz bin before andafter the `switch' points (that is, the two sleep onset criteria)have been carried out by means of one-way analyses of variance(ANOVA; lower part of Figs. 3 and 4).
A principal component analysis was carried out on the values
of single-Hz power in the 5 min before and after the ¢rst epochof stage 2 in order to have an overview of EEG changes duringthe wakefulness^sleep transition and empirically de¢ned EEGbands (Table 1).
The capacity of the two sleep onset criteria to detect signi¢-cant changes in a greater number of EEG bands as a function ofthe sleep onset point was assessed by means of two multivariateanalyses of variance (MANOVA), comparing EEG powerwithin the EEG bands before and after the ¢rst epoch ofstage 1 and stage 2, respectively (Fig. 7).
Statistical signi¢cance was set at a probability level of 0.05.For details see Results section.
RESULTS
Comparison of the two sleep onset criteria: time course of1-Hz changes
Figure 1a reports the time course of single-Hz powervalues in the 3 min before and after the ¢rst epoch ofstage 1 averaged across subjects. The frequency rangebetween 1 and 6 Hz showed an increase during the tran-sition beginning just before stage 1 onset. Their timecourses were best ¢tted by a ¢rst-order polynomial
Fig. 1. Time course of EEG power during the wakefulness^sleep transition. Sleep onset (SO) is de¢ned respectively by the¢rst epoch of stage 1 (a) or by the ¢rst epoch of stage 2 (b). Periods of 3 or 5 min before and 3 or 5 min after SO wereconsidered when the criterion to de¢ne sleep onset was the ¢rst epoch of stage 1 or the ¢rst epoch of stage 2, respectively.The ¢gure reports EEG power [expressed in log(WV2)], calculated across the 1^28-Hz range, and the best ¢tting slope foreach frequency bin when it explains more than 30% of the variance. The vertical dotted line indicates SO. Di¡erent colors
group the traditional EEG bands (delta, theta, alpha, sigma and beta).
NSC 5150 25-10-01 Cyaan Magenta Geel Zwart
EEG power during the wakefulness-sleep transition 3

curve; percentages of variance ranging from 43 to 74%were explained by a multiple linear regression model.EEG power at 7 and 8 Hz did not show any systematicchanges. Power within the 9^12-Hz range decreased dur-ing this transition, best ¢tting a ¢rst-order polynomialcurve; percentages of variance ranging from 48 to 82%were explained by the regressions. The frequency rangebetween 13 and 15 Hz did not show any systematicchange during this transition. Finally, the range ofEEG frequencies between 16 and 28 Hz decreased duringthe entire period of the transition. This decrease ¢tted a¢rst-order polynomial curve with percentages ofexplained variance ranging from 36 to 82%.
Time course of single-Hz power values in the 5 minbefore and after the ¢rst epoch of stage 2 also showed anincrease of slow frequencies in the range between 1 and 7Hz, with a steeper increase corresponding to sleep onset(Fig. 1b). Their time courses ¢tted ¢rst-order polynomialcurves, explaining percentages of variance ranging from80 to 85%. EEG power in the frequency range between8 and 12 Hz decreased from the beginning of the tran-sition until the ¢rst epoch of stage 2 and then increasedin the subsequent 5-min interval. Their time courses best¢tted second-order polynomial curves, explaining percen-tages of variance ranging from 57 to 84%. The wholerange of frequencies between 12 and 15 Hz was stablebefore sleep onset and then increased thereafter, with astep coinciding with the sleep onset point: time coursesof EEG power within the 12^13-Hz frequency range werebest ¢tted by second-order polynomial curves, explaining84 and 91% of the variance, respectively, while changesin the 14^15-Hz frequency range ¢tted ¢rst-order poly-nomial curves which explained 81 and 71% of the var-iance, respectively. Finally, power values at 16 and 17 Hzdid not show any systematic change, while the range ofhigher EEG frequencies, that is 18^28 Hz, decreased dur-
ing the entire period of the transition. This decrease ¢t-ted a ¢rst-order polynomial curve with percentages ofvariance ranging from 55 to 83%, explained by theregression model.
Figure 2 plots the di¡erences between R2 coe¤cientsof the regressions carried out on time series of Hz-by-HzEEG power values when the sleep onset criterion was the¢rst epoch of stage 2 minus those obtained when thecriterion for scoring sleep onset was the ¢rst occurrenceof stage 1. As can be observed by inspecting the ¢gure,for most frequency bins higher percentages of variance ofthe time courses of EEG power values were explained bythe multiple linear regression model when the transitionconsidered stage 2 as the sleep onset criterion. A one-wayrepeated measure ANOVA on the R2 coe¤cients con-¢rmed this prevalence (F1;56 = 11.71; P = 0.002), with amean R2 equal to 0.72 when the transition consideredstage 2 as the sleep onset criterion, and equal to 0.54in the other case.
Comparison of the two sleep onset criteria: changes ofmean power values within the 1-Hz bin before and after the`switch' point
A more direct comparison of the two EEG sleep onsetde¢nitions (the ¢rst occurrence of stage 1 vs. the ¢rstoccurrence of stage 2) should be provided by the capa-bility of these two criteria to detect more (i.e., a largernumber of EEG frequencies) and greater (i.e., explaininghigher percentages of variance) changes as a function ofthe sleep onset points.
Therefore, power values of each 1-Hz bin before the¢rst epoch of stage 1 were compared to the ones afterthis point by means of one-way repeated measureANOVAs. As detailed in Fig. 3, di¡erences before andafter sleep onset de¢ned as the ¢rst epoch of stage 1 were
Fig. 2. Di¡erences between the percentages of variance (R2 coe¤cients) explained by multiple linear regression models on thetime course of EEG power values within single-Hz bins with time (or time2, as in the case of the 8^13-Hz frequency range ofthe transition in which the occurrence of the ¢rst epoch of stage 2 was the criterion for scoring sleep onset; see also Fig. 1b)as the explaining variable. Values refer to the Hz-by-Hz di¡erence between the R2 coe¤cients obtained when the sleep onsetcriterion was the ¢rst epoch of stage 2 minus those obtained when it was the ¢rst occurrence of stage 1. Positive valuesindicate higher percentages of variance explained by multiple linear regressions when the sleep onset criterion was the ¢rst
epoch of stage 2.
NSC 5150 25-10-01 Cyaan Magenta Geel Zwart
L. De Gennaro et al.4
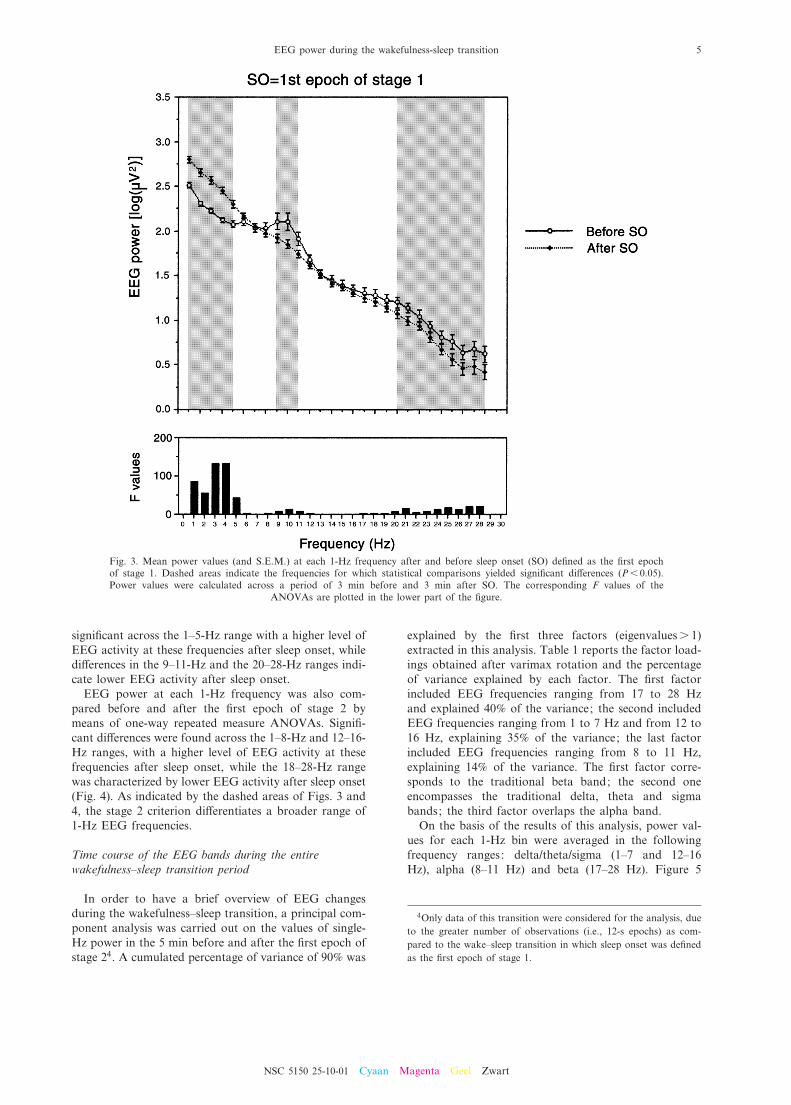
signi¢cant across the 1^5-Hz range with a higher level ofEEG activity at these frequencies after sleep onset, whiledi¡erences in the 9^11-Hz and the 20^28-Hz ranges indi-cate lower EEG activity after sleep onset.
EEG power at each 1-Hz frequency was also com-pared before and after the ¢rst epoch of stage 2 bymeans of one-way repeated measure ANOVAs. Signi¢-cant di¡erences were found across the 1^8-Hz and 12^16-Hz ranges, with a higher level of EEG activity at thesefrequencies after sleep onset, while the 18^28-Hz rangewas characterized by lower EEG activity after sleep onset(Fig. 4). As indicated by the dashed areas of Figs. 3 and4, the stage 2 criterion di¡erentiates a broader range of1-Hz EEG frequencies.
Time course of the EEG bands during the entirewakefulness^sleep transition period
In order to have a brief overview of EEG changesduring the wakefulness^sleep transition, a principal com-ponent analysis was carried out on the values of single-Hz power in the 5 min before and after the ¢rst epoch ofstage 24. A cumulated percentage of variance of 90% was
explained by the ¢rst three factors (eigenvaluess 1)extracted in this analysis. Table 1 reports the factor load-ings obtained after varimax rotation and the percentageof variance explained by each factor. The ¢rst factorincluded EEG frequencies ranging from 17 to 28 Hzand explained 40% of the variance; the second includedEEG frequencies ranging from 1 to 7 Hz and from 12 to16 Hz, explaining 35% of the variance; the last factorincluded EEG frequencies ranging from 8 to 11 Hz,explaining 14% of the variance. The ¢rst factor corre-sponds to the traditional beta band; the second oneencompasses the traditional delta, theta and sigmabands; the third factor overlaps the alpha band.
On the basis of the results of this analysis, power val-ues for each 1-Hz bin were averaged in the followingfrequency ranges: delta/theta/sigma (1^7 and 12^16Hz), alpha (8^11 Hz) and beta (17^28 Hz). Figure 5
Fig. 3. Mean power values (and S.E.M.) at each 1-Hz frequency after and before sleep onset (SO) de¢ned as the ¢rst epochof stage 1. Dashed areas indicate the frequencies for which statistical comparisons yielded signi¢cant di¡erences (P6 0.05).Power values were calculated across a period of 3 min before and 3 min after SO. The corresponding F values of the
ANOVAs are plotted in the lower part of the ¢gure.
4Only data of this transition were considered for the analysis, dueto the greater number of observations (i.e., 12-s epochs) as com-pared to the wake^sleep transition in which sleep onset was de¢nedas the ¢rst epoch of stage 1.
NSC 5150 25-10-01 Cyaan Magenta Geel Zwart
EEG power during the wakefulness-sleep transition 5

reports the time course of the power values within thesebands throughout the wakefulness^sleep transition. TheEEG frequencies grouped within factor 2 progressivelyincreased and best ¢tted a ¢rst-order polynomial curvewhich explained 88% of the variance (Table 2). Thealpha frequency range decreased from the beginning ofthe transition until the ¢rst epoch of stage 2 and thenslightly increased. Table 2 shows that these time courseswere best ¢tted by a second-order polynomial curve;74% of the variance was explained by the regression.Finally, the beta frequency range best ¢tted a ¢rst-order polynomial curve with a decrease during the con-
sidered transition period (82% of the variance wasexplained by the regression model).
Plotting the same values after a Z score transforma-tion (Fig. 6) clearly shows that during wakefulness(0^180 s) the main EEG changes concern the decreasingactivity in the alpha and beta frequency ranges, whilefrequencies grouped within factor 2 show their lowestactivity. Stage 1 (180^420 s) is characterized by the low-est level of EEG activity in the alpha range, by a furtherslight decreasing trend in the beta range and by anincreasing activity in the frequencies grouped in factor2. Stage 2 (420^720 s) shows the continuing increase of
Fig. 4. Mean EEG power (and S.E.M.) at each 1-Hz frequency after and before sleep onset (SO) de¢ned as the ¢rst epoch ofstage 2. Dashed areas indicate the frequencies for which statistical comparisons yielded signi¢cant di¡erences (P6 0.05).Power values were calculated across a period of 5 min before and 5 min after SO. The corresponding F values of the
ANOVAs are plotted in the lower part of the ¢gure.
Table 2. Regression equations best ¢tting variations of EEG power values during the entire wakefulness^sleep transition period
EEG band y R2 F
Factor 1 (beta frequency range) 1.040235.826434x 0.786 208.98Factor 2 (delta/theta/sigma frequency ranges) 1.7989+8.760534x 0.881 423.91Factor 3 (alpha frequency range) 2.196831.702433x+2.331036x2 0.742 159.23
The three EEG frequency ranges (factors 1^3), grouped by principal component analysis, have been considered. The table reports linear regres-sion equations for the delta/theta/sigma and beta frequency ranges, while the alpha frequency range was best ¢tted by a second order poly-nomial curve. The table also reports the percentage of variance explained by the regressions (R2) and the F values (F).
NSC 5150 25-10-01 Cyaan Magenta Geel Zwart
L. De Gennaro et al.6

frequencies included in factor 2 and a higher activity (ascompared to stage 1) in the alpha range resembling thedelta/theta/sigma increase; the activity in the beta fre-quency range reaches its lowest point.
Comparison of the two sleep onset criteria: changes in theEEG bands
The capacity of the two sleep onset criteria to detectsigni¢cant changes in a greater number of EEG bandsas a function of the sleep onset point was assessed bymeans of two MANOVAs, comparing EEG powerwithin the delta/theta/sigma, alpha and beta bands beforeand after the ¢rst epoch of stage 1 and stage 2, respec-
tively. When sleep onset de¢nition coincides with stage 1,the level of EEG activity across these bands is signi¢-cantly di¡erent before vs. after the `switch' point(Wilk's Lambda3;26 = 0.1108; Rao's R3;26 = 69.53;P6 0.00000001) with 89% of explained variance (canon-ical r = 0.94; R2 = 0.89). Univariate comparisons (Table 3)show that all the EEG bands signi¢cantly change: sleepis characterized by higher EEG activity in the delta/theta/sigma ranges, and lower in the alpha and beta ranges(Fig. 7). When sleep coincides with stage 2, the level ofEEG activity across these bands is also signi¢cantlydi¡erent before vs. after the `switch' point(Wilk's Lambda3;46 = 0.0850; Rao's R3;46 = 157.88;P6 0.00000001) with 92% of explained variance (canon-
Fig. 5. Time course of EEG bands during the wakefulness^sleep transition. This 12-min period takes into account a 3-mininterval before the ¢rst epoch of stage 1 (WAKEFULNESS), a 4-min interval after the ¢rst epoch of stage 1 (STAGE 1) and5 min after the ¢rst epoch of stage 2 (STAGE 2). The distance between the ¢rst epoch of stage 1 and stage 2 has beenestimated on the basis of the mean di¡erence between stage 2 and stage 1 latency. Mean stage 1 latency was 14.41 min(S.E.M. 2.18) and mean stage 2 latency was 18.53 min (S.E.M. 2.44); mean di¡erence between latency of stage 2 minuslatency of stage 1 was 4.12 min (S.E.M. 0.99). Due to the oscillating pattern of wakefulness (W) and stage 1 (S1) after the¢rst occurrence of S1 and to some EEG arousal interrupting stage 2 (S2) continuity after the ¢rst occurrence of this stage,intervals after the ¢rst occurrence of S1 and intervals before and after the ¢rst occurrence of stage 2 may have been non-homogeneous with respect to the stage. In actual fact, the interval after the ¢rst occurrence of S1 was mainly characterizedby this stage (S1 = 99.60%, S.E.M. 0.39; W = 0.40%, S.E.M. 0.39); similarly the interval after the ¢rst occurrence of S2 washomogeneous (S2 = 91.54, S.E.M. 3.12; S1 = 6.68%, S.E.M. 2.38; W = 1.78%, S.E.M. 1.42). The only interval with a mixedpattern of stages was the one before the ¢rst occurrence of S2 (W = 40.01%, S.E.M. 4.78; S1 = 59.99%, S.E.M. 4.78). There-fore, EEG power for the interval after the ¢rst occurrence of S1 was based only on the 12-s epochs scored as S1. The verticaldotted lines respectively indicate the ¢rst epoch of stage 1 and of stage 2. The ¢gure reports EEG power [expressed inlog(WV2)] calculated respectively for delta/theta/sigma (1^7- and 12^16-Hz), alpha (8^11-Hz), beta (17^28-Hz) EEG bands,
and the best ¢tting slope for each frequency band. S.E.M. are also reported.
Table 3. Results of univariate comparisons (ANOVAs) of power values in the EEG frequencies (grouped according to principal componentanalysis) before and after sleep onset (SO), de¢ned as a function of the ¢rst epoch of stage 1 or stage 2, respectively
SO = 1st epoch of stage 1 SO = 1st epoch of stage 2
F1;28 P F1;48 P
Delta/theta/sigma 52.04 0.0000001 450.27 6 0.00000001Alpha 72.95 6 0.00000001 5.98 0.02Beta 53.54 0.0000001 68.5725 6 0.00000001
NSC 5150 25-10-01 Cyaan Magenta Geel Zwart
EEG power during the wakefulness-sleep transition 7

ical r = 0.96; R2 = 0.92). Univariate comparisons (Table 3)again highlight that all the EEG bands show signi¢cantchanges: higher activity after stage 2 onset in the delta/theta/sigma and alpha ranges, and a further decrease ofbeta power (Fig. 7).
DISCUSSION
Sleep onset was investigated by means of a quantita-tive approach by considering EEG powers in 1-Hz binsand by comparing two sleep onset de¢nitions: (a) the¢rst epoch of stage 1, characterized by a drop in alphaactivity to less than 50% of the recording epoch, replacedby a relatively low-voltage, mixed-frequency activity or(b) the ¢rst epoch of stage 2, characterized by theappearance of a sleep spindle longer than 0.5 s or by aK-complex.
The analysis of the time course of single-Hz EEGpower during the wakefulness^sleep transition revealedthat the 3-min intervals preceding and following the¢rst epoch of stage 1 were characterized by a linearincrease in the 1^6-Hz range and by a linear decreasein the 9^12- and 16^28-Hz ranges. The transition tostage 2 showed a linear increases in the 1^7- and14^15-Hz ranges and a linear decrease in the 18^28-Hzrange. The power values of EEG frequencies between8 and 12 Hz ¢tted a second-order polynomial curve,decreasing until the end of stage 1, and then starting toincrease again; the 13-Hz bin did not change during theperiod after the ¢rst occurrence of stage 1 and began toincrease just after the ¢rst epoch of stage 2. As a whole,multiple regression models best predicted the time courseof EEG power when the ¢rst occurrence of stage 2 wasthe criterion for de¢ning sleep onset, explaining higherpercentages of variance.
Comparisons of the mean single-Hz activity before
and after each of the two `switch' points (Figs. 2 and3) revealed a lower EEG activity in the 9^11-Hz and20^28-Hz bins and a higher activity in the 1^5-Hz binsafter the beginning of stage 1. On the other hand, de¢n-ing sleep onset on the basis of the appearance of the ¢rstK-complex or sleep spindle (i.e., the ¢rst epoch of stage2) allowed us to detect a larger number of signi¢cantdi¡erences in the comparison of time intervals precedingand following this `switch' point: signi¢cantly higherpower values after stage 2 onset were found in the 1^8-Hz and 12^16-Hz bins and lower powers in the 18^28-Hzbins. In other words, the two sleep onset de¢nitions seemto di¡er in their ability to discriminate sleep and wake-fulness as a function of the di¡erent frequency bins.However, some caution should be used in this interpre-tation since the increased number of signi¢cant bins mayalso be a function of the di¡erent time intervals contrib-uting to the spectra (i.e., 3+3 min vs. 5+5 min).
The only published study assessing single-Hz EEGactivity from 3 to 11 Hz during the wakefulness^sleeptransition reported the largest increases in EEG powerat 3 and 4 Hz and the largest decreases at 9 and 10 Hzduring the ¢rst minute of stage 1 sleep (Wright et al.,1995). Our results on the wakefulness^stage 1 transition(shown in Fig. 3) con¢rmed this ¢nding, since the highestpercentage of variance was explained by changes as afunction of the sleep onset point in EEG power at 3and 4 Hz and at 9, 10 and 11 Hz, respectively. In fact,the largest increase of EEG power after stage 1 onset wasat 3^4 Hz (respectively, a 15.25% and 15.56% increase),while the largest decrease was at 9^11 Hz (respectively, a9.00%, 11.90% and 8.90% decrease) (Fig. 3).
The lack of signi¢cant di¡erences in EEG power at6 and 7 Hz when sleep onset is de¢ned by the ¢rst occur-rence of stage 1 (Fig. 3) deserves some comment since theincrease in the theta range is a well-known feature ofstage 1. On the one hand, it should be noted that the
Fig. 6. Time course of EEG bands during the wakefulness^sleep transition. The ¢gure reports power values (expressed in Zscores) respectively calculated across delta/theta/sigma (1^7- and 12^16-Hz), alpha (8^11-Hz), beta (17^28-Hz) EEG bands,
and the best ¢tting curve for each frequency band.
NSC 5150 25-10-01 Cyaan Magenta Geel Zwart
L. De Gennaro et al.8

signi¢cant increases at the 4- and 5-Hz frequency5afterstage 1 onset indeed con¢rm this prediction; on theother, the only study assessing single-Hz EEG activityduring the ¢rst minute of stage 1 sleep showed system-atically smaller increases in power at 5, 6, and 7 Hz(Wright et al., 1995) as compared to the adjacent fre-quency bins. Nevertheless, it could be argued that theabsence of signi¢cant increases within the 6^7-Hz rangeis due to the fact that stage 1 is not consolidated enoughand the EEG may still present some reoccurring epochsof wakefulness. For this reason, EEG power values inthe 1-min interval after the ¢rst occurrence of stage 1were re-calculated, excluding epochs scored as wakeful-ness, and then compared to the corresponding powervalues in the 1-min interval preceding the `switch'point, across the 5^9-Hz frequency range. Also in thiscase, while stage 1 onset was marked by a signi¢cantincrease of power at 5 Hz (F = 25.28; P = 0.001) and bya decrease at 9 Hz (F = 25.25; P = 0.001), the di¡erenceswere not signi¢cant at 6 Hz (F = 3.70; P = 0.09), at 7 Hz(F = 0.0003; P = 0.98), and at 8 Hz (F = 2.55; P = 0.15).The only available conclusion at this time is that thesingle-Hz analysis points to an increase within the thetafrequency range after stage 1 onset as limited to the 4^5-Hz frequency bin.
Grouping single-Hz activities on the basis of principalcomponent analysis allowed us to extract three factors:delta/theta/sigma (1^7- and 12^16-Hz), alpha (8^11-Hz)and beta (17^28-Hz) bands, respectively. Their timecourse throughout the transition period pointed to linearchanges for delta/theta/sigma and beta bands, con¢rming
the expected increase in frequencies coupled to the EEGsynchronization process and the expected decrease infaster EEG frequencies. As regards the temporal evolu-tion of the delta/theta/sigma frequency range, its trendstrictly corresponds to the one reported by Morikawa etal. (1997) who averaged EEG recordings of 12 subjectsfalling asleep. The time course of delta (2.5^3.5-Hz) andtheta (4.0^7.5-Hz) activity recorded from the C3 deriva-tion during the 5 min preceding and 24 min followingstage 1 onset indicates a minimum steady level of activityduring the wake interval. Slow EEG activity started toincrease about 1 min before stage 1 onset, showing anabrupt enhancement lasting about 5 min, and then a lesssteep increment (their Figs. 1 and 2). In our results,shown in Fig. 6, the delta/theta/sigma frequency rangestarted to increase about 36 s before stage 1 onset, risingsteeply for 5 min ^ the largest enhancement coincidingwith stage 2 onset ^ and then showing a less steepincrease about 24 s after stage 2 onset. Similar temporalchanges in the traditional delta (0.4^3.9-Hz) and beta(14.7^30-Hz) bands, beginning just before the start ofstage 1 and ending just after the start of stage 2, havealso been reported by others (Merica and Gaillard,1992).
At variance with delta/theta/sigma and beta frequencyranges, which had predictable changes, the quadratictrend for the alpha band needs to be explained. Whilethe progressive decrease in alpha activity during thewake preceding stage 1 is well-known (and leads to thestandard scoring of stage 1), its increase after the onsetof stage 2 seems to support a recent re-examination ofthe psychophysiological literature suggesting the exis-tence of a di¡erent alpha activity associated with sleep-maintaining processes (Pivik and Harman, 1995). Inspec-tion of Fig. 6, in which EEG changes are plotted in termsof standard scores of power values, shows that the stage
Fig. 7. Mean EEG power [expressed in log(WV2)] respectively calculated across delta/theta/sigma (1^7-and 12^16-Hz), alpha(8^11-Hz) and beta (17^28-Hz) EEG bands before and after sleep onset (SO) de¢ned by the ¢rst epoch of stage 1 (left panel)and by the ¢rst epoch of stage 2 (right panel). S.E.M. are also reported. Results of a MANOVA and of univariate compar-
isons on these power values are reported in the text and in Table 3, respectively.
5Since the `true' bounds of these frequency bins are 4.00^4.75 Hzand 5.00^5.75 Hz, these EEG power should be considered within thetheta range.
NSC 5150 25-10-01 Cyaan Magenta Geel Zwart
EEG power during the wakefulness-sleep transition 9

1 interval appears as a `no man's land' in which the EEGsynchronization process is building up and the alpharange of EEG frequencies is shifting its activity towarda progressive enhancement. This interpretation ofchanges in macroscopic surface EEG activity is also sup-ported by ¢ndings obtained by intracellular recordingsthat shed light on the functional role played by oscilla-tions in the 7^14-Hz range during the EEG synchroniza-tion process, describing them as a unitary phenomenonproduced by thalamic reticular and thalamocortical cellswhich are in turn driven by the depolarizing componentof the cortically generated slow (0.6^1-Hz) oscillations(Steriade and Amzica, 1998).
In view of this, wakefulness before falling asleep iselectrophysiologically characterized by the abruptdecrease in alpha and beta EEG activity; stage 1 ismarked by the beginning of synchronized activity,expressed by the increasing level of activity in thedelta/theta/sigma ranges, by the disappearance of alpharhythm and by a continuing decrease in the beta band;stage 2 shows a uniformly increasing trend across the1^16-Hz frequency range, while EEG power within thefaster frequency range reaches its lowest point. From theviewpoint of macroscopic electrophysiology, this `simpli-¢cation' of EEG changes after stage 2 onset could beconsidered the most solid phenomenon of sleep onset.Moreover, this electroencephalographic `simpli¢cation'is consistent with neurophysiological evidence whichhas reduced the multiplicity of EEG rhythms to a fewbasic cellular operations, providing explanations of themechanisms underlying these rhythms and ultimatelyshedding light on their functional role (Steriade, 1999,2000).
As regards the comparison of the two sleep onset def-initions, the set of variables extracted by the principalcomponent analysis shows a similar ability to discrimi-nate EEG activity preceding and following sleep onsetde¢ned by both criteria, even though a higher percentageof variance (higher canonical r coe¤cients) is explainedby using the ¢rst epoch of stage 2 to de¢ne sleep onset.However, at least two other ¢ndings suggest the appear-ance in EEG recordings of a sleep spindle or a K-com-plex as the `true' boundary between wakefulness andsleep: (1) stage 1 appears as an intermediate zone inthe synchronization process in which alpha power isshifting its functional meaning; (2) linear regressionsbest predicted the time course of EEG power when the¢rst occurrence of stage 2 was the criterion for de¢ningsleep onset (higher percentages of explained variance).
Even though the EEG is the most commonly usedmeasure to detect di¡erences between wakefulness andsleep, the sleep onset process has also been evaluatedby means of behavioral measures (e.g., Ogilvie andWilkinson, 1984; Casagrande et al., 1995). In these stud-ies the onset of sleep has been described by a decrease inresponsiveness to external sensory stimuli (auditory stim-uli) or by an increase in duration of time intervalsbetween consecutive self-generated motor responses in a¢nger-tapping task, respectively. In both cases the failure
to respond marks the wakefulness^sleep transition, de¢n-ing a `behavioral sleep onset', that coincides in mostsubjects with late stage 1/early stage 2 EEG. The com-parison of EEG power within all standard frequencybands (delta, theta, alpha, sigma, beta) between intervalspreceding and following the `behavioral sleep onset'showed increases across all bands (Ogilvie et al., 1991).Interestingly, alpha power decreased as responsivenessslowed, increasing subsequently with the cessation ofbehavioral responses (Ogilvie et al., 1991). This behav-ioral trend strongly resembles the current results showinga progressive decrease in the alpha frequency rangeduring wakefulness, a minimum point during stage 1,and a subsequent increase during stage 2.
However, comparisons between behavioral and EEGindices of sleep onset should be considered with caution,since there is evidence in monkeys that sleep asynchro-nously develops in cortical areas (Pigarev et al., 1997)and since the alpha rhythm spreads anteriorly as thetransition progresses and several anterior areas ¢rst syn-chronize EEG activity (De Gennaro et al., 2001). If dif-ferent cortical areas show a di¡erent time evolution ofEEG power during the transition, it is not so unexpectedthat behavioral and EEG-based de¢nitions of sleep onset(scored on the standard central scalp location) may notcoincide. For example, an auditory reaction-time task(e.g., Ogilvie and Wilkinson, 1984), providing informa-tion on the activity of temporal and/or motor corticalareas (sensorial or motor components of the task) or a¢nger-tapping task (e.g., Casagrande et al., 1997), sensi-tive to the activation of motor and/or premotor areas,will more directly express the activation/deactivation ofthese areas. In this view, the behavioral changes observedshould be compared to the concomitant changes in EEGpower at the same brain sites.
Summarising, the uniformly increasing EEG poweracross the 1^16-Hz frequency range after stage 2 onset,the higher percentages of variance explained by linearregressions, the greater ability of stage 2 onset in di¡er-entiating sleep from wakefulness at a greater number ofsingle-Hz bins (particularly in the 6^8-Hz range), and thetime course of EEG changes during stage 1 when alphapower shifts its functional meaning all go to show thatthe start of stage 2 is the most reliable boundary betweenwakefulness and sleep.
Spectral changes documented in the present study havetheoretical implications for an understanding of the EEGmicrostructure of the sleep onset process and may alsobe useful for clinicians. In fact, the increase in EEGpower in the delta/theta/sigma frequency range or thedescending and ascending trend for alpha activity appearto be a more informative and valid estimate of sleepinessthan the visually scored latency to sleep onset (MultipleSleep Latency Test), which is the standard criterion forassessing sleepiness in clinical practice.
AcknowledgementsöThanks to Frank Amodeo for his languagerevision.
NSC 5150 25-10-01 Cyaan Magenta Geel Zwart
L. De Gennaro et al.10

REFERENCES
Burgess, H.J., Kleiman, J., Trinder, J., 1999. Cardiac activity during sleep onset. Psychophysiology 36, 298^306.Carskadon, M.A., Dement, W., Mitler, M., Roth, T., Westbrook, P., Keenan, S., 1986. Guidelines for the multiple sleep latency test. Sleep 9, 519^
524.Casagrande, M., De Gennaro, L., Braibanti, P., Violani, C., Bertini, M., 1992. Discontinuity of the sleep onset process. J. Sleep Res. 3 (Suppl. 1),
37.Casagrande, M., De Gennaro, L., Violani, C., Braibanti, P., Bertini, M., 1997. A ¢nger-tapping task and a reaction time task as behavioral
measures of the transition from wakefulness to sleep: which task interferes less with the sleep onset process. Sleep 20, 301^312.Casagrande, M., Violani, C., De Gennaro, L., Braibanti, P., Bertini, M., 1995. Which hemisphere falls asleep ¢rst? Neuropsychologia 33, 815^822.Davis, H., Davis, P.A., Loomis, A.L., Harvey, E.N., Hobart, G., 1937. Changes in human brain potentials during the onset of sleep. Science 86,
448^450.De Gennaro, L., Ferrara, M., Curcio, G., Cristiani, R., 2001. Antero-posterior EEG changes during the wakefulness-sleep transition. Clin.
Neurophysiol. 112, 1901^1911.De Gennaro, L., Ferrara, M., Ferlazzo, F., Bertini, M., 2000. Slow eye movements and EEG power spectra during wakefulness-sleep transition.
Clin. Neurophysiol. 111, 3007^3015.Dement, W.C., Kleitman, N., 1957. The relation of eye movements during sleep to dream activity: an objective method for the study of dreaming.
J. Exp. Psychol. 53, 339^346.Hauri, P., Good, R., 1975. Frontalis muscle tension and sleep onset. Sleep Res. 4, 222.Hori, T., 1982. Electrodermal and electro-oculographic activity in a hypnagogic state. Psychophysiology 19, 668^672.Johnson, L.C., 1975. Sleep. In: Venable, P.H., Christie, M.J. (Eds.), Research in Psychophysiology. Wiley, New York, pp. 125^152.Maquet, P., 2000. Functional neuroimaging of normal human sleep by positron emission tomography. J. Sleep Res. 9, 207^231.Merica, H., Gaillard, J.M., 1992. The EEG of the sleep onset period in insomnia: A discriminant analysis. Physiol. Behav. 52, 199^204.Morikawa, T., Hayashi, M., Hori, T., 1997. Auto power and coherence analysis of delta-theta band EEG during the waking-sleeping transition
period. Electroencephalogr. Clin. Neurophysiol. 103, 633^641.Ogilvie, R.D., Simons, I.A., Kuderian, R.H., MacDonald, T., Rustember, J., 1991. Behavioral, event-related potential, and EEG/FFT changes at
sleep onset. Psychophysiology 28, 54^64.Ogilvie, R.D., Wilkinson, R.T., 1984. The detection of sleep onset: Behavioral and physiological convergence. Psychophysiology 21, 510^520.Ogilvie, R.D., Wilkinson, R.T., Allison, S., 1989. The detection of sleep onset: behavioral, physiological, and subjective convergence. Sleep 12,
458^474.Pigarev, I., Northdurft, H., Kastner, S., 1997. Evidence for asynchronous development of sleep in cortical areas. Neuroreport 8, 2557^2560.Pivik, R.T., Harman, K., 1995. A re-conceptualization of EEG alpha activity as an index of arousal during sleep: all alpha is not equal. J. Sleep
Res. 4, 131^137.Rechtscha¡en, A., Kales, A. (Eds.), 1968. A Manual of Standardized Terminology: Techniques and Scoring System for Sleep Stages of Human
subjects. Brain Information Service/Brain Research Institute, Los Angeles, CA.Santamaria, J., Chiappa, K.H., 1987. The EEG of drowsiness in normal adults. J. Clin. Neurophysiol. 4, 327^382.Spielman, A.J., Zhang, G., Yang, C.M., D'Ambrosio, P., Serizawa, S., Nagata, M., von Gizycki, H., D'Alfano, R.R., 2000. Intracerebral
hemodynamics probed by near infrared spectroscopy in the transition between wakefulness and sleep. Brain Res. 866, 313^325.Steriade, M., 1999. Coherent oscillations and short-term plasticity in corticothalamic networks. Trends Neurosci. 22, 337^345.Steriade, M., 2000. Corticothalamic resonance, states of vigilance and mentation. Neuroscience 101, 243^276.Steriade, M., Amzica, F., 1998. Coalescence of sleep rhythms and their chronology in corticothalamic networks. Sleep Res. Online 1, 1^10.Van Den Heuvel, C.J., Noone, J.T., Lushington, K., Dawson, D., 1998. Changes in sleepines and body temperature precede nocturnal sleep onset:
Evidence from a polysomnographic study in young men. J. Sleep Res. 7, 159^166.Webb, W.B., 1979. The natural onset of sleep. In: Popoviciu, L., Asgian, B., Badiu, G. (Eds.), Sleep 1978. Karger, Basel, pp. 19^23.Wright, K.P., Jr, Badia, P., Wauquier, A., 1995. Topographical and temporal patterns of brain activity during the transition from wakefulness to
sleep. Sleep 18, 880^889.
(Accepted 23 July 2001)
NSC 5150 25-10-01 Cyaan Magenta Geel Zwart
EEG power during the wakefulness-sleep transition 11
Copyright © 2022 FDOKUMEN