ASSESSMENT OF HEAVY METAL CONTAMINATION OF AGRICULTURAL SOIL AROUND DHAKA EXPORT PROCESSING ZONE...
26
This chapter was originally published under the Creative Commons Attribution License. Rahman SH, Khanam D, Adyel TM, Islam MS, Ahsan MA, and Akbor MA. Assessment of Heavy Metal Contamina- tion of Agricultural Soil around Dhaka Export Processing Zone (DEPZ), Bangladesh: Implication of Seasonal Variation and Indices. Applied Sciences 2 (2012), 584-601. doi:10.3390/app2030584. ASSESSMENT OF HEAVY METAL CONTAMINATION OF AGRICULTURAL SOIL AROUND DHAKA EXPORT PROCESSING ZONE (DEPZ), BANGLADESH: IMPLICATION OF SEASONAL VARIATION AND INDICES SYED HAFIZUR RAHMAN, DILARA KHANAM, TANVEER MEHEDI ADYEL, MOHAMMAD SHAHIDUL ISLAM, MOHAMMAD AMINUL AHSAN, AND MOHAMMAD AHEDUL AKBO CHAPTER 9 9.1 INTRODUCTION The role of heavy and trace elements in the soil system is increasingly becoming an issue of global concern at private as well as governmental levels, especially as soil constitutes a crucial component of rural and urban environments [1], and can be considered as a very important “ecological crossroad” in the landscape [2]. Agricultural soil contamination with heavy metals through the repeated use of untreated or poorly treated wastewater from industrial establishments and application of chemical fertilizers and pesticides is one of the most severe ecological problems in Bangladesh. Although some trace elements are essential in plant nutrition, plants grow- © 2014 Apple Academic Press, Inc.
Transcript of ASSESSMENT OF HEAVY METAL CONTAMINATION OF AGRICULTURAL SOIL AROUND DHAKA EXPORT PROCESSING ZONE...
This chapter was originally published under the Creative Commons Attribution License. Rahman SH, Khanam D, Adyel TM, Islam MS, Ahsan MA, and Akbor MA. Assessment of Heavy Metal Contamina-tion of Agricultural Soil around Dhaka Export Processing Zone (DEPZ), Bangladesh: Implication of Seasonal Variation and Indices. Applied Sciences 2 (2012), 584-601. doi:10.3390/app2030584.
ASSESSMENT OF HEAVY METAL CONTAMINATION OF AGRICULTURAL SOIL AROUND DHAKA EXPORT PROCESSING ZONE (DEPZ), BANGLADESH: IMPLICATION OF SEASONAL VARIATION AND INDICES
SYED HAFIZUR RAHMAN, DILARA KHANAM, TANVEER MEHEDI ADYEL, MOHAMMAD SHAHIDUL ISLAM, MOHAMMAD AMINUL AHSAN, AND MOHAMMAD AHEDUL AKBO
CHAPTER 9
9.1 INTRODUCTION
The role of heavy and trace elements in the soil system is increasingly becoming an issue of global concern at private as well as governmental levels, especially as soil constitutes a crucial component of rural and urban environments [1], and can be considered as a very important “ecological crossroad” in the landscape [2]. Agricultural soil contamination with heavy metals through the repeated use of untreated or poorly treated wastewater from industrial establishments and application of chemical fertilizers and pesticides is one of the most severe ecological problems in Bangladesh. Although some trace elements are essential in plant nutrition, plants grow-
© 2014 Apple Academic Press, Inc.
222 Heavy Metal Contamination of Water and Soil
ing in the close vicinity of industrial areas display increased concentration of heavy metals, serving in many cases as biomonitors of pollution loads [3]. Vegetables cultivated in soils polluted with toxic and heavy metals take up such metals and accumulate them in their edible and non-edible parts in quantities high enough to cause clinical problems both to animals and human beings consuming these metal-rich plants as there is no good mechanism for their elimination from the human body [4–6]. Toxic metals are known to have serious health implications, including carcinogenesis induced tumor promotion, and hence the growing consciousness about the health risks associated with environmental chemicals has brought a major shift in global concern towards prevention of heavy metal accumulation in soil, water and vegetables [7,8]. Heavy metals and trace elements are also a matter of concern due to their non biodegradable nature and long biological half-lives. Wastewater from industries or other sources carries appreciable amounts of toxic heavy metals such as Cd, Cu, Zn, Cr, Ni, Pb, and Mn in surface soil which create a problem for safe rational utiliza-tion of agricultural soil [9–13]. Long-term use of industrial or municipal wastewater in irrigation is known to have a significant contribution to the content of trace and heavy elements such as Cd, Cu, Zn, Cr, Ni, Pb, and Mn in surface soil [12]. As a result, excessive accumulation of trace el-ements in agricultural soils through wastewater irrigation may not only result in soil contamination but also affect food quality and safety [14–16].
The Dhaka Export Processing Zone (DEPZ) being the 2nd EPZ and the largest industrial belt of Bangladesh at present houses 92 industrial units which are categorically the leading pollution creators. These indus-trial units include cap/accessories/garments; textile/knitting plastic goods; footwear/leather goods; metal products; electronic goods; paper products; chemicals and fertilizers and miscellaneous products [17,18]. Industrial activities discharge untreated or poorly treated industrial wastewater, ef-fl uent and even sludge into the surrounding environment that can decrease soil quality by increasing concentrations of pollutants such as heavy met-als, resulting in adverse effects on macrophytes, soil fauna and human health [7,8,19,20]. So it is a nerve-racking issue to fi nd out the present status of toxic and heavy metals in this surface soil, redress the affected subsequent environmental problems and adopt a future mitigation strate-gy. The present work is aimed at investigating seasonal and spatial variation
© 2014 Apple Academic Press, Inc.
Dow
nloa
ded
by [
Uni
vers
ity o
f W
este
rn A
ustr
alia
] at
02:
41 0
8 A
pril
2014
Assessment of Heavy Metal Contamination of Agricultural Soil 223
of the contamination levels of different heavy metals (Fe, As, Mn, Cu, Ni, Pb, Zn, Hg, Cr, Cd) in the agricultural soil around DEPZ using different indices such as the index of geoaccumulation, contamination factor, de-gree of contamination, and the pollution load index. This approach would help adopt an effective effl uent management strategy towards control over enhanced metal levels with recycling of effl uents for toxic metal separa-tion and soil remediation and reclamation. The data generated in this work may help to work out an effl uent management strategy towards control over effective treatment of the DEPZ discharges in terms of toxic and heavy metal contents.
9.2 MATERIALS AND METHODS
9.2.1 GEOLOGICAL AND HYDROLOGICAL SETTING OF THE STUDY AREA
DEPZ, located at about 35 km south-east of Dhaka, the capital city of Ban-gladesh, was selected as the study area in the present research work. This area belongs to Dhamsona Union under Savar Upazila of Dhaka District. The area is situated at the southwestern fringe of a Pleistocene terrace named the Madhupur Tract, an elevated landscape distinct from the sur-rounding Fluvio-deltaic plains by the Ganges, Brahmaputra and Meghna River. The major geomorphic units of the area are: the high land, the low lands or floodplains, depressions, swamps, marshes and abandoned chan-nels. Soil of the Modhupur Formation, in general reddish brown in color, contains pre-existing paleosol materials. Hydrology of the study area is governed by rainfall intensity and distribution, permanent or ephemeral water bodies and rivers or canals. The average rainfall distribution pattern in various months shows a distinct conformation with the climatic pattern prevailing, with strong Monsoon influence. The average annual rainfall in dry and wet season in the area is about 25 and 380 mm, respectively. The Bansi-Daleshwari and Turag River comprise the drainage network of the area-Bansi on the west and Turag away on the east.
© 2014 Apple Academic Press, Inc.
Dow
nloa
ded
by [
Uni
vers
ity o
f W
este
rn A
ustr
alia
] at
02:
41 0
8 A
pril
2014
224 Heavy Metal Contamination of Water and Soil
9.2.2 SAMPLING AND ANALYTICAL PROCEDURE
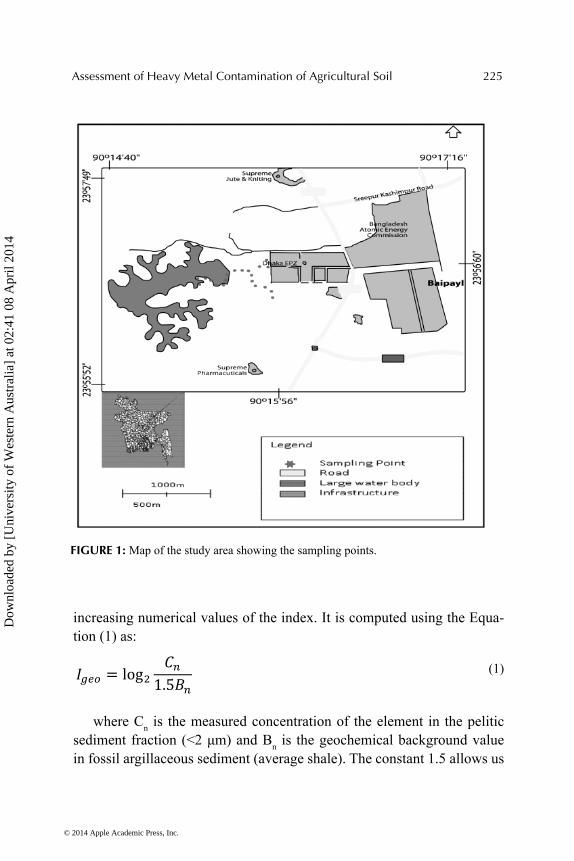
Agricultural soil samples were collected during February 2010 to April 2011 from the surface layer (15–20 cm) of soil with a stainless steel Ek-man Grab Sampler from twenty (20) different locations adjacent to DEPZ (Figure 1) in two different seasons—dry and wet season. The sampler was inspected for possible cross-contamination and cleaned with ambient wa-ter for individual sample collection. The difference from one sampling point to another was approximately 100 m. About 250–300 g of the soil was sampled from the central part of the grab sampler by avoiding contact with the inside materials of the sampler and transferred to a pre-cleaned plastic container. Collected soil samples were air dried for several days over pre-cleaned Pyrex petry dishes. Then 2–3 g dry soil samples were digested in about 15 mL of aqua-regia (HCL:HNO3 = 3:1) for approxi-mately 4–5 hours using a hotplate maintaining a heating temperature of approximately 110 °C. The samples were next placed in a 100 mL Pyrex glass beaker and diluted with distilled water up to 50 mL. The solution was filtered and the filtrates were analyzed in the Analytical Research Divi-sion, BCSIR Laboratories, Dhaka by Atomic Absorption Spectrophotom-eter (AA-6401 F, Shimadzu, Japan). The working standard solutions for each metal were prepared before every analysis. The analytical procedures were verified with National Institute of Standards and Technology (NIST) traceable certified reference standards. Concentrations of Fe, Mn, Cu, Ni, Zn, Cr and Cd were measured by an air acetylene flame AAS, with As determined by hydride vapor generation AAS, Hg by hydride generation with cold vapor AAS and Pb by graphite furnace AAS.
9.2.3 INDEX OF GEOACCUMULATION
The index of geoaccumulation (Igeo) actually enables the assessment of contamination by comparing the current and pre-industrial concentrations originally used with bottom sediments [21]; it can also be applied to the assessment of soil contamination. The method assesses the degree of metal pollution in terms of seven enrichment classes (Table 1) based on the
© 2014 Apple Academic Press, Inc.
Dow
nloa
ded
by [
Uni
vers
ity o
f W
este
rn A
ustr
alia
] at
02:
41 0
8 A
pril
2014
Assessment of Heavy Metal Contamination of Agricultural Soil 225
FIGURE 1: Map of the study area showing the sampling points.
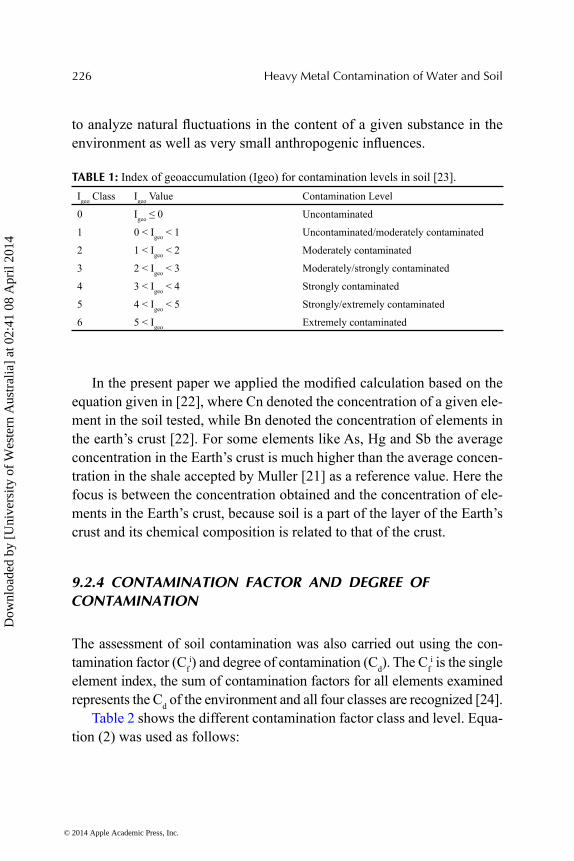
increasing numerical values of the index. It is computed using the Equa-tion (1) as:
(1)
where Cn is the measured concentration of the element in the pelitic sediment fraction (<2 μm) and Bn is the geochemical background value in fossil argillaceous sediment (average shale). The constant 1.5 allows us
© 2014 Apple Academic Press, Inc.
Dow
nloa
ded
by [
Uni
vers
ity o
f W
este
rn A
ustr
alia
] at
02:
41 0
8 A
pril
2014
226 Heavy Metal Contamination of Water and Soil
to analyze natural fl uctuations in the content of a given substance in the environment as well as very small anthropogenic infl uences.
TABLE 1: Index of geoaccumulation (Igeo) for contamination levels in soil [23].Igeo Class Igeo Value Contamination Level
0 Igeo ≤ 0 Uncontaminated
1 0 < Igeo < 1 Uncontaminated/moderately contaminated
2 1 < Igeo < 2 Moderately contaminated
3 2 < Igeo < 3 Moderately/strongly contaminated
4 3 < Igeo < 4 Strongly contaminated
5 4 < Igeo < 5 Strongly/extremely contaminated
6 5 < Igeo Extremely contaminated
In the present paper we applied the modifi ed calculation based on the equation given in [22], where Cn denoted the concentration of a given ele-ment in the soil tested, while Bn denoted the concentration of elements in the earth’s crust [22]. For some elements like As, Hg and Sb the average concentration in the Earth’s crust is much higher than the average concen-tration in the shale accepted by Muller [21] as a reference value. Here the focus is between the concentration obtained and the concentration of ele-ments in the Earth’s crust, because soil is a part of the layer of the Earth’s crust and its chemical composition is related to that of the crust.
9.2.4 CONTAMINATION FACTOR AND DEGREE OF CONTAMINATION
The assessment of soil contamination was also carried out using the con-tamination factor (Cf
i) and degree of contamination (Cd). The Cfi is the single
element index, the sum of contamination factors for all elements examined represents the Cd of the environment and all four classes are recognized [24].
Table 2 shows the different contamination factor class and level. Equa-tion (2) was used as follows:
© 2014 Apple Academic Press, Inc.
Dow
nloa
ded
by [
Uni
vers
ity o
f W
este
rn A
ustr
alia
] at
02:
41 0
8 A
pril
2014
Assessment of Heavy Metal Contamination of Agricultural Soil 227
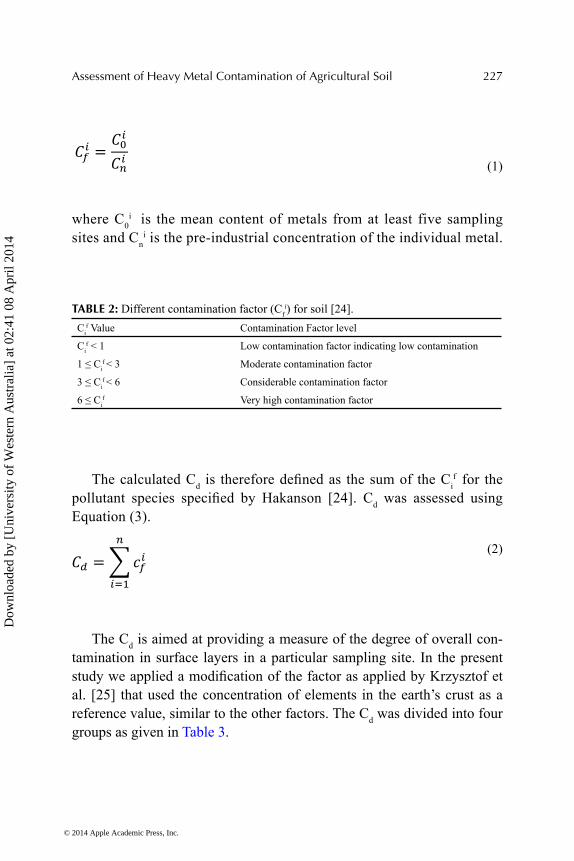
(1)
where C0i is the mean content of metals from at least five sampling
sites and Cni is the pre-industrial concentration of the individual metal.
TABLE 2: Different contamination factor (Cfi) for soil [24].
Cif Value Contamination Factor level
Cif < 1 Low contamination factor indicating low contamination
1 ≤ Cif < 3 Moderate contamination factor
3 ≤ Cif < 6 Considerable contamination factor
6 ≤ Cif Very high contamination factor
The calculated Cd is therefore defi ned as the sum of the Cif for the
pollutant species specifi ed by Hakanson [24]. Cd was assessed using Equation (3).
(2)
The Cd is aimed at providing a measure of the degree of overall con-tamination in surface layers in a particular sampling site. In the present study we applied a modifi cation of the factor as applied by Krzysztof et al. [25] that used the concentration of elements in the earth’s crust as a reference value, similar to the other factors. The Cd was divided into four groups as given in Table 3.
© 2014 Apple Academic Press, Inc.
Dow
nloa
ded
by [
Uni
vers
ity o
f W
este
rn A
ustr
alia
] at
02:
41 0
8 A
pril
2014

228 Heavy Metal Contamination of Water and Soil
TABLE 3: Different degree of contamination (Cd) for soil [24].Cd Class Degree of Contamination Level
Cd < 8 Low degree of contamination
8 ≤ Cd < 16 Moderate degree of contamination
16 ≤ Cd < 32 Considerable degree of contamination
32 ≥ Cd < 8 Very high degree of contamination
9.2.5 MODIFIED DEGREE OF CONTAMINATION (MCD)
Abrahim [26] presented a modified and generalized form of the Hakanson [24] equation for the calculation of the overall degree of contamination at a given sampling or coring site as follows: (a) The modified formula is generalized by defining the degree of contamination (mCd) as the sum of all the contamination factors (Cf
i) for a given set of estuarine pollutants divided by the number of analyzed pollutants; (b) The mean concentration of a pollutant element is based on the analysis of at least three samples; and (c) The baseline concentrations are determined from standard earth materials The modified equation for a generalized approach to calculating the degree of contamination is given in Equation 4.
(4)
where n is the number of analyzed elements and and Cfi is the contami-
nation factor.Using this generalized formula to calculate the mCd allows the incor-
poration of as many metals as the study may analyse with no upper limit. For the classifi cation and description of the mCd seven gradations are pro-posed as shown in Table 4.
An intrinsic feature of the mCd calculation is that it produces an overall average value for a range of pollutants. As with any averaging procedure, care must however be used in evaluating the fi nal results since the effect of signifi cant metal enrichment spikes for individual samples may be hidden within the overall average result.
© 2014 Apple Academic Press, Inc.
Dow
nloa
ded
by [
Uni
vers
ity o
f W
este
rn A
ustr
alia
] at
02:
41 0
8 A
pril
2014
Assessment of Heavy Metal Contamination of Agricultural Soil 229
TABLE 4: Different modified degree of contamination (mCd) for soil [26].mCd Class Modified Degree of Contamination Level
mCd < 1.5 Nil to very low degree of contamination
1.5 ≤ mCd < 2 Low degree of contamination
2 ≤ mCd < 4 Moderate degree of contamination
4 ≤ mCd < 8 High degree of contamination
8 ≤ mCd < 16 Very high degree of contamination
16 ≤ mCd < 32 Extremely high degree of contamination
mCd ≥ 32 Ultra high degree of contamination
9.2.6 POLLUTION LOAD INDEX (PLI)
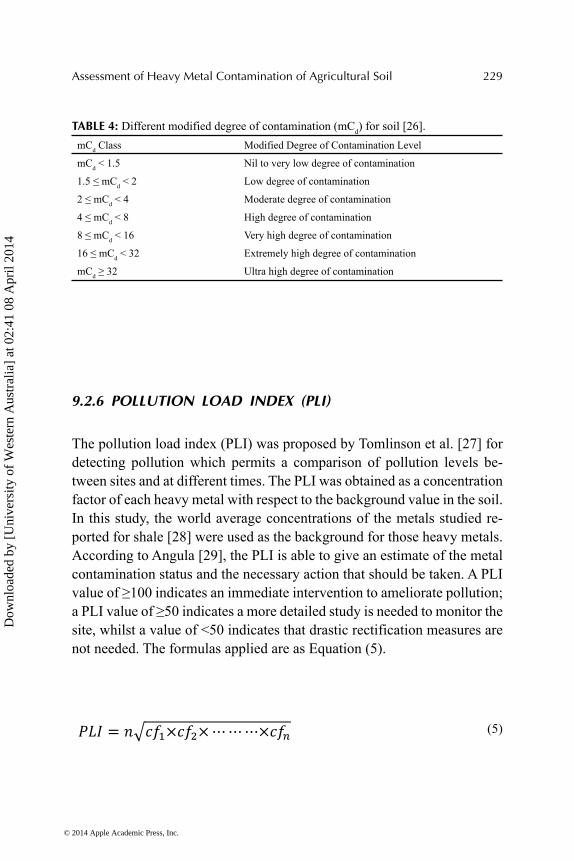
The pollution load index (PLI) was proposed by Tomlinson et al. [27] for detecting pollution which permits a comparison of pollution levels be-tween sites and at different times. The PLI was obtained as a concentration factor of each heavy metal with respect to the background value in the soil. In this study, the world average concentrations of the metals studied re-ported for shale [28] were used as the background for those heavy metals. According to Angula [29], the PLI is able to give an estimate of the metal contamination status and the necessary action that should be taken. A PLI value of ≥100 indicates an immediate intervention to ameliorate pollution; a PLI value of ≥50 indicates a more detailed study is needed to monitor the site, whilst a value of <50 indicates that drastic rectification measures are not needed. The formulas applied are as Equation (5).
(5)
© 2014 Apple Academic Press, Inc.
Dow
nloa
ded
by [
Uni
vers
ity o
f W
este
rn A
ustr
alia
] at
02:
41 0
8 A
pril
2014
230 Heavy Metal Contamination of Water and Soil
9.3 RESULTS AND DISCUSSION
9.3.1 SEASONAL AND SPATIAL VARIATION OF HEAVY
METAL CONTENT
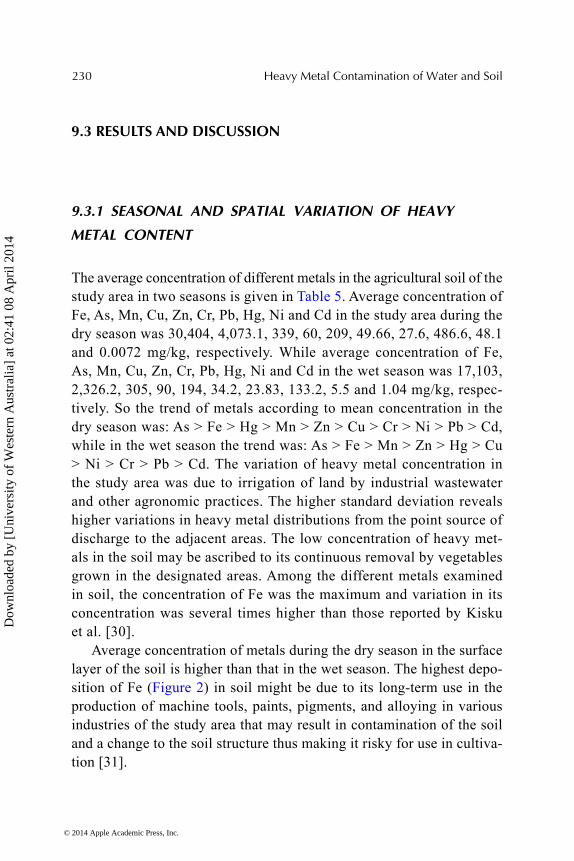
The average concentration of different metals in the agricultural soil of the study area in two seasons is given in Table 5. Average concentration of Fe, As, Mn, Cu, Zn, Cr, Pb, Hg, Ni and Cd in the study area during the dry season was 30,404, 4,073.1, 339, 60, 209, 49.66, 27.6, 486.6, 48.1 and 0.0072 mg/kg, respectively. While average concentration of Fe, As, Mn, Cu, Zn, Cr, Pb, Hg, Ni and Cd in the wet season was 17,103, 2,326.2, 305, 90, 194, 34.2, 23.83, 133.2, 5.5 and 1.04 mg/kg, respec-tively. So the trend of metals according to mean concentration in the dry season was: As > Fe > Hg > Mn > Zn > Cu > Cr > Ni > Pb > Cd, while in the wet season the trend was: As > Fe > Mn > Zn > Hg > Cu > Ni > Cr > Pb > Cd. The variation of heavy metal concentration in the study area was due to irrigation of land by industrial wastewater and other agronomic practices. The higher standard deviation reveals higher variations in heavy metal distributions from the point source of discharge to the adjacent areas. The low concentration of heavy met-als in the soil may be ascribed to its continuous removal by vegetables grown in the designated areas. Among the different metals examined in soil, the concentration of Fe was the maximum and variation in its concentration was several times higher than those reported by Kisku et al. [30].
Average concentration of metals during the dry season in the surface layer of the soil is higher than that in the wet season. The highest depo-sition of Fe (Figure 2) in soil might be due to its long-term use in the production of machine tools, paints, pigments, and alloying in various industries of the study area that may result in contamination of the soil and a change to the soil structure thus making it risky for use in cultiva-tion [31].
© 2014 Apple Academic Press, Inc.
Dow
nloa
ded
by [
Uni
vers
ity o
f W
este
rn A
ustr
alia
] at
02:
41 0
8 A
pril
2014
Ass
essm
ent o
f Hea
vy M
etal
Con
tam
inat
ion
of A
gric
ultu
ral S
oil
231
TABLE 5. Different concentrations of metals in the agricultural soil of the study area over two seasons.M
AC
in
Agr
icul
tura
l So
il in
Chi
na
(mg/
kg) [
34]
Nat
ural
B
ackg
roun
d So
il in
Chi
na
(mg/
kg) [
34]
Safe
Lim
it of
Indi
a (m
g/kg
) [35
]
DEP
Z ar
ea
(mg/
kg) [
37] Present study
Dry season Wet season
Metals Mean (mg/kg)
SD Range (Min-Max) (mg/kg)
Mean (mg/kg)
SD Range (Min-Max) (mg/kg)
Fe 75–150 1715.8 30404 37.3 23016.4–38458 17103 12147 13.9–581
As 4073.1 1116 789.24–565.92 2326.2 3274 0–14307
Mn 339 142 149.94–22.77 305 131.6 107–582
Cu 100 35 135–200 39.14 60 16.5 19.92–728.25 90 66.9 20.4–281
Zn 300 100 300–600 115.4 209 193.6 75.33–859.95 194 120.4 0.15–474
Cr 200 90 53.7 49.66 34.7 22.77–170.83 34.2 26.5 0–89.78
Pb 350 35 250–500 49.7 27.6 7.9 9.79–41.08 23.83 11.3 0.511–45
Hg 486.6 229.3 132.7–5016.2 133.2 72.7 0–328.28
Ni 60 40 58.2 48.1 11.3 29–68.2 35.5 10.5 11.65–52
Cd 0.6 20 3–6 11.4 0.0072 0.02 0–0.09 1.04 2.03 0.25–8.8
© 2
014
App
le A
cade
mic
Pre
ss, I
nc.
Dow
nloa
ded
by [
Uni
vers
ity o
f W
este
rn A
ustr
alia
] at
02:
41 0
8 A
pril
2014

232 Heavy Metal Contamination of Water and Soil
FIGURE 2: Seasonal and spatial variation of (a) Fe and (b) As in the study area.
High concentrations of As in the soils are due to signifi cant anthro-pogenicity particularly industrial activities such as the metallurgical and chemical industries and the use of arsenical sprays [32]. Arsenic is a prior-ity toxic element that can cause arsenicosis-related disease and internal cancers, even in trace amounts. The dry season showed about a two times higher concentration of arsenic in the soil than that of the wet season (Fig-ure 2). The mean As content in the soil near industrial areas in Turkey was 9.53 mg/kg ranging from 1.50 to 65.60 mg/kg [32]. Arsenic concentration in uncontaminated
Mn is one of the commonly found elements in the lithosphere and its concentration in the dry season was about two times higher than in the wet season (Figure 3). Cu was distributed uniformly in the wet season, but in the dry some zigzag was found. This metal was about 1.5 times higher in the dry season compared to the wet (Figure 3). There was a sharp variation in average Cu concentration in the dry season at sampling point 8 due to point source contamination. More or less the average concentration of the metal was within the MAC of elements in agricultural soil found in China [34], and within the safe limit of India [35]. Cu content of soils in the Ge-bze region was between 7.87 and 725 mg/kg with an average of 95.88 mg/kg which was signifi cantly greater than that in uncontaminated soils [32]. In some other works, Cu concentrations lower than in Gebze soils were recorded [33,36].
© 2014 Apple Academic Press, Inc.
Dow
nloa
ded
by [
Uni
vers
ity o
f W
este
rn A
ustr
alia
] at
02:
41 0
8 A
pril
2014

Assessment of Heavy Metal Contamination of Agricultural Soil 233
FIGURE 3: Seasonal and spatial variation of (a) Mn and (b) Cu in the study area.
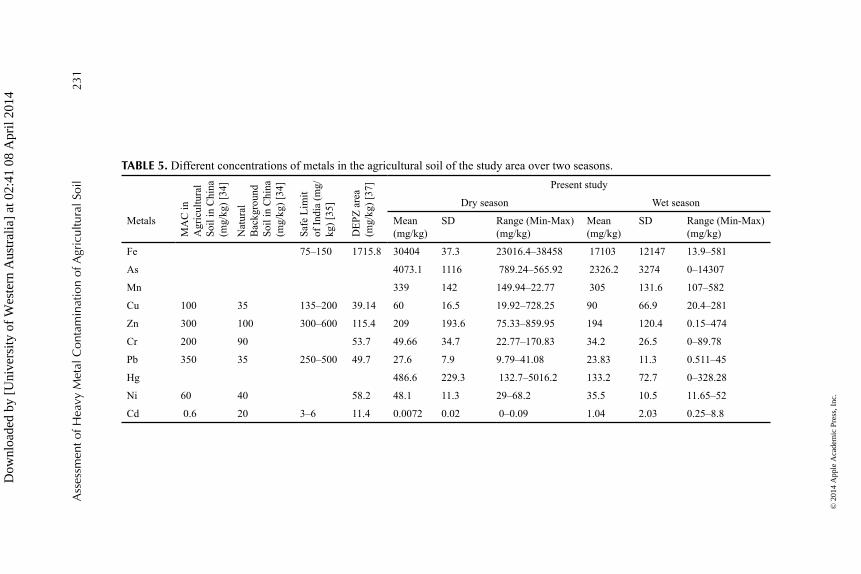
Zn and Cr are heavy metals and their sources in industrial locations are usually anthropogenic [38]. The main anthropogenic sources of Zn are related to the non-ferric metal industry and agricultural practice [32,33]. Zinc is a very readily mobile element. High doses of Zn show toxic and carcinogenic effects and result in neurologic and hematological complica-tions, hypertension, and kidney and liver function disorders [39].
The Cr content of topsoil is known to increase due to pollution from various sources of which the main ones are attributable to industrial wastes such as Cr pigment and tannery wastes, electroplating sludge, leather man-ufacturing wastes, and municipal sewage sludge etc. Cr behavior in soil is controlled by soil pH and redox potential, while long term exposure to Cr can cause liver and kidney damage [38]. The observed Zn and Cr concen-trations in studied soil around DEPZ probably comes from construction materials in the form of alloys for protective coating for iron and steel. These metals are also used in the industries of DEPZ pigment and reduc-ing agents; cotton processing, soldering and welding fl ux; rubber industry, glass, enamels, plastics, lubricants, cosmetics, pharmaceuticals, agents for burns and ointments [40]. Both metals were unevenly distributed in the study area (Figure 4). Both metals showed higher concentration in a simi-lar study area to Ahmed and Gani [37].
Pb contamination in soils has been seriously emphasized in recent years since this metal is very toxic for humans and animals [32]. Pb enters human or animal metabolism via the food chain. Pb production
© 2014 Apple Academic Press, Inc.
Dow
nloa
ded
by [
Uni
vers
ity o
f W
este
rn A
ustr
alia
] at
02:
41 0
8 A
pril
2014
234 Heavy Metal Contamination of Water and Soil
FIGURE 4: Seasonal and spatial variation of (a) Zn and (b) Cr in the study area.
and operation facilities without a waste-gas treatment system, battery production and scrap battery recovery facilities, thermal power plants, and iron–steel industries are the other lead sources. Moreover among the heavy metals, Pb is the most immobile element and its content in soil is closely associated with clay minerals, Mn-oxides, Al and Fe hydrox-ides, and organic material [32]. Although there was point wise varia-tion in concentration of Pb (Figure 5), a very limited average variation was observed over two seasons. Pb concentrations in Gebze soils were between 17.07 and 8,469 mg/kg with an average of 246 mg/kg which is noticeably higher than values reported in the literature [32]. The av-erage Pb concentration in the soils of the Thrace region was recorded as 33 mg/kg [41]. Long term exposure of Pb is risky. Bioaccumulation and bio-magnifi cation can take place. Hence, regular consumption of vegetables from this area by residents could pose a serious neurological health problem from long term Pb exposure.
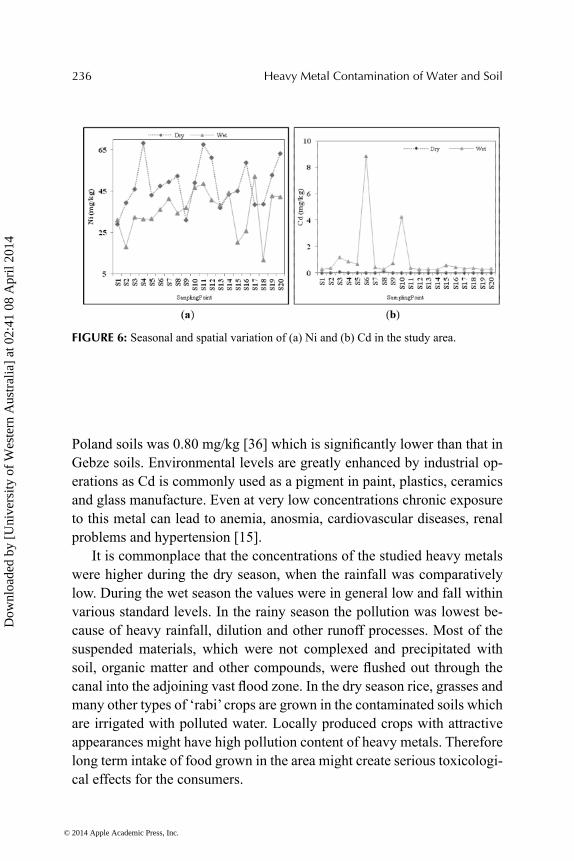
Hg is a toxic metal for environmental and human health. Base-metal processing and some chemical industrial activities are the main source for Hg contamination in soils. Mining activities, sewage wastes, and the use of fungicides also result in Hg pollution. The dry season contained about four times higher concentrations of this metal than that of the wet season (Figure 5). Seasonal rainfall may limit the concentration in soil during the
© 2014 Apple Academic Press, Inc.
Dow
nloa
ded
by [
Uni
vers
ity o
f W
este
rn A
ustr
alia
] at
02:
41 0
8 A
pril
2014

Assessment of Heavy Metal Contamination of Agricultural Soil 235
FIGURE 5: Seasonal and spatial variation of (a) Pb and (b) Hg in the study area.
wet season. Hg concentration in Gebze soils was between 9 μg/kg and 2,721 μg/kg with an average of 102 μg/kg [32], which is very much lower than present work.
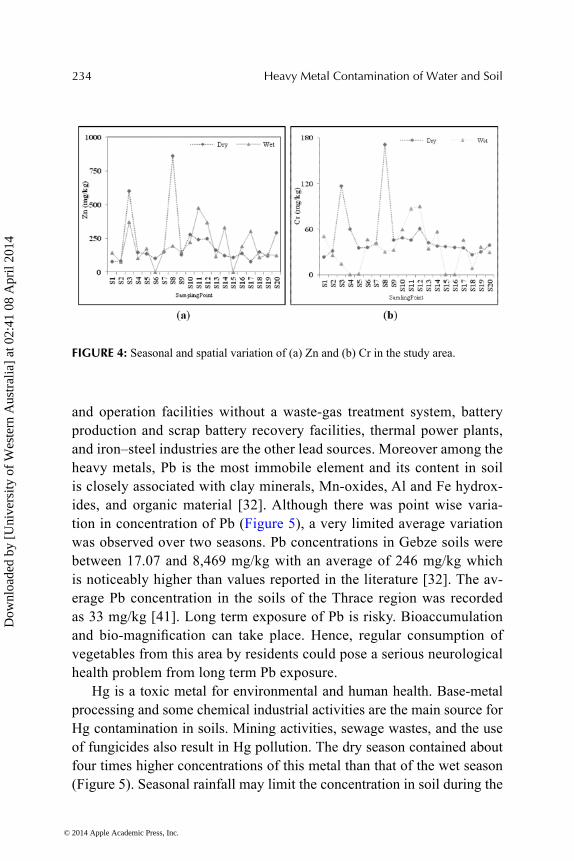
Average concentration of Ni in the dry season was higher than the wet season (Figure 6). Major sources of Ni in the soil are poorly treated waste-water that is discharged from ceramics, steel and alloys and other metal processing industries. Long term exposure of Ni through the food chain may contribute to health problems like skin allergies, dermatitis, rhinitis, nasal sinusitis, lung injury and nasal mucosal injury [38].
There is a growing environmental concern about Cd being one of the most eco-toxic metals, exhibiting highly adverse effects on soil health, bi-ological activity, plant metabolism, and the health of humans and animals [33]. The comparison of mean concentrations of heavy metals in the soil of the study area with the offi cial Indian standard [35], and the MAC of elements in agricultural soil in China [34] showed that only the concentra-tion of Cd was found to be 3-fold higher than the threshold level of India and 19 times higher than the Chinese standard (Figure 6). Higher concen-tration of Cd in the wet season may be due to more Cd containing waste water release from DEPZ compared to that of the dry season. The Cd con-centrations in Gebze, Turkey soils varied from 0.05 to 176 mg/kg and the average was 4.41 mg/kg [32]. The average Cd concentration in northern
© 2014 Apple Academic Press, Inc.
Dow
nloa
ded
by [
Uni
vers
ity o
f W
este
rn A
ustr
alia
] at
02:
41 0
8 A
pril
2014
236 Heavy Metal Contamination of Water and Soil
FIGURE 6: Seasonal and spatial variation of (a) Ni and (b) Cd in the study area.
Poland soils was 0.80 mg/kg [36] which is signifi cantly lower than that in Gebze soils. Environmental levels are greatly enhanced by industrial op-erations as Cd is commonly used as a pigment in paint, plastics, ceramics and glass manufacture. Even at very low concentrations chronic exposure to this metal can lead to anemia, anosmia, cardiovascular diseases, renal problems and hypertension [15].
It is commonplace that the concentrations of the studied heavy metals were higher during the dry season, when the rainfall was comparatively low. During the wet season the values were in general low and fall within various standard levels. In the rainy season the pollution was lowest be-cause of heavy rainfall, dilution and other runoff processes. Most of the suspended materials, which were not complexed and precipitated with soil, organic matter and other compounds, were fl ushed out through the canal into the adjoining vast fl ood zone. In the dry season rice, grasses and many other types of ‘rabi’ crops are grown in the contaminated soils which are irrigated with polluted water. Locally produced crops with attractive appearances might have high pollution content of heavy metals. Therefore long term intake of food grown in the area might create serious toxicologi-cal effects for the consumers.
© 2014 Apple Academic Press, Inc.
Dow
nloa
ded
by [
Uni
vers
ity o
f W
este
rn A
ustr
alia
] at
02:
41 0
8 A
pril
2014
Assessment of Heavy Metal Contamination of Agricultural Soil 237
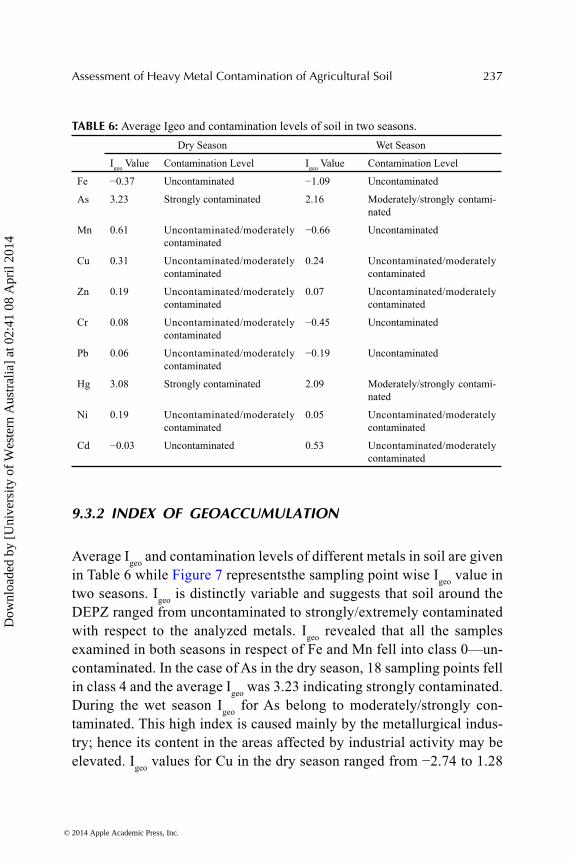
TABLE 6: Average Igeo and contamination levels of soil in two seasons.Dry Season Wet Season
Igeo Value Contamination Level Igeo Value Contamination Level
Fe −0.37 Uncontaminated −1.09 Uncontaminated
As 3.23 Strongly contaminated 2.16 Moderately/strongly contami-nated
Mn 0.61 Uncontaminated/moderately contaminated
−0.66 Uncontaminated
Cu 0.31 Uncontaminated/moderately contaminated
0.24 Uncontaminated/moderately contaminated
Zn 0.19 Uncontaminated/moderately contaminated
0.07 Uncontaminated/moderately contaminated
Cr 0.08 Uncontaminated/moderately contaminated
−0.45 Uncontaminated
Pb 0.06 Uncontaminated/moderately contaminated
−0.19 Uncontaminated
Hg 3.08 Strongly contaminated 2.09 Moderately/strongly contami-nated
Ni 0.19 Uncontaminated/moderately contaminated
0.05 Uncontaminated/moderately contaminated
Cd −0.03 Uncontaminated 0.53 Uncontaminated/moderately contaminated
9.3.2 INDEX OF GEOACCUMULATION
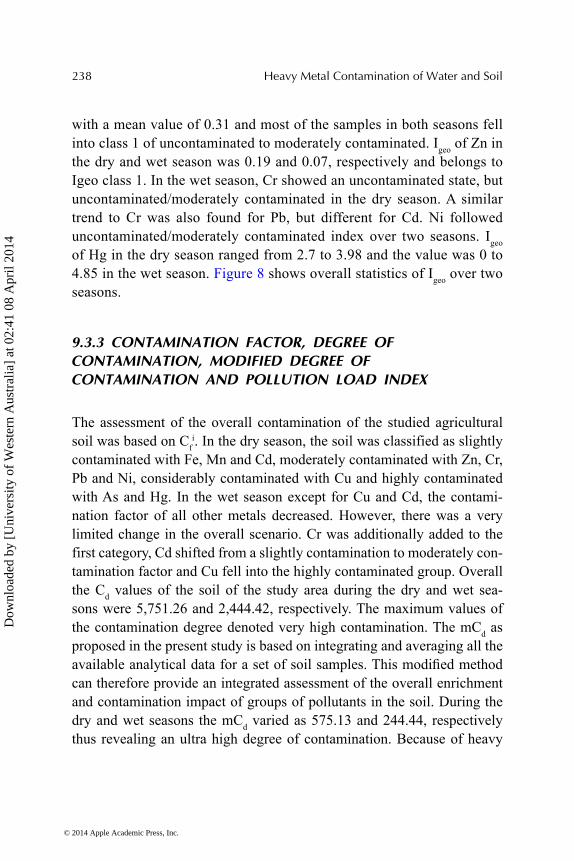
Average Igeo and contamination levels of different metals in soil are given in Table 6 while Figure 7 representsthe sampling point wise Igeo value in two seasons. Igeo is distinctly variable and suggests that soil around the DEPZ ranged from uncontaminated to strongly/extremely contaminated with respect to the analyzed metals. Igeo revealed that all the samples examined in both seasons in respect of Fe and Mn fell into class 0—un-contaminated. In the case of As in the dry season, 18 sampling points fell in class 4 and the average Igeo was 3.23 indicating strongly contaminated. During the wet season Igeo for As belong to moderately/strongly con-taminated. This high index is caused mainly by the metallurgical indus-try; hence its content in the areas affected by industrial activity may be elevated. Igeo values for Cu in the dry season ranged from −2.74 to 1.28
© 2014 Apple Academic Press, Inc.
Dow
nloa
ded
by [
Uni
vers
ity o
f W
este
rn A
ustr
alia
] at
02:
41 0
8 A
pril
2014
238 Heavy Metal Contamination of Water and Soil
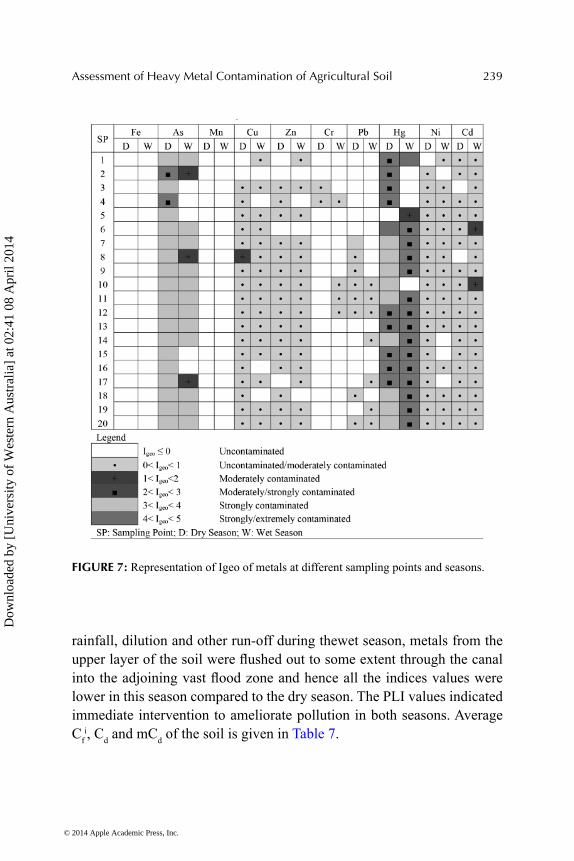
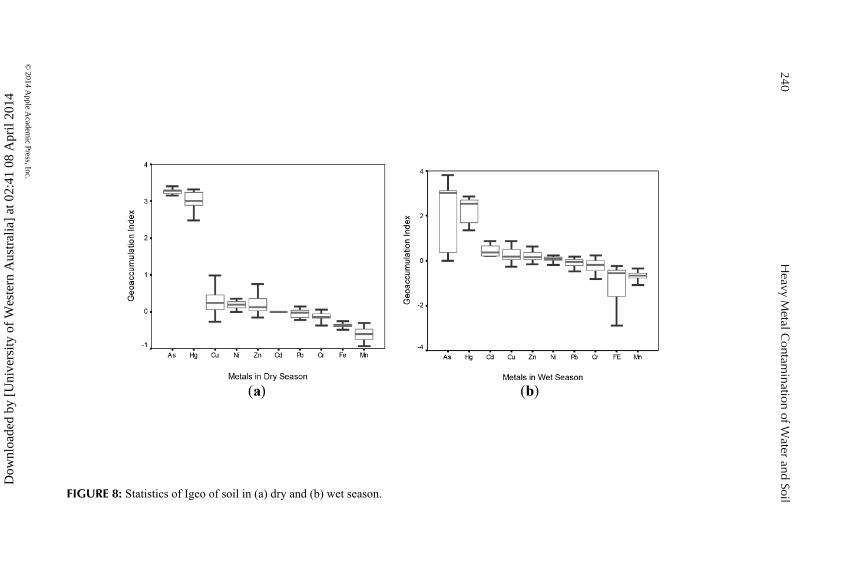
with a mean value of 0.31 and most of the samples in both seasons fell into class 1 of uncontaminated to moderately contaminated. Igeo of Zn in the dry and wet season was 0.19 and 0.07, respectively and belongs to Igeo class 1. In the wet season, Cr showed an uncontaminated state, but uncontaminated/moderately contaminated in the dry season. A similar trend to Cr was also found for Pb, but different for Cd. Ni followed uncontaminated/moderately contaminated index over two seasons. Igeo of Hg in the dry season ranged from 2.7 to 3.98 and the value was 0 to 4.85 in the wet season. Figure 8 shows overall statistics of Igeo over two seasons.
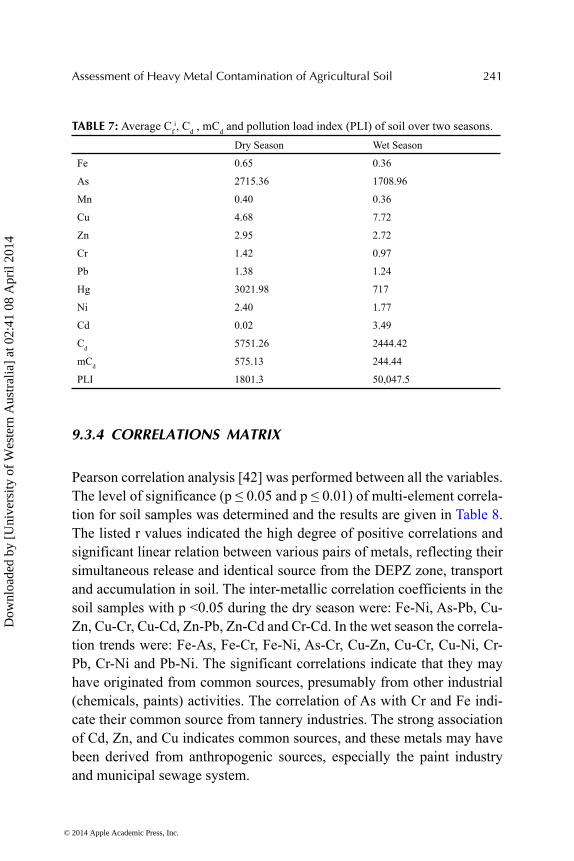
9.3.3 CONTAMINATION FACTOR, DEGREE OF CONTAMINATION, MODIFIED DEGREE OF CONTAMINATION AND POLLUTION LOAD INDEX
The assessment of the overall contamination of the studied agricultural soil was based on Cf
i. In the dry season, the soil was classified as slightly contaminated with Fe, Mn and Cd, moderately contaminated with Zn, Cr, Pb and Ni, considerably contaminated with Cu and highly contaminated with As and Hg. In the wet season except for Cu and Cd, the contami-nation factor of all other metals decreased. However, there was a very limited change in the overall scenario. Cr was additionally added to the first category, Cd shifted from a slightly contamination to moderately con-tamination factor and Cu fell into the highly contaminated group. Overall the Cd values of the soil of the study area during the dry and wet sea-sons were 5,751.26 and 2,444.42, respectively. The maximum values of the contamination degree denoted very high contamination. The mCd as proposed in the present study is based on integrating and averaging all the available analytical data for a set of soil samples. This modifi ed method can therefore provide an integrated assessment of the overall enrichment and contamination impact of groups of pollutants in the soil. During the dry and wet seasons the mCd varied as 575.13 and 244.44, respectively thus revealing an ultra high degree of contamination. Because of heavy
© 2014 Apple Academic Press, Inc.
Dow
nloa
ded
by [
Uni
vers
ity o
f W
este
rn A
ustr
alia
] at
02:
41 0
8 A
pril
2014
Assessment of Heavy Metal Contamination of Agricultural Soil 239
FIGURE 7: Representation of Igeo of metals at different sampling points and seasons.
rainfall, dilution and other run-off during thewet season, metals from the upper layer of the soil were fl ushed out to some extent through the canal into the adjoining vast fl ood zone and hence all the indices values were lower in this season compared to the dry season. The PLI values indicated immediate intervention to ameliorate pollution in both seasons. Average Cf
i, Cd and mCd of the soil is given in Table 7.
© 2014 Apple Academic Press, Inc.
Dow
nloa
ded
by [
Uni
vers
ity o
f W
este
rn A
ustr
alia
] at
02:
41 0
8 A
pril
2014
240 H
eavy Metal C
ontamination of W
ater and SoilFIGURE 8: Statistics of Igeo of soil in (a) dry and (b) wet season.
© 2014 A
pple Academ
ic Press, Inc.
Dow
nloa
ded
by [
Uni
vers
ity o
f W
este
rn A
ustr
alia
] at
02:
41 0
8 A
pril
2014
Assessment of Heavy Metal Contamination of Agricultural Soil 241
TABLE 7: Average Cfi, Cd , mCd and pollution load index (PLI) of soil over two seasons.
Dry Season Wet Season
Fe 0.65 0.36
As 2715.36 1708.96
Mn 0.40 0.36
Cu 4.68 7.72
Zn 2.95 2.72
Cr 1.42 0.97
Pb 1.38 1.24
Hg 3021.98 717
Ni 2.40 1.77
Cd 0.02 3.49
Cd 5751.26 2444.42
mCd 575.13 244.44
PLI 1801.3 50,047.5
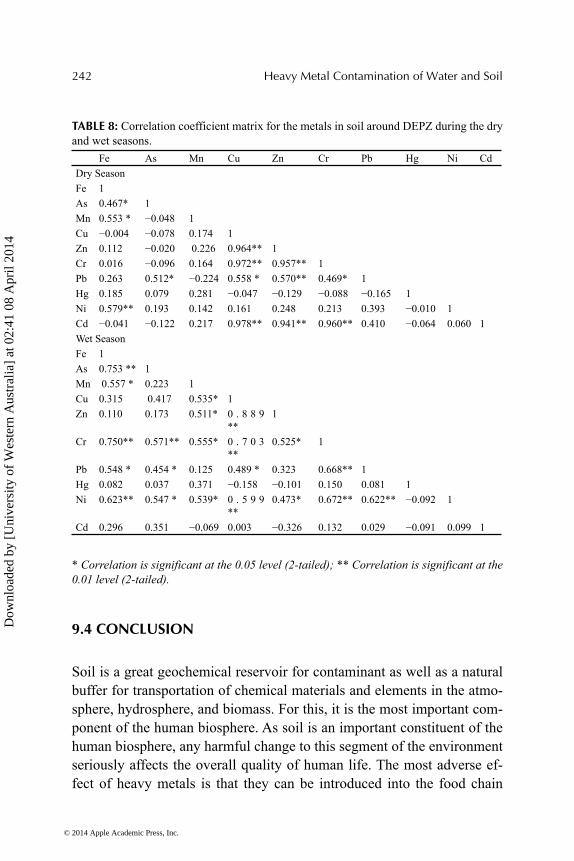
9.3.4 CORRELATIONS MATRIX
Pearson correlation analysis [42] was performed between all the variables. The level of significance (p ≤ 0.05 and p ≤ 0.01) of multi-element correla-tion for soil samples was determined and the results are given in Table 8. The listed r values indicated the high degree of positive correlations and significant linear relation between various pairs of metals, reflecting their simultaneous release and identical source from the DEPZ zone, transport and accumulation in soil. The inter-metallic correlation coefficients in the soil samples with p <0.05 during the dry season were: Fe-Ni, As-Pb, Cu-Zn, Cu-Cr, Cu-Cd, Zn-Pb, Zn-Cd and Cr-Cd. In the wet season the correla-tion trends were: Fe-As, Fe-Cr, Fe-Ni, As-Cr, Cu-Zn, Cu-Cr, Cu-Ni, Cr-Pb, Cr-Ni and Pb-Ni. The significant correlations indicate that they may have originated from common sources, presumably from other industrial (chemicals, paints) activities. The correlation of As with Cr and Fe indi-cate their common source from tannery industries. The strong association of Cd, Zn, and Cu indicates common sources, and these metals may have been derived from anthropogenic sources, especially the paint industry and municipal sewage system.
© 2014 Apple Academic Press, Inc.
Dow
nloa
ded
by [
Uni
vers
ity o
f W
este
rn A
ustr
alia
] at
02:
41 0
8 A
pril
2014
242 Heavy Metal Contamination of Water and Soil
TABLE 8: Correlation coefficient matrix for the metals in soil around DEPZ during the dry and wet seasons.
Fe As Mn Cu Zn Cr Pb Hg Ni CdDry SeasonFe 1 As 0.467* 1Mn 0.553 * −0.048 1Cu −0.004 −0.078 0.174 1Zn 0.112 −0.020 0.226 0.964** 1Cr 0.016 −0.096 0.164 0.972** 0.957** 1Pb 0.263 0.512* −0.224 0.558 * 0.570** 0.469* 1Hg 0.185 0.079 0.281 −0.047 −0.129 −0.088 −0.165 1Ni 0.579** 0.193 0.142 0.161 0.248 0.213 0.393 −0.010 1Cd −0.041 −0.122 0.217 0.978** 0.941** 0.960** 0.410 −0.064 0.060 1Wet SeasonFe 1As 0.753 ** 1Mn 0.557 * 0.223 1Cu 0.315 0.417 0.535* 1Zn 0.110 0.173 0.511* 0 . 8 8 9
** 1
Cr 0.750** 0.571** 0.555* 0 . 7 0 3 **
0.525* 1
Pb 0.548 * 0.454 * 0.125 0.489 * 0.323 0.668** 1Hg 0.082 0.037 0.371 −0.158 −0.101 0.150 0.081 1Ni 0.623** 0.547 * 0.539* 0 . 5 9 9
** 0.473* 0.672** 0.622** −0.092 1
Cd 0.296 0.351 −0.069 0.003 −0.326 0.132 0.029 −0.091 0.099 1
* Correlation is significant at the 0.05 level (2-tailed); ** Correlation is significant at the 0.01 level (2-tailed).
9.4 CONCLUSION
Soil is a great geochemical reservoir for contaminant as well as a natural buffer for transportation of chemical materials and elements in the atmo-sphere, hydrosphere, and biomass. For this, it is the most important com-ponent of the human biosphere. As soil is an important constituent of the human biosphere, any harmful change to this segment of the environment seriously affects the overall quality of human life. The most adverse ef-fect of heavy metals is that they can be introduced into the food chain
© 2014 Apple Academic Press, Inc.
Dow
nloa
ded
by [
Uni
vers
ity o
f W
este
rn A
ustr
alia
] at
02:
41 0
8 A
pril
2014
Assessment of Heavy Metal Contamination of Agricultural Soil 243
and threaten human health. Agricultural products growing on soils with high metal concentrations are represented by metal accumulations at lev-els harmful to human and animal health as well as to the bio-environment. The impact of anthropogenic heavy metal contamination on agriculture soil around DEPZ was evaluated in this study using seasonal variation and indices. All the indices more or less revealed that the study area was seri-ously affected by different metals. Dry seasons resulted in some multi-fold higher values of the overall indices. These metals with high concentrations in the studied soils may have been mixed with groundwater by leaching. High concentrations of heavy metals in soils around industrial facilities originate from an anthropogenic source which is associated with unre-strained solid release and untreated or poorly treated fluid wastes from these industrial facilities. To control soil contamination, legislative mea-sures must be taken, legally binding the individual industries, forbidding discharge of untreated or poorly treated industrial effluents. Lowering the quality of soil health due to these industries can only be restricted if a zero discharge system ETP is implemented throughout the DEPZ. Immediate steps including regular monitoring of toxic metals in the agricultural soil is needed to check the environmental quality. Wastewater discharged from DEPZ could be recycled for the remediation of pollution in a sustainable and eco-specific way. Moreover different remediation measures should be taking promptly to remove excising metal contamination.
REFERENCES
1. USDA (United States Department of Agriculture Natural Resources Conservation Services Soils Quality Institute). Urban Technical Note, 2001.
2. Thuy, H.T.T.; Tobschall, H.J.; An, P.V. Distribution of heavy metals in urban soils—A case study of Danang-Hoian area (vietnam). Environ. Geogr. 2000, 39, 603–610.
3. Mingorance, M.D.; Valdes, B.; Oliva-Rossini, S. Strategies of heavy metal uptake by plants growing under industrial emissions. Environ. Int. 2007, 33, 514–520.
4. Alam, M.G.M.; Snow, E.T.; Tanaka, A. Arsenic and heavy metal concentration of veg-etables grown in Samta village, Bangladesh. Sci. Total Environ. 2003, 111, 811–815.
5. Arora, M.; Kiran, B.; Rani, A.; Rani, S.; Kaur, B.; Mittal, M. Heavy metal accumu-lation in vegetables irrigated with water from different sources. Food Chem. 2008, 111, 811–815.
6. Bhuiyan, M.A.H.; Suruvi, N.I.; Dampare, S.B.; Islam, M.A.; Quraishi, S.B.; Ganya-glo, S.; Suzuki, S. Investigation of the possible sources of heavy metal contamina-
© 2014 Apple Academic Press, Inc.
Dow
nloa
ded
by [
Uni
vers
ity o
f W
este
rn A
ustr
alia
] at
02:
41 0
8 A
pril
2014
244 Heavy Metal Contamination of Water and Soil
tion in lagoon and canal water in the tannery industrial area in Dhaka, Bangladesh. Environ. Monit. Assess. 2011, 175, 633–649.
7. Ahmed, G.; Uddin, M.K.; Khan, G.M.; Rahman, M.S.; Chowdhury, D.A. Distri-bution of trace metal pollutants in surface water system connected to effluent dis-posal points of Dhaka Export Processing Zone (DEPZ), Bangladesh: A statistical approach. J. Nat. Sci. Sus. Technol. 2009, 3, 293–304.
8. Mortula, M.M.; Rahman, M.S. Study on waste disposal at DEPZ. Bangladesh Envi-ron. (BAPA). 2002, 2, 807–817.
9. Yadav, R.K.; Goyal, B.; Sharma, R.K.; Dubey, S.K.; Minhas, P.S. Post irrigation im-pact of domestic sewage effluent on composition of soils, crops and ground water—A case study. Environ. Int. 2002, 28, 481–486.
10. Singh, K.P.; Mohan, D.; Sinha, S.; Dalwani, R. Impact assessment of treated/un-treated wastewater toxicants discharged by sewage treatment plants on health, agri-cultural, and environmental quality in the wastewater disposal area. Chemosphere 2004, 55, 227–255. Appl. Sci. 2012, 2 600
11. Chen, Y.; Wang, C.; Wang, Z. Residues and sources identification of persistent or-ganic pollutants in farmland soils irrigated by effluents from biological treatment plants. Environ. Int. 2005, 31, 778–783.
12. Mapanda, F.; Mangwayana, E.N.; Nyamangara, J.; Giller, K.E. The effect of long-term irrigation using wastewater on heavy metal contents of soils under vegetables in Harare, Zimbabwe. Agric. Ecosys. Environ. 2005, 107, 151–165.
13. Luo, X.; Yu, S.; Zhu, Y.; Li, X. Trace metal contamination in urban soils of China. Sci. Total Environ. 2012, 441–442, 17–30.
14. Muchuweti, M.; Birkett, J.W.; Chinyanga, E.; Zvauya, R.; Scrimshaw, M.D.; Lester, J. Heavy metal content of vegetables irrigated with mixture of wastewater and sew-age sludge in Zimbabwe: Implications for human health. Agric. Ecosys. Environ. 2006, 112, 41–48.
15. Sharma, R.K.; Agrawal, M.; Marshall, F. Heavy metal contamination in vegetables grown in wastewater irrigated areas of Varanasi, India. Bull. Environ. Contam. Toxi-col. 2006, 77, 312–318.
16. Sharma, R.K.; Agrawal, M.; Marshall, F. Heavy metal (Cu, Zn, Cd and Pb) contami-nation of vegetables in urban India: A case study in Varanasi. Environ. Poll. 2008, 154, 254–263.
17. Khan, M.K.; Alam, A.M.; Islam, M.S.; Hassan, M.Q.; Al-Mansur, M.A. Environ-mental pollution around Dhaka EPZ and its impact on surface and groundwater. Bangladesh J. Sci. Ind. Res. 2011, 46, 153–162.
18. Khanam, D.; Rahman, S.H.; Islam, M.S.; Ahsan, M.A.; Shaha, B.; Akbor, M.A.; Beg, R.U.; Adyel, T.M. Seasonal implication of heavy metal contamination of sur-face water around Dhaka Export Processing Zone (DEPZ), savar, bangladesh. Jah-angirnagar Univ. J. Sci. 2011, 34, 21–35.
19. Mahfuz, M.A.; Ahmad, J.U.; Sultana, M.S.; Rahman, M.M.; Goni, M.A.; Rahman, M.S. Status of physicochemical properties of wastewater in Bangladesh: A cash studies in Dhalai Beel of DEPZ. Bangladesh J. Environ. Res. 2004, 2, 9–15.
20. Rahman, S.H.; Neelormi, S.; Tareq, S.M. Environmental impact assessments of tex-tile and dyeing industries on ecosystem of Karnopara canal at Savar, Bangladesh. Jahangirnagar Univ. J. Sci. 2008, 31, 19–32.
© 2014 Apple Academic Press, Inc.
Dow
nloa
ded
by [
Uni
vers
ity o
f W
este
rn A
ustr
alia
] at
02:
41 0
8 A
pril
2014
Assessment of Heavy Metal Contamination of Agricultural Soil 245
21. Muller, G. Index of Geoaccumulation in sediments of the Rhine River. Geo. J. 1969, 2,108–118
22. Taylor, S.R.; Mclennan, S.M. The geochemical evolution of the continental crust. Rev. Geophys. 1995, 33, 241–265
23. Muller, G. Die Schwermetallbelstung der sediment des Neckars und seiner Neben-flusse: Eine Bestandsaufnahme. Chem. Zeitung. 1981, 105, 156–164.
24. Hakanson, L. An ecological risk index for aquatic pollution control, a sedimento-logical approach. Water Res. 1980, 14, 975–1001.
25. Krzysztof, L.; Wiechula, D.; Korns, I. Metal contamination of farming soils affected by industry. Environ. Int. 2004, 30, 159–165.
26. Abrahim, G.M.S.; Parker, R.J. Assessment of heavy metal enrichment factors and the degree of contamination in marine sediments from Tamaki Estuary, Auckland, New Zealand. Environ. Monit. Assess. 2008, 136, 227–238.
27. Tomlinson, D.L.; Wilson, J.G.; Harris, C.R.; Jeffrey, D.W. Problems in the assess-ment of heavy metal levels in estuaries and the formation of a pollution index. Hel-golaender Meeresunter. 1980, 33, 566–575.
28. Turekian, K.K.; Wedepohl, K.H. Distribution of the elements in some major units of the earth’s crust. Bull. Geo. Soc. Am. 1961, 72, 175–192.
29. Angula, E. The Tomlinson Pollution Index applied to heavy metal, Mussel–Watch data: A useful index to assess coastal pollution. Sci. Total Environ. 1996, 187, 19–56.
30. Kisku, G.C.; Barman, S.C.; Bhargava, S.K. Contamination of soil and plants with potentially toxic elements irrigated with mixed industrial effluent and its impact on the environment. Water Air Soil Poll. 2000, 120, 121–137.
31. Islam, M.M.; Halim, M.A.; Safiullah, S.; Hoque, S.A.M.W.; Islam, M.S. Heavy metal (Pb, Cd, Zn, Cu, Cr and Mn) content in textile sludge in Gazipur, Bangladesh. Res. J. Environ. Sci. 2009, 3, 311–315.
32. Yaylali-Abanuz, G. Heavy metal contamination of surface soil around Gebze indus-trial area, Turkey. Microchem. J. 2011, 99, 82–92.
33. Kabata-Pendias, A. Trace Element in Soils and Plants; CRC Press: Boca Raton, FL, USA, 2000; p. 413.
34. SEPA. The Limits of Pollutants in Food; GB2762-2005; State Environmental Pro-tection Administration: Beijing, China, 2005.
35. Awashthi, S.K. Prevention of Food Adulteration Act No. 37 of 1954. Central and State Rules as Amended for 1999; Ashoka Law House: New Delhi, India, 2000; p. 2000.
36. Loska, K.; Wiechula, D.; Korus, I. Metal contamination of farming soils affected by industry. Environ. Int. 2004, 30, 159–165.
37. Ahmed, J.U.; Gani, M.A. Heavy metal contaminations in water, soil and vegetation of the industrial areas in dhaka, Bangladesh. Environ. Monit. Assess. 2010, 166, 347–357.
38. Mondol, M.N.; Chamon, A.S.; Faiz, B.; Elahi, S.F. Seasonal variation of heavy metal concentrations in Water and plant samples around Tejgaon industrial Area of Bangladesh. J. Bangladesh Acad. Sci. 2011, 35, 19–41.
39. Roa, M.S.; Gopalkrishnan, R.; Venkatesh, B.R. Medical geology—An emerging field in environmental science. In National Symposium on Role of Earth Sciences, Integrated and Related Societal Issues, Lucknow, India, 2–4 November 2001, GSI Spl. Pub. No. 65, 2001; pp. 213–222.
© 2014 Apple Academic Press, Inc.
Dow
nloa
ded
by [
Uni
vers
ity o
f W
este
rn A
ustr
alia
] at
02:
41 0
8 A
pril
2014
246 Heavy Metal Contamination of Water and Soil
40. Ahmed, G.; Miah, M.A.; Anawar, H.M.; Chowdhury, D.A.; Ahmad, J.U. Influence of multi-industrial activities on trace metal contamination: An approach towards sur-face water body in the vicinity of Dhaka Export Processing Zone (DEPZ). Environ. Monit. Assess. 2011; doi:10.1007/s10661-011-2254-9.
41. Coşkun, M.; Steinnes, E.; Frontasyeva, V.F.; Sjobakk, T.E.; Demnika, S. Heavy metal pollution of surface soil in the Thrace region, Turkey. Environ. Monit. Assess. 2006, 119, 545–556.
42. Edwards, A.L. The Correlation Coefficient. In Introduction to Linear Regression and Correlation; W. H. Freeman and Company: San Francisco, CA, USA, 1976; Chapter 4, pp. 33–46.
© 2014 Apple Academic Press, Inc.
Dow
nloa
ded
by [
Uni
vers
ity o
f W
este
rn A
ustr
alia
] at
02:
41 0
8 A
pril
2014