Nanohybrids for controlled antibiotic release in topical applications

RESEARCH PAPER
Green and facile synthesis of water-soluble ZnS quantumdots nanohybrids using chitosan derivative ligands
Fabio P. Ramanery • Alexandra A. P. Mansur •
Fernanda G. L. M. Borsagli • Herman S. Mansur
Received: 5 April 2014 / Accepted: 5 June 2014 / Published online: 24 June 2014
� Springer Science+Business Media Dordrecht 2014
Abstract Semiconductor quantum dots (QDs) are
fluorescent nanocrystals with great potential for use in
biomedical and environmental applications. However,
eliminating the potential cytotoxicity of the QDs
comprised of a core containing heavy metals and using
a green chemical process are still challenges faced by
the research community. Thus, the aim of this work
was to develop a novel green and facile route for
synthesizing biocompatible water-soluble QDs using
chemically modified chitosan as a capping ligand in
aqueous media, with their chemical and optical
properties tuned by the nanoparticle size. The synthe-
sis of ZnS QDs capped by carboxymethylchitosan
(CMC) was performed using a single-step aqueous
colloidal process at room temperature. The nanohy-
brids were extensively characterized by several imag-
ing and spectroscopic techniques, and the results
demonstrated that ultra-small ZnS nanocrystals were
produced with average nanoparticles ranging from 3.2
to 4.2 nm. In addition, the luminescent properties of
ZnS QDs were influenced by the pH during the
synthesis due to the size distribution of the
nanoparticles produced. Hence, new ‘‘heavy metal
free’’ nanohybrids were successfully developed based
on ZnS QDs directly surface-functionalized by bio-
polymer exhibiting fluorescent activity that may be
potentially used in a large number of eco-friendly and
biomedical applications.
Keywords Nanoparticle � Quantum dot �Nanomaterials � Colloids � Chitosan � Nanohybrid
Introduction
In the last two to three decades, innovation in nanotech-
nology and nanoscience for biology, medicine, and
environmental applications has been a major driving
force in the creation of new nanocomposites, nanohy-
brids, and nanoconjugates. This new class of materials
may bring together the intrinsic functionalities of
inorganic nanoparticles combined with the biocompat-
ibility and eco-friendly interfaces offered by biomole-
cules and biopolymers, such as carbohydrates,
glycoconjugates, proteins, and enzymes (Emerich
2005; Tan et al. 2007; Etheridge et al. 2013). Among
the alternatives of nanomaterials, ultra-small semicon-
ductor nanocrystals, which are known as quantum dots
(QDs), have lately emerged as an advanced class of
materials with unique physico-chemical, electronic, and
optical properties. Despite exhibiting interesting prop-
erties, the use of QDs in environmental applications has
only recently attracted attention from scientists (Zhang
F. P. Ramanery � A. A. P. Mansur �F. G. L. M. Borsagli � H. S. Mansur (&)
Center of Nanoscience, Nanotechnology and Innovation -
CeNano2I, Department of Metallurgical and Materials
Engineering, Federal University of Minas Gerais, Av.
Antonio Carlos, 6627 – Escola de Engenharia,
Bloco 2 – Sala 2233, Belo Horizonte,
MG 31270-901, Brazil
e-mail: [email protected]
123
J Nanopart Res (2014) 16:2504
DOI 10.1007/s11051-014-2504-1

et al. 1998; Rajabi et al. 2013). As a major drawback,
most of the experimentally studied and commercial QDs
are synthesized via traditional organometallic methods,
using highly toxic elements, such as cadmium, lead and
mercury, and use organic solvents and ligands at high
temperatures, which are undesirable in eco-friendly
processes. Compared with organic-phase synthesis,
aqueous-phase process is much simpler, greener, and
cheaper. Currently, the most commonly used QDs are
made with Cd2? (CdS, CdSe, and CdTe), which is a
heavy metal severely harmful to the environment
because of its toxicity to plants, animals, and micro-
organisms. As a result, cadmium-free QDs, such as zinc-
based nanoparticles, are very promising alternatives due
to the environmental abundance and natural presence of
Zn2? in the human body (Lim et al. 2013; Rajabi et al.
2013). For that reason, zinc sulfide (ZnS) has been the
most frequent QD semiconductor for the application in
biomedical and chemical catalysis, taking advantage of
both the low toxicity and the huge surface area-to-
volume ratio of QDs compared with their bulk counter-
parts (Rajabi et al. 2013). However, QDs exhibit a strong
thermodynamic tendency to agglomerate and grow
during operation that is highly unfavorable for the
overall stability of the system. Therefore, the develop-
ment of molecular ligands for the synthesis of QDs is
increasingly important because they will play a crucial
role in determining the overall physico-chemical stabil-
ity and environmentally friendly nanoconjugates. In
view of the large number of available alternatives to
produce core–shell (inorganic–organic) hybrids, carbo-
hydrates, such as cellulose, chitosan, and starch, have
been often a common choice of ligand, due to their
biocompatibility, physico-chemical and mechanical
properties, and relative chemical solubility and stability
in aqueous physiological environment (Tan et al. 2007;
Dash et al. 2011). Chitosan (poly-b(1?4)-2-amino-2-
deoxy-D-glucose) is one of the most abundant polysac-
charides (semi-processed) from natural sources, second
only to cellulose (Tan et al. 2007; Dash et al. 2011).
Chitosan and its derivatives are promising options as
capping ligands for stabilizing nanosize particles for a
wide range of applications. They contain a large number
of chemical groups, such as hydroxyls and amino
groups, and other functionalities may also be added to
the polymer chain, resulting in strong interactions and
adsorption properties with different molecules and ions.
However, chitosan is reasonably soluble only in acidic
water solutions with poor solubility above pH 6.5
(pKa = 6.5). The solubility of chitosan can be improved
by introducing chemical groups, as it has reactive amino,
primary hydroxyl, and secondary hydroxyl functional
groups, which can be used for chemical modifications
under relatively mild reaction conditions. Consequently,
chitosan derivatives like carboxymethylated chitosans
(O-carboxymethylchitosan and N-carboxymethyl chito-
san), which are water-soluble in acidic, alkaline, and
physiologic circumstances, may be good candidates as
ligands for preparing colloidal semiconductor nanopar-
ticles (Chen and Park 2003; Mansur et al. 2013). These
combined features of chitosan and its derivatives offer
limitless possibilities for developing water-dispersible
QD conjugates for biological, pharmaceutical (Mansur
et al. 2012, 2013; Santos et al. 2013), and environmental
purposes (Jiang et al. 2012). Unexpectedly, reports on
the surface bio-functionalization of colloidal QDs with
chitosan and its derivatives are scarcely found in the
literature (Tan et al. 2007; Chang et al. 2011), and only
recently the direct synthesis of QDs using chitosan in
aqueous colloidal media was published by our group
(Mansur et al. 2012). Mansur and collaborators pio-
neered the direct synthesis of CdS quantum dots using
chitosan and derivatives as capping ligands for potential
biomedical applications (Mansur et al. 2012; Santos
et al. 2013). Nevertheless, no study was found in the
accessed literature where water-soluble ZnS QDs were
directly produced with carboxyl-functionalized chitosan
using strictly green colloidal chemistry.
Thus, this research focused on the synthesis of ZnS
quantum dots directly capped by carboxymethylchitosan
(CMC) using a green, facile, reproducible, and single-step
aqueous process at room temperature. In addition, the
nanohybrid systems were extensively characterized, and
the influence of pH on the formation of the semiconductor
nanocrystals and their fluorescent response was investi-
gated. The novel colloidal bio-functionalized water-
soluble nanoconjugates made of ZnS QDs/CMC are
potentiallynontoxicand,combined with their luminescent
properties, may offer potential use in various biomedical
and environmentally friendly applications.
Experimental
Materials
All reagents and precursors, such as zinc chloride
(Sigma-Aldrich, USA, C98 %, ZnCl2), sodium sulfide
2504 Page 2 of 14 J Nanopart Res (2014) 16:2504
123

(Synth, Brazil,[98 %, Na2S�9H2O), sodium hydrox-
ide (Merck, USA, C99 %, NaOH), acetic acid (Synth,
Brazil, C99.7 %, CH3COOH), hydrochloric acid
(Sigma-Aldrich, USA, 36.5–38.0 %, HCl), monochlo-
roacetic acid (Sigma-Aldrich, USA, 99 %, ClCH2-
COOH), ethanol (Synth, Brazil, 99.8 %, CH3CH2OH),
and isopropanol (Sigma-Aldrich, USA, 99.5 %,
(CH3)2CHOH), were used as-received. Chitosan
powder (Aldrich, USA, MM = 310,000 to
[375,000 g/mol, DD C 75.0 %, and viscosity
800–2,000 cPoise, at 1 % in 1 % acetic acid) was
used as the reference ligand. Deionized water (Milli-
pore SimplicityTM) with resistivity of 18 MX�cm was
used in the preparation of all solutions. All preparations
and synthesis were performed at room temperature
(23 ± 2 �C) unless specified.
Synthesis of carboxymethylchitosan (CMC)
and ZnS quantum dots (ZnS-CMC)
A similar method to that reported by Liu et al. (2001)
was used to prepare carboxymethylchitosan (CMC) at
room temperature. Approximately 3.0 g of chitosan
powder was suspended in 70.8 mL of isopropanol.
After 30 min of magnetic stirring, 8.6 g of NaOH
dissolved in 10.0 g of deionized water (45 % in
water), and 10 mL of isopropanol were added to the
suspension and kept under stirring for 1 h. Next,
14.4 g of monochloroacetic acid/isopropanol solution
(1:1 in mass) was added to the suspension. The
reaction proceeded for 4 h under magnetic stirring at
room temperature and stopped by adding 100 mL of
ethanol. Subsequently, the suspension was filtered,
and the solid filtrate (Na-CMC) was washed with
ethanol/water mixtures of increasing ethanol content
(from 70 to 90 %). The neutralization was conducted
by suspending 1.0 g of Na-CMC salt in 80 % ethanol/
aqueous solution (100 mL), adding hydrochloric acid
(1 mL, 37 %) and stirring for 30 min. In the sequence,
the suspension was filtered, and the solid filtrate was
rinsed in 70 to 90 % ethanol to neutral, and then
vacuum dried, leading to the formation of CMC
derivative. Finally, the CMC solution (1.0 % w/v) was
prepared by dissolving 0.5 g of CMC flakes in 50 mL
of deionized water under moderate magnetic stirring
until complete solubilization occurred.
ZnS nanoparticles were synthesized via an aqueous
route at room temperature as follows: 2 mL of the
CMC solution (1 % w/v) and 45 mL of deionized
water were added to a flask. The pH value of this
solution was adjusted to 4.0 ± 0.2 or 10.0 ± 0.2 with
NaOH (1.0 mol L-1). Under magnetic stirring,
4.0 mL of the zinc precursor solution (ZnCl2,
8 9 10-3 mol L-1) and 2.5 mL of the sulfur source
solution (Na2S�9H2O, 1.0 9 10-2 mol L-1) were
added to the flask (S:Zn = 1:2) and stirred for
60 min. ZnS QDs colloidal suspensions were referred
to as ZnS-CMC_4 and ZnS-CMC_10, as a function of
the pH of quantum dots synthesis. Sampling aliquots
of 3.0 mL were collected at different time intervals for
UV–Vis spectroscopy measurements to evaluate the
colloidal stability.
Characterization of CMC and ZnS-CMC colloidal
quantum dots
The presence of characteristic functional groups of
chitosan (CHI) and the introduction of carbo-
xymethylchitosan (CMC) were evaluated by Fourier
transform infrared spectroscopy (FTIR) and thermal
analysis. FTIR was performed over the range of
650–4,000 cm-1 (Thermo Fischer, Nicolet 6700)
using the attenuated total reflectance spectroscopy
method (ATR-FTIR). Chitosan and functionalized
chitosan derivative (CMC) flakes were placed on the
ATR crystal prism (ZnSe), and 16 scans were acquired
at a 2 cm-1 resolution with a background subtraction.
Thermogravimetric (TG) and differential scanning
calorimetry (DSC) analyses were performed using
SDT Q-600 simultaneous TGA/DSC instrument (TA
Instruments). Samples of approximately 9.0 ± 1.0 mg
were used for the experiments at a heating rate of
10 �C min-1 to temperatures of up to 700 �C. The
samples were loaded into an open platinum crucible.
The TG, DTG (derivative thermogravimetric ana-
lysis), and DSC curves were recorded simultaneously
with 0.1 lg sensitivity. The analysis was performed
under the continuous flow of dry nitrogen gas
(100 mL min-1).
The water solubility of CMC as a function of the pH
was evaluated by the turbidity method using UV–Vis
(ultraviolet–visible) spectroscopy based on the
reported literature (Abreu and Campana-Fillho 2009;
Chen and Park 2003). Briefly, the CMC samples were
dissolved at a concentration of 1.5 g L-1 in deionized
water, and the solutions were prepared at different pH
values by adjusting with HCl or NaOH (0.5 %
aqueous solution). The transmittance of the solution
J Nanopart Res (2014) 16:2504 Page 3 of 14 2504
123

was recorded on a Lambda EZ-2100 spectrophotom-
eter (Perkin-Elmer) using a quartz cell with an optical
path length of 10 mm. The spectra were acquired in
the range 190 nm B k B 800 nm, and the sample was
considered insoluble when the transmittance was
lower than 85 % at k = 450 nm.
The nucleation, growth, and stabilization of colloi-
dal ZnS quantum dots in CMC were monitored by
UV–Vis spectroscopy, and their physico-chemical and
optical properties were assessed using photolumines-
cent spectroscopy (PL), fluorescent microscopy,
FTIR, transmission electron microscopy (TEM), and
Zeta potential (ZP).
UV–Vis spectroscopy measurements were con-
ducted in transmission mode with samples in a quartz
cuvette (optical path length of 10 mm) over a wave-
length range from 190 to 600 nm (Lambda EZ-210,
Perkin-Elmer). All of the experiments were conducted
in triplicates (n = 3) unless otherwise noted; the data
are presented as the mean ± standard deviation.
ZnS-CMC conjugates fluorescence emissions and
relative intensities were acquired by using Nanodrop
3300 fluorospectrometer (Thermo Scientific, UV LED
with kexcitation = 365 ± 10 nm). All the PL spectra
were collected at room temperature, and the measure-
ments of fluorescence intensities were reported in
relative fluorescent units (RFU). The relative activity
was calculated by subtracting the background of
samples without the presence of the colloidal QDs. In
order to avoid errors and deviation in the data gener-
ated, all experiments were performed by sampling 2 lL
of the homogeneous QD medium using precision
pipette with precision tips, and the absence of bubbles
was guaranteed (minimum of four replicates, n C 4). In
addition, QD colloidal media were dropped in a glass
slide, and the fluorescence response of each system was
characterized by inverted fluorescence microscopy
(fluorescence microscope Ti-U, Nikon, illuminating
system 130 W/Hg lamp, objective 409, eyepiece 109)
coupled to a refrigerated CCD camera (DS Qi1-U3,
Nikon) with 1,280 9 1,024 resolution (1.5 Mpixels).
The filter cube (C-FL UV-2E/C DAPI, blue excitation)
had an excitation filter: 340–380 nm; a dichroic mirror:
400 nm; and an emission filter: 435–485 nm.
Nanostructural characterizations of the QD nano-
conjugates were based on the images and selected area
electron diffraction patterns (SAED) obtained using a
Tecnai G2-20-FEI transmission electron microscope
at an accelerating voltage of 200 kV. Energy-
dispersive X-ray spectra (EDX) were collected using
the TEM for element chemical analysis. In all of the
TEM analyses, the samples were prepared by dropping
the colloidal dispersion onto a porous carbon grid. The
QD size and size-distribution data were obtained
based on the TEM images by measuring at least 100
randomly selected nanoparticles using an image
processing program (ImageJ, version 1.44, public
domain, National Institutes of Health).
ZnS-CMC_4 and ZnS-CMC_10 quantum dots were
analyzed by diffuse reflectance infrared Fourier
transform spectroscopy (DRIFTS) method (Thermo
Fischer, Nicolet 6700) over the range of
400–4,000 cm-1 using 64 scans and a 2 cm-1 reso-
lution. These samples were prepared by placing a
droplet of the chitosan solution or ZnS-CMC disper-
sions onto KBr powder and drying at the temperature
of (60 ± 2 �C) for 24 h. CMC solutions at the same
pH values (4.0 and 10.0) were used as references.
Zeta potential measurements were performed on
quantum dot colloidal media using a Zetaplus instru-
ment by applying the laser light diffusion method
(Brookhaven Instruments). This instrument uses the
laser Doppler electrophoresis technique (35 mW red
diode laser at k = 660 nm). All tests were performed
using a minimum of three replicates (n C 3), and the
values were averaged (Table 1).
Results and discussion
The FTIR spectra of chitosan (CHI) and carbo-
xymethylchitosan (CMC) are showed in Fig. 1. The
main bands associated with chitosan and CMC
observed in the FTIR spectra are summarized and
listed in Table 2. Changes in the macromolecule of
chitosan after the carboxymethylation reaction were
detected by infrared spectroscopy. Unlike the chitosan
spectrum (Fig. 1(a)), a characteristic band is observed
at approximately 1,731 cm-1, which is assigned to
carboxyl (–COOH) groups. Protonation of the amine
group in CMC causes the appearance of two new
bands. The first band at 1,640–1,620 cm-1, associated
with the antisymmetric –NH3? stretching overlaps the
amide I band, and the second band at
1,550–1,500 cm-1 is related to the –NH3? symmetric
deformation. These bands indicated the H-form CMC
(H-CMC). In addition, the absorbance bands at 1,588
and 1,412 cm-1 were attributed to the symmetric and
2504 Page 4 of 14 J Nanopart Res (2014) 16:2504
123

asymmetric axial deformations of COO-, respec-
tively, which are the characteristics of sodium carbo-
xymethylchitosan (Na-CMC). Based on the results,
the acid form and the Na-salt of CMC were produced.
Because CMC was prepared in alkaline solution, the
carboxyl groups are deprotonized. After the neutral-
ization procedure, both forms of CMC (Na-CMC and
H-CMC) were detected, indicating that the complete
conversion of the salt form to the free acid form was
not achieved even when washing to acid condition (pH
3.0).
From Fig. 2 (TG/DTG), which shows the thermal
analyses of chitosan and CMC, it was possible to
determine the temperatures for the occurrence of the
main thermal events associated with losses of mass.
Two steps can be observed in the TG/DTG curve of
chitosan (Fig. 2A). The first region of temperature
ranges from 25 to 110 �C with a peak centered at
52 �C and mass loss of approximately 10.7 %, which
was due to the evaporation of water physically
adsorbed in the polymeric network. The second region
starts at the temperature of approximately 250 �C and
ends at 400 �C with a corresponding mass loss of
approximately 52 %, which is attributed to the thermal
degradation of polymeric chain (Jiang et al. 2010).
Both stages are associated with endothermic peaks in
the DSC curve (not showed). Figure 2B indicates that
CMC derivative also exhibited a first stage of mass
loss in the range of 25–125 �C, primarily associated
with water removal. The total mass loss in this step
was 12.9 %, which is higher than that calculated for
the parent chitosan, and the temperature correspond-
ing to the maximum loss is 49 �C. These data could be
attributed to the higher hydrophilicity of CMC due to
the character of the negatively charged carboxymethyl
groups incorporated in the chitosan backbone, con-
sidering that the gain of water is mostly related to the
concentration of hydrophilic groups in the polymer
(Ujang et al. 2011). For CMC, the region of the TG
Table 1 Optical and morphological parameters of ZnS quantum dots capped by CMC as a function of the pH during the synthesis
Sample pH kexc (nm) EQD (eV) Blue-shift (eV) Bulka = 3.61 Size—2r (nm)
ZnS-CMC_4 4.0 ± 0.2 281 ± 2 3.83 ± 0.02 0.22 ± 0.02 4.2 ± 0.1
ZnS-CMC_10 10.0 ± 0.2 268 ± 2 4.10 ± 0.02 0.49 ± 0.02 3.2 ± 0.1
a Reference of the bulk value ZnS (cubic crystalline structure, Cooper et al. 2011)
1900 1800 1700 1600 1500 1400 1300
-CH 1380
Abs
orba
nce
(a.u
.)
Wavenumber (cm-1)
(a)
(b)
-NH+
3
-COOH1731
1640-1620
1588-COO-
1550-1500
-NH+
3
1412-COO-
-C=OAmide I
1650 -NH -NH
2 and Amide II
1575
-CNAmide III
1320-CH 1422
Fig. 1 The FTIR spectra of chitosan (a) and CMC (b)
Table 2 FTIR vibrational bands associated with CHI and
CMC (Chen and Park 2003; Lawrie et al. 2007; Abreu and
Campana-Filho 2009; Yan et al. 2011; Mansur et al. 2013)
Wavenumber
(cm-1)
Band assignment Material
1,740–1,730 –COOH stretch H-CMC
1,650 –C=O bend (Amide I) CHI and
CMC
1,640–1,620 –NH3? antisymmetric stretch H-CMC
1,600–1,580 –COO- symmetric stretch Na-CMC
1,590–1,550 –NH bend (NH2 and Amide II) CHI and
CMC
1,550–1,500 –NH3? symmetric stretch H-CMC
1,422 –CH3 antisymmetric
deformation
CHI and
CMC
1,412 –COO- asymmetric stretch Na-CMC
1,380 –CH3 symmetric deformation CHI and
CMC
1,320 –CN stretch (Amide III) CHI and
CMC
1,120–1,090 –C–O stretch (C3-OH
secondary alcohol)
CHI and
CMC
1,060–1,020 –C–O stretch (C6-OH primary
alcohol)
CHI and
CMC
J Nanopart Res (2014) 16:2504 Page 5 of 14 2504
123

curve related to degradation of polymer ranges from
200 to 450 �C (mass loss equal to 47 %) and consists
of three endothermic peaks at 275, 302, and 370 �C
corresponding to the decomposition of carboxylic
groups, glucosamine units, and sodium salt carboxy-
methyl species, respectively (Ujang et al. 2011). These
data reveal the introduction of carboxymethyl groups
in the chitosan structure and the reduction of the
thermal stability of the polymer derivative as the
temperature corresponding to the onset of the degra-
dation step decreased (Ujang et al. 2011).
The solubility tests based on UV–Vis transmittance
revealed that CMC solutions were soluble under acidic
and alkaline conditions, and only insoluble in the
range of 6.0 \ pH \ 7.5. This is one of the major
advantages of CMC derivative over chitosan because
it is soluble in both acid and alkaline aqueous media,
and chitosan is insoluble at pH higher than 6.5. The
solubility range of chitosan and chitosan derivatives
may be explained based on the overall balance of
negative and positive charges on the polymer chain.
Under acidic conditions (pH \ pKa & 6.5) (Sonia
and Sharma 2011), the amine group of chitosan is
protonated to various degrees (Eq. 1). Protonated
amine groups repeal each other, favoring the chitosan-
water interactions, which overcomes the associative
hydrogen bonds and hydrophobic interactions
between chains. In a moderately acidic to neutral
medium, the number of –NH3? species and the net
result of the interchain repulsive electrostatic forces
are reduced and solubility reduces.
CHI� NH2 ðsÞ þ HþðaqÞ ! CHI� NHþ3 ðaqÞ: ð1Þ
The CMC synthesized in this study presents both
acid (CHI–CH2COOH) and sodium salt (CHI–CH2-
COONa) forms of CMC. In this sense, the sodium salt
is readily available for dissociation in aqueous solu-
tion (Eq. 2), because it is practically independent of
the pH. On the other hand, the dissociation of the acid
form of CMC is pH-dependent (Eq. 3). In acidic
solutions, two species of protonated groups are present
in CMC, carboxyls (–COOH), and amines (–NH3?).
As the pH is raised (i.e., by adding OH-), the
carboxylic groups (–COOH) are firstly deprotonated
forming carboxylates (–COO-, Eq. 3) and then
followed by the deprotonation of amines from
–NH3? to –NH2 (Wang et al. 2008) (Eq. 4). The
schematic representation of the expected chemical
steps of deprotonation of CMC by increasing the pH is
showed in Eq. 5.
CHI� CH2COONaðsÞ þ H2OðlÞ! CHI� CH2COO�ðaqÞ þ NaþðaqÞ ð2Þ
CHI� CH2COOHðsÞ þ OH�ðaqÞ! CHI� CH2COO�ðaqÞ þ H2OðlÞ ð3Þ
CHI� NHþ3 ðaqÞ þ OH�ðaqÞ ! CHI� NH2 ðaqÞ
þ H2OðlÞ ð4Þ
CHICH2COOH
NHþ3
���!þOH�CHICH2COO�
NHþ3
���!þOH�CHICH2COO�
NH2
pH1 \ pH2 \ pH3
:
ð5ÞBecause the main factor determining the solubility
of the polymer at a given pH is the net result of positive
and negative charges, the insolubility of the polymer is
predominantly due to an insufficient excess of charge
(Abreu and Campana-Filho 2009). As a result, the
effect of carboxymethyl groups incorporation in
chitosan chain (CMC) was a slight shift to lower pH
20
40
60
80
100
Temperature (oC)
Mas
s lo
ss (
%)
(a)
(b)
300oC
52oC
10.7%
-2
0
2
4
6
8
10
12
14
Derivative m
ass (%/m
in)
0 100 200 300 400 500 600 700
0 100 200 300 400 500 600 70020
40
60
80
100
Temperature (oC)
Mas
s lo
ss (
%)
(a)
(b)
49oC
275oC
302oC
371oC
0
1
2
3
4
5
6
Derivative m
ass (%/m
in)
12.3%
(A)
(B)
Fig. 2 TG (a) and DTG (b) curves of chitosan (A) and CMC (B)
2504 Page 6 of 14 J Nanopart Res (2014) 16:2504
123

(from 6.5 in CHI to 6.0 in CMC) of the low solubility
range in water, probably caused by the presence of
dissociated –COO- side chains balancing the ammo-
nium groups (Chen and Park 2003; Abreu and
Campana-Filho 2009). In the pH range from 6.0 to
7.5, it is expected that the polymer was uncharged or
slightly positive or negative, resulting in lower
solubility. Below pH 6.0 the protonated amine positive
charges predominate and promote CMC solubility.
Additionally, above 7.5, the carboxymethyl groups
250 300 350 400 450 500 550
ZnS-CMC_4 ZnS-CMC_10
Wavelength (nm)
Ab
sorb
ance
(a.
u.)
ZnS bulk 343 nm
λexc
= 281 nm
λexc
= 268 nm
416 nm435 nm
470 nm(a)
(b)
(a)
(b)
0
50
100
150
200
250 Relative F
luo
rescence U
nits (R
FU
)
2.0 2.5 3.0 3.5 4.0 4.5 5.00
5000
10000
15000
20000
25000
30000
EQD
= 3.83 eVBlue Shift = 0.22 eV2R = 4.2 nm
ZnS-CMC_4 ZnS-CMC_10
(αhν
)2 ( e
V.c
m-1)2
hν (eV)
EQD
= 4.10 eVBlue Shift = 0.49 eV2R = 3.2 nm
(a) (b)
ZnS bulk3.61 eV
(A)
(B)
Inset
ZnS
Zn+2
Zn+2
Zn+2
Zn+2
Zn+2
Fig. 3 UV-Vis and PL spectra (A) and the optical band gap using ‘‘Tauc’’ relation (B) for ZnS conjugates synthesized at different pH:
(a) pH 4.0 and (b) pH 10.0. Inset: blue luminescence under UV excitation. (Color figure online)
J Nanopart Res (2014) 16:2504 Page 7 of 14 2504
123
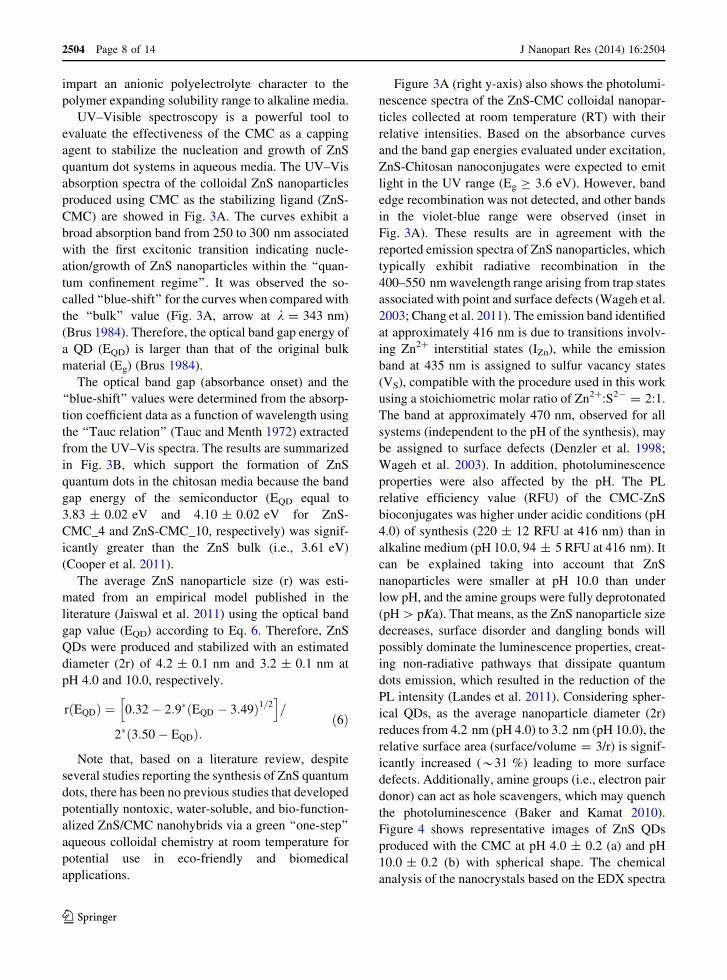
impart an anionic polyelectrolyte character to the
polymer expanding solubility range to alkaline media.
UV–Visible spectroscopy is a powerful tool to
evaluate the effectiveness of the CMC as a capping
agent to stabilize the nucleation and growth of ZnS
quantum dot systems in aqueous media. The UV–Vis
absorption spectra of the colloidal ZnS nanoparticles
produced using CMC as the stabilizing ligand (ZnS-
CMC) are showed in Fig. 3A. The curves exhibit a
broad absorption band from 250 to 300 nm associated
with the first excitonic transition indicating nucle-
ation/growth of ZnS nanoparticles within the ‘‘quan-
tum confinement regime’’. It was observed the so-
called ‘‘blue-shift’’ for the curves when compared with
the ‘‘bulk’’ value (Fig. 3A, arrow at k = 343 nm)
(Brus 1984). Therefore, the optical band gap energy of
a QD (EQD) is larger than that of the original bulk
material (Eg) (Brus 1984).
The optical band gap (absorbance onset) and the
‘‘blue-shift’’ values were determined from the absorp-
tion coefficient data as a function of wavelength using
the ‘‘Tauc relation’’ (Tauc and Menth 1972) extracted
from the UV–Vis spectra. The results are summarized
in Fig. 3B, which support the formation of ZnS
quantum dots in the chitosan media because the band
gap energy of the semiconductor (EQD equal to
3.83 ± 0.02 eV and 4.10 ± 0.02 eV for ZnS-
CMC_4 and ZnS-CMC_10, respectively) was signif-
icantly greater than the ZnS bulk (i.e., 3.61 eV)
(Cooper et al. 2011).
The average ZnS nanoparticle size (r) was esti-
mated from an empirical model published in the
literature (Jaiswal et al. 2011) using the optical band
gap value (EQD) according to Eq. 6. Therefore, ZnS
QDs were produced and stabilized with an estimated
diameter (2r) of 4.2 ± 0.1 nm and 3.2 ± 0.1 nm at
pH 4.0 and 10.0, respectively.
r EQDð Þ ¼ 0:32� 2:9� EQD � 3:49ð Þ1=2h i
=
2� 3:50� EQDð Þ:ð6Þ
Note that, based on a literature review, despite
several studies reporting the synthesis of ZnS quantum
dots, there has been no previous studies that developed
potentially nontoxic, water-soluble, and bio-function-
alized ZnS/CMC nanohybrids via a green ‘‘one-step’’
aqueous colloidal chemistry at room temperature for
potential use in eco-friendly and biomedical
applications.
Figure 3A (right y-axis) also shows the photolumi-
nescence spectra of the ZnS-CMC colloidal nanopar-
ticles collected at room temperature (RT) with their
relative intensities. Based on the absorbance curves
and the band gap energies evaluated under excitation,
ZnS-Chitosan nanoconjugates were expected to emit
light in the UV range (Eg C 3.6 eV). However, band
edge recombination was not detected, and other bands
in the violet-blue range were observed (inset in
Fig. 3A). These results are in agreement with the
reported emission spectra of ZnS nanoparticles, which
typically exhibit radiative recombination in the
400–550 nm wavelength range arising from trap states
associated with point and surface defects (Wageh et al.
2003; Chang et al. 2011). The emission band identified
at approximately 416 nm is due to transitions involv-
ing Zn2? interstitial states (IZn), while the emission
band at 435 nm is assigned to sulfur vacancy states
(VS), compatible with the procedure used in this work
using a stoichiometric molar ratio of Zn2?:S2- = 2:1.
The band at approximately 470 nm, observed for all
systems (independent to the pH of the synthesis), may
be assigned to surface defects (Denzler et al. 1998;
Wageh et al. 2003). In addition, photoluminescence
properties were also affected by the pH. The PL
relative efficiency value (RFU) of the CMC-ZnS
bioconjugates was higher under acidic conditions (pH
4.0) of synthesis (220 ± 12 RFU at 416 nm) than in
alkaline medium (pH 10.0, 94 ± 5 RFU at 416 nm). It
can be explained taking into account that ZnS
nanoparticles were smaller at pH 10.0 than under
low pH, and the amine groups were fully deprotonated
(pH [ pKa). That means, as the ZnS nanoparticle size
decreases, surface disorder and dangling bonds will
possibly dominate the luminescence properties, creat-
ing non-radiative pathways that dissipate quantum
dots emission, which resulted in the reduction of the
PL intensity (Landes et al. 2011). Considering spher-
ical QDs, as the average nanoparticle diameter (2r)
reduces from 4.2 nm (pH 4.0) to 3.2 nm (pH 10.0), the
relative surface area (surface/volume = 3/r) is signif-
icantly increased (*31 %) leading to more surface
defects. Additionally, amine groups (i.e., electron pair
donor) can act as hole scavengers, which may quench
the photoluminescence (Baker and Kamat 2010).
Figure 4 shows representative images of ZnS QDs
produced with the CMC at pH 4.0 ± 0.2 (a) and pH
10.0 ± 0.2 (b) with spherical shape. The chemical
analysis of the nanocrystals based on the EDX spectra
2504 Page 8 of 14 J Nanopart Res (2014) 16:2504
123

revealed that Zn and S are the major elements
(Fig. 4C), excluding the copper related to the TEM
grid, the oxygen and carbon peaks associated with the
polymer stabilizer, and Si from the detector. The
lattice fringes with an interplanar distance of approx-
imately 0.30 ± 0.02 nm can be assigned to the (111)
0
5
10
15
20
25
30
Fre
quen
cy (
%)
Diameter (nm)
Energy (keV)
C
O
CuZn
Si S
Cu
Zn Cu Zn
2.2 2.4 2.6 2.8 3.0 3.2
0.0 0.5 1.0 1.5 2.0 7.5 8.0 8.5 9.0 9.5 10.0
3.2 3.4 3.6 3.8 4.0 4.2 4.4 4.6 4.8 5.0 5.20
5
10
15
20
25
30
Fre
quen
cy (
%)
Diameter (nm)
2R = 4.3±0.3 nm 2R = 2.7±0.2 nm
d = 0.30±0.2 nm
(A) (B)
(C)
Inset
(D) (E)
Fig. 4 TEM images of ZnS-CMC_4 (A) and ZnS-CMC_10 (B). Inset nanocrystal plane spacing. Typical EDX spectrum of the QDs
(C). Histograms of the nanoparticle size distribution of QDs synthesized at pH 4.0 (D) and pH 10.0 (E)
J Nanopart Res (2014) 16:2504 Page 9 of 14 2504
123

plane of ZnS with a cubic crystalline structure (JCPDS
05-0566) as showed in the inset of Fig. 4B. The
histogram of the size distribution of ZnS-CMC_4
nanoconjugates (Fig. 4D) indicates a monodisperse
distribution with an average size of 4.3 ± 0.3 nm.
Similarly, the ZnS-CMC_10 samples exhibited rea-
sonably monodisperse nanoparticles, with an average
size centered at approximately 2.7 ± 0.2 nm
(Fig. 4E). Thus, the TEM results demonstrated that
ZnS quantum dots were properly stabilized by CMC,
in reasonable agreement with the values obtained from
the UV–Vis optical absorbance in the previous section
for ZnS-CMC_4 (2r = 4.2 ± 0.1 nm) and ZnS-
CMC_10 (2r = 3.2 ± 0.1 nm).
Figure 5A, B (curves (b)) show the FTIR spectra of
the ZnS-CMC_4 and ZnS-CMC_10 conjugates,
respectively, compared with their ligand solutions
(CMC at pH 4 and pH 10, curves (a)). The FTIR
spectra of CMC were compatible with the amphiprotic
behavior of CMC. At pH 4, the vibration mode
associated with protonated amines (–NH3?) is over-
lapped with the characteristic band of amide I. The
C=O stretch band of the carboxyl group is absent from
the spectrum due to deprotonation of carboxylic group
from H-CMC in aqueous solution at this pH. Instead,
the band that is assigned to carboxylates (COO-)
stretching mode associated with both deprotonated
forms and dissociated Na-CMC is observed. For CMC
Abs
orba
nce
(a.u
.)
(b)
(a)
Amide I
COO-
-NH+
3
C6-OH
(a)
(b)
C3-OH
Abs
orba
nce
(a.u
.)
Amide I
COO-
(a)
(b)
1800 1750 1700 1650 1600 1550 1500 1150 1100 1050 1000 950
C3-OH
C6-OH
(a)
(b)
1800 1750 1700 1650 1600 1550 1500 1150 1100 1050 1000 950
(A)
(B)
Wavenumber (cm-1)
Wavenumber (cm-1)
Fig. 5 FTIR spectra results for (a) CMC and (b) ZnS-CMC conjugates at pH 4.0 (A) and pH 10.0 (B). Vibrational spectral regions:
1,800–1,500 cm-1 (left) and 1,150–950 cm-1 (right)
2504 Page 10 of 14 J Nanopart Res (2014) 16:2504
123

solution at pH 10, as amine groups from chitosan are
fully deprotonated, the band at 1,640–1,620 cm-1 is
not present, emphasizing the carboxylate band at
1,600–1,580 cm-1. In addition to amines, amides, and
carboxylate groups, chitosan and CMC also have
hydroxyls as possible reactive sites (Riva et al. 2011).
The absorptions at 1,020–1,060 cm-1 and
1,090–1,120 cm-1 indicate the C–O stretching vibra-
tion in CMC, which are associated with the C6-OH
primary alcohol and the C3-OH secondary alcohol,
respectively (Table 2).
Some changes in the relative intensities and/or
energies of the bands assigned to these reactive species
in the FTIR spectra may be expected after conjugation
with the nanoparticles (Cooper et al. 2011). Such a
trend may be associated with the formation of metal
ion complexes with CMC caused by ion exchange,
chelating, and electrostatic interactions in the coordi-
nation compounds (metal ions–ligands) (Deacon and
Phillips 1980; Cooper et al. 2011). The relative
‘‘excess’’ of zinc ions compared with sulfides used in
the synthesis ([S2-]:[Zn2?] = 1:2) was designed for
stabilizing the ZnS nanoparticles with the electroneg-
ative groups of the capping ligands (i.e., amines and
hydroxyls in CHI and carboxylates in CMC). Based on
the results (Fig. 5), in the FTIR spectra of both
0-200 -150 -100 -50 50 100 150 2000.0
0.2
0.4
0.6
0.8
1.0
Pow
er
Zeta Potential (mV)
-33.0+/-2.1 +32.9+/2.0
(a)(b)
-
- -
-
- -
--
-
-
-
-
-
-
-
- +
+ +
+ +
+ +
+
+
+ +
++
+ ZnS “core”
-NH3+
-NH3+
-NH3+
CMC “shell”
Zn2+
-NHCH2COO- ---
-NHCH2COO----
(c) Zn2+
-NHCH2COO-
-NHCH2COO-
-NHCH2COO-
+
+
Fig. 6 Zeta potential curve of CMC solutions at pH 4.0 (a) and pH 10.0 (b). Schematic representation of the zeta potential and the
interactions at the ZnS-CMC nanointerfaces (not to scale) (c)
J Nanopart Res (2014) 16:2504 Page 11 of 14 2504
123

conjugated QDs, no considerable changes were
detected in the relative intensity and wavenumber of
the amines, amides, and hydroxyls. The major change
observed after CMC conjugation with ZnS was in the
relative intensity of the carboxylate band vibration that
weakened or even disappeared. Hence, it may be
assumed that the carboxylate groups of CMC are
involved in the formation and stabilization of ZnS
quantum dots. The differences between the FTIR
spectra of CMC before and after conjugation with ZnS
nanocrystals can be assigned to the formation of
coordination complexes Zn2?–(COO-) on the surface
of the QDs.
As a consequence of the stabilization of ZnS nuclei
mostly by carboxylate species, a significant influence
of pH on the formation/growth/stabilization of the ZnS
QDs in CMC colloidal solution was observed. Based
on the UV–Vis spectroscopy results, when the pH was
raised from 4 to 10, the average nanocrystal size was
decreased by approximately 30 % (from 4.2 to
3.2 nm). The decrease in size could be attributed to
the sum of several contributions toward the formation
of the nanoconjugates made by the ZnS ‘‘core’’ and the
CMC ‘‘shell’’. At relatively lower pH (pH 4), most of
the amine groups of the chitosan derivative are
protonated; as a result, the positively charged transi-
tion metal ions [Zn2?] must compete with the
electrostatic attraction between NH3?���COO- reduc-
ing the sites for metal–ligand interactions. However,
as the pH increases up to 10, amine and carboxylic
groups are fully deprotonated, and all COO- become
available in the CMC chain for complexation with
Zn2?, favoring the stabilization of the ZnS nanocrys-
tals at smaller dimensions due to the increase of the
number of nucleation sites.
The zeta potential (ZP) calculated for ZnS-CMC_4
and ZnS-CMC_10 was ?32.9 ± 2.0 mV (Fig. 6a)
and -33.0 ± 2.1 mV (Fig. 6b), respectively, indicat-
ing that stabilization of these nanoparticles rely both
on electrostatic repulsion and steric hindrance of the
polymer chains adsorbed physically and chemically to
prevent close contact between the fluorescent QDs
(Jiang et al. 2009).
These results indicated that the CMC conjugates
possess positive surface charges at pH 4 and negative
surface charges at pH 10. At pH 4, the carboxylic
groups are mostly involved in the formation of
coordination complexes at ZnS nanointerfaces, leaving
the protonated amines positively charged facing out-
wards in the polymeric ‘‘shell’’, which are available for
anions adsorption/chelation. In contrast, at alkaline
medium, all amines are deprotonated and carboxylates
control both the nucleation and growth of the ZnS
quantum dots and the stabilization of the ‘‘core–shell’’
nanohybrids. In addition, the negatively charged shell
is available for electrostatic cations uptake. Figure 6c
summarizes the results of the zeta potential analysis
with a schematic representation of the interactions at
interface based on the FTIR results. Based on the
results, it may be suggested that the nanohybrids made
of ZnS QD-carboxymethylchitosan may be designed
and tailored to improve the adsorption of cations and
anions in a broad range of pH in water media.
Furthermore, considering the known biocompatibility
of chitosan and its derivatives, the nanoconjugates
produced in this study could be possibly utilized as
cationic/anionic sorbents for environmental and sus-
tainable applications, with prospective recovery due to
their fluorescent property at the same time.
Conclusions
In the present work, ZnS QDs directly bio-function-
alized by carboxymethylchitosan were synthesized
using a green single-step colloidal process in aqueous
medium at room temperature. The results indicated
that varying the pH within a wide range, from acid (pH
4.0) to alkaline (pH 10.0) CMC solutions, significantly
affects the average size and zeta potential of ZnS
nanocrystals produced. By increasing pH from 4.0 to
10.0, the diameter decreased from 4.2 to 3.2 nm and
the ZP changed from ?33 to -33 mV, leading to
changes in the luminescent properties of the ZnS
nanohybrids. In addition, the results indicated that the
stabilization mechanism of the ZnS nanoconjugates
was predominantly determined by the interactions of
the carboxylate functional groups of CMC with Zn2?
at the surface of the QDs.
Acknowledgments The authors acknowledge the financial
support from CAPES, FAPEMIG, and CNPq. The authors
express their gratitude to the staff of the Microscopy Center/
UFMG for TEM analysis.
Conflict of interests The authors declare that they have no
competing interests.
2504 Page 12 of 14 J Nanopart Res (2014) 16:2504
123

References
Abreu FR, Campana-Filho SP (2009) Characteristics and
properties of carboxymethylchitosan. Carbohydr Polym
75:214–221. doi:10.1016/j.carbpol.2008.06.009
Baker DR, Kamat PV (2010) Tuning the emission of CdSe
quantum dots by controlled trap enhancement. Langmuir
26:11272–11276. doi:10.1021/la100580g
Brus LE (1984) Electron-electron-hole in small semiconductors
crystallites: the size dependence of the lowest excited
electronic state. J Chem Phys 80:4403–4409. doi:10.1063/
1.447218
Chang S-Q, Kang B, Dai Y-D, Zhang H-X, Chen D (2011) One-
step fabrication of biocompatible chitosan coated ZnS and
ZnS:Mn2? quantum dots via gamma-radiation route.
Nanoscale Res Lett 6:591. doi:10.1186/1556-276X-6-591
Chen X-G, Park H-J (2003) Chemical characteristics of O-car-
boxymethyl chitosans related to the preparation conditions.
Carbohydr Polym 53:355–359. doi:10.1016/S0144-
8617(03)00051-1
Cooper JK, Franco AM, Gul S, Corrado C, Zhang JZ (2011)
Characterization of primary amine capped CdSe, ZnSe,
and ZnS quantum dots by FT-IR: determination of surface
bonding interaction and identification of selective desorp-
tion. Langmuir 27:8486–8493. doi:10.1021/la201273x
Dash M, Chiellini F, Ottenbrite RM, Chiellini E (2011) Chito-
san—a versatile semi-synthetic polymer in biomedical
applications. Prog Polym Sci 36:981–1014. doi:10.1016/j.
progpolymsci.2011.02.001
Deacon GB, Phillips RJ (1980) Relationships between the carbon-
oxygen stretching frequencies of carboxylato complexes and
the type of carboxylate coordination. Coord Chem Rev
33:227–250. doi:10.1016/S0010-8545(00)80455-5
Denzler D, Olschewski M, Sattler K (1998) Luminescence
studies of localized gap states in colloidal ZnS nanocrys-
tals. J Appl Phys 84:2841–2845. doi:10.1063/1.368425
Emerich DF (2005) Nanomedicine—prospective therapeutic
and diagnostic applications. Expert Opin Biol Ther 5:1–5.
doi:10.1517/14712598.5.1.1
Etheridge ML, Campbell SA, Erdman AG, Haynes CL, Wolf
SM, Cullough J (2013) The big picture on nanomedicine:
the state of investigational and approved nanomedicine
products. Nanomedicine 9:1–14. doi:10.1016/j.nano.2012.
05.013
Jaiswal A, Sanpui P, Chattopadhyay A, Ghosh SS (2011)
Investigating fluorescence quenching of ZnS quantum dots
by silver nanoparticles. Plasmonics 6:125–132. doi:10.
1007/s11468-010-9177-0
Jiang J, Oberdorster G, Biswas P (2009) Characterization of
size, surface charge, and agglomeration state of nanopar-
ticle dispersions for toxicological studies. J Nanopart Res
11:77–89. doi:10.1007/s11051-008-9446-4
Jiang M, Wanga K, Kennedy JF, Nie J, Yu Q, Ma G (2010)
Preparation and characterization of water-soluble chitosan
derivative by Michael addition reaction. Int J Biol Mac-
romol 47:696–699. doi:10.1016/j.ijbiomac.2010.09.002
Jiang R, Zhu H, Yao J, Fu Y, Guan Y (2012) Chitosan hydrogel
films as a template for mild biosynthesis of CdS quantum
dots with highly efficient photocatalytic activity. Appl Surf
Sci 258:3513–3518. doi:10.1016/j.apsusc.2011.11.105
Landes CF, Braun M, El-Sayed MA (2011) On the nanoparticle
to molecular size transition: fluorescence quenching stud-
ies. J Phys Chem B 105:10554–10558. doi:10.1021/
jp0118726
Lawrie G, Keen I, Drew B, Chandler-Temple A, Rintoul L,
Fredericks P, Grøndahl L (2007) Interactions between
alginate and chitosan biopolymers characterized using
FTIR and XPS. Biomacromolecules 8:2533–2541. doi:10.
1021/bm070014y
Lim KHC, Riddell LJ, Nowson CA, Booth AO, Szymlek-Gay
EA (2013) Iron and zinc nutrition in the economically-
developed world: a review. Nutrients 5:3184–3211. doi:10.
3390/nu5083184
Liu XF, Guan YL, Yang DZ, Li Z, Yao KD (2001) Antibacterial
action of chitosan and carboxymethylated chitosan. J Appl
Polym Sci 79:1324–1335. doi:10.1002/1097-
4628(20010214)79:7\1324:AID-APP210[3.0.CO;2-L
Mansur HS, Mansur AAP, Curti E, de Almeida MV (2012)
Bioconjugation of quantum-dots with chitosan and N,N,N-
trimethyl chitosan. Carbohydr Polym 90:189–196. doi:10.
1016/j.carbpol.2012.05.022
Mansur HS, Mansur AAP, Curti E, de Almeida MV (2013)
Functionalized-chitosan/quantum dots nano-hybrids for
nanomedicine applications: towards biolabeling and bio-
sorbing phosphate metabolites. J Mater Chem B
1:1696–1711. doi:10.1039/C3TB00498H
Rajabi HR, Khani O, Shamsipur M, Vatanpour V (2013) High-
performance pure and Fe3?-ion doped ZnS quantum dots
as green nanophotocatalysts for the removal of malachite
green under UV-light irradiation. J Hazard Mater
250(251):370–378. doi:10.1016/j.jhazmat.2013.02.007
Riva R, Ragelle H, des Rieux A, Duhem N, Jerome C, Preat V
(2011) Chitosan and chitosan derivatives in drug delivery
and tissue engineering. Adv Polym Sci 244:19–44. doi:10.
1007/12_2011_137
Santos JCC, Mansur AAP, Mansur HS (2013) One-step biofunc-
tionalization of quantum dots with chitosan and N-palmitoyl
chitosan for potential biomedical applications. Molecules
18:6550–6572. doi:10.3390/molecules18066550
Sonia TA, Sharma CP (2011) Chitosan and its derivatives for
drug delivery perspective. Adv Polym Sci 243:23–54.
doi:10.1007/12_2011_117
Tan WB, Huang N, Zhang Y (2007) Ultrafine biocompatible
chitosan nanoparticles encapsulating multi-coloured
quantum dots for bioapplications. J Colloid Interface Sci
310:464–470. doi:10.1016/j.jcis.2007.01.083
Tauc J, Menth A (1972) States in the gap. J Non-Cryst Solids
8(10):569–585. doi:10.1016/0022-3093(72)90194-9
Ujang Z, Diah M, Rashid AHA, Halim AS (2011) The devel-
opment, characterization and application of water soluble
chitosan. In: Elnashar M (ed) Biotechnology of biopoly-
mers, ISBN: 978-953-307-179-4, InTech, doi: 10.5772/
16771
Wageh S, Ling ZS, Xu-Rong X (2003) Growth and optical
properties of colloidal ZnS nanoparticles. J Cryst Growth
255:332–337. doi:10.1016/S0022-0248(03)01258-2
Wang LC, Chen XG, Liu CS, Li PW, Zhou YM (2008) Disso-
ciation behaviors of carboxyl and amine groups on car-
boxymethyl-chitosan in aqueous system. J Polym Sci B
Polym Phys 46:1419–1429. doi:10.1002/polb.21475
J Nanopart Res (2014) 16:2504 Page 13 of 14 2504
123

Yan H, Dai J, Yang Z, Yang H, Cheng R (2011) Enhanced and
selective adsorption of copper (II) ions on surface carbo-
xymethylated chitosan hydrogel beads. Chem Eng J
174:586–594. doi:10.1016/j.cej.2011.09.064
Zhang ZB, Wang CC, Zakaria R, Ying JY (1998) Role of par-
ticle size in nanocrystalline TiO2-based photocatalysts.
J Phys Chem B 102:10871–10878. doi:10.1021/
jp982948?
2504 Page 14 of 14 J Nanopart Res (2014) 16:2504
123
Copyright © 2022 FDOKUMEN


![Fluorescent cellulose aerogels containing covalently immobilized (ZnS) ₓ (CuInS ₂) ₁₋ ₓ/ZnS (core/shell) quantum dots [2013]](https://static.fdokumen.com/doc/165x107/63372dc94554fe9f0c05b209/fluorescent-cellulose-aerogels-containing-covalently-immobilized-zns-cuins.jpg)