F057228838 (1)
58
KONSEP BIAYA DAN KLASIFIKASI BIAYA PERTEMUAN 2
Transcript of F057228838 (1)
KONSEP BIAYA DAN
KLASIFIKASI BIAYA
PERTEMUAN 2
© The McGraw-Hill Companies, Inc., 2003McGraw-Hill/Irwin
Pengertian
Cost (biaya) adalah alat pengukur pengorbanan sumber daya ekonomis untuk melakukan kegiatan tertentu.Expense( beban) adalah biaya yang bermanfaat dan telah dikorbankan. Apabila manfaat suatu barang atau jasa telah digunakan, maka biaya barang atau jasa itu menjadi beban. Sebaliknya , biaya yang belum dikorbankan diklasifikasikan sebagai “Aktiva” karena masih bermanfaat pada masa yang akandatang.
© The McGraw-Hill Companies, Inc., 2003McGraw-Hill/Irwin
Klasifikasi Biaya
1. Klasifikasi Umum Biaya. : Biaya Produksi. Terdiri dari 3 jenis yaitu : a. Direct Material. Adalah bagian yang menjadi bagian tidak terpisahkan dari produk jadi, dan dapat ditelusuri secara fisik dan mudah ke produk tersebut. Dikenal juga Indirect Material yaitu bahan yang digunakan untuk produksi yang tidak diklasifikasikan sebagai bahan langsung.
© The McGraw-Hill Companies, Inc., 2003McGraw-Hill/Irwin
b. Direct Labor Adalah adalah biaya yang terlibat dalam kegiatan produksi yang dapat diidentifikasi dengan produk dan mudah untukditelusuri kepada produk jadi. Indirect Labor adalah biaya tenaga kerja yang terlibat dalam produksi tetap tidak diklasifikasikan sebagai tenaga kerja langsung.
© The McGraw-Hill Companies, Inc., 2003McGraw-Hill/Irwin
c. Overhead Pabrik. Adalah biaya mencakup biaya prosuksi yang tidak termasuk dalam direct material dan direct labor. Termasuk disini adalah indirect manterial dan indirect labor. Biaya Direct Material ditambah dengan Direct Labor disebut “Prime Cost” dan biaya direct labor ditambah dengan biaya overhead pabrik disebut “ Conversion Cost”.
© The McGraw-Hill Companies, Inc., 2003McGraw-Hill/Irwin
Biaya Non Produksi ( Biaya Priodik). 1. Biaya Pemasaran dan Penjualan. 2. Biaya Administrasi.
© The McGraw-Hill Companies, Inc., 2003McGraw-Hill/Irwin
2. Klasifikasi Biaya dalam Laporan Keuangan : 1. Neraca. Dalam perusahaan manufaktur terdapat tiga persediaan dalam neraca yaitu
a. Persediaan bahan baku, b. Barang dalam proses c.Barang jadi. Sedangkan perusahaan dagang, hanya
mempunyai satu persediaan.
© The McGraw-Hill Companies, Inc., 2003McGraw-Hill/Irwin
2. Laporan Rugi Laba. Perhitungan biaya-biaya dapat dilihat pada laporan perhitungan rugi dan laba secara jelas baik perusahaan manufaktur dan perusahaan dagang.Perhitungan Harga Pokok Produksi yang ada pada perusahaan manufaktur adalah Biaya direct material + Direct labor dan Overhead Pabrik.
© The McGraw-Hill Companies, Inc., 2003McGraw-Hill/Irwin
3. Klasifikasi Biaya Untuk Memprediksi Perilaku Biaya. Dalam pembahasan ini ditekankan untuk membedakan biaya variabel dan tetap. Pemisahkan biaya tetap dan variabel dari“Biaya Semi Variabel” dengan 3 metode :a. Metode High and low.(titik rendah dan tinggi)b. Metode Least Square./Linear regression (Regresi linear)c. Metode Scatter Diagram ( Diagram pencar)
© The McGraw-Hill Companies, Inc., 2003McGraw-Hill/Irwin
4. Klasifikasi Biaya untuk Pembebanan Biaya ke Obyek Biaya. Obyek biaya adalah segala sesuatu di mana data biaya termasuk produk, lini produk, konsumen, pekerjaan dan subunit organisasi yang terdiri dari biaya langsung dan tidak langsung.
© The McGraw-Hill Companies, Inc., 2003McGraw-Hill/Irwin
5. Klasifikasi Biaya Untuk Pembuat Keputusan.Biaya sangat penting sebagai alat Keputusan manajemen. Hal inilah manajemen harus memahami konsep biaya Diffrential Cost, Opportunity Cost, Sunk Cost.
© The McGraw-Hill Companies, Inc., 2003McGraw-Hill/Irwin
• Diffrential Revenue dan Diffrential Cost
Diffrential Cost disebut juga Relevant Cost atau Incremental Cost. Differential cost adalah perbedaan biaya antara dua alternatif, sedangkan Difffrential revenue adalah perbedaan penghasilan antara dua alternatif. Perbedaan umum Antara dua alternatif yang relevan dalam pembuatan keputusan dalam kondisi tidak berubah dibawah berbagai alternatif dan tidak dipengaruhi oleh keputusan yang telah dibuat dapat diabaikan. Contoh:PT.ABC hendak memilih alternatif menggunakan komputer merk A dan B dioperasikan untuk disewakan. Keputusan manajemen, tergantung kepada operator yang menggunakan komputer tsb, apakah terdapat perbedaan upahnya. Selisih upah operator itulah yang disebut “Diffrential Cost”.
© The McGraw-Hill Companies, Inc., 2003McGraw-Hill/Irwin
• Opportunity Cost.Adalah manfaat potensial yang hilang atau dikorbankan karena adanya keputusan untuk memilih nya satu alternatif yang lebih menguntungkan. Manfaat potensial berupan Revenue (pendapatan), laba bersih atau Cost saving. Opportunity hanya ada dalam pengertian ekonomi dan tidak dicatat dalam buku besar.
© The McGraw-Hill Companies, Inc., 2003McGraw-Hill/Irwin
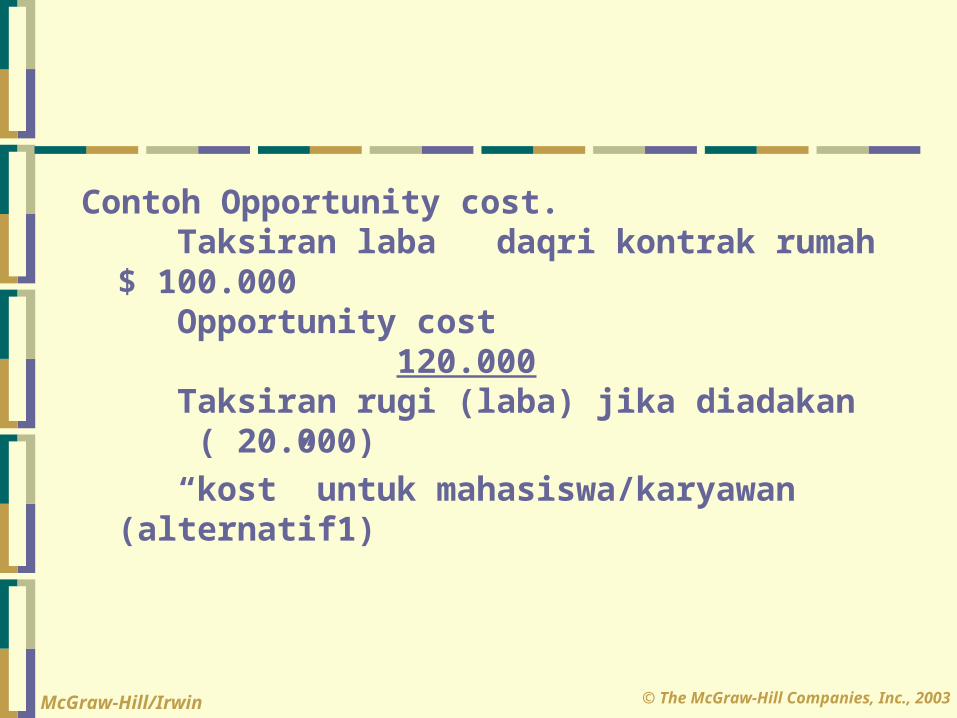
Contoh Opportunity cost. Taksiran laba daqri kontrak rumah $ 100.000 Opportunity cost 120.000 Taksiran rugi (laba) jika diadakan ( 20.000) “kost” untuk mahasiswa/karyawan (alternatif1)
© The McGraw-Hill Companies, Inc., 2003McGraw-Hill/Irwin
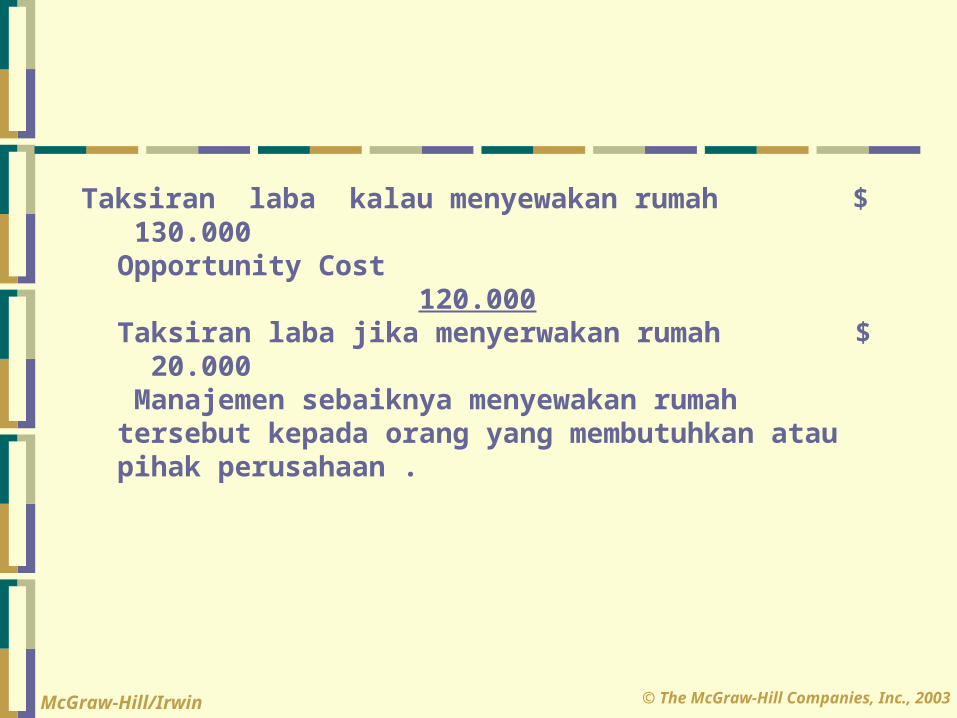
Taksiran laba kalau menyewakan rumah $ 130.000Opportunity Cost 120.000Taksiran laba jika menyerwakan rumah $ 20.000 Manajemen sebaiknya menyewakan rumah tersebut kepada orang yang membutuhkan atau pihak perusahaan .
© The McGraw-Hill Companies, Inc., 2003McGraw-Hill/Irwin
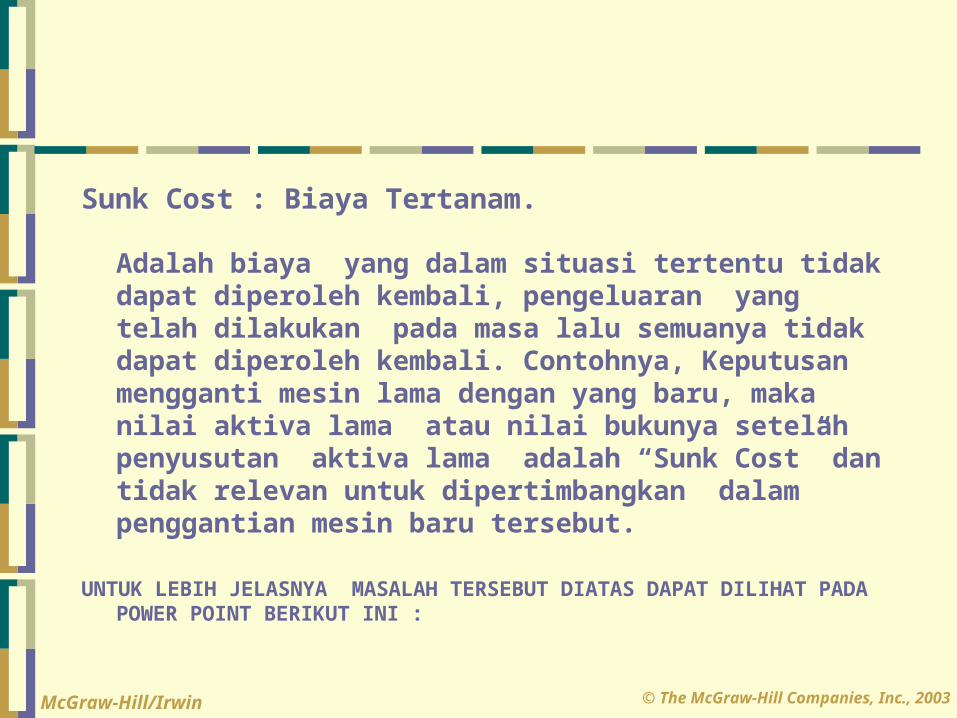
Sunk Cost : Biaya Tertanam.
Adalah biaya yang dalam situasi tertentu tidak dapat diperoleh kembali, pengeluaran yang telah dilakukan pada masa lalu semuanya tidak dapat diperoleh kembali. Contohnya, Keputusan mengganti mesin lama dengan yang baru, maka nilai aktiva lama atau nilai bukunya setelah penyusutan aktiva lama adalah “Sunk Cost” dan tidak relevan untuk dipertimbangkan dalam penggantian mesin baru tersebut.
UNTUK LEBIH JELASNYA MASALAH TERSEBUT DIATAS DAPAT DILIHAT PADA POWER POINT BERIKUT INI :
© The McGraw-Hill Companies, Inc., 2003McGraw-Hill/Irwin
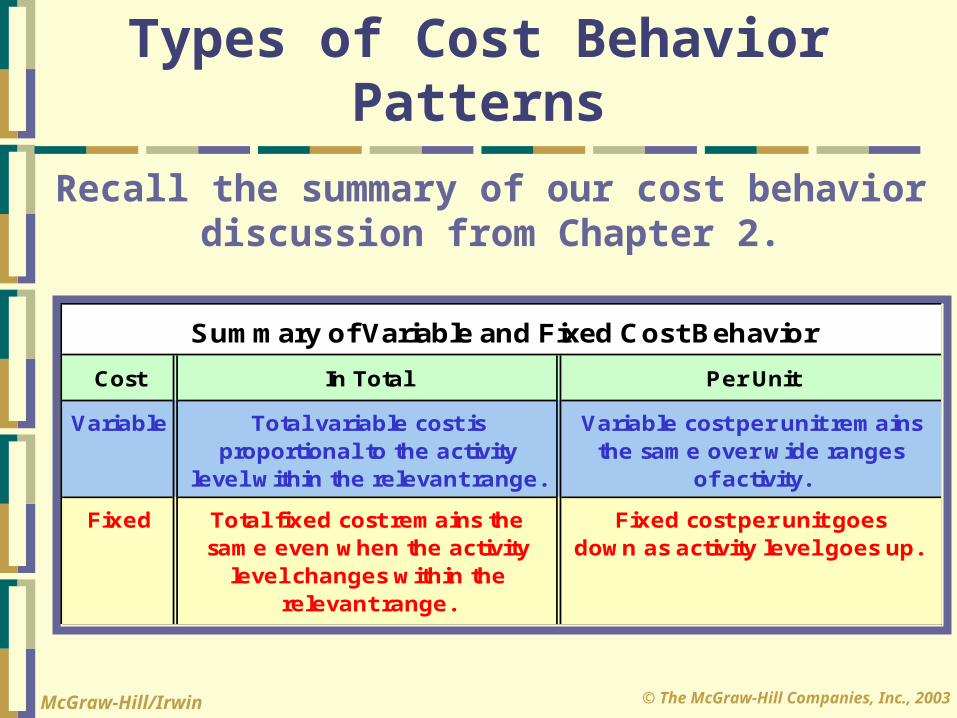
Sum m ary of Variable and Fixed Cost BehaviorCost In Total Per Unit
Variable Total variable cost is Variable cost per unit rem ainsproportional to the activity the sam e over w ide ranges
level w ithin the relevant range. of activity.Fixed Total fixed cost rem ains the Fixed cost per unit goes
sam e even w hen the activity dow n as activity level goes up. level changes w ithin the
relevant range.
Recall the summary of our cost behavior discussion from Chapter 2.
Types of Cost Behavior Patterns
© The McGraw-Hill Companies, Inc., 2003McGraw-Hill/Irwin
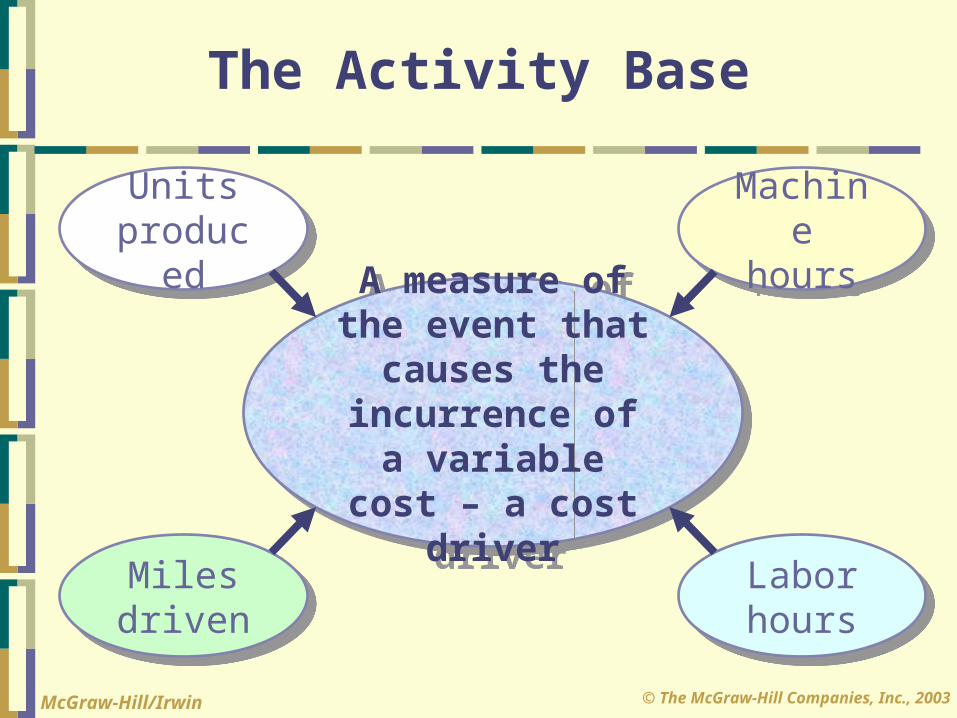
The Activity Base
A measure of the event that causes the
incurrence of a variable
cost – a cost driver
Unitsproduc
ed
Miles driven
Labor hours
Machine
hours
© The McGraw-Hill Companies, Inc., 2003McGraw-Hill/Irwin
Minutes Talked
Total Lo
ng
Dist
ance
Tele
phone
Bill
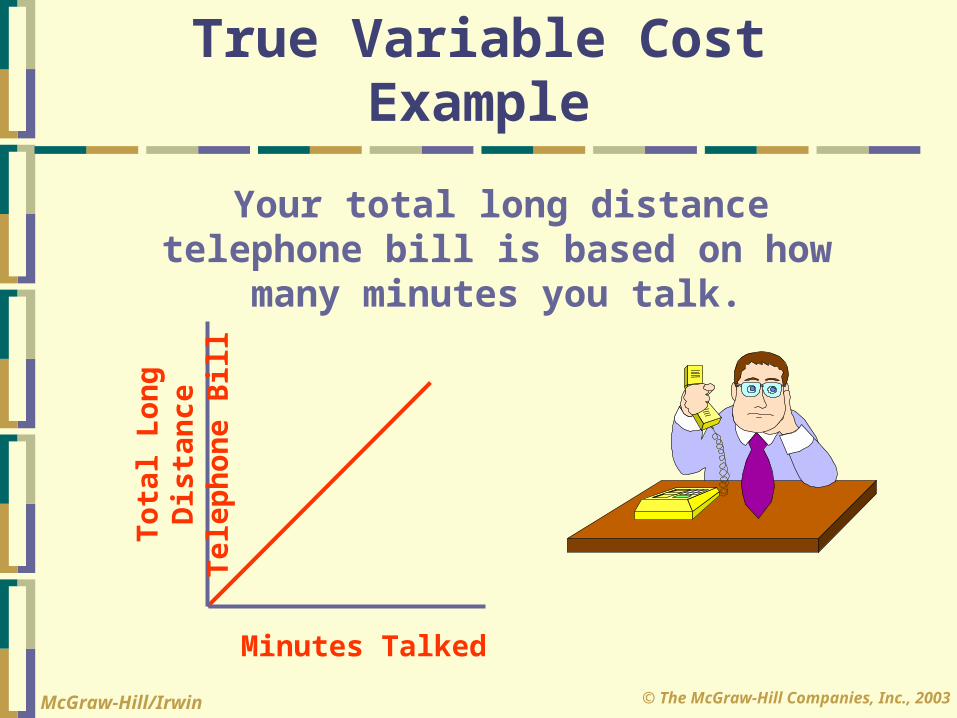
True Variable Cost Example
Your total long distance telephone bill is based on how
many minutes you talk.
© The McGraw-Hill Companies, Inc., 2003McGraw-Hill/Irwin
Minutes Talked
Per
Minute
Tele
phone
Charge
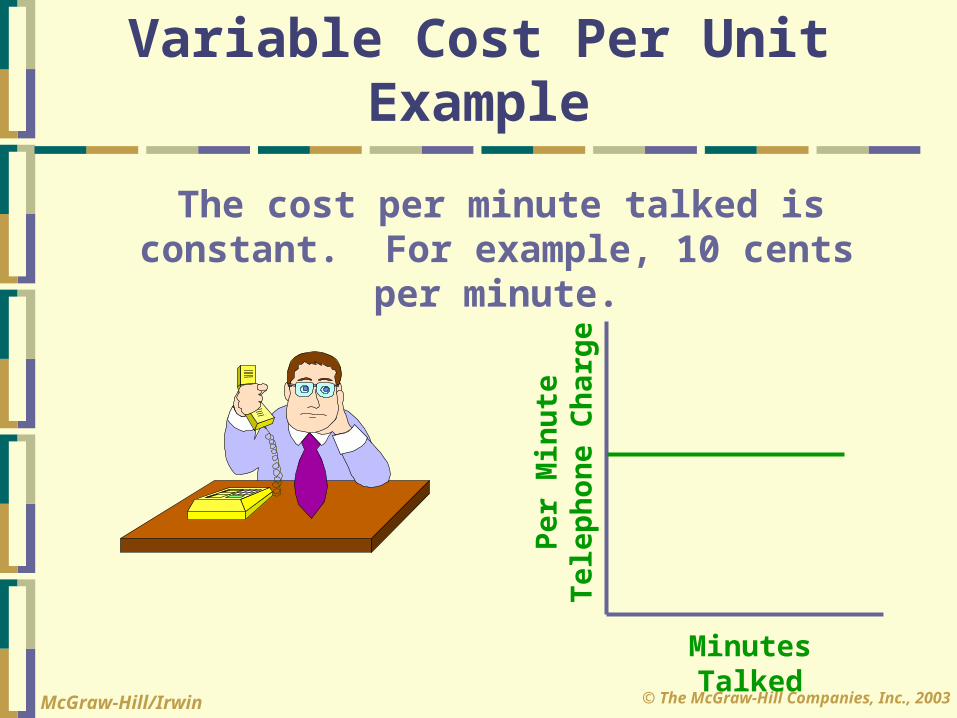
Variable Cost Per Unit Example
The cost per minute talked is constant. For example, 10 cents
per minute.
© The McGraw-Hill Companies, Inc., 2003McGraw-Hill/Irwin
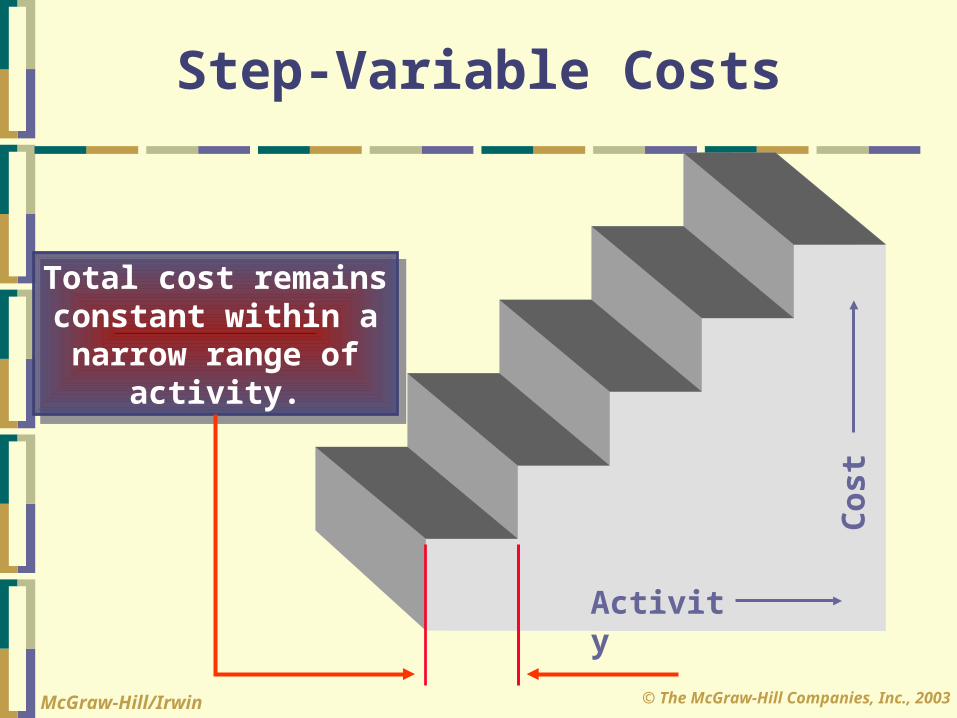
Step-Variable Costs
Activity
Cost
Total cost remainsconstant within anarrow range of
activity.
© The McGraw-Hill Companies, Inc., 2003McGraw-Hill/Irwin
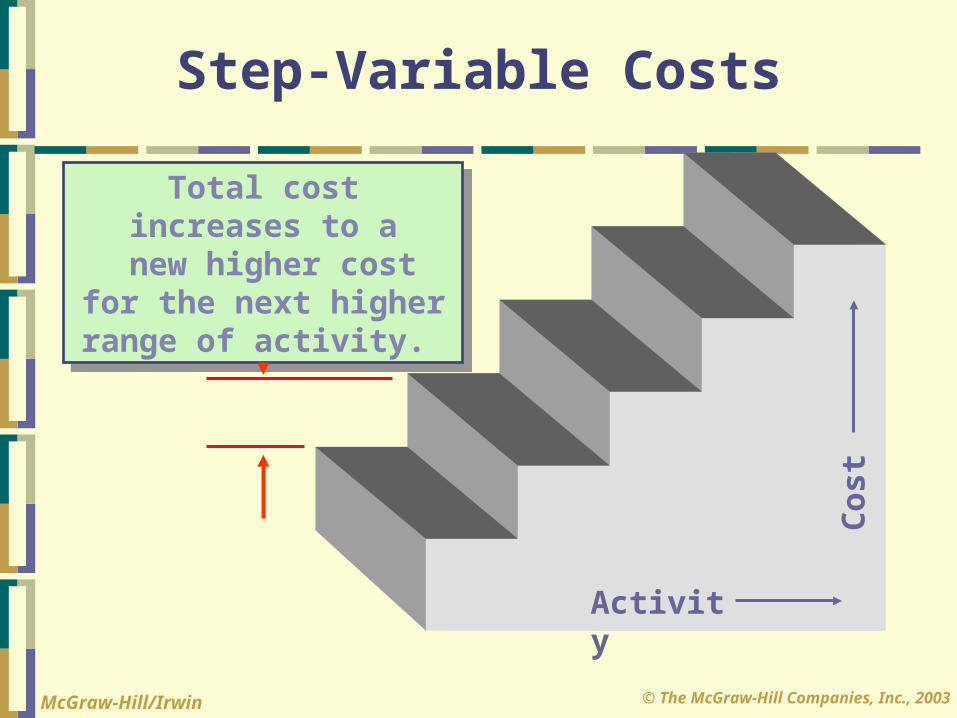
Step-Variable Costs
Activity
Cost
Total cost increases to a new higher cost
for the next higher range of activity.
© The McGraw-Hill Companies, Inc., 2003McGraw-Hill/Irwin
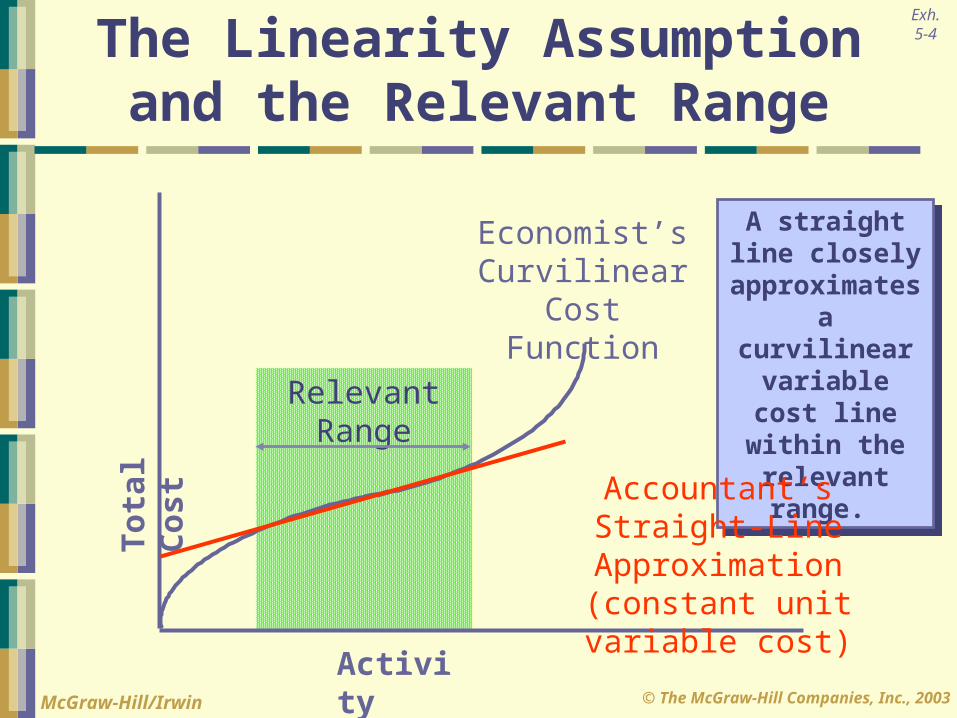
RelevantRange
A straight line closely approximates
a curvilinear variable cost line within the relevant range.
Activity
Total
Cost
Economist’sCurvilinear
Cost Function
The Linearity Assumption and the Relevant Range
Accountant’s Straight-Line Approximation (constant unit variable cost)
Exh.5-4
© The McGraw-Hill Companies, Inc., 2003McGraw-Hill/Irwin
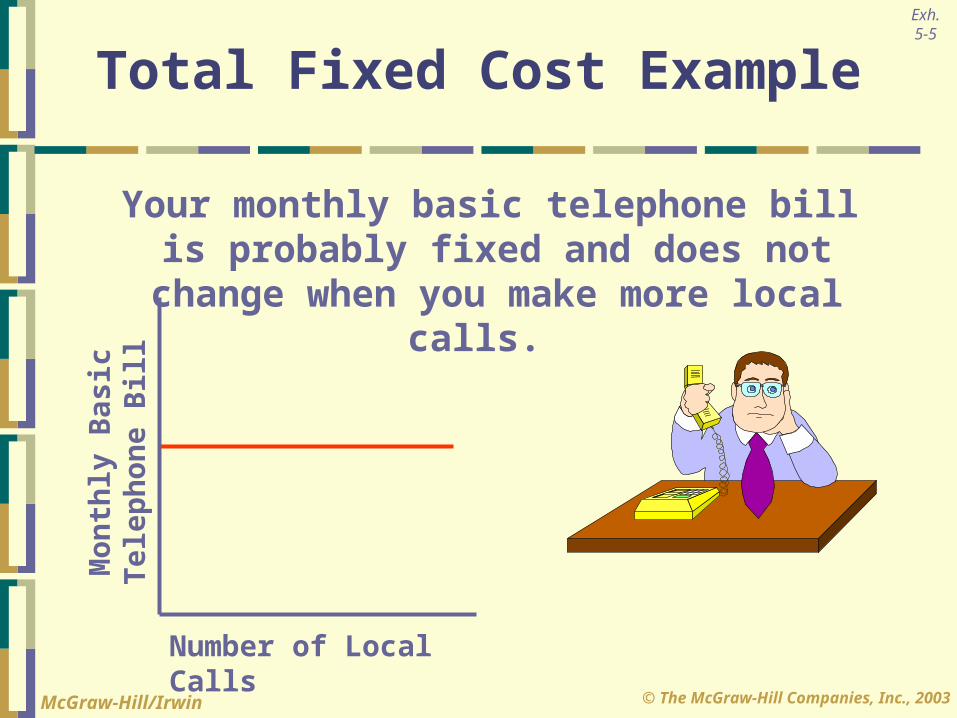
Number of Local Calls
Mont
hly Ba
sic
Telephon
e Bill
Total Fixed Cost Example
Your monthly basic telephone bill is probably fixed and does not change when you make more local
calls.
Exh.5-5
© The McGraw-Hill Companies, Inc., 2003McGraw-Hill/Irwin
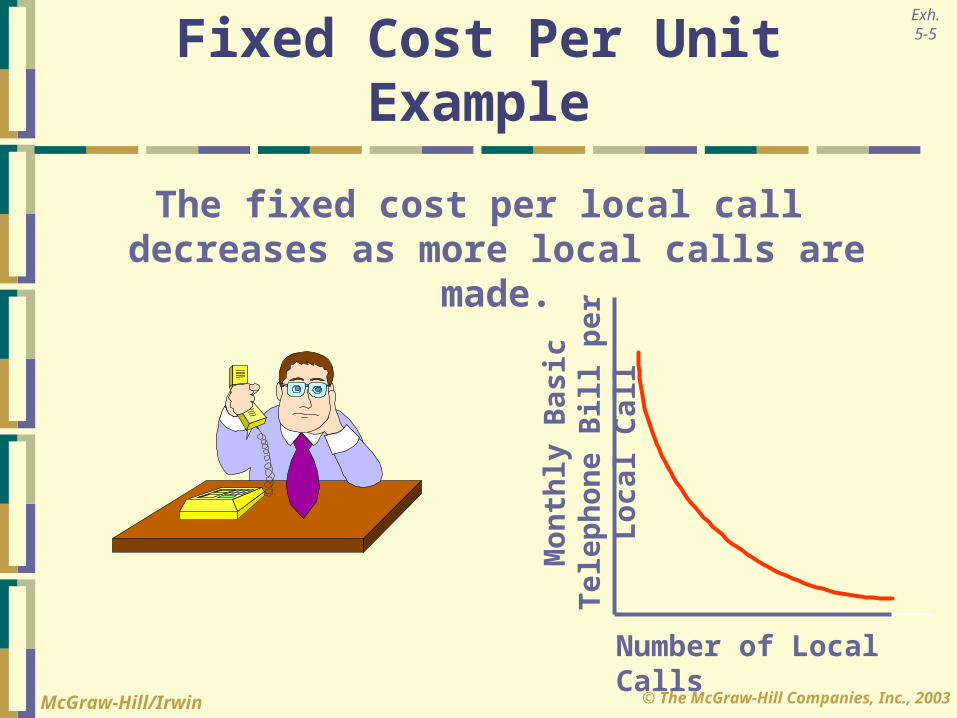
Number of Local Calls
Monthl
y Basi
c Te
lephon
e Bill
per
Loca
l Call
Fixed Cost Per Unit Example
The fixed cost per local call decreases as more local calls are
made.
Exh.5-5
© The McGraw-Hill Companies, Inc., 2003McGraw-Hill/Irwin
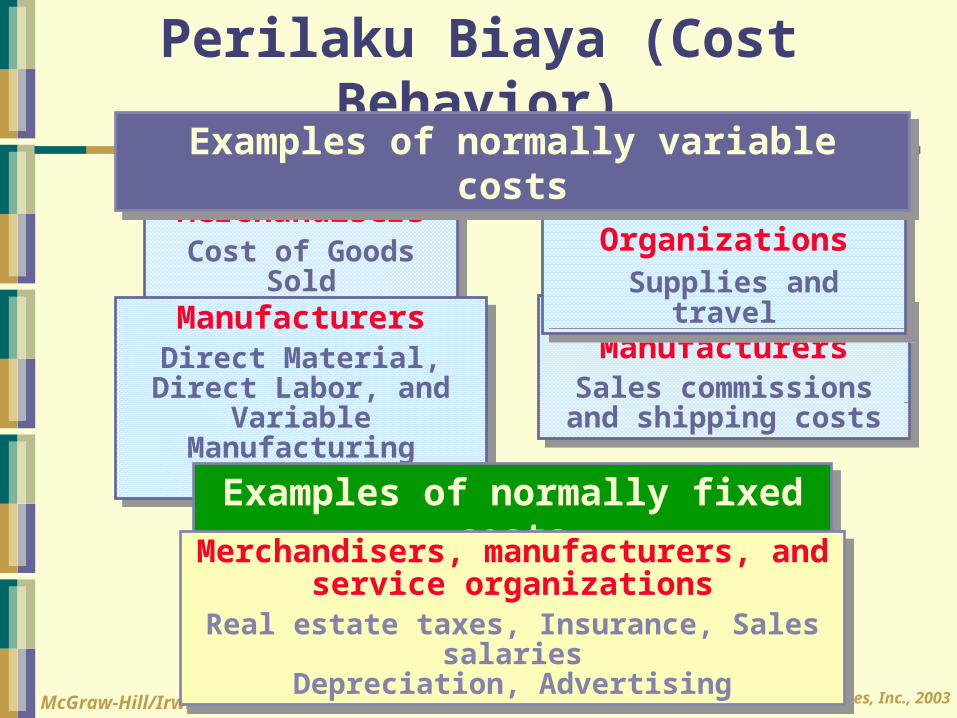
Perilaku Biaya (Cost Behavior)
MerchandisersCost of Goods
SoldManufacturersDirect Material, Direct Labor, and
Variable Manufacturing
Overhead
Merchandisers and Manufacturers
Sales commissions and shipping costs
Service Organizations Supplies and
travel
Examples of normally variable costs
Examples of normally fixed costsMerchandisers, manufacturers, and
service organizationsReal estate taxes, Insurance, Sales
salariesDepreciation, Advertising
© The McGraw-Hill Companies, Inc., 2003McGraw-Hill/Irwin
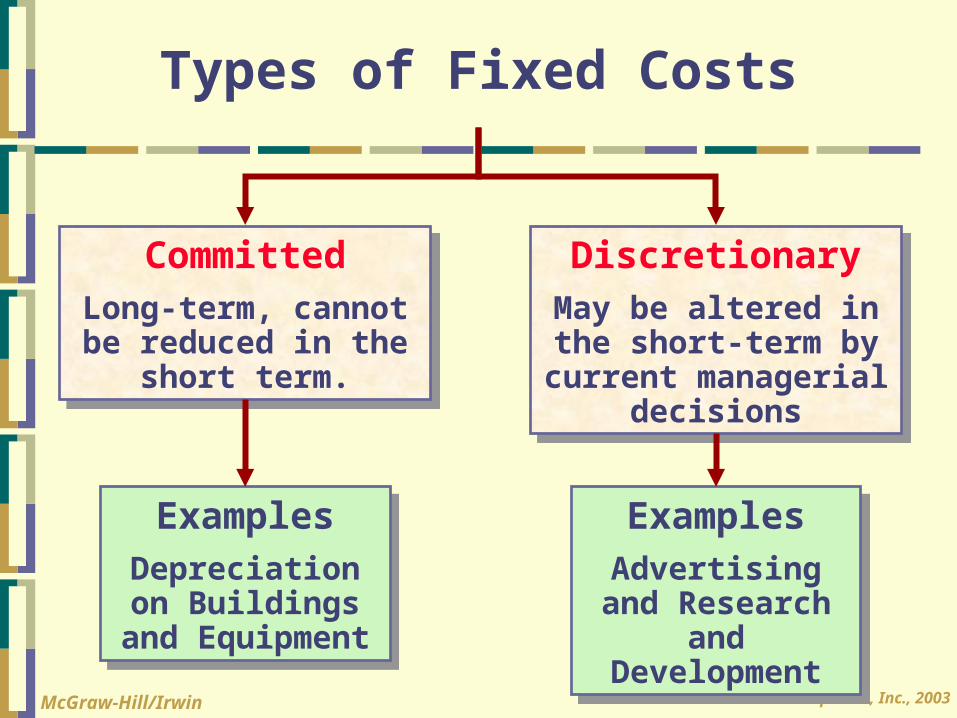
ExamplesAdvertising and Research
and Development
ExamplesDepreciation on Buildings and Equipment
Types of Fixed Costs
DiscretionaryMay be altered in the short-term by current managerial
decisions
CommittedLong-term, cannot be reduced in the
short term.
© The McGraw-Hill Companies, Inc., 2003McGraw-Hill/Irwin
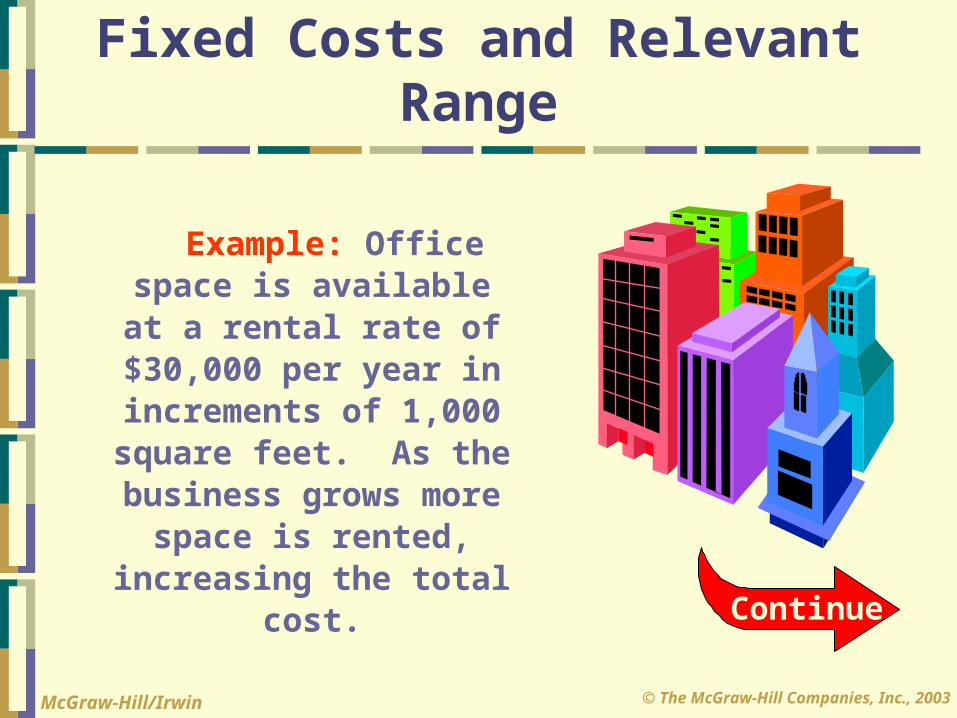
Example: Office space is available at a rental rate of $30,000 per year in increments of 1,000 square feet. As the business grows more space is rented,
increasing the total cost.
Fixed Costs and Relevant Range
Continue
© The McGraw-Hill Companies, Inc., 2003McGraw-Hill/Irwin
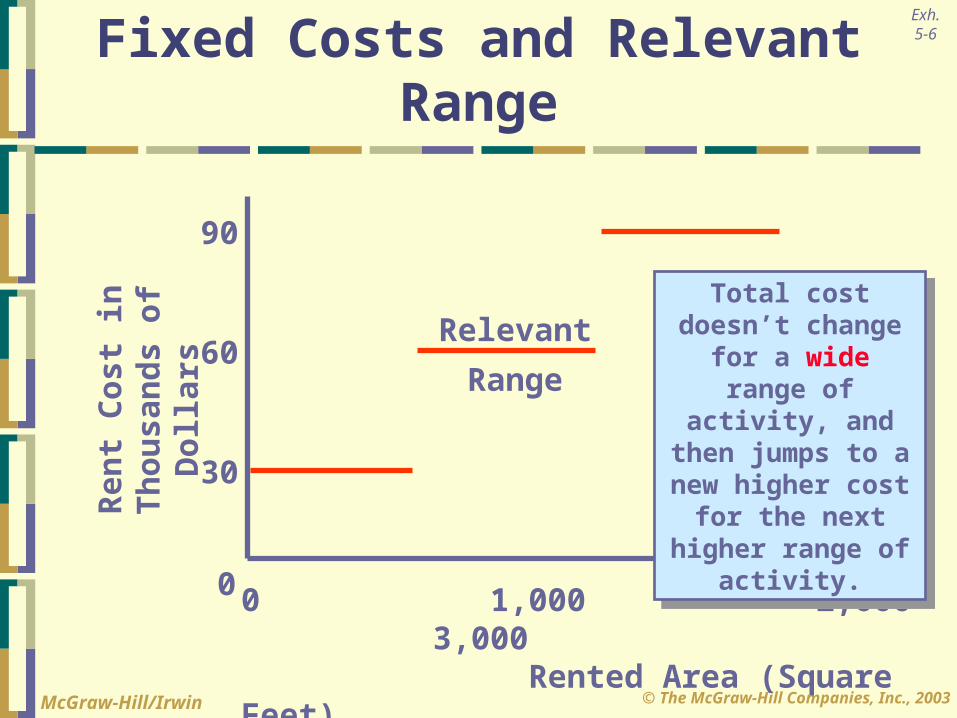
Rent Cost in
Thousands of
Dollars
0 1,000 2,000 3,000 Rented Area (Square Feet)
0
30
60
Fixed Costs and Relevant Range
90
Relevant Range
Total cost doesn’t change for a wide range of
activity, and then jumps to a new higher cost for the next
higher range of activity.
Exh.5-6
© The McGraw-Hill Companies, Inc., 2003McGraw-Hill/Irwin
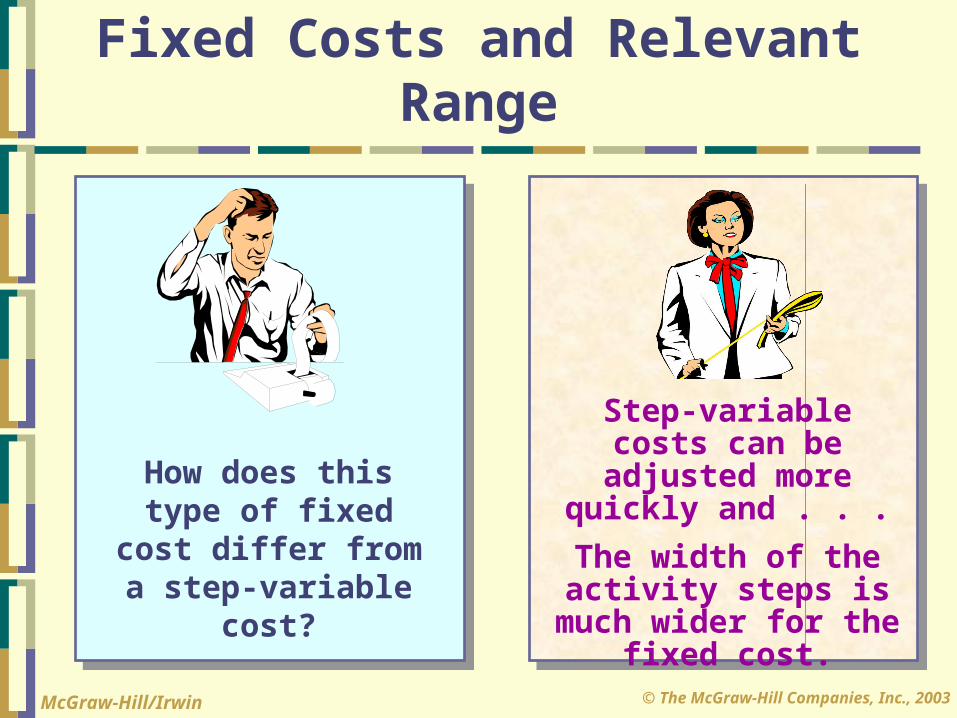
How does this type of fixed
cost differ from a step-variable
cost?
Step-variable costs can be adjusted more
quickly and . . .The width of the activity steps is much wider for the
fixed cost.
Fixed Costs and Relevant Range
© The McGraw-Hill Companies, Inc., 2003McGraw-Hill/Irwin
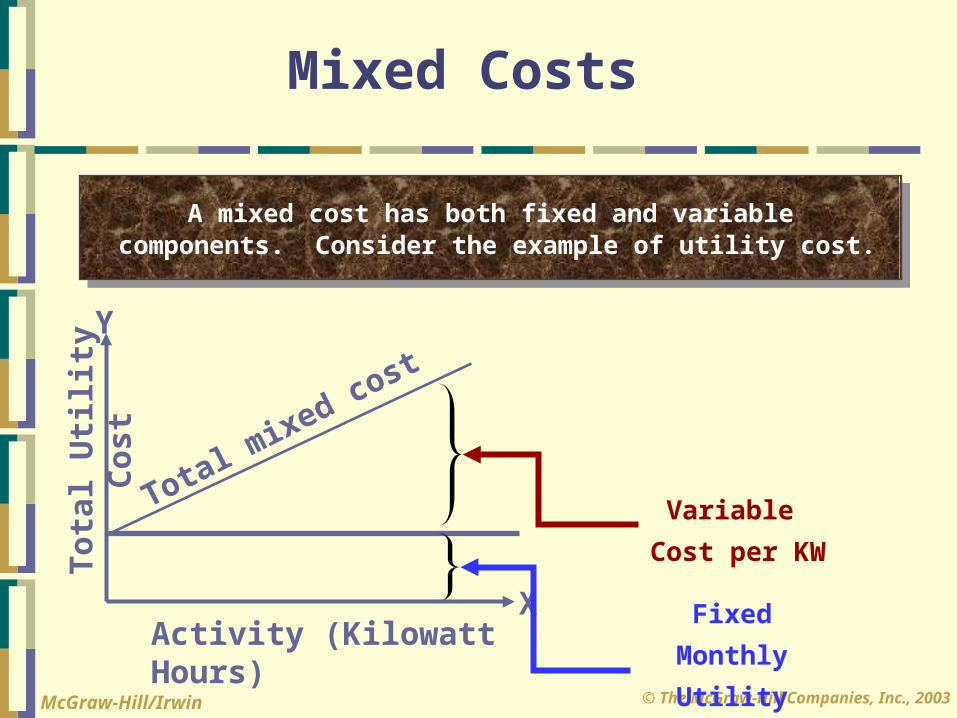
Fixed MonthlyUtility Charge
Variable Cost per KW
Activity (Kilowatt Hours)
Total Utility
Cost
X
Y
A mixed cost has both fixed and variablecomponents. Consider the example of utility cost.
Mixed Costs
Total
mixed
cost
© The McGraw-Hill Companies, Inc., 2003McGraw-Hill/Irwin
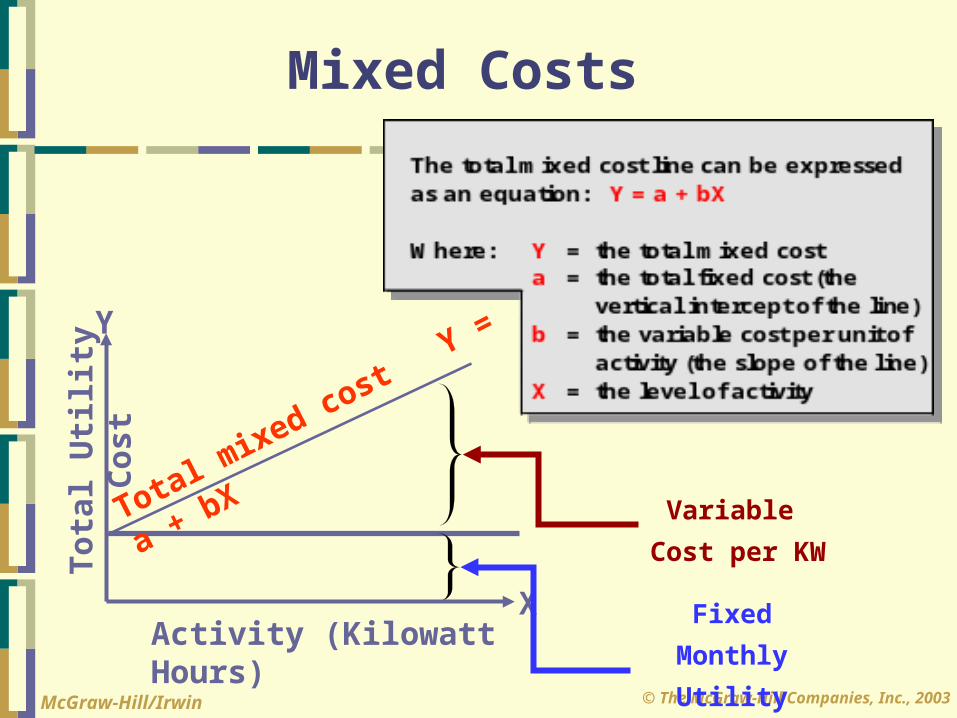
Fixed MonthlyUtility Charge
Variable Cost per KW
Activity (Kilowatt Hours)
Total Utility
Cost
X
Y
Mixed Costs
Total
mixed
cost
Y =
a + bX
© The McGraw-Hill Companies, Inc., 2003McGraw-Hill/Irwin
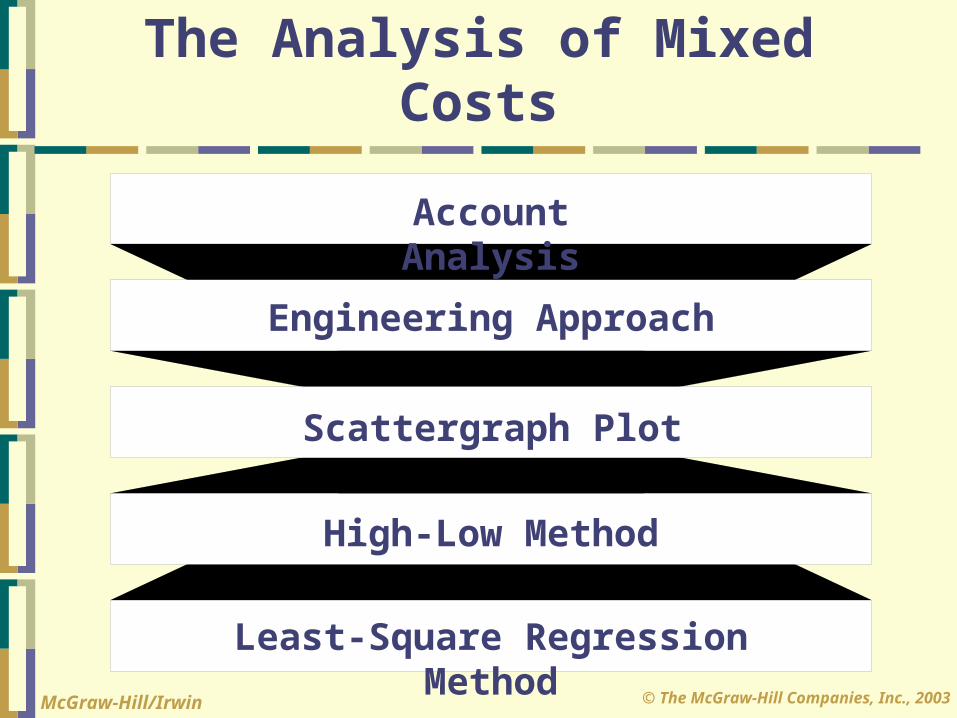
The Analysis of Mixed Costs
Engineering Approach
Account Analysis
High-Low Method
Least-Square Regression Method
Scattergraph Plot
© The McGraw-Hill Companies, Inc., 2003McGraw-Hill/Irwin
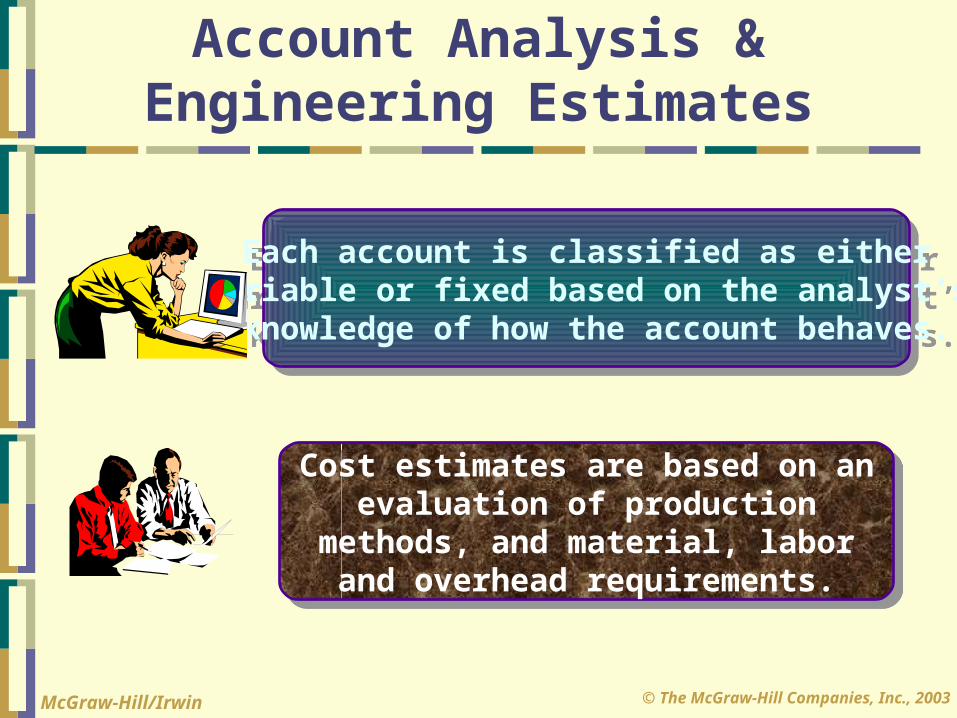
Account Analysis & Engineering Estimates
Each account is classified as eithervariable or fixed based on the analyst’s knowledge of how the account behaves.
Cost estimates are based on an evaluation of production
methods, and material, labor and overhead requirements.
© The McGraw-Hill Companies, Inc., 2003McGraw-Hill/Irwin
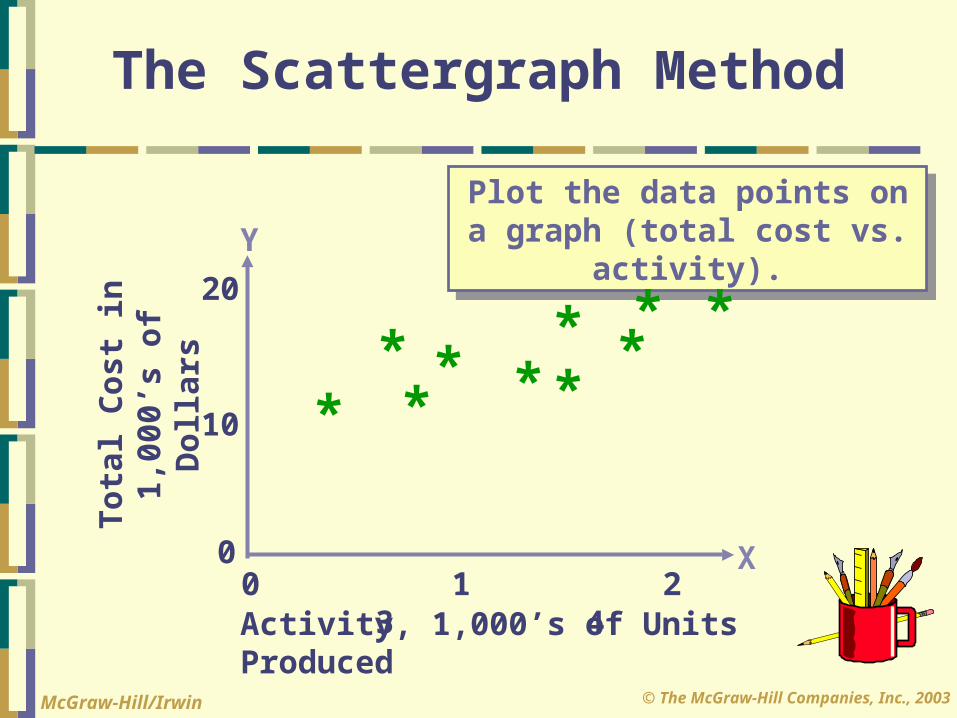
Plot the data points on a graph (total cost vs.
activity).
0 1 2 3 4
*
Total Cost in
1,000’s of
Dollars
10
20
0
**** *
* ***
Activity, 1,000’s of Units Produced
X
Y
The Scattergraph Method
© The McGraw-Hill Companies, Inc., 2003McGraw-Hill/Irwin
0 1 2 3 4
*
Total Cost in
1,000’s of
Dollars
10
20
0
**** *
* ***
Activity, 1,000’s of Units Produced
X
Y
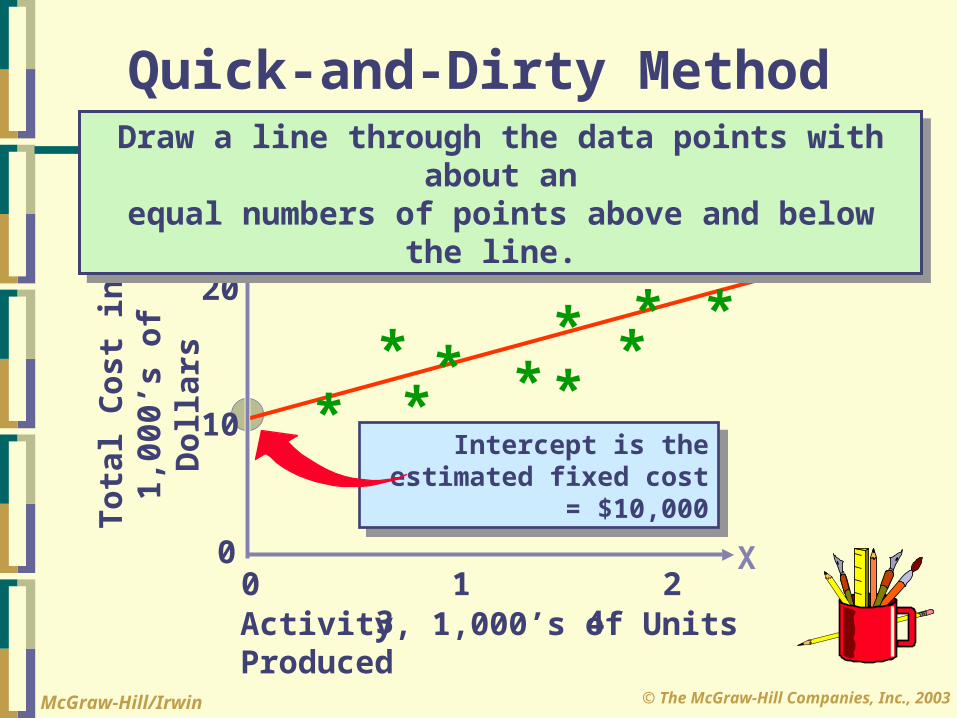
Quick-and-Dirty Method
Intercept is the estimated fixed cost
= $10,000
Draw a line through the data points with about an
equal numbers of points above and below the line.
© The McGraw-Hill Companies, Inc., 2003McGraw-Hill/Irwin
0 1 2 3 4
*
Total Cost in
1,000’s of
Dollars
10
20
0
**** *
* ***
Activity, 1,000’s of Units Produced
X
Y
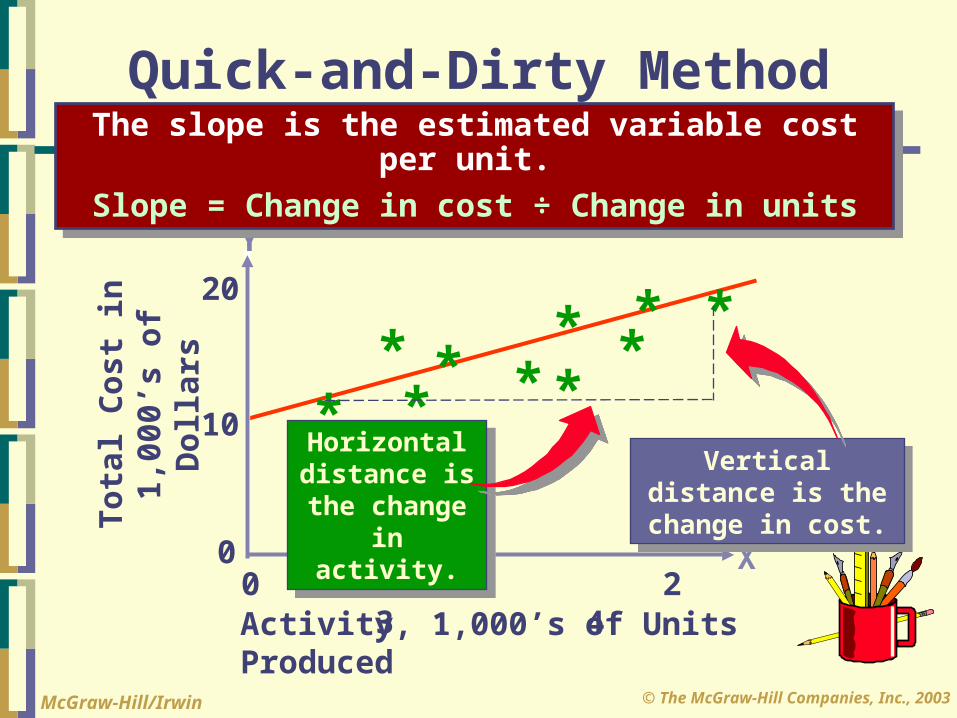
Quick-and-Dirty MethodThe slope is the estimated variable cost
per unit. Slope = Change in cost ÷ Change in units
Vertical distance is the change in cost.
Horizontal distance is the change
in activity.
© The McGraw-Hill Companies, Inc., 2003McGraw-Hill/Irwin
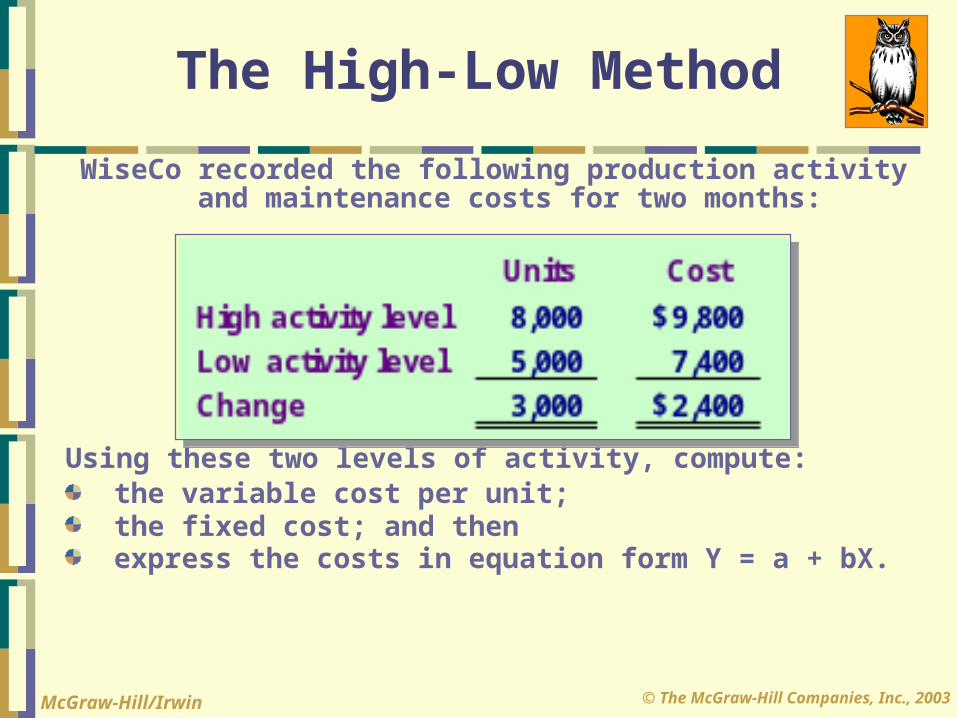
WiseCo recorded the following production activity and maintenance costs for two months:
Using these two levels of activity, compute: the variable cost per unit; the fixed cost; and then express the costs in equation form Y = a + bX.
The High-Low Method
© The McGraw-Hill Companies, Inc., 2003McGraw-Hill/Irwin
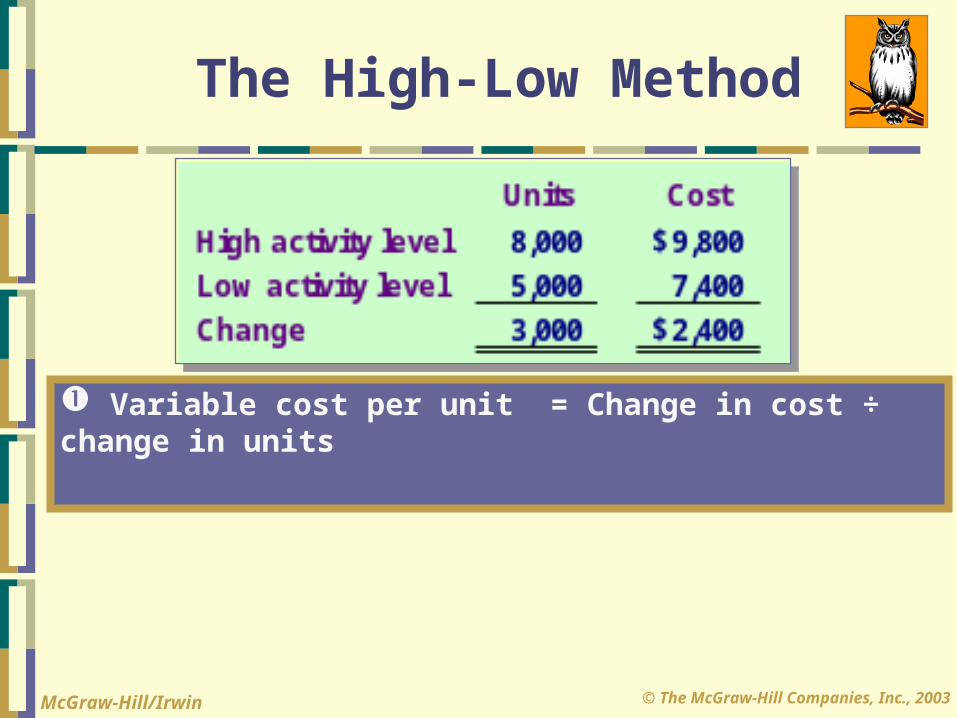
Changein costChange in units
The High-Low Method
Variable cost per unit = Change in cost ÷ change in units
© The McGraw-Hill Companies, Inc., 2003McGraw-Hill/Irwin
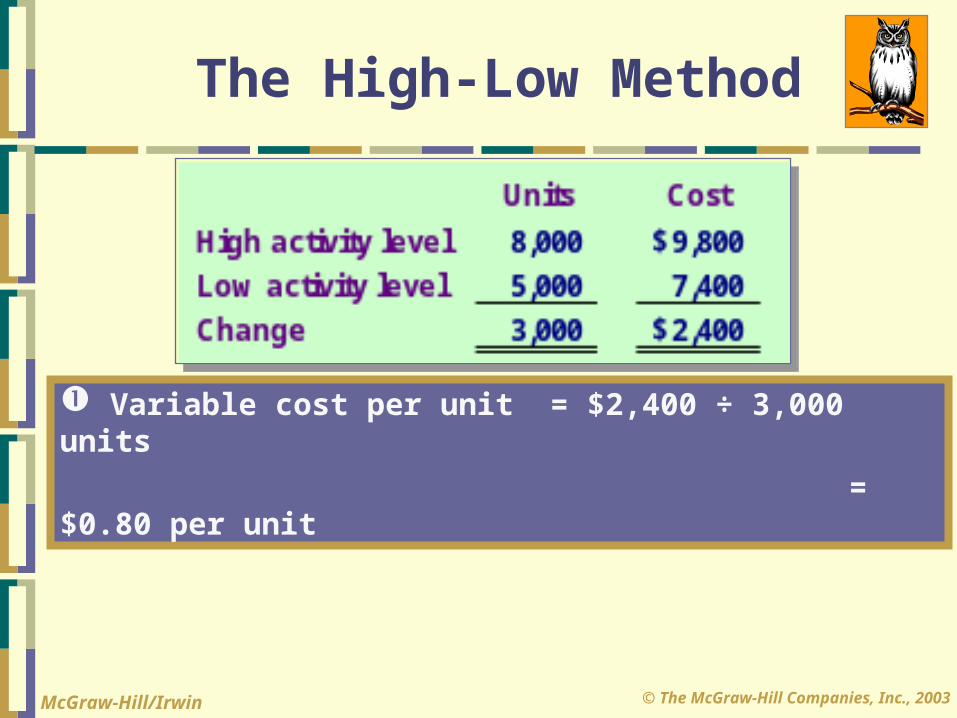
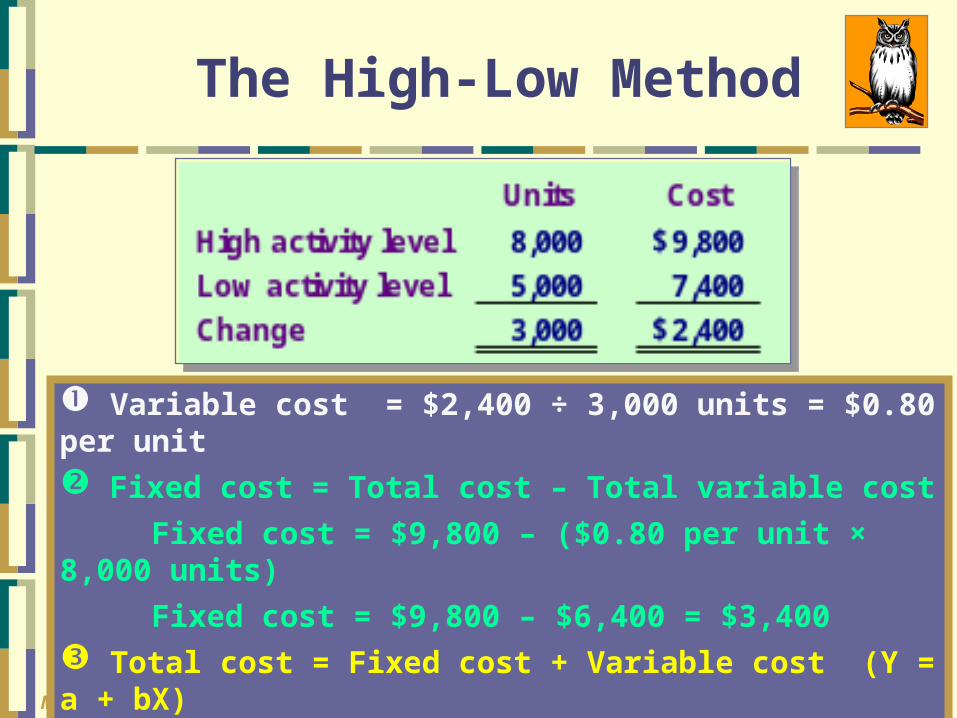
The High-Low Method
Variable cost per unit = $2,400 ÷ 3,000 units = $0.80 per unit
© The McGraw-Hill Companies, Inc., 2003McGraw-Hill/Irwin
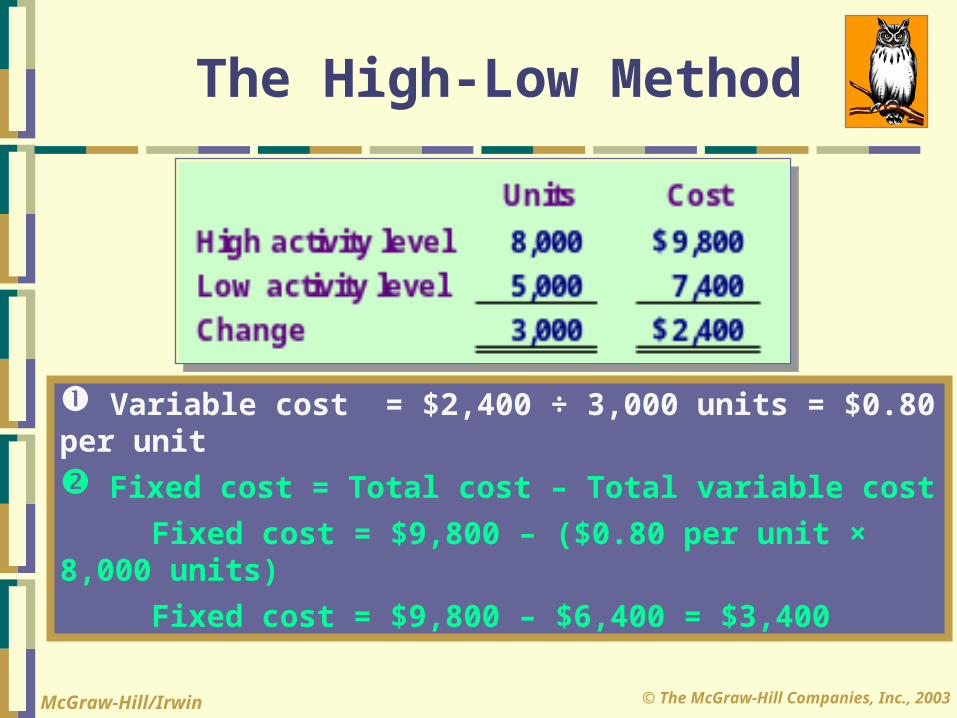
The High-Low Method
Variable cost = $2,400 ÷ 3,000 units = $0.80 per unit Fixed cost = Total cost – Total variable cost Fixed cost = $9,800 – ($0.80 per unit × 8,000 units) Fixed cost = $9,800 – $6,400 = $3,400
© The McGraw-Hill Companies, Inc., 2003McGraw-Hill/Irwin
Variable cost = $2,400 ÷ 3,000 units = $0.80 per unit Fixed cost = Total cost – Total variable cost Fixed cost = $9,800 – ($0.80 per unit × 8,000 units) Fixed cost = $9,800 – $6,400 = $3,400 Total cost = Fixed cost + Variable cost (Y = a + bX) Y = $3,400 + $0.80X
The High-Low Method
© The McGraw-Hill Companies, Inc., 2003McGraw-Hill/Irwin
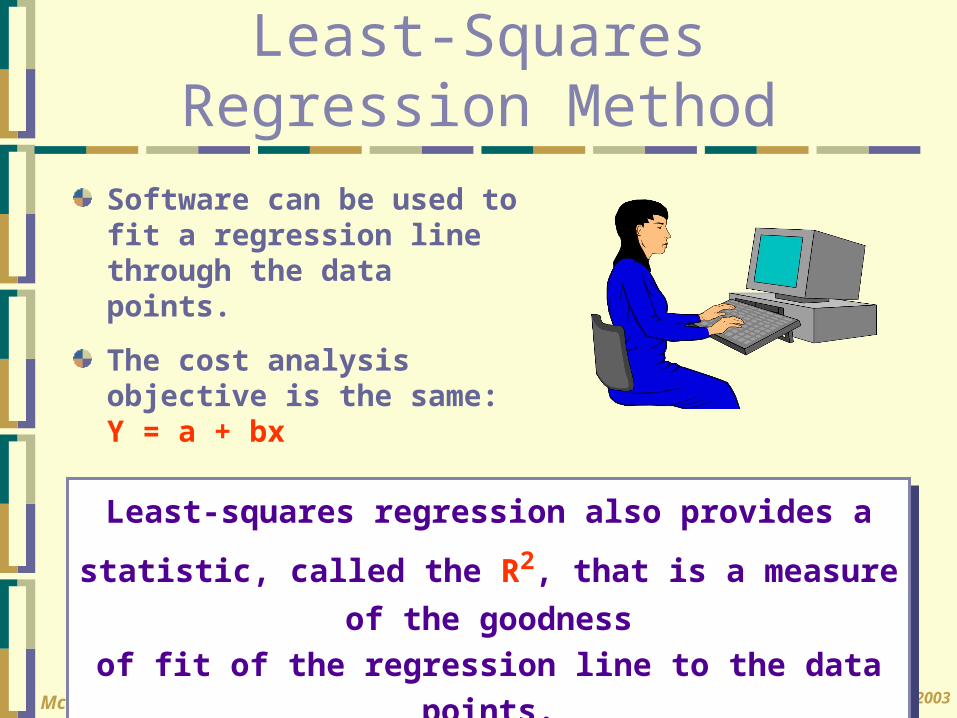
Software can be used to fit a regression line through the data points.The cost analysis objective is the same: Y = a + bx
Least-Squares Regression Method
Least-squares regression also provides a statistic, called the R2, that is a measure
of the goodnessof fit of the regression line to the data
points.
© The McGraw-Hill Companies, Inc., 2003McGraw-Hill/Irwin
0 1 2 3 4
Total Cost
10
20
0
Activity
***** *
* ***
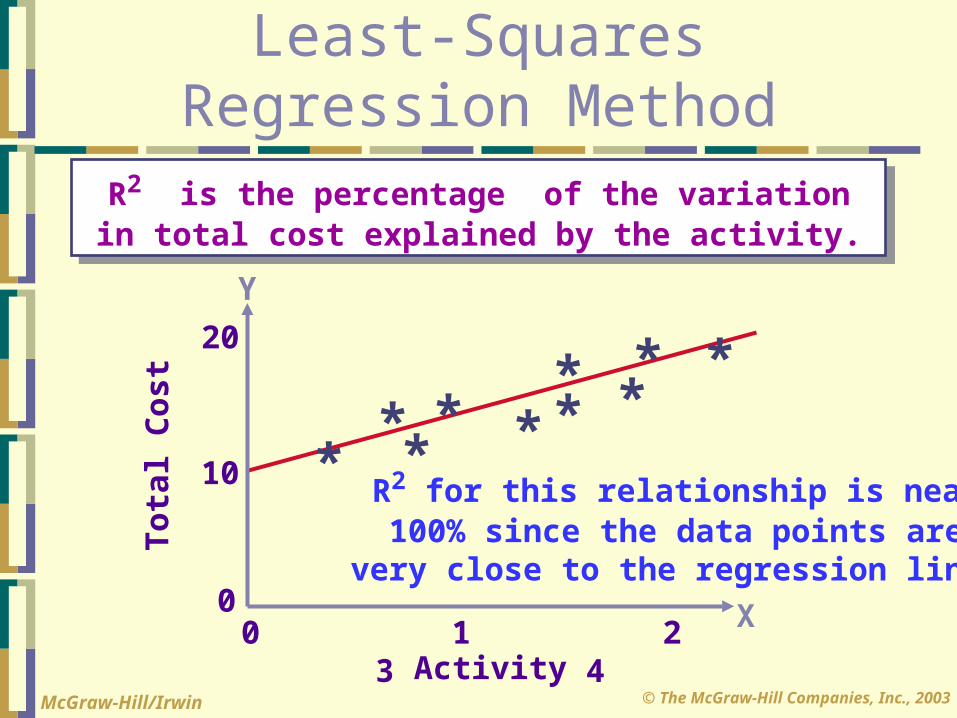
Least-Squares Regression Method
R2 is the percentage of the variation in total cost explained by the activity.
R2 for this relationship is near100% since the data points are
very close to the regression line.X
Y
© The McGraw-Hill Companies, Inc., 2003McGraw-Hill/Irwin
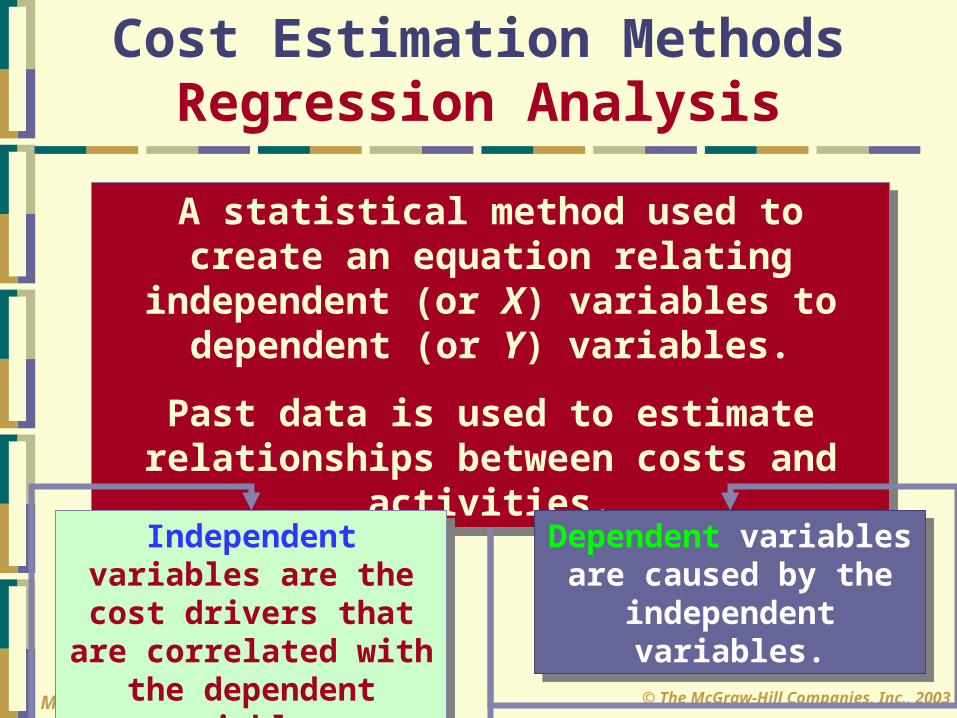
Cost Estimation MethodsRegression AnalysisA statistical method used to create an equation relating
independent (or X) variables to dependent (or Y) variables.
Past data is used to estimate relationships between costs and
activities.Dependent variables are caused by the
independent variables.
Independent variables are the cost drivers that are correlated with
the dependent variables.
© The McGraw-Hill Companies, Inc., 2003McGraw-Hill/Irwin
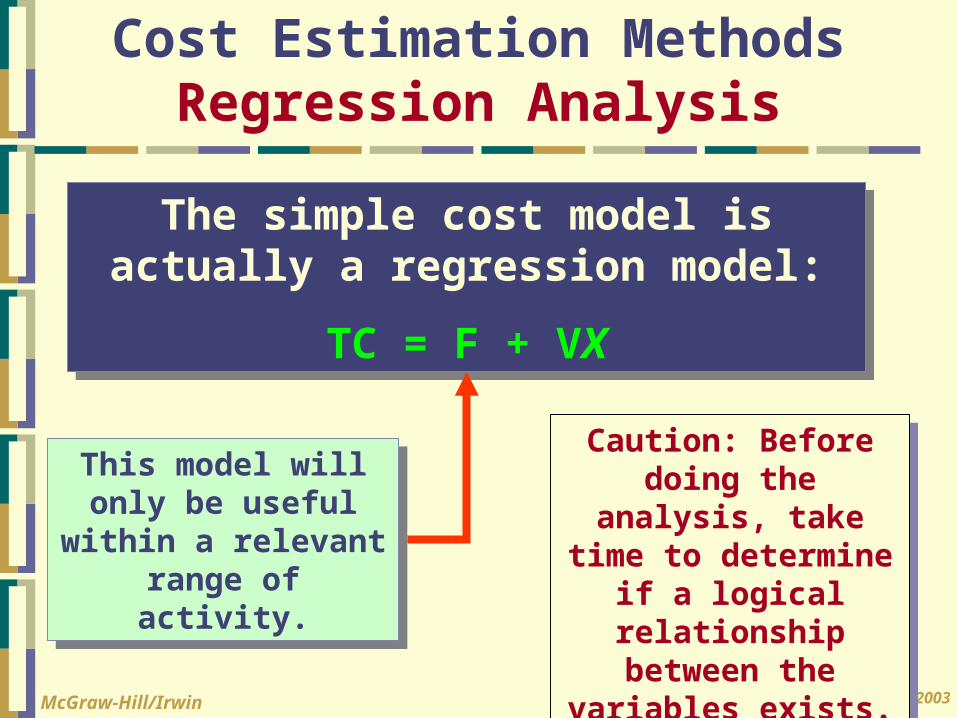
Caution: Before doing the
analysis, take time to determine
if a logical relationship between the
variables exists.
Cost Estimation MethodsRegression Analysis
The simple cost model is actually a regression model:
TC = F + VX
This model will only be useful
within a relevant range of activity.
© The McGraw-Hill Companies, Inc., 2003McGraw-Hill/Irwin
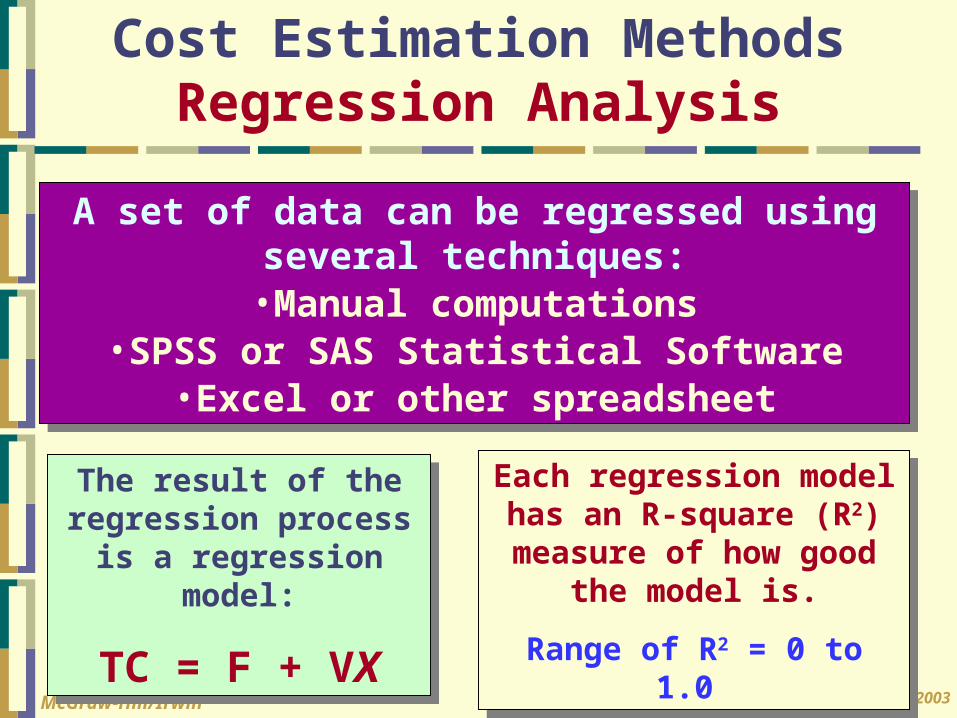
Cost Estimation MethodsRegression Analysis
A set of data can be regressed using several techniques:•Manual computations
•SPSS or SAS Statistical Software•Excel or other spreadsheet
The result of the regression process is a regression
model:
TC = F + VX
Each regression model has an R-square (R2) measure of how good
the model is.Range of R2 = 0 to
1.0
© The McGraw-Hill Companies, Inc., 2003McGraw-Hill/Irwin
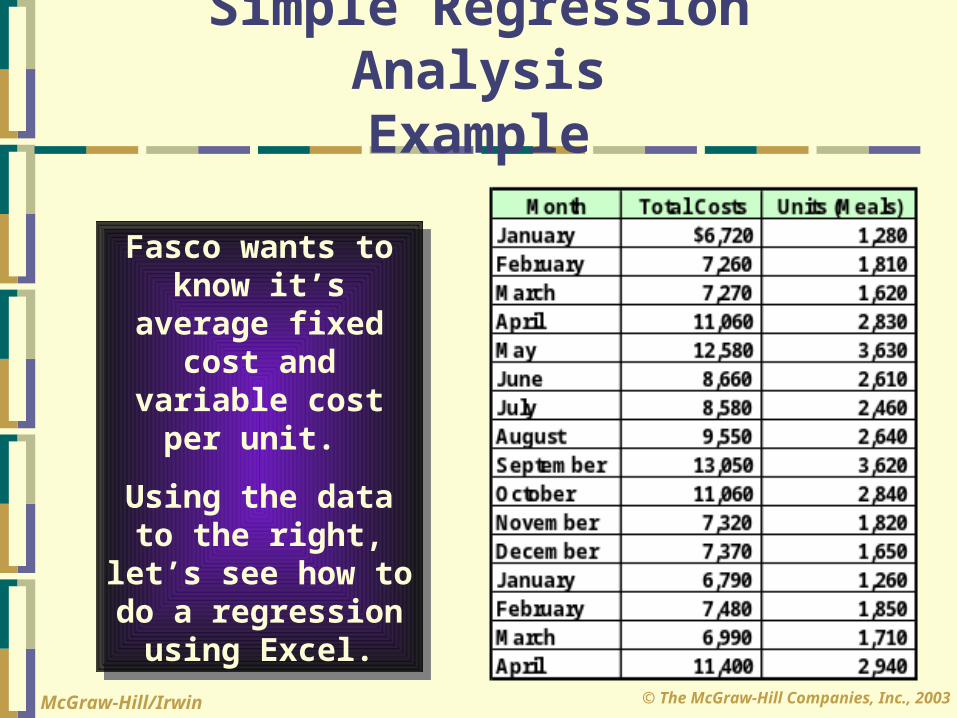
Simple Regression AnalysisExample
Fasco wants to know it’s
average fixed cost and
variable cost per unit.
Using the data to the right,
let’s see how to do a regression using Excel.
© The McGraw-Hill Companies, Inc., 2003McGraw-Hill/Irwin
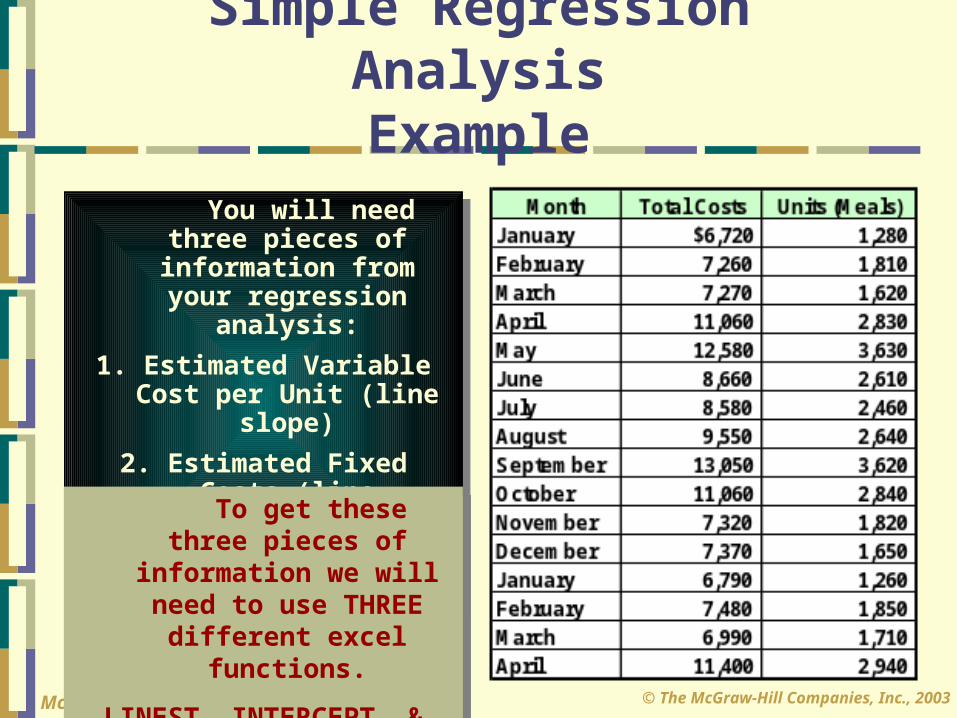
Simple Regression AnalysisExample
You will need three pieces of information from your regression
analysis:1. Estimated Variable
Cost per Unit (line slope)
2. Estimated Fixed Costs (line intercept)
3. Goodness of fit, or R2
To get these three pieces of
information we will need to use THREE different excel
functions.LINEST, INTERCEPT, &
RSQ
© The McGraw-Hill Companies, Inc., 2003McGraw-Hill/Irwin
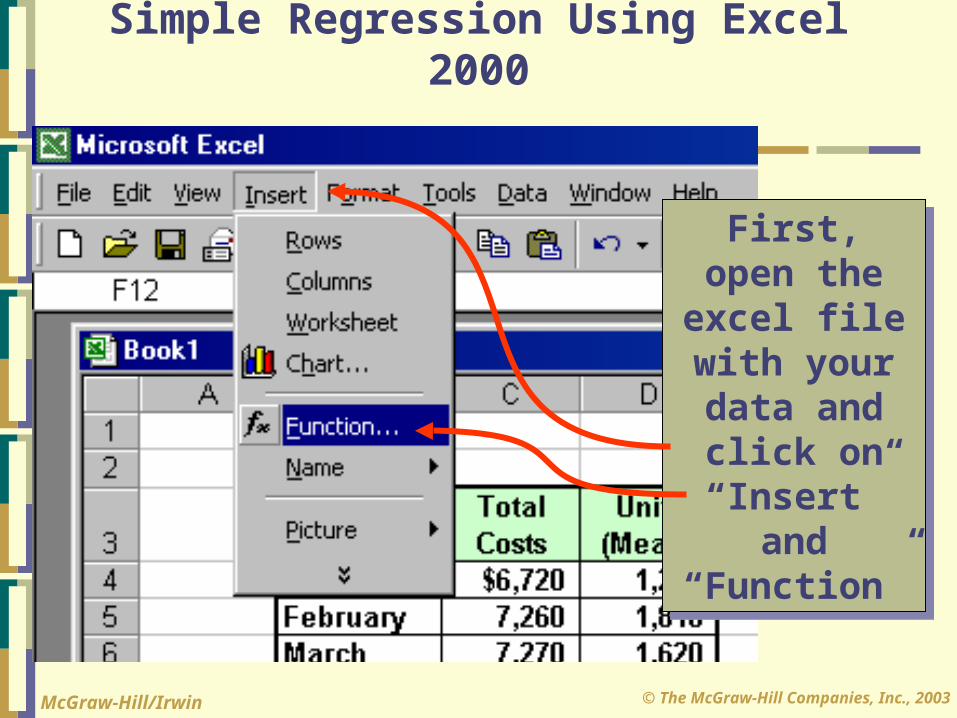
Simple Regression Using Excel 2000
First, open the excel file with your data and click on “Insert”
and “Function”
© The McGraw-Hill Companies, Inc., 2003McGraw-Hill/Irwin
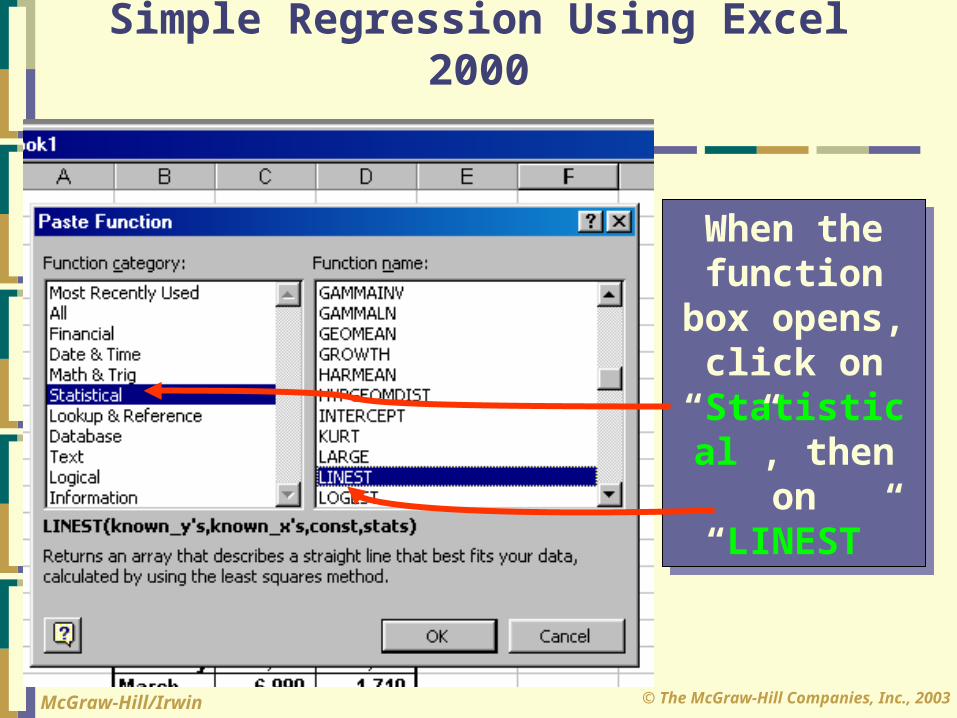
Simple Regression Using Excel 2000
When the function box opens, click on “Statistical”, then
on “LINEST”
© The McGraw-Hill Companies, Inc., 2003McGraw-Hill/Irwin
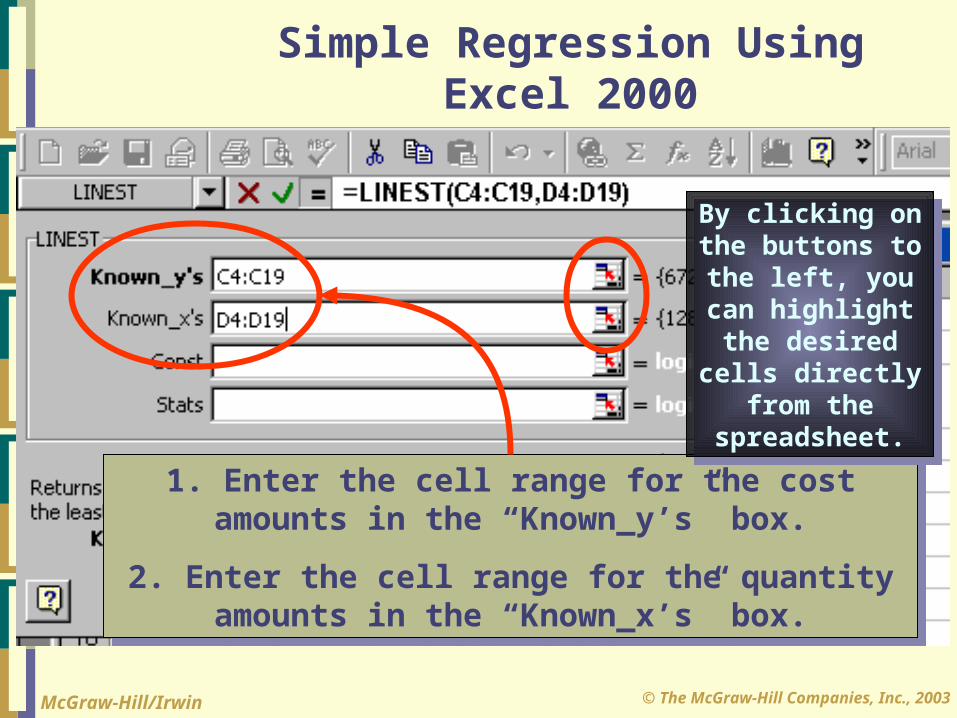
Simple Regression Using Excel 2000
1. Enter the cell range for the cost amounts in the “Known_y’s” box.
2. Enter the cell range for the quantity amounts in the “Known_x’s” box.
By clicking on the buttons to the left, you can highlight the desired
cells directly from the
spreadsheet.
© The McGraw-Hill Companies, Inc., 2003McGraw-Hill/Irwin
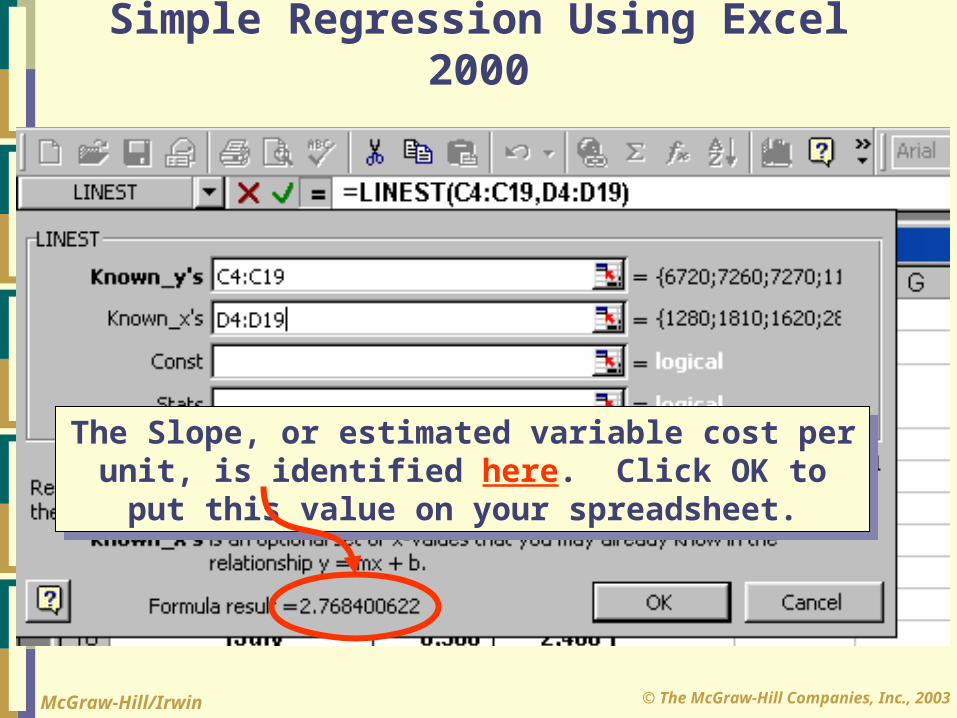
Simple Regression Using Excel 2000
The Slope, or estimated variable cost per unit, is identified here. Click OK to put this value on your spreadsheet.
© The McGraw-Hill Companies, Inc., 2003McGraw-Hill/Irwin
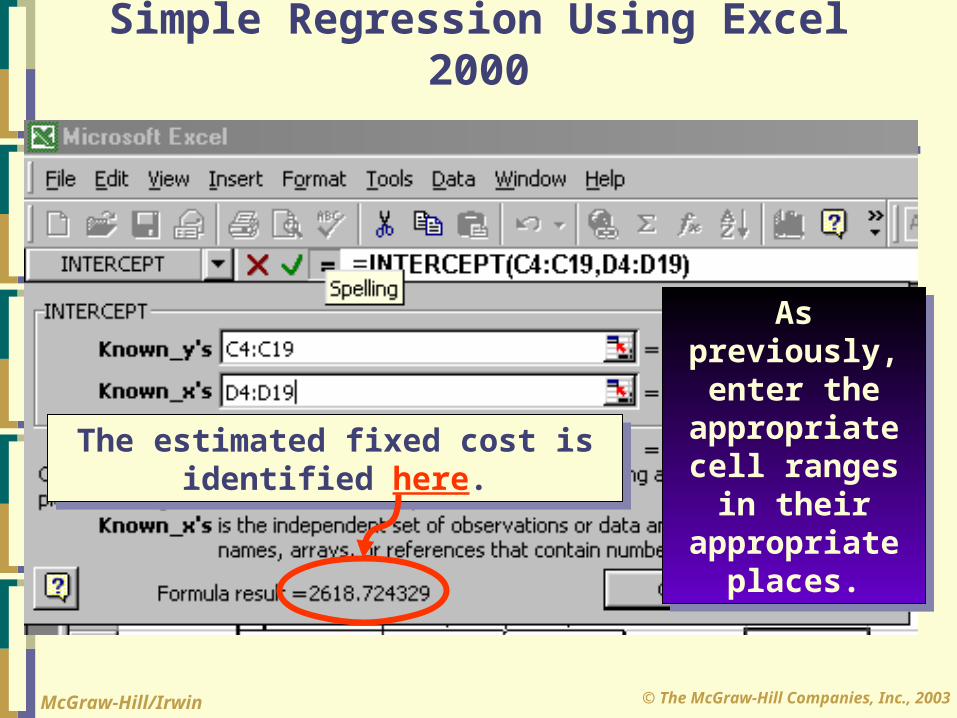
Simple Regression Using Excel 2000
As previously, enter the appropriate cell ranges in their
appropriate places.
The estimated fixed cost is identified here.
© The McGraw-Hill Companies, Inc., 2003McGraw-Hill/Irwin
Simple Regression Using Excel 2000
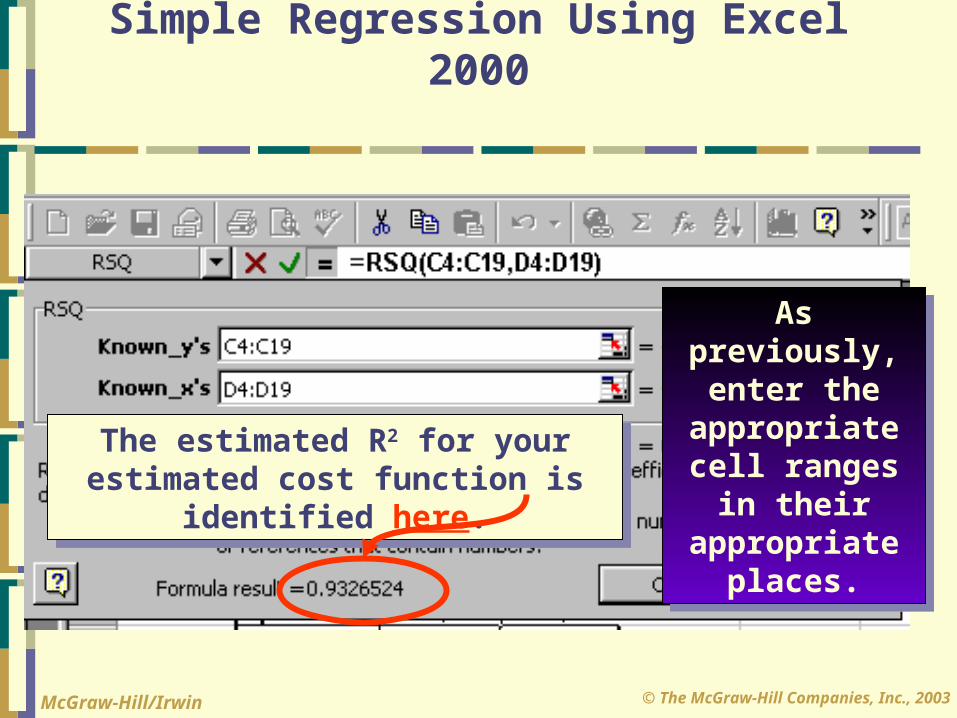
As previously, enter the appropriate cell ranges in their
appropriate places.
The estimated R2 for your estimated cost function is
identified here.
© The McGraw-Hill Companies, Inc., 2003McGraw-Hill/Irwin
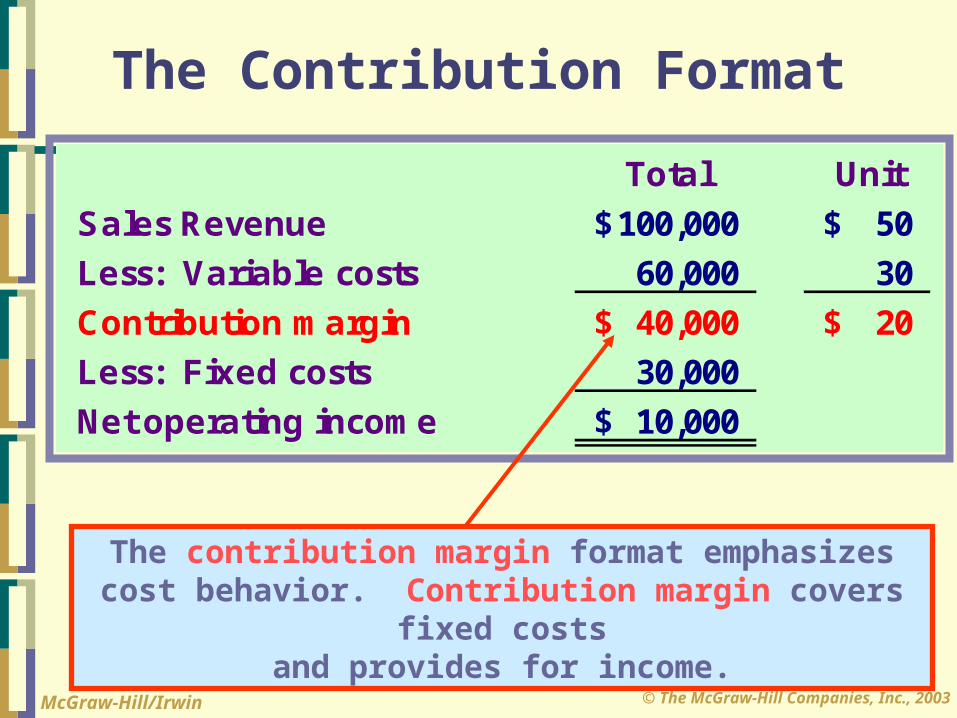
The Contribution FormatTotal Unit
Sales Revenue 100,000$ 50$ Less: Variable costs 60,000 30 Contribution m argin 40,000$ 20$ Less: Fixed costs 30,000 Net operating incom e 10,000$
The contribution margin format emphasizes cost behavior. Contribution margin covers
fixed costsand provides for income.
© The McGraw-Hill Companies, Inc., 2003McGraw-Hill/Irwin
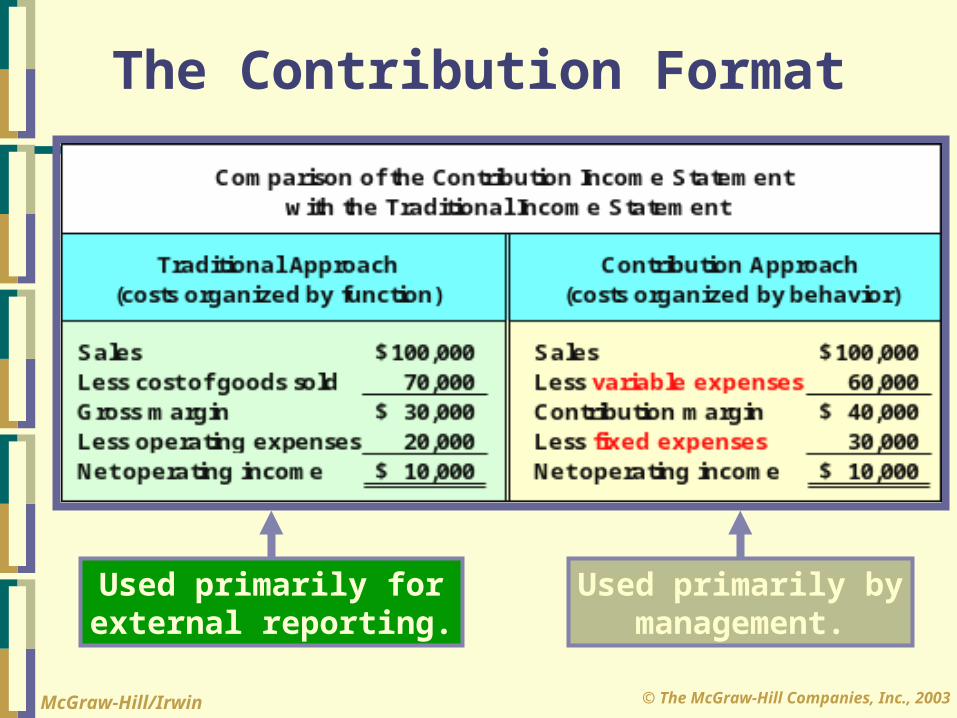
The Contribution Format
Used primarily forexternal reporting.
Used primarily bymanagement.

© The McGraw-Hill Companies, Inc., 2003McGraw-Hill/Irwin
Akhir Pertemuan 2 Terima Kasih


![1 INCOTERMS 2010 (1)[1]](https://static.fdokumen.com/doc/165x107/631de3d1dc32ad07f3074e54/1-incoterms-2010-11.jpg)