Nanoparticles of carbon allotropes inhibit glioblastoma multiforme angiogenesis in ovo
Upload
independentCategory
view
0download
0
ORIGINAL PAPER
Expression of the progenitor marker NG2/CSPG4 predicts poorsurvival and resistance to ionising radiation in glioblastoma
Agnete Svendsen • Joost J. C. Verhoeff • Heike Immervoll • Jan C. Brøgger • Justyna Kmiecik •
Aurelie Poli • Inger A. Netland • Lars Prestegarden • Jesus Planaguma • Anja Torsvik •
Anneli Bohne Kjersem • Per Ø. Sakariassen • Jan I. Heggdal • Wouter R. Van Furth •
Rolf Bjerkvig • Morten Lund-Johansen • Per Ø. Enger • Joerg Felsberg • Nicolaas H. C. Brons •
Karl J. Tronstad • Andreas Waha • Martha Chekenya
Received: 30 June 2011 / Revised: 15 August 2011 / Accepted: 15 August 2011 / Published online: 24 August 2011
� The Author(s) 2011. This article is published with open access at Springerlink.com
Abstract Glioblastoma (GBM) is a highly aggressive
brain tumour, where patients respond poorly to radiother-
apy and exhibit dismal survival outcomes. The mechanisms
of radioresistance are not completely understood. However,
cancer cells with an immature stem-like phenotype are
hypothesised to play a role in radioresistance. Since the
progenitor marker neuron-glial-2 (NG2) has been shown to
regulate several aspects of GBM progression in experi-
mental systems, we hypothesised that its expression would
influence the survival of GBM patients. Quantification of
NG2 expression in 74 GBM biopsies from newly diag-
nosed and untreated patients revealed that 50% express
high NG2 levels on tumour cells and associated vessels,
being associated with significantly shorter survival. This
effect was independent of age at diagnosis, treatment
received and hypermethylation of the O6-methylguanine
Electronic supplementary material The online version of thisarticle (doi:10.1007/s00401-011-0867-2) contains supplementarymaterial, which is available to authorized users.
A. Svendsen � J. Kmiecik � A. Poli � I. A. Netland �J. Planaguma � A. Torsvik � P. Ø. Sakariassen � R. Bjerkvig �P. Ø. Enger � K. J. Tronstad � M. Chekenya
Department of Biomedicine, University of Bergen,
5009 Bergen, Norway
J. J. C. Verhoeff
Laboratory of Experimental Oncology and Radiobiology,
Academic Medical Center, University of Amsterdam,
Amsterdam, The Netherlands
H. Immervoll
Department of Pathology, Haukeland University Hospital,
5021 Bergen, Norway
J. C. Brøgger
Department of Neurology, Haukeland University Hospital,
5021 Bergen, Norway
A. Poli � R. Bjerkvig � N. H. C. Brons
Centre de Recherche de Public de la Sante, Luxembourg,
Haukeland University Hospital, Bergen, Norway
L. Prestegarden
Department of Dermatology, Haukeland University Hospital,
5021 Bergen, Norway
A. B. Kjersem
Det Norske Veritas, Johan Berentsensvei 109-111,
5020 Bergen, Norway
J. I. Heggdal
Department of Oncology and Medical Physics,
University of Amsterdam, Amsterdam, The Netherlands
W. R. Van Furth
Department of Neurosurgery, Academic Medical Center,
University of Amsterdam, Amsterdam, The Netherlands
M. Lund-Johansen � P. Ø. Enger
Department of Neurosurgery, Haukeland University Hospital,
5021 Bergen, Norway
J. Felsberg
Department of Neuropathology, Heinrich-Heine-University,
Dusseldorf, Germany
A. Waha
Department of Neuropathology, University Hospital Bonn,
Bonn, Germany
M. Chekenya (&)
Translational Cancer Research Group, Jonas Lies vei 91,
5009 Bergen, Norway
e-mail: [email protected]
123
Acta Neuropathol (2011) 122:495–510
DOI 10.1007/s00401-011-0867-2

methyltransferase (MGMT) DNA repair gene promoter.
NG2 was frequently co-expressed with nestin and vimentin
but rarely with CD133 and the NG2 positive tumour cells
harboured genetic aberrations typical for GBM. 2D pro-
teomics of 11 randomly selected biopsies revealed
upregulation of an antioxidant, peroxiredoxin-1 (PRDX-1),
in the shortest surviving patients. Expression of PRDX-1
was associated with significantly reduced products of oxi-
dative stress. Furthermore, NG2 expressing GBM cells
showed resistance to ionising radiation (IR), rapidly
recognised DNA damage and effectuated cell cycle
checkpoint signalling. PRDX-1 knockdown transiently
slowed tumour growth rates and sensitised them to IR in
vivo. Our data establish NG2 as an important prognostic
factor for GBM patient survival, by mediating resistance to
radiotherapy through induction of ROS scavenging
enzymes and preferential DNA damage signalling.
Keywords Radiation resistance � NG2 �CD133, DNA damage � Peroxiredoxin-1 � Glioblastoma
Introduction
Glioblastoma (GBM) is the most common and malignant
primary brain tumour in adults [34]. Although combined
radiation and chemotherapy is currently the most effective
treatment modality, the patients have a median survival of
only 14.6 months [49], due to the tumour’s intrinsic resis-
tance to radio- and chemotherapy. Molecular markers that
effectively predict response to therapy and survival out-
comes are limited. Young age at diagnosis and promoter
methylation of the DNA repair gene O6-methylguanine
methyltransferase (MGMT) are established predictors of
favourable response to radiotherapy and chemotherapy [18,
34]. Reactive oxygen species (ROS) are produced in
response to ionising radiation (IR), and mediate its muta-
genic and cytotoxic effects. Elevated ROS, in excess of
antioxidant enzyme expression, damages DNA, lipids and
proteins, ultimately causing tumour cell death [41]. Perox-
iredoxins (PRDX) are a large, highly conserved thioredoxin-
specific antioxidant family classified by the presence of one
or two cysteine residues (1-Cys) and (2-Cys), respectively
[40]. PRDX-1 is a major 2-Cys family member whose
antioxidant activity modulates responses to IR.
The neural progenitor marker Neuron Glia-2 (NG2), is a
300 kDa transmembrane chondroitin sulphate proteoglycan
encoded by the cspg4 gene on chromosome 15 [31].
The human homologue is the melanoma proteoglycan
(MPG) and is aberrantly expressed by several tumour types
[2, 8, 25, 28, 43, 44] where it correlates with poor clinical
outcome [4, 45]. We have previously demonstrated that NG2
promoted GBM multi-drug chemoresistance mediated by
augmented integrin activated PI3K/AKT survival signalling.
[10]. We showed also that NG2 promotes tumour growth and
angiogenesis in animal models [9, 51]. Given its multi-
functional role in GBM biology, we hypothesised that
increased proportions of NG2 expressing cells in a GBM
may have an impact on patient survival outcomes. Further-
more, some studies have linked therapy resistance to another
subpopulation of GBM cells characterised by expression of
the neural stem cell marker, CD133/prominin [1]. We
therefore investigated the expression patterns of CD133,
nestin and vimentin expressing neural stem/progenitor cells
and asked whether the NG2 positive tumour cells co-
expressed these molecular markers. We demonstrate herein
that high NG2 expression on tumour cells and angiogenic
vasculature in GBM is associated with shorter survival,
independent of patients’ age, treatment, and MGMT pro-
moter hypermethylation status. NG2 expressing GBM cells
harbour genetic aberrations that are typical for the disease,
co-express nestin and vimentin but are rarely CD133 posi-
tive. At a mechanistic level, we demonstrate that NG2
positive GBM cells with increased PRDX-1 activity show
resistance to radiotherapy by rapidly inducing a DNA
damage signalling response. Moreover, this response could
be counteracted by NG2 and PRDX-1 knockdown in the
NG2 expressing cells but not in control NG2 negative cells.
Our data establish NG2 as a prognostic factor for poor sur-
vival and resistance to IR in GBM and as such may be an
amenable therapeutic target. Our findings further contribute
to a body of evidence demonstrating that aggressive growth
and therapy resistance may not be restricted to a discrete
population of tumour cells. Cellular and molecular hetero-
geneity in GBMs drive these biological features through
multiple mechanisms.
Materials and methods
Cell lines and shRNA transduction
The NG2 negative GBM cell line U251N (U251, American
Type Culture Collection, Rockville, MA, USA; ATCC)
was transfected with NG2 cDNA to produce the U251-
NG2 cell line as previously described [9]. HF66 (Ford
Cancer Center, Detroit, MI, USA) GBM cell line that
endogenously expressed NG2 was propagated as previ-
ously described [9]. Due to increasing reports of
misidentified cell lines, we verified the identities of all our
cell lines by STR analysis, and confirmed these to be
bonafide (data not shown).
Retroviral PRDX-1 and irrelevant GFP control shRNA
constructs were purchased from Origene (Rockville, MD),
and used to generate the stable U251-NG2 shPRDX-1 and
U251-NG2-shCTRL cell lines as well control U251
496 Acta Neuropathol (2011) 122:495–510
123

shPRDX-1 and U251 shCTRL cell lines. Stable cell lines
were generated by puromycin selection, according to the
manufacturer’s protocols. To validate our findings in
another cell line, the high endogenous NG2 expressing
HF66 cells were transduced with lentiviral particles har-
bouring shRNAs targeting the cspg4 gene or control
scrambled shRNAs according to the manufacturer’s pro-
tocol (Santa Cruz Biotechnology Inc, Santa Cruz, CA,
USA). Briefly, cells were infected at a MOI of 1–2 in the
presence of 10 lg/ml Polybrene� (Sigma Aldrich, St.
Louis, MO, USA). Stable clones expressing the shRNA
constructs were established by 2 lg/ml puromycin selec-
tion, and immunoblotting analyses validated knockdowns.
Patient samples
Ninety-six human GBM biopsies were obtained during
surgical resections performed at the Haukeland Univer-
sity Hospital, Norway, between 1998 and 2008, and the
University Hospital in Dusseldorf, Germany, from 1988
to 2004. In an additional study of GBM stem cell phe-
notyping, seven GBM biopsies from surgical resections
performed in 2010 at Haukeland University Hospital
were included. The patients gave their written informed
consent and the study was approved by the respective
ethical boards in Norway and Germany. Parts of the
tumour were snap frozen while other parts were formalin
fixed and paraffin embedded (FFPE). H&E-stained sec-
tions were prepared to define representative tumour
regions as previously described [17] and GBM diagnosis
was confirmed according to the World Health Organi-
zation (WHO) classification [27] by pathologists (H.I and
J.F). Eligibility criteria included availability of follow-up
data, less than 50% necrosis in the sample, and only
biopsies obtained at primary diagnosis were included.
Clinical information was obtained by reviewing the
medical records, and death certificates/registers. Patients
were followed-up from the date of operation until death
or May 2009. At this point only one patient with a NG2
negative tumour was alive. All patients were treated by
surgery, radiotherapy and/or chemotherapy and survival
determined as the time elapsed from the date of surgery
to the date of death.
Immunohistochemistry
FFPE tissue was subjected to immunohistochemistry using
the avidin–biotin-peroxidase complex method according to
the manufacturer’s protocol (Vectastain, Vector laborato-
ries, Burlingame, CA, USA). NG2 staining was performed
as previously described [10]. The expression was graded
blindly by two independent investigators including a
pathologist (H.I) as negative (0); slight (?); moderate
(??) or high (???) on tumour cells, or on vessels based
on overall staining intensity and area fraction of positive
cells (Table 2). However, due to small groups, 0/? and
??/??? were combined (Table 3).
Morphometric quantification of NG2 expression
in patient GBM biopsy material
NG2 expression was also quantified using the NIS-Ele-
mentsTM BR 3.1 software (Nikon Corporation, Tokyo,
Japan), 2009 magnification (Supplementary Figure ESM 1).
The threshold for pixel intensity was determined on the basis
of four brain tumour sections stained for NG2, using a Nikon
Eclipse 600 microscope (Nikon). This threshold was stored
and subsequently applied with identical microscope settings
for scoring of all tumour sections, including negative
controls stained for MOC31 antibody (Santa Cruz Biotech-
nology Inc.). Immunopositive elements (pixels above
threshold) were measured and expressed as area fraction of
the visual field for each tumour section. The NG2 low GBM
biopsies had an immunopositive fraction of 5% or less,
compared to NG2 high biopsies that had correspondingly
15% or more. The difference in immunopositive fraction
was statistically significant (T test, p = 0.0027).
Array comparative genomic hybridization
Comparative genomic hybridization was used to determine
the gene copy number in high and low NG2 expressing
GBMs (n = 5), using whole-genome arrays of 2,400
chromosomally mapped BAC clones (Hum.Array1.14) as
previously described [47].
Simultaneous immunohistochemistry and in situ
hybridization
FFPE patient GBM biopsies were incubated at 58�C o/n,
de-paraffinised and rehydrated using the standard proce-
dures. Antigen retrieval was performed in target retrieval
solution, pH 9 (DAKO Cytomation, Glostrup, Denmark).
The slides were dehydrated and washed in 29 SSC
(150 mM NaCl, 15 mM Sodium Citrate, pH7), and dena-
tured in the presence of 10 ll Vysis LSI EGFR Spectrum
Orange/CEP7 Spectrum Green probe (Abbott Molecular,
Abbott Park, IL, USA) at 75�C for 5 min. The slides were
hybridized at 37�C for 36 h in a humidified hybridisation
chamber, followed by incubation with anti-NG2 (WB
Stallcup, Burnham Institute) o/n at 4�C and AlexaFluor
647-labelled 2�Ab (Invitrogen, Carlsbad, CA, USA). The
slides were mounted with DAPI Vectashield, (Vector Labs,
Burlingame, CA, USA) and analysed on a Zeiss LSM
510Meta Confocal microscope (Carl Zeiss MicroImaging,
Thornwood, NY, USA).
Acta Neuropathol (2011) 122:495–510 497
123

Bisulfite treatment and MGMT methylation analysis
For the analysis of MGMT promoter methylation, DNA
was extracted from snap-frozen tumour tissue using pro-
teinase K digestion and phenol/chloroform extraction
whereas for FFPE samples, the QIAamp DNA mini kit
(Qiagen, Hilden, Germany) was used. Bisulfite conversion
was conducted as previously described [30]. Each tumour
and control sample (bisulfite treated DNA from normal
brain as negative control, and SssI treated genomic DNA as
positive control) was analysed using the same bisulfite
preparation as template.
2D electrophoresis
The first dimension of separation was carried out on
IPGphore (Amersham Biosciences, Uppsala, Sweden) at
20�C. The protein concentration was adjusted to 600 lg
in a sample buffer consisting of 7 M urea, 2 M thiourea,
4% CHAPS, 100 mM DTT, and 1% v/v pharmalyte
(Amersham Biosciences) pI 3-10, and applied to 18-cm
(pH 3–10) linear immobilized pH gradient (IPG) Im-
mobiline DryStrip (Amersham Biosciences) by in-sample
rehydration. The strips were applied onto 13.75% v/v
acrylamide/N,N0-methylenebisacrylamide gels (Bio-Rad,
Hempstead, UK). The gels were stained with SYPRO
Ruby (Bio-Rad) according to the manufacturer’s proto-
col, scanned on the Typhoon laser scanner (Amersham
GE Healthcare, Fairfield, CT, USA) and spot analysis
was performed on PDQuest software version 8.0
(Bio-Rad).
Protein digestion and mass spectrometry analysis
Differentially expressed protein spots digested in porcine
trypsin (Promega, Madison, WI, USA) and the peptides
mixed with a-cyano-4-hydroxycinnamic acid (CHCA)
(Bruker Daltonics, Bremen, Germany). Mass spectra were
generated on an Ultraflex MS/MS (Bruker Daltonics). Data
analysis was performed using MASCOT 2.0 software
(Matrix science, Boston, MA), the Swiss-Prot and NCB
database search. Protein identification was based on pep-
tide mass fingerprinting, percent coverage, Mowse score,
number of peptide matches, peak intensity, and match of
pI and molecular weight with the location of the protein on
the 2D gel [42].
Flow cytometric analysis of GBM stem cell phenotype
Seven GBM biopsies from newly diagnosed, untreated
patients were dissociated into single cell suspensions with
papain at 37�C using the Neuronal Dissociation Kit (Milte-
nyi Biotec, Bergisch-Gladbach, Germany) according to the
manufacturer’s protocol. GBM biopsies were stained with
the following purified mouse and rat anti-human monoclonal
antibodies (mAb): anti-CD45-V450, HI30 (BD Biosciences,
Erembodegem, Belgium); anti-Vimentin-FITC, V9 (eBio-
science, Vienna, Austria); anti-NG2, 9.2.27 (Santa Cruz
Biotechnology Inc.); anti-Nestin-PerCP-Cy5.5, 25/Nestin
(BD Bioscience); anti-CD31-PE-Cy7, WM59, (Biolegend,
San Diego, CA, USA); anti-CD133/1-APC, AC133 (Milte-
nyi Biotec, Bergisch Gladbach, Germany). Appropriate
isotype controls (ImmunoTools, Friesoythe, Germany) were
used in all experiments to determine the level of background
staining. The NCH421k GBM cells that are enriched for
CD133 [6] were used as positive controls (courtesy of Dr
Herold-Mende, Dept Neurosurgery, University of Heidel-
berg). The anti-NG2 mAb was coupled with Zenon R-PE
mouse IgG2a labelling kit, following the supplier’s recom-
mendations (Invitrogen, Paisley, UK). Dead cells were
excluded by LIVE/DEAD fixable near-infra red dead cells
staining (Invitrogen). After 30-min incubation at 4�C, the
GBM cell suspensions were washed twice in ice-cold
phosphate-buffered saline (PBS, Invitrogen) supplemented
with 0.5% BSA and then incubated for an additional 15 min
at 4�C and in the dark with Cytofix/Cytoperm solution (BD
Biosciences) in order to permeabilise the cells. The intra-
cellular staining using anti-Vimentin and anti-Nestin was
performed for 30 min at 4�C in PermWash solution (BD
Biosciences). After two washes in PermWash solution, cells
were suspended in PBS supplemented with 0.5% BSA
and stained with Hoechst solution at 0.1 lg/ml in order to
discriminate nuclear cells from debris. The samples were
run on a FACSAriaTM
flow cytometer and analysed with
FACSDivaTM
software (BD Biosciences). Diagrams were
then created using FlowJo flow software version 7.2.5 (Tree
Star Inc, Ashland, OR, USA).
Lipid peroxidation assay
The level of thiobarbituric reactive substances (TBARS)
was assessed in butanol-extracts of tissue homogenates
(10% w/v prepared from frozen samples), according to the
manufacturer’s protocol (Northwest Life Science Special-
ties, LCC, Vancouver). The 3rd-derivative absorbance
spectra (400–700 nm) were obtained, and malondialdehyde
levels were calculated based on the peak value at 510 nm.
Viability and clonogenic assays
Prior to irradiation cells in exponential growth were seeded
in conditioned medium in 6-well plates at a density of
300 cells/well. Colonies were stained in 6% glutaralde-
hyde/0.5% Crystal violet and counted 11 days post-
irradiation. Surviving fractions were calculated as previ-
ously described [16]. The 3-(4,5dimethylthiazol-2-yl)-5-(3-
498 Acta Neuropathol (2011) 122:495–510
123

carboxymethoxyphenyl)-2-(4-sulfophenyl)-2H-tetrazolium
salt (MTS) assay was used in viability assays after 120 h as
described by the manufacturer (CellTiter96 Aqueous One
Solution Cell Proliferation Assay, Promega, Madison, WI,
USA). Cells in exponential growth phase were seeded at
5,000 cells/ml in 96-well plates after exposure to ionising
radiation from 2, 5 10, and 20 Gy.
Flow cytometric assessment of cell cycle kinetics
G1-phase checkpoint was analysed by simultaneous mea-
surement of DNA content and bromo-deoxy uridine (BrdU)
uptake. After 5 Gy irradiation, the cells were incubated at
37�C for 2 h and pulse-labelled with 10 lM BrdU (BD
Pharmingen, San Jose, CA, USA) for 20 min. The cells
were fixed and propagated for staining with FITC-labelled
anti-BrdU antibody, according to the manufacturers pro-
tocol (BD Pharmingen). 7-AAD counterstain was used to
visualise DNA content. For G2 checkpoint analyses, irra-
diated cells were incubated at 37�C for 16 h, harvested and
fixed in 3.7% formaldehyde. Cells were immunostained for
phosphorylated Histone H3 Ser10 (Cell Signalling, Boston,
MA, USA) and nuclei counterstained with propidium
iodide according to the manufacturer’s protocol. Flow
cytometry was performed on Accuri C6, and bivariate data
analysed by FlowJo software (Tree Star Inc.).
Western blotting
Immunoblotting was performed using NuPage gel systems
(Invitrogen), lysates were prepared according to the Kinexus
protocol (http://www.kinexus.ca) 15 min post-irradiation.
Western blotting for PRDX-1 from mice brains was per-
formed on homogenates from the right (site of tumour
implantation) and the left hemisphere (normal brain). The
band intensity of PRDX-1 in the tumour was quantified using
densitometry, and expressed as fold change from the normal
brain, normalised for b-actin. Antibodies used: Phospho-
ATM (Ser1981); ATM (D2E2); Phospho-Chk2 (Thr68);
Chk2; phospho-ASK (Thr845); ASK; pH2AX (Cell Sig-
nalling), PRDX-1 (Abcam, Cambridge, UK); NG2 (WB
Stallcup, Burnham Institute); b-actin (Abcam).
Surgical procedures and ionising radiation
In vitro ionising radiation was given as 2, 5, 10 and 20 Gy
doses at a rate of 3.1 Gy/min with a Clinac 600C/D linear
accelerator irradiator (Varian Medical Systems Inc., Palo
Alto, CA, USA). Fifty-four, 4 to 6-week old athymic Nude-
nu female mice (Harlan, Horst, The Netherlands) were
xenografted intracranially with 5 9 105/3 ll PBS U251,
U251-NG2 ctrl shRNA or U251-NG2 PRDX-1shRNA
cells. Three weeks prior to the cell implantation, a hollow
guide-screw was implanted right fronto-lateral in the skull,
through which cell suspensions were injected 2 mm below
the screw, see Fig. 6a. At the onset of irradiation, starting
14 days post-implantation, a 0.2 mCi iodine-125 (125I)
seed (IBt, Seneffe, Belgium) was inserted though the hol-
low screw as described previously [50]. After 26 days mice
were sacrificed to enable tumour analysis.
Statistical analyses
Patient survival was analysed using the Kaplan–Meier and
the log rank test with Stata 11.0 software (StataCorp LP,
College Station, TX, USA). Cox regression was used to
adjust for age as a categorical variable, below 60, between
60 and 70, and 75 years and above. A probability B0.05
was considered significant. The two-tailed Student’s t test,
one way- or two way-analysis of variance (ANOVA) and
Chi-square analyses were performed using Graphpad Prism
5.0 (Graphpad Software, La Jolla, CA, USA).
Results
High NG2 expression associates with poorer survival
in GBM patients
To determine the relevance of aberrant NG2 expression in
GBM progression, we quantified expression in 96 unassigned
patient GBM biopsies and correlated the expression with
survival outcomes. The patient sample group had a median
survival of 12 months (Supplementary Figure ESM 1a),
mean and median age of 59.5 and 63.2 years, respectively.
The mean and median follow-up was 12.2 and 11.4 months,
respectively. Complete clinical data was available for 74
patients. There was no significant difference in the treatment
received in the high versus low NG2 expressing patients (Chi-
square 2.42, p = 0.49). 92.4% of all the patients received
temozolomide in combination with radiation and 9.5%
received procarbazine and vincristine (PCV) in addition. 13%
of the patients that received conventional fractionated whole
brain radiation also received gamma knife radiosurgery.
Histopathological examination revealed that NG2 was pre-
dominantly expressed on the surface of tumour cells
(Fig. 1a[2, 6]), as well as on the highly pleomorphic tumour
cells in different patients (Fig. 1a[3, 7]). NG2 was also
expressed on the tumour vasculature, in particular, on the
glomeruloid-like microvascular proliferations in the vicinity
of pseudopalisading necroses (Fig. 1a[4, 8]) but rarely on
normal appearing capillary vessels. 36% (n = 27) of the 74
GBM cases expressing high NG2 levels on the tumour cells
also highly expressed it on the tumour vasculature. 15%
(n = 11) of cases expressed high NG2 levels only on the
tumour cells, while 19% (n = 15) highly expressed it only on
Acta Neuropathol (2011) 122:495–510 499
123

the vasculature. 28% (n = 21) expressed little or undetect-
able levels of NG2 on the tumour cells or vasculature. Array
comparative genomic hybridisation (CGH) performed on a
subset of the GBM biopsies confirmed multiple genetic
aberrations characteristic of GBM in both the high and low
NG2 expressing GBM patient samples (Fig. 1b; Table 1)
[29]. To prove that the highly pleomorphic NG2 positive
tumour cells were indeed neoplastic, we hybridised the sec-
tions with a probe for epidermal growth factor receptor
(EGFR), one of the most frequently amplified genes in GBM
[29] and simultaneously stained them for NG2. The NG2
positive cells were shown to harbour gross chromosomal
alterations, including EGFR and centrosome 7 amplification
(Fig. 1c). Kaplan–Meier survival analysis demonstrated a
significantly shorter median survival of 8 months for the NG2
high (n = 38), compared to the NG2 low (n = 36)
expressing patients, that had a median survival of
12.5 months. The difference in survival was statistically
significant whether NG2 was highly expressed on tumour
cells or the associated vasculature (Log Rank test5.196,
df = 1, p = 0.03 and p = 0.02), respectively, Fig. 1d;
Tables 2, 3). The patients that highly expressed NG2 only on
the tumour cells or vasculature had median survival of 11 and
12 months, respectively, and there was no significantly
increased mortality in these patients when compared to the
NG2 low tumour/low vessel group (ANOVA, p = 0.3 and
p = 0.2, respectively) that had a median survival of
13 months. However, the Cox regression hazard ratios were
1.52 and 1.60 increased risk of death in the patients that highly
expressed NG2 only on the tumour cells or only on the vas-
culature, respectively, compared to the low NG2 expressors.
This lack of statistical significance may be due to the small
Fig. 1 High NG2 expression is prognostic for poor survival
independent of MGMT promoter methylation. a Immunohistochemis-
try staining for NG2 in representative GBM examples of NG2
negative tumours (1 and 5); NG2 positivity mostly on tumour cells (2and 6), on the most pleomorphic tumour cells (arrowheads in 3 and
7), and on vessels and microvascular proliferations (arrowheads in 4and 8). b Array CGH demonstrating genetic aberrations indicated by
loss of chromosomes 6, 9, 10, 13 and 14, as well as gains on
chromosomes 7, 12, 15 and 21, consistent with GBM diagnosis in
patient material of NG2-low (2 and 10) and NG2-high (8, 11, 20)
tumours. c Simultaneous fluorescent immunostaining of NG2 (red)
and fluorescent in situ hybridisation for EGFR (orange) and
centromere 7 (green) amplifications. Nuclear counterstain (blue) by
DAPI. d Left Kaplan–Meier survival curves for high versus low NG2
expressors on tumour cells, Middle Kaplan–Meier survival curves for
high versus low NG2 expressors on vasculature, Right Proportion of
patient GBMs exhibiting MGMT promoter hypermethylation versus
unmethylated promoter in the groups of NG2 positive and NG2
negative tumours
500 Acta Neuropathol (2011) 122:495–510
123
patient numbers in these groups. In contrast, the patients that
highly expressed NG2 on both tumour cells and microvas-
cular proliferations had a significantly shorter median
survival of 8.2 months compared to 13 months in the patients
expressing low NG2 levels on both tumour cells and micro-
vascular proliferations, p = 0.005, (hazard ratio 2.55).
Morphometric quantification of NG2 levels on both tumour
cells and angiogenic vessels revealed significant differences
in NG2 levels in the high and low expressors (Supplementary
Figure ESM 1b, t test, p = 0.0027) confirming the patholo-
gists grading, Supplementary Figure ESM 1d. Although some
tumours were completely NG2 negative, the majority
had varying levels of expression from reduced intensity and
immunopositive area fraction to highly intense immunopo-
sitivity and large area fraction. Since age at diagnosis is a
major prognostic factor, we adjusted for this variable. The
hazard ratio before adjusting for age was HR1.313 (p = 0.03).
However, after adjusting for age, (\60, 60–70, C75 years)
the significance level of NG2 expression on survival was even
stronger, HR1.36 (p = 0.0177). The effect of age on survival
had a hazard ratio of 2.09 for ages 60–70, and 2.81 in the
group aged C75 years. In addition, 51% of the NG2 positive
tumours contained methylated MGMT promoter, compared
to 26% of the NG2 negative tumours (Fishers exact test,
p = 0.03; Fig. 1d). Taken together, the association of NG2
expression with poorer survival was independent of clinical
treatment, age and MGMT promoter methylation status.
NG2 expressing cells are phenotypically distinct
from CD133 positive tumour cells
Since multiple progenitor cells express NG2 during nor-
mal tissue development, we aimed to establish whether
NG2 was co-expressed with other markers of immature
cells in GBM tumours. Using flow cytometry, we inves-
tigated tumour cells from seven dissociated surgical
specimens for expression of NG2, nestin, vimentin and
CD133. Viable cells were selected for analysis by
excluding dead cells by live/dead staining and excluding
debris by including only Hoechst positive nucleated cells
(Fig. 2a). Furthermore, the cells were gated on CD45- and
CD31-populations to exclude immune and endothelial
cells, respectively, and ensure subsequent analysis of
tumour cells (Fig. 2b). We asked what percentage of
tumour cells were NG2, nestin and vimentin positive and
whether these subpopulations were coincident with
CD133 positive cells. A large proportion of the GBM
cells were NG2 and nestin double positive, 50.2 ± 8.4%,
n = 7 (Fig. 2c). The majority of these cells were also
positive for vimentin, 94.5 ± 2.4%, n = 7 (Table 4) and
negative for CD133, 1.75 ± 1.2%, n = 7 (Fig. 2d). NG2
was variably expressed in these GBMs (Fig. 2e; Table 4).
These results are consistent with qualitative immunohis-
tochemical analyses presented in Fig. 1. A majority of
NG2 positive cells co-expressed the intermediate fila-
ments nestin and vimentin, confirming their immature
phenotype. NG2/nestin positive cells rarely co-expressed
CD133 (p = 0.0021, Mann–Whitney U paired, two-tailed
t test, Fig. 2; Table 4). These studies confirmed that NG2
positive tumour cells represent an immature, mesenchy-
mal differentiation phenotype and the majority of these
are distinct from CD133 positive populations.
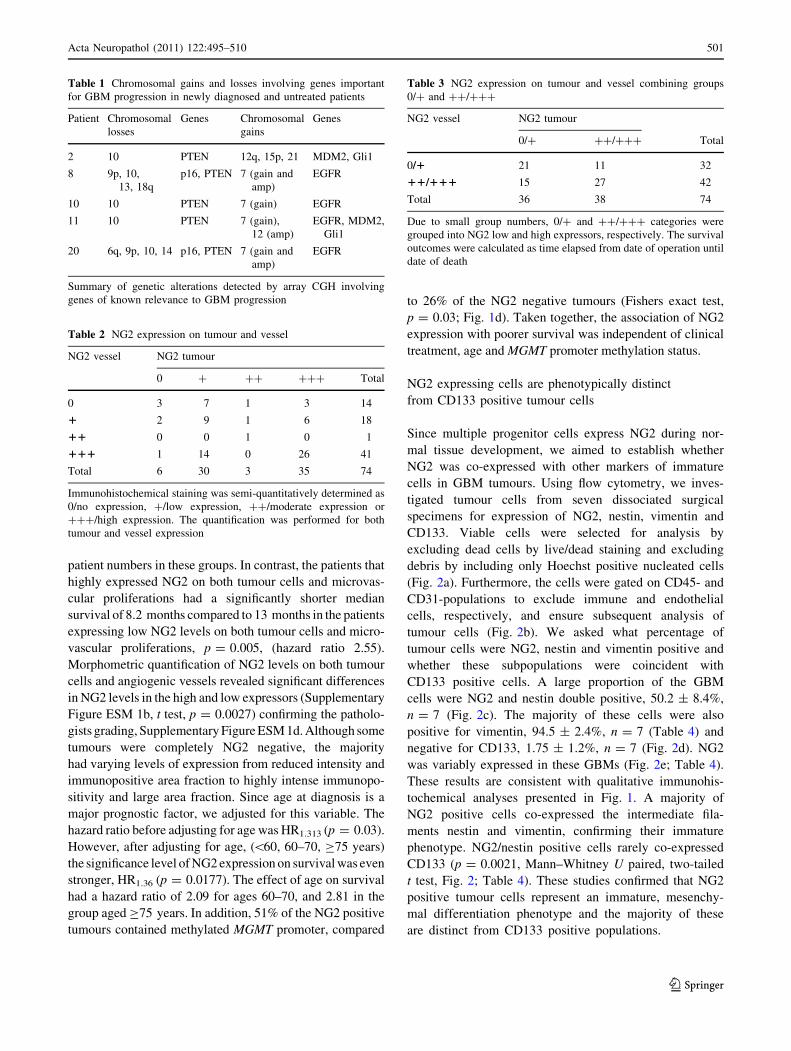
Table 2 NG2 expression on tumour and vessel
NG2 vessel NG2 tumour
0 ? ?? ??? Total
0 3 7 1 3 14
1 2 9 1 6 18
11 0 0 1 0 1
111 1 14 0 26 41
Total 6 30 3 35 74
Immunohistochemical staining was semi-quantitatively determined as
0/no expression, ?/low expression, ??/moderate expression or
???/high expression. The quantification was performed for both
tumour and vessel expression
Table 3 NG2 expression on tumour and vessel combining groups
0/? and ??/???
NG2 vessel NG2 tumour
0/? ??/??? Total
0/1 21 11 32
11/111 15 27 42
Total 36 38 74
Due to small group numbers, 0/? and ??/??? categories were
grouped into NG2 low and high expressors, respectively. The survival
outcomes were calculated as time elapsed from date of operation until
date of death
Table 1 Chromosomal gains and losses involving genes important
for GBM progression in newly diagnosed and untreated patients
Patient Chromosomal
losses
Genes Chromosomal
gains
Genes
2 10 PTEN 12q, 15p, 21 MDM2, Gli1
8 9p, 10,
13, 18q
p16, PTEN 7 (gain and
amp)
EGFR
10 10 PTEN 7 (gain) EGFR
11 10 PTEN 7 (gain),
12 (amp)
EGFR, MDM2,
Gli1
20 6q, 9p, 10, 14 p16, PTEN 7 (gain and
amp)
EGFR
Summary of genetic alterations detected by array CGH involving
genes of known relevance to GBM progression
Acta Neuropathol (2011) 122:495–510 501
123

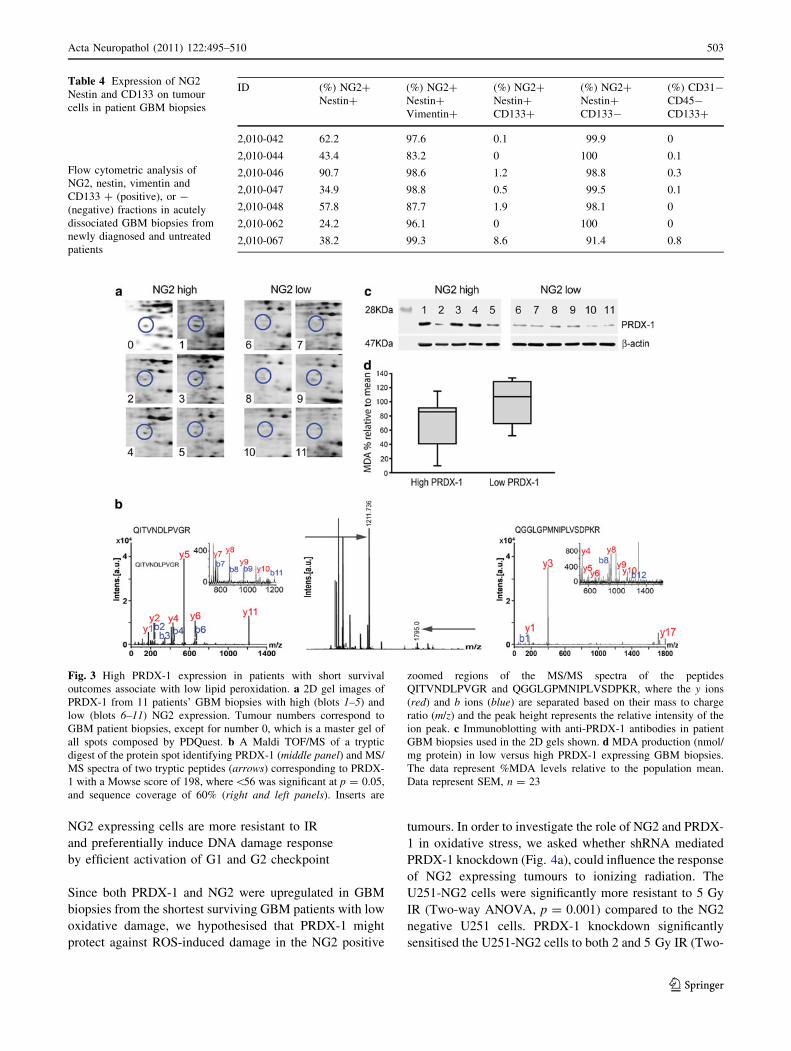
PRDX-1 is highly expressed in GBMs from the patients
with shortest survival
Next, we aimed to identify protein signatures associated with
the survival outcomes using proteomic analyses. PDQuest
statistical software identified 15 spots that significantly dif-
ferentiated the high from the low NG2 expressing biopsies,
p \ 0.05. One of the spots was identified in all the NG2 high
patients with shortest survival (Fig. 3a, blot 1–5) but not the
NG2 low patients with longer survival outcomes (Fig. 3a,
blot 6–11). This spot corresponded to the antioxidant enzyme
PRDX-1. The mass spectrum of tryptic peptides from the
protein spot (22.3 kDa; pI 8.27) on Maldi ToF MS is shown in
Fig. 3b. MS/MS fragment spectra (post source decay) of the
precursors m/z 1,211.7 QITVNDLPVGR (Fig. 3b, left and
insert) and m/z 1,795.0 QGGLGPMNIPLVSDPKR (Fig. 3b,
right and insert). The peptide fragments were consistent with
in silico fragmentation of QITVNDLPVGR and QGGLG
PMNIPLVSDPKR and were both unique for PRDX-1. We
confirmed by immunoblotting that the PRDX-1 levels were
upregulated in the patient GBMs with the shortest (Fig. 3c,
left) compared to those with longer survival outcomes
(Fig. 3c, right). In order to functionally test the antioxidant
activity of PRDX-1 in the high NG2 expressing GBMs, we
measured the end products of lipid peroxidation and found
that patient biopsies with high PRDX-1 levels had signifi-
cantly lower levels of malondialdehyde (MDA) (T test,
n = 23, p = 0.038; Fig. 3d). However, PRDX-1 expression
was not of prognostic relevance for GBM patient survival
(p [ 0.05, Online Supplementary Figure ESM 1c).
Fig. 2 Expression of CD133 on
the NG2? subpopulation of
tumour cells in patient biopsies.
a Representative gating strategy
from patient 2,010-046 showing
viable cells gated on Live/dead
negative and Hoechst positive
nucleated cells. b Tumour cells
were discriminated from
immune and endothelial cells by
excluding CD45? and CD31?
cells, respectively. c % tumour
cells double positive for NG2
and Nestin. d Representative
histogram showing CD133
expression by the NG2?/
Nestin? cells (blue), CD133
isotype control (dark shadedregion), NCH421k GBM cells
enriched for CD133 used as
positive control (green). e %
tumour cells positive for NG2/
nestin levels in the CD31–
CD45-gated cells. f The NG2/
nestin expressing tumour cells
have low CD133 expression,
p = 0.0021, Mann–Whitney
U paired t test
502 Acta Neuropathol (2011) 122:495–510
123
NG2 expressing cells are more resistant to IR
and preferentially induce DNA damage response
by efficient activation of G1 and G2 checkpoint
Since both PRDX-1 and NG2 were upregulated in GBM
biopsies from the shortest surviving GBM patients with low
oxidative damage, we hypothesised that PRDX-1 might
protect against ROS-induced damage in the NG2 positive
tumours. In order to investigate the role of NG2 and PRDX-
1 in oxidative stress, we asked whether shRNA mediated
PRDX-1 knockdown (Fig. 4a), could influence the response
of NG2 expressing tumours to ionizing radiation. The
U251-NG2 cells were significantly more resistant to 5 Gy
IR (Two-way ANOVA, p = 0.001) compared to the NG2
negative U251 cells. PRDX-1 knockdown significantly
sensitised the U251-NG2 cells to both 2 and 5 Gy IR (Two-
Table 4 Expression of NG2
Nestin and CD133 on tumour
cells in patient GBM biopsies
Flow cytometric analysis of
NG2, nestin, vimentin and
CD133 ? (positive), or -
(negative) fractions in acutely
dissociated GBM biopsies from
newly diagnosed and untreated
patients
ID (%) NG2?
Nestin?
(%) NG2?
Nestin?
Vimentin?
(%) NG2?
Nestin?
CD133?
(%) NG2?
Nestin?
CD133-
(%) CD31-
CD45-
CD133?
2,010-042 62.2 97.6 0.1 99.9 0
2,010-044 43.4 83.2 0 100 0.1
2,010-046 90.7 98.6 1.2 98.8 0.3
2,010-047 34.9 98.8 0.5 99.5 0.1
2,010-048 57.8 87.7 1.9 98.1 0
2,010-062 24.2 96.1 0 100 0
2,010-067 38.2 99.3 8.6 91.4 0.8
Fig. 3 High PRDX-1 expression in patients with short survival
outcomes associate with low lipid peroxidation. a 2D gel images of
PRDX-1 from 11 patients’ GBM biopsies with high (blots 1–5) and
low (blots 6–11) NG2 expression. Tumour numbers correspond to
GBM patient biopsies, except for number 0, which is a master gel of
all spots composed by PDQuest. b A Maldi TOF/MS of a tryptic
digest of the protein spot identifying PRDX-1 (middle panel) and MS/
MS spectra of two tryptic peptides (arrows) corresponding to PRDX-
1 with a Mowse score of 198, where\56 was significant at p = 0.05,
and sequence coverage of 60% (right and left panels). Inserts are
zoomed regions of the MS/MS spectra of the peptides
QITVNDLPVGR and QGGLGPMNIPLVSDPKR, where the y ions
(red) and b ions (blue) are separated based on their mass to charge
ratio (m/z) and the peak height represents the relative intensity of the
ion peak. c Immunoblotting with anti-PRDX-1 antibodies in patient
GBM biopsies used in the 2D gels shown. d MDA production (nmol/
mg protein) in low versus high PRDX-1 expressing GBM biopsies.
The data represent %MDA levels relative to the population mean.
Data represent SEM, n = 23
Acta Neuropathol (2011) 122:495–510 503
123

way ANOVA, p = 0.05, Fig. 4b). Interestingly, the U251-
NG2 cells had an increased recognition of IR induced DNA
double-strand breaks (DSBs), as indicated by phosphory-
lated Histone 2A (H2AX), compared to U251 and U251-
NG2 shRNA/PRDX-1 cells. U251-NG2 cells showed a
marked activation of the checkpoint proteins, pATM and
pChk2 compared to U251 and U251-NG2 shRNAPRDX-1
cells (Fig. 4c). Even low dose IR-induced DNA damage
immediately activated cell cycle checkpoints as indicated
by phosphorylation of cH2AX, ATM and Chk2 proteins in
U251-NG2 positive cells (Fig. 4c). In particular, Chk2 was
activated in a dose-dependent manner. In contrast, phos-
phorylation of checkpoint proteins was only evident after
high IR doses of 10–20 Gy in the U251 and U251-NG2
shRNA/PRDX-1 cells (Fig. 4c). PRDX-1 levels were con-
sistently higher in the U251-NG2 and U251-NG2 shRNA
CTRL cells. PRDX-1 levels were attenuated in the U251
and U251-NG2 shRNA/PRDX-1 cells (Fig. 4c). These
findings from these cells with a similar genetic background
were confirmed in HF66 cells with endogenous NG2
Fig. 4 NG2 positive cells are
more resistant to IR and activate
checkpoint. a Immunoblotting
of NG2 expression and stable
PRDX-1 protein knockdown, b-
actin as control for equal
loading. b Clonogenic survival
11 days post-treatment with
5 Gy IR. The data represent the
mean ± SEM from three
independent experiments.
c Composite immunoblot of
phosphorylated ATM, Chk2,
(H2AX and ASK1 from
multiple blots, 15 min post IR
treatment. d Bivariate flow
cytometric analysis of BrdU
uptake and cell cycle
distribution determines G1
checkpoint efficiency 2 h post
5 Gy irradiation
504 Acta Neuropathol (2011) 122:495–510
123
expression. NG2 knockdown by shRNA (supplementary
Figure ESM 2a) sensitised these cells to IR (Supplementary
Figure ESM 2b). PRDX-1 and Chk2 were activated in a
dose-dependent manner after 2 and 5 Gy in the HF66 wt
and HF66 ctrl shRNA cells, which subsequently exited
checkpoint, while HF66 NG2 shRNA failed to show dose-
dependent PRDX-1 and Chk2 induction (Supplementary
Figure ESM 2c).
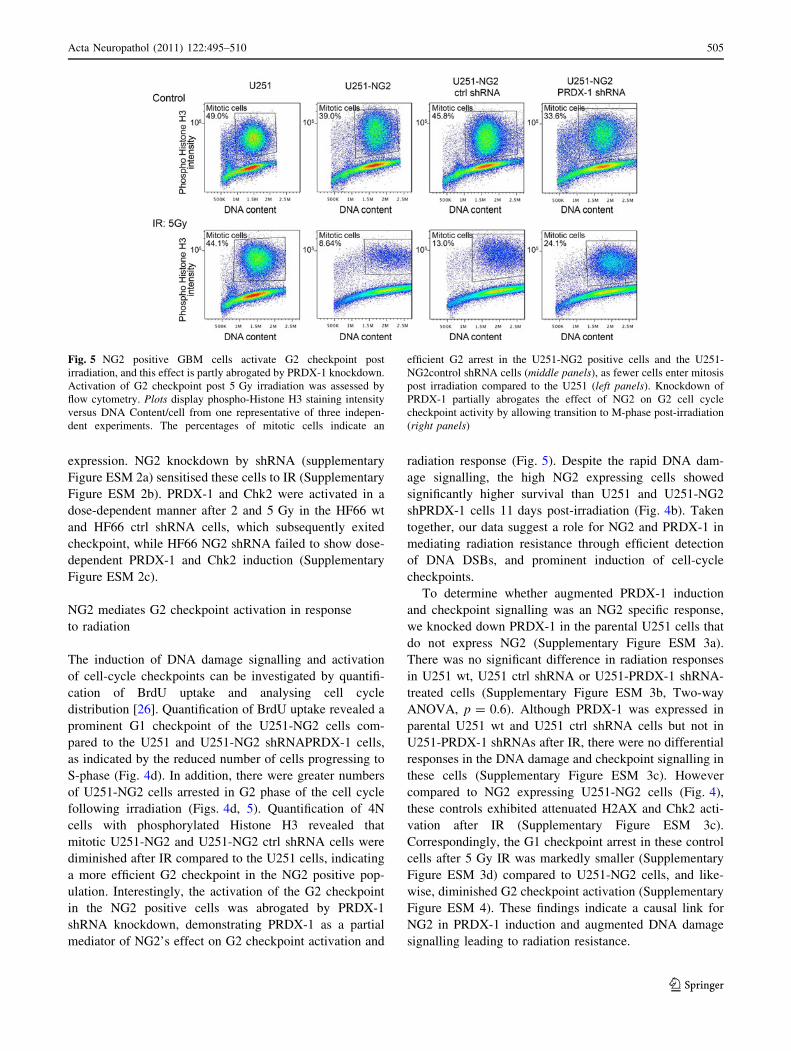
NG2 mediates G2 checkpoint activation in response
to radiation
The induction of DNA damage signalling and activation
of cell-cycle checkpoints can be investigated by quantifi-
cation of BrdU uptake and analysing cell cycle
distribution [26]. Quantification of BrdU uptake revealed a
prominent G1 checkpoint of the U251-NG2 cells com-
pared to the U251 and U251-NG2 shRNAPRDX-1 cells,
as indicated by the reduced number of cells progressing to
S-phase (Fig. 4d). In addition, there were greater numbers
of U251-NG2 cells arrested in G2 phase of the cell cycle
following irradiation (Figs. 4d, 5). Quantification of 4N
cells with phosphorylated Histone H3 revealed that
mitotic U251-NG2 and U251-NG2 ctrl shRNA cells were
diminished after IR compared to the U251 cells, indicating
a more efficient G2 checkpoint in the NG2 positive pop-
ulation. Interestingly, the activation of the G2 checkpoint
in the NG2 positive cells was abrogated by PRDX-1
shRNA knockdown, demonstrating PRDX-1 as a partial
mediator of NG2’s effect on G2 checkpoint activation and
radiation response (Fig. 5). Despite the rapid DNA dam-
age signalling, the high NG2 expressing cells showed
significantly higher survival than U251 and U251-NG2
shPRDX-1 cells 11 days post-irradiation (Fig. 4b). Taken
together, our data suggest a role for NG2 and PRDX-1 in
mediating radiation resistance through efficient detection
of DNA DSBs, and prominent induction of cell-cycle
checkpoints.
To determine whether augmented PRDX-1 induction
and checkpoint signalling was an NG2 specific response,
we knocked down PRDX-1 in the parental U251 cells that
do not express NG2 (Supplementary Figure ESM 3a).
There was no significant difference in radiation responses
in U251 wt, U251 ctrl shRNA or U251-PRDX-1 shRNA-
treated cells (Supplementary Figure ESM 3b, Two-way
ANOVA, p = 0.6). Although PRDX-1 was expressed in
parental U251 wt and U251 ctrl shRNA cells but not in
U251-PRDX-1 shRNAs after IR, there were no differential
responses in the DNA damage and checkpoint signalling in
these cells (Supplementary Figure ESM 3c). However
compared to NG2 expressing U251-NG2 cells (Fig. 4),
these controls exhibited attenuated H2AX and Chk2 acti-
vation after IR (Supplementary Figure ESM 3c).
Correspondingly, the G1 checkpoint arrest in these control
cells after 5 Gy IR was markedly smaller (Supplementary
Figure ESM 3d) compared to U251-NG2 cells, and like-
wise, diminished G2 checkpoint activation (Supplementary
Figure ESM 4). These findings indicate a causal link for
NG2 in PRDX-1 induction and augmented DNA damage
signalling leading to radiation resistance.
Fig. 5 NG2 positive GBM cells activate G2 checkpoint post
irradiation, and this effect is partly abrogated by PRDX-1 knockdown.
Activation of G2 checkpoint post 5 Gy irradiation was assessed by
flow cytometry. Plots display phospho-Histone H3 staining intensity
versus DNA Content/cell from one representative of three indepen-
dent experiments. The percentages of mitotic cells indicate an
efficient G2 arrest in the U251-NG2 positive cells and the U251-
NG2control shRNA cells (middle panels), as fewer cells enter mitosis
post irradiation compared to the U251 (left panels). Knockdown of
PRDX-1 partially abrogates the effect of NG2 on G2 cell cycle
checkpoint activity by allowing transition to M-phase post-irradiation
(right panels)
Acta Neuropathol (2011) 122:495–510 505
123
To investigate the mechanisms by which PRDX-1 might
confer radioprotection, we examined activated apoptosis
signalling kinase (ASK1) levels following IR. ASK1 is
kept inactive by intramolecular complex with thioredoxins,
and ROS oxidise thioredoxin and release it from ASK1.
Phosphorylation of ASK1 is cognate for cell death by
apoptosis [20]. Phospho-ASK1 levels were elevated in the
radiosensitive U251 and U251-PRDX-1 shRNA cells in a
radiation dose-dependent manner, whereas phospho-ASK1
levels were unaltered in the radioresistant U251-NG2 cells
(Fig. 4c), suggesting that the radioprotective effect of
PRDX-1 is mediated by blocking phosphorylation of
ASK1.
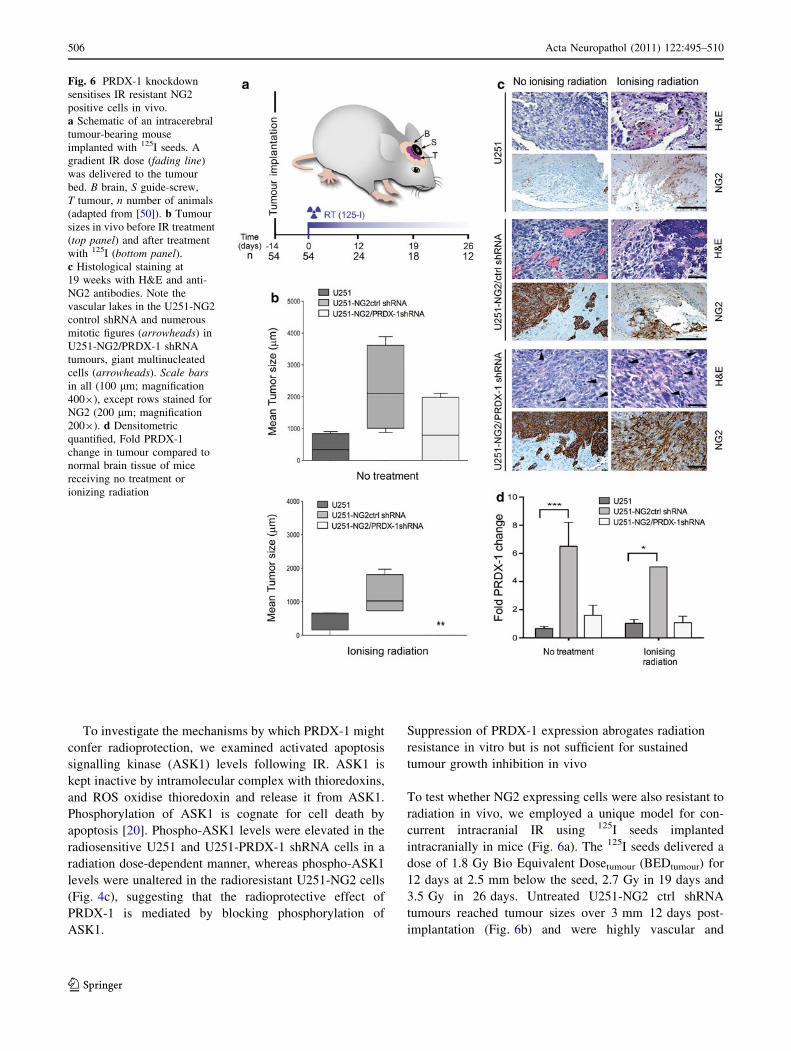
Suppression of PRDX-1 expression abrogates radiation
resistance in vitro but is not sufficient for sustained
tumour growth inhibition in vivo
To test whether NG2 expressing cells were also resistant to
radiation in vivo, we employed a unique model for con-
current intracranial IR using 125I seeds implanted
intracranially in mice (Fig. 6a). The 125I seeds delivered a
dose of 1.8 Gy Bio Equivalent Dosetumour (BEDtumour) for
12 days at 2.5 mm below the seed, 2.7 Gy in 19 days and
3.5 Gy in 26 days. Untreated U251-NG2 ctrl shRNA
tumours reached tumour sizes over 3 mm 12 days post-
implantation (Fig. 6b) and were highly vascular and
Fig. 6 PRDX-1 knockdown
sensitises IR resistant NG2
positive cells in vivo.
a Schematic of an intracerebral
tumour-bearing mouse
implanted with 125I seeds. A
gradient IR dose (fading line)
was delivered to the tumour
bed. B brain, S guide-screw,
T tumour, n number of animals
(adapted from [50]). b Tumour
sizes in vivo before IR treatment
(top panel) and after treatment
with 125I (bottom panel).c Histological staining at
19 weeks with H&E and anti-
NG2 antibodies. Note the
vascular lakes in the U251-NG2
control shRNA and numerous
mitotic figures (arrowheads) in
U251-NG2/PRDX-1 shRNA
tumours, giant multinucleated
cells (arrowheads). Scale barsin all (100 lm; magnification
4009), except rows stained for
NG2 (200 lm; magnification
2009). d Densitometric
quantified, Fold PRDX-1
change in tumour compared to
normal brain tissue of mice
receiving no treatment or
ionizing radiation
506 Acta Neuropathol (2011) 122:495–510
123

invaded the brain parenchyma through perivascular infil-
tration (Fig. 6c). Nevertheless, this invasive phenotype in
the xenografts was distinct from that of patient GBMs that
display more diffuse invasion of the neuropil by single
tumour cells. U251-NG2 tumours expressed sixfold more
PRDX-1 protein than U251 tumours in vivo (Fig. 6d).
PRDX-1 knock down delayed the growth of U251-NG2
PRDX-1 shRNA tumours compared to U251-NG2 ctrl
shRNA and U251 tumours (Fig. 6b) there were no signifi-
cant difference in tumour-sizes of the different groups
(Two-way ANOVA, p \ 0.08; Fig. 6b). PRDX-1 knock-
down partially sensitised U251-NG2 PRDX-1 shRNA cells
to IR (Two-way ANOVA, p \ 0.05; Fig. 6b), while the
U251 tumours were entirely growth suppressed and there
was no viable tumour evident after 26 days (Two-way
ANOVA; F4.420; p \ 0.05). Only haemorrhage and reactive
gliosis was evident in remnant lesions from these animals
(Fig. 6c). Immunoblotting of the brain lysates revealed that
PRDX-1 was indeed stably downregulated in vivo and that
the levels were similar to those of the NG2 negative
tumours (Fig. 6d), supporting the sensitised response to IR
in these animals. The radioresistant U251-NG2ctrl shRNA
cells had the greatest PRDX-1 levels both before and after
IR (Fig. 6d). Our data collectively establish a role for NG2
as a predictive factor for radiation response in vivo, partially
mediated by increased PRDX-1 expression.
Discussion
The present study demonstrates that increased expression of
the progenitor marker NG2 on tumour cells and vasculature
in GBM biopsies was associated with shorter patient
survival, independent of age, clinical treatment and MGMT
promoter hypermethylation status. NG2 was highly
expressed on the surface of tumour cells, including the most
pleomorphic cells. However, both NG2 positive and nega-
tive tumours exhibited gross chromosomal aberrations that
are typical for GBM. Approximately 19% of the GBM cases
highly expressed NG2 only on the tumour vasculature, and
predominantly on the glomerular-like microvascular
proliferations. We have previously demonstrated that
overexpression of NG2 in NG2 negative tumour cells pro-
duced highly angiogenic tumours characterised by highly
tortuous and leaky vasculature [5, 9]. We further demon-
strated recently that perturbation of NG2 function with
shRNAs abrogated angiogenesis and normalised the tumour
vasculature both structurally and functionally in patient
GBM-based xenografts [51], indicating a causal role for
NG2 in the formation of abnormal tumour vessels. Florid
microvascular proliferations are poorly perfused and leaky,
due to frequent thrombosis, lack of patent lumen and
reduced blood brain barrier integrity. As a consequence,
they are commonly located in the vicinity of necrosis where
they are thought to contribute to the genesis of the ischemia
[24]. Hypoxia promoting microvascular proliferations con-
tribute to radioresistance by reducing the oxygen
enhancement effect of IR, inducing gene expression for cell
cycle delay and stress proteins, and/or by increased genetic
and cellular heterogeneity [19]. The association of high
NG2 expression on microvascular proliferations with 60%
increased risk of patient mortality and the implications for
radioresistance are limited by the retrospective neuro-
pathological nature of the analysis that does not establish
causality. We thus investigated the effect of IR in the
angiogenic, NG2 expressing tumours in vivo, enabling us to
mitigate these retrospective limitations. We were intrigued
to note that the NG2 expressing tumours were still more
resistant to IR compared to the less angiogenic, U251
tumours, that were completely eliminated in vivo. These
findings implicate NG2 as an important factor predicting
response to IR rather than differential hypoxic tumour
microenvironments. The proportion of cycling U251-NG2
cells was reduced immediately post irradiation, and con-
comitantly, checkpoint point and DNA damage sensor
proteins were activated. Subsequently, a larger fraction of
the NG2 positive cells survived irradiation in vitro and in
vivo. Collectively, these findings suggest that due to their
high metabolic rates, these cells may have evolved a
mechanism for surviving DNA damage based on rapid
damage detection and checkpoint activation, facilitating
repair or availability of survival factors.
The majority of the tumours highly expressed NG2 on
both tumour cells and angiogenic vasculature, which is
consistent with the high concordance of poor survival out-
comes based on tumour or vascular NG2 expression,
indicating that multiple mechanisms impacted on the
patients’ survival outcomes. Indeed, high NG2 expression
on both tumour cells and microvascular proliferations
increased the risk of death by 155%. These findings have
significant clinical implications as NG2 identifies 50% of
GBM patients who respond poorly despite optimal treat-
ment. In addition, our data demonstrate that high NG2
expression may override the impact of otherwise favourable
prognostic factors such as young age and MGMT hyper-
methylation status. Stratification for age and MGMT
promoter methylation is mandatory in EORTC clinical trials
for GBM, thus we suggest that NG2 may be an additional
eligibility factor for identifying the potentially poor
responders.
NG2 is an established marker for progenitor cells in
various tissues [3], and we have previously shown that it
was greatly expressed in GBMs and oligodendrogliomas
compared to low-grade tumours [8, 11]. So far it had not
been established whether the NG2 positive tumour cells in
GBMs represent an immature phenotype. We demonstrated
Acta Neuropathol (2011) 122:495–510 507
123

herein that the vast majority of NG2? tumour cells co-
expressed nestin and vimentin, and that this subpopulation
rarely expressed CD133, indicating a possible mesenchy-
mal differentiation phenotype [13]. These findings are
supported by cDNA microarray data of the GBM molecular
class datasets [37], where searches revealed that the greatest
intensity of NG2 gene (cspg4) expression was in the GBM
with necrosis where 13/50 (26%) exhibited intensity values
equal to or greater than 500 [37]. They all fell under the
proliferative/mesenchymal subclass with a predominance of
genes related to proliferation, wound healing and angio-
genesis. This subclass was demonstrated to be associated
with poor patient survival [7, 37]. Indeed only 1/6 of the
GBMs belonging to the proneural classification (GBM
without necrosis) had cspg4 intensity greater than 500. So,
the association of NG2 with poor survival is partially val-
idated by independent datasets and adds to the link between
immature cells and GBM aggressiveness [1, 37]. On the
other hand, a body of evidence is emerging demonstrating
that GBM cells expressing various differentiation markers,
irrespective of the stem cell phenotype, may as readily
contribute to the aggressive growth of this disease [13, 38].
Loss of heterozygosity of chromosome 10 and gain of
chromosome 7 have been linked to the mesenchymal GBM
phenotype. Although limited, our array CGH data showed a
possible trend in favour of greater frequency or amplitude
of relative copy number changes on chromosomes 7 and 10
in the high NG2 expressing tumours. Combined with the
flow cytometric data demonstrating high vimentin expres-
sion in this subpopulation, this trend is in keeping with the
finding of high NG2 expression among the previously
reported poor prognosis proliferative and mesenchymal
tumour subtypes [37]. It is thus also possible that the
prognostic value of NG2 might be partially based on its
ability to distinguish molecular tumour subtypes. Further
work is required to explore these initial observations. Our
data emphasise the complexity of this cancer and the need
for individualised therapy based on the tumours genetic and
phenotypic composition. We hypothesise that NG2 could be
an attractive target in tailored GBM treatment because it is
expressed on both the sprouting tumour vasculature and
treatment resistant tumour cells.
Upregulation of peroxiredoxin antioxidants has been
reported in various solid tumours [23, 32, 35], and is pro-
posed to protect cancer cells from oxidative damage,
induced by excessive metabolic activity and anti-cancer
treatments. PRDX-1 belongs to the same gene family as
PRDX-II, whose expression was induced by IR and che-
motherapy [14, 36, 48]. We previously demonstrated that
highly aggressive NG2 expressing cell lines and patient
GBM spheroids were more resistant to chemotherapy
mediated by increased integrin/PI3K/AKT survival signal-
ling [10]. Since these GBM patients also expressed high
levels of PRDX-1, our study supports a role for augmented
survival signalling that rescues the tumours from lethal
DNA damage. Antioxidants inhibit the formation of peroxy
radicals and interfere with the subsequent formation of
cyclic endo-peroxides to malondialdehyde [39]. Our finding
of low MDA levels in high PRDX-1 expressing tumours is
consistent with this. Previous work demonstrated that
shRNA knockdown of PRDX-II sensitised tumour cells to
radiation in vitro due to decreased glutathione reductase
activity [46]. Unlike the previous studies examining effects
of PRDX-1 depletion on IR response in ectopic tumours [12,
52], we observed only moderate sensitisation to IR by
PRDX-1 knockdown in our orthotopic irradiation model.
PRDX family members with high functional homology,
such as PRDX-II may contribute to scavenge surplus per-
oxides in the absence of PRDX-1. Moreover, other cell
types, such as macrophages are known to produce perox-
iredoxins [15]. Thus an alternative approach might have
been to knockdown PRDX-1 directly in vivo in all the cell
types expressing it. Nevertheless, our patient data extend
previous proteomic studies that demonstrated that PRDX-1
was more abundantly expressed in GBMs compared to low
grade gliomas [33], and that it predicts the recurrence and
shorter survival in stage I non-small cell lung cancer
(NSCLC) patients [21]. These findings support a role for
PRDX-1 in cancer progression, although its role in GBM
radiation response in vivo requires further investigation
since we found no association between PRDX-1 expression
and patient survival outcomes. Furthermore, analysis of
peroxiredoxin gene expression plots on REMBRANDT
database revealed no obvious correlation with glioma grade
of malignancy since both non-tumour samples as well as
various histological types expressed it. Taken together,
these findings might be due to functional redundancy in the
large PRDX-1 family of antioxidants.
Since stem/progenitor cells can survive cycling hypoxic
conditions that produce high levels of ROS (for example
the NG2 positive cells), cancer cells that share some of
their features may equally survive these hostile conditions
by upregulating ROS scavengers such as PRDX-1 [22]. We
propose therefore a model (Supplementary Figure ESM 5)
where ROS dissociates thioredoxin (PRDX-1) from ASK1,
and the latter is phosphorylated and mediates apoptosis via
downstream targets such as c-jun and P38 MAPKK [20]. In
NG2 expressing tumours capable of producing excess
PRDX-1, the latter will be readily complexed with ASK1
preventing its activation and subsequent apoptosis. Instead,
NG2 expressing cells rapidly activate DNA checkpoints,
and survive DNA damage by upregulating the survival
factors such as PRDX-1 and PI3K/Akt [10].
In conclusion, high NG2 expression is an important prog-
nostic factor for GBM patient survival independent of age at
diagnosis, clinical treatment and MGMT promoter
508 Acta Neuropathol (2011) 122:495–510
123

hypermethylation. Multiple mechanisms may be involved,
including radiation resistance, partially through mechanisms
involving the antioxidant defence systems as well as molec-
ular aberrations at the genetic level. NG2 may be an amenable
therapeutic target worth exploring for GBM patients.
Acknowledgments We are grateful to the patients that consented to
the use of their biopsy tissue for this research. This work was sup-
ported by The Norwegian Cancer Society (PK01-2008-0093), The
Meltzer Fond, The Norwegian research Council FRIFORSK, The
Bergen Medical Research Foundation, The National Genome
Research Network NGFN, Brain Tumour Net (grant 01GS08187,
SP8), The German Ministry for Education and Research BMBF. We
thank Professor Anders Molven for STR analyses, Professor WB
Stallcup and Dr L.J. Stalpers for their generosity with reagents and
constructs. We thank Dr Niclou (Norlux laboratory, CRP Sante,
Luxembourg) for providing us NCH421k cells used as positive con-
trols for CD133 expression (courtesy of Dr Herold-Mende, Dept
Neurosurgery, University of Heidelberg). We are very grateful to
Bodil B. Hansen, Tove Johannsen, Solrun Steine, Christine Eriksen,
Ingrid Strand for technical assistance and Arwed Weigel at the
Molecular Imaging Center (MIC) for assistance with confocal
microscopy. Proteomic and cell cycle flow cytometric analyses were
performed at PROBE and MIC, respectively, University of Bergen,
supported by the National Program for Research in Functional
Genomics (FUGE), funded by the Norwegian Research council. Flow
cytometric GBM stem cell phenotyping was conducted at Centre de
Recherche de Public de la Sante, Luxembourg.
Conflict of interest The authors declare no conflict of interest.
Open Access This article is distributed under the terms of the
Creative Commons Attribution Noncommercial License which per-
mits any noncommercial use, distribution, and reproduction in any
medium, provided the original author(s) and source are credited.
References
1. Bao S, Wu Q, McLendon RE et al (2006) Glioma stem cells
promote radioresistance by preferential activation of the DNA
damage response. Nature 444:756–760
2. Behm FG, Smith FO, Raimondi SC, Pui CH, Bernstein ID (1996)
Human homologue of the rat chondroitin sulfate proteoglycan,
NG2, detected by monoclonal antibody 7.1, identifies childhood
acute lymphoblastic leukemias with t(4;11)(q21;q23) or t(11;19)
(q23;p13) and MLL gene rearrangements. Blood 87:1134–1139
3. Belachew S, Chittajallu R, Aguirre AA et al (2003) Postnatal
NG2 proteoglycan-expressing progenitor cells are intrinsically
multipotent and generate functional neurons. J Cell Biol
161:169–186
4. Benassi MS, Pazzaglia L, Chiechi A et al (2009) NG2 expression
predicts the metastasis formation in soft-tissue sarcoma patients.
J Orthop Res 27:135–140
5. Brekke C, Lundervold A, Enger PO et al (2006) NG2 expression
regulates vascular morphology and function in human brain
tumours. Neuroimage 29:965–976
6. Campos B, Wan F, Farhadi M et al (2010) Differentiation therapy
exerts antitumor effects on stem-like glioma cells. Clin Cancer
Res 16:2715–2728
7. Chang HY, Nuyten DS, Sneddon JB et al (2005) Robustness,
scalability, and integration of a wound-response gene expression
signature in predicting breast cancer survival. Proc Natl Acad Sci
USA 102:3738–3743
8. Chekenya M, Enger PO, Thorsen F et al (2002) The glial pre-
cursor proteoglycan, NG2, is expressed on tumour neovasculature
by vascular pericytes in human malignant brain tumours.
Neuropathol Appl Neurobiol 28:367–380
9. Chekenya M, Hjelstuen M, Enger PO et al (2002) NG2 proteo-
glycan promotes angiogenesis-dependent tumor growth in CNS
by sequestering angiostatin. Faseb J 16:586–588
10. Chekenya M, Krakstad C, Svendsen A et al (2008) The progen-
itor cell marker NG2/MPG promotes chemoresistance by
activation of integrin-dependent PI3K/Akt signaling. Oncogene
27:5182–5194
11. Chekenya M, Rooprai HK, Davies D et al (1999) The NG2
chondroitin sulfate proteoglycan: role in malignant progression of
human brain tumours. Int J Dev Neurosci 17:421–435
12. Chen MF, Keng PC, Shau H et al (2006) Inhibition of lung tumor
growth and augmentation of radiosensitivity by decreasing per-
oxiredoxin I expression. Int J Radiat Oncol Biol Phys 64:581–591
13. Chen R, Nishimura MC, Bumbaca SM et al (2010) A hierarchy of
self-renewing tumor-initiating cell types in glioblastoma. Cancer
Cell 17:362–375
14. Chung YM, Yoo YD, Park JK, Kim YT, Kim HJ (2001)
Increased expression of peroxiredoxin II confers resistance to
cisplatin. Anticancer Res 21:1129–1133
15. Conway JP, Kinter M (2006) Dual role of peroxiredoxin I in
macrophage-derived foam cells. J Biol Chem 281:27991–28001
16. Franken NA, Rodermond HM, Stap J, Haveman J, van Bree C
(2006) Clonogenic assay of cells in vitro. Nat Protoc 1:2315–2319
17. Freier K, Joos S, Flechtenmacher C et al (2003) Tissue micro-
array analysis reveals site-specific prevalence of oncogene
amplifications in head and neck squamous cell carcinoma. Cancer
Res 63:1179–1182
18. Hegi ME, Diserens AC, Gorlia T et al (2005) MGMT gene
silencing and benefit from temozolomide in glioblastoma. N Engl
J Med 352:997–1003
19. Hockel M, Schlenger K, Mitze M, Schaffer U, Vaupel P (1996)
Hypoxia and radiation response in human tumors. Semin Radiat
Oncol 6:3–9
20. Ichijo H, Nishida E, Irie K et al (1997) Induction of apoptosis by
ASK1, a mammalian MAPKKK that activates SAPK/JNK and
p38 signaling pathways. Science 275:90–94
21. Kim JH, Bogner PN, Ramnath N et al (2007) Elevated peroxire-
doxin 1, but not NF-E2-related factor 2, is an independent
prognostic factor for disease recurrence and reduced survival in
stage I non-small cell lung cancer. Clin Cancer Res 13:3875–3882
22. Kim YJ, Ahn JY, Liang P et al (2007) Human prx1 gene is a
target of Nrf2 and is up-regulated by hypoxia/reoxygenation:
implication to tumor biology. Cancer Res 67:546–554
23. Kinnula VL, Lehtonen S, Sormunen R et al (2002) Overexpression
of peroxiredoxins I, II, III, V, and VI in malignant mesothelioma.
J Pathol 196:316–323
24. Kleihues P, Burger PC, Collins VP et al (2000) Glioblastoma. In:
Kleihues P, Cavenee WK (eds) World Health Organisation
classification of tumours. Pathology and genetics. Tumours of the
central nervous system. IARC Press, Lyon, pp 29–39
25. Li Y, Madigan MC, Lai K et al (2003) Human uveal melanoma
expresses NG2 immunoreactivity. Br J Ophthalmol 87:629–632
26. Lieberman HB (2004) Cell cycle checkpoint control protocols.
Humana Press, New York
27. Louis DN, Ohgaki H, Wiestler OD et al (2007) The 2007 WHO
classification of tumours of the central nervous system. Acta
Neuropathol 114:97–109
28. Mauvieux L, Delabesse E, Bourquelot P et al (1999) NG2
expression in MLL rearranged acute myeloid leukaemia is
restricted to monoblastic cases. Br J Haematol 107:674–676
Acta Neuropathol (2011) 122:495–510 509
123
29. McLendon RFA, Bigner D, Van Meir EG, Brat DJ, Mastrogi-
anakis GM et al (2008) Comprehensive genomic characterization
defines human glioblastoma genes and core pathways. Nature
455:1061–1068
30. Mikeska T, Bock C, El-Maarri O et al (2007) Optimization of
quantitative MGMT promoter methylation analysis using
pyrosequencing and combined bisulfite restriction analysis. J Mol
Diagn 9:368–381
31. Nishiyama A, Dahlin KJ, Prince JT, Johnstone SR, Stallcup WB
(1991) The primary structure of NG2, a novel membrane-spanning
proteoglycan. J Cell Biol 114:359–371
32. Noh DY, Ahn SJ, Lee RA et al (2001) Overexpression of perox-
iredoxin in human breast cancer. Anticancer Res 21:2085–2090
33. Odreman F, Vindigni M, Gonzales ML et al (2005) Proteomic
studies on low- and high-grade human brain astrocytomas.
J Proteome Res 4:698–708
34. Ohgaki H, Kleihues P (2005) Population-based studies on inci-
dence, survival rates, and genetic alterations in astrocytic and
oligodendroglial gliomas. J Neuropathol Exp Neurol 64:479–489
35. Park JH, Kim YS, Lee HL et al (2006) Expression of peroxire-
doxin and thioredoxin in human lung cancer and paired normal
lung. Respirology 11:269–275
36. Park SH, Chung YM, Lee YS et al (2000) Antisense of human
peroxiredoxin II enhances radiation-induced cell death. Clin
Cancer Res 6:4915–4920
37. Phillips HS, Kharbanda S, Chen R et al (2006) Molecular sub-
classes of high-grade glioma predict prognosis, delineate a pattern
of disease progression, and resemble stages in neurogenesis.
Cancer Cell 9:157–173
38. Prestegarden L, Svendsen A, Wang J et al (2010) Glioma cell
populations grouped by different cell type markers drive brain
tumor growth. Cancer Res 70:4274–4279
39. Requena JR, Fu MX, Ahmed MU et al (1996) Lipoxidation
products as biomarkers of oxidative damage to proteins during
lipid peroxidation reactions. Nephrol Dial Transplant 11(Suppl
5):48–53
40. Rhee SG, Kang SW, Chang TS, Jeong W, Kim K (2001) Per-
oxiredoxin, a novel family of peroxidases. IUBMB Life 52:35–41
41. Riley PA (1994) Free radicals in biology: oxidative stress and the
effects of ionizing radiation. Int J Radiat Biol 65:27–33
42. Roepstorff P, Fohlman J (1984) Proposal for a common nomen-
clature for sequence ions in mass spectra of peptides. Biomed
Mass Spectrom 11:601
43. Schrappe M, Klier FG, Spiro RC et al (1991) Correlation of
chondroitin sulfate proteoglycan expression on proliferating brain
capillary endothelial cells with the malignant phenotype of
astroglial cells. Cancer Res 51:4986–4993
44. Shoshan Y, Nishiyama A, Chang A et al (1999) Expression of
oligodendrocyte progenitor cell antigens by gliomas: implications
for the histogenesis of brain tumors. Proc Natl Acad Sci USA
96:10361–10366
45. Smith FO, Rauch C, Williams DE et al (1996) The human
homologue of rat NG2, a chondroitin sulfate proteoglycan, is not
expressed on the cell surface of normal hematopoietic cells but is
expressed by acute myeloid leukemia blasts from poor-prognosis
patients with abnormalities of chromosome band 11q23. Blood
87:1123–1133
46. Smith-Pearson PS, Kooshki M, Spitz DR et al (2008) Decreasing
peroxiredoxin II expression decreases glutathione, alters cell
cycle distribution, and sensitizes glioma cells to ionizing radia-
tion and H(2)O(2). Free Radic Biol Med 45(8):1178–1189
47. Snijders AM, Nowak N, Segraves R et al (2001) Assembly of
microarrays for genome-wide measurement of DNA copy num-
ber. Nat Genet 29:263–264
48. Spitz DR, Phillips JW, Adams DT et al (1993) Cellular resistance
to oxidative stress is accompanied by resistance to cisplatin: the
significance of increased catalase activity and total glutathione in
hydrogen peroxide-resistant fibroblasts. J Cell Physiol 156:72–79
49. Stupp R, Mason WP, van den Bent MJ et al (2005) Radiotherapy
plus concomitant and adjuvant temozolomide for glioblastoma.
N Engl J Med 352:987–996
50. Verhoeff JJ, Stalpers LJ, Coumou AW et al (2007) Experimental
iodine-125 seed irradiation of intracerebral brain tumors in nude
mice. Radiat Oncol 2:38
51. Wang J, Svendsen A, Kmiecik J et al (2011) Targeting the NG2/
CSPG4 proteoglycan retards tumour growth and angiogenesis in
preclinical models of GBM and melanoma. PLoS One 6(7):e23062
52. Zhang B, Wang Y, Liu K et al (2008) Adenovirus-mediated transfer
of siRNA against peroxiredoxin I enhances the radiosensitivity of
human intestinal cancer. Biochem Pharmacol 75:660–667
510 Acta Neuropathol (2011) 122:495–510
123
Copyright © 2022 FDOKUMEN