Modelling the propagation of effects of chronic exposure to ionising radiation from individuals to...
10
Modelling the propagation of effects of chronic exposure to ionising radiation from individuals to populations F. Alonzo a,b, * , T. Hertel-Aas c , M. Gilek d , R. Gilbin b , D.H. Oughton c , J. Garnier-Laplace b a Laboratory of Environmental Modelling, DEI/SECRE/LME, Institute of Radioprotection and Nuclear Safety (IRSN), Cadarache, Building 159, BP3, 13115 St-Paul-lez-Durance Cedex, France b Laboratory of Radioecology and Ecotoxicology, DEI/SECRE/LRE, Institute of Radioprotection and Nuclear Safety (IRSN), Cadarache Building 186, BP3, 13115 St-Paul-lez-Durance Cedex, France c Department of Plant and Environmental Sciences, P.O. Box 5003, Norwegian University of Life Sciences, 1432 Aas, Norway d School of Life Sciences, So ¨derto ¨rn University College, 14189 Huddinge, Sweden Received 17 July 2007; received in revised form 12 November 2007; accepted 29 November 2007 Available online 7 March 2008 Abstract This study evaluated the potential effect of ionising radiation on population growth using simple population models and parameter values derived from chronic exposure experiments in two invertebrate species with contrasting life-history strategies. In the earthworm Eisenia fetida, models predicted increasing delay in population growth with increasing gamma dose rate (up to 0.6 generation times at 11 mGy h 1 ). Population extinction was predicted at 43 mGy h 1 . In the microcrustacean Daphnia magna, models predicted increasing delay in population growth with increasing alpha dose rate (up to 0.8 generation times at 15.0 mGy h 1 ), only after two successive generations were exposed. The study exam- ined population effects of changes in different individual endpoints (including survival, number of offspring produced and time to first repro- duction). Models showed that the two species did not respond equally to equivalent levels of change, the fast growing daphnids being more susceptible to reduction in fecundity or delay in reproduction than the slow growing earthworms. This suggested that susceptibility of a popu- lation to ionising radiation cannot be considered independent of the species’ life history. Ó 2008 Elsevier Ltd. All rights reserved. Keywords: Earthworm; Daphnid; Population growth; Ionising radiation 1. Introduction Assessing the ecological risk of radioactive substances re- quires evaluation of the effects of acute and chronic exposure to ionising radiation, for a representative range of wildlife spe- cies. The FASSET Radiation Effects Database (FRED), which has been supplemented with new data during the ERICA pro- ject to form FREDERICA, provides a comprehensive overview of the available information on radiation effects (FASSET, 2003; ERICA, 2006; Beresford et al., 2007). But FREDERICA also highlights the considerable knowledge gaps regarding ef- fects of chronic irradiation for many species and endpoints (Re ´al et al., 2004). The vast majority of the data comes from effects observed on an individual level (typically: survival, growth and reproduction) followed by a sub-individual level (i.e. histological, cellular and molecular damages). The poten- tial effect of radioactive substances at the population level is poorly documented, and it is acknowledged that the relevance for risk assessment would be improved by incorporating more ecologically relevant indicators. Also in chemical risk assess- ment, conservation biologists have highlighted the need to bet- ter understand interactions between environmental exposure to contaminants and population declines (Davidson et al., 2001; Blaustein et al., 2003). The consequences of changes in * Corresponding author. Laboratory of Environmental Modelling, DEI/SE- CRE/LME, Institute of Radioprotection and Nuclear Safety (IRSN), Cadar- ache Building 159, BP3, 13115 St-Paul-lez-Durance Cedex, France. Fax: þ33 4 42 19 91 43. E-mail address: [email protected] (F. Alonzo). 0265-931X/$ - see front matter Ó 2008 Elsevier Ltd. All rights reserved. doi:10.1016/j.jenvrad.2007.11.021 Available online at www.sciencedirect.com Journal of Environmental Radioactivity 99 (2008) 1464e1473 www.elsevier.com/locate/jenvrad
Transcript of Modelling the propagation of effects of chronic exposure to ionising radiation from individuals to...

Available online at www.sciencedirect.com
Journal of Environmental Radioactivity 99 (2008) 1464e1473www.elsevier.com/locate/jenvrad
Modelling the propagation of effects of chronic exposureto ionising radiation from individuals to populations
F. Alonzo a,b,*, T. Hertel-Aas c, M. Gilek d, R. Gilbin b, D.H. Oughton c, J. Garnier-Laplace b
a Laboratory of Environmental Modelling, DEI/SECRE/LME, Institute of Radioprotection and Nuclear Safety (IRSN),Cadarache, Building 159, BP3, 13115 St-Paul-lez-Durance Cedex, France
b Laboratory of Radioecology and Ecotoxicology, DEI/SECRE/LRE, Institute of Radioprotection and Nuclear Safety (IRSN),
Cadarache Building 186, BP3, 13115 St-Paul-lez-Durance Cedex, Francec Department of Plant and Environmental Sciences, P.O. Box 5003, Norwegian University of Life Sciences, 1432 Aas, Norway
d School of Life Sciences, Sodertorn University College, 14189 Huddinge, Sweden
Received 17 July 2007; received in revised form 12 November 2007; accepted 29 November 2007
Available online 7 March 2008
Abstract
This study evaluated the potential effect of ionising radiation on population growth using simple population models and parameter valuesderived from chronic exposure experiments in two invertebrate species with contrasting life-history strategies. In the earthworm Eisenia fetida,models predicted increasing delay in population growth with increasing gamma dose rate (up to 0.6 generation times at 11 mGy h�1). Populationextinction was predicted at 43 mGy h�1. In the microcrustacean Daphnia magna, models predicted increasing delay in population growth withincreasing alpha dose rate (up to 0.8 generation times at 15.0 mGy h�1), only after two successive generations were exposed. The study exam-ined population effects of changes in different individual endpoints (including survival, number of offspring produced and time to first repro-duction). Models showed that the two species did not respond equally to equivalent levels of change, the fast growing daphnids being moresusceptible to reduction in fecundity or delay in reproduction than the slow growing earthworms. This suggested that susceptibility of a popu-lation to ionising radiation cannot be considered independent of the species’ life history.� 2008 Elsevier Ltd. All rights reserved.
Keywords: Earthworm; Daphnid; Population growth; Ionising radiation
1. Introduction
Assessing the ecological risk of radioactive substances re-quires evaluation of the effects of acute and chronic exposureto ionising radiation, for a representative range of wildlife spe-cies. The FASSET Radiation Effects Database (FRED), whichhas been supplemented with new data during the ERICA pro-ject to form FREDERICA, provides a comprehensive overviewof the available information on radiation effects (FASSET,
* Corresponding author. Laboratory of Environmental Modelling, DEI/SE-
CRE/LME, Institute of Radioprotection and Nuclear Safety (IRSN), Cadar-
ache Building 159, BP3, 13115 St-Paul-lez-Durance Cedex, France. Fax:
þ33 4 42 19 91 43.
E-mail address: [email protected] (F. Alonzo).
0265-931X/$ - see front matter � 2008 Elsevier Ltd. All rights reserved.
doi:10.1016/j.jenvrad.2007.11.021
2003; ERICA, 2006; Beresford et al., 2007). But FREDERICAalso highlights the considerable knowledge gaps regarding ef-fects of chronic irradiation for many species and endpoints(Real et al., 2004). The vast majority of the data comes fromeffects observed on an individual level (typically: survival,growth and reproduction) followed by a sub-individual level(i.e. histological, cellular and molecular damages). The poten-tial effect of radioactive substances at the population level ispoorly documented, and it is acknowledged that the relevancefor risk assessment would be improved by incorporating moreecologically relevant indicators. Also in chemical risk assess-ment, conservation biologists have highlighted the need to bet-ter understand interactions between environmental exposure tocontaminants and population declines (Davidson et al., 2001;Blaustein et al., 2003). The consequences of changes in

1465F. Alonzo et al. / Journal of Environmental Radioactivity 99 (2008) 1464e1473
individual endpoints for population dynamics need to be clari-fied, and in most cases one must resort to extrapolation from in-dividual to population level effects. This requires an inherentassumption that laboratory data can be applied to field popula-tions, and that the use of an appropriate level of individual spe-cies protection confers protection on populations, communitiesand ecosystem even though many of the species that will be po-tentially exposed have not been tested (Versteeg et al., 1999).
As a first community-level approach, it has been proposedthat the SSD (Species Sensitivity Distribution) method couldbe used to derive ‘‘no observed effect limits’’ wherein 95%of the species in the ecosystem would be protected, basedon a distribution of sensitivity in natural communities or rep-resentative selections of species (EC, 2003). This has alsobeen applied to ionising radiation (Garnier-Laplace et al.,2008). Nevertheless, the SSD approach is still based on the un-derlying assumption that toxicity at the individual level can bedirectly compared between different species and between dif-ferent endpoints, such as mortality, morbidity, growth and re-production. This assumption was recently tested for seveninvertebrate species using simple population models (Starket al., 2004). Simulations demonstrated that equal levels of ef-fect on different individual endpoints might have different im-pact on population dynamics depending on life-historystrategies of the species. Species with high intrinsic rates of in-crease were less susceptible to changes than species withlower intrinsic rates of increase. Because susceptibility of spe-cies to toxicants is complex, differences in life-history charac-teristics must be taken into account in investigation of toxicityat the population level.
Within ERICA, chronic exposure experiments with two or-ganisms were performed (Alonzo et al., 2006; Hertel-Aaset al., 2007). In addition to filling data gaps for the test species,the design of the experiments focused on the more genericobjective of demonstrating the types of methodology andmodelling that can be applied to extrapolate from individualto population effects. This methodology could be applied toa variety of organisms, within a variety of case studies inenvironmental risk assessment. The two studied invertebratespecies, Daphnia magna and Eisenia fetida, were selectedpartly because of their contrasting life-history strategies.Daphnids are short lived, parthenogenetic, freshwater Crusta-ceans; whereas, earthworms are hermaphroditic, terrestrialAnnelids that reproduce sexually. Both species are recognizedecotoxicological test organisms in chemical risk assessment(Reinecke and Reinecke, 2004; OECD, 2007a,b).
Some authors have suggested that the reproduction capacity,commonly used in standard OECD (Organisation for EconomicCo-operation and Development) tests for invertebrate species,might not be the most appropriate endpoint to test potential ef-fects of toxicants at the population level. D. magna, for example,does not necessarily respond to toxicants by reducing thenumber of offspring produced, and progeny fitness is likely toplay a major role (Hammers-Wirtz and Ratte, 2000). Similarly,it is recognized that parameters such as growth rates of offspringand time of sexual maturation are of great importance forearthworm population dynamics, and results from modelling
indicate that populations are specifically sensitive to toxicantsthat retard maturation (Klok and de Roos, 1997). A number ofscientists have therefore recommended that laboratory tests onthe toxicity of chemicals should also include chronic tests forpre-adult growth (Klok and de Roos, 1997; Spurgeon et al.,2003; Reinecke and Reinecke, 2004). With this in mind, the ex-periments were carried out to establish dose(rate)eeffect rela-tionships for a number of individual endpoints over differentlife-stage and generations; e.g. survival of adults, number ofoffspring produced, offspring growth and maturation rate andreproduction in the offspring generation(s) (Alonzo et al.,2006, in press; Hertel-Aas et al., 2007).
Using the experimental results from the E. fetida andD. magna studies, the objectives of this work were (1) to modelpopulation growth in relation to effects observed at the individ-ual level; (2) to investigate population susceptibility betweenmodels based on single generation and multiple generationexposure experiments; and (3) to compare population suscepti-bility to changes in different individual endpoints in specieswith contrasting life-history strategies.
2. Material and methods
2.1. Population models
2.1.1. Single generation
The model is based on an age-structured population, describing the age
distribution of the population at time t, where ni(t) is the number of individuals
of age class i. The simulations start at t0 with 10 neonate individuals, as
follows:
�n1ðt0Þ ¼ 10niðt0Þ ¼ 0 ci> 1
Individuals advance from one age class to the next at discrete, equidistant time
intervals D. The tested species have different lifespan and generation times,
namely several years and 12 weeks in E. fetida and several weeks and 10 d
in D. magna. Therefore, we use D¼ 1 week (wk) for earthworms and D¼ 1
day (d) for daphnids. Like in a Leslie matrix (Leslie, 1945), changes in pop-
ulations with time are determined by age-specific survival and reproduction
rates. Individuals start reproducing when they reach the adult age ia. Ulti-
mately, individuals are removed from the population when they reach the max-
imum age imax, assuming that they die of old age, i.e.: niðtÞ ¼ 0; ci > imax.
Between times t and tþ 1, the number of individuals in each age class is
calculated according to the following equations:
(niðtþ 1Þ ¼ Pi�1ni�1ðtÞ ci ˛ ½2; imax�n1ðtþ 1Þ ¼
Pimax
i¼iaRiðtÞ where RiðtÞ ¼ finiðtÞPrepro
where Pi is the probability of survival and Ri is the reproductive investment in
the age class i over one time step. Ri is calculated using the fecundity rate fiand the reproducing proportion of daphnids or the hatchability of earthworm
cocoons Prepro. Reproductive investments of all existing age classes are
summed to calculate the number of individuals of age i¼ 1.
2.1.2. Multiple generation
Multiple generation formulation is an extension of the single generation
model, developed in order to take account of changes in life-history traits ob-
served from one generation to the next in our experiments. At time t, multiple
generation models distinguish numbers of individuals ni;GðtÞ in age class i be-
tween the successive generations G. Like in the single generation formulation,
the multiple generation population model starts with 10 neonate F0 individ-
uals, as follows:

1466 F. Alonzo et al. / Journal of Environmental Radioactivity 99 (2008) 1464e1473
8<:
n1;F0ðt0Þ ¼ 10ni;F0ðt0Þ ¼ 0 ci> 1ni;Gðt0Þ ¼ 0 cGsF0
Changes in the population with time depend on life-history components which
are specific to age class i and generation G: Pi,G is the probability of survival,
fi,G is the fecundity rate and Prepro,G is the reproducing proportion of daphnids
or the hatchability of earthworm cocoons. Thus, between times t and tþ 1, the
number of individuals in each age class is calculated according to the follow-
ing equations:8<:
ni;Gðtþ 1Þ ¼ Pi�1;Gni�1;GðtÞ ci ˛ ½2; imax�n1;Gþ1ðtþ 1Þ ¼
Pimax
i¼iaRi;GðtÞ where Ri;GðtÞ ¼ fi;Gni;GðtÞPrepro;G
Reproductive investments of all age classes in generation G are summed to
create the new age class 1 of the offspring generation Gþ 1.
2.1.3. Population sizeThe population models simulate the total number of individuals at time t:
ntotðtÞ ¼P
iniðtÞ (single generation) or ntotðtÞ ¼
PG
Pi
ni;GðtÞ (multiple gener-
ation). Both models assume a closed system with no immigration or emigra-
tion and no density-dependence, i.e. however, abundant individuals may
become during simulations, population size does not affect life-history
parameters.
2.2. Life table data
Life-history parameters (Tables 1 and 2) were taken from previously per-
formed experiments with gamma-irradiated earthworms (Hertel-Aas et al.,
2007) and alpha-irradiated daphnids (Alonzo et al., 2006, in press). Briefly,
E. fetida was continuously exposed to external 60Co gamma irradiation during
Table 1
Life table data for gamma-irradiated E. fetida generated from experiments (Hertel
F0
Age i (wk) fi % HatchabilityP
Ri
Control
21e24 4.7� 0.6 98� 2 4.6� 0.6
25e28 5.3� 0.6 98� 2 9.8� 0.8
29e33 4.1� 0.5 98� 3 13.8� 1.0
0.19 mGy h�1
21e24 4.5� 0.4 94� 6 4.2� 0.5
25e28 5.1� 0.5 94� 6 9.0� 0.8
29e33 4.1� 0.5 91� 3 12.7� 0.9
1.8 mGy h�1
21e24 5.0� 0.2 95� 2 4.8� 0.2
25e28 5.3� 0.5 98� 2 10.0� 0.5
29e33 4.4� 0.5 96� 4 14.3� 0.7
4.2 mGy h�1
21e24 4.1� 0.3 94� 7 3.9� 0.4
25e28 4.5� 0.3 93� 3 8.1� 0.5
29e33 3.6� 0.4 92� 10 11.4� 0.7
11 mGy h�1
21e24 4.1� 0.5 89� 10 3.6� 0.6
25e28 4.4� 0.7 90� 6 7.6� 0.9
29e33 2.8� 0.9 24� 9 8.2� 1.0
43 mGy h�1
21e24 4.1� n.d. 60� n.d. 2.5� n.d.
25e28 4.0� n.d. 0� n.d. 2.5� n.d.
29e33 2.9� n.d. 0� n.d. 2.5� n.d.
Values are mean� S.D.
two generations (F0 and F1). The experiment was started with 20-wk-old
adult worms, and reproduction capacity (i.e. number of cocoons produced,
hatchability and number of F1 hatchlings) in controls and at five absorbed
dose rates (0.18, 1.7, 4, 11 and 43 mGy h�1) was measured over a 13-wk ex-
posure period. Survival and sexual maturation of F1 hatchlings were exam-
ined for 11 wk. This was followed by 13-wk exposure of F1 adults for
registration of reproduction capacity. D. magna was exposed for three gener-
ations (F0, F1 and F2) to waterborne 241Am over a range of concentrations,
resulting in bioaccumulation and internal alpha dose rates of 0.30, 1.53 and
15.0 mGy h�1. Survival and reproduction were measured for 24 d in each
generation, for a total of 70 d. All experiments were performed under optimal
laboratory conditions for the tested species. For the single generation models,
data from F0 generations were used as constant life-history parameters over
generations. For the multiple generation models, simulations were based on
data from F0, then F1 for every subsequent generation in earthworms, and
from F0, F1, then F2 for every subsequent generation in daphnids.
During experiments with earthworms, mortality remained very low (<3%
over the whole period) in control and in irradiated earthworms, with no differ-
ence in relation to dose rate. Therefore, an ordinary exponential mortality rate
of 0.6% wk�1 was introduced for every exposure conditions, to simulate
a background juvenile survival of 95% (Watanabe and Tsukamoto, 1976;
Kammenga et al., 2003). The probability of survival in age class i in genera-
tion G was therefore given by:
Pi;G ¼ e�0:006; cicG
This yielded a survival of w68% after 60 wk, when population simulations
were ended. Observed fecundity and hatchability rates were assumed to vary
with exposure duration (and increasing absorbed dose) rather than worm
age, in agreement with an invariant age-specific reproduction observed in E.fetida by Venter and Reinecke (1988). Under this assumption, F0 parameters
observed in age classes from 21 to 33 wk in the experiment were applied to
age classes from 12 to 24 wk in the models. A gradual onset of reproduction,
-Aas et al., 2007)
F1
Age i (wk) fi % HatchabilityP
Ri
Control
12e16 11.1� 1.5 98� 4 10.9� 1.5
17e20 10.9� 1.4 97� 4 21.5� 2.1
21e24 6.7� 1.0 96� 3 28.0� 2.3
0.18 mGy h�1
12e16 10.6� 2.2 99� 3 10.5� 2.2
17e20 10.2� 2.7 97� 4 20.4� 3.4
21e24 6.3� 1.8 97� 4 26.5� 3.8
1.7 mGy h�1
12e16 11.5� 2.3 97� 3 11.2� 2.2
17e20 11.0� 2.6 97� 2 21.8� 3.4
21e24 6.5� 1.5 94� 3 28.0� 3.7
4.0 mGy h�1
12e16 12.6� 2.2 96� 4 12.1� 2.1
17e20 12.0� 1.9 98� 2 24.0� 2.8
21e24 7.2� 1.2 95� 5 30.8� 3.1
11 mGy h�1
12e16 7.5� 1.6 45� 13 3.4� 1.2
17e20 7.4� 1.7 56� 13 7.5� 1.8
21e24 4.4� 0.9 69� 9 10.6� 2.0
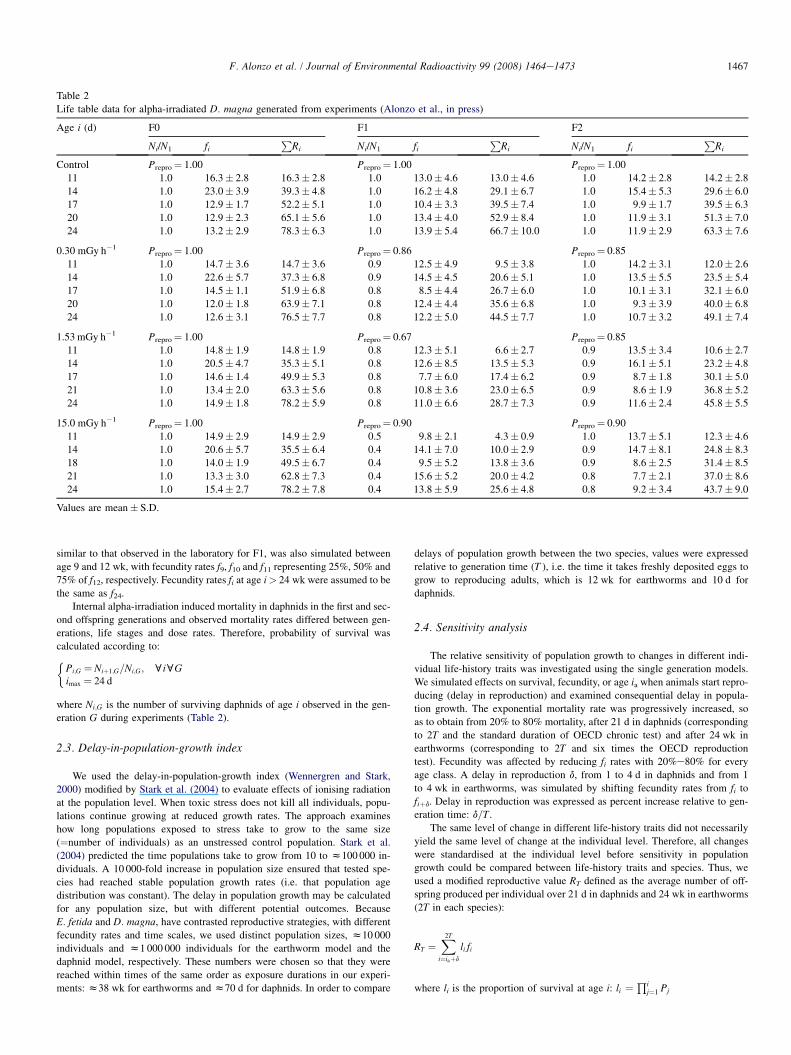
Table 2
Life table data for alpha-irradiated D. magna generated from experiments (Alonzo et al., in press)
Age i (d) F0 F1 F2
Ni/N1 fiP
Ri Ni/N1 fiP
Ri Ni/N1 fiP
Ri
Control Prepro¼ 1.00 Prepro¼ 1.00 Prepro¼ 1.00
11 1.0 16.3� 2.8 16.3� 2.8 1.0 13.0� 4.6 13.0� 4.6 1.0 14.2� 2.8 14.2� 2.8
14 1.0 23.0� 3.9 39.3� 4.8 1.0 16.2� 4.8 29.1� 6.7 1.0 15.4� 5.3 29.6� 6.0
17 1.0 12.9� 1.7 52.2� 5.1 1.0 10.4� 3.3 39.5� 7.4 1.0 9.9� 1.7 39.5� 6.3
20 1.0 12.9� 2.3 65.1� 5.6 1.0 13.4� 4.0 52.9� 8.4 1.0 11.9� 3.1 51.3� 7.0
24 1.0 13.2� 2.9 78.3� 6.3 1.0 13.9� 5.4 66.7� 10.0 1.0 11.9� 2.9 63.3� 7.6
0.30 mGy h�1 Prepro¼ 1.00 Prepro¼ 0.86 Prepro¼ 0.85
11 1.0 14.7� 3.6 14.7� 3.6 0.9 12.5� 4.9 9.5� 3.8 1.0 14.2� 3.1 12.0� 2.6
14 1.0 22.6� 5.7 37.3� 6.8 0.9 14.5� 4.5 20.6� 5.1 1.0 13.5� 5.5 23.5� 5.4
17 1.0 14.5� 1.1 51.9� 6.8 0.8 8.5� 4.4 26.7� 6.0 1.0 10.1� 3.1 32.1� 6.0
20 1.0 12.0� 1.8 63.9� 7.1 0.8 12.4� 4.4 35.6� 6.8 1.0 9.3� 3.9 40.0� 6.8
24 1.0 12.6� 3.1 76.5� 7.7 0.8 12.2� 5.0 44.5� 7.7 1.0 10.7� 3.2 49.1� 7.4
1.53 mGy h�1 Prepro¼ 1.00 Prepro¼ 0.67 Prepro¼ 0.85
11 1.0 14.8� 1.9 14.8� 1.9 0.8 12.3� 5.1 6.6� 2.7 0.9 13.5� 3.4 10.6� 2.7
14 1.0 20.5� 4.7 35.3� 5.1 0.8 12.6� 8.5 13.5� 5.3 0.9 16.1� 5.1 23.2� 4.8
17 1.0 14.6� 1.4 49.9� 5.3 0.8 7.7� 6.0 17.4� 6.2 0.9 8.7� 1.8 30.1� 5.0
21 1.0 13.4� 2.0 63.3� 5.6 0.8 10.8� 3.6 23.0� 6.5 0.9 8.6� 1.9 36.8� 5.2
24 1.0 14.9� 1.8 78.2� 5.9 0.8 11.0� 6.6 28.7� 7.3 0.9 11.6� 2.4 45.8� 5.5
15.0 mGy h�1 Prepro¼ 1.00 Prepro¼ 0.90 Prepro¼ 0.90
11 1.0 14.9� 2.9 14.9� 2.9 0.5 9.8� 2.1 4.3� 0.9 1.0 13.7� 5.1 12.3� 4.6
14 1.0 20.6� 5.7 35.5� 6.4 0.4 14.1� 7.0 10.0� 2.9 0.9 14.7� 8.1 24.8� 8.3
18 1.0 14.0� 1.9 49.5� 6.7 0.4 9.5� 5.2 13.8� 3.6 0.9 8.6� 2.5 31.4� 8.5
21 1.0 13.3� 3.0 62.8� 7.3 0.4 15.6� 5.2 20.0� 4.2 0.8 7.7� 2.1 37.0� 8.6
24 1.0 15.4� 2.7 78.2� 7.8 0.4 13.8� 5.9 25.6� 4.8 0.8 9.2� 3.4 43.7� 9.0
Values are mean� S.D.
1467F. Alonzo et al. / Journal of Environmental Radioactivity 99 (2008) 1464e1473
similar to that observed in the laboratory for F1, was also simulated between
age 9 and 12 wk, with fecundity rates f9, f10 and f11 representing 25%, 50% and
75% of f12, respectively. Fecundity rates fi at age i> 24 wk were assumed to be
the same as f24.
Internal alpha-irradiation induced mortality in daphnids in the first and sec-
ond offspring generations and observed mortality rates differed between gen-
erations, life stages and dose rates. Therefore, probability of survival was
calculated according to:�Pi;G ¼ Niþ1;G=Ni;G; cicGimax ¼ 24 d
where Ni;G is the number of surviving daphnids of age i observed in the gen-
eration G during experiments (Table 2).
2.3. Delay-in-population-growth index
We used the delay-in-population-growth index (Wennergren and Stark,
2000) modified by Stark et al. (2004) to evaluate effects of ionising radiation
at the population level. When toxic stress does not kill all individuals, popu-
lations continue growing at reduced growth rates. The approach examines
how long populations exposed to stress take to grow to the same size
(¼number of individuals) as an unstressed control population. Stark et al.
(2004) predicted the time populations take to grow from 10 to z100 000 in-
dividuals. A 10 000-fold increase in population size ensured that tested spe-
cies had reached stable population growth rates (i.e. that population age
distribution was constant). The delay in population growth may be calculated
for any population size, but with different potential outcomes. Because
E. fetida and D. magna, have contrasted reproductive strategies, with different
fecundity rates and time scales, we used distinct population sizes, z10 000
individuals and z1 000 000 individuals for the earthworm model and the
daphnid model, respectively. These numbers were chosen so that they were
reached within times of the same order as exposure durations in our experi-
ments: z38 wk for earthworms and z70 d for daphnids. In order to compare
delays of population growth between the two species, values were expressed
relative to generation time (T ), i.e. the time it takes freshly deposited eggs to
grow to reproducing adults, which is 12 wk for earthworms and 10 d for
daphnids.
2.4. Sensitivity analysis
The relative sensitivity of population growth to changes in different indi-
vidual life-history traits was investigated using the single generation models.
We simulated effects on survival, fecundity, or age ia when animals start repro-
ducing (delay in reproduction) and examined consequential delay in popula-
tion growth. The exponential mortality rate was progressively increased, so
as to obtain from 20% to 80% mortality, after 21 d in daphnids (corresponding
to 2T and the standard duration of OECD chronic test) and after 24 wk in
earthworms (corresponding to 2T and six times the OECD reproduction
test). Fecundity was affected by reducing fi rates with 20%e80% for every
age class. A delay in reproduction d, from 1 to 4 d in daphnids and from 1
to 4 wk in earthworms, was simulated by shifting fecundity rates from fi to
fiþd. Delay in reproduction was expressed as percent increase relative to gen-
eration time: d=T.
The same level of change in different life-history traits did not necessarily
yield the same level of change at the individual level. Therefore, all changes
were standardised at the individual level before sensitivity in population
growth could be compared between life-history traits and species. Thus, we
used a modified reproductive value RT defined as the average number of off-
spring produced per individual over 21 d in daphnids and 24 wk in earthworms
(2T in each species):
RT ¼X2T
i¼iaþd
li fi
where li is the proportion of survival at age i: li ¼Qi
j¼1 Pj
0
2000
4000
6000
8000
10000
20 30 40 50 60
0
2000
4000
6000
8000
10000
20 30 40 50 60
Time (wk)
Nu
mb
er o
f earth
wo
rm
s
Single generation
Multiple generation
Control0.19 mGy h-1
1.8 mGy h-1
4.2 mGy h-1
11 mGy h-1
43 mGy h-1
Control0.19 mGy h-1
1.8 mGy h-1
4.2 mGy h-1
11 mGy h-1
43 mGy h-1
0
200000
400000
600000
800000
1000000
20 30 40 50 60Time (d)
Nu
mb
er o
f d
ap
hn
id
s
Multiple generation
0
200000
400000
600000
800000
1000000
20 30 40 50 60
Single generation
Control
0.30 mGy h-1
1.53 mGy h-1
15.0 mGy h-1
Control
0.30 mGy h-1
1.53 mGy h-1
15.0 mGy h-1
A B
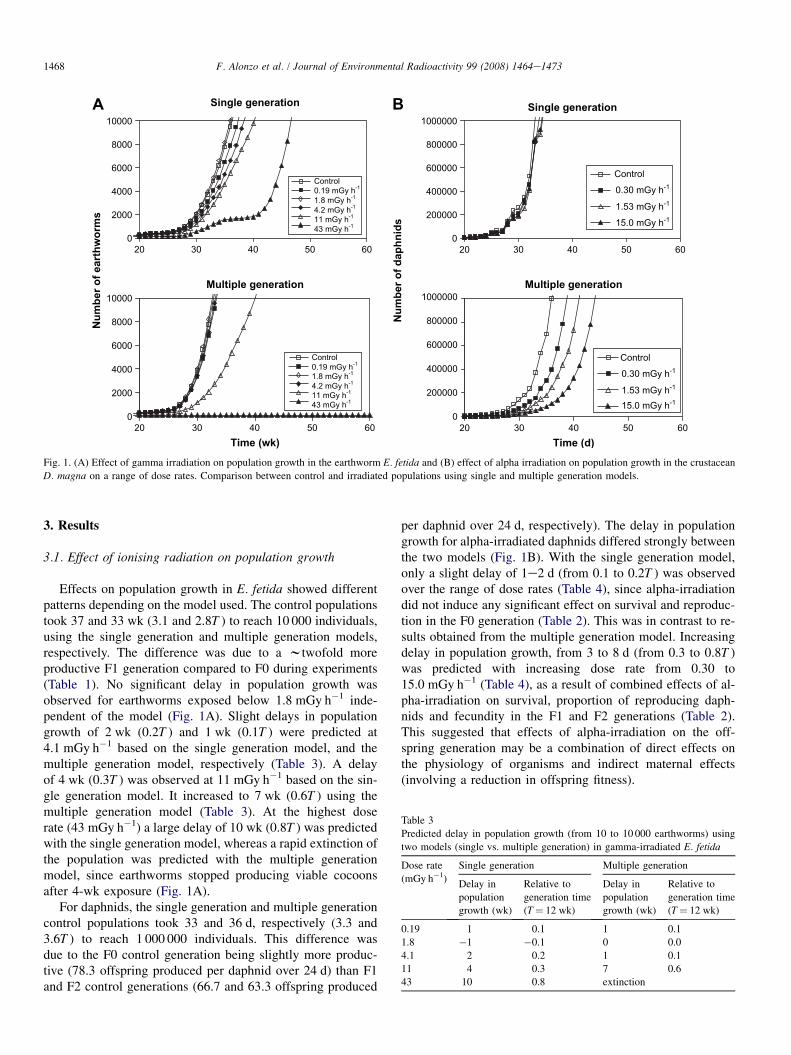
Fig. 1. (A) Effect of gamma irradiation on population growth in the earthworm E. fetida and (B) effect of alpha irradiation on population growth in the crustacean
D. magna on a range of dose rates. Comparison between control and irradiated populations using single and multiple generation models.
1468 F. Alonzo et al. / Journal of Environmental Radioactivity 99 (2008) 1464e1473
3. Results
3.1. Effect of ionising radiation on population growth
Table 3
Predicted delay in population growth (from 10 to 10 000 earthworms) using
two models (single vs. multiple generation) in gamma-irradiated E. fetida
Dose rate
(mGy h�1)
Single generation Multiple generation
Delay in
population
growth (wk)
Relative to
generation time
(T¼ 12 wk)
Delay in
population
growth (wk)
Relative to
generation time
(T¼ 12 wk)
0.19 1 0.1 1 0.1
1.8 �1 �0.1 0 0.0
4.1 2 0.2 1 0.1
11 4 0.3 7 0.6
43 10 0.8 extinction
Effects on population growth in E. fetida showed differentpatterns depending on the model used. The control populationstook 37 and 33 wk (3.1 and 2.8T ) to reach 10 000 individuals,using the single generation and multiple generation models,respectively. The difference was due to a wtwofold moreproductive F1 generation compared to F0 during experiments(Table 1). No significant delay in population growth wasobserved for earthworms exposed below 1.8 mGy h�1 inde-pendent of the model (Fig. 1A). Slight delays in populationgrowth of 2 wk (0.2T ) and 1 wk (0.1T ) were predicted at4.1 mGy h�1 based on the single generation model, and themultiple generation model, respectively (Table 3). A delayof 4 wk (0.3T ) was observed at 11 mGy h�1 based on the sin-gle generation model. It increased to 7 wk (0.6T ) using themultiple generation model (Table 3). At the highest doserate (43 mGy h�1) a large delay of 10 wk (0.8T ) was predictedwith the single generation model, whereas a rapid extinction ofthe population was predicted with the multiple generationmodel, since earthworms stopped producing viable cocoonsafter 4-wk exposure (Fig. 1A).
For daphnids, the single generation and multiple generationcontrol populations took 33 and 36 d, respectively (3.3 and3.6T ) to reach 1 000 000 individuals. This difference wasdue to the F0 control generation being slightly more produc-tive (78.3 offspring produced per daphnid over 24 d) than F1and F2 control generations (66.7 and 63.3 offspring produced
per daphnid over 24 d, respectively). The delay in populationgrowth for alpha-irradiated daphnids differed strongly betweenthe two models (Fig. 1B). With the single generation model,only a slight delay of 1e2 d (from 0.1 to 0.2T ) was observedover the range of dose rates (Table 4), since alpha-irradiationdid not induce any significant effect on survival and reproduc-tion in the F0 generation (Table 2). This was in contrast to re-sults obtained from the multiple generation model. Increasingdelay in population growth, from 3 to 8 d (from 0.3 to 0.8T )was predicted with increasing dose rate from 0.30 to15.0 mGy h�1 (Table 4), as a result of combined effects of al-pha-irradiation on survival, proportion of reproducing daph-nids and fecundity in the F1 and F2 generations (Table 2).This suggested that effects of alpha-irradiation on the off-spring generation may be a combination of direct effects onthe physiology of organisms and indirect maternal effects(involving a reduction in offspring fitness).
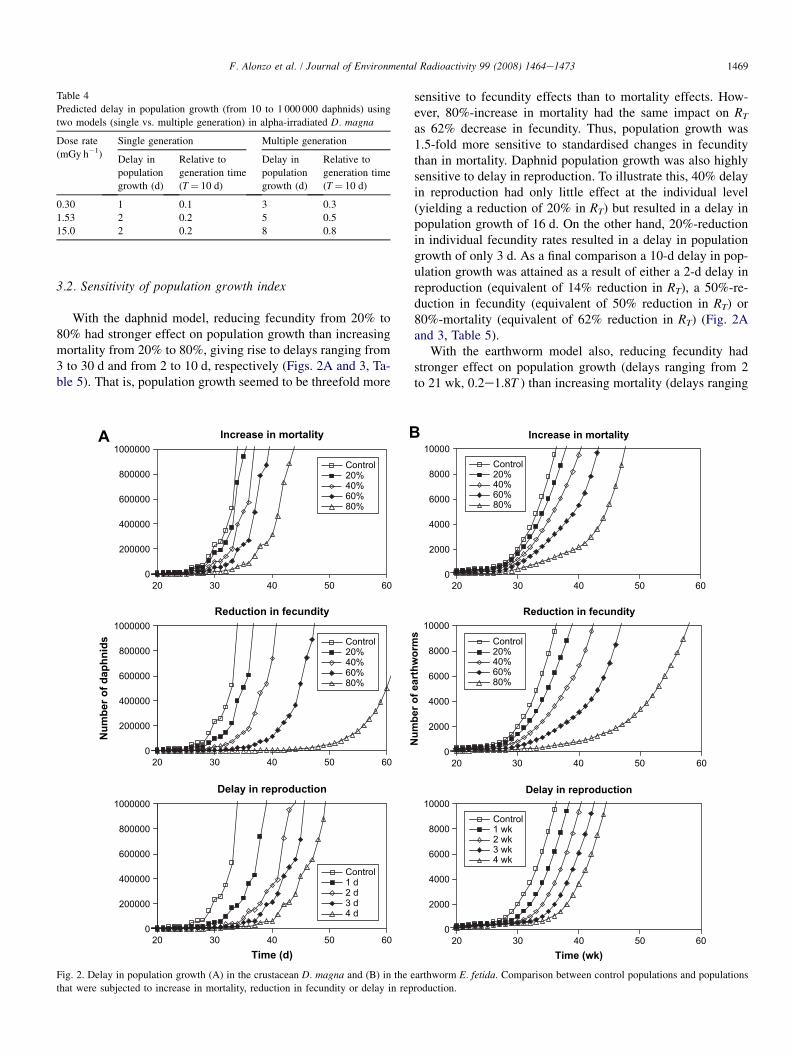
Table 4
Predicted delay in population growth (from 10 to 1 000 000 daphnids) using
two models (single vs. multiple generation) in alpha-irradiated D. magna
Dose rate
(mGy h�1)
Single generation Multiple generation
Delay in
population
growth (d)
Relative to
generation time
(T¼ 10 d)
Delay in
population
growth (d)
Relative to
generation time
(T¼ 10 d)
0.30 1 0.1 3 0.3
1.53 2 0.2 5 0.5
15.0 2 0.2 8 0.8
1469F. Alonzo et al. / Journal of Environmental Radioactivity 99 (2008) 1464e1473
3.2. Sensitivity of population growth index
With the daphnid model, reducing fecundity from 20% to80% had stronger effect on population growth than increasingmortality from 20% to 80%, giving rise to delays ranging from3 to 30 d and from 2 to 10 d, respectively (Figs. 2A and 3, Ta-ble 5). That is, population growth seemed to be threefold more
0
200000
400000
600000
800000
1000000
20 30 40 50 60
0
200000
400000
600000
800000
1000000
20 30 40 50 60
0
200000
400000
600000
800000
1000000
20 30 40 50 60
Time (d)
Nu
mb
er o
f d
ap
hn
id
s
Increase in mortality
Reduction in fecundity
Delay in reproduction
Control20%40%60%80%
Control20%40%60%80%
Control1 d2 d3 d4 d
A B
Fig. 2. Delay in population growth (A) in the crustacean D. magna and (B) in the e
that were subjected to increase in mortality, reduction in fecundity or delay in rep
sensitive to fecundity effects than to mortality effects. How-ever, 80%-increase in mortality had the same impact on RT
as 62% decrease in fecundity. Thus, population growth was1.5-fold more sensitive to standardised changes in fecunditythan in mortality. Daphnid population growth was also highlysensitive to delay in reproduction. To illustrate this, 40% delayin reproduction had only little effect at the individual level(yielding a reduction of 20% in RT) but resulted in a delay inpopulation growth of 16 d. On the other hand, 20%-reductionin individual fecundity rates resulted in a delay in populationgrowth of only 3 d. As a final comparison a 10-d delay in pop-ulation growth was attained as a result of either a 2-d delay inreproduction (equivalent of 14% reduction in RT), a 50%-re-duction in fecundity (equivalent of 50% reduction in RT) or80%-mortality (equivalent of 62% reduction in RT) (Fig. 2Aand 3, Table 5).
With the earthworm model also, reducing fecundity hadstronger effect on population growth (delays ranging from 2to 21 wk, 0.2e1.8T ) than increasing mortality (delays ranging
0
2000
4000
6000
8000
10000
20 30 40 50 60
0
2000
4000
6000
8000
10000
20 30 40 50 60
0
2000
4000
6000
8000
10000
20 30 40 50 60Time (wk)
Nu
mb
er o
f earth
wo
rm
s
Increase in mortality
Reduction in fecundity
Delay in reproduction
Control20%40%60%80%
Control1 wk2 wk3 wk4 wk
Control20%40%60%80%
arthworm E. fetida. Comparison between control populations and populations
roduction.

0.0
1.0
2.0
3.0
0% 20% 40% 60% 80%
0.0
1.0
2.0
3.0
0% 20% 40% 60% 80%
0.0
1.0
2.0
3.0
0% 20% 40% 60% 80%
0.0
1.0
2.0
3.0
0% 20% 40% 60% 80%
Effect at endpoint level
Pred
icted
d
elay in
p
op
ulatio
n g
ro
wth
(relative to
g
en
eratio
n tim
e)
Effect on individual RT
D. magna
E. fetida
D. magna
E. fetida
Increase in mortality Reduction in fecundity Delay in reproduction
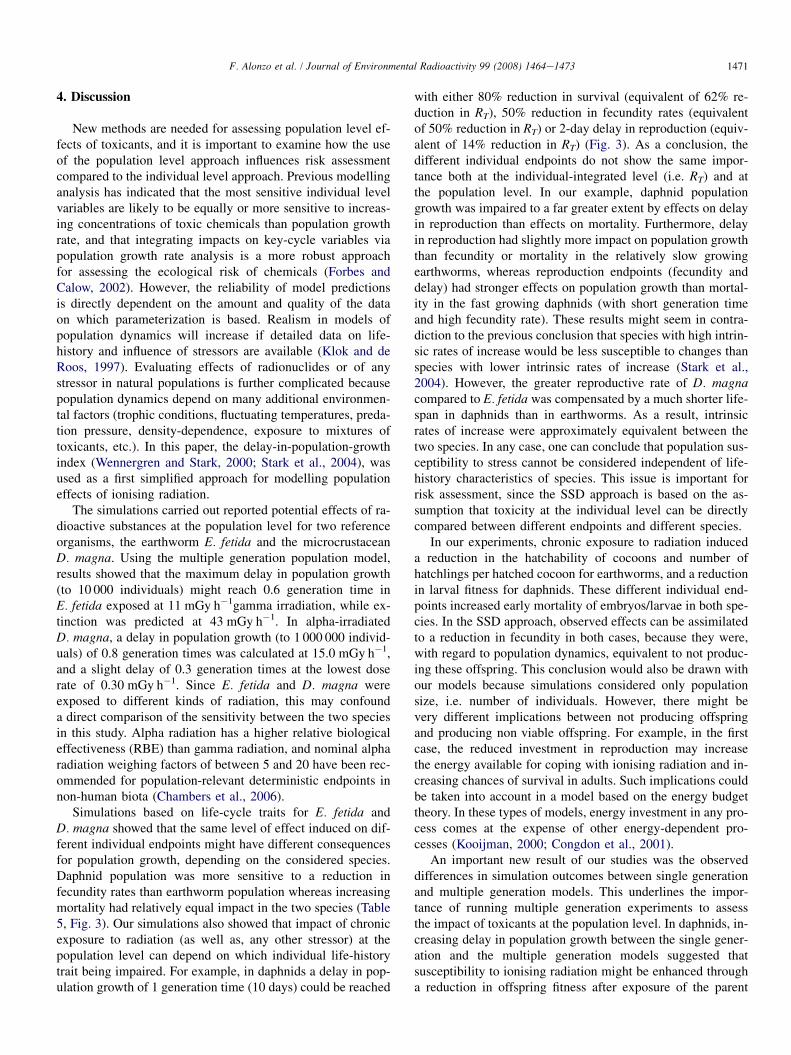
Fig. 3. Sensitivity of the delay in population growth of the crustacean D. magna and the earthworm E. fetida in response to increase in mortality, reduction in
fecundity or delay in reproduction, expressed as % effects at endpoint level and as % effects on individual RT.
1470 F. Alonzo et al. / Journal of Environmental Radioactivity 99 (2008) 1464e1473
from 1 to 11 wk, 0.1e0.9T ) (Fig. 2B, Table 5). However, thedifference between these individual endpoints was not signif-icant anymore once standardised with RT (Fig. 3). Populationgrowth was a bit more sensitive to delay in reproduction thanto other endpoints: 33% delay in reproduction yielded a reduc-tion of 25% in RT and a delay in population growth of 8 wk,while 40% reduction in fecundity rates resulted in a delay inpopulation growth of 6 wk (Fig. 3, Table 5).
Table 5
Sensitivity of model predictions: delay in population growth of D. magna (from 10 t
in mortality, fecundity and delay in reproduction, expressed as % effect at endpoi
D. magna E. fetid
Effect at
endpoint level
Effect on
individual
RT (%)
Delay in
population
growth (d)
Relative to
generation
time (T¼ 10 d)
Effect a
endpoin
Mortality Mortali
20% 13 2 0.2 20%
40% 27 3 0.3 40%
60% 43 6 0.6 60%
80% 62 10 1.0 80%
Reduction in fecundity Reduct
20% 20 3 0.3 20%
40% 40 7 0.7 40%
60% 60 14 1.4 60%
80% 80 30 3.0 80%
Delay in reproduction Delay i
1 de10% 0 5 0.5 1wke
2 de20% 14 10 1.0 2 wk
3 de30% 20 12 1.2 3 wk
4 de40% 20 16 1.6 4 wk
In conclusion, sensitivity of population growth to changes inindividual endpoints differed between the two species. Sensitiv-ity ranged according to the following order: delay in reproduction>> fecundity>mortality in daphnids and delay in reproduc-tion> fecundity¼mortality in earthworms. Daphnid popula-tion growth showed higher sensitivity to delay in reproductionand reduction in fecundity than earthworm population growth,but the two species showed equivalent sensitivity to mortality.
o 1 000 000 daphnids) and E. fetida (from 10 to 10 000 earthworms) to changes
nt level and as % effect on individual RT
a
t
t level
Effect on
individual
RT (%)
Delay in population
growth (wk)
Relative to generation
time (T¼ 12 wk)
ty
14 1 0.1
29 4 0.3
46 7 0.6
66 11 0.9
ion in fecundity
20 2 0.2
40 6 0.5
60 10 0.8
80 21 1.8
n reproduction
8% 6 2 0.2
e17% 13 4 0.3
e25% 19 6 0.5
e33% 25 8 0.7
1471F. Alonzo et al. / Journal of Environmental Radioactivity 99 (2008) 1464e1473
4. Discussion
New methods are needed for assessing population level ef-fects of toxicants, and it is important to examine how the useof the population level approach influences risk assessmentcompared to the individual level approach. Previous modellinganalysis has indicated that the most sensitive individual levelvariables are likely to be equally or more sensitive to increas-ing concentrations of toxic chemicals than population growthrate, and that integrating impacts on key-cycle variables viapopulation growth rate analysis is a more robust approachfor assessing the ecological risk of chemicals (Forbes andCalow, 2002). However, the reliability of model predictionsis directly dependent on the amount and quality of the dataon which parameterization is based. Realism in models ofpopulation dynamics will increase if detailed data on life-history and influence of stressors are available (Klok and deRoos, 1997). Evaluating effects of radionuclides or of anystressor in natural populations is further complicated becausepopulation dynamics depend on many additional environmen-tal factors (trophic conditions, fluctuating temperatures, preda-tion pressure, density-dependence, exposure to mixtures oftoxicants, etc.). In this paper, the delay-in-population-growthindex (Wennergren and Stark, 2000; Stark et al., 2004), wasused as a first simplified approach for modelling populationeffects of ionising radiation.
The simulations carried out reported potential effects of ra-dioactive substances at the population level for two referenceorganisms, the earthworm E. fetida and the microcrustaceanD. magna. Using the multiple generation population model,results showed that the maximum delay in population growth(to 10 000 individuals) might reach 0.6 generation time inE. fetida exposed at 11 mGy h�1gamma irradiation, while ex-tinction was predicted at 43 mGy h�1. In alpha-irradiatedD. magna, a delay in population growth (to 1 000 000 individ-uals) of 0.8 generation times was calculated at 15.0 mGy h�1,and a slight delay of 0.3 generation times at the lowest doserate of 0.30 mGy h�1. Since E. fetida and D. magna wereexposed to different kinds of radiation, this may confounda direct comparison of the sensitivity between the two speciesin this study. Alpha radiation has a higher relative biologicaleffectiveness (RBE) than gamma radiation, and nominal alpharadiation weighing factors of between 5 and 20 have been rec-ommended for population-relevant deterministic endpoints innon-human biota (Chambers et al., 2006).
Simulations based on life-cycle traits for E. fetida andD. magna showed that the same level of effect induced on dif-ferent individual endpoints might have different consequencesfor population growth, depending on the considered species.Daphnid population was more sensitive to a reduction infecundity rates than earthworm population whereas increasingmortality had relatively equal impact in the two species (Table5, Fig. 3). Our simulations also showed that impact of chronicexposure to radiation (as well as, any other stressor) at thepopulation level can depend on which individual life-historytrait being impaired. For example, in daphnids a delay in pop-ulation growth of 1 generation time (10 days) could be reached
with either 80% reduction in survival (equivalent of 62% re-duction in RT), 50% reduction in fecundity rates (equivalentof 50% reduction in RT) or 2-day delay in reproduction (equiv-alent of 14% reduction in RT) (Fig. 3). As a conclusion, thedifferent individual endpoints do not show the same impor-tance both at the individual-integrated level (i.e. RT) and atthe population level. In our example, daphnid populationgrowth was impaired to a far greater extent by effects on delayin reproduction than effects on mortality. Furthermore, delayin reproduction had slightly more impact on population growththan fecundity or mortality in the relatively slow growingearthworms, whereas reproduction endpoints (fecundity anddelay) had stronger effects on population growth than mortal-ity in the fast growing daphnids (with short generation timeand high fecundity rate). These results might seem in contra-diction to the previous conclusion that species with high intrin-sic rates of increase would be less susceptible to changes thanspecies with lower intrinsic rates of increase (Stark et al.,2004). However, the greater reproductive rate of D. magnacompared to E. fetida was compensated by a much shorter life-span in daphnids than in earthworms. As a result, intrinsicrates of increase were approximately equivalent between thetwo species. In any case, one can conclude that population sus-ceptibility to stress cannot be considered independent of life-history characteristics of species. This issue is important forrisk assessment, since the SSD approach is based on the as-sumption that toxicity at the individual level can be directlycompared between different endpoints and different species.
In our experiments, chronic exposure to radiation induceda reduction in the hatchability of cocoons and number ofhatchlings per hatched cocoon for earthworms, and a reductionin larval fitness for daphnids. These different individual end-points increased early mortality of embryos/larvae in both spe-cies. In the SSD approach, observed effects can be assimilatedto a reduction in fecundity in both cases, because they were,with regard to population dynamics, equivalent to not produc-ing these offspring. This conclusion would also be drawn withour models because simulations considered only populationsize, i.e. number of individuals. However, there might bevery different implications between not producing offspringand producing non viable offspring. For example, in the firstcase, the reduced investment in reproduction may increasethe energy available for coping with ionising radiation and in-creasing chances of survival in adults. Such implications couldbe taken into account in a model based on the energy budgettheory. In these types of models, energy investment in any pro-cess comes at the expense of other energy-dependent pro-cesses (Kooijman, 2000; Congdon et al., 2001).
An important new result of our studies was the observeddifferences in simulation outcomes between single generationand multiple generation models. This underlines the impor-tance of running multiple generation experiments to assessthe impact of toxicants at the population level. In daphnids, in-creasing delay in population growth between the single gener-ation and the multiple generation models suggested thatsusceptibility to ionising radiation might be enhanced througha reduction in offspring fitness after exposure of the parent
1472 F. Alonzo et al. / Journal of Environmental Radioactivity 99 (2008) 1464e1473
generation. Although the experimental data for E. fetida couldsuggest a possible acclimation and/or adaptation in the F1 gen-eration as discussed by Hertel-Aas et al. (2007), the multiplegeneration model predicted larger delays than the single gen-eration model. Due to the longer generation time and life spanof the earthworms it was not possible to perform a study thatspanned from newly hatched F0 neonates to adult F1 wormsduring the available time. We therefore had to make a numberof assumptions for the parameterization in the earthwormmodels, which make the outcome of the modelling more un-certain than for the daphnid. It follows that designing experi-ments with relevant time scales becomes particularlyimportant in chronic conditions because exposure of popula-tions to radiation might exceed the organism’s lifespan andinvolve several successive generations.
One of the disadvantages of both the delay-in-population-growth index method and SSDs is that interactions betweenspecies are not taken into account (Duboudin et al., 2004;Forbes and Calow, 2002; Pennington, 2003). Also, our modelswere based on the assumption that populations were growing inspatially unlimited habitat and under optimal conditions oftrophic resources. Thus, growth was not assumed to be densitydependent. In natural habitats, population growth rates aredriven by a number of environmental factors, such as foodavailability. Alonzo et al. (2006) reported that exposure to a ra-dionuclide led to reduced resistance of daphnid larvae to starva-tion. Increased sensitivity to food depletion in contaminatedenvironment might have critical consequences for populationstability, and data achieved under optimal laboratory conditionsmight lead to conservative estimations of impacts. It is impor-tant to keep in mind that such factors will influence the recov-ery times of populations in the field, and that the recovery timesgenerated for E. fetida and D. magna in this study serve only asa comparison among species under contrived conditions.
5. Conclusions
Structured population models can provide a way of translat-ing the effects on individual endpoints to population level con-sequences, and aid in comparing effects of stressors betweendifferent species. Although this kind of modelling approachesbrings more realistic endpoints into the risk assessment pro-cess, the question still remains whether the observed delayin population growth is a serious effect. The length and depthto which population density might be reduced and still allowpopulation survival cannot be answered from the perspectiveof one species alone. Furthermore, model predictions neednow to be tested using independent sets of empirical datathat match the hypothetical conditions of the model.
Recommendations for taking individual-to-population ex-trapolation issue into account in a refined effect analysiswithin Ecological Risk Assessment should include the follow-ing stages:
(1) Since the propagation of effects from individuals to popu-lation depends greatly on the life-cycle characteristics, the
first stage is to collect data describing life-history traits ofthe species under investigation.
(2) The second stage is to implement theoretical populationdynamics models to rank the sensitivity of the populationgrowth rate to individual endpoints. Modelling should berun under a well-defined scenario, so that ranking of indi-vidual endpoints depends only on the characteristics ofspecies.
(3) The third stage is to search in the literature or to imple-ment adequate effects testing in case of knowledge gapsto obtain doseeeffect relationships for individual end-points which have strong consequences at the populationlevel.
Acknowledgements
This work is part of the EC’s ERICA program (Environ-mental Risk from Ionising Contaminants: Assessment andManagement, contract FI6R-CT-2003-508847). The supportof EC is gratefully acknowledged. This research receivedadditional funding by IRSN, as part of the ENVIRHOM pro-gram, and by EDF ‘‘GGP Environment’’.
References
Alonzo, F., Gilbin, R., Bourrachot, S., Floriani, M., Morello, M., Garnier-
Laplace, J., 2006. Effects of chronic internal alpha irradiation on physiol-
ogy, growth and reproductive success of Daphnia magna. Aquat. Toxicol.
80, 228e236.
Alonzo, F., Gilbin, R., Zeman, F., Garnier-Laplace, J. Increased effects of al-
pha radiation stress in Daphnia magna after chronic exposure over three
successive generations. Aquat. Toxicol., in press. doi:10.1016/j.aquatox.
2008.01.015.
Beresford, N.A., Brown, J., Copplestone, D., Garnier-Laplace, J., Howard, B.,
Larsson, C.M., Oughton, D., Prohl, G., Zinger, I. (Eds.), 2007. An INTE-
GRATED APPROACH to the assessment and management of environmen-
tal risks from ionising radiation. Description of purpose, methodology and
application. EC project contract no. FI6R-CT-2004-508847. Available
from: www.erica-project.org
Blaustein, A.R., Romansic, J.M., Kiesecker, J.M., Hatch, A.C., 2003. Ultravi-
olet radiation, toxic chemicals and amphibian population declines. Diver-
sity Distributions 9, 123e140.
Chambers, D.B., Garva, A.L., Osborne, R.V., 2006. Choosing an alpha radia-
tion weighting factor for doses to non-human biota. J. Environ. Radioact.
87, 1e14.
Congdon, J.D., Dunham, A.E., Hopkins, W.A., Rowe, C.L., Hinton, T.G.,
2001. Resource allocation-based life histories: a conceptual basis for stud-
ies of ecological toxicology. Environ. Toxicol. Chem. 20, 1698e1703.
Davidson, C., Shaffer, H.B., Jennings, M.R., 2001. Declines of the California
red-legged frog: climate, UV-B, habitat, and pesticides hypotheses. Ecol.
Appl. 11, 464e479.
Duboudin, C., Ciffroy, P., Magaud, H., 2004. Effects of data manipulation and
statistical methods on species sensitivity distributions. Environ. Toxicol.
Chem. 23, 489e499.
EC, 2003. Technical guidance document in support of Commission Directive
93/67/EEC on risk assessment for new notified substances and Commis-
sion Regulation (EC) No 1488/94 on risk assessment for existing sub-
stances, Directive 98/8/EC of the European Parliament and of the
Council concerning the placing of biocidal products on the market. Part
II. Luxembourg, Office for Official Publication of the European Commu-
nities. Report nr EUR 20418 EN/2.

1473F. Alonzo et al. / Journal of Environmental Radioactivity 99 (2008) 1464e1473
ERICA, 2006. Derivation of predicted no effect dose rate values for ecosys-
tems (and their sub-organisaonal levels) exposed to radioactive substances.
Deliverable D5. In: Garnier-Laplace, J., Gilbin, R. (Eds.), 6th Framework,
Contract N�FI6R-CT-2003-508847. European Commission.
FASSET, 2003. Radiation effects on plants and animals. Deliverable 4. In:
Woodhead, D., Zinger, I. (Eds.), FASSET Project Contract FIGE-CT-
2000-00102.
Forbes, V.E., Calow, P., 2002. Extrapolation in ecological risk assessment:
balancing pragmatism and precaution in chemical controls legislation.
BioScience 52, 249e257.
Garnier-Laplace, J., Copplestone, D., Gilbin, R., Ciffroy, P., Gilek, M., Aguero, A.,
Bjork, M., Oughton, D., Jaworska, A., Larsson, C.M., Hingston, J., 2008.
Issues and practices in the use of effects data from FREDERICA in the
ERICA Integrated Approach. J. Environ. Radioact 99, 1474e1483.
Hammers-Wirtz, M., Ratte, H.T., 2000. Offspring fitness in Daphnia: is the
Daphnia reproduction test appropriate for extrapolating effects on the
population level? Environ. Toxicol. Chem. 19, 1856e1866.
Hertel-Aas, T., Oughton, D.H., Jaworska, A., Bjerke, H., Salbu, B.,
Brunborg, G., 2007. Effects of chronic gamma irradiation on reproduction
in the earthworm Eisenia fetida (Oligochaeta). Radiat. Res. 168, 515e526.
Kammenga, J.E., Spurgeon, D.J., Svendsen, C., Weeks, J.M., 2003. Explaining
density-dependent regulation in earthworm populations using life-history
analysis. Oikos 100, 89e95.
Klok, C., de Roos, A.M., 1997. Impact of toxicants on earthworm populations:
a modeling approach. In: Sheppard, S.C., Bembridge, J.D., Holmstrup, M., Post-
huma, L. (Eds.), Advances in Earthworm Ecotoxicology, Proceedings from the
Second International Workshop on Earthworm Ecotoxicologie, pp. 295e309.
Kooijman, S.A.L.M., 2000. Dynamic Energy and Mass Budgets in Biological
Systems, second ed. Cambridge University Press, Cambridge.
Leslie, P.H., 1945. On the use of matrices in certain population mathematics.
Biometrika 33, 183e212.
OECD, 2007a. Test no. 211: Daphnia magna reproduction test. OECD
Guideline for the Testing of Chemicals 2, 1e21.
OECD, 2007b. Test no. 222: earthworm reproduction test (Eisenia fetida/
Eisenia andrei). OECD Guideline for the Testing of Chemicals 1, 1e18.
Pennington, D.W., 2003. Extrapolating ecotoxicological measures from small
data sets. Ecotoxicol. Environ. Saf. 56, 238e250.
Real, A., Sundell-Bergman, S., Knowles, J.F., Woodhead, D.S., Zinger, I.,
2004. Effects of ionising radiation exposure on plants, fish and mammals:
relevant data for environmental radiation protection. J. Radiol. Prot. 24,
123e137.
Reinecke, A.J., Reinecke, S.A., 2004. Earthworms as test organisms in ecotox-
icological assessment of toxicant impacts on ecosystems. In:
Edwards, C.A. (Ed.), Earthworm Ecology, second ed. CRC Press, Boca
Raton (US), pp. 299e319.
Spurgeon, D.J., Weeks, J.M., Van Gestel, C.A.M., 2003. A summary of eleven
years progress in earthworm ecotoxicology. Pedobiologia 47, 588e606.
Stark, J.D., Banks, J.E., Vargas, R., 2004. How risky is risk assessment: the
role that life history strategies play in susceptibility of species to stress.
Proc. Natl. Acad. Sci. U.S.A. 101, 732e736.
Venter, J.M., Reinecke, A.J., 1988. The life-cycle of the compost worm
Eisenia fetida (Oligochaeta). S. Afr. J. Zool. 23, 161e165.
Versteeg, D., Belanger, S., Carr, G., 1999. Understanding single-species and
model ecosystem sensitivity: data-based comparison. Environ. Toxicol.
Chem. 18, 1329e1346.
Watanabe, H., Tsukamoto, J., 1976. Seasonal changes in size, class and age
structure of the lumbricid Eisenia foetida population in a field compost
and its practical application as the decomposer of organic waste matter.
Rev. D’Ecol. Biol. Sol. 13, 141e146.
Wennergren, U., Stark, J., 2000. Modeling long-term effects of pesticides
on populations: beyond just counting dead animals. Ecol. Appl. 10,
295e302.