Abnormal adhesion and cell-cell interactions in sickle cell disease
Upload
independentCategory
view
0download
0
of March 23, 2014.This information is current as Melanoma Cell Lines
Leukemia/Lymphoma, Carcinoma, and Healthy Donors and inAminopeptidases in EBV-B Cell Lines from Expression of Endoplasmic Reticulum
and Patrizio GiacominiSibilio, Oliver Carroll, Akira Hattori, Peter M. van EndertVeronica Cunsolo, Ezio Giorda, Rocco Fraioli, Leonardo Doriana Fruci, Silvia Ferracuti, Maria Zaira Limongi,
http://www.jimmunol.org/content/176/8/48692006; 176:4869-4879; ;J Immunol
Referenceshttp://www.jimmunol.org/content/176/8/4869.full#ref-list-1
, 12 of which you can access for free at: cites 34 articlesThis article
Subscriptionshttp://jimmunol.org/subscriptions
is online at: The Journal of ImmunologyInformation about subscribing to
Permissionshttp://www.aai.org/ji/copyright.htmlSubmit copyright permission requests at:
Email Alertshttp://jimmunol.org/cgi/alerts/etocReceive free email-alerts when new articles cite this article. Sign up at:
Print ISSN: 0022-1767 Online ISSN: 1550-6606. Immunologists All rights reserved.Copyright © 2006 by The American Association of9650 Rockville Pike, Bethesda, MD 20814-3994.The American Association of Immunologists, Inc.,
is published twice each month byThe Journal of Immunology
by guest on March 23, 2014
http://ww
w.jim
munol.org/
Dow
nloaded from
by guest on March 23, 2014
http://ww
w.jim
munol.org/
Dow
nloaded from

Expression of Endoplasmic Reticulum Aminopeptidases inEBV-B Cell Lines from Healthy Donors and inLeukemia/Lymphoma, Carcinoma, and Melanoma Cell Lines1
Doriana Fruci,2* Silvia Ferracuti,* Maria Zaira Limongi,3* Veronica Cunsolo,3* Ezio Giorda,4†
Rocco Fraioli,† Leonardo Sibilio,† Oliver Carroll,§ Akira Hattori,¶ Peter M. van Endert,§ andPatrizio Giacomini†‡
Peptide trimming in the endoplasmic reticulum (ER), the final step required for the generation of most HLA class I-bindingpeptides, implicates the concerted action of two aminopeptidases, ERAP1 and ERAP2. Because defects in the expression of thesepeptidases could lead to aberrant surface HLA class I expression in tumor cells, we quantitatively assayed 14 EBV-B cell lines and35 human tumor cell lines of various lineages for: 1) expression and enzymatic activities of ERAP1 and ERAP2; 2) ER peptide-trimming activity in microsomes; 3) expression of HLA class I H chains and TAP1; and 4) surface HLA class I expression. ERAP1and ERAP2 expression was detectable in all of the EBV-B and tumor cell lines, but in the latter it was extremely variable,sometimes barely detectable, and not coordinated. The expression of the two aminopeptidases corresponded well to the respectiveenzymatic activities in most cell lines. A peptide-trimming assay in microsomes revealed additional enzymatic activities, presum-ably contributed by other unidentified aminopeptidases sharing substrate specificity with ERAP2. Interestingly, surface HLA classI expression showed significant correlation with ERAP1 activity, but not with the activity of either ERAP2 or other unidentifiedaminopeptidases. Transfection with ERAP1 or ERAP2 of two tumor cell lines selected for simultaneous low expression of the twoaminopeptidases resulted in the expected, moderate increases of class I surface expression. Thus, low and/or imbalanced expres-sion of ERAP1 and probably ERAP2 may cause improper Ag processing and favor tumor escape from the immunesurveillance. The Journal of Immunology, 2006, 176: 4869–4879.
A minopeptidases trim N-terminal amino acid residues ofprecursor polypeptides, playing important roles in vari-ous biological processes such as the maturation, degra-
dation, modulation, and activation of proteins (1).This N-terminal peptide trimming has been found to play a very
important role also in MHC class I Ag processing (2). It custom-izes precursor peptides to fit them to the binding groove of MHCclass I molecules. Precursor peptides produced from self- and non-self-proteins in the cytosol through the ubiquitin-proteasome deg-radation pathway are translocated into the endoplasmic reticulum(ER)5 by the TAP heterodimer, trimmed to an optimal size, i.e.,
8–10 residues, and then loaded onto HLA class I molecules. Al-though cytosolic aminopeptidases have been implicated in trim-ming (3–5), ER aminopeptidases are involved in the final and cru-cial step of the generation of MHC class I-binding peptides. Onlyoptimally trimmed peptides with a defined binding motif are pref-erentially loaded onto MHC class I H chain/�2-microglobulin(�2m) dimers and then transported to the cell surface for recogni-tion by CTLs. Thus, peptide trimming by ER aminopeptidases is acrucial link between Ag processing and peptide loading/Agpresentation.
Microsomes have been shown to contain peptide-trimming ac-tivity involved in the generation of MHC class I-binding peptidesfrom larger precursors (6, 7). This trimming activity is thought tobe mediated by a group of aminopeptidases. So far, two of themhave been defined with respect to primary structure and substratespecificity. One was named endoplasmic reticulum aminopepti-dase associated with Ag processing (ERAAP) in the mouse (8) andendoplasmic reticulum aminopeptidase 1 (ERAP1) in the rat andhuman (9). The latter denomination will be adopted throughoutthis study. ERAP1 corresponds to an aminopeptidase previouslyfound in normal tissues of both human and murine origin, desig-nated adipocyte-derived leucine aminopeptidase (A-LAP) (10),puromycin-insensitive leucyl-specific aminopeptidase (11), oraminopeptidase regulator of TNFR1 shedding 1 (12). Another ami-nopeptidase has been identified in humans and called leukocyte-derived arginine aminopeptidase (L-RAP) (13). This peptidase hashigh structural homology with ERAP1. Like ERAP1, it is detectedin the ER lumen, enhanced by IFN-�, and can trim precursors of
*Research Center Ospedale Bambino Gesu, Rome, Italy; †Laboratory of Immunologyand ‡Melanoma Disease Management Team, Regina Elena Institute, Centro dellaRicerca Sperinentale, Rome, Italy; §Institut National de la Sante et Recherche Medi-cale, Unite 580, Necker Institute, Paris, France; and ¶Laboratory of Cellular Bio-chemistry, RIKEN, Institute of Physical and Chemical Research, Wako, Japan
Received for publication September 29, 2005. Accepted for publication January13, 2006.
The costs of publication of this article were defrayed in part by the payment of pagecharges. This article must therefore be hereby marked advertisement in accordancewith 18 U.S.C. Section 1734 solely to indicate this fact.1 This work was supported by the Associazione Italiana per la Ricerca sul Cancro (toD.F. and P.G.) and the Italian Ministry of Health (to P.G.). M.Z.L. was supported byfellowship from the Associazione Italiana per la Ricerca sul Cancro.2 Address correspondence and reprint requests to Dr. Doriana Fruci, Research CenterOspedale Bambino Gesu, Piazza Sant’Onofrio 4, 00165 Rome, Italy. E-mail address:[email protected] M.Z.L. and V.C. contributed equally to this work.4 Current address: Research Center Ospedale Bambino Gesu, Piazza Sant’Onofrio 4,00165 Rome, Italy.5 Abbreviations used in this paper: ER, endoplasmic reticulum; �2m, �2-microglobu-lin; ERAP, ER aminopeptidase; ERAAP, ER aminopeptidase associated with Agprocessing; A-LAP, adipocyte-derived leucine aminopeptidase; L-RAP, leukocyte-
derived arginine peptidase; AMC, aminoacyl-aminomethylcoumarin; pK, protein ki-nase; FI, fluorescence intensity; MFI, mean FI.
The Journal of Immunology
Copyright © 2006 by The American Association of Immunologists, Inc. 0022-1767/06/$02.00
by guest on March 23, 2014
http://ww
w.jim
munol.org/
Dow
nloaded from

MHC class I ligands in vitro. Because of these similarities, thisaminopeptidase is also called ERAP2 (14). These two peptidasesdisplay distinct specificities when tested with aminoacyl-aminom-ethylcoumarin (aminoacyl-AMC) substrates: ERAP1 preferen-tially hydrolyzes Leu-AMC, while ERAP2 displays a preferencefor Arg-AMC and Lys-AMC. Recent detailed analysis indicatesthat these aminopeptidases have distinct specificities, particularlyon certain polypeptides, and act in concert, in vivo, to removesome longer extensions from the precursor peptides (14). Previ-ously, TLC was used to detect peptide trimming of TAP-translo-cated peptides in the ER and in the cytosol (15). A similar assaywas used by us to quantify N-terminal trimming activity that con-verts a radioiodinated peptide substrate R-SLYNTVATL (abbre-viated R-S9L or R10L) to SLYNTVATL (S9L) in the microsomevescicles (6). Recently, we found that this R-S9L-trimming assaydetects several aminopeptidases in an EBV-B cell line that includeERAP2 and yet unidentified ER aminopeptidases and, further-more, that ERAP2 is the main trimming enzyme among theseaminopeptidases (14).
Suppression of ERAP1 expression by small interfering RNAwas originally shown to partially reduce the surface MHC class Iexpression in mouse and human systems (16). We have subse-quently confirmed this effect and demonstrated that partial sup-pression of surface HLA class I expression can also be obtained bysuppression of ERAP2 expression by RNA interference (14).These data indicated a key role of ERAP1 and ERAP2 (possibly incombination with other ER aminopeptidases) in regulating the sur-face expression of HLA class I molecules.
Tumor cells can evade immune recognition by host CTLs bydown-regulating MHC class I expression (17). Such down-regu-lated abnormal MHC class I expression has been found to be as-sociated with defects in the genes encoding HLA-A, -B, and -C Hchains, �2m, TAP, and other components of the Ag-processing andpresentation machinery. It is conceivable that abnormal MHC classI expression may result from defects in the expression of ER amin-opeptidases, including ERAP1 and also ERAP2, leading to im-paired peptide trimming in the ER.
In this study, in an attempt to place ER peptide trimming withinthe framework of our current understanding of Ag processing andpresentation, we have expanded our studies on ER aminopepti-dases to a large panel of EBV-transformed B cell lines fromhealthy blood donors and tumor cell lines derived from lymphoidand nonlymphoid cell lineages and characterized them for: 1) ex-pression of ER aminopeptidases that include ERAP1, ERAP2, andas yet unidentified ER aminopeptidases and 2) expression of HLAclass I H chains and TAP1. We have analyzed the correlationbetween surface HLA class I molecules and expression of the com-ponents involved in assembly of HLA class I Ags to explore therole of ER aminopeptidases in tumor cells. Finally, we have re-constituted the expression of ERAP1 and ERAP2 in two tumor celllines selected because of their low expression of both aminopep-tidases and analyzed their surface expression of HLA class Imolecules.
Materials and MethodsCell lines
The cell lines tested were composed of 15 EBV-B lymphoblastoid celllines (EBV-B cell lines) from healthy donors; 5 leukemia-lymphoma celllines, DAUDI (Burkitt’s lymphoma), K562 (erythroid leukemia), MOLT4(T lymphoblastoid), U937, (myelomonocytic leukemia), and WI-L2 (Blymphoblastoid); 15 carcinoma cell lines from breast (BT20, MCF7, andSK-BR3), colon (HT-29, LoVo, and LS174T), lung (A549 and Calu1),chorion (JAR and JEG-3), epidermoid, prostate, cervix, kidney and bladder(A431, H494, HeLa, KJ29, and T24, respectively); and 17 melanoma celllines (501, 1102, 1182, 1290-2, 1704, Colo38, FO-1, HO-1, IR8, M10,
M14, MEL249, MRN-1, SK-MEL37, SK-MEL93, SP6.5, and STP-1). Inaddition, 721.221 and 721.220 cell lines which lack the expression ofHLA-A, -B, and -C molecules and tapasin, respectively, and T2 that lacksTAP were tested. T1, the parental cell line used to generate T2, was alsoincluded in this study. Cells were grown in RPMI 1640 supplemented with10% FCS.
DNA constructs and transfection
Full-length cDNAs encoding human ERAP1 (accession numberAF106037) and ERAP2 (accession number AB109031) (13) were EcoRIand BamHI-XhoI cloned into the pCI-neo (Promega) (18) and pcDNA3-Hygro (Invitrogen Life Technologies) vectors, respectively. BT20 andHeLa cell lines were transfected with these cDNAs or the correspondingempty vectors using LipofectAMINE 2000 according to the manufacturer’sinstructions (Invitrogen Life Technologies). BT20 stable transfectants wereselected with either 150 �g/ml G418 (Invitrogen Life Technologies) or 40�g/ml hygromycin B (Sigma-Aldrich). HeLa transient transfectants weretested 48 h after transfection.
RT-PCR and sequencing
Total RNA was isolated with TRIzol (Invitrogen Life Technologies) fromthe CNC cell line according to the manufacturer’s instructions and wasretrotranscribed by random priming (Roche). The following primers wereused to RT-PCR amplify an �3000-bp region that includes the entireERAP2 gene, forward (Fw) 1: 5�-ATCTAAGCTTATGTTAAAAACATTCAACATGC-3�; reverse (Rv) 1, 5�-CCCTTCAAAGCCATCACCTA-3�; Fw2, 5�-CCACCCTTCAGTCAGAGGAA-3�, Rv2, 5�-TCATCAAATTGCAGCTCTGG-3�; Fw3, 5�-TGGCTTAATGAGGGTTTTGC-3�, Rv3,5�-GCTGCTTGTTTCATGTTGGA-3�; Fw4, 5�-GTCATGGATGGGACCAACTC-3�, Rv4 5�TGAAGGAGAGCTGCCAAGTT-3�; and Fw5, 5�-TTTGTCAACGAGCAAGCATC-3�, Rv5, 5�TTAAGTATTAACCATTAGC-3�). The fragments were sequenced in a CEQ2000 automatedsequencer (Beckman Coulter).
Antibodies
Rabbit polyclonal Ab and mouse mAb were used for detection or isolationof ERAP1 or ERAP2 (14, 18). Rabbit polyclonal Ab A-LAP was raisedagainst recombinant A-LAP/ERAP1 (18). Mouse mAb 4D2 was raisedagainst recombinant human ERAP1 and recognizes native, but not dena-tured ERAP1 (14). Mouse mAb 3F5 was raised against recombinantERAP2 and recognizes both native and denatured ERAP2 (14). MousemAbs HCA-2 and HC10 were used for detection of HLA class I H chains.HCA-2 recognizes �2m-free HLA-A (excluding -A24), -B7301, and -G Hchains (19, 20), and HC10 recognizes �2m-free HLA-B (excluding-B2702, -B5804, and -B73) H chains and a limited set of HLA-A H chainssuch as HLA-A3, -A10, -A28, -A29, -A30, -A31, -A32, and -A33 (19, 20).The mouse mAb W6/32, which recognizes �2m-associated HLA-A, -B, -C,-E, and -G H chains (21, 22), was used to quantify cell surface expressionof HLA class I Ags by flow cytometry. In addition, rabbit polyclonal Absspecific to TAP1 and ERp57 were used (23).
Western blot analysis
The procedures used have been described previously (23). In brief, cellswere washed and lysed with 500 �l of a buffered saline (50 mM Tris (pH7.5) and 150 mM NaCl) containing 1% Nonidet P-40 in the presence of amixture of protease inhibitors (Sigma-Aldrich). Lysates clarified by high-speed centrifugation were assayed for protein concentration by the BCAassay kit (Pierce). Equal amounts of cell lysate (100 �g/lane) were sub-jected to SDS-PAGE on an 8% slab gel. After electrophoresis, the sepa-rated components were electroblotted onto a nitrocellulose membrane at 25V overnight using 10 mM 3-(cyclohexylamino)-1 propanesulfonic acid(Sigma-Aldrich) buffer containing 10% methanol. Blots were incubatedwith purified polyclonal rabbit Abs or mouse mAbs, and then with a per-oxidase-coupled secondary Ab and developed using an ECL detection kit(Amersham). Films were analyzed with the Scion Image Analysis soft-ware, and the intensity of each band was recorded and expressed as thefraction (percent) of the highest value obtained for each test component.Even sample loading was checked by staining with Ponceau S and with ananti-ERp57 polyclonal Ab (23).
ERAP1 and ERAP2 activity assay
ERAP1 and ERAP2 were isolated from cell lysates by using specific im-munoabsorbents and assayed for cleavage activity against aminoacyl-AMCs. Briefly, cells were lysed at 4°C in 500 �l of a 1% Triton X-100buffer (50 mM Tris (pH 7.5) and 150 mM NaCl). After high-speed cen-trifugation, clarified lysates containing 500 �g of proteins were incubated
4870 EXPRESSION OF ER AMINOPEPTIDASES IN TUMOR CELLS
by guest on March 23, 2014
http://ww
w.jim
munol.org/
Dow
nloaded from

overnight at 4°C with protein G-Sepharose beads coated with preimmuneserum and then for 2 h at 4°C with protein G-Sepharose beads precoatedwith 10 �g of mAb 4D2 for ERAP1 or mAb 3F5 for ERAP2. ERAP1- orERAP2-bound Sepharose beads were washed three times and suspended in100 �l of a Tris-HCl buffer (50 mM Tris (pH 7.5) and 1 mM DTT) con-taining 40 �M Leu-AMC for ERAP1 and 40 �M Arg-AMC for ERAP2.After 1 h at 37°C, the reaction was terminated by addition of 1% SDS andthe fluorescence intensity was measured by an LS50B fluorometer(PerkinElmer) with excitation at 380 nm and emission at 440 nm. Theassays were run under Ab excess conditions that were determined by thepreliminary experiments. A Lys-AMC substrate preferentially cleaved byERAP2 was also used in some cases, as indicated. To determine the purityof the proteins bound to Ab-coated beads, these beads were suspended in100 �l of gel-loading SDS buffer and subjected to Western blot analysis asdescribed above.
TLC assay of ER aminopeptidase activity
This assay was used to measure peptide-trimming activity of isolated mi-crosomes as described previously (6). Microsomes were isolated from 109
cells by sucrose gradient centrifugation, adjusted to equal protein concen-trations, snap-frozen, and stored at �80°C. The preparations were usableup to 60 days without loss in peptide-trimming activity. Microsomes (50�l) were treated with 0.4 mg/ml proteinase K (pK) for 30 min at 4°C,followed by washing and incubation with 2 mM PMSF for 30 min at 4°Cand then lysed in PBS with 1% CHAPS (Sigma-Aldrich). Microsomes thustreated were incubated for 3 min with 125I-radiolabeled peptide RSLYNTVATL (R-S9L) (132 nM; sp. act., 60 cpm/fmol) at 37°C. The reactionwas terminated by the addition of an equal volume of phenol. Untreatedmicrosomes and pK-treated microsomes were included in the assay as con-trols. Four microliters of the organic phase was subjected to TLC on silicagel 60 plates (Merck) using a mixture of N-butanol/pyridine/acetic acid/water (97:75:15:60) as described elsewhere (15). Spot radioactivities werequantified using the ImageQuant 5.0 software (Molecular Dynamics).
HLA class I assay by flow cytometry
Cell surface expression of HLA class I molecules was determined by in-direct immunofluorescence staining. Cells (0.5 � 106) were washed withPBS and then stained with an excess of HLA class I-specific mAb W6/32for 40 min on ice and then incubated with a FITC-conjugated goat anti-mouse IgG (BD Biosciences). FACS analysis was done on a FACSCaliburflow cytometer (BD Biosciences).
Statistical analysis
All raw assay data were normalized as the fraction (percent) of the highestvalues obtained for each assay. Normalized values were analyzed for cor-relation by the regression analysis using StatView software (SAS Institute).
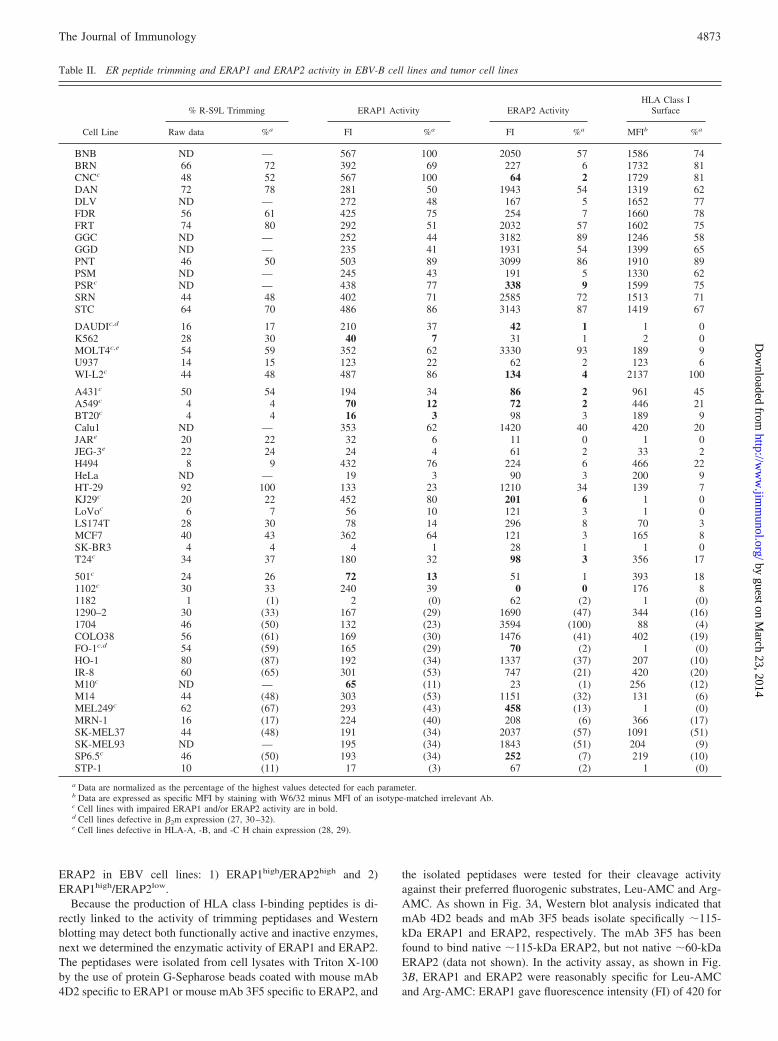
ResultsTo explore the role of ER aminopeptidases in HLA class I Agexpression, a large panel of human cell lines that include EBV-Bcell lines established from healthy blood donors and tumor celllines derived from various organs and tissues, were assayed forexpression of ERAP1 and ERAP2, HLA class I:H chains, andTAP1 by Western blot analysis. Western blot patterns of EBV-Bcell lines and control cell lines are shown in Fig. 1A and those ofmelanoma cell lines and other lymphoid and nonlymphoid celllines in Fig. 1, B and C. The densitometry data are given alongwith the normalized values, i.e., the percentage of the highest valueobtained in each assay component, in Table I. These cell lines werealso assayed for surface HLA class I expression, ER peptide-trim-ming activity, and ERAP1 and ERAP2 peptidase activity. Thesedata are given, along with the normalized values, in Table II.
Expression of ERAP1 and ERAP2 in EBV-B cell lines
Fifteen EBV-B cell lines established from healthy blood donorswere assayed for expression of ER aminopeptidases, ERAP1 andERAP2. These two peptidases have been shown to be implicatedin the generation of optimal HLA class I-binding peptides (8, 14,16). In parallel, expression of HLA class I H chains and TAP1 wasalso determined.
The expression of ERAP1 and ERAP2 was first measured at theprotein level by Western blotting using rabbit Ab A-LAP specific
to ERAP1 (18) and mouse mAb 3F5 specific to ERAP2 (14). Lym-phoid cell lines T1, T2, 721.220, and 721.221 that carry well-defined defects of specific components of the HLA class I Agpresentation pathway were included as controls for Abs used in thedetection of HLA class I H chains and TAP1. T2 is devoid of TAP,721.221 of HLA-A, -B, and -C H chains and 721.220 of tapasin(24–26).
As seen in Fig. 1A, ERAP1 migrated as a single band of theexpected molecular size, �115 kDa, and was seen in all of the
FIGURE 1. Immunoblot analysis of EBV-B and tumor cell lines. A–C,Equal amounts of non-ionic detergent cell lysates (100 �g/lane) fromEBV-B cell lines, control mutant cells, and tumor cell lines were resolvedon an 8% SDS-PAGE and probed by incubation with the indicated purifiedrabbit antiserum specific for ERAP1 (A-LAP), TAP1, and ERp57, andmAbs specific for ERAP2 (3F5) and HLA class I H chains (HC10 andHCA-2). A cross-reaction of HCA-2 with HLA-G is noted. A representa-tive experiment is shown of four performed.
4871The Journal of Immunology
by guest on March 23, 2014
http://ww
w.jim
munol.org/
Dow
nloaded from

tested cell lines, including the control cell lines. No additionalbands were detected. ERAP2 was also detected in all of the testedcell lines but, unlike ERAP1, it gave two distinct bands of �115and �60 kDa. Although the band of �115 kDa corresponds tofull-length ERAP2, the band of �60 kDa likely corresponds toL-RAPs, a truncated form of L-RAP/ERAP2 previously observedin the human T cell line Jurkat (13). Because L-RAP is known tohave no peptidase activity (13), only the �115-kDa band was con-sidered in quantifications of active ERAP2 by Western blot. NoEBV-B cell lines that completely lack ERAP1 and/or ERAP2 werefound.
As shown in Table I, the expression level of ERAP1 quantifiedby densitometry was high and fairly invariable in all cell lines,whereas that of ERAP2 was variable, either high or low. To fa-cilitate visual comparison, the densitometry data were normalizedas percentages of the highest density value obtained for ERAP1and ERAP2, and the percent expression is depicted side-by-sidefor each cell line in Fig. 2A. The levels of expression of these twopeptidases were comparable in nine cell lines, but in six cell lines(BRN, FDR, LMZ, PSR, PSM, and DLV) high ERAP1 expressionwas associated with low expression of ERAP2. It thus appearedthat there are two different patterns of expression of ERAP1 and
Table I. Expression of HLA class I H chains, ERAP1, ERAP2, and TAP1 in EBV-B cell lines and tumor cell lines
Cell Lines
HLA Class I (HCA2) HLA Class I (HC10) ERAP1 (ALAP) ERAP2 (3F5) TAP1
Raw data %a Raw data %a Raw %a Raw data %a Raw data %a
BNB 3526 92 2579 52 740 89 924 87 1732 100BRN 3246 84 4084 82 801 97 185 18 1063 61CNC 3851 100 4342 87 755 91 581 55 1214 70DAN 2000 52 3418 68 640 77 854 81 1098 63DLV 2918 76 2359 47 580 70 199 19 1038 60FDR 3234 84 4924 98 829 100 158 15 1038 60FRT 1980 51 3012 60 476 57 556 53 1242 72GGC 2875 75 2095 42 730 88 943 89 1180 68GGD 1892 49 2080 42 750 90 843 80 794 46LMZ 3756 98 4538 91 830 100 160 15 1139 66PNT 2071 54 4150 83 680 82 1016 96 874 50PSM 3029 79 2585 52 494 60 126 12 905 52PSR 2934 76 2844 57 770 93 259 25 1118 65SRN 2099 55 4142 83 675 81 855 81 786 45STC 1931 50 3754 75 590 71 953 90 1400 81
DAUDIb 250 6 1342 27 180 22 319 30 870 50K562c 22 1 238 5 260 31 128 12 32 2MOLT4 150 4 3238 65 639 77 1057 100 385 22U937 1403 36 3600 72 149 18 107 10 410 24WI-L2 3422 89 4300 86 695 84 250 24 1010 58
A431 2950 77 4704 94 766 92 399 38 911 53A549 786 20 4091 82 356 43 264 25 422 24BT20 32 1 2048 41 176 21 22 2 100 6Calu1 1250 32 2350 47 420 51 1057 100 185 11JARc 62 2 147 3 59 7 114 11 50 3JEG-3c 22 1 408 8 80 10 135 13 195 11H494 1073 28 3428 69 580 70 36 3 40 2HeLa 3849 100 5031 100 252 30 67 6 ND —HT-29 191 5 252 5 275 33 369 35 87 5KJ29b 465 12 1693 34 615 74 241 23 200 12LoVo 175 5 747 15 104 13 110 10 200 12LS174T 675 18 361 7 81 10 86 8 120 7MCF7 533 14 1134 23 481 58 47 4 200 12SK-BR3 27 1 29 1 80 10 24 2 250 14T24 1100 29 1363 27 400 48 249 24 24 1
501 21 1 2085 42 333 40 152 14 23 11102 1759 46 767 15 323 39 236 22 57 31182 31 1 250 5 20 2 120 11 18 11290–2 1605 42 2058 41 296 36 738 70 1255 721704 600 16 701 14 120 14 620 59 25 1COLO38 900 23 1149 23 348 42 415 39 567 33FO-1b 27 1 2187 44 289 35 500 47 20 1HO-1 2600 68 987 20 296 36 597 56 20 1IR-8 1403 36 1900 38 422 51 488 46 634 37M10 1743 45 4700 94 240 29 117 11 654 38M14 2950 77 3980 80 544 66 444 42 140 8MEL249 3300 86 2315 46 344 41 520 49 185 11MRN-1 1531 40 2614 52 660 80 80 7 494 29SK-MEL37 3300 86 4200 84 283 34 666 63 693 40SK-MEL93 2700 70 3500 70 373 45 921 87 734 42SP6.5 800 21 101 2 110 13 610 58 900 52STP-1 24 1 645 13 74 9 73 7 20 1
a Data are normalized as the percentage of the highest values detected for each parameter.b Cell lines defective in �2m expression (27, 30–32).c Cell lines defective in HLA-A, B, C H chain expression (28, 29).
4872 EXPRESSION OF ER AMINOPEPTIDASES IN TUMOR CELLS
by guest on March 23, 2014
http://ww
w.jim
munol.org/
Dow
nloaded from
ERAP2 in EBV cell lines: 1) ERAP1high/ERAP2high and 2)ERAP1high/ERAP2low.
Because the production of HLA class I-binding peptides is di-rectly linked to the activity of trimming peptidases and Westernblotting may detect both functionally active and inactive enzymes,next we determined the enzymatic activity of ERAP1 and ERAP2.The peptidases were isolated from cell lysates with Triton X-100by the use of protein G-Sepharose beads coated with mouse mAb4D2 specific to ERAP1 or mouse mAb 3F5 specific to ERAP2, and
the isolated peptidases were tested for their cleavage activityagainst their preferred fluorogenic substrates, Leu-AMC and Arg-AMC. As shown in Fig. 3A, Western blot analysis indicated thatmAb 4D2 beads and mAb 3F5 beads isolate specifically �115-kDa ERAP1 and ERAP2, respectively. The mAb 3F5 has beenfound to bind native �115-kDa ERAP2, but not native �60-kDaERAP2 (data not shown). In the activity assay, as shown in Fig.3B, ERAP1 and ERAP2 were reasonably specific for Leu-AMCand Arg-AMC: ERAP1 gave fluorescence intensity (FI) of 420 for
Table II. ER peptide trimming and ERAP1 and ERAP2 activity in EBV-B cell lines and tumor cell lines
Cell Line
% R-S9L Trimming ERAP1 Activity ERAP2 ActivityHLA Class I
Surface
Raw data %a FI %a FI %a MFIb %a
BNB ND — 567 100 2050 57 1586 74BRN 66 72 392 69 227 6 1732 81CNCc 48 52 567 100 64 2 1729 81DAN 72 78 281 50 1943 54 1319 62DLV ND — 272 48 167 5 1652 77FDR 56 61 425 75 254 7 1660 78FRT 74 80 292 51 2032 57 1602 75GGC ND — 252 44 3182 89 1246 58GGD ND — 235 41 1931 54 1399 65PNT 46 50 503 89 3099 86 1910 89PSM ND — 245 43 191 5 1330 62PSRc ND — 438 77 338 9 1599 75SRN 44 48 402 71 2585 72 1513 71STC 64 70 486 86 3143 87 1419 67
DAUDIc,d 16 17 210 37 42 1 1 0K562 28 30 40 7 31 1 2 0MOLT4c,e 54 59 352 62 3330 93 189 9U937 14 15 123 22 62 2 123 6WI-L2c 44 48 487 86 134 4 2137 100
A431c 50 54 194 34 86 2 961 45A549c 4 4 70 12 72 2 446 21BT20c 4 4 16 3 98 3 189 9Calu1 ND — 353 62 1420 40 420 20JARe 20 22 32 6 11 0 1 0JEG-3e 22 24 24 4 61 2 33 2H494 8 9 432 76 224 6 466 22HeLa ND — 19 3 90 3 200 9HT-29 92 100 133 23 1210 34 139 7KJ29c 20 22 452 80 201 6 1 0LoVoc 6 7 56 10 121 3 1 0LS174T 28 30 78 14 296 8 70 3MCF7 40 43 362 64 121 3 165 8SK-BR3 4 4 4 1 28 1 1 0T24c 34 37 180 32 98 3 356 17
501c 24 26 72 13 51 1 393 181102c 30 33 240 39 0 0 176 81182 1 (1) 2 (0) 62 (2) 1 (0)1290–2 30 (33) 167 (29) 1690 (47) 344 (16)1704 46 (50) 132 (23) 3594 (100) 88 (4)COLO38 56 (61) 169 (30) 1476 (41) 402 (19)FO-1c,d 54 (59) 165 (29) 70 (2) 1 (0)HO-1 80 (87) 192 (34) 1337 (37) 207 (10)IR-8 60 (65) 301 (53) 747 (21) 420 (20)M10c ND — 65 (11) 23 (1) 256 (12)M14 44 (48) 303 (53) 1151 (32) 131 (6)MEL249c 62 (67) 293 (43) 458 (13) 1 (0)MRN-1 16 (17) 224 (40) 208 (6) 366 (17)SK-MEL37 44 (48) 191 (34) 2037 (57) 1091 (51)SK-MEL93 ND — 195 (34) 1843 (51) 204 (9)SP6.5c 46 (50) 193 (34) 252 (7) 219 (10)STP-1 10 (11) 17 (3) 67 (2) 1 (0)
a Data are normalized as the percentage of the highest values detected for each parameter.b Data are expressed as specific MFI by staining with W6/32 minus MFI of an isotype-matched irrelevant Ab.c Cell lines with impaired ERAP1 and/or ERAP2 activity are in bold.d Cell lines defective in �2m expression (27, 30–32).e Cell lines defective in HLA-A, -B, and -C H chain expression (28, 29).
4873The Journal of Immunology
by guest on March 23, 2014
http://ww
w.jim
munol.org/
Dow
nloaded from

Leu-AMC and an FI of 53 for Arg-AMC, whereas ERAP2 gave anFI of 26 for Leu-AMC and an FI of 625 for Arg-AMC. Substratecleavage reflected the amounts of the aminopeptidases visualizedin the blots, indicating a similar sensitivity of the two assays.
Using these cleavage assays, the activity of ERAP1 and ERAP2was detected in 14 EBV-B cell lines. The FI values obtained werenormalized as percentages of the highest FI value obtained for bothERAP1 and ERAP2 (Table II) and depicted side-by-side with thenormalized Western blotting data in Fig. 3C. In most EBV-B celllines tested, the measured ERAP1 activity (assessed using Leu-AMC) and ERAP2 activity (assessed using Arg-AMC) correlatedwell with their respective expression at the protein level. The onlydiscrepancy between expression and activity (low Arg-AMC hy-drolysis and high ERAP2 expression) was found in the CNC cellline. ERAP2 cDNA from CNC cells was amplified by RT-PCRand sequenced, but no nucleotide variations (as compared with
accession number AB109031) were detected that could account foran impaired function. Except for this cell line, the Western blotdata are indicative of the expression level of enzymatically active�115-kDa ERAP1 and ERAP2.
Cleavage activity by unidentified ER aminopeptidases in EBV-Bcell lines
A TLC assay that quantifies N-terminal trimming of the labeledpeptide R-S9L (also designated as R10L) was used to determineaminopeptidase activity inside microsome vesicles (6). Recently,this R-S9L-trimming assay was found to detect a group of amin-opeptidases that include ERAP2 and several as yet unidentifiedaminopeptidases (14).
The R-S9L-trimming assay was performed for eight EBV-B celllines. Microsomes were purified by differential centrifugation from
FIGURE 3. ERAP1 and ERAP2 activity in EBV-Band tumor cell lines. A, ERAP1 and ERAP2 were iso-lated (in duplicate) from Triton X-100 cell lysates (seeMaterials and Methods) using protein G beads coatedwith specific Abs (4D2 and 3F5, respectively) or pre-immune serum (pre-imm). One set was eluted, run onSDS-PAGE, Western blotted, and the specific 115-kDabands were identified by Abs to ERAP1 (A-LAP) andERAP2 (3F5). B, The remaining half was tested for en-zymatic activity with specific fluorogenic substrates:Leu-AMC (f) and Arg-AMC substrates (�) (see Ma-terials and Methods). The results are reported in fluo-rescence units. C and D, ERAP1 and ERAP2 were iso-lated as above from the indicated cell lines and tested forLeu-AMC and Arg-AMC cleavage, respectively. Thefluorescence units were normalized as percentages ofthe highest value obtained for both ERAP1 and ERAP2(�) and depicted side-by-side with the respective West-ern blotting densitometric values (f and u) for EBV-Bcell lines (C) and tumor cell lines (D). Data are repre-sentative of two experiments.
FIGURE 2. Quantitative analysis of ERAP1 andERAP2 expression in EBV and tumor cell lines. Den-sitometric values from the Western blotting data ofERAP1 and ERAP2 in EBV (A) and tumor cell lines (B)are expressed as percentage of the highest value ob-tained for each enzyme.
4874 EXPRESSION OF ER AMINOPEPTIDASES IN TUMOR CELLS
by guest on March 23, 2014
http://ww
w.jim
munol.org/
Dow
nloaded from

cell homogenates and treated with pK and then CHAPS. Un-treated, pK-treated and pK/CHAPS-treated microsomes weretested for their aminopeptidase activity that trims R-S9L to S9L bythe TLC assay. Representative TLC patterns are shown for theEBV-B cell line JY in Fig. 4A. The difference in radioactivity ofthe S9L spot between pK-treated microsomes and pK/CHAPS-treated microsomes was taken to be indicative of luminal ER ami-nopeptidase activity. The difference, expressed as percentage ofthe input R-S9L, was used as a measure of R-S9L-trimmingactivity.
Assay data of R-S9L-trimming activity is presented in Table II.The R-S9L-trimming activity is also shown side-by-side with theERAP2 activity for each cell line in Fig. 4B. At a glance, it isevident that high R-S9L-trimming activity was associated withvery low ERAP2 activity in three cell lines (BRN, FDR, andCNC). This indicates that, in these cells, unidentified aminopepti-dases are involved predominantly in the R-S9L trimming.
Correlation of ERAP1 and ERAP2 expression with HLA class Iexpression in EBV-B cell lines
To evaluate the implication of ERAP1 and ERAP2 in HLA classI surface expression, EBV-B cell lines were measured for surfaceHLA class I expression by indirect immunofluorescence stainingusing mAb W6/32 that identifies all classical class I HLA-A, -B,and -C H chains and nonclassical class I HLA-E and -G H chains.The mean fluorescence intensity (MFI) was determined by flow
cytometry. MFI and the percentage values of the highest MFI ob-served are presented in Table II. All EBV-B cell lines displayedhigh and fairly similar surface HLA class I expression �1200MFI. The normalized percentage of HLA class I surface expres-sion is plotted side-by-side with the normalized ERAP1 activity(labeled Leu-AMC) and ERAP2 activity (labeled Arg-AMC) inFig. 5A.
Surface HLA class I expression in these EBV-B cell lines cor-related fairly well with ERAP1 activity, but not with ERAP2 ac-tivity. In six cell lines, BRN, FDR, CNC, PSR, PSM, and DLV,high surface HLA class I expression was associated with very lowERAP2 activity. Thus, ERAP1 activity correlates with surfaceHLA class I expression better than ERAP2 activity.
Expression of ERAP1 and ERAP2 in tumor cell lines
Next, a panel of tumor cell lines, including 5 leukemia/lymphomacell lines, 17 melanoma cell lines, and 15 carcinoma cell lines, wasassayed for the expression of ERAP1, ERAP2, HLA class I Hchains, and TAP1 by Western blotting, followed by densitometry,and the data were processed and presented as described above forEBV-B cell lines.
As shown in Fig. 1, B and C, essentially all tumor cell lines werefound to express �115-kDa ERAP1 and �115-kDa ERAP2 tosome extent. Truncated ERAP2 of �60 kDa was also detected inall cell lines (data not shown). Unlike EBV-B cell lines, the levelof expression in tumor cell lines was highly variable for both
FIGURE 4. Comparison between ERAP2 activityand R-S9L trimming in EBV-B and tumor cell lines. A,Representative TLC analysis of an EBV-B cell line. Mi-crosomes purified from a EBV-B cell line were left un-treated (lane 3), treated with pK to remove extraluminalpeptidases (lane 4), or treated with pK and lysed in PBSwith 1% CHAPS (lane 5) and then incubated 3 min with3 �l of 125I-labeled R-S9L. Undigested labeled peptidesR-S9L and S9L were included for TLC calibration(lanes 1 and 2). B and C, R-S9L trimming from a panelof cell lines is expressed as the percentage of the highestvalue and shown side-by-side with the ERAP2 activityfor EBV-B cell lines (B) and tumor cell lines (C). Dataare representative of three experiments.
FIGURE 5. Correlation between ERAP1 and ERAP2activity with HLA class I surface expression. SurfaceHLA class I expression and activity data of ERAP1 andERAP2 are expressed as percentage of the highest valueobtained for each enzyme and plotted against each otherfor EBV (A) and tumor cell lines (B).
4875The Journal of Immunology
by guest on March 23, 2014
http://ww
w.jim
munol.org/
Dow
nloaded from

ERAP1 and ERAP2. As seen in Table I, the expression level quan-tified by densitometry, i.e., the percent expression, ranged between2 and 92% for ERAP1 and between 2 and 100% for ERAP2. Cellline 1182 was barely positive for ERAP1 at a longer exposure ofthe chromatograph shown in Fig. 1C. The cell lines BT20, H494,HeLa, MCF7, and SK-BR3 were only weakly positive for ERAP2.
The normalized expression of ERAP1 and ERAP2 is presentedside-by-side for each cell line for direct comparison in Fig. 2B.These data, along with those for EBV-B cell lines (Fig. 2A), wereevaluated statistically for correlation by regression analysis. Theregression plot with R2 and p values is shown in Fig. 6A. Nosignificant correlation between ERAP1 and ERAP2 expressionwas found, R2 � 0.13 and p � 0.009. The statistical values ob-tained for EBV-B cell lines were R2 � 0.016 and p � 0.65, andthose for tumor cell lines were R2 � 0.08 and p � 0.10. Thus, itis clear that the expression of ERAP1 and ERAP2 is independentand not coordinated.
Tumor cell lines were then assayed for the aminopeptidase ac-tivity of ERAP1 and ERAP2. ERAP1 and ERAP2 were isolatedfrom each tested cell line with specific Ab-coated Sepharose beadsand assayed for the cleavage activity against aminoacyl-AMC asdescribed for EBV-B cells.
For direct comparison, the FI values were normalized as thepercentage of the highest FI value obtained in each of ERAP1 andERAP2 activity assays (Table II). These normalized values aredepicted side-by-side with the respective normalized Western blot-ting data for each cell line in Fig. 3D.
In many cell lines, the enzymatic activities (cleavage of Leu-AMC and Arg-AMC) appeared to be proportional to ERAP1 andERAP2 expression, estimated by Western blotting, over a wide
range of expression levels, suggesting a similar sensitivity of thetwo assays. However, as shown in bold in Table II, low enzymaticactivities (�15%) were associated with relatively high (�20%)ERAP1 or ERAP2 expression in 5 and 12 tumor cell lines, respec-tively. The cell lines CNC, A431, and FO-1 also displayed poor orundetectable cleavage of a second ERAP2 substrate (Lys-AMC).Like the EBV-B cell line CNC, these tumor cell lines expressfunctionally impaired ERAP proteins.
In the regression analysis of the whole data set, includingEBV-B cell and tumor cell lines, the correlation between ERAPexpression and aminoacyl-AMC hydrolysis was highly significant.The R2 value was 0.70 ( p � 0.0001) for ERAP1 vs Leu-AMC(Fig. 6C) and 0.71 ( p � 0.0001) for ERAP2 vs Arg-AMC (Fig.6D). When the cell lines with impaired ERAP1 or ERAP2 cleav-age were excluded, the R2 values were not or slightly affected, inthat they became 0.70 ( p � 0.0001) for ERAP1 vs Leu-AMC, and0.82 ( p � 0.0001) for ERAP2 vs Arg-AMC. This indicates that ingeneral ERAP1 and ERAP2 are enzymatically active and the lev-els of their expression reflect the levels of their peptidase activity.Conforming to the lack of correlation in the levels of their expres-sion (Fig. 6A), ERAP1 and ERAP2 activities did not correlatesignificantly (Fig. 6B). The R2 values were 0.11 ( p � 0.018) forthe whole data set, and 0.18 ( p � 0.012) when the cell lines withimpaired AMC substrate cleavage activity were omitted.
Cleavage activities by unidentified ER aminopeptidases in tumorcell lines
As mentioned previously, ER aminopeptidase activity detected bythe use of the peptide substrate R-S9L has been found to be due toERAP2 and one or several unknown aminopeptidases. In fact, highR-S9L-trimming activity was detected in the absence of ERAP2activity in three of the eight EBV-B cell lines tested (Fig. 4B).Thus, it appeared that in these cell lines, the R-S9L-trimming ac-tivity is primarily attributable to unidentified aminopeptidases.
We, therefore, looked for a similar phenotype, i.e., low ERAP2activity/high R-S9L trimming, in tumor cell lines. The R-S9L as-say data are presented in Table II and, side-by-side with normal-ized ERAP2 activity data, in Fig. 4C. At a glance, it is clear thatmany cell lines, both carcinomas and melanomas, have reasonablyhigh R-S9L-trimming activity and hardly detectable ERAP2 ac-tivity (labeled Arg-AMC). In these cell lines, unidentified amin-opeptidase(s) must be involved in R-S9L-trimming activity. In-deed, as shown in Fig. 6E, no significant correlation was seenbetween R-S9L trimming and ERAP2 activity. The R2 values were0.24 ( p � 0.001) for the whole set of cell lines and 0.31 ( p �0.001) when the impaired Arg-AMC substrate cleavage cell lineswere excluded. A significant correlation was found betweenR-S9L-trimming and ERAP2 expression. The R2 value was 0.37( p � 0.0001; Fig. 6F). It thus appeared that reduced ERAP2 ac-tivity is complemented by some other, as yet unidentified,aminopeptidases.
Correlation of ERAP1 and ERAP2 expression with HLA class Iexpression in tumor cell lines
Surface HLA class I expression of tumor cell lines was assessed bymAb W6/32 in flow cytometry. MFI and the normalized values arepresented in Table II. The level of expression was generally low(MFI �467 for all but three cell lines) and highly variable.HLA-A, -B, and -C expression was either undetectable or barelydetectable in 11 cell lines that include 7 cell lines (DAUDI, K562,JAR, JEG-3, KJ-29, LoVo, and FO-1) that are known for theiraberrant expression of �2m and/or HLA class I H chains (27–32)and 4 cell lines (SK-BR3, 1182, MEL249, and STP-1) for whichno information is available in the literature. The normalized HLA
FIGURE 6. Regression analysis of ERAP1, ERAP2, and unidentifiedER aminopeptidases. Densitometric analysis of Western blots and enzy-matic activity data of ERAP1, ERAP2, and unidentified ER aminopepti-dases of all of the tested cell lines, normalized as indicated in the previousfigures, are plotted against each other. The activity data are indicated by thesubstrate name with which the activity was assayed: Leu-AMC for ERAP1activity, Arg-AMC for ERAP2 activity, and R-S9L for ERAP2 plus un-identified ER aminopeptidases. A, Expression of ERAP1 vs expression ofERAP2 (A), activity of ERAP1 vs activity of ERAP2 (B), activity ofERAP1 vs its expression (C), activity of ERAP2 vs its expression (D),activity of ERAP2 vs R-S9L peptide trimming (E), expression of ERAP2vs R-S9L peptide trimming (F). Regression lines and coefficients areshown.
4876 EXPRESSION OF ER AMINOPEPTIDASES IN TUMOR CELLS
by guest on March 23, 2014
http://ww
w.jim
munol.org/
Dow
nloaded from

class I surface expression (labeled surf. HLA I) is plotted side-by-side with the normalized ERAP1 and ERAP2 activities (labeledLeu-AMC and Arg-AMC, respectively) in Fig. 5B.
The correlation of surface HLA class I expression with each ofexpression and activity of ERAP1 and ERAP2 was estimated byregression analysis. The regression plots with R2 and p values areshown for all cell lines, including EBV-B cell lines, in Fig. 7, A–D.Surface HLA class I expression correlated significantly with theexpression and activity of ERAP1 (R2 � 0.58 and 0.48, respec-tively; p � 0.0001 in both cases; Fig. 7, A and B), but not with theexpression and activity of ERAP2 (R2 � 0.13, p � 0.01 and R2 �0.09, p � 0.03, respectively; Fig. 7, C and D). The correlation ofsurface HLA class I expression with R-S9L-trimming activity, thatdetects ERAP2 plus some other aminopeptidases, was not signif-icant, although the R2 value was somewhat greater than that seenfor the correlation with ERAP2 activity, R2 � 0.19, p � 0.004;Fig. 7E).
Next, we evaluated HLA class I H chain expression for corre-lation with surface HLA class I expression (Fig. 7F), ERAP1 ex-pression (Fig. 7G), and ERAP2 expression (Fig. 7H). The R2 val-ues were 0.55, 0.54, and 0.09, respectively. These data altogethersuggest that ERAP1 is more closely coordinated with HLA class IH chains (total as well as surface expressed) than ERAP2.
Effect of ERAP1 and ERAP2 transfection on surface HLA classI expression in tumor cells
Finally, to determine whether the available levels of ERAP1 andERAP2 might be limiting for surface HLA class I expression insome neoplastic cells, two cell lines (BT20 and HeLa) were se-lected on the basis of their low expression of both aminopeptidases
(see Fig. 1A and data not shown) and were transfected with ERAP1or ERAP2 cDNAs or the vector DNA alone. Transfectants weretested for ERAP1 and ERAP2 expression by Western blotting, forERAP1 and ERAP2 activities by assessing the cleavage of specificaminoacyl-AMC substrates, and for HLA class I surface expres-sion by flow cytometry as described above.
Whereas vector DNA had no effect, ERAP1 and ERAP2 cDNAsenhanced 7 and 20 times, respectively, the expression of the twoaminopeptidases in both BT20 and HeLa (Fig. 8A, and densito-metric data, not shown). ERAP1 and ERAP2 reached levels com-parable to their endogenous expression in EBV-B cell lines (cfwith Fig. 1A). These expression levels were proportional to func-tional aminopeptidase activities in both cells (Fig. 8B). However,despite functional reconstitution, surface HLA class I expressionwas only slightly increased. As compared with the vector DNAs,transfection with ERAP1 and ERAP2 increased W6/32 MFI valuesin BT20 cells from 20 to 30 and 29, respectively. In HeLa cells,MFI values increased from 26 to 29 and 30, respectively (Fig. 8C).These values correspond to 50 and 11% increments in BT20 andHeLa, respectively. Similar results were obtained in three separateexperiments. Thus, ERAP1 and ERAP2 both affect class I expres-sion, although to a different extent in different tumor cell lines.
DiscussionIn this study, we have assayed a large panel of human lymphoidand nonlymphoid cell lines of various cell types to investigate theexpression of ER aminopeptidases that include ERAP1, ERAP2,and unidentified ER aminopeptidases. These peptidases have beenimplicated in the generation of optimal HLA class I-bindingpeptides.
We have measured the expression of ERAP1 and ERAP2 byWestern blotting using specific Abs and their enzymatic activitiesby assessing the cleavage of specific aminoacyl-AMC substrates.Our results demonstrate that ERAP1 and ERAP2 are expressed: 1)at extremely variable levels in all the tested cell lines, includingHLA class I-defective cell lines; 2) independently of each other
FIGURE 8. Expression of ERAP1 and ERAP2 increase HLA class Isurface expression in tumor cell lines. BT20 and HeLa cells were trans-fected with either ERAP1 (E1) or ERAP2 (E2), or with vector alone (�).The expression of ERAP1 and ERAP2 was evaluated by Western blot (A).Their enzymatic activities were assessed by measuring the cleavage of thefluorogenic substrates Leu-AMC and Arg-AMC, following isolation onAb-coated beads, as described in the legend of Fig. 3 (B). Surface HLAclass I expression was analyzed by flow cytometry with the W6/32 Ab (C).Negative controls stained with isotype-matched primary Abs did not ex-ceed a MFI of 5. ERAP-transfected and vector-transfected cell lines arerepresented by black and gray lines, respectively. A representative exper-iment is shown of three that were performed.
FIGURE 7. Regression analysis of HLA class I molecules againstERAP1, ERAP2, and unidentified ER aminopeptidases. Surface HLA classI expression is plotted against ERAP1 activity (A), ERAP1 expression (B),ERAP2 activity (C), ERAP2 expression (D), and R-S9L trimming (E) forall of the tested cell lines. HLA class I H chain is plotted against surfaceHLA class I expression (F), ERAP1 expression (G), and ERAP2 expres-sion (H). Regression lines and coefficients are shown.
4877The Journal of Immunology
by guest on March 23, 2014
http://ww
w.jim
munol.org/
Dow
nloaded from

and not coordinately; and 3) in amounts proportional to their ami-nopeptidase activities in most cell lines. In addition, the reducedexpression of ERAP2 is complemented by the expression of un-identified aminopeptidases, and the peptidase activity of ERAP1has significantly high correlation with HLA class I expression, butsuch correlation is not seen for ERAP2 and unidentified ER amin-opeptidases. Transfection of ERAP1 and ERAP2 in two tumor celllines, selected for low expression of both aminopeptidases, resultsin modest increases of HLA class I expression, more evident in oneof the cell lines.
Imbalanced expression of ER aminopeptidases in tumor celllines
We found that EBV-B cells from different healthy donors displaylimited variability in the ER aminopeptidase expression: they ex-press similar high levels of HLA class I and ERAP1, and eitherhigh or low levels of ERAP2. Therefore, there are only two phe-notypes in the EBV-B cell lines, i.e., ERAP1high/ERAP2high andERAP1high/ERAP2low. Efficient in vitro trimming of precursors ofHLA class I-binding peptides requires the removal of N-terminalextensions containing hydrophobic and basic residues through thejoint action of ERAP1 and ERAP2 (14). Thus, the variation in theaminopeptidase complement of nontransformed B lymphocytes isconsistent with the idea that ERAP1 and ERAP2 must be bothexpressed above a threshold that is necessary for concerted Agtrimming in these professional APCs.
Strikingly in contrast, tumor cell lines from all tested lineagesare extremely variable in the expression of not only HLA class Imolecules, as known for many years, but also in the expression andenzymatic activities of ERAP1, ERAP2, and, possibly, of addi-tional unknown aminopeptidases (as shown by the R-S9L-trim-ming assay). There is nearly a two-log difference in the levels ofERAP1 and ERAP2 (proteins and enzymatic activities) betweenhigh and low expressors and, more important, ERAP1 and ERAP2are independently regulated, i.e., their expression levels in a givencell are often discordant. All of the possible combinations fromvery high to very low expression of the two enzymes are repre-sented in tumors; extreme phenotypes, i.e., ERAP1high/ERAP2low
phenotypes, and vice versa, being rather frequent.According to the model of concerted Ag trimming, any imbal-
ance in ER aminopeptidases would result in the insufficient trim-ming of certain N-terminal extensions and excessive trimming ofothers. Consequently, certain epitopes would be inefficiently gen-erated, while others might even be destroyed. In agreement withthis model, the suppression of human ERAP1 by RNA interferenceor murine ERAAP by homologous recombination, depressed thepresentation of some epitopes, and increased or left unmodifiedthat of others (8, 16, 33). Potentially, imbalances in the expressionof ERAP1 and ERAP2 may also suppress or derange the presen-tation of certain tumor-associated Ags. Therefore, our results in-dicate that tumor cells that completely lack ERAP expression areprobably rare (no ERAP negatives were detected in our extensivecell panel) and that the expressed ERAP polypeptides are func-tional in most cells. Nevertheless, significant numbers of tumorsare probably impaired in their ability to precisely trim Ag precur-sors, because they express extremely low activity levels of at leastone ER aminopeptidase.
We have identified one EBV-B cell line and few tumor cell linesdisplaying high ERAP1 and/or ERAP2 expression but low enzy-matic activities. At least in one case, direct gene inactivation isunlikely, since no nucleotide sequence variations were detected ascompared with functional ERAP2 cDNA. An impaired enzymaticactivity of a wild-type protein may result from an incorrect folding,possibly as a consequence of abnormal posttranslational modifi-
cations, such as glycosylation defects or incorrect formation ofdisulfide bonds, or an absence of cofactors or collaborating pro-teins. Alternatively, substrate cleavage in the test tube may besensitive to nonspecific functional inactivation by unknown factorscoimmunoprecipitated in some cell lines.
An imbalanced expression of ER aminopeptidases is not ex-pected to result in a major decrease in the levels of cell surfaceclass I molecules, as demonstrated by RNA interference withERAP1 and ERAP2 expression (14) and, more recently, inERAAP-deficient mice (33). In agreement with these data, surfaceHLA class I expression could be detected at significant levels incells expressing imbalanced levels of ERAP1 and ERAP2 and wasonly moderately enhanced upon transfection with ERAP1 orERAP2 in two cell lines, although selected from our large panel inview of their extremely low constitutive expression of theseaminopeptidases.
Recent studies in ERAAP-deficient mice indicate that the cellslacking ERAAP are not deficient in peptide supply but instead aredeficient in the composition of the MHC-associated peptide pool(33. Thus, complementary approaches (suppression and reconsti-tution of ERAP/ERAAP expression) in humans and mice concor-dantly indicate a subtle but possibly crucial role of peptide trim-ming in the optimization of class I peptide ligand-MHCinteractions. In agreement with this idea, the different enhancementof class I molecules in the two cell lines tested by us may reflectthe more or less strict dependence on trimming of different sets ofclass I alleles in different cells. Alternatively, the levels of themembers of the HLA class I Ag-processing and presentation ma-chinery (or other unknown factors) may differ in different cell linesand independently influence a limiting step (other than peptidetrimming) in class I assembly. In this respect, it should be notedthat the knockdown of class I expression by small interfering RNAwas effective in HeLa cells treated with IFN-�, a situation produc-ing an increased demand for trimming in a cell line in which theconstitutive functions required for trimming/processing are other-wise sufficient to sustain peptide presentation by a low number ofexpressed class I molecules. Thus, marginal enhancement of classI expression by overexpressing ERAP1 and ERAP2 in HeLa is notsurprising and supports the idea that proper trimming requires theright balance and the concerted action of ER aminopeptidases,members of the Ag-processing machinery, and class I H chains.
Most likely, an analysis of the peptide repertoire isolated fromsingle HLA class I allele in these cell lines may be required toidentify tumors carrying qualitative defects in their HLA class I Agrepertoire. Ideally, these studies should be conducted in tumor celllines fully characterized in their expression of all ER aminopepti-dases, but this must await the availability of specific Abs to as yetunidentified ER aminopeptidases other than ERAP1 and ERAP2.
ERAP1, ERAP2, and HLA class I: linkage and derangement
Despite the imbalanced, variable expression of ER aminopepti-dases, ERAP1 was significantly correlated with HLA class I, beinginvariably expressed at high levels in EBV-B cells, and conform-ing to the linked patterns of expression (the class I “coordinome”)previously detected among the members of the Ag-processing ma-chinery in tumor cell lines (23). In contrast, ERAP2 was less ho-mogeneous in its expression even in EBV-B cells and extensivelydeviated from HLA class I in tumor cells. A possible interpretationof the closer coordination of ERAP1 with HLA class I moleculesis that precursor peptides carrying hydrophobic amino acid resi-dues at their N terminus are particularly abundant in the ER, andERAP1 is the crucial aminopeptidase initiating their trimming. Inthis case, it would be necessary to postulate that TAP preferentiallytranslocates such precursor peptides into the ER. The strong length
4878 EXPRESSION OF ER AMINOPEPTIDASES IN TUMOR CELLS
by guest on March 23, 2014
http://ww
w.jim
munol.org/
Dow
nloaded from

specificity and preference of ERAP1 for peptides with large hy-drophobic C terminus (34) make this enzyme more adapted togenerate efficiently the great majority of MHC class I epitopes,with the possible exception of peptides with C-terminal basic res-idues bound by some human class I alleles. Interestingly, micewhich transport into the ER and present exclusively antigenic pep-tides with hydrophobic C termini express ERAAP, the closestERAP1 homolog, but lack ERAP2 (33).
Whatever the mechanism of class I-ERAP1 coregulation,ERAP2 appears to be more loosely linked to the class I coordi-nome in B cells. This weak linkage may be further weakened byneoplastic transformation, explaining the extensive derangement inERAP2 expression observed in tumor cells. It remains to be de-termined whether imbalanced ERAP (primarily ERAP1, but alsoERAP2) expression is a novel strategy of immune evasion and, ifso, whether it is particularly advantageous to tumors.
AcknowledgmentsDrs. Soldano Ferrone and Peter Cresswell are gratefully acknowledged fortheir generous gift of cell lines and Dr. Hidde Ploegh for the HCA2 andHC10 Abs. We thank Prof. Gian Franco Bottazzo for providing supportand encouragement and Drs. Nobuyuki Tanigaki and Richard Butler forhelpful suggestions and critical reading of this manuscript.
DisclosuresThe authors have no financial conflict of interest.
References1. Taylor, A. 1993. Aminopeptidases: structure and function. FASEB J. 7: 290–298.2. Rock, K. L., and A. L. Goldberg. 1999. Degradation of cell proteins and the
generation of MHC class I-presented peptides. Annu. Rev. Immunol. 17:739–779.
3. Reits, E., J. Neijssen, C. Herberts, W. Benckhuijsen, L. Janssen, J. W. Drijfhout,and J. Neefjes. 2004. A major role for TPPII in trimming proteasomal degrada-tion products for MHC class I antigen presentation. Immunity 20: 495–506.
4. York, I. A., A. X. Mo, K. Lemerise, W. Zeng, Y. Shen, C. R. Abraham, T. Saric,A. L. Goldberg, and K. L. Rock. 2003. The cytosolic endopeptidase, thimetoligopeptidase, destroys antigenic peptides and limits the extent of MHC class Iantigen presentation. Immunity 18: 429–440.
5. Reits, E., A. Griekspoor, J. Neijssen, T. Groothuis, K. Jalink, P. van Veelen,H. Janssen, J. Calafat, J. W. Drijfhout, and J. Neefjes. 2003. Peptide diffusion,protection, and degradation in nuclear and cytoplasmic compartments before an-tigen presentation by MHC class I. Immunity 18: 97–108.
6. Fruci, D., G. Niedermann, R. H. Butler, and P. M. van Endert. 2001. EfficientMHC class I-independent amino-terminal trimming of epitope precursor peptidesin the endoplasmic reticulum. Immunity 15: 467–476.
7. Serwold, T., S. Gaw, and N. Shastri. 2001. ER aminopeptidases generate a uniquepool of peptides for MHC class I molecules. Nat. Immunol. 2: 644–651.
8. Serwold, T., F. Gonzalez, J. Kim, R. Jacob, and N. Shastri. 2002. ERAAP cus-tomizes peptides for MHC class I molecules in the endoplasmic reticulum. Na-ture 419: 480–483.
9. Saric, T., S. C. Chang, A. Hattori, I. A. York, S. Markant, K. L. Rock,M. Tsujimoto, and A. L. Goldberg. 2002. An IFN-�-induced aminopeptidase inthe ER, ERAP1, trims precursors to MHC class I-presented peptides. Nat. Im-munol. 3: 1169–1176.
10. Hattori, A., H. Matsumoto, S. Mizutani, and M. Tsujimoto. 1999. Molecularcloning of adipocyte-derived leucine aminopeptidase highly related to placentalleucine aminopeptidase/oxytocinase. J. Biochem. 125: 931–938.
11. Schomburg, L., H. Kollmus, S. Friedrichsen, and K. Bauer. 2000. Molecularcharacterization of a puromycin-insensitive leucyl-specific aminopeptidase,PILS-AP. Eur. J. Biochem. 267: 3198–3207.
12. Cui, X., F. Hawari, S. Alsaaty, M. Lawrence, C. A. Combs, W. Geng,F. N. Rouhani, D. Miskinis, and S. J. Levine. 2002. Identification of ARTS-1 asa novel TNFR1-binding protein that promotes TNFR1 ectodomain shedding.J. Clin. Invest. 110: 515–526.
13. Tanioka, T., A. Hattori, S. Masuda, Y. Nomura, H. Nakayama, S. Mizutani, andM. Tsujimoto. 2003. Human leukocyte-derived arginine aminopeptidase: the
third member of the oxytocinase subfamily of aminopeptidases. J. Biol. Chem.278: 32275–32283.
14. Saveanu, L., Carroll, O., Lindo, V., Del Val, M., Lopez, D., Lepelletier, Y.,Greer, F., Schomburg, L., Fruci, D., Niedermann, G., and van Endert, P. 2005.Human aminopeptidases ERAP1 and ERAP2 associate for concerted peptidetrimming in the endoplasmic reticulum. Nat. Immunol. 6: 689–697.
15. Momburg, F., J. Roelse, G. J. Hammerling, and J. J. Neefjes. 1994. Peptide sizeselection by the major histocompatibility complex-encoded peptide transporter.J. Exp. Med. 179: 1613–1623.
16. York, I. A., S. C. Chang, T. Saric, J. A. Keys, J. M. Favreau, A. L. Goldberg, andK. L. Rock. 2002. The ER aminopeptidase ERAP1 enhances or limits antigenpresentation by trimming epitopes to 8–9 residues. Nat. Immunol. 3: 1177–1184.
17. Marincola, F. M., E. M. Jaffee, D. J. Hicklin, and S. Ferrone. 2000. Escape ofhuman solid tumors from T-cell recognition: molecular mechanisms and func-tional significance. Adv. Immunol. 74: 181–273.
18. Hattori, A., K. Kitatani, H. Matsumoto, S. Miyazawa, T. Rogi, N. Tsuruoka,S. Mizutani, Y. Natori, and M. Tsujimoto. 2000. Characterization of recombinanthuman adipocyte-derived leucine aminopeptidase expressed in Chinese hamsterovary cells. J. Biochem. 128: 755–762.
19. Stam, N. J., H. Spits, and H. L. Ploegh. 1986. Monoclonal antibodies raisedagainst denatured HLA-B locus heavy chains permit biochemical characterizationof certain HLA-C locus products. J. Immunol. 137: 2299–2306.
20. Sernee, M. F., H. L. Ploegh, and D. J. Schust. 1998. Why certain antibodiescross-react with HLA-A and HLA-G: epitope mapping of two common MHCclass I reagents. Mol. Immunol. 35: 177–188.
21. Barnstable, C. J., W. F. Bodmer, G. Brown, G. Galfre, C. Milstein,A. F. Williams, and A. Ziegler. 1978. Production of monoclonal antibodies togroup A erythrocytes, HLA and other human cell surface antigens—new tools forgenetic analysis. Cell 14: 9–20.
22. Kovats, S., E. K. Main, C. Librach, M. Stubblebine, S. J. Fisher, and R. DeMars.1990. A class I antigen, HLA-G, expressed in human trophoblasts. Science 248:220–223.
23. Giorda, E., L. Sibilio, A. Martayan, S. Moretti, I. Venturo, M. Mottolese,G. B. Ferrara, S. Cappellacci, L. Eibenschutz, C. Catricala, P. Grammatico, andP. Giacomini. 2003. The antigen processing machinery of class I human leuko-cyte antigens: linked patterns of gene expression in neoplastic cells. Cancer Res.63: 4119–4127.
24. Salter, R. D., and P. Cresswell. 1986. Impaired assembly and transport of HLA-Aand -B antigens in a mutant TxB cell hybrid. EMBO J. 5: 943–949.
25. Shimizu, Y., D. E. Geraghty, B. H. Koller, H. T. Orr, and R. DeMars. 1988.Transfer and expression of three cloned human non-HLA-A,B,C class I majorhistocompatibility complex genes in mutant lymphoblastoid cells. Proc. Natl.Acad. Sci. USA 85: 227–231.
26. Grandea, A. G. III, M. J. Androlewicz, R. S. Athwal, D. E. Geraghty, andT. Spies. 1995. Dependence of peptide binding by MHC class I molecules ontheir interaction with TAP. Science 270: 105–108.
27. Browning, M. J., J. A. Madrigal, P. Krausa, H. Kowalski, C. E. Allsopp,A. M. Little, S. Turner, E. J. Adams, K. L. Arnett, W. F. Bodmer, et al. 1995. TheHLA-A,B,C genotype of the class I negative cell line Daudi reveals novel HLA-Aand -B alleles. Tissue Antigens 45: 177–187.
28. Guillaudeux, T., A. M. Rodriguez, M. Girr, V. Mallet, S. A. Ellis, I. L. Sargent,R. Fauchet, E. Alsat, and P. Le Bouteiller. 1995. Methylation status and tran-scriptional expression of the MHC class I loci in human trophoblast cells fromterm placenta. J. Immunol. 154: 3283–3299.
29. Santamaria, P., A. L. Lindstrom, M. T. Boyce-Jacino, S. H. Myster, J. J. Barbosa,A. J. Faras, and S. S. Rich. 1993. HLA class I sequence-based typing. Hum.Immunol. 37: 39–50.
30. Delfino, L., G. Ciccarelli, D. Bini, A. Morabito, S. Pozzi, A. Martayan, E. Giorda,A. Setini, R. Fraioli, P. Giacomini, and G. B. Ferrara. 1999. HLA-A, -B, -Cgenotyping and expression in human nonlymphoid tumor cell lines. J. Immu-nother. 22: 7–15.
31. Pollack, M. S., S. D. Heagney, P. O. Livingston, and J. Fogh. 1981. HLA-A, B,C and DR alloantigen expression on forty-six cultured human tumor cell lines.J. Natl. Cancer Inst. 66: 1003–1012.
32. Martayan, A., M. Fiscella, A. Setini, G. Ciccarelli, R. Gambari, G. Feriotto,A. Beretta, A. G. Siccardi, E. Appella, and P. Giacomini. 1997. Conformation andsurface expression of free HLA-CW1 heavy chains in the absence of �2-micro-globulin. Hum. Immunol. 53: 23–33.
33. Hammer, G. E., F. Gonzalez, M. Champsaur, D. Cado, and N. Shastri. 2006. Theaminopeptidase ERAAP shapes the peptide repertoire displayed by major histo-compatibility complex class I molecules. Nat. Immunol. 7: 103–112.
34. Chang, S. C., F. Momburg, N. Bhutani, and A. L. Goldberg. 2005. The ERaminopeptidase, ERAP1, trims precursors to lengths of MHC class I peptides bya “molecular ruler” mechanism. Proc. Natl. Acad. Sci. USA 102: 17107–17112.
4879The Journal of Immunology
by guest on March 23, 2014
http://ww
w.jim
munol.org/
Dow
nloaded from
Copyright © 2022 FDOKUMEN