Exploring the ancillary benefits of the Kyoto Protocol for air pollution in Europe
17
Energy Policy 34 (2006) 444–460 Exploring the ancillary benefits of the Kyoto Protocol for air pollution in Europe D.P. van Vuuren a, , J. Cofala b , H.E. Eerens a , R. Oostenrijk a , C. Heyes b , Z. Klimont b , M.G.J. den Elzen a , M. Amann a a RIVM, National Institute for Public Health and the Environment, P.O. Box 1, 3720 BA Bilthoven, The Netherlands b IIASA, International Institute for Integrated System Analysis, Austria Abstract An integrated approach to climate change and regional air pollution can harvest considerable ancillary benefits in terms of environmental impacts and costs. This is because both problems are caused to a large extent by the same activity (fossil fuel combustion). Substantial ancillary benefits were found for regional air pollution (SO 2 , NO x , VOC and particulate matter) of implementing the Kyoto Protocol (intended to control greenhouse gas emissions) in Europe. For instance, while three different scenarios on Kyoto implementation were found to reduce European CO 2 emissions by 4–7%, they also reduced European emissions of SO 2 by 5–14% compared with a no Kyoto policies case. The magnitude of ancillary benefits depends on how flexible mechanisms and surplus emission allowances are used in meeting the Kyoto targets. The total cost savings for implementing current policies for regional air pollution of the Kyoto Protocol are of an order of 2.5–7 billion Euro. In all cases, this is in the order of half the costs of the climate policy (4–12 billion Euro). Using flexible mechanisms reduces emissions of air pollutants for Europe as a whole even further than domestic implementation (e.g. 10–14% versus 5% for SO 2 emissions), but the reductions are shifted from Western Europe to Central and Eastern Europe and Russia. The use of surplus emission allowances to achieve the Kyoto targets decreases the ancillary benefits, in particular for the latter group of countries (e.g. unprotected area against acidification increases from 1.3 to 1.7 million ha). r 2004 Elsevier Ltd. All rights reserved. Keywords: Co-benefits/ancillary benefits; Kyoto Protocol; Emission trading 1. Introduction Policies aimed at mitigation of environmental impacts in one area can have significant effects on other aspects of environmental quality. Control strategies that look at cost and environmental effectiveness of proposed solu- tions in an integrated way can therefore often prevent inefficient use of resources and implementation of sub- optimal solutions. The Protocol to the Convention on Long-range Transboundary Air Pollution (CLRTAP) to Abate Acidification, Eutrophication and Ground-level Ozone (the so-called Gothenburg Protocol), (UN/ECE 1999) is an example of how several environmental problems can be examined in an integrated way. The emission ceilings adopted in this Protocol were designed to realise important efficiency gains by simultaneously controlling acidification and eutrophication risks, and ground-level ozone concentrations. Important links have also been identified between regional air pollution and climate change, although these are currently still hardly considered in policy- making (e.g., RIVM et al., 2001; Syri et al., 2001; Mayerhofer et al., 2002; Van Harmelen et al., 2002). Links exist because greenhouse gases and regional air pollutants originate to a large extent from the same activity, i.e., fossil fuel combustion. Moreover, ARTICLE IN PRESS www.elsevier.com/locate/enpol 0301-4215/$ - see front matter r 2004 Elsevier Ltd. All rights reserved. doi:10.1016/j.enpol.2004.06.012 Corresponding author. Tel.: +31-30-274-2046; fax: +31-30-274- 4405. E-mail address: [email protected] (D.P. van Vuuren).
Transcript of Exploring the ancillary benefits of the Kyoto Protocol for air pollution in Europe
ARTICLE IN PRESS
0301-4215/$ - se
doi:10.1016/j.en
�Correspond
4405.
E-mail addr
Energy Policy 34 (2006) 444–460
www.elsevier.com/locate/enpol
Exploring the ancillary benefits of the Kyoto Protocolfor air pollution in Europe
D.P. van Vuurena,�, J. Cofalab, H.E. Eerensa, R. Oostenrijka, C. Heyesb,Z. Klimontb, M.G.J. den Elzena, M. Amanna
aRIVM, National Institute for Public Health and the Environment, P.O. Box 1, 3720 BA Bilthoven, The NetherlandsbIIASA, International Institute for Integrated System Analysis, Austria
Abstract
An integrated approach to climate change and regional air pollution can harvest considerable ancillary benefits in terms of
environmental impacts and costs. This is because both problems are caused to a large extent by the same activity (fossil fuel
combustion). Substantial ancillary benefits were found for regional air pollution (SO2, NOx, VOC and particulate matter) of
implementing the Kyoto Protocol (intended to control greenhouse gas emissions) in Europe. For instance, while three different
scenarios on Kyoto implementation were found to reduce European CO2 emissions by 4–7%, they also reduced European emissions
of SO2 by 5–14% compared with a no Kyoto policies case. The magnitude of ancillary benefits depends on how flexible mechanisms
and surplus emission allowances are used in meeting the Kyoto targets. The total cost savings for implementing current policies for
regional air pollution of the Kyoto Protocol are of an order of 2.5–7 billion Euro. In all cases, this is in the order of half the costs of
the climate policy (4–12 billion Euro). Using flexible mechanisms reduces emissions of air pollutants for Europe as a whole even
further than domestic implementation (e.g. 10–14% versus 5% for SO2 emissions), but the reductions are shifted from Western
Europe to Central and Eastern Europe and Russia. The use of surplus emission allowances to achieve the Kyoto targets decreases
the ancillary benefits, in particular for the latter group of countries (e.g. unprotected area against acidification increases from 1.3 to
1.7 million ha).
r 2004 Elsevier Ltd. All rights reserved.
Keywords: Co-benefits/ancillary benefits; Kyoto Protocol; Emission trading
1. Introduction
Policies aimed at mitigation of environmental impactsin one area can have significant effects on other aspectsof environmental quality. Control strategies that look atcost and environmental effectiveness of proposed solu-tions in an integrated way can therefore often preventinefficient use of resources and implementation of sub-optimal solutions. The Protocol to the Convention onLong-range Transboundary Air Pollution (CLRTAP) toAbate Acidification, Eutrophication and Ground-level
e front matter r 2004 Elsevier Ltd. All rights reserved.
pol.2004.06.012
ing author. Tel.: +31-30-274-2046; fax: +31-30-274-
ess: [email protected] (D.P. van Vuuren).
Ozone (the so-called Gothenburg Protocol), (UN/ECE1999) is an example of how several environmentalproblems can be examined in an integrated way. Theemission ceilings adopted in this Protocol were designedto realise important efficiency gains by simultaneouslycontrolling acidification and eutrophication risks, andground-level ozone concentrations.
Important links have also been identified betweenregional air pollution and climate change, althoughthese are currently still hardly considered in policy-making (e.g., RIVM et al., 2001; Syri et al., 2001;Mayerhofer et al., 2002; Van Harmelen et al., 2002).Links exist because greenhouse gases and regionalair pollutants originate to a large extent from thesame activity, i.e., fossil fuel combustion. Moreover,

ARTICLE IN PRESS
1The actual calculations for the climate policies are done using
global models based on 17 world regions. The WE region includes
EU15, Switzerland, Norway and Iceland. The CE region includes the
new EU member states (except Cyprus and Malta), Bulgaria and
Romania, and the Balkan countries. Finally, the EE region includes
Belarus, Moldova, Russian Federation and Ukraine. For Russia,
energy consumption and emissions are reported only for the European
part (west of the Urals) as covered by the EMEP region.
D.P. van Vuuren et al. / Energy Policy 34 (2006) 444–460 445
reduction options for each of the gases can affect theemissions of other pollutants, either beneficially oradversely. Finally, the pollutants interact within theenvironmental system. Some substances directly influ-ence both climate change and regional air pollution as,for instance, sulphur dioxide (SO2) and nitrogen oxides(NOx). There are also more indirect effects such as theimpacts of climate change on weather patterns, impact-ing the atmospheric transport and deposition ofpollutants and the buffering capacity of soils (Posch,2002). Despite these linkages, both types of problemshave, to date, usually been explored separately usingdifferent tools and models, concentrating on differenttechnical solutions. While analysis of greenhouse gasmitigation focuses generally on changes in the energysystem, the analysis of mitigation of atmosphericpollutants concentrates mostly on end-of-pipe technol-ogies.
Recently, several studies have been published onthe linkages between climate change and regionalair pollution in Europe. All those studies indicatedthat a considerable share of investments in climatepolicies can be recovered by lower costs of air pollutioncontrol (generally in the order of 20–30% or higher;see also Section 5) (van Vuuren and Bakkes, 1999;RIVM et al., 2001; Brink, 2002; Van Harmelen et al.,2002). The reason is that the reduction of carbon dioxide(CO2) emissions through structural changes in theenergy sector also reduces the emissions of airpollutants. Of these studies, only that of RIVM et al.looked specifically into the consequences of imple-menting the Kyoto Protocol—but for WesternEuropean only and without properly accountingfor emission trading. In reality, there are severalways the protocol can be implemented, a crucialdifference being the question whether the target isachieved through domestic measures only or (partly)by using the so-called Kyoto Mechanisms (i.e. JointImplementation, Clean Development Mechanismand Emission Trading). Clearly, this also affectsthe potential ancillary benefits for air pollution(emissions, control costs and environmental impacts).To date, studies have not addressed this importantissue.
The objective of our paper is to explore the emissionreductions of air pollutants and change in control costsand environmental impacts resulting from differentways in which the Kyoto Protocol is implemented inEurope, in particular with regard to the use of KyotoMechanisms. The results presented are of a descriptive‘what-if’ character and do not intend to be prescriptivefor any future implementation of the Protocol and airpollution policies. The discussion will focus primarily onthree country grouping/regions. These are: WesternEurope (WE), Central Europe (CE) and Eastern Europe(Ukraine, Moldova, Belarus and Russia, west of the
Ural, EE).1 Calculations for climate policy are done atthe levels of these regions. The calculations on airpollution policies, in contrast, are done at the nationallevel and aggregated to the regional level. The study isrestricted to carbon dioxide (CO2), leaving the remain-ing five greenhouse gases covered by the Kyoto Protocolun-addressed.
The analysis was performed using three linked modelsthat collectively simulate different ways of achieving theKyoto targets for climate change and targets forcontrolling regional air pollution. Section 2 describesthe methodology, scenarios and the models used, whileSection 3 discusses the baseline scenario. Section 4presents the results of three mitigation scenarios.Finally, Sections 5 and 6 discuss the results and drawconclusions. More details of this study can be found invan Vuuren et al. (2003).
2. Methodology
In other to assess the potential impacts of differentways to implement the Kyoto Protocol in Europe, threeclimate policy scenarios have been developed. Thescenarios are compared to a baseline scenario, whichassumes no new climate policies. For this analysis,several models that have so far been used independentlyhave been linked. The results of the study are intendedas explorative in ascertaining the ancillary benefits inlarger European regions.
In analysing the co-benefits of climate policies, at leastthree cases can be explored:
�
Emissions of air pollutants (e.g. SO2) are held at thelevel of a reference scenario (mostly the baselinescenario without climate policies). In such a case, co-benefits are substantiated in terms of reduced costs ofachieving these air pollutant emission levels.�
The technologies introduced to control air pollutionlevels are held at the level of a reference scenario. Insuch a case, co-benefits exist in terms of emissionsreductions.�
The co-benefits are determined on the basis of existingpolicies. For European countries, the most relevantpolicies are the air pollution emission targets underthe Gothenburg Protocol and the EU NationalEmission Ceilings Directive. In our baseline (withoutclimate policies) we have assumed these targets to be
ARTICLE IN PRESSD.P. van Vuuren et al. / Energy Policy 34 (2006) 444–460446
achieved, if required by additional investments intoair pollution control. In this case, introduction ofclimate policies results in (a) cost savings as long asmeeting the targets still requires additional invest-ments and (b) additional environmental benefits if thetargets are already met by existing policies and theinduced changes by climate policies alone. Thissituation differs from country to country.
The third case is explored in this article as its the mostrelevant policy in the European situation. As a result,co-benefits are mostly obtained in terms of reduced costsfor air pollution control, but partly also throughreduced emission of air pollutants.
2.1. Scenarios explored
The Kyoto Protocol and the Marrakesh Accordsprovide for three mechanisms that parties may use inaddition to domestic implementation to facilitatecompliance with their commitments. These mechanismsare: Joint Implementation (JI), Clean Development
Mechanism (CDM) and Emission trading (ET).2 Currentemission projections suggest that within Europe im-plementation of the Kyoto Protocol will requiresignificantly more abatement effort by the countries inWestern European region than in the Central andEastern European regions (EEA, 2002a). As a result, theWestern European region may use the Kyoto Mechan-isms to benefit from low-cost reduction options in otherEuropean regions. A special issue here is the possibilityfor trade in so-called ‘surplus emission allowances’(from now on referred to as surplus allowances) (see alsoden Elzen and de Moor, 2002). The emissions of mostcountries with economies in transition have substan-tially declined since 1990 and, as a result, the expectedbaseline emissions (without additional climate policies)of several of these countries in the First CommitmentPeriod (2008–2012) are significantly lower than theKyoto targets. According to the provisions of the KyotoProtocol, these surplus allowances can be traded toother parties. In fact, after the rejection of the Protocolby the USA in 2001, the total required reduction ofparticipating countries under most conceivable baselinescenarios is smaller than the total available surplusallowances in Central Europe and Eastern Europe. Insuch a case, theoretically, only trading these allowances
2JI allows Annex-1 countries to invest in projects to reduce GHG
emissions in other Annex-1 countries. The achieved emission reduction
units can be used to fulfil the reduction commitments of the investing
Party. The CDM does the same, but now between Annex-1 countries
and non-Annex-1 countries. Finally, ET allows Annex-1 countries to
trade emission allowances among themselves. The conditions of the use
of these instruments (i.e. criteria that need to be met) have been
developed within the Kyoto Protocol and are available in the related
documents.
would be enough to implement the Protocol. In reality,however, this would not be an attractive strategy for thecountries selling emission credits, as this could drive thecarbon price to zero. According to the provisions of theKyoto Protocol, the surplus allowances can be traded toother parties but can also be banked, i.e. held for use inthe years subsequent to the First Commitment Period.Several studies have indicated that banking of surplusallowances could be an attractive strategy for sellingcountries in order to maximise their revenues (den Elzenand de Moor, 2002).
Obviously, the use of Kyoto Mechanisms will notonly have important implications for the total costs ofimplementing the Kyoto Protocol, but also for theancillary benefits. In principle, the use of KyotoMechanisms will shift ancillary benefits to those regionswhere measures are implemented. The use of surplusallowances, however, will not result in any ancillarybenefits. This means that there are important trade-offsfrom the design of climate policies for the overallefficiency and effectiveness of Europe’s environmentalpolicies. In order to assess these, three different(hypothetical) climate policy scenarios are analysed inthis paper.
(1)
Domestic action: assumes that Kyoto targets are metsolely through domestic implementation, allowingonly for internal emission trading (i.e..within eachregion, such as Western Europe).(2)
Restricted trade: This case assumes full use of theKyoto mechanisms, but without using surplusallowances.(3)
Normal trade: Also, this case assumes full use ofKyoto mechanisms, but allows trading of surplusallowances. The use of surplus allowances is chosenat a level that maximises the revenues from theirtrade for the Central and Eastern European regions.This ‘‘optimal’’ level of trading has been determinedby model analysis (compare den Elzen and deMoor).In the first scenario, co-benefits are expected to occurmainly in the Western European region, the region thatalso experiences the highest costs of climate policies. Inthe second and third scenarios, some of the ancillarybenefits will have shifted to the other European regions,while ancillary benefits in the Western European regionare expected to be less. As the second scenario avoidsthe use of surplus allowances, this scenario could beindicative of the maximum amount of ancillary benefitsunder trading assumptions. The third scenario is a morecost-optimal scenario (and arguably more most realis-tic). Comparing the results of this scenario against thoseof the second allows us to assess the consequences ofincluding surplus allowances in climate policies, in termsof abatement costs and ancillary benefits. It should be

ARTICLE IN PRESS
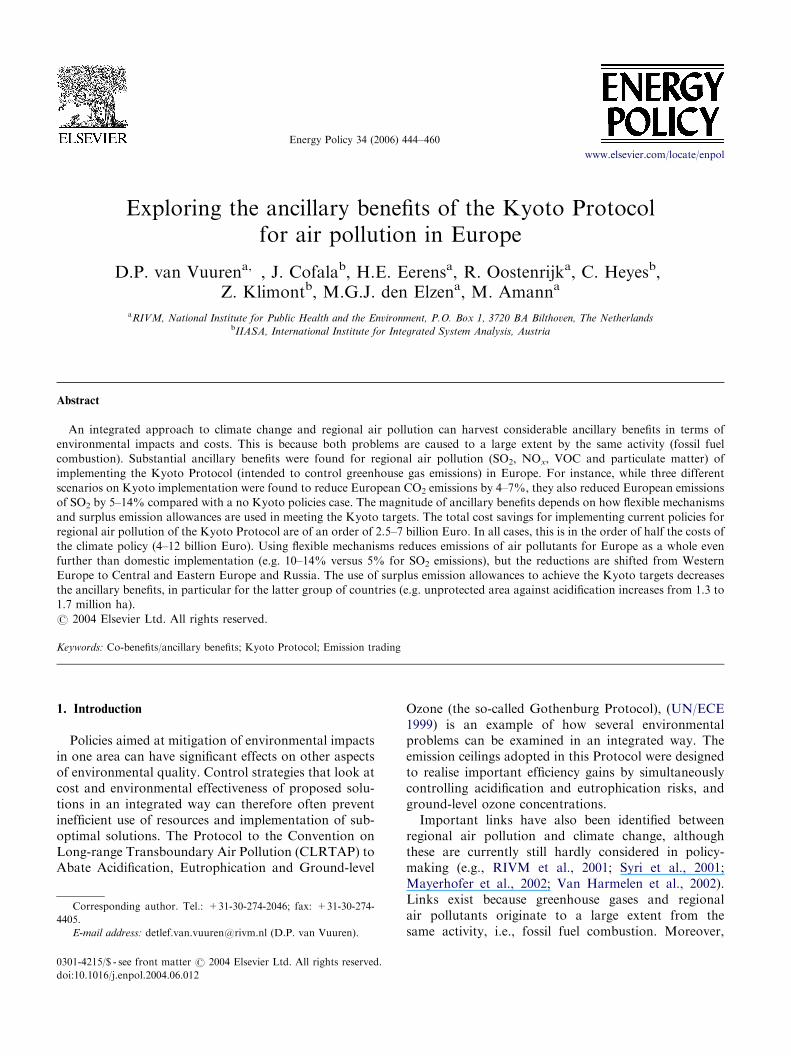
SO2,, NOx, NH3, PM10AcidificationEutrophicationOzone
Conversionto country levelTIMER
FAIR
RAINS
CO2
baseline regional GHGreduction
energy productionand consumption
Fig. 1. Overview of the models used in this study.
D.P. van Vuuren et al. / Energy Policy 34 (2006) 444–460 447
noted that the reduction of CO2 emissions are not thesame in all scenarios as a result of CDM and use ofsurplus allowances (see Section 4).
In all scenarios we included the provisions of theMarrakesh Accords on carbon sinks. Based on aseparate analysis, we assumed that the Annex-I coun-tries could use a total of sinks credits3 of 440 Mt CO2, ofwhich 270 Mt CO2 is used by the regions included in ourstudy (see den Elzen and de Moor, 2002). Our analysisconcentrates exclusively on the reduction of CO2
emissions, which is the most important greenhousegas. The Kyoto Protocol, however, refers to the total setof six greenhouse gases (also CH4, N2O, HFCs, PFCsand SF6), and allows for substitution among them.Other studies (e.g., Lucas et al.) indicate that controlcosts for non-CO2 gases for moderate reductions couldbe lower than those for CO2. Thus, under an optimalreduction strategy, reduction rates for CO2 might belower than the overall reduction targets. In such a casethe ancillary benefits could be somewhat different fromthose presented here.4 However, it is not expected thatthis will change the qualitative conclusions of ourresearch.
2.2. Model framework used
This study integrates the different research areas bylinking models that address climate change issues (theclimate policy model FAIR and the energy modelTIMER)5 and regional air pollution (RAINS) (Fig. 1).Appendix A provides some descriptions of each of themodels and their linkages.
Within the total framework, first the global energysystem model TIMER (de Vries et al. was used todetermine the changes in energy (and thus CO2
emissions) under the baseline scenario (see Section 3).Next, on the basis of these emissions and a set ofmarginal abatement curves for CO2 per region, thereduction and abatement costs submodel of the FAIRmodel (den Elzen and Lucas, 2003) was used todetermine the level of (domestic) action and use ofKyoto Mechanism required in each region to meet theKyoto targets under each scenario (see for a descriptionof this model the marginal abatement curves and adetailed description of results under comparable scenar-ios (den Elzen and de Moor, 2002)). The basic
3Activities covered by Articles 3.3 and 3.4 of the Kyoto Protocol and
agricultural management and sinks under the CDM; for details see den
Elzen and Lucas (2003).4The consequence could be that there will be fewer changes in the
energy system, and therefore less impact on sulphur and nitrogen oxide
emissions. At the same time, the increased reductions in CH4 (as a
greenhouse gas) will impact the levels of tropospheric ozone.5Both FAIR and TIMER constitute part of the IMAGE 2.2
framework (Integrated Model to Assess the Global Environment)—a
modelling framework to study global change issues.
assumption here is that, based on the marginal abate-ment curves, regions will implement a least-costapproach, choosing to use Kyoto Mechanisms if costsoutside their region are lower, unless constrained byspecific rules to emission trading.
Next, the TIMER model (de Vries et al.) implementsthe outcomes of FAIR in terms of regional emissions byintroducing price signals (a tax on CO2). In response tothe carbon tax, the model generates several responses,investments in energy efficiency, fossil fuel substitution,and extra investments in non-fossil options such aswind/solar energy, nuclear energy and biofuels. Theselead to changes in the energy system (mitigationscenarios).
Finally, the RAINS model calculates emissions of airpollutants (SO2, NOx, VOC, PM10 and NH3) for thescenarios based on the outputs of TIMER and explorestheir environmental impacts and emission control costs.In these calculations, RAINS optimises air pollutantemissions for acidification, eutrophication and forma-tion of ground-level ozone, while at the same time alsoemissions of particulate matter (PM) from anthropo-genic sources are estimated. In each scenario, theRAINS model meets the emission standards set underthe Gotenborg Protocol and the EU National EmissionCeilings Directive, by means of a cost-minimal combi-nation of measures, taking into account regionaldifferences in emission control costs and atmosphericdispersion characteristics.
Some assumptions needed to be made to link inputsand outputs of these models. As TIMER and FAIRmodels, in principle, use a similar regional breakdowndata could be easily transferred between these models.Some minor assumptions needed to be made to dealwith the non-Annex I parts of the Former Soviet Unionregion of TIMER as described in Appendix A. The linkbetween RAINS and TIMER requires a more elaborateprocedure. While RAINS requires energy activity levelson a country basis, the TIMER model calculates energyuse for three large regions in Europe. In terms of fueltypes too, the RAINS model is more detailed thanTIMER (RAINS recognises various forms of solid(coal) and liquid fuels (oil-based)). Finally, the datasources used to calibrate the model for the base year aredifferent (TIMER is calibrated against IEA data,RAINS uses in addition data from national sources).

ARTICLE IN PRESS
6The impacts are assessed for the year 2010 and include policies as
decided per December 2001.
D.P. van Vuuren et al. / Energy Policy 34 (2006) 444–460448
A downscaling method has been developed to translatethe TIMER energy results into RAINS input, which isdescribed in Appendix A. While using this method, theresults on a country level show very good correspon-dence to country-based projections, indicating that themethod for downscaling was functioning well (vanVuuren et al., 2003).
2.3. Comparing control costs from TIMER and RAINS:
compatibility of costs calculated by different models
Estimating costs of future policies is beset withuncertainties. This is already an important issue whencomparing costs from different studies within oneresearch domain—but even more so when comparingcost calculations from different areas. Some of thedifferences between different studies result from meth-odological differences, others simply reflect the uncer-tainties we are facing (see also IPCC, 2001). A practicalcause of differences is the use of different costs concepts(e.g. welfare loss and the change in energy system costs,compare Syri et al., 2001)). But, in addition, there are alarge number of other factors that can influence costcalculations such as assumptions about substitutabilityof fuels and technologies, assumptions on the use ofKyoto Mechanisms, technology development, the cover-age of the study, etc. As a result, cost estimates forimplementing the Kyoto Protocol in Western Europerange from several billions to even more than a hundredbillion Euro (IPCC, 2001).
The cost estimates of CO2 policies presented in thispaper are based on the results of the TIMER model.They are calculated using the carbon tax that is requiredto reach the specific reduction target in each region.Costs are calculated by determining the integral ofemission reductions and the carbon tax. The cost is notdirectly related to the costs of a single measure, becauseeach option induces changes in the costs of otherparts of the system. In contrast, RAINS calculates,for a given energy scenario, the costs of impleme-nting technologies that limit the emissions of airpollutants. The assumptions used for cost calculationsin RAINS and the appropriate databases are describedin various documents (see Cofala et al., 2002). InRAINS, no effect of technology development has beenaccounted for.
Theoretically, adding the control costs, as estimatedby TIMER and RAINS, should yield total technicalcosts of an integrated CO2 and air pollution controlpolicy. However, as seen above, the two models usedifferent databases and cost concepts. It was notpossible to do in the context of this aricle a fullcomparison of the costs calculations. This means thatthe costs calculated by the two models should not besimply added up. However, in the discussion section ofthis article, we will show that the costs calculations of
each model comply well to other estimates with itsrespective research domain (climate policy for TIMERand air pollution control policies for RAINS). More-over, we will also show that the TIMER calculationsalso compare well with those of Blok et al. (2001), astudy that estimates costs in a similar, bottom-upmanner as the RAINS model. We therefore concludethat the results can be used for qualitative assessmentand identification of the directions of changes in costs ofpolicies and indicate the possible orders of magnitude ofancillary benefits. In Section 5, we will pay moreattention to this issue.
3. The baseline scenario for CO2 emissions and air
pollution in Europe for 2010
The baseline scenario of this study assumes no newpolicies to control greenhouse gas emissions, butincludes the emission ceilings for regional air pollutantsthat have already been decided upon (i.e. nationallegislation (CLE)6 and the emission ceilings from the EUNational Emission Ceilings Directive and from theGothenburg Protocol to the CLRTAP). In terms ofsocio-economic trends (compare Table 1), the baseline ischaracterised by a continuation of trends that weredominant during the 1990s: increasing globalisation,further liberalisation and average assumptions forpopulation growth, economic growth and technologydevelopment. The baseline is in principle consistent withseveral other scenarios currently used for Europeanassessments (Capros, 1999; Criqui and Kouvaritakis,2000; IMAGE-team, 2001; EEA, 2002b). Table 2 showsthe resulting total primary energy demand by fuel type.In Western Europe, the scenario results in a slow,continuous increase of absolute and per capita energyuse. Natural gas shows by far the fastest growthrates—but oil remains the most important energycarrier. The share of coal further declines. In CentralEurope and Eastern Europe, the energy use changeddrastically between 1990 and 1995. In Central Europe,under the baseline scenario the historically dominantposition of coal is challenged, both by natural gas(increased use for heating as well as for electricitygeneration) and oil (fast growth of private transport).Total energy use recovers from the low 1995 levels butwill in 2010 only be slightly higher than it was in 1990.In Eastern Europe, natural gas continues to be the mostimportant energy carrier. Coal use further declines,while natural gas and oil grow modestly after 2000 (butstill showing a decline over the whole period). Total2010 energy use in this region remains almost a thirdbelow 1990 level.

ARTICLE IN PRESS
Table 1
Major baseline assumptions
Population (mln) GDP (1995 Euro/cap) Primary energy use (EJ)
1995 2010 AAGR(%) 1995 2010 AAGR(%) 1995 2010 AAGR(%)
WE 384 396 0.2 16250 22771 2.3 57.8 66.7 0.9
CEE 121 121 0.0 2120 4195 4.7 12.8 15.4 1.2
EE 293 298 0.1 1312 1851 2.3 22.6 23.5 0.3
World 5706 6891 1.3 3704 4940 1.9 371 492 1.9
Source: RIVM, TIMER model calculations after disaggregation to country level; WE=Western Europe, CE=Central Europe, EE=Eastern Europe.
(Population and GDP data for Eastern Europe includes the total Former Soviet Union; Energy data covers only the region as defined in footnote 1.)
(AAGR=Annual Average Growth Rate.)
Table 2
Changes in the primary energy demand, baseline and policy scenarios
1990 1995 Baseline 2010 Policy scenarios 2010
DA RT NT
EJ EJ EJ Change from 1990 (%) Change compared to baseline (%)
WE:
Total, of which: 56.4 57.8 66.7 18 �7 �2 �1
Coal 11.7 9.2 6.6 �43 �38 �21 �14
Oil 22.9 23.2 26.3 15 �9 �3 �2
Gas 10.8 13.1 19.3 78 �2 3 3
Other 11.1 12.4 14.5 31 2 0 0
CE:
Total, of which: 15.4 12.8 15.4 0 0 �4 �2
Coal 6.6 5.4 4.2 �36 0 �23 �17
Oil 4.0 3.1 4.0 1 0 �2 0
Gas 3.5 2.9 5.4 53 0 7 6
Other 1.3 1.4 1.9 40 0 1 0
EE:
Total, of which: 30.3 22.6 23.5 �23 0 �9 �5
Coal 4.9 3.0 1.9 �61 0 �32 �26
Oil 7.9 4.2 4.2 �47 0 �9 �6
Gas 14.5 12.6 14.2 �2 0 �7 �3
Other 3.0 2.8 3.1 6 0 �3 �2
Note: DA=Domestic Action, RT=Restricted Trade (no surplus allowances) and NT=Normal Trade (i.e. including surplus allowances; but based
on optimising revenues of supplying countries). WE=Western Europe, CE=Central Europe, EE=Eastern Europe.
D.P. van Vuuren et al. / Energy Policy 34 (2006) 444–460 449
3.1. CO2 and air pollutant emissions
Between 1990 and 1995 the CO2 emissions in Europeas a whole decreased by 10% (from 6.3 to 5.4 Gt CO2)with widely diverging trends in the different regions(Western Europe 1% decrease, Central Europe about20% decrease and Eastern Europe more than 30%decrease). In contrast to these declining trends, emis-sions are expected to grow in the baseline in all regionsbetween 1995 and 2010, driven by the growth in energyconsumption discussed in the previous section. Underthe baseline scenario, the 2010 emissions in WesternEurope will be 8% above 1990 level. The emissions inthe Central and Eastern Europe regions, althoughhigher than in 1995, will remain below the 1990 values
(by 10% and 32%—compare Table 3). Emissions ofCO2 and air pollutants by country for the baseline are tobe found in the report (van Vuuren et al., 2003).
The baseline scenario at the same time indicatessignificant reductions in the emissions of regional airpollutants throughout Europe (Table 3), which is acontinuation of the trend that has been seen in the recentpast. Between 1990 and 1995, the emissions of allpollutants in all three regions considerably decreased.For the whole of Europe, this decrease was approxi-mately 20% for NOx and NH3, 18% for VOC, 38% forSO2 and even 46% for PM10. In Western Europe, themain driver of this decrease was the implementation ofadd-on control technologies and low sulphur fuels, andto a lesser extent structural changes in the energy

ARTICLE IN PRESS
Table 3
Air emissions 1990–2010: baseline and climate policy scenarios (CO2 in million tons, other pollutants in kt)
Policy scenarios 2010
1990 1995 Baseline 2010 DA RT NT
Change from 1990 (%) Change compared to baseline (%)
WE
CO2 3311 3267 3565 8 �12 �4 �3
SO2 16,402 10,254 3153 �81 �15 �7 �4
NOx 13,769 11,796 6617 �52 �7 �3 �1
VOC 14,695 12,332 6697 �54 �1 0 0
PM10 2730 1770 1197 �56 �5 �3 �2
NH3 3726 3433 3177 �15 0 0 0
CE
CO2 1123 914 1008 �10 0 �8 �5
SO2 11,795 8404 3785 �68 0 �16 �11
NOx 3919 3199 2256 �42 0 �7 �4
VOC 2916 2494 2289 �22 0 �2 �1
PM10 2360 1177 768 �67 0 �9 �7
NH3 1608 1137 1367 �15 0 0 0
EE
CO2 1869 1259 1284 �32 0 �11 �5
SO2 9758 4751 2833 �71 0 �19 �15
NOx 5846 3886 4001 �32 0 �12 �8
VOC 5124 3840 3778 �26 0 �6 �4
PM10 3945 1954 1276 �68 0 �7 �6
NH3 2277 1530 1686 �36 0 0 0
Total Europe
CO2 6303 5440 5852 �7 �7 �6 �4
SO2 37,955 23,409 9771 �74 �5 �14 �10
NOx 23,534 18,881 12,874 �45 �4 �6 �4
VOC 22,735 18,666 12,764 �44 �1 �2 �2
PM10 9035 4901 3241 �64 �2 �6 �4
NH3 7611 6100 6260 �18 0 0 0
Source: CO2 emissions: FAIR/TIMER; other pollutants: RAINS.
Note: DA=Domestic Action, RT=Restricted Trade (no hot air) and NT=Normal Trade (i.e. including hot air; but based on optimising revenues of
supplying countries). WE=Western Europe, CE=Central Europe, EE=Eastern Europe.
D.P. van Vuuren et al. / Energy Policy 34 (2006) 444–460450
system.7 In case of the Central and Eastern Europeanregions, a large proportion of emissions reduction wasachieved through a decrease in energy demand andagricultural production due to economic restructuring.In addition, in some candidate countries (CzechRepublic, Hungary, Poland and Slovenia) add-oncontrols on SO2 and PM sources played an importantrole in emission reduction.
Under the baseline, total European emissions of SO2
decrease up to 2010 by 74% compared with 1990. Thecorresponding reductions of NOx and VOC are 45%and 44%. Finally, PM10 emissions are reduced by 64%.It should be noted that, for Western Europe andcandidate countries belonging to the Central Europeanregion, the main part of emissions reductions is achievedas a result of implementing the revised EU legislation
7The exception is the eastern part of Germany where closing down
obsolete plants and economic reform played a major role in emissions
reduction.
(standards on mobile sources, revised Large Combus-tion Plant Directive, Solvent Directive, etc.). In EasternEurope the reductions occur mainly through economicrestructuring and a switch to cleaner fuels. Abatementmeasures play a less important role in these countries.
3.2. Emission control costs
The cost of controlling all air pollutants in theBaseline Scenario for the whole of Europe will increaseto about h 89 billion per year in 2010 (Table 4). About57% of the total costs are the costs of controllingemissions from mobile sources (road and off-roadtransport). Costs of PM controls from stationarysources contribute about 11% and the costs of SO2,21% to the total. The Western European region bears81% of total European costs, the reasons being the largecontribution of the region to total European emissionsin the base year and the more stringent emission controlthan in other parts of Europe. Implementing the EU

ARTICLE IN PRESS
Table 4
Annual air pollution control costs for the Baseline Scenario (1995 prices)
Region Cost (billion Euro/year) Distribution of control costs (%)
SO2 NOx+VOCa NH3 PM10a Mobile sources
WE 72 22 11 1 8 59
CEE 14 14 2 7 15 61
EE 3 35 2 1 63 0
TOTAL 89 21 9 2 11 57
Source: IIASA (RAINS model).
Note: WE=Western Europe, CE=Central Europe, EE=Eastern Europe.aOnly stationary sources.
D.P. van Vuuren et al. / Energy Policy 34 (2006) 444–460 451
legislation by the candidate countries will increase thecontrol costs in Central Europe. Compared with thelegislation from the mid-90s, the costs for candidatecountries will more than double. More than a half of(rather low) air-pollution control costs in EasternEurope are the costs of dust control equipment(cyclones, electrostatic precipitators) used on largerstationary sources. Other costs for Eastern Europeresult from the necessity to comply with the emissionand fuel standards, as specified in the 2nd SulphurProtocol to CLRTAP.
9The AOT60 value indicates a cumulative exceedance of ozone of
3.3. Regional environmental impacts
Implementation of emission controls as assumed inthe Baseline will significantly increase the area ofecosystems protected against acidification and eutrophi-cation.8 For acidification, the share of unprotectedecosystems decreases from 16.1% in 1990 (93.4 millionha) to 1.5% in 2010 (8.7 million ha)—see Table 5.However, in spite of such an impressive improvement ata regional level, there will still be countries where a highproportion of their ecosystems will achieve atmosphericdepositions above their critical loads (compare vanVuuren et al., 2003). To these countries belong: TheNetherlands (49% of ecosystems unprotected), Belgium(15%), Hungary (13%) and Germany, Norway and theUK (9–10% ecosystems not protected). The areas withexcess deposition of nutrient nitrogen (which is respon-sible for eutrophication of ecosystems) decrease forEurope as a whole from 30.5% in 1990 (166 million ha)to 18.8% in 2010 (103 million ha). Nevertheless,relatively large areas remain unprotected from eutro-phication, in particular, those in the Central Europeanregion (more than 57% of ecosystems’ area). Develop-ments according to the baseline scenario will alsosubstantially reduce population exposure to elevatedozone levels (Table 5). The average exposure of a person
8Ecosystems are assumed to be protected against acidification if the
total acidifying deposition is below the critical load. A similar
definition holds for eutrophication.
in Europe (as measured by the so-called AOT60 value)will decrease from 2.3 ppm hours in 1990 to 0.6 ppmhours in 2010.9 However, this also means that in 2010the guidelines of the World Health Organisation will stillbe exceeded. Similarly, as for health effects, the situationwill also improve for vegetation, although at a some-what slower pace (the exposure index for the wholeEurope (as measured by the so-called AOT40 value)decreases from 4.1 excess ppm hours in 1990 to 2.0excess ppm hours in 2010).
4. Kyoto scenarios and ancillary benefits for regional air
pollution
Different ways of implementing the Kyoto Protocolresult in different CO2 reductions. Fig. 2 and Table 6illustrate these differences for three European regions(for completeness also the reductions of the otherAnnex-I countries (OA-I=Canada, Japan, Australiaand New Zealand) are shown. In the Domestic Action
scenario, of the European regions only Western Europeneeds to reduce its CO2 emissions. As a percentage ofthe 1990 emissions, the required reduction from baselineis 15% point (from 8% above the 1990 level to 7%below). About 13% point is achieved by domesticmitigation in the energy system. The balance (2% point)is assumed to be achieved by carbon sinks as indicatedin Section 2 (see also den Elzen and Lucas, 2003).Energy system CO2 reduction measures are enhancedenergy efficiency and changes in the electricity produc-tion structure. In the latter case a switch from coal toless carbon-intensive generation options occurs. Inaddition, some fuel substitution also takes place in theend-use sectors. The total response in the transportsector is small.
the critical (damage) thresholds for human health (60 ppb). Similarly,
the AOT40 value indicates a cumulative exceedance of the critical
(damage) thresholds for terrestrial vegetation (40 ppb). More details
about the indicators used can be found in Cofala et al. (2002).

ARTICLE IN PRESS
Table 5
Environmental impact, baseline and climate policy scenarios
Region Baseline Policy scenarios 2010
1990 2010 DA RT NT
Acidification (million ha unprotected)
WE 42.9 6.5 5.9 6.0 6.2
CE 18.2 0.6 0.6 0.4 0.5
EE 32.3 1.6 1.6 0.9 1.2
Europe 93.4 8.7 8.1 7.3 7.9
Eutrophication (million ha unprotected)
WE 71.4 48.2 46.7 47.2 47.4
CE 38.4 27.7 27.3 27.0 27.2
EE 56.2 26.8 26.5 24.4 25.2
Europe 166.0 102.7 100.5 98.6 99.8
Health-related ozone (AOT60, ppm hours)
WE 3.42 0.95 0.92 0.93 0.94
CE 1.64 0.34 0.32 0.29 0.30
EE 0.43 0.06 0.05 0.03 0.04
Europe 2.30 0.60 0.57 0.57 0.58
Vegetation-related ozone (AOT40, excess ppm hours)
WE 6.30 3.26 3.15 3.20 3.23
CE 6.00 2.85 2.77 2.67 2.74
EE 1.50 0.74 0.73 0.61 0.65
Europe 4.10 2.04 1.98 1.93 1.97
Source: IIASA (RAINS model).
Note: DA=Domestic Action, RT=Restricted Trade (no hot air) and NT=Normal Trade (i.e. including hot air; but based on optimising revenues of
supplying countries). WE=Western Europe, CE=Central Europe, EE=Eastern Europe.
Fig. 2. Implementation of the Kyoto targets in the three European regions and other Annex-1 countries (Canada, Japan, Australia and New
Zealand) according to: (a) the Domestic Action scenario (DA), (b) restricted trade (without the use of surplus emissions allowances, RT), and (c)
trade with optimal banking of sulphur emission allowances, NT).
D.P. van Vuuren et al. / Energy Policy 34 (2006) 444–460452
In the Restricted Trade scenario (trade without the useof surplus allowances), the Western European and otherAnnex-I (OA-I) countries use the Kyoto Mechanisms to
implement their targets. CO2 reduction in WesternEurope, achieved with domestic energy system mea-sures, is now 60% lower and replaced by the use of

ARTICLE IN PRESS
Table 6
CO2 emissions and mitigation action as a percentage of 1990 emissions
WE CE EE Total Europe
DA RT NT DA RT NT DA RT NT DA RT NT
Baseline 108 108 108 90 90 90 68 68 68 93 93 93
Assigned amounts 93 93 93 106 106 106 100 100 100 98 98 98
Reduction measures
Sinks �2 �2 �2 �1 �1 �1
Domestic mitigation (energy system) �13 �5 �3 0 �7 �5 0 �7 �5 �7 �6 �4
SEA (ET) 0 0 �5 0 0 �2
ET/JI (excl. SEA) 0 �5 �3 0 �3 �2
CDM 0 �3 �2 0 �2 �1
Actual emissions 93 101 103 90 83 85 68 61 63 85 86 88
Sales of A.A.U.
SEA (ET) — — — 0 0 �4 0 0 �8 0 0 �1
ET/JI (excl. SEA) — — — 0 �7 �5 0 �7 �5 0 �1 �1
Available for banking 0 0 0 17 17 13 32 32 24 13 13 10
Abbreviations: DA=Domestic Action, RT=Restricted Trade (no hot air) and NT=Normal Trade (i.e. including hot air; but based on optimising
revenues of supplying countries). WE=Western Europe, CE=Central Europe, EE=Eastern Europe. ET/JI: Emission trading and Joint
Implementation. The study does not distinguish between these two instruments. The row on use of Surplus Emission Allowances (SEA) only refers to
emission trading, as JI cannot lead to implementation of SEA. The row ET/JI (excl SEA) refers to the use of Kyoto Mechanisms that leads to actual
physical emission reductions.
CDM: Clean Development Mechanism. A.A.U: assigned amount units.
Note: The Kyoto targets are formulated as percentage reductions from base year. For some sources, the base year can be different from 1990. As a
result, the assigned amount, expressed as percentage of 1990 emissions, can differ from those expressed as percentage of the base year emissions. This
is in particular the case in the CE region (6% increase versus a 7% reduction). In the WE region, the differences between 1990 and base year
emissions and the higher assigned amounts (as percentage) of Switzerland, Norway and Iceland result in an assigned amount of 93% of 1990
emissions (instead of 92% for the European Union compared to base year). The EE region only covers the part of the Russian Federation west of the
Ural. The columns for the total European regions indicate under sales the trade in assigned amount units with Annex-1 regions outside the European
region. Rounding may cause small deviations in sums.
D.P. van Vuuren et al. / Energy Policy 34 (2006) 444–460 453
CDM and emission trading (ET). The latter induces thereductions in Central and Eastern Europe (by 7% and8% of their 1990 emissions, respectively). Total reduc-tions in Europe in this scenario are approximately thesame as in the Domestic Action case. This is the net effectof a decrease in reductions as a result of CDM use byWestern Europe, and an increase in reductions inCentral and Eastern Europe due to emission tradingwith the group of other Annex-I (OA-I) countries.
For the Normal Trade scenario, the optimal level ofsurplus allowances had to be determined first. This hasbeen done using a similar analysis as in den Elzen and deMoor (2002) using the FAIR model. It has beenestimated that countries having surplus allowances(mainly Russian Federation and Ukraine) can maximisetheir revenues by supplying only 25% of the availablesurplus allowances in the First Commitment Period andto ‘bank’ the rest. Compared with the Restricted Trade
case, the use of surplus allowances increases emissiontrading and decreases the need for emission reductionsfrom the energy system. In the Normal Trade scenariothe contribution of energy-system measures is 3% point(of 1990 emissions) in Western Europe, 5% point inCentral Europe and 5% point in the Eastern Europe.About 4/5 of the necessary reductions in WesternEurope is achieved by the Kyoto Mechanisms.
The overall European emissions in this scenario (88%of 1990 level) are higher than in the Domestic Action
case (85%), which is due to the use of surplusallowances. On the scale of Europe as a whole, theemission reductions under the Domestic Action caseamount to 420 Mt CO2. In the Restricted Trade case, it isreduced to 377 Mt CO2 (or 43 Mt less) as a result of thenet balance of CDM use by Western Europe (lowerreductions) and emission trading by other Annex-Icountries (higher reductions). In the Normal Trade case,the net reduction on an European scale amounts to229 Mt CO2 (191 Mt less)—as a result of both emissiontrading and the use of surplus emission allowances.
Table 2 shows the resulting changes in the demand forprimary energy. In the Domestic Action case, thenecessity of reducing carbon emissions in WesternEurope causes a 38% decrease in the use of coal. Theconsumption of oil and gas decreases by 9% and 2%,respectively. This results in a 7% decrease in the totaldemand for primary energy.
Since in the trading scenarios less CO2 needs to bereduced through domestic action, the changes in theenergy system of Western Europe do not need to go sofar. In the Restricted Trade case, Western Europeanenergy demand decreases by 2% and coal use decreasesby 21% from the baseline. Consumption of oil decreases

ARTICLE IN PRESS
0
400
800
1200
1600
DOA TNS TWS DOA TNS TWS DOA TNS TWS
kton
SO
2
WE CE EE
0
400
800
1200
kton
NO
x
WE CE EE
0
100
200
300
kton
PM
10
WE CE EE
Fig. 3. Emissions reduction of regional air pollutants as a result of implementation of the Kyoto protocol (reductions compared to baseline).
10The TIMER model does not separately specify different categories
of biomass for energy (e.g. waste, modern biomass, wood). Therefore,
the assumptions on the use of wood for heat generation have been
taken from the RAINS database and are identical in all scenarios.
Since the use of wood is an important source of PM emissions from the
residential sector, the estimates of the changes in PM emission levels
would be different if the increased direct burning of wood were
included in the CO2 control scenarios.
D.P. van Vuuren et al. / Energy Policy 34 (2006) 444–460454
by 3% but—at the same time—the use of gas increasesby the same percentage. Measures that need to beimplemented in Central Europe and Eastern Europecause a decline in the primary energy demand by 4%and 9%, respectively. This is largely due to a lower useof coal. In the scenario with full use of KyotoMechanisms, including surplus allowances (Normal
Trade), the amount of CO2 reductions from the energysystem is smaller, and therefore the level and structuresof fuel use in all regions are closer to the baseline.Nevertheless, also for that scenario the demand for coalsubstantially decreases.
4.1. Emissions of air pollutants
The right part of Table 3 and Fig. 3 demonstrates howour scenarios of implementing the Kyoto Protocolreduce the emissions of air pollutants in Europe. Theactual size of these ancillary benefits does stronglydepend on the climate policies assumed. In the Domestic
Action scenario, CO2 emission reductions are onlyimplemented in the Western European region. Thus,also the decline in air pollutant emissions is restricted tothat region. The emissions of SO2 decrease strongly as aresult of climate policies, to 15% below the baselinelevels (a similar reduction as that for CO2, the primarytarget of the climate policies). In absolute terms, thisreduction is more than 450 kt, which is comparable withthe Gothenburg Protocol emission ceiling for Italy. Thecorresponding reductions of NOx and PM10 are 7% and5%, respectively.
Compared with the unilateral case (Domestic Action),the total European emissions reductions (and thusancillary benefits) are higher in the trading scenarios(Restricted Trade, Normal Trade) (see Fig. 3). However,since the CO2 reductions in those scenarios are to a largeextent achieved in Central Europe and Eastern Europe,the benefits are shifted to these regions. The strongestimpacts occur for SO2 emissions as a result of switchingfrom coal to gas in power generation and end-usesectors. Reductions of NOx emissions are smallerbecause they mainly occur in sectors where energyefficiency options are implemented. Trading also de-creases the emissions of particulate matter (PM10, 6%
reduction in the Restricted Trade scenario comparedwith 2% for the Domestic Action case),10 while theancillary benefits for VOC emissions are relatively low(about 2% reduction from the baseline).
The introduction of surplus emission allowances onthe market (scenario Normal Trade) results in lessreduction of air pollutants. The reason is that as nowpart of the reduction does not require any physicalaction, fewer changes in the European energy system arenecessary. For instance, the additional reduction ofEuropean SO2 emissions is only 10% instead of 14% inthe Restricted Trade scenario.
4.2. Emission control costs
Table 7 shows the net implementation costs of CO2
reduction measures in Western Europe. In the Domestic
Action scenario, the costs are about 12 billion Euros peryear in 2010. This is the net result of additionalinvestments into energy efficiency and the use of low-carbon or zero-carbon supply options and cost reduc-tions for other conventional power supply, reduced oilimports and reduced production of fossil fuels. If onlythe increased investments into energy efficiency andzero-carbon supply options were accounted for, thecosts increase would be 30 billion Euros per year.
The trade scenarios show that the total costs ofreducing CO2 emissions can be more than halvedthrough the use of flexible mechanisms (see alsoFig. 4). In the Restricted Trade scenario, the costs ofdomestic energy system measures in Western Europedecrease to 2 billion Euros. However, at the same time,about 5 billion would be needed to be spent on permits,so that the total cost of meeting the Kyoto target for thisscenario is 7 billion Euro. In the scenario with ‘SurplusEmission Allowances’ (Normal Trade), the expenditures

ARTICLE IN PRESS
Table 7
Total annual costs in 2010 for reducing CO2 emissions in Western
Europe in line with the Kyoto targets and change in air pollutant
emission control costs (billion 1995 Euro/year)
Region DA RT NT
Climate policies (only WE)
Domestic measures 12 2 1
Permits 0 5 3
Total 12 7 4
Change in air pollution control costs
WE �6.6 �2.9 �1.7
CE 0 �0.9 �0.6
EE 0 �0.2 �0.2
Total �6.6 �4.1 �2.5
Note: DA=Domestic Action, RT=Restricted Trade (no hot air) and
NT=Normal Trade (i.e. including hot air; but based on optimising
revenues of supplying countries). WE=Western Europe, CE=Central
Europe, EE=Eastern Europe.
-10
-5
0
5
10
15
DA RT NT DA RT NT
bill
ion
Eu
ro
EE CE WE
Costs of climate policy
Savings forair pollution control
Fig. 4. Costs of the different climate policy scenario analysed and their
consequent savings for regional air pollution policies (changes
compared to baseline).
D.P. van Vuuren et al. / Energy Policy 34 (2006) 444–460 455
on domestic measures decrease to 1 billion Euro and thecost of permits also decreases to slightly above 3 billionEuros.
The ancillary benefits of CO2 control policies alsooccur in terms of reduced costs of regional air pollution(compare the bottom part of Table 7 and Fig. 4). In theDomestic Action scenario, the expenditures on airpollution mitigation in Western Europe decrease by6.6 billion Euro (or about 9%) from the baseline level.The air pollution control costs are also lower in thetrading scenarios. However, the cost savings are not ashigh as in the domestic action case. For instance, in theRestricted Trade scenario the savings for Western
Europe decrease to 2.9 billion Euros per year. Char-acteristically, there are important cost reductions in thetrading scenarios in the Central and Eastern Europeanregions. For the whole of Europe, the reduction inannual expenditures on air pollution control is about 4.1billion Euros per year in the Restricted Trade scenario.Inclusion of surplus emission allowances reduces theEuropean ancillary benefits to only 2.5 billion Euros peryear.
As mentioned earlier, the cost estimates for climatechange and regional air pollution are not fully compar-able and thus should be treated as an indication ofpossible synergies rather than the quantitative assess-ment. The results, however, clearly demonstrate that thegains in reducing air pollution control costs fromclimate policies can be very substantial. Although theuse of flexible mechanisms reduces these ancillarybenefits, the lowest total costs might still occur for thescenarios with emissions trading.
4.3. Regional environmental impacts
The absolute values of the changes in regionalenvironmental impacts as a result of climate policiesare not high as substantial improvement are alreadyachieved in the baseline (Table 5). For acidification,additional 0.6–1.4 million ha of ecosystem area getsprotected in our scenarios. In case of eutrophication,2.2–4.1 million ha of ecosystems get additionallyprotected. Nevertheless, still about 100 million ha ofEuropean ecosystems remains endangered by eutrophi-cation. Since our climate policies do not changeammonia emissions, achieving higher protection levelsis not possible.
An interesting aspect is the transboundary effects ofregional air pollution—which means that the tradingscenarios that reduce regional air pollutants in otherparts of Europe may indirectly also reduce environ-mental impacts in Western Europe. This can be seen bycomparing the Domestic Action and Restricted Trade
scenarios. In the latter, only a third of the action is takenin WE of that of the former; still the improvement inacidification impacts is almost similar. The strongersulphur reductions in Central Europe per Mt CO2
reduction (coming mostly from less stringent abatementlevels) helps in achieving this result. By the same token,the Domestic Action scenario also improves the environ-mental impact indicators in Central Europe even if noaction is taken in this region. For Europe as a whole, thelargest ancillary benefits are found for the tradingscenarios.
Also for ground level ozone the CO2 mitigationscenarios reduce impact indicators. For Western Eur-ope, the highest reductions occur in the Domestic Action
case (more than 3% reduction of the health-related(AOT60) and vegetation-related (AOT40) exposure

ARTICLE IN PRESSD.P. van Vuuren et al. / Energy Policy 34 (2006) 444–460456
indices compared with the baseline). For Europe as awhole, the highest effects are brought about by theRestricted Trade scenario (5% improvement of bothindices). Similarly as for the Baseline, country-specificindicators can be found in the study by van Vuuren et al.(2003).
5. Discussion
Our paper explores the potential ancillary benefits ofdifferent ways to implement the Kyoto Protocol inEurope by linking models that had previously been usedseparately to study the climate change and regional airpollution policies. A few remarks should be made on theinterpretation of our results. First, at this stage, noattempt has been made to optimise climate change andregional air pollution policies in one integrated frame-work. Before this can be done it is necessary to fullyharmonise the cost concepts used by the differentmodels. Moreover, optimisation will not be straightfor-ward given the different trade-offs within the system.Second, given the preliminary stage of this type ofresearch, climate policies in the analysis concentratedsolely on CO2. In a multi-gas strategy, reduction ratesfor CO2 are likely to be smaller than the averagereduction. In this case, both the costs of climate policiesand the gains for ancillary benefits could be somewhatlower.
Overall, the study clearly shows that implementationof the Kyoto Protocol will have important ancillarybenefits in reducing regional air pollution. This wasfound earlier in studies focusing on Western Europeonly. The results of our Domestic Action (Domestic
Action) scenario can be compared with those studies.The European Environmental Priority study (RIVM etal., 2001) and a related paper (Syri et al., 2001) foundthat reducing the CO2 emissions in Western Europe by15% compared to the baseline (�8% from 1990 level)would reduce SO2 emissions by 24% and NOx emissionsby 8%. In our study, the emission reductions aresomewhat lower (15% for SO2 and 7% for NOx,resulting from a 12% reduction of CO2 emissions),which is due to the inclusion of carbon sinks in thereduction target and different assumptions adopted inthe baseline (higher fuel efficiency of cars according tothe ACEA agreement, stricter emission control legisla-tion resulting from the Gothenburg Protocol and theNational Emission Ceilings and Large CombustionPlants Directives). Another study for the WesternEuropean region used the E3ME model (Barker, 2000)to estimate the possible ancillary benefits of a 10%reduction of the baseline CO2 emissions (domesticimplementation of the Kyoto Protocol). The results(12–14% reduction for SO2, 7–8% for NOx and 4% forPM10) compare well with our results. The differences
can be explained by different CO2 baseline projectionsand the assumptions on policies for regional airpollutants.
In contrast to the earlier studies, this paper alsoencompassed the Central and Eastern European re-gions—and the specific impacts of emission trading. Animportant finding is that the link between the reductionin CO2 emissions and regional air pollution is strongerin these regions than in Western Europe. This is causedby heavy reliance on coal in Eastern Europe and by lessstringent emission control legislation.
According to our calculations, implementation costsof the Kyoto target vary between 12 billion Euro peryear for the domestic action case and 4–7 billion for thetrading scenarios. Overall, the costs presented in thispaper seem to be within the broad range of costestimates by other studies. For instance, a recentdetailed European study (Blok et al., 2001) looking intothe costs of domestic implementation of the KyotoProtocol found costs to vary between 4 and 8 billionEuro, depending on the assumptions about EU-widetrading. Since the study also covered non-CO2 green-house gases (leading to an overall decrease in imple-mentation costs), the costs estimated by Blok et al.(2001) are consistent with the costs calculated here. TheEuropean Environmental Priorities study (RIVM et al.,2001) using the PRIMES model found very similar costsas our estimates for the similar cost concept (13.5 billionEuro/yr for domestic implementation of the KyotoProtocol). However, the total energy system costcalculated by PRIMES is much higher. This couldbe due to the sector-specific market interest rates usedin PRIMES, which for some categories of energyconsumers are quite high. The Priorities study alsoincludes an estimate of the net implementation coststaking into account emissions trading, which is againclose to those found here, i.e. 6.3 billion Euro versus 4–7billion Euro for the two trade scenarios explored in ourpaper.
The results indicate that implementation of the KyotoProtocol will lead to lower costs for regional airpollution control. For the domestic implementation ofKyoto targets in Western Europe, the changes in theenergy system result in a decrease of air pollutioncontrol expenditures by 9% or 6.6 billion Euros peryear. This result suggests that for the domestic actionscenario, about half of the total costs to implement theKyoto target may be regained in terms of reduced costsfor air pollution control. A set of other studies thatlooked into the potential reduction of regional airpollution control vis-a-vis climate control costs alsofound significant cost reductions, although generallysomewhat lower (around 20–30%). These studies coverthe EU (Syri et al., 2001), Netherlands (Smeets andWijngaart, 2002), and the USA (Burtraw and Toman,2000).

ARTICLE IN PRESSD.P. van Vuuren et al. / Energy Policy 34 (2006) 444–460 457
6. Conclusions
Our work resulted in several findings on ancillarybenefits for air pollution in Europe from implementingthe Kyoto Protocol. The most important conclusionsare presented below in conjunction with brief explana-tions indicating the magnitude of potential benefits.
Implementation of the Kyoto Protocol yields substan-
tial ancillary benefits for air pollution in Europe. The
design of climate policies is important for obtaining
ancillary benefits: Implementing the Kyoto Protocol inEurope reduces the emissions of air pollutants andresults in lower exceedances of critical thresholds forecosystems and human health throughout Europe. Infact, the additional emissions reductions (from baseline)for SO2 are mostly larger than those for CO2 (4–15%).For NOx and PM10, somewhat smaller emissionreductions are obtained (2–6%), while the additionalreductions are smallest for VOC (1–2%).
Implementing the Kyoto Protocol also reduces thecontrol costs for air pollutants. In spite of uncertaintiesin cost estimates and differences in cost calculationmethodologies, the results suggest that about 50% of thecosts of the Kyoto target can be re-gained in terms ofreduced costs of air pollution control (i.e. air pollutioncontrol costs reductions of 2.5–6.6 billion Euro/yearversus costs of climate policies of 4–12 billion Euro peryear). Interestingly, the total annual air pollutioncontrol costs expected for 2010 (typically for emissoncontrol technology) are considerably higher than theexpected costs for implementing the Kyoto Protocol(typically for changes within the energy system). As aresult, even modest climate policies (in terms of costs)may have relatively large financial co-benefits in termsof avoiding the most expensive measures for airpollution control. It should be noted that the largershare of the measures taken for climate policies impactthe industry and electric power sector. In contrast, avery large share of the air pollution control costs (about60%) occurs in the transport sector. This means that therelative reduction of air pollution control costs in thestationary sectors could in fact be much larger than theoverall reduction. Moreover, the large potential finan-cial co-benefits in the transport sector may allow forstricter climate policies in this sector than from aperspective of optimising climate control costs only.
The type and size of ancillary benefits depends on if and
how CO2 trading is used: The links between the CO2 andair pollutant emissions are weaker in Western Europecompared to Central and Eastern Europe. This is mainlydue to more stringent air pollution control legislationcompared with the other two regions. As a result, totalEuropean air pollutant reductions can be higher in thescenarios that use the Kyoto flexible mechanisms
compared to the domestic action scenario. In turn,savings on pollution control costs are the highest in theDomestic Action case since structural changes inWestern European energy system induced by the CO2
constraint allow avoiding high-cost air pollution abate-ment measures in this region.
Reaching the Kyoto targets through domestic actiononly limits the ancillary benefits to Western Europe (asonly this region needs to reduce CO2 emissions). Sinceemission trading and joint implementation inducechanges in energy systems in other parts of Europe,trading scenarios shift (‘trade’) ancillary benefits partlyto European regions outside Western Europe. Interest-ingly, however, while in the trading scenarios most ofthe CO2 emission reduction takes place outside WesternEurope, the differences for environmental impacts (inparticular acidification) are much smaller as WesternEurope can partly benefit from the transboundary effectof reducing the pollution levels in Central Europe.
Thus, the results indicate that the use of emissiontrading, provided that they lead to real emission reductionsin Central and Eastern Europe, can lead to a strongerreduction of regional air pollution in Europe. Using CDMwith developing countries foregoes these benefits.
Using surplus emission allowances reduces ancillary
benefits, in particular for the Central and Eastern Europe
regions: Introducing available surplus allowances oncarbon market reduces the need for physical action toreduce CO2 emissions in those regions and, conse-quently, the emissions of air pollutants and their controlcosts are higher. In our scenario with surplus allowan-ces, the SO2 and NOx emissions in Central Europe andEastern Europe are 2–4% higher and the control costsare 1.5 billion Euro/year higher than in the scenario thatexcludes surplus allowances. This might be a furtherimportant reason for the Central European and EasternEuropean countries (in addition to the direct impacts onthe price of CO2 emission permits) to restrict the amountof surplus allowances that is put on the market.
Integrated approach to climate change and regional air
pollution policies is important for harvesting potential
ancillary benefits: The results presented in this paperclearly demonstrate that integrating climate change andregional air pollution policies leads to important efficiencygains. However, further development of tools and methodsis necessary. In particular, the assessment models need tobe extended to non-CO2 greenhouse gases. Also, costingmethodologies used in the analysis need to be unified.
Acknowledgements
The authors would like to thank the EuropeanEnvironment Agency and its ETC—Climate Change

ARTICLE IN PRESSD.P. van Vuuren et al. / Energy Policy 34 (2006) 444–460458
and Air Pollution for their support for this study. Inparticular, this holds for Andreas Barkman, whosecomments and suggestions have been very helpful infinalising the report underlying this paper. We wouldalso like to thank Marcel Berk (RIVM) for hiscomments and ideas during different stages of theproject.
11PM is estimated separately for the fine fraction (PM2.5—particles
with aerodynamic diameter smaller than 2.5mm), coarse fraction
(particles between 2.5. and 10mm) and TSP. The sum of emissions of
fine and coarse fractions (PM10) are also calculated.
Appendix A:. Model description and linkages between the
models
This appendix describes the three models that havebeen used in this exercise and their linkages.
The FAIR 2.0 model
The FAIR 2.0 model (Framework to Assess Interna-tional Regimes for differentiation of future commit-ments) was designed to quantitatively explore theoutcomes of different climate regimes in terms ofpossible environmental and economic impacts (includ-ing emission trading). It is a decision-support tool thatuses expert information from more complex models (inparticular, IMAGE), such as baseline emissions andmarginal abatement costs curves. The basic assumptionof the model is that regions will reach their emissionreduction commitments on the basis of least cost. Thesecosts are calculated using marginal abatement cost(MAC) curves, which reflect the additional costs ofreducing the last unit of carbon. These MACs allow anassessment of the willingness of any party to buy permitsor to abate more than is required to meet the Kyotocommitment and sell permits. Extensive documentationof the FAIR model can be found in Elzen and Lucas(2003).
The TIMER model
The global energy system model, TIMER (TargetsIMage Energy Regional Model), has been developedto simulate (long-term) energy baseline and mitigationscenarios. The model describes the investments in,and the use of, different types of energy optionsinfluenced by technology development (learning-by-doing) and resource depletion. Inputs to the modelare macro-economic scenarios and assumptions ontechnology development, preference levels and restric-tions to fuel trade. The output of the model demon-strates how energy intensity, fuel costs and competingnon-fossil supply technologies develop over time. InTIMER, implementation of CO2 mitigation is generallymodelled on the basis of price signals (a tax on carbondioxide). In response to the carbon tax, the modelgenerates several outputs, i.e., investments in energyefficiency, fossil fuel substitution, and extra investments
in non-fossil options such as wind/solar energy, nuclearenergy and biofuels. The model does not account forany feedback from the energy system to economicdrivers. It should be noted that in TIMER costs arenot related to the implementation of one single measure,as it implementation changes also other parts of thesystem. Investing in energy efficiency, for instance,reduces the costs of energy production and alsoaccelerates the learning of energy-efficiency technology.Costs of air pollution control equipment are notincluded in the energy system costs of TIMER.The TIMER model has been described in detail in deVries et al.
The RAINS model
The Regional Air Pollution Information and Simula-tion (RAINS) model provides a consistent frameworkfor the analysis of emission reduction strategies withinEurope for all pollutants relevant for acidification,eutrophication and formation of ground-level ozone(Amann et al., 1999). It also includes a modulethat estimates the emissions of particulate matter (PM)from anthropogenic sources (see Klimont et al., 2002).11
Within RAINS, a non-linear optimisation is used toidentify the cost-minimal combination of measures,taking into account regional differences in emissioncontrol costs and atmospheric dispersion characteristics.RAINS covers almost all European countries andincorporates detailed data on their energy consumption.Scenarios for energy development form an exogenousinput to the model. For emissions, it is calibrated onthe basis of EMEP (compare http://webdab.emep.int),CORINAIR (EEA 2001) and CEPMEIP data(CEPMEIP 2002). In RAINS, emission reductionsare achieved exclusively by technical measures. Feed-backs of emission controls on economic and energysystem are not included. For example, emissionsof SO2 can be controlled through lowering thesulphur content of fuels or through flue gases desul-phurisation, but not by substituting coal by naturalgas. Effects of changing the structure of energy supplyand demand need to be analysed as a separatescenario. Atmospheric dispersion processes for allpollutants are modelled on the basis of results of theEMEP air pollution transport models. The impacts ofscenarios are evaluated using a set of indicatorsreflecting sensitivities of ecosystems and people topollution (critical loads and levels). More detailsabout the indicators used can be found in Cofala et al.(2002).

ARTICLE IN PRESSD.P. van Vuuren et al. / Energy Policy 34 (2006) 444–460 459
TIMER to FAIR
In principle, the TIMER and FAIR models use asimilar regional breakdown and data can be easilytransferred between them. For the Former Soviet Union(FSU), however, FAIR distinguishes between Annex-Icountries that have emission obligations under theKyoto Protocol (in particular the Russian Federationand Ukraine) and non-Annex-I countries that have noemission obligations. In TIMER, this division does notexist. As the first category contributes the lion’s share ofthe emissions in the region, we have simply assumed thesame relative reduction of CO2 in TIMER as in FAIR.A second limitation in the transfer of data was thatFAIR uses data on base year emissions from theCDIAC database (CDIAC, 1999; den Elzen and Lucas,2003), that are somewhat different from the TIMERmodelling results for 1990. Therefore, relative changescompared to 1990 were used in the data transfer betweenthese models.
TIMER to RAINS
For RAINS, country-level energy scenarios arenecessary as inputs for emissions calculations. TheTIMER model, however, calculates energy use for threelarge regions in Europe. In terms of fuel types too, theRAINS model is more detailed than TIMER. Finally,the data sources used to calibrate the model for the baseyear are different (TIMER is calibrated against IEAdata, RAINS uses in addition data from nationalsources). A methodology had to be developed totranslate the TIMER energy results into RAINS input.First, existing RAINS data for each fuel–sector combi-nation are aggregated into the (lower) level of detail ofthe TIMER model. This aggregation is done for the baseyear (1995) and for the target year (2010) using aprevious RAINS scenario, with very similar assump-tions as the TIMER baseline. Second, for each country,fuel type and sector, the original RAINS data are scaledto the TIMER values using the following equation:
En Rc;s;f ;2010 ¼ En Rold ;c;s;f ;1995
� ðEn TR;s;f ;2010=En TR;s;f ;1995Þ
� ðEn Rold;c;s;f ;2010=En Rold ;c;s;f ;1995Þ
=ðEn Rold ;R;s;f ;2010=En Rold ;R;s;f ;1995Þ; ð1Þ
where En_R is the fuel use as used in the RAINS model(GJ), ‘Old’ refers to the data of an earlier RAINS run,En_T is the fuel use in the TIMER format (GJ), Theprefixes c and R refer to country and region level, Theprefixes s and f are used for sector and fuel type.
Some further assumptions had to be made. First ofall, RAINS uses several data for emission calculationson activities not directly related to energy consumption(e.g. production of industrial products and livestock
farming). Here data from RAINS were used. This hasalso been done for energy sources for which TIMERdoes not include information (the use of solid waste as afuel). Secondly, Eq. (1) cannot be applied to fuels withvery small (or even zero) consumption in the base year,i.e. for ‘new’ renewable energy sources such as solar andwind in power generation and for natural gas use intransport. In these cases, TIMER output has beenscaled down to the country level on the basis of aconstant percentage, reflecting the contribution of agiven country to the regional total. In case of renew-ables, the share of individual countries in total powergeneration was used. Similarly, data on compressednatural gas (CNG) use in transport were distributed onthe basis of total national demand for transport fuels.Finally, using the scaling method of Eq. (1) does notnecessarily result in supply meeting demand on acountry level. For energy forms for which export/importis possible, we assumed that potential surpluses/deficitswill be levelled out through international trade withineach country group. For district heat, we have scaledback the demand per country to its production level.
References
Amann, M., Cofala, J., Heyes, C., Klimont, Z., Schopp, W., 1999. The
RAINS model: a tool for assessing regional emission control
strategies in Europe. Pollution Atmospherique, 41–63.
Blok, K., De Jager, D., Hendriks, C., 2001. Economic Evaluation of
Sectoral Emission Reduction Objectives for Climate Change—
Summary Report for Policy Makers. Ecofys Energy and Environ-
ment, Utrecht, The Netherlands.
Brink, C., 2002. Modelling cost-effectiveness of interrelated emission
reduction strategies: the case of agriculture in Europe. Wageningen
University, The Netherlands.
Burtraw, D., Toman, M.A., 2000. Estimating the ancillary benefits of
greenhouse gas mitigation policies in the US ancillary benefits and
costs of greenhouse gas mitigation. Proceedings of an IPCC Co-
sponsored Workshop, Washington, DC 27–29 March 2000,
Organisation for Economic Co-operation and Development
(OECD).
Capros, P., 1999. European Union Energy Outlook to 2020. European
Commission—DG for Energy.
CDIAC, 1999. Carbon Dioxide Emissions from Fossil-Fuel Con-
sumption and Cement Manufacture. Carbon Dioxide Information
Analysis Center.
CEPMEIP, 2002. CEPMEIP Database (Co-ordinated European
Programme on Particulate Matter Emission Inventories). TNO,
Delft, Netherlands.
Cofala, J., Heyes, C., Klimont, Z., Amann, M., 2002. Acidification,
Eutrophication and Tropospheric Ozone Impacts for Five Scenar-
ios of Greenhouse Gases Abatement in Europe. International
Institute for Applied Systems Analysis, Laxenburg, Austria.
Criqui, P., Kouvaritakis, N., 2000. World energy projections to 2030.
International Journal of Global Energy Issues 14 (1–4), 116–136.
den Elzen, M.G.J., de Moor, A.P.G., 2002. Evaluating the Bonn–-
Marrakesh agreement. Climate Policy 2, 111–117.
den Elzen, M.G.J., Lucas, P., 2003. FAIR 2.0—A Decision-support
Tool to Assess the Environmental and Economic Consequences of
Future Climate Regimes. RIVM, Bilthoven.

ARTICLE IN PRESSD.P. van Vuuren et al. / Energy Policy 34 (2006) 444–460460
EEA, 2001. Joint EMEP/CORINAIR Atmospheric Emission Inven-
tory Guidebook. European Environment Agency, Copenhagen.
EEA, 2002a. Greenhouse Gas Emission Trends and Projections in
Europe. European Environment Agency, Copenhagen, Denmark.
EEA, 2002b. The ShAir Scenario. Towards Air and Climate Change
Outlooks, Integrated Assessment Methodologies and Tools Ap-
plied to Air Pollution and Greenhouse Gases. European Environ-
ment Agency, Copenhagen.
IMAGE-team, 2001. The IMAGE 2.2 Implementation of the IPCC
SRES Scenarios. A Comprehensive Analysis of Emissions, Climate
Change and Impacts in the 21st Century. National Institute for
Public Health and the Environment, Bilthoven, The Netherlands.
IPCC, 2001. Climate Change 2001. Cambridge University Press,
Cambridge.
Klimont, Z., Cofala, J., Bertok, I., Amann, M., Heyes, C., Gyarfas, F.,
2002. Modelling Particulate Emissions in Europe; A Framework to
Estimate Reduction Potential and Control Costs. Report to the
German Environmental Protection Agency (UBA). International
Institute for Applied Systems Analysis, Laxenburg, Austria.
Mayerhofer, P., de Vries, B., den Elzen, M.G.J., van Vuuren, D.P.,
Onigkeit, J., Posch, M., Guardans, R., 2002. Long-term, consistent
scenarios of emissions, deposition and climate change in Europe.
Environmental Science and Policy 5 (4), 273–305.
Posch, M., 2002. Impacts of climate change on critical loads and their
exceedances in Europe. Environmental Science & Policy 5 (4),
307–318.
RIVM, EFTEC, NTUA and ILASA, 2001. European Environmental
Priorities: An Integrated Economic and Environmental Assess-
ment. National Institute of Public Health and the Environment,
Bilthoven.
Smeets, W., van den, Wijngaart, R., 2002. Synergie tussen klimaat en
verzuringsbeleid (Synergy Between Climate and Acidification
Policies) (in Dutch). RIVM, Bilthoven.
Syri, S., Amann, M., Capros, P., Mantzos, L., Cofala, J., Klimont, Z.,
2001. Low CO2 energy pathways and regional air pollution in
Europe. Energy Policy 29, 871–884.
UN/ECE, 1999. Protocol to the 1979 Convention on Long-range
Transboundary Air Pollution to Abate Acidification. Eutrophica-
tion and Ground-level Ozone. United Nations Economic Commis-
sion for Europe, Geneva, Switzerland.
Van Harmelen, T., Bakker, J., de Vries, B., van Vuuren, D.P., den
Elzen, M.G.J., Mayerhofen, P., 2002. An analysis of the costs and
benefits of joint policies to mitigate climate change and regional air
pollution in Europe. Environmental Science and Policy 5 (4),
349–365.
van Vuuren, D.P., Bakkes, J.A., 1999. GEO-2000 Alternative Policy
Study for Europe and Central Asia. United Nations Environment
Programme, Bilthoven.
van Vuuren, D.P., Cofala, J., Eerens, H., Oostenrijk, R., Heyes, C.,
Klimont, Z., DenElzen, M.G.J., Amann, M., 2003. Exploring the
Ancillary Benefits of the Kyoto Protocol for Air Pollution in
Europe. EEA, Copenhagen.