İklim Değişikliği Yükümlülüklerine Uygunluğun Sağlanması: Kyoto Protokolü Uygunluk Mekanizması
Upload
khangminh22Category
view
0download
0
This electronic version (PDF) was scanned by the International Telecommunication Union (ITU) Library & Archives Service from an original paper document in the ITU Library & Archives collections.
La présente version électronique (PDF) a été numérisée par le Service de la bibliothèque et des archives de l'Union internationale des télécommunications (UIT) à partir d'un document papier original des collections de ce service.
Esta versión electrónica (PDF) ha sido escaneada por el Servicio de Biblioteca y Archivos de la Unión Internacional de Telecomunicaciones (UIT) a partir de un documento impreso original de las colecciones del Servicio de Biblioteca y Archivos de la UIT.
(ITU) لالتصاالت الدولي االتحاد في والمحفوظات المكتبة قسم أجراه الضوئي بالمسح تصوير نتاج (PDF) اإللكترونية النسخة هذه .والمحفوظات المكتبة قسم في المتوفرة الوثائق ضمن أصلية ورقية وثيقة من نقال◌
此电子版(PDF版本)由国际电信联盟(ITU)图书馆和档案室利用存于该处的纸质文件扫描提供。
Настоящий электронный вариант (PDF) был подготовлен в библиотечно-архивной службе Международного союза электросвязи путем сканирования исходного документа в бумажной форме из библиотечно-архивной службы МСЭ.
© International Telecommunication Union

INTERNATIONAL TELECOMMUNICATION UNION
CCIRINTERNATIONAL RADIO CONSULTATIVE COMMITTEE
RECOMMENDATIONS AND REPORTS OF THE CCIR, 1978(ALSO QUESTIONS, STUDY PROGRAMMES, DECISIONS, RESOLUTIONS AND OPINIONS)
XlVth PLENARY ASSEMBLY KYOTO, 1978
VOLUME XI
BROADCASTING SERVICE (TELEVISION)
Gerreva, 1978

INTERNATIONAL TELECOMMUNICATION UNION
CCIRINTERNATIONAL RADIO CONSULTATIVE COMMITTEE
RECOMMENDATIONS AND REPORTS OF THE CCIR, 1978(ALSO QUESTIONS, STUDY PROGRAMMES, DECISIONS, RESOLUTIONS AND OPINIONS)
XlVth PLENARY ASSEMBLY KYOTO, 1978
VOLUME XI
BROADCASTING SERVICE (TELEVISION)
Geneva, 1978
ISBN 92-61-00761-9

II
VOLUME
VOLUME
VOLUME
VOLUME
VOLUME
VOLUME
VOLUME
VOLUME
VOLUME
VOLUME
VOLUME
VOLUME
VOLUME
PLAN OF VOLUMES I TO XIII XlVth PLENARY ASSEMBLY OF THE C.C.I.R.
(Kyoto, 1978)
I Spectrum utilization and monitoring.
II Space research and radioastronomy.
III Fixed service at frequencies below about 30 MHz.
IV Fixed service using communication satellites.
V Propagation in non-ionized media.
VI Propagation in ionized media.
VII Standard frequencies and time signals.
VIII Mobile services.
IX Fixed service using radio-relay systems. Frequency sharing and coordination between systems in the fixed satellite service and radio-relay systems.
X Broadcasting service (sound).
XI Broadcasting service (television).
XII Transmission of sound broadcasting and television signals over long distances (CMTT). Vocabulary (CMV).
XIII Information concerning the XIVth Plenary Assembly:Minutes of the Plenary Sessions.Texts of general interest.Structure of the C.C.I.R.Complete list of C.C.I.R. texts.Alphabetical index of technical terms appearing in Volumes I to XII.
© I.T.U.
Printed in U.S.A.

Ill
DISTRIBUTION OF TEXTS OF THE XlVth PLENARY ASSEMBLY OF THE C.C.I.R. IN VOLUMES I TO XIH
Volumes I to XIII, XlVth Plenary Assembly, contain all the valid texts of the C .C .I.R . and succeed those of the XHIth Plenary Assembly, Geneva, 1974.
1. Recommendations, Reports, Decisions, Resolutions, Opinions
1.1 Numbering o f these texts
Recommendations, Reports, Resolutions and Opinions are numbered according to the system in force since the Xth Plenary Assembly.
In conformity with the decisions of the X lth Plenary Assembly, when one of these texts is modified, it retains its number to which is added a dash and a figure indicating how many revisions have been made. For example: Recommendation 253 indicates the original text is still current; Recommendation 253-1 indicates that the current text has been once modified from the original. Recommendation 253-2 indicates that there have been two successive modifications of the original text, and so on.
The tables which follow show only the original numbering of the current texts, without any indication of successive modifications that may have occurred. For further information about this numbering scheme, please refer to Volume XIIL
1.2 Recommendations
Number Volume Number Volume Number Volume
45 VIII 341 I 457,458 VII48, 49 X 342-349 III 460 VII
77 VIII 352-354 IV 461 XII (CMV)80 X 355-359 IX 463 IX100 I 361 VIII 464-466 IV106 III 362-365 II 467,468 X
139,140 X 367 II 469-472 XI162 III 368-370 V 473,474 XII (CMTT)182 I 371-373 VI 475, 476 VIII205 X 374-376 VII 478 VIII
214-216 X 377-379 I 479 II218, 219 VIII 380-393 IX 480 III
239 I 395-406 IX 481-484 IV240 III 407-412 X 485, 486 VII246 III 414-416 X 487-496 VIII257 VIII 417,418 XI 497 IX
265,266 XI 419 XI 498, 499 X268 IX 422,423 VIII 500, 501 XI270 IX 427, 428 VIII 502-505 XII (CMTT)
275,276 IX 430,431 XII (CMV) 506-508 I283 IX 433 I 509-517 II290 IX 434,435 VI 518-520 III302 IX 436 III 521-524 IV
305, 306 IX 439 VIII 525-530 V310, 311 V 441 VIII 531-534 VI
313 VI 442,443 I 535-538 VII314 II 444 IX 539-554 VIII
325-329 I 445 I 555-558 IX331, 332 I 446 IV 559-564 X
334 I 447 X 565,566 XI335,336 III 450 X 567-572 XII (CMTT)
337 I 452,453 V 573,574 XII (CMV)338, 339 III 454-456 III

1.3 Reports
Number Volume Number Volume Number Volume
19 III 322 VI (1) 493 XII (CMTT)32 X 324-326 I 496-498 XII (CMTT)93 VIII 327 III 499-502 VIII
106,107 III 329 III 504-507 VIII109 III 336 V 509-512 VIII111 III 338 V 516 X112 I 340 VI (1) 518 VII122 XI 342 VI 519-528 I
345 III 530-534 I137 IX 347 III 535-546 II
176,177 III 349 III 548 II179 I 352-357 III 549-551 III181 I 358 VIII 552-561 IV183 III 362-364 VII 562-565 V184 I 367-373 I 567 V186 I 374-380 IX 569 V195 III 382 IX 571 VI196 I 383-385 IV 574,575 VI197 III 386-388 IX 576-580 VII
200, 201 III 390,391 IV 581,582 VIII203 III 393 IX 584-591 VIII
204-208 IV 394 VIII 594-596 VIII209 IX 395,396 II 598,599 VIII212 IV 400,401 X 602 VIII214 IV 404,405 XI 604 IX215 XI 409 XI 607-610 IX
222-224 II 411,412 XII (CMTT) 612-615 IX226 II 413-415 1(1) 616,617 X
227-229 V 418-420 I 619,620 X236 V 422,423 I 622 X
238, 239 V 426 V 623 XII (CMTT)249-251 VI 430-432 VI 624-634 XI
252 VI (U 434-437 III 635-637 XII (CMTT)253-255 VI 439 VII 639, 640 XII (CMTT)258-260 VI 443-446 IX 642, 643 XII (CMTT)262, 263 VI 448,449 IX 646-649 XII (CMTT)265,266 VI 451 IV 651-671 I
267 VII 453-455 IV 672-700 II270, 271 VII 456 II 701-705 III272, 273 I 457,458 X 706-713 IV275-282 I 461 X 714-724 V283-289 IX 463-465 X 725-729 VI292, 293 X 468 X 730-738 VII
294 XI 469 XI 739-778 VIII299-305 X 472 X 779-793 IX
306 XI 473 XI 794-800 X311-313 XI 476-478 XI 801-814 XI
314 XII (CMTT) 481-485 XI 815-823 XII (CMTT)315 XI 487, 488 XII (CMTT)319 VIII 491 XII (CMTT)
(!) Published separately.
1.3.1 Note concerning Reports
The individual footnote “Adopted unanimously” has been dropped from each Report. Reports in this volume have been adopted unanimously except in cases where reservations have been made which will appear as individual footnotes.
1.4 Decisions
Number Volume Number Volume Number Volume
2 IV 18 XII (CMTT) 28, 29 VII3-5 V 19 XII (CMV) 30-32 VIII
6-11 VI 21-24 VI 33 XI17 XI 27 I
1.4.1 Note concerning Decisions
Since Decisions were adopted by Study Groups, use was made of the expression “ Study G ro u p .. . , Considering” and the expression “Unanimously decides” , replaced by “Decides” .

V
1.5 Resolutions
Number Volume Number Volume Number Volume
4 VI 33 XIII 65 XI14 VII 39 XIII 66 XII (CMV)15 I 44 I 67-70 XIII20 VIII 61 XIII23 XII (CMV) 62 I24 XIII 63 VI
26,27 XIII 64 X
1.6 Opinions
Number Volume Number Volume Number Volume
2 I 34,35 I 55 XII (CMTT)11 I 38 XI 56 IV
13, 14 IX 40 XI 57 VIII15, 16 X 41 XII (CMTT) 58,59 X22, 23 VI 42 ,43 VIII 60 XI
24 VIII 45 ,46 VI 61-63 XIII26-28 VII 49 VIII
29 I 50 IX32 I 51 X
2. Questions and Study Programmes
2.1 Text numbering
2.1.1 Questions
Questions are numbered in a different series for each Study G roup: where applicable a dash and a figure added after the number of the Question indicate successive modifications. The number of a Question is completed by an Arabic figure indicating the relevant Study Group. For example:— Question 1/10 would indicate a Question of Study Group 10 with its text in the original state;— Question 1-1/10 would indicate a Question of Study Group 10, whose text has been once modified
from the original: Question 1-2/10 would be a Question of Study Group 10, whose text has had two successive modifications.
2.1.2 Study Programmes
Study Programmes are numbered to indicate the Question from which they are derived if any, the number being completed by a capital letter which is used to distinguish several Study Programmes which derive from the same Question. The part of the Study Programme number which indicates the Question from which it is derived makes no mention of any possible revision of that Question, but refers to the current text of the Question as printed in this Volume.
Examples:
— Study Programme 1A/10, which would indicate that the current text is the original version of the text of the first Study Programme deriving from Question 1/10;
— Study Programme 1C/10, which would indicate that the current text is the original version of the text of the third Study Programme deriving from Question 1/10;
— Study Programme 1A-1/10 would indicate that the current text has been once modified from the original, and that it is the first Study Programme of those deriving from Question 1/10.
It should be noted that a Study Programme may be adopted without it having been derived from a Question; in such a case it is simply given a sequential number analogous to those of other Study Programmes of the Study Group, except that on reference to the list of relevant Questions it will be found that no Question exists corresponding to that number.
2.2 Arrangement o f Questions and Study Programmes
The plan shown on page II indicates the Volume in which the texts of each Study Group are to be found, and so reference to this information will enable the text of any desired Question or Study Programme to be located.

VI
VOLUME XI
BROADCASTING SERVICE (TELEVISION)
(Study Group 11)
TABLE OF CONTENTS
Page
Plan of Volumes I to XIII, XlVth Plenary Assembly of the C C IR .................................................................... IIDistribution of texts of the XlVth Plenary Assembly of the CCIR in Volume I to X I I I ................................ IllTable of contents................................................................................................................................................... VINumerical index of t e x t s ............................................................................................................................................. XIIndex of the texts published in other volumes but containing information of interest for broadcasting service (television)............................................................................................................................................................... XIITerms of reference of Study Group 11 and Introduction by the Chairman of Study Group 11 ....................... XV
Section 11A — Characteristics o f systems for monochrome and colour television
Rec. 470-1 Television sy s te m s ....................................................................................................................... 1Report 624-1 Characteristics of television system s....................................................................................... 1Rec. 471 Nomenclature of colour bar s ig n a ls ....................................................................................... 30Report 476-1 Colorimetric standards in colour television............................................................................. 32Report 312-3 Constitution of a system of stereoscopic television .............................................................. 33Report 315-4 Reduction of the bandwidth required for the transmission of a television signal . . . . 33Report 801 The present state of high-definition te lev is io n ....................................................................... 34Report 802 Ancillary broadcasting services using the television c h a n n e l............................................... 35
Section 11B — International exchange o f television programmes
Rec. 472-1 Video-frequency characteristics of a television system to be used for the internationalexchange of programmes between countries that have adopted 625-line colour or monochrome systems................................................................................................................... 49
Report 311-4 The present position of standards conversion ....................................................................... 50Report 477-2 Transcoding of colour television signals from one colour system to another ................ 51Report 628-1 Automatic monitoring of television stations .......................................................................... 52Report 803 The international exchange of Electronic News Gathering (ENG). Television news
program m es.................................................................................................................................. 54Report 804 Definitions of parameters for automatic measurement of television insertion test
s ig n a ls ........................................................................................................................................... 55
Section 11C - Picture quality and the parameters affecting it
Rec. 500-1 Method for the subjective assessment of the quality of television p ic tu re s ....................... 57Report 313-4 Assessment of the quality of television p ic tu re s .................................................................... 60Report 405-3 Subjective assessment of the quality of television p ic tu re s .................................................. 61Report 404-2 Distortion of television signals due to the use of vestigial sideband emissions................. 72Report 409-2 Boundaries of the television service area in rural districts having a low population
d e n s ity ........................................................................................................................................... 76Report 478 Ghost images in monochrome television. Re-radiation from masts in the neighbour
hood o f transmitting a n ten n a e ................................................................................................. 77Report 481 Ratio of wanted-to-unwanted signal in television. Subjective assessment o f multiple
co-channel in ter feren ce ............................................................................................................. 78

VII
Page
Section 1 ID — Elements and methods for planning
Rec. 266 Phase correction of television transmitters necessitated by the use of vestigial-sidebandtransm ission........................................................................................................................................ 81
Rec. 417-2 Minimum field strengths for which protection may be sought in planning a televisions e rv ic e ................................................................................................................................................. 81
Rec. 418-3 Ratio of the wanted-to-unwanted signal in monochrome television......................................... 82Rec. 419 Directivity of antennae in the reception of broadcast sound and te lev is io n ......................... 92Rec. 565 Protection ratios for 625-line television against radionavigation transmitters operating
in the shared bands between 582 and 606 M H z ........................................................................... 92Report 122-2 Advantages to be gained by using orthogonal wave polarizations in the planning of
broadcasting services in bands 8 (VHF) and 9 (UHF). Sound and te le v is io n ....................... 93Report 306-3 Ratio of wanted-to-unwanted signal for colour television ........................................................ 95Report 482 Recommended characteristics for collective and individual antenna systems for
domestic reception of signals from terrestrial tran sm itte rs ...................................................... 103Report 483-2 Specifications for low-cost monochrome television receivers.................................................... 105Report 484-1 Ratio of picture-signal to synchronizing-signal............................................................................ 110Report 485 Contribution to the planning of broadcasting services. Statistics o f s e r v ic e ......................... 110Report 625-1 Characteristics of television receivers and receiving antennae essential to frequency
p la n n in g .............................................................................................................................................. 113Report 626-1 Simplification of synchronizing signals in television ................................................................ 121Report 627-1 Minimum power flux-density for planning a terrestrial television service in the
12 GHz band (band V I ) ................................................................................................................... 122Report 805 Subjective quality targets of overall television systems. Characteristics o f reference
receiving in sta lla tio n s ...................................................................................................................... 124Report 806 Test conditions and measurement procedures for the determination of protection
ratios. Terrestrial broadcasting service (television)...................................................................... 127
Section 11E — Television systems using digital modulation
Report 629-1 Television systems using digital m o d u la tio n ................................................................................ 129
Section 1 IF — Recording o f video programmes
Rec. 265-3 Standards for the international exchange of monochrome and colour-televisionprogrammes on f i l m ......................................................................................................................... 135
Report 294-4 Standards for the international exchange of monochrome and colour televisionprogrammes on f i l m ......................................................................................................................... 142
Rec. 469-2 Standards for the international exchange of television programmes on magnetic tape . 147
Report 630-1 International exchange of television programmes on magnetic tap e ......................................... 154Rec. 501-1 Appraisal of film intended for colour telev ision .......................................................................... 156Report 469-1 Photographic film recording of colour television s ig n a ls ........................................................... 159
Section 11G — Broadcasting-satellite service (television)
Rec. 566 Terminology relative to the use of space communication techniques for broadcasting . 161Report 215-4 Systems for the broadcasting-satellite service (sound and te lev is io n )...................................... 163Report 473-2 Characteristics of ground receiving equipment for broadcasting-satellite systems . . . . 185Report 631-1 Broadcasting-satellite service: sound and television. Frequency-sharing between the
broadcasting-satellite service and terrestrial services.................................................................. 192Report 632-1 Broadcasting-satellite service: sound and television. Technically suitable methods o f
modulation ....................................................................................................................................... 214

VIII
Page
Report 633-1 Orbit and frequency planning in the broadcasting-satellite s e rv ic e .................................. 216Report 634-1 Broadcasting-satellite service: sound and television. Measured interference protection
ratios for planning television broadcasting s y s te m s ............................................................ 228Report 807 Out-of-band emissions from broadcasting-satellite space stations operating in the
band 11.7 to 12.2 GHz (12.5 GHz in region 1 ) ..................................................................... 253Report 808 Broadcasting-satellite service. Space-segment technology ................................................. 256Report 809 Sharing of the 11.7 to 12.2 GHz frequency band between the broadcasting-satellite
service and the fixed satellite service....................................................................................... 265Report 810 Broadcasting-satellite service (sound and television). Reference patterns and tech
nology for transmitting and receiving antennae .................................................................. 271Report 811 Broadcasting-satellite service. Planning elements required for the establishment o f a
plan o f frequency assignments and orbital positions for the broadcasting-satellite service in the 12 GHz b a n d ...................................................................................................... 285
Report 812 Computer programs for use in planning broadcasting-satellite services in the 12 GHzb a n d .............................................................................................................................................. 290
Report 813 Broadcasting-satellite service (television). Guidelines for the establishment o f a standardised set o f test conditions and measurement procedures for the subjective and objective determination o f protection ratios for te lev is io n ................................................ 300
Report 814 Factors to be considered in the choice of polarization for planning the broadcasting-satellite s e rv ic e ........................................................................................................................... 302
Questions and Study Programmes, Decisions, Resolutions and Opinions
Question 1/11 Colour television s tan d ard s ........................................................................................................ 313Study Programme 1A/11 Standards for video colour-television s ig n a ls .................... 313Study Programme IB /11 Standards for radiated colour-television signals................. 314Study Programme 1C/11 Constitution of a system of stereoscopic television........... 314Study Programme ID /11 Ratio of picture-signal to synchronizing-signal................. 314Study Programme IE /11 Simplification of synchronizing signals in television........ 315
Question 2-2/11 Exchange of television p rogram m es......................................................................................... 315Study Programme 2A /11 Transcoding of colour television signals from one system to
a n o th e r ..................................................................................... 316
Question 3-1/11 Assessment of the quality of television p ic tu re s .................................................................... 316Study Programme 3 A-1/11 Subjective assessment of the quality of television pictures................ 316Study Progamme 3B/11 Subjective assessment and objective measurement of impairments
to television p ic tu re s .............................................................................. 317
Question 4-1/11 Ratio of the wanted-to-unwanted signal in te lev ision ........................................................... 317Study Programme 4A-1/11 Ratio of the wanted-to-unwanted signal in television. Use o f the
offset method, when there are large differences between the carrier frequencies o f the interfering s ta t io n s ................................................ 318
Study Programme 4B /11 Ratio of the wanted-to-unwanted signal in television. Subjectiveimpairment grades for specifying protection ra tios ........................... 318
Question 5-3/11 Broadcasting-satellite service (television). Protection from interference ............................ 319Study Programme 5G-2/11 Broadcasting-satellite service (television). Use o f the 12 GHz band 320Study Programme 5H -l/1 1 Broadcasting-satellite service (television). Criteria to be applied
for frequency sharing between the broadcasting-satellite service and the terrestrial broadcasting service in the frequency range 620 to 790 M H z .............................................................................................. 321
Study Programme 5J - l /1 1 Broadcasting-satellite service (television). Criteria to be appliedfor frequency sharing between the broadcasting-satellite service and the terrestrial and space services in the frequency range 2500 M H z to 2690 M H z ......................................................................... 322
Study Programme 5L/11 Frequencies for the connection to a broadcasting satellite (television) ............................................................................................................. 323

Page
Question 6/11 Ghost images in television.......................................................................................................... 324
Study Programme 6A/11 Ghost images in television....................................................................... 324
Question 7-1/11 Recommended characteristics for individual or collective television antenna systemsfor domestic reception of signals from terrestrial transm itte rs..................................... 325
Study Programme 9A-1/11 Distortion of television signals in the reception of vestigial-side-band emissions ........................................................................................ 325
Study Programme 11 A-1/11 Reduction of the bandwidth required for a television signal . . . . 326
Study Programme 12A-2/11 Insertion of special signals in the field-blanking interval of atelevision s ig n a l ........................................................................................ 326
Study Programme 12B/11 Reduction of channel bandwidth in television broadcasting byincorporating the sound information in the video s i g n a l ................. 327
Question 13/11 Specifications for low-cost television receivers...................................................................... 327
Question 14-1/11 Subjective quality targets of overall television sy s te m s ....................................................... 328
Study Programme 14A-1/11 Subjective quality targets of overall television systems and allocation of to le ran ces..................................................................................... 328
Study Programme 14B/11 Subjective quality targets of overall television systems. Referencereceiving installations............................................................................... 329
Question 15/11 Automatic monitoring of television stations .......................................................................... 329
Question 17-2/11 Optical sound recording and reproducing standards for the international exchange oftelevision programmes ............................................................................................................. 330
Question 18-1/11 Recording of television programmes on magnetic t a p e ........................................................ 330
Study Programme 18A-1/11 Recording of television programmes on magnetic t a p e .................... 330
Study Programme 18B-1/11 Standards for the international exchange of television programmeson magnetic tape. Helical-scan recording (full broadcast quality) . 331
Study Programme 18D /11 International exchange of television recordings for programmeevaluation ................................................................................................. 331
Study Programme 18E /1 1 Recording of television programmes on magnetic tape. Colour-field seq u en ce ........................................................................................... 332
Study Programme 18F/11 Recording of television signals on magnetic tape for electronicnews gathering. Helical-scan recording................................................. 332
Question 20-1/11 Recording of colour television signals on f i lm ....................................................................... 332
Question 21-1/11 Standards for the international exchange of monochrome and colour televisionprogrammes on f i l m ................................................................................................................... 333
Question 22-1/11 Methods of synchronizing various recording and reproducing system s............................. 333
Study Programme 22A -l/1 1 Recording of coded information on the cue track of televisionmagnetic ta p e s ........................................................................................... 334
Question 23-2/11 System characteristics for television broadcasting from satellites .......................................... 334
Study Programme 23A /11 Broadcasting-satellite service. Television standards.................................... 335
Study Programme 23B /l 1 Composite 625-line signal for television broadcasting from satellites ............................................................................................................. 336
Study Programme 23C /1 1 Possible broadcasting-satellite systems (television) and their relative acceptability........................................................................................ 336
Study Programme 23 D /11 Technical characteristics of broadcasting-satellite systems (television) for community and individual re c e p tio n .................................. 337
Study Programme 23E /1 1 Characteristics of receiving systems of the broadcasting-satelliteservice (television)..................................................................................... 337
Study Programme 23F/11 Transmitting antennae for the broadcasting-satellite service (television) .......................................................................................................... 338
IX

X
Page
Question 25-1/11 Standards for television systems using digital m o d u la tio n ................................................. 339Study Programme 25A /11 Standards for television systems using digital modulation. Re
duction in the bit rate in the digital coding o f television signals . . 339Study Programme 25B /l 1 Standards for television systems using digital modulation.
Encoding o f colour television signals ................................................ 340Study Programme 25C/11 Standards for television systems using digital modulation. Protec
tion against digital errors, jitter and s lip ............................................. 340Study Programme 25D/11 Digital techniques in the broadcasting-satellite service (television) . 340Study Programme 25E/11 Quality parameters and measurement and monitoring methods to
be used in the studio complex and in direct broadcasting from terrestrial transmitters and from satellites using digital or analogue-and-digital m o d u la tio n ......................................................... 341
Study Programme 25F /l 1 Standards for television systems using digital modulation.Filtering and sampling for colour television s ig n a ls ........................ 342
Question 26-1/11 Characteristics of television receivers and receiving a n te n n a e ........................................... 342Study Programme 26A-1/11 Characteristics of television receivers and receiving antennae . . . 343
Question 27/11 High-definition te lev is io n .......................................................................................................... 343Question 28/11 International exchange of recorded television programmes. Addition to television
programmes (on film or magnetic materials) o f data for controlling automatic equ ipm en t.................................................................................................................................... 344
Study Programme 28A /11 International exchange of recorded television programmes. A ddition to television programmes (recorded on magnetic tape, film or other materials) o f data for controlling automatic equipment . . 344
Question 29-1/11 Broadcasting of still pictures and other information intended for the public and usinga television channel ................................................................................................................... 345
Study Programme 29A-1/11 Broadcasting of analogue television signals for still pictures . . . . 345Study Programme 29B/11 Standards for a new broadcasting service. Teletext............................ 346Study Programme 29C/11 Specification for multiplex broadcasting of information in the
television ch a n n e l.................................................................................... 346Study Programme 29D/11 Specifications for a programme delivery s e rv ic e ............................... 347Study Programme 29E/11 Specifications for a new “audiography” broadcasting service . . . . 347
Question 30/11 Methods of reducing interference to the broadcasting service (television) from otherservices operating in adjacent b a n d s ....................................................................................... 348
Question 31/11 Performance and testing of wired distribution systems for television signals................... 348Study Programme 31 A /11 Radiation from cable distribution netw orks........................................ 349
Question 34-1/11 Radiation of spurious emissions from space stations in the broadcasting-satelliteservice (te lev isio n )...................................................................................................................... 349
Question 35/11 Synchronization necessary for the satisfactory reception of sound and picture signals . 350Question 36/11 Polarization of emissions in the terrestrial broadcasting service (television). Advan
tages o f circular or elliptical polarization ............................................................................... 350
Decision 17-1 Protection ratios for the broadcasting-satellite service for the purpose of frequencysharing (television)...................................................................................................................... 351
Decision 33 Broadcasting services intended for alphanumerical and/or graphic display. Teletextservices........................................................................................................................................... 352
Resolution 65 Alphanumeric and/or graphic displays on television receivers........................................... 352
Opinion 38 Exchange of monochrome and colour television programmes via sa te llite s ................... 353Opinion 40 Subjective assessment of the quality of television p ic tu re s ................................................. 354Opinion 60 Teletext services............................................................................................................................. 354

XI
NUMERICAL INDEX OF TEXTS
RECOMMENDATIONS Page
Rec. 265-3 135Rec. 266 81Rec. 417-2 81Rec. 418-3 82Rec. 419 92Rec. 469-2 147Rec. 470-1 1Rec. 471 30Rec. 472-1 49Rec. 500-1 57Rec. 501-1 156Rec. 565 92Rec. 566 161
REPORTS
Report 122-2 93Report 215-4 163Report 294-4 142Report 306-3 95Report 311-4 50Report 312-3 33Report 313-4 60Report 315-4 33Report 404-2 75Report 405-3 61Report 409-2 76Report 469-1 159Report 473-2 185Report 476-1 32Report 477-2 51
REPORTS Page
Report 478 77Report 481 78Report 482 103Report 483-2 105Report 484-1 110Report 485 110Report 624-1 1Report 625-1 113Report 626-1 121Report 627-1 122Report 628-1 52Report 629-1 129Report 630-1 154Report 631-1 192Report 632-1 212Report 633-1 216Report 634-1 228Report 801 34Report 802 35Report 803 54Report 804 55Report 805 124Report 806 127Report 807 253Report 808 256Report 809 265Report 810 271Report 811 285Report 812 290Report 813 300Report 814 302
Note. - Questions, Study Programmes, Decisions, Resolutions and Opinions which already appear in numerical order in the table o f contents, are not reproduced in this index.

XII
INDEX OF THE TEXTS PUBLISHED IN OTHER VOLUMES CONTAINING INFORMATION OF INTEREST FOR
BROADCASTING SERVICE (TELEVISION)
Text Title Section Volume
Rec. 239-2 Spurious radiations from sound and television broadcast receivers 1C I
Rec. 326-3 Power of radio transmitters IB I
Report 657 Statistical model for the determination of band sharing criteria 1A I
Report 665 Multiple-beam millimetre and centimetre wave antenna systems for satellite communications
1A I
Rec. 517 Protection of the radioastronomy service from transmitters in adjacent bands
2D II
Report 396-3 Maintenance telemetering, tracking and telecommand for developmental and operational satellites. Possibilities o f frequency sharing between earth-satellite telemetering or telecommand links and terrestrial services
2A II
Report 546-1 Space systems technology in the space research service: Attitude control technology
2A II
Report 675 Radiation diagrams of antennae at space research earth stations for use in interference studies
2A II
Report 676 Shaped beam antennae 2A II
Report 692 Preferred frequency bands and power flux-density considerations for earth exploration satellites
2C II
Rec. 370-3 VHF and UHF propagation curves for the frequency range from 30 MHz to 1000 MHz. Broadcasting services
5D V
Rec. 452-2 Propagation data for the evaluation of interference within and between the space and terrestrial services and for the calculation of coordination distances
5G V
Report 228-2 Measurement of field strength for VHF (metric) and UHF (deci- metric) broadcast services, including television
5D V
Report 239-4 Propagation statistiques required for broadcasting services using the frequency range 30 to 1000 MHz
5D V
Report 562-1 Propagation data required for sound and television broadcasting in the frequency bands above 10 GHz. Terrestrial broadcasting at 12 GHz
5D V
Report 564-1 Propagation data required for space telecommunication systems - 5F V
Report 565-1 Propagation data for broadcasting from satellites at frequencies above 10 GHz
5D V

XIII
Text Title Section Volume
Report 569-1 The evaluation of propagation factors in interference problems at frequencies greater than 0.6 GHz
5G V
Report 719 Attenuation by atmospheric gases 5C V
Report 720 Radio emission associated with absorption by atmospheric gases and precipitation
5C V
Report 721 Attenuation and scattering by precipitation and other atmospheric particles
5C V
Report 722 Cross-polarization due to the atmosphere 5C V
Report 723 Worst-month statistics 5C V
Report 724 Propagation data for the evaluation of co-ordination distance in the frequency range 1 to 40 GHz
5G V

PAGE INTENTIONALLY LEFT BLANK
PAGE LAISSEE EN BLANC INTENTIONNELLEMENT

XV
BROADCASTING SERVICE (TELEVISION)
STUDY GROUP 11
Terms o f reference:
1. Study of the technical aspects of the broadcasting service (television), including the use of satellites.2. Study of standards for motion-picture films intended for television and for all forms of television recording relevant to the international exchange of programmes.
Chairman: M. KRIVOSHEEV (U.S.S.R.)Vice-Chairman: C. A. SIOCOS (Canada)
INTRODUCTION BY THE CH AIRM AN OF STUDY G R O U P 11
1. Introduction
Study Group 11 deals with the various technical aspects of television broadcasting.Between the XHIth and XlVth Plenary Assemblies, Study Group 11 worked under the terms of reference
laid down by the XHIth Plenary Assembly. The XlVth Plenary Assembly adopted Resolution 61-1, “Terms of reference and structure of Study Groups” amending the terms of reference of Study Group 11, which now include:
1. Study of the technical aspects of the broadcasting service (television), inqluding the use of satellites.2. Study of standards for motion-picture films intended for television and for all forms of television
recording relevant to the international exchange of programmes.
The main themes of research are:— characteristics of monochrome and colour television systems;— the international exchange of television programmes;— picture quality and the parameters affecting it;— elements and methods for planning;— television systems using digital modulation;— recording of television programmes;— broadcasting-satellite service (television).
Study Group 11 also took account of the proposals contained in the reports by the Director, CCIR and the Chairman of the Organization Committee of the XHIth Plenary Assembly, and also of Resolutions and Decisions adopted by that Assembly.
Study Group 11 worked in close contact with other Study Groups, particularly Study Group 10, with which it jointly examined problems of the recording of television programmes and of television broadcasting by satellite. With the CMTT, it jointly studied problems of the international exchange of television programmes and also problems connected with digital television.
It should be noted that the World Administrative Radio Conference (broadcasting-satellite) took place during the previous study period, in 1977. The report by the CCIR submitted to the WARC-BS was prepared for the Special Joint Meeting in which experts from numerous Study Groups will participate; it will contain technical information on the planning of the broadcasting-satellite service in the 12 GHz range together with the technical criteria for the sharing of this band by other services, thus serving as a major source of information for the work of the WARC-BS. The numerous texts prepared by Study Group 11 and contained in the Report will be extremely useful to the WARC-79.
2. Characteristics of monochrome and colour television systems
Report 624-1, “Characteristics of television systems” is of great practical utility, containing as it does the main parameters of television broadcasting systems. Substantial amendments and additions have been introduced. For example, for a number of standards data have been included relating to transmitter group delay precorrection characteristics.

XVI
During this period, a number of entirely new theoretical and experimental research studies were carried out on the transmission of additional information incorporated in the television signal; a new Report 802, “Ancillary, broadcasting services using the television channel” was prepared on this subject. The transmission of alphanumeric and graphic information for a large television audience by multiplexing of the television signal is likely to come into general use in the near future.
In view of the importance of this problem, the XlVth Plenary Assembly decided to set up a joint CCIR/CCITT Working Party to coordinate activities with the CCITT (Resolution 65). This Working Party will work under the chairmanship of Mr. U. Ericsson (Sweden).
In addition, within the framework of Study Group 11, it was decided (Decision 33) to set up Interim Working Party 11/3 to deal directly with questions relating to the transmission of additional data multiplexed in a television signal. This group will work under the chairmanship of Prof. F. Cappuccini (Italy).
Problems connected with ensuring higher definition of television pictures were also studied. Research on high-definition television is described in Report 801, “The present state of high-definition television”.
3. Quality of television pictures and parameters affecting it
Progress was made in standardizing methods of assessing the quality of television pictures. Nearly all sections of Recommendation 500-1, “Methods for the subjective assessment of the quality of television pictures” were revised. Amendments were introduced into the sections on “Grading scales”, “Observers”, “Test pictures”, “Presentation”, etc.
Changes were also made in Report 405-2, (Report405-3) “Subjective assessment of the quality of television pictures”. These included amendments to the section on methods of processing the results of subjective tests; new sections were also added on test procedures and on the subjective assessment of picture quality in digital television systems.
4. Elements and methods for planning
Protection ratios are exceptionally important in the planning of television broadcasting networks. The protection ratios calculated for colour television are given in Report 306-3, which also contains data on changes in protection ratios as a function of carrier frequency stability, the size of offsets and the presence or absence of fading.
Report 409-2, “Boundaries of the television service area in rural districts having a low population density” contains new field strengths convenient for such localities.
Mention may also be made of the new data concerning terrestrial television services in the 12 GHz band contained in Report 627-1, “Minimum power flux-density for planning a terrestrial television service in the 12 GHz band (band VI)”.
Efforts to unify test conditions and measurement procedures for the determination of protection ratios are reflected in the new Report 806, “Test conditions and measurement procedures for the determination of protection ratios — Terrestrial broadcasting-service (television)”.
Increasing attention was given to the characteristics of overall television systems (camera to screen). A new Report 805, “Subjective quality targets of overall television systems” has been prepared on this subject.
The parameters of television receivers (both those affecting network planning and those relevant to picture quality) were studied. Accounts of these studies are given in the above-mentioned Report 805 and also in Reports 625-1, “Characteristics of television receivers and receiving antennae” and 483-2, “Specifications for low-cost monochrome television receivers”.
5. International exchange of television programmes
This period was marked by the advent of a new medium of television broadcasting technique: electronic news gathering. This consists in the collection of television news stories using small electronic colour cameras with microwave links to the newsroom and/or portable battery-driven video tape recorders. Questions relating to the technology and use of electronic news gathering for purposes of the international exchange of television programmes are described in a new Report 803, “The international exchange of electronic news gathering (ENG)”.
A large number of studies were devoted to the monitoring and measurement of television chains. The trend towards the automation of such measurements is reflected in new Report 804, “Definitions of parameters for automatic measurement of television insertion test signals”, and also in Report 628-1, “Automatic monitoring of television stations”.

XVII
6. Television system using digital modulation
A promising development in television development consists in methods of shaping and transmitting television information. Report 629, “Television systems using digital modulation”, was revised (Report 629-1) in the light of the numerous studies carried out on digital television, and dealing with the hierarchy of long-distance group channels proposed by the CCITT. The studies were aimed mainly at developing the principles and methods of coding television signals, including error protection techniques. Possible subjective and objective measurement methods in digital television were considered for the first time, as well as the combined analogue and digital systems which will presumably be used during the transitional period, until such time as all television information is transmitted by digital means.
7. Recording of television programmes
Colour films and magnetic tapes play an important role in the international exchange of television programmes. Recommendation 501-1, “Appraisal of film intended for colour television” contains a technical assessment of the quality of colour films. Research in this field was directed towards reducing subjective factors in the assessment of the technical qualities of colour films.
Recommendation 469-2, “Standards for the international exchange of television programmes on magnetic tape” describes the requirements for magnetic video recordings.
Problems relating to video recordings are also dealt with in Reports 294-4 and 630-1.
8. Broadcasting-satellite service (television)
In the field of satellite broadcasting, the following problems were studied:
— terminology,
— frequency sharing by satellite and terrestrial broadcasting services,
— characteristics of broadcasting-satellite systems,
— planning of broadcasting-satellite systems,
— characteristics of receiving equipment for the broadcasting-satellite service.
These texts were based on the decisions o f the WARC-BS.
A new Recommendation 566, “Terminology relative to the use of space communication techniques for broadcasting”, was prepared containing the definitions of “service area”, “coverage area”, “beam area”, “nominal orbital position”, etc., adopted at WARC-1977.
On the subject of frequency sharing by satellite and terrestrial broadcasting services, new Report 807, “Out-of-band emissions from broadcasting-satellite space stations operating in the band 11.7 to 12.2 GHz (12.5 GHz in Region 1)” and Report 809, “Sharing of the 11.7 to 12.2 GHz frequency band between the broadcasting-satellite and the fixed-satellite services” were prepared, and Report 631-1, “Broadcasting-satellite service: sound and television. Frequency sharing between the broadcasting-satellite service and terrestrial services” was revised.
On the characteristics of broadcasting-satellite systems, a new Report 808, “Broadcasting-satellite service — space-segment technology” was prepared containing basic data on the satellite transmitter: power source and radiated power limits, cooling systems, station-keeping and attitude control, etc.
In the light of advances in broadcasting-satellite technology, Report 215-3, “Broadcasting-satellite service: sound and television” was revised (Report 215-4). In particular, examples of broadcasting-satellite systems in the 22.75, 42 and 85 GHz range were added.
Notable progress was achieved in the planning of broadcasting-satellite systems and is described in Reports 810, “Reference patterns and technology for transmitting and receiving antennae”, 811, “Planning elements required for the establishment of a plan of frequency assignments and orbital positions for the broadcasting-satellite service in the 12 GHz band”, and 812, “Computer programmes for use in planning the broadcasting-satellite service in the 12 GHz band”. Other new Reports are: 814, “Factors to be considered in the choice of polarization for planning the broadcasting-satellite service” and 813, “Guidelines for the establishment of a standardized set of test conditions and measurement procedures for the subjective and objective determination of protection ratios for television”.
The latter Report was based on the extensive work done by Interim Working Party 11/2 under the chairmanship of Mr. Albernaz (Brazil).

XVIII
Reports 633, “Orbit and frequency planning in the broadcasting-satellite service” and 634, “Broadcasting- satellite service: sound and television. Measured interference protection ratios for planning television broadcasting systems” were revised (Reports 633-1 and 634-1 respectively).
On the subject of broadcasting-satellite receiver characteristics, Report 473-2, “Characteristics of ground receiving equipment for broadcasting-satellite systems” was amended. This Report incorporates the findings of recent research on overall characteristics of receivers, and also on certain individual components of receiving equipments, from antennae to detectors and sound channels.
9. Problems likely to be of particular interest to developing countries
The launching and development of television broadcasting services is based on the selection of a television standard. From this standpoint, Recommendation 470-1, “Television systems”, and Report 624-1, “Characteristics of television systems”, may be particularly useful.
Administrations engaged in the development of television broadcasting networks might consult the material on the planning of such networks in Recommendations 417-2, “Minimum field strengths for which protection may be sought in planning a television service”, 418-3, “Ratio of the wanted-to-unwanted signal in monochrome television”, new Recommendation 565, “Protection ratios for 625-line television against radionavigation transmitters operating in the shared bands between 582 and 606 MHz”, and also Reports 122-2, “Advantages to be gained by using orthogonal wave polarizations in the planning of broadcasting services in bands 8 (VHF) and 9 (UHF). Sound and television”, and 306-3, “Ratio of wanted-to-unwanted signal for colour-television”, which includes the protection ratios necessary for planning. Report 409-2, “Boundaries of the television service area in rural districts having a low population density” is also important.
Useful information on television receivers is contained in Reports 625-1, “Characteristics of television receivers and receiving antennae” and 483-2, “Specifications for low-cost monochrome television receivers”. Of unquestionable interest also are Recommendation 472-1 dealing with the international exchange of programmes, “Video frequency characteristics of a television system to be used for the international exchange of programmes between countries that have adopted 625-line colour or monochrome systems” and new Report 803, “The international exchange of electronic news gathering (ENG)”, as well as the texts relating to exchange of recorded television programmes: Recommendation 501-1, “Appraisal of film intended for colour television” and Recommendation 469-2, “Standards for the international exchange of television programmes on magnetic tape”. Broadcasting-satellite television systems may be of particular importance for developing countries. Basic materialson this subject are set out in § 8.
10. Fundamental questions in the current study period
In the current study period research is to be continued under the existing Questions and StudyProgrammes.
Among the most important problems, mention may be made of the optimum planning and design of terrestrial and satellite television broadcasting systems and the assessment from different angles of television picture quality. The preparation of basic Recommendations and Reports defining the main characteristics of digital television systems is of fundamental importance.
Much attention will have to be given to the formulation of standards for the parameters of systems of multiplexing television signals with additional alphanumeric and graphic information.
The studies on the recording of television programmes and electronic news gathering are of considerable practical significance.
The studies to be carried out on the parameters and principles of high-definition television equipments will be problematic.
** *
Throughout the world, television broadcasting is evolving at a rapid rate. The international exchange of programmes, both in the form of recordings and over long-distance communication lines, is increasing; digital methods for coding television data are being developed alongside broadcasting-satellite systems; problems are arising concerning high-definition television and the use of multiplexing techniques for transmitting additional information, etc. Thus in fact all studies relating to the further development and improvement of television broadcasting are within the scope of the CCIR.

SECTION 11 A: CHARACTERISTICS OF SYSTEMS FOR MONOCHROME AND COLOUR TELEVISION
Recommendations and Reports
Rec. 470-1, Rep. 624-1 1
RECOMMENDATION 470-1
TELEVISION SYSTEMS(1970 - 1974)
The CCIR,
CON SID ERIN G
(a) that many countries have established satisfactory monochrome television broadcasting services based on either 525-line or 625-line systems;(b) that a number of countries have established (or are in the process of establishing) satisfactory colour television broadcasting services based on the NTSC, PAL or SEC AM systems;(c) that it would add further complications to the interchange of programmes to have a greater multiplicity of systems,
UNANIM OUSLY RECOM M ENDS
1. that, for a country wishing to initiate a monochrome television service, a system using 525 or 625 lines as defined in Report 624-1 is to be preferred;2. that, of the systems described in this Report, systems A, C, E and F are not recommended for a newservice;3. that, for monochrome 625-line systems, the video-frequency characteristic described in Recommendation 472-1 is to be preferred;4. that, for a country wishing to initiate a colour television service, one of the systems defined inReport 624-1 or any suitable adaptation of the NTSC, PAL or SEC AM systems to any one of the monochromesystems defined in this Report is to be preferred.
REPORT 624-1
CHARACTERISTICS OF TELEVISION SYSTEMS(1974 - 1978)
The following Tables, given for information purposes, contain details of a number of different television systems in use at the time of the XlVth Plenary Assembly of the CCIR, Kyoto, 1978.
Specifications of the SECAM IV colour television system, which is still under consideration, are given in Annex II.
Information on the results of the comparative laboratory tests carried out on the various colour television systems in the period 1963-1966 by broadcasting authorities, Administrations and industrial organizations, together with the main parameters of systems may be found in Reports 406 and 407-1, XHth Plenary Assembly, New Delhi, 1970.
All television systems listed in this Report employ an aspect ratio of the picture display (width/height) of 4/3, a scanning sequence from left to right and from top to bottom and an interlace ratio of 2/1, resulting in a picture (frame) frequency of half the field frequency. All systems are capable of operating independently of the power supply frequency.

TABLE I - Basic characteristics o f video and synchronizing signals
Item Characteristics
System
A C ) M N C ( J) B, G H 1 D , K K1 L E ( ‘) Rec. 472-1 (1°)
1 Number o f lines per picture (frame) 405 525 625 625 625 625 625 625 625 625 819 625
2 Field frequency, nominal value (fields/second) (a) 50 60(59-94)
50 50 50 50 50 50 50 50 50 50
3 Line frequency f u and tolerance when operated non-synchronously (Hz) (3)
10 125 15 750 (15734-264 ±0-0003%)
15 625 ± 0-15%
15 625 ± 0 -02%
15 625 (7) ± 0-02%
(±0-0001% )
15 625 ± 0 -02%
(±0-0001 %)
15 625 ±0-0001 %
(*)
15 625 (7) ±0-02%
(±0-0001 %)
15 625 ±0-02%
(±0-0001 %)
15 625 ±0-02%
(±0-0001 %)
20 475 15 625 ±0-02%
(±0-0001 %)
3 (a) Maximum variation rate of line frequency valid for monochrome transmission (8) (•) ( %/s)
0.15 (n) 0-05 0-05 0-05 0-05 0-05 0-05
4 ( ‘)
Nom
inal
lev
els
of th
e co
mpo
site
vid
eo
sign
al
(see
Fig.
1)
(%) blanking level (reference level) 0 0 0 0 0 0 0 0 0 0 0
peak-white-level 100 100 100 100 100 100 100 100 100 100 100
synchronizing level -4 3 - 4 0 - 4 0 - 4 3 - 4 3 - 4 3 - 4 3 -4 3 -4 3 -4 3 - 4 3
difference between black and blanking level
0 7-5 ± 2-5 7-5 ± 2-5 0 0 0 0 0-7 0 (colour) 0-7 (mono.)
0 (colour) 0-7 (mono.)
0-5
5 Assumed gamma of display device for which pre-correction o f monochrome signal is made (6)
2-8 2-2 2-2 2.8 (n) (*)
6 Nominal video bandwidth (MHz) 3 4-2 4-2 5 5 5 5-5 6 6 6 105-0 or5-5 or6-0
7 Line synchronization see Table 1-1
8 Field synchronization see Table 1-2
(*) These systems are given for information only. They are not recommended for adoption by countries setting up a new television service (see Recommendation 470-1).
(*) It is also customary to define certain signal levels in 625-line systems, as follows:Synchronizing level = 0 Blanking level = 30 Peak white-level = 100
(J) Figures in brackets are valid for colour transmission.
(*) When the reference o f synchronism is being changed, this may be relaxed to 15 625 ± 0-01 %.(') See also Annex III.
(*) In Recommendation 472-1, a gamma value for the picture signal is given as approximately 0-4.(7) The exact value o f the tolerance for line frequency when the reference of synchronism is being changed
requires further study.(8) These values are not valid when the reference o f synchronism is being changed.(9) Further study is required to define maximum variation rate o f line frequency valid for colour transmission.
(10) Figures are given for comparison.(“ ) The values used in Japan are ±0.1.(12) Assumed value for overall gamma approximately 1.2.
Rep. 624-1

Rep. 624-1 3
(a) NTSC and PAL systems
FIGURE 1 - Levels in the composite signal and details o f line-synchronizing signals
1 blanking level2 peak white-level3 synchronizing level
4 difference between black and blanking levels5 peak-to-peak value of burst6 peak-to-peak value of colour sub-carrier

TABLE 1-1 - Details o f line synchronizing signals (see Fig. 1)
Durations (measured between half-amplitude points on the appropriate edges) for system
Symbol Characteristics A M O N C EB, G, H, I, D, K, K l, L (see also Rec. 472-1)
H Nominal line period (ps) 98-8 63-492(63-5555)
64 64 48-84 64 <5)
a Line-blanking interval ((is) 17-5 to 19 10-2 - 11-4 (10-9 ± 0-2)
10-24 to 11-52 11-8 to 12-2 9-2 to 9-8 12 ± 0-3
b Interval between time datum (O h) and back edge of line- blanking signal ((jls)
16 to 17 8-9 to 10-3 (9-2 to 10-3)
8-96 to 10-24 10-2 to 11 8-4 (2) 10-5 0
c Front porch (ps) 1-5 to 2-0 1-27 to 2-54 (1-27 to 2-22)
1-28 to 2-56 1-2 to 1-6 1-1 ± 0-1 1-5 ± 0-3 O
d Synchronizing pulse (ps) 8 to 10 4-19 - 5-71 (4-7 ± 0 1 )
4-22 to 5-76 4-8 to 5-2 2-4 to 2-6 4-7 ± 0-2
e Build-up time (10 to 90%) of the edges of the line-blanking signal (jxs)
0-25 to 0-5 <0-64« 0 -4 8 )
<0-64 0-2 to 0-4 0-2 to 0-4 0-3 ± 0-1
f Build-up time (10 to 90%) of the line-synchronizing pulses (l s) <0-25 <0-25 <0-25 0-2 to 0-4 0-10 to 0-20 0-2 ± 0-1 (4)
(1) Values in brackets apply to M/NTSC combination for the United States and are forecast for Canada and Japan.(2) Average calculated value, for information.(3) For system I, the values are 1-65 ± 0*1.(4) For system I, the values are 0-25 ± 0-05.(5) In France, and the countries of the OIRT, the tolerance for the instantaneous line period value is ± 0-032 /ts.

FIGURE 2 - Details o f field-synchronizing waveforms
FIGURES 2-1 - Diagrams applicable to all systems except E and M
Rep. 624-1 5
FIGURE 2-1 a - Signal at beginning o f each first field
FIGURE 2-1 b - Signal at beginning o f each second field
Note 1. — A A A indicates an unbroken sequence of edges of line-synchronizing pulses throughout the field-blanking period.Note 2. - At the beginning of each first field, the edge of the field-synchronizing pulse, Ov, coincides with the edge of a line-synchronizing pulse if I is an odd number of half-line periods as shown.Note 3. - At the beginning of each second field, the edge of the field-synchronizing pulse, Ov, falls midway between the edges of two line-synchronizing pulses if I is an odd number of half-line periods as shown.
(The durations are measured to the half-amplitude points on the appropriate edges)
FIGURE 2-lc - Details o f equalizing and synchronizing pulses

Rep. 624-1
FIGURE 2 - Details o f field-synchronizing waveforms
FIGURES 2-2 - Diagrams applicable to system E
FIGURE 2-2a - Signal at beginning o f each first field
FIGURE 2-2b - Signal at beginning o f each second field
Note 1. - A A A indicates an unbroken sequence of edges of line-synchronizing pulses throughout the field-blanking period.Note 2. - At the beginning of each first field, the edge of the field-synchronizing pulse, Ov, coincides with the edge of a line-synchronizing pulse.Note 3. — At the beginning of each second field, the edge of the field-synchronizing pulse, Ov, falls midway between the edges of two line-synchronizing pulses.
Blanking level
Sync, level
(The durations are measured to the half-amplitude points on the appropriate edges)
F IGURE 2-2c - Detail o f field-synchronizing pulse

Rep. 624-1
FIGURE 2 - Details o f field-synchronizing waveforms
FIGURES 2-3 - Diagrams applicable to system M
I1
1
lnnnnfinA A A A A
/ \Second field First field
Ljuuuijuimnnni ir Y in IIA A A A A A A A A A A A
See Fig. 2-3c
FIGURE 2-3a - Signal at beginning o f each first field
£ I!
If If! j '
:: l
Yinnniirm
JlilUUUUn
/ / ;nmmnnmrA A A A | A A A A A A A A A A A A A
| |/ °E2 V [---------- - i
First field Second field See Fig. 2-3c
FIGURE 2-3b - Signal at beginning o f each second field
Note 1. - A indicates an unbroken sequence of edges of line-synchronizing pulses throughout the field-blanking period.Note 2. - Field-one line numbers start with the first equalizing pulse in Field 1, designated O gi in Fig. 2-3a.Note 3. — Field-two line numbers start with the second equalizing pulse in Field 2, one-half-line period after O f? inFig. 2-3 b.
FIGURE 2-3c - Details o f equalizing and synchronizing pulses

00TABLE 1-2 - Details o f field synchronizing signals (see Fig. 2)
Durations (measured between half-amplitude points on the appropriate edges) for system
Symbol Characteristics A M N C EB, G, H, I, D, K, K l, L (see also
Rec. 472-1)
V Field period (ms) 20 16-667 0 (16-6833)
20 20 20 20
j Field-blanking period (for H and a, see Table 1-1) (13 to \5-S)H + a (2)
(19 to 21 )H + a(10)
(19 to 25)H + a 25 H + a 33 H + a 25 H + a
r (8) Build-up time (10 to 90%) of the edges of field-blanking pulses ((is) 0-25 to 0-5 <6-35 <6-35 <6-4 < 2 0-3 ± 0-1
k (8) Interval between front edge of field-blanking interval and front edge of first equalizing pulse (|is)
(1-5 ± 0-1) 3 ± 2 (8) (systems
B/SECAM, G/SECAM,
D, K, K l and L only; no ref. in
Rec. 472-1)
/ Duration o f first sequence of equalizing pulses (4) 3 H 3 H 2-5 H (5) 2-5 H
m Duration of sequence of synchronizing pulses 4 H 3 H 3 H 2-5 H 2-5 H
n Duration of second sequence of equalizing pulses (4) 3 H 3 H 2-5 H 2-5 H
P Duration of equalizing pulse ((is) (2*3 ± 0 - l ) (11) 2-30 to 2-56 2-3 to 2-5 2-35 ± 0-1
Q Duration of field-synchronizing pulse (ps) 38 0 to 42 0 27-1 nominal value
26-52 to 28-16 26-8 to 27-2 19 to 21 27-3 (9) (nominal value)
r Interval between field-synchronizing pulses (|is) 11-4 to 7-4 (4-7 ±0-1) 3-84 to 5-63 4-8 to 5-2 4-7 ± 0-2 (6)
s Build-up time (10 to 90%) of synchronizing and equalizing pulses ((is) <0-25 <0-25 <0-25 0-2 to 0-4 < 0-2 0-2 ± 0-1 O
See notes page 9.
Rep. 624-1

(1) The value in brackets applies to the M/NTSC system.(2) The coefficient of H is an integral multiple of 0.5.(3) This value is to be specified more precisely at a later date.(4) In system A, there are no equalizing pulses; the field-blanking period j commences in
advance of the field-synchronizing pulse sequence by an interval of from 0.015 H to 0.515 H.
(5) In system E , there are no equalizing pulses and only one field-synchronizing pulsewhich starts 3 H after the beginning of the field-blanking pulse (see item I* inFig. 2-2).
(6) For system 1: 4.7 ±0.1 .(7) For system 1: 0.25 ± 0.05.
(8) Not indicated in the diagram.(9) For system I: 27.3 ± 0.1.
(10) The following values are used in Japan :
0.07 V * q'01 v for colour transmission,
0.05 V * v for monochrome transmission,
where v is the field period.( i t) The following specification is also applied in Japan: an equalizing pulse has 0.45 to
0.5 times the area of a line-synchronizing pulse.
Rep. 624-1

9
TABLE II - Characteristics o f the video signal for colour television
Item Characteristics
Colour television system
M/NTSC M/PAL B, G, H/PAL I/PAL B, D, G, H, K, K l, L/SECAM
2.1 Assumed chromaticity coordinates (CIE 1931) for primary colours of receiver
x y Red 0-67 0-33 Green 0-21 0-71 Blue 014 008
x y Red 0-64 0-33 Green 0-29 0-60 Blue 0-15 0-06
o
2.2 Chromaticity coordinates for equal primary signals E r = E g = E'b
Illuminant C * I
(2)Illuminant D w ^ _ Q.329
0
2.3 Assumed gamma value of the receiver for which the primary signals are pre-corrected
2-2 2-8
2.4 Luminance signal E y = 0-299 E r + 0-587 E g + 0-114 Eh (4) E r , E g and E b are gamma — pre-corrected primary signals (5)
2.5 Chrominance signals (Colour difference)
Ei = -0 -2 7 (Eh - Eh) + + 0-74(Eh - E y )
£ q = 0-41 (E B -E y ) ++ 0-48 (E b - E y )
E'u = 0-493(Eb - E y )
E y = 0-877(Er - E y )
D'r - — 1-9(Er - E y )
Dh = 1-5 (E b - E y )
2.6 Attenuation of colour difference signals
dB MHz j < 3 at 1-3 \ > 20 at 3-6 ( < 2 at 0-4
E q \ < 6 at 0-5 ( > 6 at 0-6
dB MHz
Eu { < 2 at 1-3 E y \ >20 at 3-6
dB MHz
Eh ( < 3 at 1-3 E y ( >20 at 4
dB MHz
D r 1 < 3 at 1-3 D b \ >30 at 3-5
Low frequency pre-correction not taken into account (8)
See notes page 16.
Rep. 624-1

TABLE II (continued)
Item Characteristics
Colour television system
M/NTSC M/PAL B, G, H/PAL I/PAL B, D, G, H, K, K l, L/SECAM
2.7 Low frequency pre-correction of colour difference signals
For sinusoidal signals: D'r* = ABF( f ) . D ’r Db* = A sF (f) • Db A m l + j ( / / / r )
A „ M ) - j + j ( / /3/ x)/ = signal frequency
(kHz) f 1 = 85 kHz
O(See Fig. 6)
2.8 Time-coincidence error between luminance and chrominance signals (p.s)
< 0 0 5Excluding pre-correction for receiver response
2.9 Equation of composite colour signal
Em = Ey ++ Eq sin (2nfsct + 33°)+ -f Ei cos (2tifgct + 33°)
where:
Ey , see item 2.4 Eq and £ /, see item 2.5 f sc, see item 2.11 (See also Fig. 4a)
Em = Ey + Eu sin 2nfsct ± Ey cos 2nfsct
where:
Ey, see item 2.4 Eu and Ey, see item 2.5 f sc, see item 2.11The sign of the Ev component is the same as that of the sub-carrier burst (changing for each line) (see item 2.16 and Fig. 4b)
Em —E'y + Ceos 27T
CfOEr + &fOR So D'&* dr)or Ejyj = E 'y Geos li t
<OBt + ^ O B ^ 0 ° B* dr) alternately from line to line
where:Ey , see item 2.4 foR and foB, see item 2.11 A/ob and Af 0B, see item 2.12Dr * and Db *, see item 2.7 G, see item 2.13
2.10 Type of chrominance sub-carrier modulation
Suppressed-carrier amplitude-modulation of two sub-carriers in quadrature Frequency modulation
See notes page 16.

TABLE II (continued)
Item Characteristics
Colour television system
M/NTSC M/PAL B, G, H/PAL I/PAL B, D, G, H, K, K l, L/SECAM
2.11 Chrominance sub-carrier frequency
(a) nominal value and tolerance (Hz)
3 579 545 ± 10 3 575 611-49 ± 10 4 433 618-75 ± 5 4433 618-75 ± 1 («) (16) foR = 4 406 250 ± 2000
foD = 4 250 000 ± 2000 (9)
(b) relationship between chrominance subcarrier frequency f sc and line frequency f t t
455fee 2 &
909 fee 4 fa
Unmodulated sub-carrier at beginning of line 282 f y for foR 272/ H for foB (10)
2.12 Bandwidth of chrominance sidebands (quadrature modulation of sub-carrier) (kHz)
orFrequency deviation of chrominance sub-carrier (frequency modulation of sub-carrier) (kHz)
+620fee
-1 300
+600fee
-1 3 0 0
+570fee
-1 300
+ 1070fee
-1 3 0 0
Nominal deviation D'* = 1
(12)
Maximumdeviation
AfORe 1)
280 ± 9 ( ± 14)
+350 + 18 (±35)
-5 0 6 + 25 (±50)
AfOB (U)
230 ± 7 (±11-5)
+506 + 25 (± 50)
-3 5 0 + 18 (±35)
See notes page 16.

TABLE II (continued)
Item Characteristics
Colour television system
M/NTSC M/PAL B, G, H/PAL I/PAL B, D, G, H, K, K l, L/SECAM
2.13 Amplitude of chrominance sub-carrier G = V e ? + Eq* C = V & + ° 9) <20) 1 + j 16F
G - M° 1 + j 1.26/r
where the peak-to-peak amplitude, 2M0, is 23 ±2-5% of the luminance amplitude (between blanking level and peak-white)
, „ f fo and F — t — - fJ o /
where / 0 = 4286 kHzand / i s the instantaneous sub-carrier frequency.The deviation of frequency, f 0, from its nominal value due to misalignment of the circuits concerned should not exceed ± 20 kHz.(See Fig. 7)
2.14 Synchronization of chrominance sub-carrier
Sub-carrier burst on blanking back porch
Sub-carrier burst on blanking back porch
(g) Start of sub-carrier burst (see Fig. la) (jzs)
4-71 to 5-71at least 0-38 (xs after the trailing edge of line synchronization signal
5-8 ± 01 after epoch Oh 5-6 ± 01 after epoch Oh(17)
(h) Duration of subcarrier burst (see Fig. la) (ps)
2-23 to 3-11 minimum 8 cycles
2-52 ± 0-28 (9 ± 1 cycles)
2-25 ± 0-23 (10 ± 1 cycles)
See notes page 16.

TABLE II (continued)
Item Characteristics
Colour television system
M/NTSC M/PAL B, G, H/PAL I/PAL B, D, G, H, K, K l,L/SECAM
2.15 Peak-to-peak value ofchrominance sub-carrier burst (see Fig. la)
(18)
4/10 of difference between blanking level and peak white-level ± 10%
3/7 of difference between blanking level and peak white-level ± 1 0 % For system I, the tolerance is ± 3% (19) (20) (19)
2.16 Phase of chrominancesub-carrier burst (see Fig. la)
180° relative to (Eb — Ey) axis (see Fig. 4a)
135° relative to E u axis with the following sign (see Figs. 4b and 5a)
LineField
1 2 3 4
even — — ± ±odd ± ± — -
2.17 Blanking of chrominance sub-carrier
Following each equalizing pulse and also during the broad synchronizing pulses in the field- blanking interval
11 lines of field-blanking interval:
260 to 270 522 to 7 259 to 269 223 to 8
(See Fig. 5b)
9 lines of the field-blanking interval: lines 311 to 319 inclusive
623 to 6 inclusive 310 to 318 inclusive 622 to 5 inclusive
(See Fig. 5a)
(a) from leading edge of line-blanking signal up to i = 5-6 ± 0-2 (jzs) after epoch Oh , i.e. during c + i (seeFig. 16) (13)
(b) during field-blanking interval, excluding colour synchronization signals(See item 2.18)
See notes page 16.

TABLE II (continued)
Item Characteristics
Colour television system
M/NTSC M/PAL B, G, H/PAL I/PAL B, D, G, H, K, K l, L/SECAM
2.18 Synchronization of chrominance sub-carrier switching during line blanking
Does not apply to NTSC systems
By Ev chrominance component of sub-carrier burst (See item 2.16) By identification signals occupying 9 lines of field-blanking period:(a) line 7 to 15 in 1st and
3rd field(b) line 320 to 328 in
2nd and 4th field (See Fig. 9)(14) (15)
Shape o f video signals corresponding to identification signals:For lines Dr—Trapezoid with linear variation from beginning of line on 15 ± 5£ts from 0 up to level +1-25 land then constant at the (level +1-25 ± 0 06 (± 0 1 3 ) | (See Fig. 8)
For lines Db—Trapezoid with linear variation from the beginning of the line on 18 ± 6 [xs (20 ± 10[xs) from 0 down to level —1-52 and then constant at the level -1 -52 ± 0 07 (± 0 1 5 ) (see Fig. 8)
(u)Peak-to-peak amplitude o f identification signals:For lines Db ’. 500 ± 50 mV
For lines Dr : 540
See notes page 16.

TABLE II (continued)
Colour television system
Item CharacteristicsM/NTSC M/PAL B, G, H/PAL I/PAL B, D, G, H, K, K l,
L/SECAM
if amplitude of luminance signal (between blanking level and peak white) equals 700 mVMaximum deviation during transmission o f identification signals (kH z):For lines D r : 4- 350 ± 1 8
( ± 35)For lines Db : — 350 ± 1 8
( ± 35)( 0
0 For SECAM systems and for existing sets, it is provisionally allowed to use the following chromaticity coordinates for the primary colours and white:
X yRed 0-67 0-33Green 0-21 0-71Blue 014 0-08White 0-310 0-316
(2) In Japan, the chromaticity of studio monitors is adjusted to a D-white at 9300 K.
(8) The primary signals are pre-corrected so that the optimum quality is obtained with a display having the indicated value of gamma (See Annex III).
(4) In certain countries using the SECAM systems and in Japan it is also permitted to obtain the luminance signal as a direct output from an independent photo-electric analyser instead of from the primary signals.
(5) For the SECAM system, it is allowable to apply a correction to reduce interference distortions between the luminance and chrominance signals by an attenuation of the luminance signal components as a function of the amplitude of the luminance components in the chrominance band.
(6) This value will be defined more precisely later.0 The maximum deviations from the nominal shape of the curve (see Fig. 6) should
not exceed ±0-5 dB in the frequency range from 0-1 to 0-5 MHz and ± 1 -0 dB in the frequency range from 0-5 to 1-3 MHz.
(8) The tolerance may be ± 5 Hz for a signal originating overseas.Maximum rate of variation of f te: 0-1 Hz/s.
0 A reduction of the tolerance is desirable.(10) The initial phase of the sub-carrier undergoes in each line a variation defined by the
following rule:
From frame to frame, by 0°: 180°: 0°: 180° and so on, and also from line to line in either one of the following two patterns:
0°: 0°: 180°: 0°: 0°: 180°: and so on, or 0°: 0°: 0°: 180°: 180°: 180°: and so on.
(u ) Provisionally, the tolerances may be extended up to the values given in brackets.(12) The unity value represents the amplitude of the luminance signal between the blanking
level and the peak white-level.(13) The value of the tolerance will be defined more precisely later.0 ) Research is in progress with a view to using the chrominance signal on the line-blanking
back-porch (line identification) as the colour synchronization signal both in specialized equipment and in receivers available to the public.
(15) The order in which the identification signals D r * and D b * appear on the four fields of a complete cycle given in Fig. 9 is in conformity with Recommendation 469-1.
(lfl) This tolerance may not be maintained during such operational procedures as “genlock”.
(17) Transmitter pre-correction for receiver group delay is not included.0 ) For the use of automatic gain control circuits, it is important that the burst amplitude
should maintain the correct ratio with the chrominance signal amplitude.
(19) During transmission of a monochrome programme of significant duration, in order to ensure satisfactory operation of colour-killers in receivers, all signals having the same nominal frequency as the colour sub-carrier that appears in the line-blanking interval, should be attenuated by at least 35 dB below the peak-to-peak value of the burst given in item 2.15, column 3 of Table II, and shown as Item 5 in Fig. 1.
(20) The value given in N ote(19) is accepted on a tentative basis.

TABLE III - Characteristics o f the radiated signals (monochrome and colour)
Item Characteristics A ( “ ) M N C (« ) B,G H I D ,K K l L E ( “ )
1
S '
Nominal radio-frequency channel bandwidth (MHz) 6 6 7
B: 7 G : 8 8 8 8 8 8 14
2 eiE8
Sound carrier relative to vision carrier (MHz) -3 -5 +4.5 (l4) +4-5 + 5-5
+5-5± 0 0 0 1 +5-5
+5-9996±0-0005
+6-5±0-001 +6-5 +6-5 + 11-15 (*•)
3 toc1a09
Nearest edge o f channel relative to vision carrier (MHz) + 1-25 -1 -25 -1 -25 -1-25 -1-25 -1 -25 -1 -25 -1 -25 -1 -25 -1-25 ±2-83 (I3)
4CV§•£
Nominal width o f main sideband (MHz) 3 4-2 4-2 5 5 5 5-5 6 6 6 10
5 Nominal width o f vestigial sideband (MHz) 0-75 0-75 0-75 0-75 0-75 1-25 1-25 0-75 1-25 1-25 2
6 Minimum attenuation o f vestigial sideband (dB at MHz) (»)
notspecified
20 (-1 -2 5 ) 42 ( —3-58)
20 (-1 -2 5 ) 42 (-3 -5 )
20 (-1 -25 ) 20 ( - 3 0)
20 (-1 -25 ) 20 ( - 3 0) 30 (-4 -4 3 )
(*)
20 (-1 -7 5 ) 20 (-3 -0 )
20 (-3 -0 ) 30 (-4 -4 3 )
20 (-1 -2 5 ) 30(—4-33
± 0 -1 )(*)
30 dB at -4 -3 MHz
20 dB at -2 -7 MHz
ref.: 0 dB a t +0-8 MHz
30 dB a t -4 -3 MHz
15 dB at -2 -7 MHz
ref.: 0 dB a t +0-8 MHz
15 dB at 2-7 MHz ref.: 0 dB
at +0-8 MHz
7 Type and polarity o f vision modulations A3C pos. A5C neg. A5C neg. A5C pos. A5C neg. A5C neg. A5C neg. A5C neg. A5C neg. A5C pos. A5C pos.
81j Sj
Synchronizing level < 3 100 100 < 3 100 100 100 100 100 < 6 < 3
•3 S4 U Blanking level 30 72-5 to 77-5 72-5 to 77-5 22-5 to 27-5 75 ± 2-5 72-5 to 77-5 76 ± 2 75 ± 2-5 75 ± 2-5 30 ± 2 30 ± 2
■3 a o
■s 2
Difference between black level and blanking level
0(nominal)
2-88 to 6-75 2-88 to 6-75 0(nominal)
0 to 2 (nominal)
0 to 7 0(nominal)
0 to 4-5 0 to 4-5 0 to 4-5 0 to 4-5
■S’SS I Peak white-level 100 10 to 15 10 to 15 100 10 to 12-5 10 to 12-5 20 ± 2 12-5 (4)(15) 10 to 12-5 100 («-* 110)
(s)100
See notes page 18.

00
TABLE III (continued)
Item Characteristics A O M N C O B,G H I D ,K K l L E O
9 Type o f sound modulation A 3 F 3 F 3 A 3 F 3 F 3 F 3 F 3 F 3 A 3 A 3
10 Frequency deviation (kHz) ± 2 5 ± 2 5 ± 5 0 ± 5 0 ± 5 0 ± 5 0 ± 5 0
11 Pre-emphasis for modulation (tzs) 75 75 50 50 50 50 50 50
12 Ratio o f effective radiated powers o f vision and sound (“ )
4/1 10/1 to 5/1 C)
10/1 to 5/1 4/1 1 0 /1 0 0 5/1 to 10/1 5/1 10/1 to 5/1 10/1 10/1 10/1
13 Pre-correction for receiver group-delay characteristics a t medium video frequencies (ns) (see also Fig. 3)
notspecified
0 O (’a)
14 Pre-correction for receiver group- delay characteristics at colour subcarrier frequency (ns) (see Fig. 3)
notspecified
-1 7 0(nominal)
-1 7 0 (nominal) (•) C«
I1) In some cases, low-power transmitters are operated without vestigial-sideband filter.
(*) For B/SECAM and G/SECAM : 30 dB at -4 -33 MHz, within the limits o f ± 0 1 MHz.(*) In some countries, members o f the O.I.R.T., additional specifications are in use:
(a) not less than 40 dB a t -4-286 M Hz ± O S MHz,(b) 0 dB from -0 -75 M Hz to +6-0 MHz,(c) no t less than 20 dB at 4-6-375 M Hz and higher;Reference: 0 dB at +1-5 MHz.
(4) The U.S.S.R. has adopted the value 15 + 2%.As the Socialist Republic o f Roumania has not yet decided upon a system o f colour television, the values o f 10 to 12-5 for D and K monochrome television systems remain valid for this country.
O The peak white-level refers to a transmission without colour sub-carrier. The figure in brackets corresponds to the peak value o f the transmitted signal, taking into account the colour sub-carrier o f the respective colour television system.
I6) In Japan, a ratio of 1/0.15 to 1/0.35 is used.
(7) Studies performed in the Federal Republic of Germany, Italy and Sweden have indicated that ratios between 10/1 and 20/1 present certain advantages (see Docs. [CCIR, 1974-78a, b and c]). The change to a ratio of 20/1 has proved so advantageous that it will be introduced permanently in the Federal Republic of Germany. Other administrations are invited to make similar tests to determine the validity of these studies.
(•) In the Netherlands, the specifications o f the pre-correction at the transmitter for receiver group-delay characteristics is as follows: A sine wave introduced at those terminals o f the transmitter which are normally fed by the encoded (colour) video signal shall produce a radiated signal having an envelope delay, relative to the average delay between 0-05 M Hz and 0-2 MHz as indicated in Fig. 3a, curve A. In the Federal Republic o f Germany, the correction is made according to curve B in the same figure. Tolerances are shown in the table under Fig. 3a. From Doc. XI/170, 1966-1969, it is learned that Spain uses curve A. The O.I.R.T. countries using the B/SECAM and G/SECAM systems use a nominal pre-correction o f 90 ns a t medium video frequencies.In Sweden, the pre-correction is 0 ± 40 ns up to 3.6 MHz. For 4.43 MHz, the correction is —170 ± 20 ns and for 5 MHz it is —350 ± 80 ns.
O These systems are given for information only. They are not recommended for adoption by countries setting up a new television service (see Recommendation 470-1).
(n ) The values to be considered, are:— the r.m.s. value o f the carrier at the peak o f the modulation envelope for the vision signal. For system
L, only the luminance signal is to be considered.(See Note (6) above);
— the r.m.s. value o f the unmodulated carrier for amplitude-modulated and frequency-modulated sound transmissions.
O It may be that the Austrian Administration will continue to use a 5/1 power ratio in certain cases, when necessary.
(**) This system is used both normally and reversed on the frequency scale in a t£te-b£che arrangement.
(14) In Japan, the values +4.5 ± 0.001 are used.(15) A new parameter “white level with sub-carrier” should be specified at a later date. For that parameter, the U.S.S.R.
has adopted the value of 7 ± 2%.(®a) Not yet determined. The Czechoslovak Socialist Republic proposes +90 ns (nominal value).
(8ft) Not yet determined. The Czechoslovak Socialist Republic proposes +25 ns (nominal value).
Rep. 624-1

Rep. 624-1
Frequency (MHz)
(a) B/PAL and G/PAL systems (b) M/PAL and M/NTSC systems(See Table III (9))
FIGURE 3 - Curve o f pre-correction for receiver group-delay characteristics
Nominal values and tolerances (ns)
Frequency (MHz) Curve A Curve B
0-25 ± 5 ± 0100 + 30 ± 50 ± 53 ± 40200 ± 60 ± 50 + 90 ± 40300 + 60 ± 50 ± 75 ± 4 03-75 0 ± 50 0 ± 4 04-43 -1 7 0 ± 35 -1 7 0 ± 404-80 -2 6 0 ± 75 -4 0 0 ± 9 0

20 Rep. 624-1
Eby
0,493 (Eb - Ey)
B : phase of the burst
A
\\
\\
/
B /
/
/ B : phase of the burst in even lines of the first and second fields and in odd lines of the third and fourth fields.
(b) PAL system
FIGURE 4 - Chrominance axes and phase o f the burst

Rep. 624-1
| A B
z=V n r r { j u u i j u r i ^ u il uI 308 I 309 I 310 | 311 I 312 I 313 I 314 I 315 I 316 I 317 I 318 I 319 j 320
I I A I B
I 621 I 622 I 623 I 624 I 625 | 1 I 2 I 3 I 4 I 5 I 6 | 7
I I A | IB
II
riiT T U uuuL nnnnn irru itI 308 I 309 | 310 | 311 I 312 I 313 I 314 I 315 I 316 ! 317 I 318 | 319 j 320 I
l A n / v i a I m t I 1 1 1“ i M m r i T T T T i J U U U U i ^ ^i
I 621 I 622 I 623 I 624 I 625 j 1 I 2 I 3 I 4 I 5 I 6 | 7 I
C <III
IV
FIGURE 5a - Burst-blanking sequence in the B, G, H and i/PAL systems
Ov : field-synchronizing datum.I, II, III, IV : first, second, third and fourth fields.A : phase of burst; nominal value + 135°.B : phase of burst; nominal value - 135°.C : burst-blanking intervals.

22 Rep. 624-1
F* F F* F A B
T T n n n A A ^ n j^ T T T m j u u irI 519 I 520 I 521 I 522 523 I 524 I 525 I 1 I 2 I 3 I 4 I 5 I 6 I 7 I 8 I 9 I 10
F F* F
•r~\ r~ \ t r ~ \ n i ■■^ ^ ^ r ir m n n n m jju u m r
A B
t i
i n m r YI 257 I 258 I 259 | 260 I 261 I 262 I 263 I 264 I 265 I 266 I 267 I 268 I 269 I 270 I 271 I 272
! i I 'A I BF F* F
l £ \ lTTTTirl^JU U ^FTTTTT^ [H i] if523 I 524 I 525 J 1 I 2 I 3 I 4 I 5 I 6 I 7 j 8 I 9 I 10
I 1I A I IB I
I IV I M l I
niTlTTliUUULfUrirTTTl UTUTUI 257 I 258 I 259 260 I 261 I 262 I 263 I 264 I 265 I 266 I 267 I 268 I 269 270 I 271 I 272
I I 1 I I ' l l
II 519 I 520 I 521 I 522
I IF* F
niii
IV
FIGURE 5b - Burst-blanking sequence in M/PAL system
Ov : field-synchronizing datum.I, II, III, IV : first, second, third and fourth fields.A : phase of burst; nominal value + 135°.B : phase of burst; nominal value - 135°.C : burst-blanking intervals.

Resp
onse
(d
B)
Rep. 624-1 23
Frequency (kHz)
FIGURE 6 - Nominal response o f transfer function resulting from the video-frequency precorrection circuit A b f (f) and the low-pass filter (See Table II, item 2.1)

Rep. 624-1
Frequency (MHz)
FIGURE 7 - Attenuation curve o f frequency correction A f j f (f)
Deviations from the nominal curve outside point f Q must not exceed ± 0.5 dB
Frequency scale Relative peak-to-peak values
FIGURE 8 - Shape o f video signals corresponding to the chrominance synchronization signals
The value 1 represents the amplitude of the luminance signal between the blanking level and the white level. Provisionally, the tolerances may be extended up to the values given in brackets.

Rep. 624-1
End of the preceding 4-field sequence Beginning of first field
6211622162 3 16241625 1 | 2 | 3 | 4 | 5 | 6 | 7 | 8 | 9 | 10 | 11 | 12 | 13 14 I 15 16 | 17 | 18 | 19 | 20 | 21 | 22 | 23 |
mnmnnnrO r Dg
End of first field | Beginning of second fieldDr
13091 310 | 311 | 3121 313 | 314 | 315 | 316 | 3171 318 | 319 13201 32113221323 132 4 13251326 132 7 1328 132913 3 0 1 3311332 1333 1334 1335133 6 1
hnrnnnnrOr Ol
End of second field Beginning o f third fieldDb Or
16211622162316241625 1 | 2 | 3 | 4 | 5 | 6 | 7 | 8 | 9 | 10 | 11 | 12 | 13 [ 14 [ 15 | 16 | 17 J 18 | 19 | 20 | 21 | 22 | 23 |
imflffinfmMiuinnnnrriwDb d £ o t d *r
End of third field I Beginning of fourth field
nmnnnnnfD£
13091 310 | 311 1312 1313 | 314 | 315 | 316 | 317 | 318 | 319 13201 32113221323 1324 1325 1326 | 3271328 13 2 9 1330 1331 1332 1333 1334 1335 1336 |
f t^jEZZjE nTimnrf
O r Dg
FIGURE 9 - Sequence o f Dr * or Dr * signal over four consecutive fields
B B
FIGURE 10 - Significance o f items 1 to 5 in Table III
B : Channel limit V : Vision carrier S : Sound carrier
REFERENCES
CCIR Documents [1966-69]: X I /170 (Spain).[1974-78]: a. 11/319 (Germany (Federal Republic of)); b. 11.422 (Italy); c. 11/327 (Sweden).

26 Rep. 624-1
ANNEX I
SYSTEMS USED IN VARIOUS COUNTRIES
Explanation of signs used in the table:
*: planned (whether the standard is indicated or not);
—: not yet planned, or no information received;
/ : the abbreviation following the stroke indicates the colour transmission system in use (NTSC, PAL, orSECAM);
(Figures in brackets refer to the notes following the table).
CountrySystem used in bands:
i / m IV/V
Algeria (Algerian Democratic and Popular Republic) . B, E/PAL (13) (16) G*, H*/PAL(13) (16)Germany (Federal Republic o f ) ..................................... B/PAL G/PALNetherlands Antilles............................................................. M _Saudi Arabia (Kingdom o f ) ............................................. B/SECAM G/SECAM —Argentine R epublic............................................................. N NA u str a lia .............................................................................. B/PAL (22) */PAL —A u str ia .................................................................................. B/PAL G/PAL (1)Bangladesh (People’s Republic o f ) ..................................... B/PAL -B elg ium .................................................................................. C, B/PAL (17) H/PALBenin (People’s Republic o f ) ............................................. Kl* (16) Kl* (16)Brazil (Federative Republic o f ) ......................................... M/PAL M/PALBulgaria (People’s Republic of) ..................................... D/SECAM K/SECAMBurundi (Republic of) ..................................................... K l* (16) Kl* (16)Cameroon (United Republic o f ) ..................................... Kl* (15) (16) K l* (15) (16)Canada .................................................................................. M/NTSC M/NTSCCentral African Empire ................................................. K l* (16) Kl* (16)C h i l e ...................................................................................... M/NTSC M/NTSCCyprus (Republic o f ) ......................................................... B H* (2) (18)Colombia (Republic o f ) ..................................................... M M*Congo (People’s Republic of th e ) ..................................... Kl* (16) Kl* (16)Korea (Republic o f ) ......................................................... M —Ivory Coast (Republic of t h e ) ......................................... Kl* (16) Kl* (16)C u b a ...................................................................................... M MD e n m a r k .............................................................................. B/PAL G*Egypt (Arab Republic o f ) ................................................. B (16) G*, H* (14) (16)Group of Territories represented by the French Overseas
Post and Telecommunication A g e n c y ......................... K l _S p a in ...................................................................................... B GUnited States of A m e r ic a ................................................. M/NTSC M/NTSCEthiopia .............................................................................. B* (16) G (16)F in la n d .................................................................................. B/PAL G/PALFrance .................................................................................. E L/SECAMGabon R ep u b lic ................................................................. K l* (16) Kl* (16)Ghana...................................................................................... B*, G* (16) G* (16)G r e e c e .................................................................................. B* G* (3)Guinea (People’s Revolutionary Republic of).................... Kl* (15) (16) K l* (15) (16)Upper Volta (Republic o f ) ................................................. K l* (16) Kl* (16)Hungarian People’s Republic ......................................... D/SECAM K/SECAMIndia (Republic o f ) ............................................................. B —Indonesia (Republic o f ) ..................................................... B/PAL —I r a n ...................................................................................... B/SECAM G/SECAMI r e la n d .................................................................................. I/PAL (4) (23) I/PALI c e la n d .................................................................................. — G* (2) (5)Israel (State o f ) .................................................................. B G (6)I t a l y ...................................................................................... B/PAL G/PALJam aica..................................... , ........................................ N _Japan ...................................................................................... M/NTSC M/NTSCJordan (Hashemite Kingdom o f ) ..................................... B G*Kenya (Republic o f ) ......................................................... B* (16) G*. I* (16)Kuwait (State o f ) .................................................................. B G* (19)Liberia (Republic o f ) ......................................................... B* (8) (16) H* (8) (16)Libya (Socialist People’s Libyan Arab Jamahiriya) . . . B* (16) G* (16)Luxembourg.......................................................................... C L* (2)Madagascar (Democratic Republic o f ) ............................. K l* (16) K l* (16)Malaysia.................................................................................. B G*

Rep. 624-1 27
CountrySystem used in bands:
I/III IV/V
M a la w i.................................................................................. B* GO) (16) G* (10) (16)Mali (Republic o f ) .............................................................. Kl* (16) K l* (16)Morocco (Kingdom o f ) ..................................................... B H*M auritiu s.............................................................................. B _Mauritania (Islamic Republic o f ) ..................................... Kl* (16) K l* (16)M e x ic o .................................................................................. MM onaco.................................................................................. E L*Niger (Republic of t h e ) ...................................................... Kl* (16) K l* (16)Nigeria (Federal Republic o f ) ......................................... B (16) I* (16)N orw ay .................................................................................. B/PAL G* (3)New Z e a la n d ...................................................................... B/PALUganda (Republic o f ) ......................................................... B (9) (16) G* (9) (16)Pakistan (Islamic Republic o f ) ......................................... BPanama (Republic o f ) ......................................................... M —Netherlands (Kingdom of t h e ) ......................................... B/PAL G/PAL (21)P e r u ...................................................................................... M MPoland (People’s Republic o f ) ......................................... D/SECAM K/SECAMPortugal .............................................................................. B GPortuguese Oversea P ro v in ces ......................................... I* (16) I* (16)German Democratic R ep u b lic ......................................... B/SECAM G/SECAMR h o d e s ia .............................................................................. B (10) G* GO)Roumania (Socialist Republic o f ) ..................................... D K* (2)United Kingdom of Great Britain and Northern Ireland A I/PALRwanda (Republic o f ) ..................................................... Kl* (16) K l* (16)Senegal (Republic of t h e ) ................................................. Kl* (16) K l* (16)Sierra L eo n e .......................................................................... B (11) (16) G* (16)Singapore (Republic o f ) ..................................................... B G* (20)Somali Democratic Republic............................................. B* (16) G* (16)Sri Lanka (Democratic Socialist Republic o f ) ................. B —South Africa (Republic o f ) ............................................. I* (16) I* (16)S w ed en .................................................................................. B/PAL G/PALSwitzerland (Confederation o f ) ......................................... B/PAL G/PAL (7)Surinam (Republic o f ) ......................................................... M —Tanzania (United Republic o f ) ......................................... B*, I* (12) (16) I* (12) (16)Chad (Republic of t h e ) ..................................................... Kl* (16) K l* 0 6 )Thailand .............................................................................. B/PAL G/PAL*Czechoslovak Socialist R e p u b lic ..................................... D/SECAM K/SECAM
Oversea Territories for the international relations ofwhich the Government of the United Kingdom ofGreat Britain and Northern Ireland are responsible B*, I* (16) I* (16)
Oversea Territories of the United Kingdom in theEuropean Broadcasting A rea ......................................... — H* (2)
Togolese R e p u b lic .............................................................. Kl* (16) Kl* (16)T u r k e y .................................................................................. B G*Union of Soviet Socialist Republics................................. D/SECAM K/SECAMUruguay (Oriental Republic o f ) ..................................... N —Venezuela (Republic o f ) ..................................................... M —Yugoslavia (Socialist Federal Republic o f ) ..................... B/PAL G/PALZaire (Republic o f ) ............................................................. Kl* (15) (16) K l* (15) (16)Zambia (Republic o f ) ......................................................... B* (10) (16) G* (10) (16)
Note 1. — Austria reserves the right to the possible use of additional frequency-modulated sound carriers, in the band between 5-75 and 6 75 MHz, in relation to the picture carrier.
Note 2. — The Indications and Notes are based on indications and notes given in Chapter 2 of the “Technical data used by the European VHF/UHF Broadcasting Conference” .
Note 3. — No definite decision has been taken about the width of the residual sideband, but this country is willing to accept the assumption that for planning purposes the residual sideband will be 0-75 MHz wide.
Note 4. — System I will be used at all stations. In addition, during a transition period, transmissions on system A will be made from the Dublin and Sligo stations.
Note 5. — This country does not at present intend to use Bands IV and V, but accepts the parameters given in the table under “Standard G” as television standard in Bands IV and V.
Note 6. — No final decision has been taken about the width of the residual sideband, but for planning purposes this country is willing to accept the assumption of a residual sideband 1-25 MHz wide.

28 Rep. 624-1
Note 7. — The Swiss Administration is planning to use additional frequency-modulated sound carriers, in the frequency interval between the spacings of 5-5 and 6-5 MHz in relation to the picture carrier, at levels lower than or equal to the normal level of the sound carrier, for additional sound-tracks or for sound broadcasting.
Note 8. — Liberia accepted for planning purposes Standard B or H but reserves the right to adopt Standard M.
Note 9. — Uganda is already committed to Standard B in band III. Standard G is planned for bands IV and V although further consideration will be given to other standards when bands IV and V stations are to be commissioned.
Note 10. — Indications for Malawi, Rhodesia and Zambia are based on indications for Rhodesia and Nyasaland (Federation of) given in the Final Acts of the African VHF/UHF Broadcasting Conference, Geneva, 1963. Standard B is now in use in band I; no final decision is taken regarding systems to be used in bands III, IV and V.
Note 11. — Sierra Leone now uses Standard B but reserves the right to use any other standard compatible with the Plan.
Note 12. — Tanzania, the indications are based on indications for Tanganyika and Zanzibar given in the Final Acts of the African VHF/UHF Broadcasting Conference, Geneva, 1963. It is intended to use Standard B in bands I and III. Although Standard I is planned for bands IV and V, further consideration will be given to the use of Standards G and H.
Note 13.— Algeria reserves the right to change later.
Note 14. — The Arab Republic of Egypt is now studying the adoption of either Standard G or H for bands IV and V.
Note 15. — In Cameroon, Zaire and Guinea, planning has been based on Standard K l, but they reserve the right to use any other standard compatible with the Plan when they introduce television.
Note 16. — The Indications and Notes 10 to 17 are based on indications and notes given in the Final Acts of the VHF/UHF African Broadcasting Conference, Geneva, 1963.
Note 17. - Belgium will use Standard C in bands I and III until April, 1977, after which Standard B will be used.
Note 18. — Cyprus is already committed to the use of Standard B in band III. Standard H is envisaged for use in bands IV and V, although further consideration will be given to the possible use of other standards when stations operating in bands IV and V are to be commissioned.
Note 19. — In Kuwait, if the services are called upon to broadcast in a second language, the frequencies between 5-5 MHz and 6-5 MHz could be used to provide an additional frequency-modulation sub-carrier.
Note 20. — Singapore reserves the right tp use additional frequency-modulation sound channels in the band between 5-5 and 6-5 MHz in relation to the picture carrier, for additional sound channels for sound broadcasting.
Note 21. — Some existing transmitters operate with a residual sideband up to 1 -25 MHz. For the future, only transmitters with a residual sideband of 0-75 MHz are foreseen.
Note 22. — Australia uses nominal modulation levels as specified for system I.
Note 23. — Ireland will continue to use system A in Band III for three transponder stations until the end of 1979.
ANNEX II
CHIEF TECHNICAL CHARACTERISTICS OF THE SECAM IV COLOUR TELEVISION SYSTEM
1. Signals transmitted
SECAM IV is compatible with standard black-and-white 625-line television systems, except system N. The luminance signal is obtained from gamma-corrected primary signals E 'R, E 'G, E ’B, and corresponds to the equation:
E ’Y = 0.30 E'r + 0.59 E ’g + 0.11 E BThe colour information is transmitted by two colour-difference signals:
= U4 ^ ~
Di = 2 F 3 ( £ i ~ E $
Before modulation, the frequency band of the colour-difference signals occupies more than 1.5 MHz.

Rep. 624-1 29
2. Transmission procedure
The colour-difference signals are transmitted by modulation of a sub-carrier. They are differentiated from one line to the next as follows:
Signal transmitted during one of the lines
Es | =\VD'b 2 -i- D ‘r 2 + £ ,}Cos [ a y + tp (/)]
Signal transmitted during the following line
ES2 = ty DR 2 + d ‘b 2 + ^»}cos ( a y + <p0)
where Ep is a d.c. voltage equal to 10% of the maximum signal.
V D p T D p
and where(p(t) = arc tan {D'g/D'R)
3. Frequency of the colour sub-carrier
The frequency of the colour sub-carrier is equal to: fQ = 4.43361875 MHz. It is related to the line sweep frequency fline = 15 625 Hz by the following equation:
f0 = ( 2 8 4 -1 /4 )4 * + 25 Hz.
4. Colour synchronization signal
The receiver switch is synchronized by synchronization signals transmitted with the composite video signal. They represent six wave trains of the colour sub-carrier, each train lasting about 40 j i s . They are transmitted during the field returns in the 6th-11 th lines of the first field and in the 319th-324th lines of the second field. During the even lines, the sub-carrier phase in the train is <p = 90°, and during all the odd lines <p = 180°. The amplitude of each wave train is equal to 30% of the composite signal E'y measured between the white and black levels.
5. Reception procedure
The colour-difference signals D'R and D'B are obtained by multiplication of the transmitted signals E(ln + i) and Eln, each signal being delayed in turn by the duration of one line. The level of the signal Eln must be 10 to 20 times higher than that of the signal E(2n + I)-
To obtain the correct polarity for the signals E'B _ Y and E'R _ K at each line, a switch working to the line periodicity is used.
ANNEX III
D EFINITIO N OF GAMMA AND GAMMA PRE-CORRECTION
The gamma of the picture tube is defined as the slope of the curve giving the logarithm of the luminance reproduced as a function of the logarithm of the video signal voltage when the brightness control of the receiver is set so as to make this curve as straight as possible in a luminance range corresponding to a contrast of at least 1/40.
Pre-correction is intended to compensate for the non-linearities of the transfer characteristics of picture tubes in a luminance range corresponding to a contrast of at least 1/40. It is assumed that the transfer characteristic of the picture tube follows a power law, the exact exponent of which is still under study.
(See [CCIR, 1970-74a, b]).
REFERENCES
CCIR Documents[1970-74]: a. 11/78 (Netherlands); b. 11/81 (Germany (Federal Republic of))-

30 Rep. 624-1, Rec. 471
BIBLIOGRAPHY
BENSON, K. B. [January, 1977] EIA Recommended Practice for Horizontal Sync., Horizontal Blanking and Burst Timing in TV Broadcasting. Journal o f SMPTE, Vol. 86, 1, Part I.
CCIR Documents
[1966-69]: X I /136 (United Kingdom); X I /194 (Netherlands).
[1970-74]: 11/1 (EBU); 11/63 (USA); 11/276 (Germany (Federal Republic of)).
[1974-78]: 11/54 (OIRT); 11/440 (OIRT).
RECOMMENDATION 471
NOMENCLATURE OF COLOUR BAR SIGNALS
(Question 1/11)(1970)
The CCIR,
CONSIDERING
(a) that a number of different colour bar signals used for measurement and adjustment purposes are recorded on magnetic tape, transmitted on national and international circuits or radiated from television transmitters;(b) that the particular signal in use cannot be readily recognized from the video picture-signal waveform,
UNANIMOUSLY RECOMMENDS
1. that the following nomenclature is used to identify and distinguish between colour bar signals;1.1 a colour bar generator is assumed to have three outputs corresponding respectively to the red, green andblue primary colour signals, which are then used as input signals to a colour coder. The signal amplitudes enumerated below refer to these coder input signals expressed as a percentage of the white level *, taking this as 100% with the blanking level as zero. During the transmission of colour bars the signal levels should beenumerated in the following order, with an oblique stroke between each number:
A — the primary colour signal level during the transmission of the “white” colour bar;B — the primary colour signal level during the transmission of the “black” colour bar;C — the maximum level of the primary colour signal during transmission of “coloured” colour bars;D — the minimum level of the primary colour signal during transmission of “coloured” colour bars.
Example: Referring to Fig. 1, which shows the red primary colour signal for three types of colour bar signal, these data would be expressed as follows:
Colour bars (a) 100 / 0 / 100 / 25Colour bars (b) 1 0 0 / 0 / 7 5 / 0Colour bars (c) 75 / 7.5 / 75 / 7.5This nomenclature refers only to the colour bar signal and not to any other signals that may share the
raster on a split screen.
See, for example, Recommendation 567, part 2, § 3.3 and Report 624-1, Fig. 1.

Sign
al
level
rela
tive
to pe
ak
white
(%
)
Rec. 471 31
A c 100 *1 1-----
25
W C G M R B BK
(a) System used by the B.B.C.
100/q/l00/25
100
75 -
W Y C G M R B
(b) System used by the E.B.U.
BK100/q/75/t
(c) System used in North America
F ig u r e 1
Relative amplitudes o f colour bars for different types o f generator
W: white Y: yellow C: cyan (turquoise) G: green M: magenta (purple) R: red B: blue BK: black

32 Rep. 476-1
REPORT 476-1
COLORIMETRIC STANDARDS IN COLOUR TELEVISION
(Study Programme 1A/11)(1970 - 1974)
1. In 1953, when the NTSC colour television system was adopted for transmission in the United States of America, the colorimetry of the system was based on three specific primary colours and a reference white. The coordinates of the primaries were: *
Red: x = 0.67 y = 0.33Green: x = 0.21 y = 0.71Blue: x — 0.14 y = 0.08The reference white chosen was standard White C: * = 0.310 y = 0.316
2. When the PAL and SECAM systems were first designed, they were based upon the colorimetric standards of NTSC. As a result, the coefficients used for determining the signals involved in coding PAL and SECAM (the luminance signal and the colour-difference signals) were directly based upon the chromaticities given in § 1.3. However, it has been recognized that there have been continuing changes in the chromaticities of the phosphors used in making colour picture tubes over the years, and that those actually used do not have the same primary chromaticities as those which served to establish the coding of systems. Nevertheless, in all systems the coefficients used for determining the signals involved in coding (the luminance signal and the colour-difference signals) are directly based upon the chromaticities and white point given in § 1.4. Several solutions have been proposed or implemented, in different countries, for compensating orcorrecting the effect upon colour reproduction of this difference between the receiver characteristics and the standards given in § 1.5. The United States of America continues to base the colorimetry of its transmissions upon NTSC primarieswhose chromaticities and white point are defined in § 1. Studio monitors are adjusted to a reference white of D65. However, because picture tubes do not yet contain phosphors whose chromaticities are the same (or very nearly the same) as those defined in § 1, approximate corrections, involving operations upon the electrical signals, are made in receivers in order to achieve satisfactory colour reproduction. Further, to achieve greater consistency in colour transmissions, the United States of America recommends that the picture monitors used in studios should also contain correction circuits which cause the colour reproduction to approximate to that which would have been obtained if the picture tubes used in the monitors had contained phosphors with the primary chromaticities shown in § 1.6. In Japan, the colorimetry of the system is based upon the primary chromaticities and white point given in § 1. Studio monitors are adjusted to a white point of D, 9300 K.7. In the 625-line PAL and SECAM systems, the colorimetry is now based upon the three specific primarycolours: **
Red: x = 0.64 y = 0.33Green: x = 0.29 y = 0.60Blue: x = 0.15 y = 0.06
and reference white D65. **These chromaticities are closely representative of the phosphors incorporated in the picture tubes of many
of the receivers and studio monitors used in those countries that have adopted the 625-line PAL and SECAM systems. Thus, in such receivers and monitors, no electrical corrections are required in order to achieve good colour reproduction. Further, in order to improve the consistency of colour reproduction, when the television receiver is switched from one programme to another, it has been suggested that the chromaticities of the phosphors used in studio monitors should be standardized. The assessment is based upon a method of tolerance which takes account of both the primary chromaticities of the tube phosphors and the effect of their combined chromaticities upon the reproduction of a typical skin tone.
BIBLIOGRAPHY
OIRT Doc. TK-III-830 (with Annex).
CCIR Documents[1966-69]: X I/136 (United Kingdom); X I/194 (Netherlands);[1970-74]: 11/1 (EBU); 11/63 (USA); 11/229 (EBU); 11/237 (USA); 11/264 (United Kingdom).
* The coordinates are given in the CIE system (1931).** These coordinates are given in the CIE sytsem (1931). For 625-line SECAM systems, it is provisionally permitted (for
existing equipment), to use the chromaticity coordinates and reference white given in § 1.

Rep. 312-3, 315-4 33
REPORT 312-3
CONSTITUTION OF A SYSTEM OF STEREOSCOPIC TELEVISION
(Study Programme 1C/11)(1963 - 1966 - 1970 - 1978)
1. Methods of providing stereoscopic television have long been the subject of study in various countries. Some of these studies were made with mechanical scanning systems, ante-dating the electronic systems now in use. Several methods have been proposed to ensure that each of the two reproduced stereoscopic images reaches theproper eye of the viewer, and many of the methods are applicable to all electronic systems.
The first method was based directly on the optical stereoscope and consisted of the reproduction of two spatially separated images, one for each eye. The larger separations, to accommodate larger images, prismatic viewing devices or prismatic spectacles, could be used to produce visual registration of the two images. A second method consisted of the production of two overlapping images in complementary colours and the use of complementary colour filters, sometimes in spectacles worn by the observer, to separate the two images. A third method provides overlapping images, produced by light which is polarized in orthogonal planes for the two images, together with the use of spectacles with polarizing filters. Several methods of separating the two pictures, without the use of spectacles, have been devised. These make use of gratings or lenticular screens. Both gratings and lenticular optical systems have been applied to cathode-ray receiver displays. These methods may have more serious limitations as to permissible viewing positions than do methods employing spectacles.
2. The transmission of a stereoscopic television signal requires the simultaneous or successive transmission of several separate signals. Methods have been suggested for reducing the bandwidth required. This question has many aspects in common with colour television and the use of the transmission methods, of which study has been made for colour television, may be envisaged for stereoscopic television transmission. [CCIR, 1974-78] containsproposals for the transmission of additional information in stereoscopic television.
3. Various solutions for reproducing the stereoscopic picture have been envisaged. Some of these solutions entail the use, for the reproduction of a stereoscopic monochrome or colour picture, of television sets designed for the reception of normal non-stereoscopic pictures.
4. Further studies should be carried out and it should be borne in mind that the problems of bandwidth and compatibility with monochrome and colour systems are of great importance.
5. [CCIR, 1958a; 1962a, b; 1963-66a, b; 1966-69 and 1974-78] and their bibliographies, contain information on the question of stereoscopic television.
REFERENCES
CCIR Documents[1958] Moscow: X I/22 (U.S.S.R.)[1962] Bad Kreuznach: a. XI/20; b. XI/34.[1963-66]: a. XI/65; b. X I /66.[1966-69]: X I/42 (U.S.S.R.).[1974-78]: 11/102 (U.S.S.R.).
REPORT 315-4
REDUCTION OF THE BANDWIDTH REQUIRED FOR THE TRANSMISSION OF A TELEVISION SIGNAL
(Study Programme 11A-1/11)(1963 - 1966 - 1970 - 1974 - 1978)
During recent years extensive studies have been carried out in the field of bandwidth reduction in television transmission. To facilitate further work in this field, it seems appropriate to give a list of documents and publications relating to this problem. The list may be extended to include subsequent work on this subject within the scope of Study Programme 11A-1/11.
BIBLIOGRAPHY
IEEE [1977] Transaction on Communication. Special issue on “Image Bandwidth Compression” - contains a number of papers, COM. 25, 1249-1433.
LEBEDEV, D. G. and LEBEDEV, D. S. [1964] Proc. Academ y o f Sciences, U.S.S.R., 11.LEBEDEV, D. S. and ZUKKERMANN, 1.1. [1965] Television and the information theory. Publishing House “Energia”.

34 Rep. 315-4, 801
MAYER, N. and MOLL, G. [1968] FBAS Farbfernseh-Obertragung fiber einen Kanal mit 2.5 MHz Bandbreite (Colour television transmission through a channel with a frequency bandwidth of 2.5 MHz) Radio Mentor-Electronic, 36-39.
SEYLER, A. J. [1960] Channel capacity utilization of television relay links. Fortschritte des Hochfrequenztechnik, 5, 263-306.SEYLER, A. J. [1962] The coding o f visual signals to reduce channel capacity requirements. Proc. IEE, Part C, 109, 676-684.SEYLER, A. J. [1963] The coding of visual signals to reduce channel capacity requirements. IEE Monograph 535E. [July, 1962]
(Proc. IEE, Part C, 110).SEYLER, A. J. and BUDRIKIS, Z. L. [January, 1965] Detail perception after scene changes in television displays. Trans. IEEE
on information theory, Vol. IT-11, 31-43.
CCIR Documents[1962] Bad Kreuznach: 19 (USA); 32 (Japan).[1963] Geneva: 170 (U.S.S.R.).[1963-66] X I/64 (U.S.S.R.); XI/127 (Australia).[1966-69] X I /12 (Germany (Federal Republic of)).[1974-78] 11/147 (U.S.S.R.).
REPORT 801
THE PRESENT STATE OF HIGH-DEFINITION TELEVISION
(Question 27/11)(1978)
1. Introduction
The ultimate goal for future television systems may be stereoscopic television. However, the present state of technology is not sufficiently developed for this to be realised. It might be natural, therefore, to assume that large-screen, high-definition television is to be the target for the next step in television, and that development of high-definition television may bring about a new standard television system which will be common throughout the world.
2. Size of screen and sharpness
Generally, large-screen television gives viewers more realistic and stereoscopic vision as compared with that given by conventional television.
It has been reported, as the result of subjective tests [CCIR, 1970-74a], that the most preferable screen height is about 0.5 m to 1 m, and the desirable aspect ratio is between 5/3 and 2/1.
As regards sharpness, it has also been reported [Wilmotte, 1974] that in 525-line receivers, picture sharpness is evaluated as grade 3 (fair) at a viewing distance of 5 H (where H is the picture height) in terms of the six comment scale, while it is evaluated grade 2 (poor) at the shorter distance of the 2.5H. On the other hand, the picture sharpness of a 1100-line system is evaluated as grade 5 (very good) at a viewing distance of 2.5H.
According to another source [Rudolph, 1969] describing an experiment using photographs, it seems that a modulation transfer function (MTF) of 50% at between 1500 and 1800 television lines, is required to get an improved picture quality.
In an experiment using a colour television system with 1125 lines and a screen size 0.5 m by 1.0 m, the overall picture quality was evaluated as being between grades 5 and 4 in terms of the seven comment scale. With a black-and-white system using 2125 lines, sufficient sharpness was obtained at a short viewing distance of 2H [CCIR, 1974-78a].
From these facts, it appears that the desirable number of scan lines for high-definition television may lie between 1000 and 2000.
The desirable line-interlace ratio has been reported as 2:1 [CCIR, 1970-74b]. On the other hand, the possibility of further reduction of bandwidth resulting from the use of pseudo-random dot-interlace has been pointed out [Wilmotte, 1974].
3. Display
High-definition cathode-ray tubes of 56 m (22 in), 67 cm (26 in), and 75 cm (30 in), for which the shadow mask pitch was 310 pm, 440 pm and 340 pm respectively, have been developed. The 75 cm cathode-ray tube has an aspect ratio of 5/3, and it consequently became easy to fabricate a wide-screen display of about 1000 scan lines for home use [CCIR, 1970-74b; 1974-78a and b].

Rep. 801, 802 35
A technology of optical connection for screens of cathode-ray tubes to make a wide screen display 0.5 m by 1.0 m, has been realised [CCIR, 1974-78a].
Recently, video projectors for home-use appear to have found acceptance on the market. But, it seems that the resolution of this type of display is not, nor will it be, good enough for high resolution display systems.
A panel type of display may be ideal for the high-definition large-screen display. At present, research works for gas-discharge display are especially active in some countries. Small colour panels have been already developed but improvements in both the luminance and luminous efficiency by one place of figure are necessary [CCIR, 1974-78a].
4. Transmission
Subjective evaluation tests regarding required bandwidth were carried out for the 1125-line system as a first step of the study. Values of 20 MHz and 7 MHz were obtained for the luminance and chrominance signal respectively [CCIR, 1974-78a].
As far as the radio-frequency bands allocated for transmission of such wideband signals are concerned, the use of higher frequency bands allocated to the broadcasting-satellite service, i.e. 22 GHz, 42 GHz and 85 GHz, which have been supposed to be usable for future television systems, might be considered. Among them, the 22 GHz may become more realistic from the viewpoint of propagation attenuation due to rain and hardware technologies, as illustrated in Table XI of [CCIR, 1974-78c] which compares system parameters corresponding to these frequency bands.
As for the method of modulation, an amplitude-modulation, vestigial-sideband (AM-VSB) with composite colour signal generally seems to be desirable for economy of frequency utilisation.
However, when the transmitting power is limited as in the case of satellite transmission, it seems to be effective to use Y /C separate FM transmission; that is, two separate carriers frequency-modulated by a luminance ( Y) and chrominance (C) signal respectively.
In this case, an adoption of non-linear emphasis [CCIR, 1963-66] could permit a larger deviation and thus improve the signal-to-noise ratio.
REFERENCES
RUDOLPH, J. [1969] Uber die Moglichkeiten zur Kennzeichnung der Bildscharfe fotograflscher Aufnahmen (II) (On the possibilities of indicating the sharpness o f photographs (II)). Bild und Ton, V >1. 22, 12.
WILMOTTE, R. M. [December, 1974] Technological boundaries of television. FCC Report, FCC/OCE CE74-01.
CCIR Documents[1963-66]: CMTT/59 (4/219) (Japan);[1970-74]: a. 11/31 (Japan); b. 11/296 (CMTT/191) (Japan);[1974-78]: a. 11/38 (CMTT/13) (Japan); b. 11/313 (Japan); c. 11/316 (Japan).
REPORT 802 *
ANCILLARY BROADCASTING SERVICES USING THE TELEVISION CHANNEL
(Q uestion 2 9 -1 /11 , Study Program m es 2 9 A -1 /1 1 , 2 9 B -1 /1 1 , and 2 9 C -1 /11 )
(1978)1. Introduction
Broadcasting of still pictures and other information intended for the public and using a television channel has been the subject of theoretical and practical studies in a number of countries. Most of these systems use time division multiplexing techniques. Some are intended to produce a still analogue picture, others to produce an alphanumeric and/or graphic display, and others to transmit data not intended to be displayed but which are related to the broadcast television programme.
These systems have transmission aspects that are not dependent upon the source of information, for example, modulation methods and information rate. They also have service aspects, for example: resolution of analogue display, symbol- and control-set for alphanumeric displays, codes for control of video tape equipment in the possession of the public.
* This Report should be brought to the attention of the CCITT.

36 Rep. 802
The first part, § 2, of this Report deals with the transmission aspect of systems using digital modulation, including parameters of systems and results of theoretical and practical investigations.
The second part, § 3, is concerned with all aspects of systems giving rise to an analogue display.The third part, § 4, describes programme related services.The fourth part, § 5, deals with various services resulting in an alphanumeric and/or graphic display.The fifth part, § 6, is devoted to the description of existing teletext services.
2. Digital data broadcasting systems using the capability within a television channel
2.1 The following systems, using digital modulation have been described:2.1.1 A system studied in Sweden intended for subtitling [CCIR, 1974-78a — Annex].2.1.2 A system studied in Japan [CCIR, 1974-78c; Kimura, 1975; Maebara and Murasaki, 1976] capableof transmitting Japanese or other ideographic symbols.2.1.3 A system in public service in the United Kingdom for alphanumeric and/or graphical display referred to as “Teletext” [CCIR, 1974-78e; BBC, IB A, BREMA 1976].2.1.4 A system of data packet broadcasting which is in use in France and referred to as DIDON [CCIR,1974-78f; Noirel, 1975].2.1.5 A method studied in Japan, using digital modulation for the sound and ancillary signals associatedwith one of the analogue still images systems described in § 3 [CCIR, 1974-78b; Ando et al., 1973;Numaguchi, 1975].
Characteristics of these five systems are shown in Table I.In the United States of America line 21, field 1 and 1/2 line in field 2, of the field-blanking
interval is authorized to provide a programme related service “closed captionning” for persons with impaired hearing.
2.2 Organization o f the video/data multiplex
The organization of the video/data multiplex signals is defined by a certain number of characteristics and parameters concerning the available resource and the sharing mode:— method of multiplexing;— available resource;— identification of a data channel;— number of available data channels;— specification of a data channel.
The French data packet broadcasting system (DIDON) [CCIR, 1974-78f| is organized as follows: the available resource is composed of line time slots whose number and position in each frame are programmed; those available lines are dynamically allocated to the different data sources; a data channel is identified by 3 octets in each data packet header, the third being utilized for error correction; the number of available data channels is therefore 216 = 65 536; each data channel is specified by its data rate, limited by a maximum value and a minimum value.
The UK Teletext system is organized differently. Currently, only two lines per field are used for each public service and the allocation of more lines is a future option. The system is flexible and an extended addressing capability as indicated in Table III, facilitates the transmission of arbitrary data. Such data has been transmitted experimentally in the UK.
2.3 Modulation and coding standards
Theoretical studies in Italy [CCIR, 1974-78h] concerning digital signals inserted in the field-blanking interval of television signals of standards B and G, which compare bi-phase * and binary NRZ modulations, show that the latter allows a good compromise between high bit rates and low error rates; although it may not ensure a good performance in the presence of some forms of distortion and noise. This is confirmed by results of field trials in Italy [CCIR, 1974-78t and its Addendum] which have shown that, at some sites where the reception was affected by several distortions due to short delay echos and at least one transposer, the 6.94 M bit/s NRZ system did not offer an acceptable performance, although the picture quality was still acceptable. On the other hand, a 3.47 M bit/s bi-phase system offered a good performance in the same critical conditions. This is believed to be due to both the particular spectral distribution of the bi-phase signal, and the possibility offered by this system to recover the received characters, containing two equal elements (i.e. 00 and 11) in only one bit, making use of the character parity check [CCIR, 1974-78t].
In the bi-phase system, each bit is coded with two different elements, i.e. bit 1 s 10 and bit 0 s= 01.

TABLE I - Characteristics o f digital data broadcasting systems
Sweden Japan United Kingdom France Japan
System Transmission system for “Extratext”
Information display system for ideographics
Teletext (CEEFAX and ORACLE services)
Data packets broadcasting system
Multi-channelstill-picturebroadcastingsystem
Multiplex method One line in each field blanking interval
One line in each field blanking interval
Lines 17 (330) and 18 (331X1)
Dynamic allocation to available lines - Transparent to any data sources - Identification of the sources —
9 lines in the field blanking interval preceding each pair of picture fields. Each pair of picture fields to be followed by 4 fields of digitally encoded sound signals.
Modulation system NRZ(a) Synchronous NRZ(a) Synchronous NRZ(a) Synchronous NRZ(a) Synchronous NRZ(a) Synchronous
Shaping low pass filtered 1 MHz
low pass filtered 4.2 MHz
Nyquist vestigially symmetric
raised-cosine sinusoidal roll-off spectrum with precorrection
Clock frequency 1 MHz 64 f n i3)
1.79 MHz 2.86 MHz fsc/2C) 182 f j j ( 5) (4/sc(5)(4) 6.9375 MHz(7)
444 fH(3)6.203 125 MHz(6) 397 fn ? )
5.73 MHz 364 f j t f )
5.73 MHz364 fH(*) (8/sc/5 )(4)
Clock synchronisation 3 bits at logical 1 2 bitslogical 1 and 0 16 bits at logical 16 bits at logical 14 bits at logical8 bitslogical 1 and 0 alternately
1 and 0 alternately 1 and 0 alternately 1 and 0 alternately
Framing code 8 bits 8 bits at logical 11100100 8 bits at logical 11100111 8 bits
(‘) not specifically limited to a given number of lines(2) binary non-return to zero(3) f f j : line frequency of 625 line systems(4) f sc: NISC sub-carrier frequency
frequency of system M (Report 624-1)(6) this bit frequency can be easily modified to adapt the system to any television standard, without having any other impact for the services but a modification of the total data rate.(7) this bit frequency can be modified, in conjunction with other characteristics, to adapt the system to provide a teletext service using any television standard.

38 Rep. 802
The first impression, from the preliminary field trials in Italy, is that most, but not all, of the television subscribers would be satisfactorily served by a teletext service using a 6.94 M bit/s NRZ transmission system. Therefore, if the teletext service is to be considered on a full national basis, it might be preferable to adopt a lower bit rate standard, such as the 3.47 M bit/s bi-phase system.
Field trials in several countries have indicated the possibility of receiving digital data inserted with time division multiplexing techniques in a television channel with low error rates [CCIR, 1974-78a and e]. Laboratory and field tests carried out in Japan showed that in system M, an NRZ digital signal of bit rate up to 5.73 Mbit/s will possibly be utilized for data broadcasting, if a transmission error rate of one in 103 can be allowed; and that on average the receivers currently manufactured in Japan are able to receive the signal if appropriate waveform correction is employed. [CCIR, 1974-78i, Numaguchi et al., 1977].
In the UK, in 1977 three networks carried regular public teletext services and several thousand receivers and decoders are in use. Three years of regular “Teletext” transmissions have shown that the system may be transmitted satisfactorily by the existing transmitters and links. This experience bears out predictions from the results of field trials in Bavaria and the UK [CCIR, 1974-78k]. During the Bavarian trials using television system B, 88% of the sites gave satisfactory teletext using a domestic quality teletext receiver. In the UK during one set of trials [Sherry, 1976] measurements were made on domestic antenna systems — as installed — and it was found that 93.5% of these gave a signal with eye height of 25% or better. Some experiments have shown that the eye height at the end of a chain of transmitters plus two transposer stations was reduced from typically about 70% to about 60% when compared with that at the output of the “parent” transmitter.
The theoretical studies mentioned and some experimental results show that some imperfections in the transmission channel, such as reflections, impulsive noise and phase distortion, may increase the error probability of digital information. Furthermore, the error probability of the digital information may increase when the ratio of clock frequency with respect to channel bandwidth increases. Experience has borne out the expectation that the use of up-to-date receiving techniques such as synchronous demodulation and automatic frequency control is desirable for digital data reception.
2.4 Specification and measurement o f the quality o f digital data channels
The quality of digital data channels is of course related to the quality of the television signal. But some field trials have shown that, in practice, little correlation exists between the picture quality and the performance of the associated digital data channels.
Hence, it is advisable to define parameters which can be directly interpreted and easily measured in order to specify the quality of digital channels.
A first parameter is the bit error rate, or the ratio of the number of bits incorrectly received to the number of bits transmitted.
A second parameter is the information loss rate, or the ratio of the number of information bits lost to the number of information bits transmitted. This parameter refers, mainly, to the failure of acquisition of the data stream, on a data channel.
The two parameters can be easily measured, for an entire digital channel (including the receiving equipment), by insertion of pseudo random sequences into the normal data format of the digital channel [CCIR, 1974-78m], or may be calculated [CCIR, 1974-78h and s] using a comprehensive mathematical model of a broadcasting television channel.
It is also essential to be able to make direct objective measurements on sections of the television network which carry the digital data signal, particularly excluding the receiver. To meet this requirement it is not sufficient to make measurements using only the well-known television test signals. It has been found necessary to measure eye height in addition, and special equipment has been developed to measure this parameter in many countries.
2.5 Compatibility with the television service
Laboratory tests and field trials have been carried out in Japan [CCIR, 1974-78d and i, Numaguchi et aL, 1977] concerning the influence on the quality of normal television service reception through the position of the data lines inserted by time division multiplex techniques in the television channel. They have demonstrated the need for careful choice of such data lines to prevent significant degradation of picture and sound with some existing receivers and also the possibility of inserting data lines together with insertion test signals.
2.6 Digital interfaces for emission and reception
The French data packet broadcasting system (DIDON) allows the transmission of digital data originating from a number of different sources. For obtaining full flexibility it is necessary that the data channel terminal equipments both at the transmitting and receiving end are not locked to a fixed data transfer rate [CCIR, 1974-78n]. This is obtained through digital interfaces making use of a hand-shaking procedure.
The UK “Teletext” system, although having a fixed transmission speed, may be used to transmit arbitrary data from a number of different sources provided suitable data-concentration equipment is used.

Rep. 802 39
3. Analogue still-image broadcasting systems
Two types of analogue still-image broadcasting systems have been studied in Japan [Numaguchi, 1975].One is a multi-channel still picture broadcasting system, by means of which approximately 50 still picture
television programmes, each consisting of a series of colour still pictures and accompanying sound, can be transmitted simultaneously by using a television channel exclusively [CCIR, 1974-78b; Ando et al., 1973].
The other is a still picture broadcasting system multiplexed with a conventional television signal, by means of which one or more still picture television programmes can be broadcast simultaneously by multiplexing with a normal television signal [CCIR, 1974-78c; Harada, 1976].
For receiving still picture programmes by these methods, adapters containing a one-frame memory device have to be added to conventional television receivers.
3.1 Multi-channel still picture broadcasting system
The broadcast signal is composed of still picture television signals and digitally encoded signals for the accompanying sound. [CCIR, 1974-78b; Ando et al., 1973]. The still pictures comprising one programme are transmitted for only one frame period, in sequence with an interval of 5 to 10 s between pictures. A control code signal is added at the beginning of each picture signal for identifying the programme to which each still picture belongs. The sound signals of all the programmes are digitally encoded and time-division multiplexed by PCM technique.
The picture signals and the sound signals are further multiplexed by time-sharing in the ratio 1:2 television frames and broadcast by modulating a vision carrier.
At the receiving end, the picture signal of a desired programme is extracted from the received signal by aidof the address code signal and is stored in a magnetic disc memory so as to display it continuously on thetelevision screen.
Essential parameters for a laboratory test system are summarized in Table II [Yoshino et al., 1977; CCIR, 1974-78u].
The results of laboratory tests showed that the system is technically feasible, although it would be necessary to make further improvements for practical use.
This type of broadcasting might be useful especially in such Helds as information and education broadcasting services, in which the provision of many programmes is desirable within the limited radio frequency spectrum.
TABLE II - Transmission parameters for a multi-channel still picture broadcasting system
Bandwidth of multiplexed baseband signal 4.2 MHz
Time-sharing ratio of picture and sound signals 1 : 2 (frame as a unit)
Picture signal WaveformMaximum transmission capacity
Based on M/NTSC signal 10 pictures per second
Sound signalFrequency bandwidth Sampling frequency Quantization and coding CompandingSignal-to-quantizing noise ratio Number of channels
5 kHz63 kHz (A fif)Delta modulation (double integration) Syllabic, 20 dB 44 dB at 800 Hz 46
Digital signal (sound and control code) Modulation system Spectrum Bit rate
2-level NRZ, Synchronous Sinusoidal roll-off with precorrection 5.73 Mbit/s (364 fH)
Synchronization- for clock and framing- for time-sharing control
16 bits 4 bits
Threshold of video signal to noise ratio (bit error rate 10~4, eye height 60 %)
23 dB peak-to-peak (p-p)/r.m.s. (unweighted)

40 Rep. 802
3.2 Still picture broadcasting system multiplexed with television
In this system [CCIR, 1974-78c; Harada, 1976], each of the still picture signals is broadcast by inserting its scan-line components successively into the field-blanking intervals of a main television signal. A multifunction control code signal is inserted in each still picture signal in order to identify the programme to which each picture belongs.
At the receiving end, the still picture signals are extracted from the received signal and reconstructed in a magnetic disc memory so as to display it on the television screen.
Accompanying sound is transmitted by additional sound channels multiplexed with the sound carrier.In an experimental system which transmits only one still picture programme, one line of the still picture
signal was inserted in each field-blanking interval of the main signal. It took 4.5 s to transmit a complete picture composed of only one field. The sound signal was transmitted by a FM-FM method in which 4.5 fH (fH means the television line frequency) was used as the sub-carrier frequency. The results of laboratory tests showed the technical feasibility of the system. This type of broadcasting might be useful for information and education services when available television channels are limited.
4. Programme related services
The services described in this section do not include subtitling services which are considered in § 5.Two experimental services, related to the broadcast (television) programme are under study in France.
4.1 Programme identification and remote control for recording and display
The television programme signal is combined with data packets, using a very low data rate, multiplexed as described in § 2.1.4 [Degoulet et al., 1975], Data packets contain sequences from the alphabet described in CCITT Recommendation V.3. The characters make up control codes in accordance with ISO 2022 § 5.3.3.1. The codes may be used to control recording equipment and delayed programme distribution in cable television systems. The codes may be transmitted within the teletext service or on a particular data channel, whose data rate is a few octets per minute.
4.2 Scrambled television service
In a system of this type [Marti and Mauduit, 1975] only those possessors of a terminal who have received the deciphering key may view the programme. This key is partly hardware and partly contained in codes transmitted by multiplexing with the picture signal. Such a service has been, for instance, experimented with inFrance for broadcasting additional programmes intended for specific groups of the public.
5. Broadcasting services intended for alphanumeric and/or graphic display
Several countries have experimented with broadcasting services allowing, in addition to, or replacing, the normal television programme, the display of alphanumeric and/or graphic images.
5.1 Alphabetic systems
5.1.1 Teletext
Teletext became a public service in the UK in autumn 1976, following several years of experimental transmission. Experimental teletext services were opened in France in May 1977. The teletextsystems are described in § 6 below.
5.1.2 ExtratextA system named “Extratext”, for the broadcasting of subtitles, has been studied in Sweden. It
allows the display of two rows of 32 black and white symbols using a set of 128 symbols [CCIR, 1974- 78a].
5.1.3 Subtitling service for the hearing impaired
In the United States of America, broadcasters have been authorized to transmit alphanumeric information for subtitling. This service is intended for those whose hearing is impaired.
5.2 Graphic display systems
5.2.1 Information display system for ideographs
Systems for ideographic information are studied in Japan [Kimura, 1975; Maebara and Murasaki, 1976; CCIR, 1974-78c]. Although they are primarily intended for the transmission of texts or subtitles in Japanese, or other ideographic symbols, one of these systems is also capable of displaying a colourgraphic image with the resolution of 245 x 200 points.
Every Japanese symbol is represented in a 16 x 16 or 15 x 18 matrix. The symbols are transmitted as separate dots and are not encoded. The system demands the use of adequate storage at the receiver.

Rep. 802 41
5.2.2 Audiography
A service — called “audiography” in France [CCIR, 1974-78q] — has been the subject of studies and tests, in particular in the Netherlands, the United States of America, Canada and France. The service, in which it is proposed that broadcast signals should contain digitally-coded sound with associated graphics information, enables a drawing in course of execution to be reconstituted (teledrawing or telewriting).
The signal used for the teledrawing may be obtained by means of a conversion pad for transforming the co-ordinates of a stylus into electrical signals. The speed of the pencil movements by which a drawing or a hand-written text is produced is, on average, sufficiently low to require a passband of a few Hz only.
Possible applications include the broadcasting of an educational programme (in the form of a lecture) consisting of a lecturer’s comments, diagrams, formulae, etc., drawn on a blackboard. The receiving system’s television screen would thus act as a distant “electronic blackboard”.
5.3 High resolution graphics services
The picture is basically graphic, at two levels [CCIR, 1974-78v]. It is described by dots and the resolution is very high (typically of the order 1700 x 2400 dots per picture). The filling rate may be very high. Hence the picture cannot be displayed on a cathode ray screen owing both to the insufficient resolution, and to the large memory required. Display is effected on paper, which also ensures storage. This is the broadcast facsimile service, also known as the “broadcast newspaper”.
6. Systems for teletext * services
6.1 New public teletext services are now in operation, broadcasting magazines made up of pages sent out in acontinuous sequence, or once only, these pages consisting of alphanumeric or graphic displays. Two systems are described below and in Table III. Character sets are given in Tables IV and V.
6.1.1 System (a)
This system is the one used in the United Kingdom since 1974, carrying actual current information multiplexed with the programme on three television networks under the names of CEEFAX and ORACLE [CCIR 1974-78e; BBC, IBA, BREMA 1976].
6.1.2 System (b)
This system is the one used in France under the name of ANTIOPE, carrying up-to-date information such as stock exchange information [CCIR, 1974-78g and p; Schwartz et al., 1977]. Insemi-graphic mode, this system uses the symbols described in Table IV (Columns 2a, 3a, 6a and 7a).However, the DEL character is never used to transmit a symbol, according to CCITT Recommendation V.3. The (7/15) graphic symbol is thus replaced by (2/0) with an alternate colour.
6.2 System (a)
The following remarks are intended to supplement the information given in Tables III and IV.
6.2.1 Alternative alphabets
Three unallocated control bits may be used to select alternative national alphabets (see Table III). The United Kingdom character code is designated by 000, so that further national alphabets could be selected by other combinations, and receivers for each country would incorporate the appropriate alphanumeric characters. Source-defined symbol sets remain a possibility for the future as there is ample allowance for transmission of the necessary control functions (Table III, Note 7).
6.2.2 Display format addressing
As shown in Table III, page and row-address codes are protected by Hamming coding. However, the position of each symbol along the displayed row is determined basically by the television synchronising pulses which provide a very rugged timing source. Consequently, symbols are very unlikely to be incorrectly positioned in a page.
6.2.3 Separately addressable pages
As indicated in Table III, use of the “time” codes (in the range 00.00 to 39.79) allows up to 800 x 3200, i.e. 2.56 x 10⁶ pages to be separately accessed by the receiver. Using two lines per field each 100 pages take a maximum of 25 seconds to transmit but, in principle, a complete television channel could be devoted to teletext transmission, to give a proportionate reduction in access time.
* The term “teletext” has not yet been adopted definitively.

42 Rep. 802
TABLE III — Characteristics o f teletext systems
(a)United Kingdom
(b)France
Display characteristics
Number of rows per page Max. 23 + 1 Max. 24 + 1 (625 line standard) Max. 20 + 1 (525 line standard)
Number of symbols per row 40 Max. 40
Set of displayed symbols 96(!) 127(2)
Symbol colours 6 + white with CC(3)
6 + white + black with CS2(4)
Background colours 6 + white + black with CC(3)
6 + white + black with CS2(4)
Special effects
— Flashing With CC(3) With CS2(4)
— Conceal With CC(3) With CS2(4)
- Boxing With CC(3) With CS2(4)
- Inverted background No With CS2(4)
- Double height With CC(3) With CS2(4)(Alphanumeric symbols only)
- Double width Future option With CS2(4)(Alphanumeric symbols only)
Control junctions
Page selection
— Number of pages 8 0 0 0 999
— Page number coding 2 BCD digits + 3 bits for “hundreds”
3 BCD digits
— Code identification <• Position in data stream Preceded by RS(6) Followed by US(6)
— Protection Hamming code Hamming code
— Magazine selection “Hundreds” in page number Selection of data channel
Page format addressing
Data organization Row basis As in ISO 646 and ISO 2022
Row addressing 5 CBO 2 BCD digits
Code identification Position in data stream Preceded by US(6)
Format characters Irrelevant LF, CR, VT, HT, BS(6) Row overflow continuing in next row
Other functions
Erase page 1 CBO With CC(3)
News flashes 1 CBO J lC B (3)Subtitles 1 CBO
Selection of index pages Receiver option 1 CB(3)
Alarm page(8) Future option 1 CB(3)
Suppress display of row zero 1 CBO Under user control
Update 1 CBO 1 CB(3)
Interrupted sequence indicator 1 CBO 1 CB(3) (option)
Inhibited text display 1 CB(3) 1 CB(3)
Magazine/serial mode 1 CBO No

Rep. 802 43
(a)United Kingdom
(b)France
Multiple alphabets
— Selection mode On a page basis choice of 1 out of 8
On a page basis choice of 1 main alphabet out of 16
- Identification 3 unallocated CB(3) 4 CB(3)Secondary alphabet defined within a page by CS3(4) and selected by lSO(6)
“Time” selection 13 CB(3)“hours” and “minutes”(s)
Row zero option
Graphics With CC(3) With CS2(4)
Maximum number of control bits 11(7) Unlimited(9)
Page header Contains control bits (CB) and displays: 24 symbols for page number, date, service identification +8 symbols either to display the time or to be used as supplementary control characters.
Contains control bits and displays up to 40 symbols for page number, time, date, service identification, etc.
Protection Odd parity on all characters
Odd parity on all characters.
Hamming code on all addresses (pages and rows) and on all control bytes.
Hamming code on all addresses and control bytes.
(*) See Table IV.(2) 95 symbols according to ISO 646 and 32 special symbols as accented vowels (see Table V).(3) CC: control character. CB: control bit inside a control byte; CC are generally displayed like blank.(4) CS2: control sequence of 2 characters (ISO 2022).
CS3: control sequence of 3 characters (ISO 2022).(s) A page number may relate to up to 3200 separately addressable sub-pages by “time” selection.(6) According to ISO 646 and CCITT Recommendation V. 3.(7) Supplementary control bits can be included in auxiliary rows.(*) Receivers are automatically switched to display this page.(9) The maximum length of the digital field used for the control bytes is not limited by the specification.

44
TABLE IV - Teletext character codes (System (a) United Kingdom)
Rep. 802
b7 00
00
01
0 0 10
01
01
h1
1b6w
0 1CO*-> d5w
— ► 0 1m b4
ib3I
b2i
b1I Rows. 0 1 2 2a 3 3a 4 5 6 6a 7 7a
0 0 0 0 0 NUL® DLE® □ □ 0 □ 0 0 0 □ 0 a0 0 0 1 1 Alpha11
RedGraphics
Red □ □ □ d 0 0 0 Q 0 s
0 0 1 0 2AlphanGreen
GraphicsGreen □ □ 0 a 0 0 0 n □ □
0 0 1 1 3Alpha0Yellow
GraphicsYellow 0 H 0 n 0 0 0 n 0 B
0 1 0 0 4Alpha0
BlueGraphics
Blue 0 0 0 s 0 0 0 s 0' f i
0 1 0 1 5Alpha0
MagentaGraphicsMagenta E 0 E 0 0 0 G 0 G
0 1 1 0 6Alpha0Cyan
GraphicsCyan H 0 B 0 0 0 B 0 B
0 1 1 1 7©Alpha0
WhiteGraphics
White □ E 0 n 0 @ 0 B 0 B1 0 0 0 8 Flash Conceal
Display □ 0 0 a 0 0 0 a 0 H1 0 0 1 9 Steady®
©ContiguousGraphics 0 H 0 B □ 0 □ 9 0 B
1 0 1 0 10 ©End BoxSeparatedGraphics □ H □ a 0 0 □ J 0 a
1 0 1 1 11 Start Box ESC® 0 H □ H 0 0 0 9 0 a1 1 0 0 12 Normal®
HeightBlack®
Backround □ B 0 a 0 0 0 s 0 H
1 1 0 1 13DoubleHeight
NewBackround □ 6 0 B 0 B 0 N 0 B
1 1 1 0 14 SO®Hold
Graphics □ a 0 H 0 0 0 a 0 a1 1 1 1 15 §i®
©ReleaseG raph ics □ s 0 H 0 1 0 a ■ ■
0 These control characters are Codes may be referred to I I Symbol rectanglereserved for compatibility by their column and I— Iwith other data codes row e.g. 2/5 refers Black represents display colour
to %© These control characters are White represents background
presumed before each row begins

Rep. 802 45
TABLE Va - Control characters (system (b), France)
CD: Conceal display RS: Backspace H: HeightRV: Reveal display HT: Horizontal tabulation L: WidthSB: Start box LF: Line feed FI: Reversed backgroundFB: End box VT: Vertical tabulation FNI: Non-reversed* 2nd character of CS3 FF: Form Feed background
((4) of Table III) CR: Carriage return Cl: Flashinga: alphanumeric SO: Shift out F: Steadyy: graphics SI:
CAN:Shift in Cancel
Colours ESC: EscapeN: black RS: Record separator (pageR: red flag)V: green J: yellow
US: Unit separator (row flag)
B: blueW: white

46 Rep. 802
TABLE Vb - Present Teletext alphabetic symbol set (System (b) France)
Bits
b7 ------------- ►b6 ---- ---------►
b5 ------------- ►
oo
o
oo
o 1
o
01
1
o !
o 10
11
10
11
1
b4 b3 b2 b1 0 1 2 3 4 5 6 7
0 0 0 0 0s
a\
<? SP 0 / e. P\
P
0 0 0 1 1S
aS ! 1 A Q a q
0 0 1 0 2\
a\
B " 2 B R b r
0 0 1 1 3\
a \# 3 C S c s
0 1 0 0 4\
e\
u $ 4 D T d t
0 1 0 1 5s
e\
u % 5 E U e u
0 1 1 0 6 Ae\
u & 6 F V f V
0 1 1 1 7\
e\
u ' 7 G w 9 w
1 0 0 0 8\
i oN( 8 H X h X
1 0 0 1 9s
1\
<t> ) 9 I Y i y
1 0 1 0 10\
i\
I * J z i 2
1 0 1 1 11 SI\
n + ; K k / *—
1 1 0 0 12s
os
i < L \ I / n
1 1 0 1 13 os
1 - = M ' ] m/ —►
1 1 1 0 14 A0 s • > N/
T n
1 1 1 1 15 A0 s / ? 0 - o ©
n Characters intended for national DEL character notuse with standard ISO 646 ^ used in transmission,
reserved in terminalI ^ additional non-standardised fox internal operationsI I characters
Note.— Columns 0 and 1 contain 32 special symbols. For the present French service, these symbols have been provisionally selected from accented vowels and special signs not included in the International Alphabet No. 5. The French Administration considers that the final choice for this supplementary set should be the result of an international agreement.
6.3 System (b)
The following remarks are intended to supplement the information given in Tables III and V.
6.3.1 Display characteristics
Present decoders are capable of displaying up to 3 x 127 different symbols within a page. While a 256-symbol set is proposed [CCIR, 1974-78p] for European applications, including cyrillic letters, the third symbol set is intended to be transmitted by means of non-displayed service pages. When this is done, each symbol will be represented in a 10 x 10 matrix to which every point may be addressed, so that symbols may be displayed with no gaps between them in either direction.
6.3.2 Coding system
The coding system used conforms to CCITT Recommendation V.3, and ISO 646 and 2022 standards. Thus, there is no correlation between the transmission data format and the display characteristics, and the control sequences and control codes do not lead to the display of any symbol. However, on present receivers, when the control sequences for boxing, conceal, and background colour of alphanumeric symbols are transmitted, the corresponding functions are set up only at the first space character encountered.

Rep. 802 47
Symbols from International alphabet No. 5 are transmitted directly by the corresponding characters, while accented letters are transmitted by three characters: accent — backspace — letter. This assists the compatibility with data terminals not able to reproduce the diacritical signs. When used on other networks, this system requires no modifications either to the editing and encoding systems or to the data terminal equipment (DTE). The network terminating unit (NTU) is specific to the network and replaces the digital channel equipment of the data broadcasting network.
6.3.3 Service aspects
Use of the full television channel allows about 11 000 different pages to be broadcast with a mean access time of 12 seconds. This capacity may be shared by many information providers, one per magazine. Some magazines might be accessed only on subscription basis.
Present decoders restrict the information rate to about 15 average pages per second in each magazine, using about 10 lines per television field.
6.4 Measurement o f the teletext service quality
The systems referred to in § 6.1 incorporate error protection and this must influence the criterion for a satisfactory service quality in terms of the bit error rate of the digital channel, as defined in § 2.4. One set of criteria for the. service quality evaluation which has been applied in field trials of system (a) [BBC, IBA, IRT 1975] is:
Criterion A: No errors received in 10 seconds for entire data stream.Criterion B : No visible errors in each of three consecutive new acquisitions of one page.Criterion C: No visible errors remaining on the second writing of one page.In general, satisfaction of these criteria will depend upon the coding strategy and will therefore correspond
to different bit error rates for different teletext systems. It is desirable to establish the relationship between quality evaluation criteria such as B and C, and the bit error rate. Assumptions regarding the performance of the teletext decoder will then permit the establishment of acceptance limits for parameters such as eye-height which allow the performance of the transmission path to be related to the bit error rate. Such a relationship has been studied for system (a) in [Lucas, 1976],
6.5 Connection o f terminal equipment to other networks
Although this report is specifically concerned with broadcast information using a television channel, it has been pointed-out [CCIR, 1974-78o] that other information services use other networks, for instance telephone networks. Thus the need could arise to connect teletext terminal equipment, or certain parts of it, to other networks. This infers that consideration should be given to compatibility requirements of the data terminal equipment, the channel equipment remaining specific to the transmission medium.
REFERENCES
ANDO, H. et al. [September, 1973] Still picture broadcasting. A new informational and instructional broadcasting system. IEEE Trans. B-C 19, 3.
BBC, IBA, BREMA [September, 1976] Broadcast Teletext Specification. Available from BBC or IBA.
BBC, IBA, IRT [April 15-24, 1975] Teletext field trials in Bavaria. Available from the BBC or the IBA.
CCITT [1972] Volume VIII p. 47, Recommendation V.3.DEGOULET, G. et al. [December, 1975] EPEOS, service de videomessageries. Revue de radiodiffusion et television , 40.
HARADA, S. [February, 1976] Still picture multiplex television system. NHK Laboratories Note, serial No. 194.
HUTT, P. R. [1976] The Fundamentals o f Teletext. IBA, E & D, Report No. 112/76.
ISO 646-1973
ISO 2022-1973
KIMURA, A. [1975] Telescan, simultaneous information display system. Telecommun. Joum., Vol. 42, 1.
LUCAS, K. [1976] Analysis and Rationalization of Teletext Field Trial Results. IBA E & D Report 16/76.
MAEBARA, A. and MURASAKI, K. [February, 1976] A text television system. NHK Lab. Note, No. 195.
MARTI, B. and MAUDUIT, M. [December, 1975] DISCRET, service de television cryptee. Revue de radiodiffusion et television, 40.
NOIREL, Y. [December, 1975] Un syst&me experimental de diffusion de donnees par paquets. Revue de radiodiffusion et television, 40.
NUMAGUCHI, Y. [July, 1975] Broadcasting o f still images, a review. NHK Lab. Note, No. 187.
NUMAGUCHI, Y. et al. [September, 1977] Compatibility and transmission characteristics o f digital signals inserted in the field-blanking interval o f a television signal. NHK Lab. Note, No. 216.

48 Rep. 802
SCHWARTZ, C. R., POIGNET, A. and MARTI, B. [June, 1977] Specifications preliminaires du service de teletexte ANTIOPE. Revue de radiodiffusion et television, 47.
SHERRY, L. A. [June, 1976] An assessment of teletext data transmission over the UHF television network: IBA Teletext Report 10.
YOSHINO, T., TAMAI, S. et al. [August, 1977] A multi-channel still picture transmission system: TDM transmission of delta modulation sound signals with picture signals in television channel, NHK Lab., Note 214.
CCIR Documents[1974-78]: a. 11/30 (Sweden); b. 11/31 (Japan); c. 11/32 (Japan); d. 11/33 (Japan); e. 11/49 + 11/173 (United Kingdom);
f. 11/61 (France); g. 11/62 (France); h. 11/121 (Italy); i. 11/309 (Japan); j. 11/310 (Japan); k. 11/339 (United Kingdom); 1. 11/340 (United Kingdom); m. 11/361 (France); n. 11/362 (France); o. 11/363 (France); p. 11/364 (France); q. 11/366 (France); r. 11/367 (France); s. 11/368 (France); t. 11/371 (France); u. 11/435 + Add. 1 (Italy); v. 11/369 (France).

Rec. 472-1 49
SECTION 1 IB: INTERNATIONAL EXCHANGE OF TELEVISION PROGRAMMES
Recommendations and Reports
RECOMMENDATION 472-1
VIDEO-FREQUENCY CHARACTERISTICS OF A TELEVISION SYSTEM TO BE USED FOR THE INTERNATIONAL EXCHANGE OF
PROGRAMMES BETWEEN COUNTRIES THAT HAVE ADOPTED 625-LINE COLOUR OR MONOCHROME SYSTEMS
(1970 - 1974)The CCIR
UNANIMOUSLY RECOMMENDS
1. the video characteristics, given below, for the international exchange of programmes between countries that have adopted 625-line colour or monochrome television systems. In particular, countries that use Systems B, C, D, G, H, I, K, Kl and L will facilitate programme interchange by adopting these characteristics.Note 1. — The details concerning the line-blanking and field-blanking intervals are listed in the same order and are designated by the same symbols as in Report 624-1.Note 2. — This Recommendation is not intended to apply to Standard N.
2. General characteristics
2.12.2
2.32.42.52.6 2.7
Number of lines per picture:Line frequency and tolerance Hz) (')— monochrome transmissions:
colour transmissions:Field frequency f v (Hz):Picture-frame frequency fp (Hz):Gamma of picture signal:Nominal video bandwidth (MHz):Nominal difference between black level and blanking level (as a percentage of the luminance amplitude):
625
15 625 ± 0.02%15 625 ± 0.0001%(2/625) fHV 625approx. 0.45, or 5.5, or 6 (2)
3. Details of line-blanking interval (3) (ps)
(H) Nominal duration of a line: H = 64.(a) Line-blanking interval: 12 ± 0.3(b) Interval between datum (Oh ) and back edge of line-blanking signal (average
calculated value for information): 10.5(c) Front porch: 1.5 ± 0.3(d) Synchronizing pulse: 4.7 ± 0.2(e) Build-up time (10-90%)of line blanking edges: 0.3 ± 0.1(0 Build-up time (10-90%) of line-synchronizing pulses: 0.2 ± 0.1
4. Details of the field-blanking interval
0) Field-blanking period: 25 H ± a (4)(k) Build-up time (10-90%) of field-blanking edges as in (e): 0.3 ± 0.1
0) Duration of first equalizing pulse sequence: 2.5H, or 3H (5)(m) Duration of field-synchronizing pulse sequence: 2.5H, or 3H (5)(n) Duration of second equalizing pulse sequence: 2.5 H, or 3 f /(5)(P) Duration of equalizing pulse (one half the value given in (d): 2.35 ± 0.1(g) Duration of field-synchronizing pulse (average calculated value for informa
tion): 27.3

50 Rec. 472-1, Rep. 311-4
(r) Interval between field-synchronizing pulses as in (d): 4.7 ± 0.2(s) Build-up time (10-90%) of field-synchronizing pulses as in (f): 0.2 ± 0.1(') When the reference of synchronism is being changed, the tolerance for colour transmissions may be increased
to ± 0.01% (see Report 624-1). Attention is drawn to the desirability of adding to these characteristics a value for the maximum rate of change of line frequency.
(2) The attention of Study Groups 4 and 9 and the CMTT is drawn to the desirability of subsequently standardizing tolerances for corresponding transmission characteristics applicable to all 625-line systems. For international routine measurements, it is suggested that the test signals be based on a single reference frequency which could be 5 MHz, particularly by countries using systems with nominal video bandwidth of 6 MHz. For example, this suggestion is not contrary to the use of a frequency close to 6 MHz in a multiburst test signal.
(3) The nom inal value o f the p icture-synchronizing signal ratio is 7 /3 . For details o f perm itted tolerances in long-distance transm issions, see R ecom m endation 567.
(4) In the blanking interval, lines 16, 17, 18, 19, 20, 21, and 329, 330, 331, 332, 333 and 334 are reserved for the reception of any special signals.
(5) These values may be subject to revision in the case where a single equalizing pulse system might be adopted (see [CCIR, 1963-66] and Report 626-1).
REFERENCE
CCIR Document
[1963-66]: XI/115 (United Kingdom).
REPORT 311-4
THE PRESENT POSITION OF STANDARDS CONVERSION
(Question 2-2/11)(1963 - 1966 - 1970 - 1974 - 1978)
For standards conversion between monochrome television signals having different line frequencies but the same or nearly the same field frequencies, a satisfactory result may be obtained by the well-known image-transfer methods. If the field frequencies are identical, however, line converters may be used. In these converters no intermediate optical or electron-charge image is used and a more consistent and better quality image is achieved. Furthermore, variations in image quality, due to the human element involved in the operation of standards conversion equipment, are notably reduced.
When converting from one standard to another, when the field frequencies of the two standards are different, it is possible to use image transfer methods and to reduce the flicker of the pictures reproduced to a hardly perceptible level; provided the adjustment of the converter is effected correctly. It has been proved that, by the use of suitable techniques, the main shortcomings of former electro-optical converters, such as low resolution and flickering and smearing in moving pictures, can be overcome, and this has led to the development in the Federal Republic of Germany of a colour standards converter with electro-optical image transfer.
Methods of conversion which do not require the use of the image-transfer method have been developed, and are now fully operational in the United Kingdom and in Japan. These are field converters for both monochrome and colour television and use ultrasonic delay lines as the storage medium.
Recent work in the United Kingdom and Japan has led to the successful development of digital field converters, employing stores based on dynamic shift registers or random access memories, which undoubtedly represent a significant step forward. Operations with these equipments have confirmed that converters of this type can be relatively small in size, and are likely to prove very stable in service and economic in terms of running costs. In general, they include far fewer pre-set and operational controls than corresponding analogue equipments. The performances of the digital equipments are noticeably better than that of previous converters and the signal-to-noise ratio at the output is not significantly different from that at the input.
A considerable amount of work on the design and production of converters has been carried out in several countries. For the benefit of workers in this field of activity, a bibliography follows.

Rep. 311-4, 477-2 51
BIBLIOGRAPHY
ABU [2-8 November, 1973] Asian Broadcasting Union, Television Standards Converter. The Second World Congress of Broadcasting Organizations, Rio de Janeiro, Brazil.
BALDWIN, J. L. E. [1970] New techniques in television standards conversion. IEE Conference Publication, No. 69.BALDWIN, J. L. E., STALLEY, A. D., COFFEY, J. A. GREENFIELD, R. L., LEVER, I. R. and TAYLOR, J. H. [September-
October, 1974]. The world’s first digital field rate converter. Royal Television Soc. Joum.BALDWIN, J. L. E., STALLEY, A. D. and KITCHIN, H. D. [January-February 1974] A standards converter using digital
techniques. Royal Television Soc. Joum., 14, 1.BOYER, R. [February/March and April/May 1975] Le transligneur numerique 625-819 lignes 2. Partie: constitution et mode de
fonctionnement. (Digital line store standards converter 625-819 lines: technical structure and operating mode). Radiodiffusion et Television, 36 and 37.
DAVIES, R. E., EDWARDSON, S. N. and HARVEY, R. V. [March/April, 1971] Electronic field-store standards converter. Proc. IEE, 118, 460-468.
EDWARDSON, S. M. and JONES, A. H. [October, 1971] Digital television synchronizers and converters. Wireless World, 77, 479-482.
GUINET, Y. [February-March, 1975] Le transligneur numerique 625 lignes/819 lignes: conception et resultats (Digital line-store standards converter 625 lines/819 lines: design and results). Radiodiffusion et Television, 36.
IBA [September, 1972] New IBA picture converter for transatlantic colour television uses computer technology. IBA Engineering Information.
IBA [June, 1973] DICE — Digital Intercontinental Conversion Equipment. IBA Technical Review No. 3 — Digital Television.KINUHATA, K., SASAKI, H., YAMAMOTO, H. and AMANO, K. [1974] A digital standards converter for television using
intra-frame line interpolation techniques. IEEE International Conference Communications.KINUHATA, K., SASAKI, H., YAMAMOTO, H. and AMANO, K. [November, 1975] Digital standards converter for colour
television. Denshi Tokyo of IEEE.LE COUTEUR, G. M. and OSBORNE, D. W. [1970] A field-store converter/synchronizer. IEE Conference Publication, No. 69.LORD, A. V., RAINGER, P. and ROUT, E. R. [1970] Digital line-store standards conversion. IEE Conference Publication,
No. 69.Radio and Elect. Engr. [April, 1971] Digital techniques in broadcast engineering. Radio and Electronic Engineer, S48-S49.RTSJ [May/June, 1971] Progess in digital television. Royal Television Soc. Joum., 13, 9, 199-201.SAKATA, H. et al. [March, 1971] Television standards converter. NHK Technical Monograph, No. 17.SATOH, H. et al. [July, 1971] Television standards converter. K D D Tech. Joum., 69.
REPORT 477-2
TRANSCODING OF COLOUR TELEVISION SIGNALS FROM ONE COLOUR SYSTEM TO ANOTHER
(Study Programme 2A-1/11)(1970 - 1978)
The different colour systems now being used on the various 625-line television standards require, for international exchange of colour television programmes, that, when the colour television system employed in the originating country differs from that of the receving country, a means be provided of changing the colour television system. Since no change of line or field frequency is necessary but only a change in the coding of the colour information, the process for effecting this change has been given the name of “transcoding”.
A considerable amount of work on the design and production of transcoding equipment has been carried out in several countries. For the benefit of workers in the field of activity, a bibliography follows.
BIBLIOGRAPHY
BRUCH, W. [1964] Ein neues Verfahren zur zentralen Phasenfehlerkorrektur eines PAL Farbfernsehsignals (PAL-IN-PALTranscoder) (A new approach to centrally correcting the phase o f PAL colour television signal (PAL-IN-PALTranscoder)). Telefunken-Zeitung, Vol. 37, 2.
BRUCH, W. [1965] Ein neues Verfahren zur zentralen Phasenfehlerkorrektur eines PAL Farbfernsehsignals (PAL-IN-PALTranscoder) (A new approach to centrally correcting the phase o f PAL colour TV signal (PAL-IN-PAL transcoder).Rundfunktechniche Mitteilungen, Vol. 9, 4.
CASTELLI, E. [May, 1966] Standards conversion and chrominance transcoding problems in the exchange o f television programmes. IEEE Trans., Broadcast and television receivers, Vol. BTR-12, 2.
EDWARDSON, S. M. [1967] Translating and transcoding between colour television systems with common scanning standards. PIEE, Vol. 114, 1, 23-29.

52 Rep. 477-2, 628-1
EBU [October, 1964] Transcoding NTSC-PAL-NTSC. EBU Doc. Com. T(E) 136.
EBU [December, 1964] Transcoding NTSC-PAL-NTSC. EBU Doc. Com. T(E) 148.
EBU [November, 1965] Report on transcoding. EBU (Sub-Group 1) Com. T(E) 209.
EBU [November, 1965] Requirements for line frequency stability when transcoding SECAM-PAL. EBU Com. T(E) 212, Institut fur Rundfunktechnick.
ILLETSCHKO, G. and SCHONFELDER, H. [1969] Ein Kammfllter fur das PAL-Verfahren (A comb filter for the PAL process). Elektronische Rundschau, B. 23, 8, 197-200.
JASCHKE, F. [April 1968] Methoden zur Farbnormwandlung NTSC-PAL zwischen Femsehnormen unterschiedlicher Vertikal- frequenz (Methods for the conversion from NTSC-PAL between colour television systems with different frame frequencies). NTZ, 21, 4, 177-181.
JASCHKE, E. and M0LLER, H. [1968] Ein Transcoder zur Umsetzung von SECAM-Farbfemsehsignalen in das PAL-System (A transcoder for the conversion of SECAM colour TV signals into the PAL system). Radio Mentor, 7, 494-498.
JASCHKE, F. and WENDT, H. [1968] A transcoder for conversion o f SECAM colour television signals into the PAL system. Radio-M entor Electronic, 34.
KHLEBORODOV, V. A. [1965] Sposoby vydeleniya signala yarkosti pri transkodirovanii signala sistemy PAL v signal sistemy SEKAM (Methods o f separating the luminance signal in PAL-SECAM transcoding). Voprosy radioelectroniki, in the series Teknika televideniya, 5, 107-124.
OIRT [1970] TK-III-506/OIRT Transcoding of colour television signals.
OIRT [1971] TK-III-579/OIRT Information on practical experience gained in SECAM/PAL transcoding.
OIRT [1971] TK-III-624/OIRT Transcoding of colour television signals.
OIRT [1971] TK-III-625/OIRT Transcoding of colour television signals.
OIRT [1972] TK-III-697/OIRT Colour television transcoding in stages.
OIRT [1972] TK-III-696/OIRT Correction of the influence of the transcoding process.
OIRT [1972] TK-III-679/OIRT Transcoding o f colour television signals.
OIRT [1972] TK-III-752/OIRT Transcoding o f colour television signals.
OIRT Transcoding of colour television signals. OIRT Recommendation No. 82.
PETH, H. [1969] Ein industriell-gefertigter SECAM-PAL Transcoder (an industrially manufactured SECAM-PAL transcoder). Radio-TV Service, 111-112, 4730-4739.
PTACEK, M. [1968] Metody transkodov&ni signalu barevne televize (Methods o f transcoding colour television signals). Slaboproudy obzor, Vol. 29, 9, 509-520.
SOROKA, E.Z., KHLEBORODOV, V. A., MAVRITSYN, V. G. and SHTEINBERG, A. L. [1970] Transkodirovanie PAL- SEKAM (PAL-SECAM transcoding). All-Union Scientific Conference on Television Techniques. Abstracts, 32-33, Leningrad, U.S.S.R.
STEELE, F. H. [April-June, 1965] The transcoding of colour television signals. Royal Television Soc. Joum., Vol. 11, 2.
WATSON, S. N. [May, 1966] A survey o f colour transcoding. IEEE Trans., Broadcast and television receivers, Vol. BTR-12, 2.
WENDT, H. [1968] Method o f separation o f luminance and chrominance signals in transcoding SECAM-PAL. NTZ, 21, 4, 182-185.
CCIR Document
[1966-69]: XI/191 (France).
REPORT 628-1
AUTOMATIC MONITORING OF TELEVISION STATIONS
(Question 15/11)(1974 - 1978)
During recent years, it has been the custom to design transmitting stations for unattended operation. This has led to a growing demand for automatic measuring systems capable of checking transmitter performance and providing alarms and status information for control stations. This automatic equipment is generally arranged to measure important characteristics of the television signal such as the synchronizing pulses, blanking intervals and the main features of an insertion test signal located in the field-blanking period. The equipment may also check the frequency of the vision and sound carriers and, in some cases, the continuity of the sound channel may be checked by detecting the presence of a super audio pilot signal. In the case of transposers, the insertion test signal measurement results may be regarded as sufficient evidence of correct operation of the sound channel.

Rep. 628-1 53
The facilities needed for the automatic monitoring of a network of broadcasting stations may either be located at each of the stations to be monitored, or, in another method, a central master station may employ a more comprehensive system which is able to make measurements by direct reception of the remote stations. While the transmitter is in programme service, it is convenient to monitor the radio-frequency signal by feeding the measuring system from a high quality receiver or demodulator. A similar set of measurements may be needed for the point to point link network which distributes the signal to the main transmitting stations. Both sets of measurements may often be performed by the same operational system which is able therefore to supervise the link networks as well as the transmitters.
The recent emergence of the integrated circuit micro-processor has led to the design of equipment which allows wholly digital measuring techniques to be applied to on-site test line parameter analysis and noise measurement [James and Watson, 1975]. This approach results not only in greater versatility, but affords appreciable economies in both size and cost over comparable analogue measuring equipment capable of taking executive corrective action.
Report 411-3 discusses automatic methods of measuring and supervising video test signals. The methods decribed are equally applicable to the monitoring of transmitting stations.
REFERENCES
JAMES, A. and WATSON, J. B. [1975] Digital automatic measuring equipment. 9th International Television Symposium, Montreux, Switzerland.
BIBLIOGRAPHY
ANDERSON, W. N. and MCKENZIE G. A. [October, 1970] Automatic control and supervision o f television transmitting stations. EBU Tech. 3092-E, European Broadcasting Union: Symposium on Automation and Computers in Broadcasting.
BARRATT, K. H. [September, 1973] The application of a mini-computer to the automatic measurement o f the technical quality of television signals. IEE Conference Publication No. 103.
BLAKE, A. R. [September, 1973] Requirements for peripheral hardware used for the measurements o f television waveforms. IEE Conference Publication No. 103.
KRIVOSHEEV, M. I. [May, 1967] Problems o f monitoring and measurements in the television chain. 5th International Symposium on Television, Montreux, Switzerland.
McKENZIE, G. A. [September, 1972] Experiments with a computer in a television control and monitoring centre. IEE Conference Publication No. 88.
McKENZIE, G. A. [October, 1973] Automated television waveform measurement by use o f a digital computer. 114th SMPTE Technical Conference.
RHODES, C. W. [May, 1973] An automated, remote measuring and telemetry system for insertion test signals. 8th International Television Symposium, Montreux, Switzerland.
RHODES, C. W., [January, 1977] Automated measurement by digital means o f baseband transmission parameters. SMPTE Winter Television Conference, San Francisco, California, USA.
RHODES, C. W., [June, 1977] An all digital measuring system for baseband video test signals — ANSWER II. 10th International Television Symposium, Montreux, Switzerland.
SCHAFFER, J. [September, 1973] Digital telemetry for monitoring television signals. IEE Conference on the use o f digital computers in measurement, IEE Conference Publication No. 103.
STEELE, F. H. [February, 1975] Some applications o f digital techniques to broadcast data. IEE London. Electronics and Power, Vol. 21, No. 3.
VIVIAN, R. H. [December, 1971] Some methods o f automatic analysis of television test signals. Joum. o f the SMPTE, Vol. 80.
VIVIAN, R. H. [September, 1973] Software for television waveform measurements by computer. IEE Conference Publication No. 103.
WILLIAMSON-NOBLE, G. E. and SEVILLE, R. G. [November, 1966] The television automatic monitor major. IEE Conference Publication No. 25.
WISE, F. H. [November, 1966] The use of signals inserted in the field blanking period o f the television waveform for control and monitoring o f broadcast equipment. IEE Conference Publication No. 25.
CCIR Document
[1966-69]: XI/186 (U.S.S.R.).

54 Rep. 803
REPORT 803 *
THE INTERNATIONAL EXCHANGE OF ELECTRONIC NEWS GATHERING (ENG)
Television news programmes
(Question 2-2/11 and Study Programme 18B-1/11)(1978)
1. IntroductionElectronic News Gathering (ENG) or Electronic Journalism (EJ) is the collection of television news stories
without the use of film, using small, hand-held, electronic, colour cameras with microwave links to the news-room and /o r portable battery driven video tape recorders. The technical picture quality is not yet as good as that currently produced by television studio equipment, and since the emphasis for news gathering is on portability and low-light sensitivity, it seems probable that for some years this situation will continue. However, the requirements of news gathering sometimes make some loss of technical quality of less importance than the news story. ENG cameras may be used with microwave-radio-links carrying the picture and sound back to the news-room. ENG cameras may also be used with small portable recording machines and the tape transported either direct to the news-room or to a convenient injection point where it may be replayed to line or to a radio-link connection to the news-room.
The availability of light-weight, battery operated video tape recorders — together with the development of time-base correctors to stabilise their outputs — are the two technical developments which have made ENG practicable.
ENG equipment is already in use in broadcasting in several parts of the world. The aim of the following proposals is to preserve the quality of ENG pictures offered for international exchange. The proposals are drawn from recommendations of the EBU and are being implemented in some countries in Europe.
Since the use of Electronic News Gathering is subject to revision, due to the application of new and emerging technology,, additional and continuing studies are invited.
2. Main proposalsThe following proposals are not intended to cover all the different aspects of the use of ENG systems. The
purpose is to draw the attention of the Administrations to some present day aspects (1977) that may have a particular implication in the international exchange of signals derived from systems of this kind. Additional information relating to the use and characteristics of ENG systems is contained in the bibliography attached to this Report.
2.1 Characteristics o f the signals (wa veforms)ENG pictures carried across national boundaries for international exchange should be suitable for direct
broadcasting, for standards conversion, for transcoding, or for recording on full-broadcast quality machines, without any additional timing corrections. If this is not the case, broadcasters must reprocess the signal, perhaps through a digital time-base corrector, since it is not easy to tell, with normal monitoring equipment, whether the ENG signals are suitable for broadcasting purposes; however, continued reprocessing of the ENG signal is not only wasteful of equipment time, but steadily reduces the picture quality.
Such ENG pictures should, in principle, conform to one of the standards in Report 624-1 “Characteristicsof television systems” and, for 625-line systems, Recommendation 472-1, “Video-frequency characteristics of a television system to be used for the international exchange of programmes between countries that have adopted 625-line colour or monochrome systems”. However, for such purposes, a video bandwidth smaller than the usual value may be admitted during the initial stage.
2.2 Guidelines for the setting up and use o f EN G systems2.2.1 At the present state of technology, it is considered good engineering practice to offer for international exchange, only recordings of generations not greater than the second (that is, the first copy from the original), when signals from ENG video tape recordings (VTR) are used.Note. — Normally, ENG tape recordings can undergo several further generations of copying by full-broadcast quality VTR machines, without significant deterioration in picture quality.2.2.2 Any equipment for noise reduction or image improvement should be sited as close to the source of degradation as is practicable. Nevertheless, repeated reprocessing of the signal should be avoided.
BIBLIOGRAPHY
EBU [1977] Report o f the EBU on Electronic News Gathering, Tech. Doc. EBU-3225.ENG -Field Production Handbook. Published by BM/E, 29 Madison Avenue, New York, USA.SMPTE [1976] Television News Gathering, 10th Annual SMPTE Winter Television Conference, Detroit, USA.
India reserves its position in regard to the use for ENG of the bandwidths given in Recommendation 472-1.

Rep. 804 55
REPORT 804
DEFINITIONS OF PARAMETERS FOR AUTOMATIC MEASUREMENT OF TELEVISION INSERTION TEST SIGNALS
(Study Programme 15D/CMTT and Question 15/11)(1978)
At the Interim Meeting of the CCIR, Geneva, 1976, the need for definitions of parameters for automatic measurement of insertion test signals (Recommendation 473-2) was recognized. At that time a draft text for such a Recommendation was prepared by the CMTT and contributions were invited from all Administrations on the application of those definitions.
The CMTT at their meeting in 1977 adopted a revised text specifying a set of parameters in the form of Recommendation 569. It is believed that it would greatly simplify operational procedures if a unified set of parameter definitions could be adopted for use on point-to-point links, transmitters and studio signals. It is, therefore, desirable that the set of definitions given in the CMTT Recommendation should be used in the studio and transmitter areas. Further contributions are needed on the application of these parameter definitions at all points in the studio and transmitter chain.

PAGE INTENTIONALLY LEFT BLANK
PAGE LAISSEE EN BLANC INTENTIONNELLEMENT

Rec. 500-1 57
SECTION 11C: PICTURE QUALITY AND THE PARAMETERS AFFECTING IT
Recommendations and Reports
RECOMMENDATION 500-1
METHOD FOR THE SUBJECTIVE ASSESSMENT OF THE QUALITY OF TELEVISION PICTURES
(1974 - 1978)The CCIR,
CONSIDERING
(a) that a large amount of information has been collected about the methods used in various laboratories for the assessment of picture quality;(b) that examination of these methods shows that there exists a considerable measure of agreement between the different laboratories about a number of aspects of the tests;(c) that the adoption of a single standardized method is of the greatest importance in the exchange ofinformation between various laboratories;(d) that routine or operational assessments of picture quality and/or impairments using a five-grade qualityand impairment scale made during the normal course of duty of certain supervisory engineers, can also make some use of certain aspects of the methods recommended for laboratory assessments,
UNANIMOUSLY RECOMMENDS
that the general methods of test, the grading scales and the viewing conditions for the assessment of picture quality, described in Annex I should be used for laboratory experiments and for operational assessments whenever possible.
ANNEX I
METHOD FOR LABORATORY ASSESSMENT OF PICTURE QUALITY
1. IntroductionBefore giving details of the method, it should be remarked that the ultimate purpose of tests is to discover
the acceptability of some impairment whose complete elimination may be uneconomic to achieve. Although in a normal television audience there will be some “expert observers” *, the proportion of them is thought to be so small that it is proper to concentrate the objective of the laboratory tests on the opinions of non-experts, because the use of experts could lead to results which are much more critical than would be obtained with normal television viewers. The philosophy which leads to preference being given to the opinions of non-experts is also applied to the choice of test pictures and viewing conditions which are chosen to be more critical than average but not unduly so. As tests with non-expert observers tend to be lengthy, it is often desirable that a quick test shouldbe carried out by experts. In this case, a smaller number of observers can be used. However, it should be notedthat in certain circumstances tests carried out with expert observers may not be a satisfactory substitute for tests carried out by non-expert observers [CCIR, 1963-66]. In cases of doubt, the relationship between expert and non-expert opinion should be investigated.
The statistical design of experiments has been well considered and documented; the amount of data which needs to be collected depends upon such interrelated factors as the confidence level which is needed in the answer, the standard deviation in the measurements, and the relative magnitude of the effect which it is required to detect. The following suggestions are intended as guide lines to assist in formulating a considered experimental assessment programme.
2. Details of the method
2.1 ObserversObservers may be either expert or non-expert.Normally, the experiments should be carried out with non-expert observers (see Introduction). These
observers should be appropriately introduced to the test method, the grading scale and the impairments or processes to be assessed. Remarks likely to influence the rating should be avoided.
The number of observers should be at least ten, and preferably about twenty. In all cases, the number and type of the observers, as well as the details of their introduction to the test should be specified.
The term “expert observers” is considered to apply to observers who have had recent extensive experience in observing picture quality or impairments, particularly of the type being studied in the subjective test.

58 Rec. 500-1
2.2 Grading scales
The five-grade scales are listed in Table I. It is important to restrict the definitions of the grades to those given in Table I; according to the nature of the problem it may be more appropriate to use a quality scale or an impairment scale.
TABLE I
Five-grade scale
Quality Impairment
5 Excellent 5 Imperceptible4 Good 4 Perceptible, but not annoying3 Fair 3 Slightly annoying2 Poor 2 Annoying1 Bad 1 Very annoying
It is recommended that results should be presented in the form given above although it is recognised that, to suit local practices, some laboratories may wish to invert the order of the numbering or to replace the numbers with letters when an experiment is being carried out.
The scale which has been used, that is, an impairment or a quality scale, should always be quoted along with the results of an experiment. *
For certain types of experiment, a comparison scale is more convenient than a quality or impairment scale; in such cases the scale of Table II is recommended:
TABLE II - Comparison scale
+ 3 Much better+ 2 Better+ 1 Slightly better
0 The same- 1 Slightly worse- 2 Worse- 3 Much worse
2.3 Test pictures
About five short sequences of pictures, including moving subject matter and/or still pictures, as appropriate, should be used. Normally, these should be pictures that are more critical than average pictures, but not unduly so, taking into account the specific assessments being made. For example, certain effects are best evaluated by using scenes containing bright saturated colours viewed by colour cameras. In assessments where the effects of movement do not cause specific impairments the use of still pictures should be preferred. Other effects may dictate the use of sharp, contrasted edges, detailed areas and/or de-saturated colours with a low level of brightness. However, test patterns should not normally be included. The visual scenes and the signal sources used should be described in the presentation of the results.
2.4 Viewing conditions
The preferred viewing conditions are affected by the field frequency of the television system. Table III shows the conditions for systems with 50 and 60 fields/s.
In view of the large number of documented results which have been obtained using six-grade scales, it is desirable to have a means of transforming results so that these data can still be used. Uncertainties arise in attempting to transform results obtained from one scale into another scale, particularly from the categorisation o f the grades. However, as a first approximation, the following linear relationship can be used to transform mean values A$ obtained in an experiment using a six-grade scale (Report 405-3, Notes 7 and 9) into a corresponding mean value A5 in the five-grade scale:
As = 5.8 - 0.8 A6.

Rec. 500-1 59
TABLE III
Condition Field frequency 50 fields/s 60 fields/s
a Ratio of viewing distance to picture height 6 0 4 to 6b Peak luminance on the screen (cd/m2) 70 ± 10 (2) 70 ± 10c Ratio of luminance of inactive tube screen (beams
cut off) to peak luminance < 0 0 2 < 0 0 2d Ratio of the luminance of the screen when dis
playing only black level in a completely dark room, to that corresponding to peak white approximately 0 01
e Ratio of luminance of background behind picture monitor to peak luminance of picture approximately 01 (3) approximately 0-15
f Other room illumination low (4) low
g Chromaticity of background white (5) d 66h Ratio of solid angle subtended by that part of the
background which satisfies this specification, to that subtended by the picture > 9
0 Normally 6 ; if a different ratio is used, this should be stated.
(а) Normally (70 ± 1 0 ) cd/m2, or (220 ± 30) asb (6), but certain tests may require luminances outside the tolerances, for example, because of flicker, defocusing, etc.
(3) If the ratio is greater than 0 1 , the chromaticity has to be nearer to Illuminant (7).
0 The specification is loosely phrased here, since the precise value is not critical, provided it does not conflict with condition c.
0 Not very critical. Any white in the region between standardized illuminants A and D^. See, however, Note (3).
(б) 1 apostilb (asb) = — candela per square metre (cd/m2).TZ
(7) Illuminants standardized by the International Commission on Illumination (CIE); see International Electrotechnical Vocabulary, Group 45, No. 45-15-145.
2.5 P resentation
The pictures and impairments should be presented in random sequence with the proviso that the same picture should never be presented on two successive occasions with the same or different levels of impairment.
When using the quality or impairment scale, the range of impairments should be chosen, wherever practicable, so that all grades are used by the majority of observers; a grand mean score (averaged over all judgements made in the experiment) close to 3 should be aimed at, to standardize results.
A session should not last more than roughly half an hour, including the explanations and preliminaries; the test sequence could begin with a few pictures indicative of the range of impairments; judgements of these pictures would not be taken into account in the final results.
REFERENCES
CCIR [1963-66]: X I/16, United Kingdom (refers to a published paper: PROSSER, R. D., ALLNATT, J. W. and LEWIS, N. W. [March, 1964] Quality grading of impaired television pictures. Proc. IEE, 111, 491-502).
CCIR Document[1963-66]: X I/16 (United Kingdom).
BIBLIOGRAPHY
CCIR Documents [1966-69]: XI/158 (France).[1970-74]: 11/111 (Italy); 11/128 (U.S.S.R.).

60 Rep. 313-4
REPORT 313-4
ASSESSMENT OF THE QUALITY OF TELEVISION PICTURES
(Question 3-1/11)(1959 - 1963 - 1966 - 1970 - 1974 - 1978)
It appears that during recent years extensive studies have been made in many laboratories on the assessment of the quality of television pictures and the respective methods of measurement, both for monochrome and colour television. Since it would appear that these studies cannot yet be considered to be concluded, it seems appropriate, with a view to facilitating future work, to give a list of documents and publications bearing on this question.
Such a list would serve both to avoid duplication of work and to enable comparisons to be made with results already found elsewhere. It may be extended to include subsequent publications on this subject and would be a valuable aid, within the scope of Question 3-1/11, to the arriving at suitable standard methods for measuring the various kinds of picture distortion in television.
Bibliography relating to Question 3-1/11
ALLNATT, J. W. [October, 1965] Subjective quality of colour television pictures impaired by gain and delay inequalities between the luminance and chrominance channels. Proc. IEE, 112, 1819-1824.
ALLNATT, J. W. [1971] Subjective assessment of impairments in television pictures. A pplied Ergonomics, 2, 231-235.
ALLNATT, J. W. [1973] Opinion distribution model for subjective rating studies. International Joum. Man-Machine Studies, 5, 1-15.
ALLNATT, J. W. [August, 1975] Opinion-rating model applied to television transmission system studies. Proc. IEE, 122, 769-774.
ALLNATT, J. W. [1975] Subjective rating and apparent magnitude. International Joum. Man-Machine Studies, 7, 801-816.
ALLNATT, J. W. [September, 1977] Subjective quality of television pictures impaired by linear waveform distortion. Electronics Letters, 13, 546-548.
ALLNATT, J. W. and BRAGG, E. J. W. [March, 1968] Subjective quality o f television pictures impaired by sinewave noise and low-frequency random noise. Proc. IEE, 115, 371-375.
ALLNATT, J. W. and CORBETT, J. M. [1972] Adaptation of observers during television quality-grading tests. Ergonomics, 15, 353-366 and 491-504.
ALLNATT, J. W. and CORBETT, J. M. [August, 1974] Comparisons of category scales employed for opinion rating. Proc. IEE, 121, 785-793.
ALLNATT, J. W. and PROSSER, R. D. [March, 1965] Subjective quality of television pictures impaired by long-delayed echoes. Proc. IEE, 112, 487-492.
ALLNATT, J. W. and PROSSER, R. D. [April, 1966] Subjective quality of colour television pictures impaired by random noise. Proc. IEE, 113, 551-557.
CORBETT, J. M. [1970] Effect o f observer adaptation on the results of television quality-grading tests. Proc. IEE, 117, 512-514.
CORBETT, J. M. and ALLNATT, J. W. [July, 1974] Subjective quality of television pictures impaired by short-delay echo. Proc. IEE, 121, 583-593.
CORBETT, J. M., TAYLOR, J. R. and ALLNATT, J. W. [February, 1969] Subjective quality of colour television pictures impaired by video-crosstalk. Proc. IEE, 116, 181-184.
FLOR, W. [February, 1977] Beurteilungen intermodulationsgestorter Fernsehbilder durch Nichtexperten (Assessment by nonexperts of television pictures impaired by intermodulation). Femseh und Kino-Tech., 31, 46-48.
FLOR, W. [March, 1977] Beurteilung intermodulationsgestorter Fernsehbilder (Assessment of television pictures impaired by intermodulation). Rundfunktech. Mitt., 21, 62-67.
GEDDES, W. K. E. [April, 1963] The relative impairment produced by random noise in 405-line and 625-line television pictures. E BU Review, A-Technical, 78, 46-48.
JESTY, L. C. [February, 1958] Relation between picture size, viewing distance and picture quality. Proc. IEE, 105, part B.
KRETZ, F. [October, 1977] Criteres objectifs de qualite subjective en codage numerique des signaux visuels: methodologie et application a Toptimalisation; exemples (Objective criteria of subjective quality in digital coding o f picture signals: method and application for optimization; examples). Proc. of the International Symposium on Measurement in Telecommunication (URSI), Lannion, France.
KRETZ, F. and BOUDEVILLE, J.-L. [1976] Degradations des signaux d’images et qualite subjective en codage numerique: visibility du flottement de contour (Degradation of picture signals and subjective quality in digital coding: visibility of edge busyness). Ann. Telecommun., 31, 333-356.
KRETZ, F., BOUDEVILLE, J.-L. and SALLIO, P. [6-9 September, 1977] Optimization of DPCM using subjective quality criteria. Procs. of IERE Conference No. 37, Loughborough, UK.

Rep. 313-4, 405-3 61
KRETZ, F. and DE LATRIBONNIERE, J. P. [6-9 September 1977] Non-linear quantization o f colour difference signals using data on colour differential thresholds. Proc. o f IERE Conference No. 37, Loughborough, UK.
LEWIS, N. W. and ALLNATT, J. W. [September, 1965] Subjective quality o f television pictures with multiple impairments. IEE Electronics Letters, 1, 187-188.
LEWIS, N. W. and ALLNATT, J. W. [1968] Subjective and objective impairments in television pictures. IEE Conference Publication No. 46, 2.1.1. to 2.1.5.
PROSSER, R. D. and ALLNATT, J. W. [June, 1965] Subjective quality o f television pictures impaired by random noise. Proc. IEE., 112, 1099-1102.
REID, G. M. [September, 1977] Subjective data for random noise measured through the new CMTT unified weighting network for television. Electronics Letters, 13, 551-553.
CCIR Documents
[1956], Warsaw: 383.
[1958], Moscow: X I/3 , X I/11, X I/12, X I/24, XI/25.
[1959], Los Angeles: 39, 124, 125, 126, 145.
[1962], Bad Kreuznach: X I/18, X I/22, X I/29, X I/30.
[1963-66]: X I/16, X I/31, X I/61, X I/62, X I/63, XI/149.
[1966-70]: X I/37, (Germany, Federal Republic of); X I/39 (U.S.S.R.); X I/40 (U.S.S.R.); X I/56 (France), X I/203 (Italy).[1970-74]: 11/75 (Switzerland); 11/115 (Italy); 11/252 (USA); 11/279 (USA); 11/280 (USA); 11/311 (Italy); 11/322 (Poland,
People’s Republic of); 11/323 (Poland, People’s Republic of); 11/329 (Italy); 11/330 (Italy).[1974-78]: a. 11/78 (Poland, People’s Republic of); b. 11/79 (Poland, People’s Republic of); c. 11/171 (Italy); d. 11/331 (USA);
e. 11/388 (Poland, People’s Republic of); f. 11/360 (France).
REPORT 405-3
SUBJECTIVE ASSESSMENT OF THE QUALITY OF TELEVISION PICTURES
(Study Programmes 3A-1/11 and 3B/11)(1966- 1970- 1974- 1978)
Recommendation 500-1 proposes a method for subjective assessment of the quality of television pictures and provides a partial answer to Study Programme 3A-1/11. However, as many results of subjective experiments which have been carried out in different countries using different methods are already available and in use, it is considered important that the details of the grading scales and methods of test employed should remain on record. This information is summarized in Annex I.
In order to facilitate the comparison of results among different laboratories it would be useful to list the types of experiments for which the different scales (that is quality, impairment and comparison) are best used.
Study Programme 3A-1/11 calls for studies on the analysis and presentation of the results of subjective tests. Contributions have been received on this topic from a number of Administrations and Annex II lists and summarizes these contributions.
Annex III is an example of one such method. Administrations are invited to provide further contributions on all aspects of this important topic.
Annex IV describes two test procedures, one which uses the quality scale, and the other using the impairment scale for the case where each subjective assessment is made in relation to a reference (unimpaired) picture.
Annex V is a first attempt to describe methods for testing the performance of digital television systems.
REFERENCES
ALLNATT, J. [1973] Opinion-distribution model for subjective rating studies. Int. Joum. Man-machine studies, 5, 1-15.
ALLNATT, J. W. and BRAGG, E. J. W. [1968] Subjective quality of television pictures impaired by sinewave noise and low-frequency random noise. Proc. IEE, 115, 317-375.
CAVANAUGH, J. R. and LESSMAN, A. M. [1971] Subjective effects of differential gain and differential phase distortions in NTSC colour television pictures. Journ. Soc. Motion Picture Televis. Engrs. 80, 614-9.

62 Rep. 405-3
CORBETT, J. M. [1970] Effect o f observer adaptation on the results of television quality-grading tests. Proc. IEE, 117, 512-514.
KRIVOSHEEV, M. I. [1976] Osnovy televizionnykh izmerenii (Fundamentals o f television measurement). Sviaz. Izd., Moscow, U.S.S.R..
LESSMAN, A. M. [1972] The subjective effects o f echoes in 525-line monochrome and NTSC colour television and resulting echo time weighting. Joum. Soc. Motion Picture Televis. Engrs., 81, 907-916. Also, CCIR [1970-1974] 11/280 (USA).
LEWIS, N. W. and ALLNATT, J. W. [1965] Subjective quality o f television pictures with multiple impairments. Electronics Letters, 1, 187-188.
LEWIS, N. W. and ALLNATT, J. W. [1968] Subjective and objective impairments in television pictures. IEE Conference Publication, 46, 2.1.1.-5.
MICELI, S. and ORLANDO, A. [1977], Subjective assessments elaboration for determining the distortion tolerance of a telecommunication system. Proc. o f IEEE of EUROCON’ 77, Venice, Italy, 1, 305.
PROSSER, R. D., ALLNATT, J. W. and LEWIS, N. W. [1964] Quality grading of impaired television pictures. Proc. IEE, 111, 491-502.
SIOCOS, C. A. [1972] Subjective impairment o f television pictures — considerations regarding the summability o f impairment units. Journal o f the SMPTE, 81, 917-920.
CCIR Documents
[1963-66]: a. X I/16 (United Kingdom); b. XI/31 (Federal Republic of Germany); c. X I/33 (EBU); d. X I/45 (CCIR Secretariat); e. X I /140 (Japan); f. XI/145 (United States o f America); g. X I/149 (OIRT).
[1966-69]: a. XI/155 (Japan); b. XI/8 (United States o f America); c. XI/45 + XI/181 (Italy); d. X I/46 (OIRT); e. XI/146 (Canada); f. CMTT/159 (Italy).
[1970-74]: a. 11/330 (Italy); b. 11/329 (Italy); c. 11/273 (United Kingdom); d. 11/279 (United States of America); e. XI/304 (Switzerland).
[1974-78]: a. 11/171 (Italy); b. 11/65 (France); c. 11/56 (United Kingdom); d. 11/421 (Italy); e. 11/360 (France); f. 11/409 (U.S.S.R.).
BIBLIOGRAPHY
ALLNATT, J. W. [1965] Subjective quality o f colour-television pictures impaired by gain and delay inequalities between the luminance and chrominance channels. Proc. IEE, 122, 1819-1824.
ALLNATT, J. W. [1971] Subjective assessment o f impairments in television pictures. Applied Ergonomics, 2, 231-235.
ALLNATT, J. W. [1975] Opinion-rating model applied to television-transmission-system studies. Proc. IEE, 122, 769-774.
ALLNATT, J. W. and CORBETT, J. M. [1972] Adaptation in observers during television quality-grading tests. I, Adaptation as a function of the conditioning situation. Ergonomics, 15, 353-366.
ALLNATT, J. W. and CORBETT, J. M. [1972] Adaptation in observers during television quality-grading tests. II, Progress of adaptation during an experiment, Ergonomics, 15, 491-504.
ALLNATT, J. W. and PROSSER, R. D. [1966] Subjective quality of colour-television pictures impaired by random noise, Proc. IEE, 113, 551-557.
CORBETT, J. M. [1970] Effect of observer adaptation on the results of television quality-grading tests, Proc. IEE, 117, 512-514.
CORBETT, J. M. and ALLNATT, J. W. [1974] Subjective quality of television pictures impaired by short-delay echo, Proc. IEE, 121, 583-593.
SIOCOS, C. A. [1971] Numerical values for subjective picture quality in television. Journal o f the SMPTE, 80, 958-962.
WEAVER, L. E. [1968] The quality rating o f colour television pictures. Journal o f the SMPTE, 77, 601-612.
CCIR Documents
[1966-69]: XI/158 (France); X I/159 (France);
[1970-74]: 11/89 (France); 11/26 (Canada); 11/111 (Italy).

TABLE I - Conditions for laboratory assessments
Reference UK[CCIR,
1963-66a]
EBU, OIRT [CCIR, 1963-66c and d]
Fed. Rep. of Germany [CCIR, 1963-66b]
Japan [CCIR, 1963-66e and 1966-69a]
USA[CCIR,
1963-66f]
USA[CCIR,
1966-69b]
Italy[CCIR,
1966-69c]
ObserversCategoryNumber
Non-expert20-25 > 6
Non-expert> 10
Non-expert20-25
Non-expert approx. 200
Expert> 10
Non-expert approx. 20
Grading scale TypeNumber of grades
Quality5
(Note 1)
Impairment6
(Note 9)
Quality6
(Note 7)
Comparison7
(Note 11)
Impairment5
Quality5
Comparison5
Impairment5
(Note 3)
Quality5
(Note 2)
Quality6
(Note 8)
Impairment7
(Note 10)
Comparison5
(Note 5)
Test pictures Number 4-8 5 > 5 > 3 2-8 3-4 6
Viewing conditions Ratio of viewing distance to picture height
6 4-6 6 6-8 6-8 4 6
Peak luminance on the screen (cd/m2) (2)
Contrast range of the picture
50
Notspecified
41-54 50
Not specified
Approx. 400 (monochrome)
74-84 (colour) (Note 12)
30/1 to 50/1
70(Note 12)
Notspecified
170 (monochrome)
34 (colour) (Note 12)
50
Luminance of inactive tube screen (cd/m2)
<0-5 0-5 <0-5 Approx. 5 (monochrome) 0-7-2 (colour)
2 Approx. 0-5
Luminance of backcloth (cd/m2) (3)
1illuminant C Approx. 2-5 O Not specified
Room illumination, average (lx)
3 Not specified 6-5
PresentationRandom
sequence of pictures and impairments
Random sequence of pictures and impairments
Random sequence of pictures and impairments
Random sequence of
impairments
Random sequence of
impairments
Random sequence of
pictures and impairments
0 For monochrome only. (2) 1 cd/m2 = 1 nt = 3-14 asb = 0-29 ft-L. (3) Ambient luminance at the end of the room as seen by the viewer.
AN
NEX
I

64 Rep. 405-3
TABLE II - Conditions for assessment during programme transmission
Reference OIRT [CCIR, 1966-69(1]
Canada [CCIR, 1966-69e]
ObserversCategoryNumber
Expert 1 or 2
Expert 1 or 2
Grading scale TypeNumber o f grades
Impairment6
(Note 9)
Quality6
(Note 7)
Impairment5
(Note 4)
PicturesType Television programmes Television programmes
Viewing conditionsRatio of viewing distance to picture height 4-6 4-6
Angle of view, from a line normal to the face of the monitor <30°
Luminance, on the screen, at reference white (cd/ma) 70 ± 7
Chromaticity of the screen at reference white Illuminant D
Luminance of the inactive tube screen Adapted to the ambient illumination
As low as practicable
Luminance of “light surround” (cd/m2) 10-5 ± 3-5 (Note 14)
Chromaticity of “light surround” Illuminant D
Quality scales
Five-grade scale
A Excellent Note 2 . - 5 ExcellentB Good 4 GoodC Fair 3 FairD Poor 2 BadE Bad 1 Very bad
Impairment scales
Note 3. — 5 Imperceptible
4 Perceptible but not annoying 3 Somewhat annoying 2 Severely annoying1 Unusable
Comparison (fidelity) scales
Note 5. — 1 Equal2 Slightly different3 Different4 Very different5 Extremely different
Note 4. — 1
2345
Imperceptible (implied grade) Detectable Noticeable Objectionable Unsuitable for broadcast
Note 6. — + 2 + 1
0 - 1 - 2
Much better Better The same Worse Much worse

Rep. 405-3
Six-grade scales
65
Quality scales
Note 7. — 1 Excellent2 Good3 Fairly good4 Rather poor5 Poor6 Very poor
Note 8. — 1 Excellent: the picture is of extremely high quality, as good as you could desire.2 Fine: the picture is of high quality providing enjoyable viewing; interference is perceptible.3 Passable: the picture is of acceptable quality; interference is not objectionable.4 Marginal: the picture is poor in quality and you wish you could improve it; interference is
somewhat objectionable.5 Inferior: the picture is very poor but you could watch it; definitely objectionable interference is
present.6 Unusable: the picture is so bad that you could not watch it.
Impairment scale
Note 9. — 1 Imperceptible2 Just perceptible3 Definitely perceptible but not disturbing4 Somewhat objectionable5 Definitely objectionable6 Unusable
Seven-grade scales
Impairment scale
Note 10. — 1 Not perceptible 2 Just perceptible3 Definitely perceptible, but only slight impairment to picture4 Impairment to picture, but not objectionable5 Somewhat objectionable6 Definitely objectionable7 Extremely objectionable
Comparison scale
- 3 Much worse- 2 Worse- 1 Slightly worse
0 Same as+ 1 Slightly better+ 2 Better+ 3 Much better
Note 12. — These higher values of peak luminance can be used with 60-field systems.
Note 13. — The Doc., [CCIR, 1963-66g], points out the need for subjective assessment of picture quality during an international programme exchange. The document provides instructions on how to carry out the assessment, and also a list of terms related to the parameters subjected to assessment. The operational experience gained during transmissions in the Intervision network shows that in spite of the variety of monitoring devices used, adequate agreement on the assessment of picture quality was achieved by the technical staff.
Note 14. — The expression “light surround” is defined as the light visible to the observer from a plane or from behind a plane coincident with, and surrounding but not including, the viewing screen. It is provided over an area at least eight times the area of the monitor screen, or, in the case of adjacent monitors, over an area at least four times the total monitor screen area.

66 Rep. 405-3
ANNEX II
ANALYSIS AND PRESENTATION OF THE RESULTS OF TELEVISION SUBJECTIVE TESTS
1. Introduction
Methods of analyzing and presenting experimental data relating the degradation of a television signal to the consequent picture impairment, assessed subjectively, have up to now varied considerably among experimenters. Such differences add to the difficulty of comparison of results which may already exist due to variations in experimental method. Generally, the techniques that have been used fall into the four following categories:
1.1 In what is probably the simplest method, numbers in an arithmetic series are assigned to the grades of theassessment scale, thus making possible the computation of a mean subjective score (from the reactions of all observers) corresponding to a given magnitude of objective impairment. The results are usually presented as a smooth-curve plot of mean score against objective magnitude. Statistically, the mean is the most efficient estimator of central tendency of the data, but it gives no information about the distribution of opinions regarding a given impairment condition.
1.2 In a second method [Cavanaugh and Lessman, 1971], analysis is made of the cumulative proportions ofobservers judging the subjective quality of a given picture condition as being in or above a stated grade. The results are presented as a family of cumulative probability curves for the various grades. The large amount of detail tends to make interpretation difficult.
1.3 A third method [CCIR, 1966-69f] employs mean score, as described for the method of § 1.1, but providessummarized information about opinion distributions by quoting the standard deviation of scores about the mean. The method works well for mean scores in the vicinity of mid-scale, but is complicated by the inevitable reduction in standard deviation for low and high values of mean, due to the bounded nature of the scales and the associated phenomenon known as “skewing”.
1.4 This difficulty in the method of § 1.3 is overcome in a fourth method [Prosser et al., 1964]. Here again, the method of § 1.1 is relied upon to describe the central tendency of opinions. Use is made of the assumption that the distributions of opinions for a given type of impairment are matched by a theoretical model which can be readily derived from the binomial distribution. Thus the complete experimental results can be summarized in terms of mean score coupled with a statement of the “order” of the binomial model.
1.5 Recently, System M experimenters who had previously favoured the method of § 1.2 have modified their analysis procedure. Like the method of § 1.4, the new method [Lessman, 1972] is based on a generalized distribution model linked to mean score. Unlike the method of § 1.4, the distribution model is based on the concept of a normal distribution, quantized according to the number of grades. This new analytical procedure is still being studied and evidence about its relative advantages and disadvantages has not yet been published.
A somewhat similar model has recently been described [Allnatt, 1973] by a System I experimenter who employs the method of § 1.4. The model employs quantizing intervals which, although symmetrically arranged, are not equal. Calculations are greatly simplified by using the logistic function to calculate both the distribution curve and the quantizing interval. Analysis in terms of the model is comparable in complexity to the method of § 1.4. Match to the data is claimed to be better than for any other known all-embracing model, but the improvement compared with the binomial-type is slight. The benefit of the new model is most likely to be found in the many problems to be encountered in the application of results, where it will be advantageous to work in terms of distributions based on a notional continuous scale of opinion level.
1.6 In some cases it is only necessary to evaluate the perceptibility threshold of an impairment rather than the complete relationship between subjective evaluations and objective impairment. The “random stimuli” method is proposed [CCIR, 1974-78a]. Two slightly different definitions of the threshold may be used, either corresponding to the maximum standard deviation of assessments or to 50 per cent of the positive observations [CCIR, 1974- 78b].
H ow ever, it should be remem bered that know ledge o f the threshold o f perceptibility a lone is insufficient in the treatm ent o f any but the sim plest situations.
1.7 Apart from the above fundamental differences, interpretation and comparison are further complicated by a number of points of detail:
1.7.1 The grading scale may be in terms of “quality” or “impairment”, one being roughly, but in general not exactly, the inverse of the other. The number of grades in the scale has varied between 5 and 7.
1.7.2 Numerical scores are sometimes ordinal numbers which may either increase or decrease with the magnitude of the judged attribute. Alternatively the scores may be normalized so that the range of mean scores is from 0 to 1.
1.7.3 Objective impairment magnitudes may be expressed either directly or in such terms as signal/noise ratio. They may be in arithmetic or logarithmic (dB) units.

Rep. 405-3 67
2. Subjective-impairment units
Although the present concern is with analysis of results, it is useful to take a note of a requirement that frequently arises in application.
Under practical viewing conditions, a number of impairments may arise simultaneously. As it is impracticable to test all the possible combinations, a ’’law of addition” of impairments can be of great benefit.
An empirical law, which has been used [Lewis and Allnatt, 1968; CCIR, 1970-74a], states that if zJ,,u2, uT u„ are the respective normalized mean scores for n unrelated impairments taken separately, thenormalized mean score u for all impairments taken simultaneously is given by:
i - i = y ( l _ i \u La \ ur (1)
r = 1 ' 1
While a possible psychophysical basis for the law of addition in the above equation remains a matter for speculation [Siocos, 1972], all the relevant experimental data available at the present time confirms that it appears to be valid to an accuracy sufficient for most, if not all, practical purposes [CCIR, 1974-78c]; although the multiple regression analysis quoted below may provide an interesting approach.
Consideration of design objectives is facilitated by expressing subjective impairment magnitudes in the form of directly summable quantities. As equation (1) suggests, this can be done very simply by transforming the mean score u into units of subjective impairment, termed “imps”, by means of the relation I = ( l /u — 1) imps. The I scale ranges from zero for the “perfect” picture (u = 1) to infinity at the other extreme (u = 0). I = 1 imp at the “mid-opinion” point given by u = 0.5.
In the presentation of results, convenient mark points may be placed on the I scale, for example, 1/8, Va, Vi and 1 imp. When the term “imp” was originally introduced [Lewis and Allnatt, 1965 and 1968], its proponents intended that it should be related to a particular quality grading scale and narrowly defined test arrangements [Prosser et al., 1964; Corbett, 1970], with a view to providing as near an absolute basis as possible for results. Subsequently it has become clear that some qualification of results will almost always be necessary. For example, scales and observers’ standards could vary from place to place, translation of the scale into another language produces an unknown effect, and sometimes it may be desired to apply the test technique to a television system for which broadcast-viewing conditions are unsuitable. It is suggested that details should be given of test arrangements about which there is any possibility of doubt.
The following remarks offer some guidance to interpretation of the mark points when a particular set of conditions [Prosser et a l, 1964; Corbett, 1970; Allnatt and Bragg, 1968] is used. The 1/8 imp mark point represents a low level of impairment, of the same order as the residual impairment normally found with a laboratory set-up consisting of a high-grade slide scanner and picture monitor. Experience suggests that 0.25 imp may be taken as a practical design objective for each of the major impairments that may occur in a system, such as a national one, of moderate size and complexity. At the present time, 0.5 imp appears to be a reasonable design objective for each major impairment in a complex system involving transmission over a chain of long-distance international links.
One final word of caution is that the use of the “law of addition” to find the overall impairment resulting from the simultaneous presence of component impairments, should not be used to add impairments having the same subjective effect, but resulting from the errors of different objective parameters (e.g. in the PAL system, chrominance phase and chrominance gain errors give rise to saturation impairments in the image). In this case, the overall impairment should first be calculated in objective terms from each of the errors of the individual objective parameters [CCIR, 1970-74a].
A preliminary study of an alternative approach to the problem of multiple simultaneous impairments, has been reported [CCIR, 1970 74b]. In this, multiple linear regression analysis is shown to give satisfactory results with a set of available data. However, studies are continuing to examine the range of validity of the expression obtained; to examine the use of non-linear regression models and to extend the range of data used for checking the validity of the method.
Further contributions to the study of the evaluation of the effects of multiple simultaneous impairments areinvited.
3. Opinion distribution
3.1 Statistical models o f opinion distribution
In §§ 1.4 and 1.5 reference was made to models based on the binomial and normal distributions. [CCIR, 1970-74c] summarizes the binomial type models referred to in § 1.4.; [CCIR, 1970-74d] summarizes, in its Annex, the data analysis method based on the normal distribution, and referred to in § 1.5.

68 Rep. 405-3
It has been shown that the above two methods, to a good degree of approximation, can be directly related to one another as the logarithm of the impairment unit is both linearly related to the objective impairment and very nearly normally distributed, when the opinion distribution is taken as binomial [Siocos, 1972]. While this virtual correspondence should make it possible, if desired, to retain both the above methods of representing distribution, the advisability of recommending a single method should be studied.
3.2 Double-stratified method
It is an important matter to examine the standard deviation of mean scores. Usually the test pictures need to be systematically selected, but sometimes it may be desired to use pictures drawn at random from a large population. In such a case, consideration should be given to the statistical properties of the double-stratified sample that may be obtained [CCIR, 1974-78d; Miceli and Orlando, 1977]. By this means, standard deviations can be evaluated and the results could suggest a possible economic compromise in future similar experiments, by proper choice of the relative numbers of observers and pictures used.
4. Use of comparison scale
A contribution [CCIR, 1970-74e] on comparison scales has shown that when the recommended 7-grade comparison scale is used for comparing pictures impaired by random noise, a more linear relationship between comparison grade and signal-to-noise ratio is obtained if the numerical weighting attached to the comparison grades is 4, 2, 1, 0, —1, —2, —4 rather than 3, 2, 1, 0, —1, —2, —3.
ANNEX III
EXAMPLE OF A METHOD OF PROCESSING THE RESULTS OF SUBJECTIVE TESTS
To provide a unified method of presenting the results of subjective tests using a particular cause of impairment, the following example describes the sequence of operations which can be carried out.
1. Processing test results for a particular value of impairment
The objective magnitude of the impairment is characterized by a particular number according to the convention appropriate to the particular effect; for example, signal/noise ratio in decibels, differential phase distortion in degrees, etc. This numerical value is called D and is defined more precisely in § 2.
The test carried out with D constant, according to the principles set out in Recommendation 500-1 lead to a certain distribution of grades on the 5-point scale which is used. This distribution includes the differences in judgement between observers and the effect of a variety of conditions associated with the experiment, for example the use of several pictures.
In what follows U denotes the quality grade (1 to 5) on the scale being used.The analysis of this distribution shows, for each grade Uh the proportion of the total opinions.
Pi (? p, = i).
The analysis of this distribution can be made by two methods:1.1 By simply calculating the direct mean score,
_ 5u = y i x P.
/=i <2)
1.2 By finding a mathematical model (or interpolating function) which smooths out the random errors in the measured proportions p y.
The different solutions to this problem which have been proposed fall under two main classifications. Firstly, models which yield directly the proportions in the five grades. An example of such a model is:— a modified binomial distribution [Prosser et al., 1964] which is described by its mean score and order (an
integer).The second class of models comprises those which are based on the concept of a smooth distribution
function in terms of a continuous variable. Such a model can yield a distribution in terms of opinion grades, which can be matched to the experimental data, by a suitable process of quantization. Examples of such models are:— the approximation by a Gaussian function, an example of which is given in [Lessman, 1972]. Such a function
can be conveniently described by its mean and its standard deviation.— the approximation by a logistic function [Allnatt, 1973]. The distribution is described by its median value and
its width parameter (both being continuous variables).

Rep. 405-3 69
Note 1. — The choice of method will depend both on the particular features of the distribution encountered in the experimental results, and also, on the mathematical treatment envisaged for the application of results.Note 2. — In fitting the chosen model to the results for a given impairment condition, an efficient method of adjustment is simply to equate the mean and standard deviation of grades yielded by the model, to those actually found.Note 3. — In an experiment with a given type of impairment, it is commonly found that a single value of width parameter (or binomial order, etc.) suffices to fit a well-chosen model to all the impairment conditions tested. Differences between the standard deviation actually found for a given impairment condition and that yielded by the model are no greater than can be accounted for by sampling error. Indeed, it has been found that a single width parameter can apply to many different types of impairment. Thus the finding of a distribution model with a width parameter which will apply to all impairment conditions in an experiment, and the establishment of arelationship between central tendency (mean or median) and objective magnitude can be treated as separateoperations. According to circumstances it may be appropriate for the next stage of the analysis to be made in terms either of the model mean (or median) or of the mean of the categorized distribution yielded by the model. It will suffice for what follows to have obtained the deduced mean score Um, which may be identical to the direct mean score U, but sometimes may differ slightly from it.
2. Processing to find the relationship between Um and D
The next step in processing the data is to establish the relationship between the mean score Um (or U) and the objective measure of the distortion D as D is varied. The process which follows consists of finding a simple continuous relationship between Um and D. The approximation of this experimental relationship by a logistic function is particularly interesting.
The processing of the data Um can be made as follows:2.1 The scale of values Um is normalized by taking a continuous variable u such that,
u = (Um — l)/4 (3)
when Um is in the range 1 to 5.2.2 Graphical representation of the relationship between u and D shows that the curve tends to be askew-symmetrical sigmoid shape provided that the natural limits to the values o f D extend far enough from the region in which u varies rapidly.
In other cases, where a physical limit on the value of D is close to the region in which u varies rapidly, a consequent marked dissymmetry of the curve can be observed.
In the latter cases, the variable D can be replaced by a function of D, such as the logarithm, which effectively moves the limit to infinity, thus achieving skew-symmetry of the curve. In what follows D is the value of the impairment expressed in units, usually logarithmic, chosen to yield skew-symmetry.
The use of arithmetic units, denoted by D, is common in the literature. The effect of this is discussed in the Appendix.2.3 The function u = f{D) can now be approximated by a judiciously chosen logistic function, as given bythe general relation:
u = l/[l/z i0 + exp(D - Dm)G] (4)
where G may be positive or negative.In this expression the presence of the constant u0 * will be noted. It represents, in the function u = f(D ),
the asymptotic value of u for the very small impairment.This peculiarity of the curve u = f{D) is frequently encountered and characterizes the fact that even for a
level of impairment which is theoretically zero, the mean quality grade obtained in the course of the tests does notreach the limiting value Um = 5, or u = 1. As a result of various imperfections of the picture, the measured valueis uQ.2.4 The value u obtained from the optimum logistic function approximation is used to provide a deducednumerical value / according to the relation:
I = (1 /u ) - 1 (5)
In the case where the value u0 is not equal to 1, this transformation provides a limiting values of I, as
Jo = ( l /u 0) - 1 (6)
In the publications this constant is also called H.

70 Rep. 405-3
2.5 If Iexp is the raw result obtained from equation (1), a correction is made to this result by the relation,lu = I exp ~ 0-
It is convenient in practice, for the graphical representation of the values of Iu as a function of the impairment D, to use a logarithmic scale for Iu. This convenience results from the fact that the logistic function being used to represent the relationship takes the form of a straight line in this graph. The expression for this relationship is effectively:
Iu = exp (D - Dm)G (7)
It will be observed that in such a graph the experimental values, processed to obtain corresponding valuesof will be sensibly on a straight line.
Interpolation by a straight line is simple and in some cases of an accuracy which is sufficient for thestraight line to be considered as representing the impairment due to the effect measured by D.
Fig. 1 shows the representation thus obtained. The values of / are expressed, in accordance with the proposals which have been made by Lewis and Allnatt [Lewis and Allnatt, 1965] in “imp” units.
Impairmentcharacteristic
FIGURE 1 - Representation o f the impairment characteristic U - Mean score, 5-point scale
The straight line may be termed the impairment characteristic associated with the particular impairment being considered. It will be noted that the straight line can be defined by the characteristic values DM and G of the logistic function.
3. Conclusions
The processing of subjective test data which is described above has two advantages:— the impairment characteristic is a straight line;— in very many cases, the values of / appear to possess the property of summability when several sources of
impairment which are not correlated are present simultaneously on the picture.It is desirable that for each of the causes of impairment known to be important, the results of a subjective
test should be available as an impairment characteristic presented in this form. The establishment of a collectionof these characteristics would facilitate the use of the results of subjective tests.

Rep. 405-3 71
APPENDIX
ARITHMETIC MEASURE OF OBJECTIVE IMPAIRMENT
Where the conventional objective measure of impairment is arithmetic in nature, the relationship with u will generally not be skew-symmetrical and it will be necessary to employ logarithms, as discussed in § 2.20 f Annex III. However, the arithmetic measure, which will be designated d, might be considered the more basic one and it is of interest to examine the function relating u with d.
D = loge dand,
D m = l°ge
Substituting d in the logistic equation (1), it can be shown that,
u - l/K l/u o ) + (d/dM)°] (8)
from which (as in § 2.5 of Annex III),/„ = (d /d Mf
Although the relationship of u to d is not skew-symmetrical it will be seen to be extremely simple in form.It may be considered that the corresponding values of G (or equally those arising from values D which are
natural logarithms) are of more fundamental significance than those from values of D expressed in decibels, or a logarithmic measure other than natural logarithms. Accordingly, it is proposed to reserve G exclusively for values appropriate to equation (8), as this usage is common in the literature and particularly because an extensive set of results, expressed in these terms, has been published, [Lewis and Allnatt, 1968].
Values of G arising from values of D expressed in decibels may be conveniently designated G' and are related to G as follows:
G = (20 log10e) G' (9)= 8.686 G'
ANNEX IV
TEST PROCEDURES
The following procedures are based on Recommendation 500-1 and both employ non-expert observers as is preferred in the Recommendation. During the course of the experiment, unimpaired pictures are displayed and rated by the observers in the same way as impaired pictures. Thus the observers are able to take these high-quality pictures into account. Also in analysis it is possible to make allowance for the small “residual” impairment which remains in the absence of the test impairment. Analysis of results has generally proved straightforward.
1. Procedure using quality scale
The procedure is that described in [Prosser et a l, 1964]. It employs the five-grade quality scale of Recommendation 500-1. Unimpaired pictures are presented during the course of the experiment and their quality is judged in exactly the same way as pictures containing a measured amount of the impairment being investigated. Observers are allowed to modify the interval of time for which each of the successive picture conditions is displayed, if they wish. In practice an interval of about 10 s is found suitable. Pictures are removed for about 15 s between successive picture conditions, while observers formulate and record their opinions and the equipment is re-adjusted.
Advantages claimed for the method, additional to those resulting from use of Recommendation 500-1 are:1.1 The method of presentation satisfactorily resembles the conditions that apply in practice.1.2 The scale is appropriate because quality is the criterion on the basis of which received pictures will ultimately be judged. Moreover the sense (positive or negative) of measured quality relative to that of the unimpaired picture, is preserved in situations where addition of a small “impairment” actually improves quality.1.3 The method has been applied satisfactorily over a period of 15 years; and more data consistent with it have been obtained and published than so far is the case for any other known method.1.4 More comprehensive investigations into the properties of the method have been made and published than so far is the case for any other known method.1.5 It has been discovered that a simple empirical law can be applied to results which enables the subjective effect of simultaneously-present unrelated impairments to be predicted.1.6 Considerable experience in the interpretation and application of results has been gained.

72 Rep. 405-3, 404-2
2. A proposed procedure when using a reference picture
The proposed procedure described in [CCIR, 1974-78e] is one which uses the impairment scale of Recommendation 500-1 and in which a reference (unimpaired) picture is displayed prior to each test condition. By such means the observers are regularly reminded of the subjective quality of the reference during the course of thetest session. Order effects due to the successive display of pictures with contrasted levels of impairment could, inprinciple, be reduced. The use of a reference has also the advantage of more precisely anchoring the impairment scale.
To obtain an adequate statistical basis and to check the coherence of the ratings, systematic duplication, in random sequence, is recommended. The method of presentation of each viewing sequence (corresponding to one test condition) can conform to the following pattern:
7j = 7 s: reference pictureT2 — 5 s: “grey” (separation)T3 — 15 s: picture to be assessed in relation to the referenceT4 = 10 s: “grey” (separation and rating time)For moving pictures, it is preferable to select Tx = T3 (in the region of 10 s).
ANNEX V
SUBJECTIVE PICTURE QUALITY IN DIGITAL TELEVISION SYSTEMS
Picture impairments in digital television systems are, in general, different from those that occur in analogue systems, and depend on the methods of coding and redundancy reduction employed. Consequently, in early laboratory studies of coding systems which seek to compare different systems or to optimize a particular system, it may be advantageous to use different testing techniques specially chosen to visually distinguish specific impairments more clearly.
Dynamic test pictures have advantages when testing digital and mixed analogue-digital-analogue systems. These test pictures should include linear and rotational movement as well as slow signal-amplitude fluctuations [CCIR, 1974-78f|; the latter fluctuations can reveal quantizing contour effects in almost uniform areas.
In some cases, subjective assessments may usefully be supported by instrumental methods. The “compar- ison-field” (e.g., split-screen) technique has been proposed for testing digital systems [Krivosheev, 1976]. In this method, comparison fields are displayed side by side with those areas of the original picture which are being studied. Two types of such fields are used: synthesized fields and natural fields. The first type is generated electronically, and by suitable choices of brightness, chromaticity, structure and configuration can correspond closely with the picture being assessed. Measurements of quantizing noise may be made using this method. The second type of comparison field consists of parts of the original picture; this type can, for example, be used when comparing the input to, and output from, a system.
REPORT 404-2
DISTORTION OF TELEVISION SIGNALS DUE TO THE USE OF VESTIGIALSIDEBAND EMISSIONS
(Study Programme 9A-1/11)(1966- 1970- 1974)
This Report provides a synthesis of all information in the documents enumerated in Report 404 (1966) supplemented by new data based on studies carried out by the OIRT, and other contributors (see bibliography).
1. Introduction
Vestigial-sideband emission of television signals and their reception with receivers using demodulation with a Nyquist slope give rise to different kinds of distortion:— linear distortion due to group-delay differences in the receiver circuits, both along the Nyquist slope and in
relation to the necessary attenuation on sound carrier of the lower adjacent channel;— non-linear distortion due to the envelope demodulation, in the form of quadrature distortion, and to crosstalk
between the luminance and the chrominance signals.

Rep. 404-2 73
These distortions result in the deterioration of the quality of the received television picture.Theoretical and practical investigations have been recently carried out in many countries with the aim, on
one hand, of obtaining a quantitative picture of the distortion of television signals due to the use of vestigial-sideband transmission and, on the other hand, of finding methods of reducing this distortion as well as of determining the degree of the picture quality improvement as perceived by viewers. Such improvement can be ensured by the correction of distortion or the selection of the optimal width of the lower sideband and the steepness of the Nyquist slope.
2. Analysis of the television signal distortion
The distortion of television signals, arising in the vestigial-sideband transmission, depends on several factors such as the steepness of the Nyquist slope (i.e. the relative width of the vestigial sideband), the modulation depth, and the position of the vision carrier on the Nyquist slope. These distortion can be presented either as depending on frequency, i.e. by the amplitude and group-delay characteristics, or as depending on time, by the transient characteristic.
The television signal distortion due to the vestigial-sideband transmission affects the build-up time (10 to 90%) of the transient characteristic, or causes voltage overshoots.
When analyzing the distortion by means of the approximated calculation method [CCIR, 1963-66a; Dobesch, 1966], the following conclusions can be drawn:— the distortion increases with the modulation depth;— the build-up time diminishes with the decreasing steepness of the Nyquist slope (i.e. the increasing useful
width of the vestigial sideband);— the influence of the changes of the vision carrier position on the Nyquist slope with regard to the value of
distortion depends, to a great extent, on the steepness of the Nyquist slope — it diminishes with the decreasing steepness;
— the shift of the vision carrier on the Nyquist slope within 0 and -1.5 MHz in relation to the nominal position generally tends to decrease the distortion (decreased build-up time and overshoots, improved symmetry of the transient characteristic).
It can be presumed that in industrial receivers the Nyquist slope, within the established tolerances, can be approximated by straight lines. In this case the calculated results are highly accurate in practical conditions. Thus it follows that a further decrease of the steepness of the Nyquist slope will not result in an essential improvement of the video signal form.
Similar results have been obtained by computer calculations. It is noted [CCIR, 1963-66b] that a change of the steepness of the Nyquist slope from 0.75 to 1 MHz does not lead to a perceptible decrease of distortion.
3. Establishment of tolerances for television signal distortion
Measurements of the frequency responses of television transmitters are usually effected between the transmitter input and the Nyquist demodulator output. In this case the measurement results reflect the actual distortion of television signals at the receiving end.
As mentioned above the characteristics can be presented as depending on time, or as depending on frequency. Investigations [CCIR, 1963-66c] have shown that transient characteristics are more useful, because they afford a result closer to the visible effect of the distortion on the received television picture. On the basis of the assessed picture quality, the admissible distortion value can be determined. Under such conditions the amplitude- frequency characteristic is of lesser importance.
Attention should be drawn to the fact that at present no methods are known enabling transformation of tolerances of characteristics in the time domain into tolerances of characteristics in the frequency domain, and vice versa. Even so the danger exists that an equipment may have transient characteristics within the tolerances, while the amplitu de-frequency characteristic exceeds the respective tolerances.
Tests have also shown [CCIR, 1963-66c] that transmitter phase correction can be easily effected on the basis of the transient characteristic, the same results being obtained as on the basis of measurement of the group-delay characteristic.
So far sufficient data for the establishment of tolerances of television signal distortion have not been obtained. From theoretical calculations [CCIR, 1963-66b] it follows that the difference between the group-delay on the vision carrier frequency and that on the central video frequency — corresponding to a Nyquist slope of0.75 MHz — is approximately 150 ns. It has also been proved that the non-uniformity of group-delay higher than 50 ns in the vicinity of the vision carrier frequency causes considerable distortion of the transient characteristics.
For measurements on a television transmitter with the Nyquist demodulator, it is proposed to use adequate tolerance masks, determining the admissible deviations of the individual characteristics from nominal responses [OIRT a]. These masks determine separately the parameters of the transm itter and those of the Nyquist demodulator [OIRT b] as well as the parameters of the entire transmitter-demodulator channel.

74 Rep. 404-2
Theoretical calculations of T and 2 T sine-squared pulse distortion in the Nyquist demodulator have shown that the amplitude of 2 T sine-squared pulse at the demodulator output attains:
— 80% without demodulator phase correction,
— 100% with demodulator phase correction;
and the amplitude of T sine-squared pulse:— 76% without demodulator phase correction,
— 80% with demodulator phase correction,
in relation to the input pulse amplitude.It has also been calculated that the distortion of 4.43 MHz sub-carrier pulse with 20 T sine-squared
envelope, originating in the Nyquist demodulator, need not be taken into consideration and that the distortion at the base of the pulse does not exceed 3% when applying phase correction to the demodulator.
4. Investigation of possibilities for improving picture quality
To improve the quality of television pictures, distorted due to the use of vestigial-sideband transmission, several investigations have been carried out along two basic lines:
— pre-correction of distortion while maintaining the existing standards for the width of the vestigial sideband, and
— broadening of the vestigial sideband.
4.1 Correction o f the television signal distortion
Long-term investigations of the correction of television signal distortion have led to the conclusion that in this way a considerable improvement of the signal form can be obtained [CCIR, 1963-66d]. With this in view,both correction of linear distortion with the aid of phase filters and correction of quadrature distortion were used on the transmitter. Measurements effected under laboratory conditions and on a number of transmitters have shown that television signal distortion can be almost entirely eliminated in this way.
In relation to colour television signals the quadrature component causes two types of distortion: incorrect reproduction of the brightness of coloured areas, and phase modulation of the vision carrier, depending on the degree of modulation.
It has been shown that the correction of quadrature distortion can entirely eliminate both effects.
With the aim of confirming the measurement results of the correction of linear and quadrature distortion investigations of picture quality have been carried out on the basis of subjective tests [CCIR, 1963-66e]. The results of these measurements make it possible to establish the following:
— the improvement of picture quality obtained by group-delay correction is greater than that obtained by quadrature correction,
— after an optimal correction of both types of distortion no deterioration of the picture quality can be observed;
— in rebroadcasting transmissions with two successive modulation and demodulation processes quadrature correction should be used.
The usefulness of linear-distortion correction has been investigated in system L [CCIR, 1963-66fJ. Some improvement of the transient characteristic has been obtained (decreased overshoots from 7% to 4% and decreased streaking). A further improvement of the picture quality can be obtained by quadrature correction.
4.2 Broadening o f the vestigial sideband
In order to verify the influence of broadening the vestigial sideband on the subjective picture quality assessed by viewers, investigations of the picture quality with 0.75 MHz and 1.25 MHz vestigial-sideband transmissions have been carried out [CCIR, 1963-66g]. Investigations with the aid of various characteristic pictures have confirmed that most viewers note a better picture quality in the case of transmission with a broader vestigial sideband, the degree of improvement depending on the contents of the picture. Differences in quality were almost indiscernible only in pictures with low contrast and a small number of details.
As regards broadening of the vestigial sideband, the opinion has been expressed [OIRT a] that the reduction of the steepness of the Nyquist slope tends to decrease the non-uniformity of group-delay and the quadrature distortion, as well as the sensitivity of the receiver to heterodyne frequency variations. For channels in Bands IV/V, 1.5 MHz is considered to be the optimum value. At the same time, attention has been drawn to the fact that broadening of the vestigial sideband decreases the protection between adjacent channels and that this is connected with transmitter network planning and the establishment of protection ratios.

Rep. 404-2 75
5. Effects of quadrature distortion on the insertion test signals described in Recommendation 473-2, Annex I
A complete theoretical investigation on this subject has been carried out in Italy [CCIR, 1970-74;D’Amato, 1971], and calculations have been made for the case of systems B and G.
A hypothetical “transmitter-demodulator chain” has been considered, with the following characteristics:— all the circuits have a flat group-delay frequency response;— the overall amplitude-frequency response of the radio-frequency intermediate-frequency circuits varies linearly
from 0 to 1 over the frequency range (f v - 0.75 MHz) to (fv + 0.75 MHz) and is equal to 1 for frequenciesgreater than f v + 0.75 MHz (fv being the video-carrier frequency);
— the amplitude-frequency response of all the video-frequency circuits is equal to 1 over the range 0 to 5 MHzand to 0 for frequencies greater than 5 MHz;
— the depth of modulation at white level is 10%;— the depth of modulation at black level is 73%.
With these assumptions, the distortion which affect the elements of the insertion test signal are thosesummarized in Table I. As regards distortion of the white bar, 2 T and 20 T pulse, the theoretical results of Table Iagree with results of an experimental investigation carried out in the Federal Republic of Germany [IRT, 1970].
T able I
Signal element Parameter
Values (x) for system
B, G
White bar leading (trailing) edge (shaped by Undershoot amplitude 3%the network generating the 2T pulse) Half-amplitude delay (lead) 69 ns
Rise time (fall time) 240 ns
2T pulse (half-amplitude duration: 200 ns) Amplitude reduction 11%Half-amplitude duration 156 nsMain negative echoes amplitude 6-7%
207 pulse Base-line depression 6%Amplitude reduction 13-8%Phase distortion 5° 50'
Chrominance bar Chrominance peak amplitude 92-1%Chrominance-to-luminance intermodulation 9-9%
Luminance staircase Line-time non-linearity distortion 0%
Staircase with chrominance superimposed Differential gain (2) 3-7%Differential phaseLine-time non-linearity distortion (altered by chrominance-to-luminance intermodulation)
0°
(2) 4-4%
0) All values expressed as percentages are referred to the nominal amplitude of the picture signal (0-7V).(2) As the sub-carrier at the white level gives rise to over modulation, the step at the white level is not considered.
It must be remembered that these characteristics are not representative of normal equipment designs where the response in the frequency range of the colour sub-carrier is reduced to minimize quadrature distortion.
6. Receivers employing synchronous demodulation of the intermediate-frequency signal
The use of an ideal synchronous demodulator for the intermediate-frequency signal eliminates quadrature distortion due to vestigial-sideband transmission and practical circuits show a very considerable advantage over envelope detection in this respect. However, quadrature distortion can arise due to shifts in the phase of the vision carrier relative to the sideband. Such phase shifts may occur at the transmitter or in the receiver circuits.

76 Rep. 404-2, 409-2
REFERENCES
D ’AMATO, P. [July, 1971] Influenza della distorsione di quadratura sui segnali d’inserzione CCIR (Influence of quadrature distortion on the CCIR insertion test signals). Alta Frequenza. 40, 7, 601-612.
DOBESCH, H. [1966] Der Einschwingvorgang eines Femseh-Sendesystems (Overshoot in television transmission systems). Technische Mitteilungen des RFZ, Heft 4.
IRT [March, 1970] Die Verzerrungen des 2T/20T-Impulses und Sprungsignals bei der Restseitenband-Obertragung (The distortion o f the 2T/20T pulse and bar signal due to vestigial sideband transmission). IRT Technischer Bericht No. 191.
OIRT a Doc. TK-III-218. Erweiterung des unteren Seitenbandes der Fernsehubertragung (Broadening of the lower sideband in television transmission).
OIRT b Doc. TK-III-211. Verzerrungen der Sinus2-Impulse im Nyquist-Demodulator (Distortion of sine-squared impulses in a Nyquist demodulator).
CCIR Documents[1963-66]: a. XI/28 (OIRT); b. X I/42 (Czechoslovak S. R.); c. XI/23 (OIRT); d. X I/2 (Federal Republic of Germany); e. XI/142
(Federal Republic o f Germany); f . XI/178 (France); g. XI/25 (OIRT);
[1970-74]: XI/121 (Italy).
BILIOGRAPHY
DINSEL, S. [1964] Neue Untersuchungen iiber die Entzerrung der Quadraturfehler von Femsehsendern (New studies on the correction of quadrature errors of television transmitters). Rundfunktechnische Mitt., Vol. 8, 253-265.
DINSEL, S. [1966] Quadrature distortion correction for television vestigial-sideband transmission. Journal o f the SMPTE, Vol. 75, 20-25.
DOBESCH, H. and SULANKE, H. [1965] Zeitfunktionen (Time series). VEB Verlag Technik.HOPF, H. and DINSEL, S. [1961] Verbesserung der Obertragungsqualitat des Fernseh-Restseitenbandverfahrens durch Einf-
uhrung einer Quadraturentzerrung (Improvement in quality of transmission o f vestigial- sideband television signals by the introduction of quadrature distortion). Rundfunktechnische Mitt., Vol. 5, 272-280.
SZANTO, L. [1964] Frekvendne a prechodne charakteristiky vysokofrekven6neho televizneho kan&lu (Steady-state and transient characteristics o f RF television channels). Slaboproudy obzor, Vol. 25, 8, 466-474.
WISE, F. [September, 1970] The interpretation o f waveform measurements made through VSB transmission networks. International Broadcasting Convention, London, 216-218.
CCIR Documents[1962]: X I/25 (Federal Republic of Germany, Bad Kreuznach);[1970-74]: 11/2 (OIRT); 11/80 (Netherlands).
REPORT 409-2
BOUNDARIES OF THE TELEVISION SERVICE AREA IN RURAL DISTRICTS HAVING A LOW POPULATION DENSITY
(1966 - 1970 - 1978)
Where television services are to be provided for a sparsely populated region, in which better receivers and antenna installations are likely to be employed than those considered in Recommendation 417-2, Administrations may find it desirable to establish the appropriate median field strength for which protection against interference is planned as low as:
Band I III
dB ([xV/m) +46 +49
These values refer to the field strength at a height of 10 m above ground level.

Rep. 409-2, 478 77
In such areas, without co-channel interference, field strengths of the order of 40 dB(jiV/m) in Band I and 43 dB(|xV/m) in Band III can give good quality pictures; however, it is generally observed that the public begin to lose interest in installing television reception equipment when the field strength falls much below these levels.
The values given in this Report have been obtained from field investigations of the service area limits and picture quality in rural districts of Australia [CCIR, 1963-66] and India [CCIR, 1974-78].Note. — See Recommendation 417-2.
REFERENCES
CCIR Documents [1963-66]: X I /168 (Australia).[1974-78]: 11/439 (India).
REPORT 478
GHOST IMAGES IN MONOCHROME TELEVISION
Re-radiation from masts in the neighbourhood of transmitting antennae (Study Programme 6A/11)
(1970)
When a television radiator is sited too close to another antenna structure “ghost” images displaced from the wanted picture can occur over a large proportion of the service area due to re-radiation of the transmissions from the other mast. These “ghosts” can be termed “permanent ghosts” since they cannot generally be reduced by the use of receiving antenna directivity except in the vicinity of the transmitting station. In this way, they are distinguished from “local ghosts” which may be seen only by viewers situated close to large re-radiating structures and which can sometimes be reduced by suitable orientation of a directional reveiving antenna.
It has been suggested that under good viewing conditions, “ghost images” will produce negligible impairment for a ratio of 32 dB or more between the direct and re-radiated signals. This figure applies where the time separation is 2 ps or more and may be less for smaller time separations [CCIR, 1966-69; Mertz, 1953].
It has been established, as the result of theoretical studies and experimental work [Allnatt and Prosser, 1965; Hill, 1974] that, where the reflecting structure is at least as high as the antenna, the level of the re-radiated signals decreases at a rate of about 3 dB for each doubling of the distance separating the masts. In Bands I and III, this variation can be appreciably modified by ground reflection, which can increase it by as much as 6 dB, or reduce it.
The Table gives the distances in kilometres at which the ratio between the direct and re-radiated signals is 32 dB neglecting the effect of ground reflection for different frequencies and different types of mast. It is assumed that the reflecting mast is at least 60 m higher than the transmitting antenna.
Frequency (MHz) 50 200 800
Polarization Vertical Horizontal Vertical Horizontal Vertical Horizontal
Cylindrical mast, 3 m diameter 1-4 1*4 1-2 1*2 1*2 1*2
Triangular lattice mast,3 m side, least favourableorientation 1-5 2-4 1*5 0-9 2-4 2-4
Square lattice mast, 2-5 mside, least favourableorientation 2-4 2-4 2-9 1*2 1*7 1*7
The ratio of the direct and reflected signals is modified by the horizontal radiation pattern of the transmitting antenna

78 Rep. 478, 481
REFERENCES
ALLNATT, J. W. and PROSSER, R. D. [March, 1965] Subjective quality of television pictures impaired by long-delayed echoes. Proc. IEE, Vol. 112, 3, 487-492.
HILL, P. J. [December, 1964] Measurements o f re-radiation from lattice masts at VHF. Proc. IEE, Vol. I l l , 12, 1957-1968.MERTZ, P. [May, 1953] Influence of echoes on television transmission. Journal o f the SMPTE, 60, 572-596.
CCIR Documents[1966-69]: X I/3 (United Kingdom).
BIBLIOGRAPHY
KNIGHT, P. [January, 1967] Re-radiation from masts and similar obstacles at radio frequencies. Proc. IEE, Vol. 114, 1, 30-42.
REPORT 481
RATIO OF WANTED-TO-UNWANTED SIGNAL IN TELEVISION
Subjective assessment of multiple co-channel interference (Question 4-1/11)
(1970)
1. This Report summarizes some recent work in the United Kingdom on the subjective effect of a combination of several co-channel interfering signals of constant, but not necessarily equal, levels. The document does not consider the situation in which the signals vary appreciably with time. It includes consideration of transmissions with very high carrier-frequency stability (precision offset) but not special cases where carrier frequencies might be phase-locked.
The interferences are considered to be in one of two classes, viz., “related” and “unrelated” interferences. The related class only arises in cases involving transmitters with precision control of the carrier frequency,1.e. control with a precision of the order of 1 Hz. The laws proposed for related interferences apply to a group of interferences for which either:— the frequency offsets relative to the wanted signal are close to (n ± 1/3) times line-frequency, where n is a
small integer, but precisely adjusted for minimum visibility of interference;— the interfering signal frequencies, apart from those covered above, are equal to one another within a few
hertz.For example, two-thirds and five-thirds line-frequency precision offsets can be considered as being in the
related class, and it is unimportant whether the offset frequency is above or below the wanted signal. Similarly, all precision zero offset interferences can be regarded as in the related class.
On the other hand, all non-precision offset interferences are to be regarded as unrelated. In the caseswhere both related and unrelated interferences are present, the related interferences should first be added inaccordance with the appropriate law; the two classes can then be added together as if they were single unrelatedinterfering signals. For the purpose of dealing with co-channel signals with different offsets it is convenient tomeasure the interfering signals in terms of protected field strength defined below:If Rr : protection ratio (dB) applicable to the rth interfering signal for a given subjective impairmentand Ir : level (dB (pV/m)) of the rth interfering signal,then Pr = Rr + Ir is the protected field strength (dB (pV/m)) applicable to the /th interfering signal.2. Unrelated interferences appear to combine according to a simple power-addition law:
01 P — l o g / £ "lO01 Prr = 1 W
3. For impairment grades near grade 3.5 (using the scale given in Note 2, Annex I, to Report 405-3) relatedinterferences tend to follow a different law. From the limited experimental work, it appeared that a (voltage)15 law represented the method of combination at least as well as any other law. Such a law may be written:
0-075 P = logxo Z ”10°'076 Prr = 1 (2)

Rep. 481 79
4. For certain types of calculation it may be easier to use the following law which was equally accurate for the cases covered by the experiments (up to seven interfering signals):
0-1 P — log10 1001 Px + 2 £ 1001 Prr = 2 (3)
where Px is the protected field strength applicable to the largest interfering signal alone.
5. For low interference levels (corresponding to grade 2.5 or less on the six-point impairment scale) there was a trend for all types of interfering signals (related or unrelated) to combine by the simple power-addition law given in § 2.
BIBLIOGRAPHY
BBC [1968] Subjective assessment of multiple co-channel television interference. BBC Research Report RA-26.
CCIR Document
[1966-69]: XI/135 (United Kingdom).

PAGE INTENTIONALLY LEFT BLANK
PAGE LAISSEE EN BLANC INTENTIONNELLEMENT

Rec. 266, 417-2 81
SECTION 11D: ELEMENTS AND METHODS FOR PLANNING
Recommendations and Reports
RECOMMENDATION 266
PHASE CORRECTION OF TELEVISION TRANSMITTERS NECESSITATED BY THE USE OF VESTIGIAL-SIDEBAND TRANSMISSION
(1959)The CCIR,
CONSIDERING
(a) that the transmission of television signals using vestigial-sideband techniques gives rise to distortion;(b) that this distortion consists of linear distortion (in-phase errors) and non-linear distortion (quadrature errors);(c) that with average pictures, the depths of modulation are low and thus the non-linear distortion is less than the linear distortion;(d) that linear distortion arises partly from the transmitter and partly in the receiver;(e) that due regard has to be paid to future design and development of television receivers as well as to the differing degree of phase errors in existing receivers,
UNANIMOUSLY RECOMMENDS
1. that linear pre-correction shall be introduced into the television picture transmitter, so as to compensate for that part of the linear distortion arising from the errors in the radiated signal;2. that the television picture transmitter may also introduce a correction to compensate for linear disortions arising in the receiver, but this correction shall not exceed one half of that necessary to compensate a receiver using normal minimum phase-shift networks and with an amplitude characteristic corresponding to the television standard concerned;3. that the pre-correction allowed in § 2 applies only to frequencies between zero and up to approximately half the video bandwidth.
RECOMMENDATION 417-2
MINIMUM FIELD STRENGTHS FOR WHICH PROTECTION MAY BE SOUGHT IN PLANNING A TELEVISION SERVICE
(1963 - 1966 - 1970)The CCIR
UNANIMOUSLY RECOMMENDS
1. that when planning a television service in Bands I, III, IV or V, the median field strength for which protection against interference is planned should never be lower than:
Band I III IV V
dB (ji.V/m) +48 +55 +65* +70*
The values shown for Bands IV and V should be increased by 2 dB for the 625-line (OIRT) system.
These values refer to the Field strength at a height of 10 m above ground level;

82 Rec. 417-2, 418-3
2. that the percentage of time for which the protection may be sought should lie between 90% and 99%.Note 1. — In arriving at the figures shown in § 1, it has been assumed that, in the absence of interference from other television transmissions and man-made noise, the minimum field strengths at the receiving antenna that will give a satisfactory grade of picture, taking into consideration receiver noise, cosmic noise, antenna gain and feeder loss, are: +47 dB (pV/m) in Band I, +53 dB in Band III, +62 dB * in Band IV and +67 dB * in Band V.Note 2. — Further information concerning the planning of television services for sparsely populated regions is contained in Report 409-2.Note 3. — In a practical plan, because of interference from other television transmissions, the field strengths that can be protected will generally be higher than those quoted in § 1 and the exact values to be used in the boundary areas between any two countries should be agreed between the Administrations concerned.
RECOMMENDATION 418-3 **
RATIO OF THE WANTED-TO-UNWANTED SIGNAL IN MONOCHROME TELEVISION
(1963 - 1966 - 1970 - 1978)The CCIR
UNANIMOUSLY RECOMMENDS
that the protection ratios given in Annex I should be used for planning purposes.
ANNEX I
1. Introduction
The protection ratios quoted are considered to be acceptable for planning purposes for a small percentageof the time, not precisely defined, but assumed to be between 1% and 10% ***. Protection ratios for justperceptible interference would be some 10 to 20 dB higher.
When making use of the protection ratios in planning, suitable allowance for fading is made by using field-strength curves appropriate to the percentage of time for which protection is desired, it being assumed that fading of the wanted signal is small, compared with that of the unwanted signal.
The protection ratios quoted refer in all cases to the ratios at the input to the receiver, no account having been taken of the effect of using directional receiving antennae or of the advantage that can be obtained by using different polarization for transmission of the wanted and unwanted signals.
The amplitude of a vision-modulated signal is defined as the r.m.s. value of the carrier at peaks of themodulation envelope, while that of a sound-modulated signal is the r.m.s. value of the unmodulated carrier, bothfor amplitude modulation and for frequency modulation.
All the protection ratios quoted in this Annex refer to interference from a single interfering source.The full advantage of offset operation can only be obtained if the carrier frequencies of the transmitters
concerned are within ± 500 Hz of their nominal values.
* The values shown for Bands IV and V should be increased by 2 dB for the 625-line (OIRT) system.
** This Recommendation incorporates the substance of Report 480, which is hereby cancelled and terminates the study of Question 4-1/11.
*** The question of the protection necessary when interference is present for a large percentage o f the time is considered in Report 306-3.

Rec. 418-3 83
2. Interference within the same channel
2.1 Protection ratio when the wanted and unwanted signals have the same line frequency
2.1.1 Carriers separated by less than 1000 Hz, but not synchronized
Protection ratio: 45 dB *.
2.1.2 Carriers separated by less than 50 Hz, but not synchronized
Protection ratio reduced by 5 to 10 dB relative to the preceding case.
2.1.3 Nominal carrier frequencies separated by 1/3, 2/3, 4/3 or 5 /3 o f the line frequency
Protection ratio: — for 405-line system: 35 dB;— for 525-line system: 28 dB;— for 625- and 819-line systems: 30 dB.
These values may be reduced to 28 dB, 20 dB and 20 dB respectively, if a carrier separation equal to an appropriate multiple of the frame frequency can be maintained; the line frequency should be kept constant to within 5 x 10⁻⁶ and each transmitter should have a frequency tolerance of not more than ± 2.5 Hz.
The 20 dB value is at present valid for the 525- and 625-line systems when there is one unwanted transmitter. Under these conditions, the ratio between the wanted and unwanted sound signals will also be 20 dB, and this is permissible only if the offset is at least 5/3 of the line frequency for frequency-modulated sound (see § 6.1); or above the audio-frequency range for amplitude-modulated sound (see § 6.2).
2.1.4 Nominal carrier frequencies separated by 1/2 or 3 /2 o f the line frequency
Protection ratio: — for 405-line system: 31 dB;— for 525-, 625- and 819-line systems: 27 dB.
2.1.5 Nominal carrier frequencies separated by multiples o f one-twelfth the line frequency
The Table gives figures for 625-line systems based on transmitter stabilities of ± 500 Hz.The protection ratios are also valid, if multiples of the line frequency, up to about 50 kHz, are
added to the offset.
Offset (multiples of 1/12 line frequency) 0 1 2 3 4 5 6 7 8 9 10 11 12
Protection ratio (dB) 45 44 40 34 30 28 27 28 30 34 40 44 45
2.2 Protection ratio for the picture signal when the wanted and unwanted signals have different line frequencies
2.2.1 Carriers separated by less than 1000 Hz, but not synchronized
Protection ratio: 45 dB.
2.2.2 Carriers separated by less than 50 Hz, but not synchronized
Protection ratio reduced by 5 to 10 dB relative to the preceding case.
2.2.3 Nominal carrier frequencies separated by 6.3 kH z
Protection ratio between a 625-line system and an 819-line system: 30 dB.
* This value may be reduced by about 20 dB for the 525-line system, if a carrier separation of a few hundred hertz is maintained at an appropriate multiple of the frame frequency with a variation in carrier-frequency difference less than1.5 Hz.

84 Rec. 418-3
3. Adjacent-channel interference
Throughout this section, fairly conservative values have been chosen to take account of the divergence in performance between different types of television receivers and to allow for the possible introduction of colour.
3.1 Lower * adjacent-channel interference — VHF bands
The worst interference on the picture signal from another signal using the same standard results from the sound signal in the lower * adjacent channel. The figures below relate to the cases where the separation between the wanted vision carrier frequency and the unwanted sound carrier frequency is 1.5 MHz and the ratio between the unwanted vision and unwanted sound powers is 7 dB. The ratios are expressed in terms of the wanted and unwanted vision signals.
Protection ratio: — for frequency-modulated sound carrier (except system N): — 6 dB;— for frequency-modulated sound carrier (system N): —10 dB;— for amplitude-modulated sound carrier: —2 dB.
3.2 Lower adjacent-channel interference — UHF bands
Protection ratio: — for the 525-line system in a 6 MHz channel: —6 dB.For the various 625-line systems proposed for use in 8 MHz channels in the UHF bands, the Table below
gives the protection required by a signal on any system against a lower adjacent-channel signal of the same or any of the other standards. The protection ratios quoted are those to be applied between the wanted and unwanted vision signal levels.
Interfering signal standard
(See Report 624-1)
Protection ratio (dB) for a wanted-signal standard: Vision/sound power ratio (dB) for
interfering signalG H I K 0 L
G - 6 -6 -6 -6 - 6 7
H - 6 - 6 - 6 - 6 -6 7
I - 6 -6 - 6 0 - 6 + 3 0 7
K - 6 + 16 + 16 - 6 + 16 7
L - 4 + 18 + 18 - 4 + 18 9
0 Administrations using system K in the VHF bands are studying the possibility of broadening the vestigial sideband to 1 -25 MHz for use in the UHF bands without changing the other parameters of the systems. In this case, the protection ratios required for system K would be the same as those quoted for the 625-line system L.
(2) The values for systems I and L are different in this case, because receivers for system I will contain a sound trap giving additional rejection at the frequency of the interference.
Note. — When an interfering frequency-modulated sound signal is offset, during quiescent periods, relative to the wanted vision signal by a frequency equal to a multiple of the line frequency plus or minus about one-third line frequency, the protection ratio may be reduced by 6 dB. For an interfering amplitude-modulated sound signal with the carrier offset in a similar way the reduction may be greater.
3.3 Upper** adjacent-channel interference — VHF and UHF bands
Protection ratio: — for system K: 4 dB;— for system N: —10 dB;— for all other systems: —12 dB.
* Upper for the 405-line standard, since the vestigial sideband lies above the vision carrier frequency.** Lower, for system A in the VHF bands.

Rec. 418-3 85
4. Overlapping-channel interference
Figs. 1 to 9 give protection ratios for the 405-, 525-, 625- and 819-line systems when a CW signal or the carrier of an interfering sound or vision signal lies within the channel of the wanted transmission.
When the difference between the carrier frequencies of the wanted and unwanted signals is large and it is desired to use offset to reduce the necessary protection ratio, the line frequency of the wanted signal must be controlled to within 5 parts in 106.
Where it affects the result, the ratio of vision power to sound power is assumed to be 9 dB for system L, 3 dB for system M and 7 dB for the other systems.
5. Image channel interference
The protection ratio required will depend on the intermediate frequency and image-channel rejection of the receiver, and on the type of unwanted signal falling in the image channel. It can be determined by subtracting the image rejection figure from the required protection ratio for overlapping channels, provided that the signs of the frequency difference in the protection ratio curves are reversed.
For the purposes of planning it may be assumed that the image-channel rejection of receivers will be not less than 40 dB except in receivers for OIRT systems D and K when it will be not less than 30 dB. In Japan (system M) the appropriate figures are 60 dB (VHF) and 45 dB (UHF).
6. Protection ratios between sound signals
(The ratios quoted are those between wanted and unwanted sound signals.)
6.1 Wanted and unwanted sound signals frequency-modulated
Protection ratio:— for carriers separated by less than 1000 Hz: 28 dB;
— for carriers separated by 5/3 of the line-frequency: 20 dB.
6.2 Wanted and unwanted sound signals amplitude-modulated
Protection ratio:— for carriers separated by frequency below the audio range: 30 dB;
— for carriers separated by frequency within the audio range: 40 dB;
— for carriers separated by frequency above the audio range: 15 dB.
6.3 Wanted-sound signal amplitude-modulated, unwanted-sound signal frequency-modulated
Protection ratio:
— for carriers separated by frequency below 1000 Hz: 40 dB;
— for carriers separated by 25 kHz: 30 dB;
— for carriers separated by 50 kHz: 12 dB.
6.4 Wanted-sound signal frequency-modulated, unwanted-sound signal amplitude-modulated
Protection ratio: 30 dB.

Prot
ectio
n rat
io (d
B)
Prot
ectio
n rat
io (d
B)
Prot
ectio
n rat
io (d
B)
86 Rec. 418-3
3 2 1 0 -1 -2 -3 -4 -5 -6 -7 -8 -9 -10
Frequency separation (MHz)
FIGURE 1
3 2 1 0 -1 -2 -3 -4 -5 -6 -7 -8 -9 -10
Frequency separation (MHz)
FIGURE 2
-3 -2 -1 0 1 2 3 4 5 6 7 8 9 10
Frequency separation (MHz)
FIGURE 3

Rec. 418-3 87
FIGURE 1
System A. Protection from vision-signal interference
In all cases in this figure, the ratios quoted are those between the wanted and the unwanted vision levels.
Curve a — Interference to vision from a 405-, 625-, or 819-line vision signal with no special control of the nominal frequency difference between the carriers of the wanted and unwanted signals.
Curve b — Interference to vision from a 405-, 625-, or 819-line vision signal when the nominal frequency difference between the carriers of the wanted and unwanted signals is a multiple of the line frequency (10 125 Hz) plus or minus 3 to 5 kHz. If the nominal frequency difference is 1/2 or 3/2 of the line frequency, a protection ratio of 31 dB may be accepted (see § 2.1.4).
Curve d — Interference to sound signal from a 450-, 625-, or 819-line vision signal.
FIGURE 2
System A. Protection from C W or sound-signal interference
In all cases in this figure, the ratios quoted are those between the wanted vision and the unwanted sound levels.
Curve e — Interference to vision from a CW or frequency-modulated sound signal with no special control of the nominal frequency difference between the carriers of the wanted and unwanted signals.
Curve / — Interference to vision from an amplitude-modulated sound signal with no special control of the nominal frequency difference between the carriers of the wanted and unwanted signals.
Curve g — Interference to vision from a frequency-modulated sound signal when the nominal frequency difference between the wanted-signal carrier and the interfering-sound carrier, during quiescent periods, is an odd multiple of half the line frequency, 5062-5 Hz.
Curve h — Interference to vision from an amplitude-modulated sound signal when the nominal frequency difference between the carriers of the wanted and unwanted signals is an odd multiple of half the line frequency, 5062-5 Hz.
FIGURE 3
System M. Protection from vision-signal interference
In all cases in this figure, the ratios quoted are those between the wanted and the unwanted vision signals.
Curve a — Interference to vision from another 525-line vision signal with no special control of the nominal frequency difference between the carriers of the wanted and unwanted signals.
Curve b — Interference to vision from another 525-line vision signal when the nominal frequency difference between the carriers of the wanted and unwanted signals is a multiple of the line frequency (15-75 kHz) plus or minus one-third of the line frequency (5-25 kHz).
Curve d — Interference to sound signal from a 525-line vision signal.

Prot
ectio
n rat
io (d
B)
Prot
ectio
n rat
io (d
B)
Prot
ectio
n rat
io (d
B)
88 Rec. 418-3
- 3 - 2 -1 0 1 2 3 4 5 6 7 8 9 10
Frequency separation (MHz)
FIGURE 4
-3 -2 -1 0 1 2 3 4 5 6 7 8 9 10
Frequency separation (MHz)
FIGURE 5
Frequency separation (MHz)
FIGURE 6
Rec. 418-3 89
FIGURE 4
625-line system. Protection from vision-signal interference
In all cases in this figure, the ratios quoted are those between the wanted and unwanted vision levels.
The subscript numbers used on the curves indicate the various applications of the 625-line system:
1 — 625-lines; 2 — system I; 3 — system K*; 4 — system L.
Curves a — Interference to vision from 405-, 625-, or 819-line systems vision signal, with no special control of the nominal frequency-difference between the carriers of the wanted and unwanted signals.
Curves b — Interference to vision from a 625-line vision signal when the nominal frequency difference between the carriers of the wanted and unwanted signals is a multiple of the line frequency (15 625 Hz), plus or minus one-third of the line frequency (5208 Hz).
Curves c — Interference to vision from a 625-line vision signal when the nominal frequency difference between the carriers of the wanted and unwanted signals is an odd multiple of half the line frequency (7812-5 Hz).
Curves d — Interference to sound from a 625-line vision signal.
* If a vestigial sideband of 1 -25 MHz is used in system K, curves at and bA should be used instead of curves a3 and b3 and curve c3 is no longer valid.
FIGURE 5
625-line system. Protection from CW or sound-signal interference
In both cases in this figure, the ratios quoted are those between the wanted vision and the unwanted sound levels.
The subscript numbers are used on the curves to indicate the variations applicable to the various 625-line systems as follows:
1 — 625-lines; 2 — system I; 3 — system K*; 4 — system L.
Curves e — Interference to vision from a CW or frequency-modulated sound signal, with no special control of the nominal frequency difference between the carriers of the wanted and unwanted signals. For amplitude-modulation of the interfering sound signal, the protection ratios should be increased by 4 dB.In the case of curve e2, for the special case of interference from sound signals that conform to the frequency limits quoted in § 6 of this Recommendation the protection ratios quoted therein apply.
Curves g — Interference to vision from a frequency-modulated sound signal, when the nominal frequency difference between the wanted signal carrier and the sound carrier during quiescent periods is an odd multiple of half the line frequency (7812-5 Hz).
* If a vestigial sideband of 1-25 MHz is used in system K, curves eA and gA should be used instead of curves e9 and gs.
FIGURE 6
System E. Protection from vision-signal interference
In all cases in this figure, the ratios quoted are those between the wanted and unwanted vision levels.
Curve a — Interference to vision from a 405-, 625-, or 819-line vision signal with no special control of the nominal frequency difference between the carriers of the wanted and unwanted signals.
Curve b — Interference to vision from an 819-line vision signal, when the nominal frequency difference between the wanted and unwanted signal carriers is a multiple of the line frequency (20 475 Hz), plus or minus one-third of the line frequency (6825 Hz).
Curve d — Interference to the sound signal from a 405-, 625- or 819-line vision signal.

Prot
ectio
n rat
io (d
B)
Prot
ectio
n rat
io (d
B)
Prot
ectio
n rat
io (d
B)
90 Rec. 418-3
- 3 - 2 - 1 0 1 2 3 4 5 0 7 8 9 10
Frequency separation (MHz)
FIGURE 7
- 3 - 2 - 1 0 1 2 3 4 5 6 7 8 9 10
Frequency separation (MHz)
FIGURE 8
- 3 -2 - 1 0 1 2 3 4 5 6 7 8 9 10
Frequency separation (MHz)
FIGURE 9

Rec. 418-3 91
FIGURE 7
System E. Protection from C W or sound-signal interference
In both cases in this figure, the ratios quoted are those between the wanted vision and unwanted sound levels.
Curve e — Interference to vision from a CW or frequency-modulated sound signal, with no special control of the nominal frequency difference between the carriers of the wanted and unwanted signals. For amplitude modulation of the interfering sound signal, the protection ratios should be increased by 4 dB.
Curve g — Interference to vision from a frequency-modulated sound signal, when the nominal frequency difference between the wanted signal carrier and the sound carrier during quiescent periods is an odd multiple of half the line frequency (10 237-5 Hz).
FIGURE 8
Systems C and F. Protection from vision-signal interference
In all cases in this figure, the ratios quoted are those between the wanted levels of the vision and unwanted vision signals.
Letters with a single prime are used for curves applying to System C. Letters with double primes are used for curves applying to System F.
Curves a — Interference to vision from a 405-, 625-, or 819-line vision signal, with no special control of the nominal frequency difference between the carriers of the wanted and unwanted signals.
Curves b — Interference to vision from a vision signal, having the same number of lines when the nominal frequencydifference between the carriers of the wanted and unwanted signals is a multiple of the line frequency (15 625or 20 475 Hz), plus or minus one-third of the line frequency (5208 or 6825 Hz).
Curves d — Interference to the sound signal from a 405-, 625-, or 819-line vision signal.
FIGURE 9
Systems C and F. Protection from CW and sound-signal interference
In all cases in this figure, the ratios quoted are those between the levels of the wanted vision and the unwanted sound signals.
Letters with a single prime are used for curves applying to System C. Letters with double primes are used for curves applying to System F.
Curves e — Interference to vision signal from a CW or frequency-modulated sound signal, with no special control of the nominal frequency difference between the carriers of the wanted and unwanted signals. When the interfering sound signal is amplitude-modulated, the protection ratios should be increased by 4 dB.
Curves g — Interference to vision signal from a CW or frequency-modulated sound signal, when the nominal frequency difference between the carrier of the wanted signal and the sound carrier, during quiescent periods, is an odd multiple of half the line frequency (7812-5 or 10 237-5 Hz).

92 Rec. 419, 565
RECOMMENDATION 419
DIRECTIVITY OF ANTENNAE IN THE RECEPTION OF BROADCAST SOUND AND TELEVISION
(1963)The CCIR
UNANIMOUSLY RECOMMENDS
that the characteristics of directivity of the receiving antennae of Fig. 1 can be used for planning broadcast sound or television service in Bands I to V.Note 1. — It is considered that the discrimination shown will be available at the majority of antenna locations in built-up areas. At clear sites in open country, slightly higher values will be obtained.Note 2. — The curves in Fig. 1 are valid for signals of vertical or horizontal polarization, when both the wanted and the unwanted signals have the same polarization.Note 3. — The Special Regional Conference, Geneva, 1960, and the European VHF/UHF Broadcasting Conference, Stockholm, 1961, did not take the directional characteristics of antennae into consideration for sound broadcasting.
F ig u r e 1
Discrimination obtained by the use o f directional receiving antennae in broadcasting (The number of the broadcasting band is shown on the curve)
RECOMMENDATION 565 *
PROTECTION RATIOS FOR 625-LINE TELEVISION AGAINST RADIONAVIGATION TRANSMITTERS OPERATING IN THE SHARED BANDS BETWEEN 582 AND 606 MHz
(1978)The CCIR,
CONSIDERING
(a) the Final Acts of the European VHF/UHF Broadcasting Conference, Stockholm, 1961 **, and the Special Agreement relating to the use of the band 582-606 MHz by the radionavigation service, Brussels, 1962;(b) the assumption, which remains to be fully confirmed, that the results of tests carried out with monochrome television signals are also applicable to colour television;(c) that protection ratios should be such that they are satisfied for 99% of the time;(d) that values of protection ratios refer to the conditions at the input to the television receiver;(e) that the level of the television signal is expressed in terms of the power at the peak of the modulationenvelope;(f) that the level of the radionavigation signal is expressed as the power at peak-pulse level,
* This Recommendation replaces Report 307 which is hereby cancelled and constitutes a partial answer to Question 4-1/11. It should be brought to the attention of Study Group 8.
** However, at the European VHF/UHF Broadcasting Conference, Stockholm, 1961, some delegates made reservations as to the prospect of fulfilling the technical criteria in actual planning.

Rec. 565, Rep. 122-2 93
UNANIMOUSLY RECOMMENDS
that the values of protection ratio given below should be used in determining the protection available to monochrome or colour television systems operating in the band 582 to 606 MHz:
1. Protection ratios required when the radionavigation signal falls within the passband of the television receiver
When the radionavigation signal falls within the passband of the television receiver, the required signal-to-interference ratio should be:
10 dB for systems with negative modulation,15 dB for systems with positive modulation.The ratio is sensibly constant over the greater part of the passband of the television receiver, but decreases
in accordance with the selectivity of the receiver as shown in Fig. 1.The protection ratios given in Fig. 1 do not relate to interference to the sound channel from signals of the
radionavigation services. Further studies should be carried out on this subject.
Frequency separation with respect to the vision carrier (MHz)
FIGURE 1 - Protection ratio required by system L, G, I and K picture signals against a radionavigation signal in the band 582 to 606 MHz
2. Protection ratios required when the radionavigation signal falls outside the passband of the television receiver
Reference should be made to Recommendation 418-3, § 5, for image channel interference.No information exists at present on adjacent channel interference.
Note. — Other interference effects (intermodulation) are likely to occur if radionavigation stations, which in general use high peak powers and highly directional antennae, are situated near receiving locations, especially where the television signal is weak.
REPORT 122-2
ADVANTAGES TO BE GAINED BY USING ORTHOGONAL WAVE POLARIZATIONS IN THE PLANNING OF BROADCASTING SERVICES
IN BANDS 8 (VHF) AND 9 (UHF)
Sound and television(1956 - 1959 - 1970 - 1974)
Investigations have been conducted in several countries to ascertain the advantages which can be obtained in sound and television broadcasting by using polarization discrimination in reception. The results of extensive studies made in Europe by the Federal Republic of Germany, France, Italy and the United Kingdom and also in the United States of America, have been made available in documents at Warsaw, 1956 and Geneva, 1958; and a reasonably definite answer may now be given to the question.

94 Rep. 122-2
1. Band 8 (VHF)
In this band of frequencies, between 30 and 300 MHz, the median value of discrimination that can be achieved at domestic receiving sites by the use of orthogonal polarization may be as much as 18 dB, and under these conditions, the values exceeded at 90% and 10% of the receiving sites are about 10 dB and 25 dB respectively.
The values of discrimination are likely to be better in open country and worse in built-up areas or places where the receiving antenna is surrounded by obstacles. For domestic installations in densely populated districts, the median values of 18 dB will usually be realized only at roof level; and this value may be reduced to 13 dB or less at street level.
No significant changes in the polarization of waves in band 8 due to transmission through the troposphere have been observed over distances exceeding 200 km. Furthermore, there have been no reports of systematic changes in polarization effects with frequency in the metric band, neither with distance nor with type of terrain.
It must be emphasized, however, that to realize the discrimination ratios mentioned above, certain precautions are necessary at both the transmitting and receiving installations; cases have been reported in which, for a transmitter of horizontally polarized waves, some 7% of the radiated power was vertically polarized. It is clear that if the best discrimination is to be obtained for co-channel operation, the transmitters and antenna systems must be designed and installed so as to radiate as much as possible of the total power on the assigned polarization.
In the same way, to achieve the desired discrimination at the home receiving installation, the reception of the undesired orthogonally polarized waves on the antenna feeder and on the receiver itself must be reduced to the minimum practicable value.
2. Band 9 (UHF)
Experiments have been conducted in the United Kingdom to determine the polarization discrimination in band 9 (UHF) of receiving antennae at typical urban and rural sites. The results of measurements showed that for orthogonally polarized signals arriving in the direction of main response of the antenna, the discrimination obtained is similar to that already described above for frequencies in band 8 (VHF), although the factor exceeded for 90% of receiving sites was only 8 dB (as compared with 10 dB for band 8 (VHF)). In the case of discrimination against orthogonally polarized signals arriving within the arc 180° ± 90° relative to the direction of main response, measurements confirmed that at least 20 dB discrimination is achieved at 90% of receiving sites. As a result of these investigations, for television planning purposes in band 9 (UHF), the United Kingdom uses values of antenna discrimination for orthogonal transmissions which exceed the values for co-planar transmissions given in Recommendation 419, by 8 dB (total value: 8 dB) in the range of 0° to 20° relative to the direction of main response and by 4 dB (total value: 20 dB) in the range 60° to 180°. Linear interpolation is applied for the range 20° to 60° as in the existing curve for discrimination between co-planar transmissions.
As in band 8, care is necessary to ensure that the transmitter and receiver respectively do not emit or receive radiation of the undesired polarization. Apart from this, however, experience indicates that in band 9 (UHF), the use of horizontal polarization offers advantages, because of the greater directivity obtainable at the receiving antennae; this reduces the effect of reflected waves, particularly in town areas. The European Broadcasting Union, therefore, considers that frequency assignments in these bands should be based on the general use of horizontal polarization, though exceptions may be made in cases where orthogonal polarization is necessary to achieve the desired protection.
3. Conclusion
From the studies described above, it is clear that the use of orthogonal polarization for broadcasting stations operating in the same frequency channel is of material assistance in discriminating against the reception of undesired signals. Worth-while advantages are obtainable over the whole band of frequencies from 40 to 500 MHz and within the normal broadcasting service ranges. From the uniformity of the discrimination obtained over these frequencies, it is considered to be almost certain that the advantages will extend to the top of the broadcasting band in band 9 at nearly 1000 MHz.
BIBLIOGRAPHY
CCIR Documents
[1956]: Warsaw 267, 435 and 512.
[1958]: Geneva V /l, V /6, V/12, V/23 and V/27.
[1970-74]: United Kingdom, 11/267.

Rep. 306-3 95
REPORT 306-3 *
RATIO OF WANTED-TO-UNWANTED SIGNAL FOR COLOUR TELEVISION(1963 - 1966 - 1970 - 1974 - 1978)
The protection ratios required by amplitude-modulation vestigial-sideband colour television systems are considered in this Report.
1. Co-channel interference-protection ratios for mutual interference between any of the seven systems B, D,G, I, K, Kl and L
1.1 Carriers separated by less than 1000 Hz, but not synchronized
Protection ratio: 45 dB.
1.2 Nominal carrier frequencies separated by 1/3, 2/3, 4/3 or 5/3 o f the line frequency
Protection ratio: 30 dB (see Note).
1.3 Carriers separated by 1/2 or 3 /2 o f the line frequency
Protection ratio: 27 dB (see Note).Note. — If the wanted signal is system D or K, and the interfering signal is system G, the protection ratio should be increased to 35 dB, to avoid interference from the unwanted sound signal.
1.4 For systems B/PAL, G/PAL, I/PAL and L/SECAM, the values (in decibels) of the protection ratio should be those given in Table I.
TABLE I
Offset (multiples of 1/12 line-frequency)
0 1 2 3 4 5 6 7 8 9 10 11 12
Transmitter stability ±500 Hz(non-precision offset)
T 45 44 40 34 30 28 27 28 30 34 40 44 45
C 52 51 48 43 40 36 33 36 40 43 48 51 52
L P 60 60 57 54 50 45 42 45 50 54 57 60 60
Transmitter stability ±1 Hz(precision offset)
T 30 34 30 26 22 22 24 22 22 26 30 34 30
C 36 38 34 30 27 27 30 27 27 30 34 38 36
L P 45 44 40 36 36 39 42 39 36 36 40 44 45
T : tropospheric interference, 1 % to 10% of time (reference 30 dB at 8/12 line frequency)C : continuous interference (reference 40 dB at 8/12 line frequency)LP : limit of perceptibility
The protection ratios given are also valid up to about 50 kHz if multiples of the line frequency be added to the first line of this table.
This Report incorporates the substance of Report 479 which is hereby cancelled.

96 Rep. 306-3
1.5 For systems B/SECAM and G/SECAM, the values (in decibels) of the protection ratios should be those given in Table II:
TABLE II
Offset (multiples of 1/12 line frequency)
0 1 2 3 4 5 6 7 8 9 10 11 12
Transmitter stability ±500 Hz(non-precision offset)
A 50 46 37 36 32 30 31 30 32 36 37 46 50
B 42 45 42 37 31 28 25 28 31 37 42 45 42
Transmitter stability ± 1 Hz(precision offset)
A 41 36 28 24 24 26 25 26 24 24 28 36 41
B 36 35 32 26 23 23 24 23 23 26 32 35 36
A : unwanted PAL or SECAM modulated carrier with slightly different line frequency, A/ 1 Hz.B: unwanted SECAM modulated carrier with the same line frequency.
In addition to luminance interference, slight chrominance interference appears for frequency offsets (5/12) /* to (7/12)/*.
2. Overlapping channel interference
2.1 Figs. 1 to 7 give protection ratios for 525- and 625-line colour systems when a CW signal or the carrier ofan interfering sound or vision signal lies within the channel of the wanted transmission. Where it affects the results, the ratio of vision to sound power is assumed to be 7 dB for systems M and I and 10 dB for other systems, unless otherwise specified.
2.2 Relationships between the carrier frequencies o f the wanted and unwanted emission
2.2.1 Non-controlled
No special control of the nominal frequency difference between the carriers of the wanted and unwanted signals.
2.2.2 Non-precision offset
Difference between the nominal frequencies of the two carriers is suitably related to the line frequency; the precision of the nominal carrier frequencies being ± 500 Hz.
The line synchronization of television receivers must be sufficiently immune to periodic interference if full advantage of carrier offset operation is to be achieved.
2.2.3 Precision offset
Difference between the nominal frequencies of the two carriers is suitably related to the line and field frequencies, but with a precision of each of the nominal carrier frequencies of the order of ± 1 Hzand a stability of the line frequencies equal to or better than 1 x 10~6.
The protection ratios obtained through the application of precision offsets, presumes that the amplitude of the short-term instability of the carrier frequencies is maintained within acceptable limitswhich depend on the frequency of the deviations corresponding to the instability.
3. Adjacent-channel interference
3.1 Lower adjacent-channel interference
The values of the protection ratios should be the same as those quoted for monochrome television in Recommendation 418-3, § 3.2.
3.2 Upper adjacent-channel interference
The values of the protection ratios should be the same as those quoted for monochrome television in Recommendation 418-3, § 3.3.

Rep. 306-3 97
Frequency difference (MHz)
FIGURE 1
525-line NTSC or PAL system. Protection from a CW signal interference
The curve shown in Fig. 1 gives the protection required for 525 line colour television signals using either PAL or NTSC systems.
Frequency difference (MHz)
FIGURE 2
625-line L/SECAM system. Protection from a CW or frequency-modulated sound signal interference
Curve A : non-controlled condition.
Curve B (non-precision offset condition):the frequency difference is an odd multiple of half the line frequency.
Curve C (precision offset):in the luminance spectrum between -1 .8 and 3.2 MHz.:
- the frequency difference is a multiple of the line frequency plus or minus {In + 1) 25 Hz with a value of n chosen to give a deviation in the vicinity of 1/3 of the line frequency;in the chrominance spectrum between 3.8 and 4.8 MHz:
- the frequency difference is a multiple of the line frequency plus or minus n x 50 Hz with a value of n not exceeding 20.

Rep. 306-3
«T5_o
Frequency difference (MHz)
FIGURE 3
625-line B/SECAM and G/SECAM systems. Protection from CW or frequency-modulated soundand vision signal interference
Curve A : non-controlled condition- video modulated carrier, PAL or SECAM, with line frequency slightly different from that of the wanted signal
(A /% 1 Hz).
Curve B : non-controlled condition- video modulated carrier, SECAM, with the same line frequency, as the wanted signal.
Curve C : non-precision offset condition- an unmodulated or amplitude-modulated carrier (1000 Hz, 50% modulation).
Curve D : a frequency-modulated carrier (1000 Hz, 50 kHz deviation).
50
40
« 30
« 20
10
0- 3
/ \/ \ / 1/f \ S. // \V /r \
////- 2 - 1 0 1 2 3 4 5 6 7 8 9 10
Frequency difference (MHz)
FIGURE 4
625-line B/PAL and G/PAL systems. Protection from CW signal interference, with no special control o f the nominal frequency difference between the carriers o f the wanted and unwanted signals

Rep. 306-3 99
74-75
-1 0 1 2 3 4 5 6 7 8 9
Frequency difference (MHz)
FIGURE 5
625-line B/PAL and G/PAL systems. Protection from vision-signal interference
10
Curve A : non-controlled condition
Curve B (non-precision offset):in the luminance spectrum between —1.5 and 3.5 MHz
- the frequency difference is an odd multiple of half the line frequency; in the chrominance spectrum between 3.5 and 5 MHz:
- the frequency difference is a multiple of the line frequency plus 7/12 of the line frequency.
Curve C (precision offset):in the luminance spectrum between —1.5 and 3.5 MHz :
- a selected frequency difference in the vicinity of a multiple of the line frequency plus either 4/12 or 5/12 of the line frequency.
Frequency difference (MHz)
FIGURE 6
625-line i/PAL system. Protection from CW or frequency-modulation sound signal interference, with no special control o f the nominal frequency difference between the carriers

100 Rep. 306-3
Frequency difference (MHz)
FIGURE 7
625-line I/PAL system. Protection from vision-signal interference
In all cases, the ratios quoted are those between the wanted and unwanted vision levels.
Curve A : non-controlled condition.
Curve B (non-precision offset):the frequency difference is an odd multiple of half the line frequency.
Curve C (precision offset):in the luminance spectrum between -2 .5 and 3.6 MHz :
— the frequency difference is a multiple of the line frequency plus or minus 1/3 of the line frequency but finely adjusted to be an odd multiple of the picture frequency (25 Hz)in the chrominance spectrum between 3.6 and 5.2 MHz:
- the separation between the vision carrier frequencies is made to differ from the subcarrier frequency by a value which is a multiple of the line frequency, plus a multiple of the field frequency (50 Hz) near 1/6 line frequency, plus 31.25 Hz.
For curves B and C, it is assumed that the vision carrier offsets will be accompanied by suitable sound carrier offsets; otherwise, greater protection ratios will be needed for frequency differences very close to zero for I/PAL system unwanted signals (or close to 0.5 MHz for standards B and G) because of interference between sound channels.
4. Protection ratios between sound signals
Protection ratios between sound signals are given in Recommendation 418-3, § 6.Curves for the audio-frequency signal-to-noise ratio corresponding to a constant radio-frequency protec
tion ratio of 30 dB are given in Fig. 8 as a function of the carrier-frequency offset. These curves may be assumed to be valid for all 625-line systems using frequency-modulation sound transmission.
Audio-frequency signal-to-noise ratios corresponding to other radio-frequency protection ratio values may be readily deduced because of the closely linear relationship; for example, for a 22-dB radio-frequency protection ratio (acceptable for a small percentage of the time with precision offset of 2/3 or 5/3 line frequency under tropospheric propagation conditions), the audio-frequency signal-to-noise ratio values will be 8 dB lower.
Taking into account that the audio-frequency signal-to-noise ratio will become rather poor if precision offset operation of the vision transmitters is envisaged, it is evident that 5/3 line-frequency operation is to be preferred to 2/3 line-frequency offset working.
5. Image channel interference
For planning purposes the assumed values of receiver image-channel rejection should be the same as those quoted in Recommendation (418-3), § 5.
6. Allowance for substantially non-fading unwanted signals
Except where otherwise stated, the protection ratios given in §§ 1 to 3 correspond closely to a just tolerable impairment condition and are considered to be acceptable only if the interference occurs for a small percentage of the time, not precisely defined but generally accepted to be between 1% and 10%. If the wanted and unwanted signals are substantially non-fading then the values of protection ratio should be increased to approach a just perceptible impairment condition.

Rep. 306-3 101
Frequency offset (f fj /3)
Frequency offset (kHz)
FIGURE 8 - Audio-frequency signal-to-noise ratio (weighted) for a radio-frequency protection ratio o f 30 dB
Wanted sound transmitter : unmodulatedInterfering sound transmitter: modulated with “ coloured noise” , r.m.s. deviation ± 15 kHz
Curve A : split-sound demodulationCurve B : inter-carrier demodulation (black picture) - for both wanted and interfering emissions Curve C : inter-carrier demodulation (white picture) - for both wanted and interfering emissions
When using the given protection ratios for planning, sufficient allowance for fading of the unwanted signal is ensured provided that its fading range, derived from the difference between the median field-strength and the field-strength applicable to the percentage of time for which protection is required, is greater than the difference between the values of protection ratio required for fading and for non-fading conditions.
If the fading range is less than this figure then the interference can be treated as continuous, and the interference assessment can be based upon the median level of the unwanted signal and the protection ratio applicable to continuous interference. Where the latter is not known, a suitable approximation is obtained by increasing the protection ratio appropriate to short-term interference by 10 dB; in this case interference is considered to be continuous unless the fading range of the interfering signal is at least 10 dB.
ANNEX I
CONDITIONS UNDER WHICH THE PROTECTION RATIO IS SPECIFIED
1. Except where otherwise stated, the standard of protection adopted for interference between two 625-line television systems should be that corresponding to a protection ratio of 30 dB with a non-precision carrier offset equal to two-thirds of the line frequency,2. For planning purposes, this value of protection ratio should be taken as acceptable for interference occurring between 1% and 10% of the time.3. The fading allowance should be determined from field-strength curves appropriate to the percentage of the time for which the value of protection is desired, based on the assumption that the fading of the wanted signal is small compared with that of the interfering signal.

102 Rep. 306-3
4. The values of protection ratio quoted refer to values at the input to the receiver, no account being taken of the effect of using directional antennae or of the advantage that can be obtained by the use of different polarizations for the wanted and the interfering signal.5. The amplitude of a vision-modulated signal is defined as the r.m.s. value of the carrier at peaks of themodulation envelope (taking no account of the chrominance signal in positive-modulation systems), and that of a sound-modulated signal is taken as the r.m.s. value of the unmodulated carrier, for both amplitude- and frequency-modulation.6. For planning purposes, it may be assumed that the power in the chrominance channel at peaks of thecolour modulation envelope cannot exceed a value lower by 14 dB than that of the power in the main carrierduring peaks of the modulation envelope.7. All the values of protection ratio quoted refer to interference produced by a single source.
ANNEX II
The results of such measurements in Canada are given in Fig. 9. A representative sample of 17 colour television receivers was evaluated on channels in Bands I and III, at a nominal viewing distance of 3 m by a mixed group of experts and non-experts. The desired video signal was a colour bar pattern while the sound signal was a 400 Hz tone at a deviation of ± 25 kHz. The level of the desired signal was 1 mV into 300 ohms. The undesired signal was a single carrier which was frequency modulated by a 1 kHz tone at a modulation depth sufficient to produce ± 7 5 kHz deviation.
Fig. 9 expresses the results in the form of a curve for the median receiver and also gives the standard deviation of the curve.
60
50
03T3r 40o‘3o<DJ-H
£.2*3£ 30t-H
£o
£01 20ot_<a*
10
0-2 -1 0 1 2 3 4 5
Frequency difference from video carrier (MHz)
FIGURE 9 - Protection ratio for just perceptible interference for the 525-line NTSC colour television system
Curve A : protection ratio curve for median receiver.B : standard deviation of curve A.

Rep. 306-3, 482 103
BIBLIOGRAPHY
CCIR Documents[1966-69]: X I/16 (Italy), XI/138 (Federal Republic of Germany), XI/187 (Italy).[1970-74]: 11/23 (United Kingdom), 11/74 (Federal Republic o f Germany), 11/85 (France), 11/94 (France), 11/101 (OIRT),
11/125 (U.S.S.R.).
REPORT 482
RECOMMENDED CHARACTERISTICS FOR COLLECTIVE AND INDIVIDUAL ANTENNA SYSTEMS FOR DOMESTIC RECEPTION OF
SIGNALS FROM TERRESTRIAL TRANSMITTERS
(Question 7-1/11)(1970)
1. Scope
Installations may be classified according to the number of users served. An individual antenna serves one user, even though it may be associated with several receivers. A collective antenna serves all or part of a building and hence a larger number of users.
This Report applies to antenna systems for individual and collective use designed to receive television broadcasts in bands 8 (VHF) and 9 (UHF) and also to the associated equipment of such systems; the transmission line, amplifiers, couplers, etc. used to convey the signal to the television receivers.
It does not apply to television antennae for wired distribution systems.
2. Frequency range
The parts of bands 8 (VHF) and 9 (UHF) allocated to broadcasting and used for television.
3. Amplitude/frequency characteristic
The amplitude/frequency characteristic of the system, excluding the antenna, should be uniform within 3 dB for each channel at each individual outlet.
4. Nominal output impedance
In unbalanced systems, the nominal impedance should be 75 Q.In balanced systems, the nominal impedance should be 300 Q.
5. Noise figure (see Recommendation 331-4, § 2) in particular when the system includes active elements:
— lower part of band 8 (VHF) < 9 dB— upper part of band 8 (VHF) < 9 dB— lower part of band 9 (UHF) < 12 dB— upper part of band 9 (UHF) < 15 dBunless the peak-to-peak picture signal-to-r.m.s. unweighted noise ratio at the video signal output of the receiver is greater than 37 dB.
6. Reflection coefficient
Passive equipment Couplers and filters Active equipment
7. Interference
7.1 The installation should cause neither interference at fixed frequencies nor cross-modulation products(between signals from different transmitters) which, assuming they are referred to the receiver input, would interfere (in the sense of Recommendation 418-3 or Report 306-3) with reception from the wanted transmitters, in the service area as defined by the protected field.
Band 8< 0.25< 0.33< 0.33
Band 9< 0.33< 0.33< 0.33

104 Rep. 482
7.2 An echo, whether it originates outside or inside the installation will not be considered as interfering if thewanted signal/echo ratio is greater than or equal to 20 dB.
The case of multiple echoes remains to be studied.7.3 The installation, in particular the devices for preventing interference or echoes, e.g:— high-gain antennae with a front-back ratio of not less than 18 dB,— multiple antennae,— echo correctors,should not cause, in the channels of the transmissions normally received, discernible defects such as smear, hum, loss of synchronization, interference patterns, or interference in general.
8. Signal level at each outlet
The following are the limits within which the signal to be applied to the television receiver should lie, measured at the terminals of the appropriate resistance:
Maximum Minimum(dBm)
— lower part of band 8 (VHF) -2 0 -5 1— upper part of band 8 (VHF) -2 0 -5 1— lower part of band 9 (UHF) -3 0 -4 8— upper part of band 9 (UHF) -3 0 -4 8
9. Colour television
The system, including the antenna, should be capable of receiving broadcasts in colour made according to the CCIR system in use by the transmissions to be received. In particular, the amplitude of the sub-carrier should not differ from its nominal value by more than ± 2 dB. This value refers to the system excluding the antenna (see § 3). Particular care must be taken regarding intermodulation products between vision, sound- and colour-carrier frequencies falling into the useful radio-frequency band.
10. Oscillators and other equipment used in the system
The levels of the energy radiated and of the energy reinjected into the distribution system should be less than the values which may be specified by the CISPR.
The total frequency drift of the oscillators should not exceed the value of ± 75 kHz for variations in the supply voltage of ± 10% and a temperature range of —10 °C to +55 °C.* This value applies to both band 8(VHF) and band 9 (UHF).
11. Isolation between outlets
The isolation between two different outlets must be at least 22 dB for all the frequencies in the broadcasting bands. This value assumes that the frequency allocation and the intermediate frequency of the receivers have been planned to avoid interference.Note. — This value is raised to 46 dB between an outlet for television signals in bands 8 and 9 and an outlet for frequency modulation sound broadcasting signals with two different users. The selection circuits required form an integral part of the installation.
12. Antenna characteristics
The gain shall be expressed relative to that of a half-wave dipole for each of the channels to be received. Subject to further studies, the directivity characteristics of the antenna should meet the provisions of
Recommendation 419.The antenna gain should be uniform within ± 2 dB throughout the bandwidth of each of the channels
which are indicated as being receivable by the antenna.The impedance should be matched to the nominal impedance of the system used (see § 4).Protection against a linearly polarized wave, whose polarization plane is perpendicular to that of the
antenna, should be greater than 20 dB. This limit only applies to reception in the main lobe of the antenna.
BIBLIOGRAPHY
CCIR Documents[1966-69]: XI/6 (United Kingdom); X I/25 (France); X I/49 (Canada); XI/165 (France); X I/169 (Spain); X I/184 (Italy).
Further information is requested.

Rep. 483-2 105
REPORT 483-2 *
SPECIFICATIONS FOR LOW-COST MONOCHROME TELEVISION RECEIVERS
(Question 13/11)(1970 - 1974 - 1978)
This Report is a reply to Question 13/11. It presents values for the characteristics of low-cost television receivers suitable for home and community use. Values are based on information in [CCIR, 1966-69a, b, c, d, e; 1970-74a; 1974-78].
1. General
1.1 Types o f receiver
These specifications apply to two types of low-cost monochrome television receiver giving a satisfactory performance:
Type A: Receivers intended to give acceptable performance at the lowest possible cost.Type B: Receivers intended to give good performance at a reasonable cost.Generally speaking Type A receivers would be home receivers whereas Type B receivers would often be
community receivers.It should be noted that in establishing the performance specifications listed below due consideration was
given to the situation prevailing in many developing countries where the normal utilities have not reached the required level. As a result of this, the requirements of certain parameters of a television receiver are severe and this adds to the cost.
1.2 Power supply
Where feasible, the use of a.c. mains operated receivers is recommended. In some countries, battery-operated receivers are at present either of lower performance, or of higher cost.
The Administrations concerned should specify the television standard to be employed and the mains voltage and frequency, if the receivers are to be mains-operated. Particular emphasis should be given to any difference that may exist between the mains frequency and the field frequency of the television system, whether due to intentional differences or to temporary disturbances.
For battery-operated receivers, satisfactory performance should be secured with the battery voltage 15% below the nominal value.
1.3 Controls
The following controls, at least, should be available to the user:— power switch,— channel selector and tuning,— contrast,— brightness,— sound volume.
1.4 Planning o f uses
In planning the uses of these receivers, Administrations should take account of their differing characteristics, the range of signal intensity expected, and the possibilities for special antennae, pre-amplifiers and low-loss radio-frequency feeders.
Although it is desirable that receivers should be capable of operation on all channels, receivers equipped toreceive only the channels of the transmitters serving the given area and conforming to the frequency plan may beacceptable.
Administrations should further take account of the effect of the size of the screen and the cabinet on cost. The recommended values given are considered appropriate for the expected use of the receivers.
The receivers should be simple, robust and well protected against the environment. Those intended for use in areas of high temperature, high humidity or dust, should be treated so that they can be used under the climatic conditions specified by the Administration concerned. Appropriate tests, consistent with the relevant IEC Publications **, should be prepared by the Administration concerned.
* This Report is also o f interest to Study Group 1.** The IEC Publications quoted in the text are the most up-to-date issues at the time of preparation of the Report.

106 Rep. 483-2
1.5 Safety
The receiver should comply with the safety recommendations of IEC Publication 65.
1.6 Methods o f measurement
The methods of measurement and the tests to be employed should be those recommended in relevant paragraphs of IEC Publications 106 (1959), 106A (1962) and 107 (1960). National regulations or tests differing from these standards should be quoted.
1.7 Receiver tuning
For all the measurements which follow, the receiver should be accurately tuned as described in IEC Publication 107, § 1.4.8.2 or, if this is not appropriate, in some other specified manner.
2. General specifications
2.1 Recommended size (diagonal) for the screen
2.2 Frequency bands
Type A Type B
28 cm 48 cm(11 in.) (19 in.)or larger or larger
VHF or VHF orVHF and VHF andUHF UHF
2.3 Power supply for a.c. operation
Frequency:— nominal value (Hz)
(see § 1.4 above, second sub-paragraph)
To be specified by the Administration concerned
± 2 ± 2— maximum variation (Hz)Note. — If this variation is greater, the cost of the receiver will inevitably be higher.Voltage:— nominal value (V) To be specified by the
Administration concerned— maximum permissible variation without extra equipment (%) ± 1 0 ± 1 0— surges of . . . * ms duration and changes in amplitude of (%) ± 3 0 ± 3 0Note. — It will be up to the user to provide a means of voltage control for variations greater than ± 10%.
3. Input characteristics
3.1 Input impedance at the antenna terminals (Q)
3.2 Toleration o f surge discharges at the input circuit (IEC Publication 315-1, § 6)Energy of each discharge (pJ)
3.3 Maximum noise figure (dB) (least favourable channel)Band 8 - VHF Band 9 - UHF
3.4 Noise-limited sensitivity at a signal-to-noise ratio o f 30 dB and standard output (IEC Publication 107, § 3.3) (dBm)Band 8 - VHF Band 9 - UHF
3.5 Characteristic o f the automatic gain control (IEC Publication 107, §§ 3.6 and 3.7)( - 2 0 to -5 0 dBm) (dB)
75 or 300
1016
-5 0-4 0
75 or 300
12
-6 0-5 5
The value is under study.

Rep. 483-2 107
4. Output characteristics
4.1 Minimum audio-frequency pass-band within 6 dB(IEC Publication 107, § 12.3) (Hz) 150 to 5000 150 to 5000
4.2 Minimum audio-frequency output at 10% distortion(IEC Publication 107, § 13.2.5) (W) 0.5 2
4.3 Minimum picture resolution * (IEC Publication 107, § 2.6) (lines per picture height)
— 6 MHz channel systems (4.5 MHz intercarrier frequency) 225 280— 7 or 8 MHz channel systems (5.5, 6 or 6.5 MHz intercarrier
frequency) 270 320
4.4 Minimum brightness at white level for a black level o f 3 cd/m 2 (IEC Publication 107, § 2.4.1)
— 50 fields/s system (cd/m2) 70 120— 60 fields/s system (cd/m2) 70 150
4.5 Minimum interlace ratio (IEC Publication 107, § 2.9) 30/70 30/70
4.6 Maximum picture motion expressed as a percentage o f picture height for a difference o f 1 Hz between the mains frequency andthe field frequency (IEC Publication 107, § 2.3.1.1) (%) 0.8 0.4
4.7 Maximum relative non-linearity o f scan over a complete field(IEC Publication 107, § 2.3.2) (%) 10 ± 10
4.8 Maximum distortion o f the picture outline (IEC Publication 107,§ 2.3.3) (%) 10 6
5. Interference
5.1 Intermediate frequency
The picture and sound intermediate frequencies used in the receivers should be in accordance with those chosen for the establishment of the given frequency plan.** For standard K l, see, for instance, Doc. 44 of the African Broadcasting Conference, Geneva, 1963.
5.2 Minimum rejection o f the upper adjacent picture carrier(IEC Publication 107, § 4.2) (dB) 26 32
5.3 Minimum rejection o f the lower adjacent sound carrier(IEC Publication 107, § 4.2) (dB) 30 35
5.4 Minimum image rejection (IEC Publication 107, § 4.5) (dB)Band 8 - VHF 40 40Band 9 - UHF 20 25
5.5 Minimum intermediate-frequency rejection (IEC Publication 107, § 4.4) (dB)Band I - VHF 20 20Band III - VHF, Bands, IV, V - UHF 30 30
5.6 Minimum crosstalk (IEC Publication 107, § 4.8.1) (dB)Vision into sound 30 30Sound into vision 40 40
5.7 Minimum attenuation o f the sound carrier relative to the visioncarrier at the video detector (dB) 30 34
Note 1. — This requirement is to avoid beats in the receiver between the sound carrier and a subsequent colour sub-carrier.Note 2. — An attenuation of 20 dB will be sufficient for both types of receivers in areas where transmissions are made only in black and white.
* Alternatively, Administrations may wish to specify their requirements on resolution in terms of an electrical bandwidth measurement (e.g. according to IEC Publication 107, § 5.2) in which case the requirement must be negotiated with the manufacturer.
** For economic reasons the number of different intermediate frequencies should be kept to a minimum (see Report 184-2).

108 Rep. 483-2
5.8 Radiation (IEC Publication 106/106A) In accordance withRecommendation No. 24/2 of the CISPR
Note. — Unless otherwise specified by the Administration concerned, no measurements will be made below0.5 MHz (LF Broadcasting).
6. Stability
6.1 Maximum drift o f the local oscillator between 2 min and 60 min after the picture appears (IEC Publication 107, § 6.1.3) (kHz)VHF ± 300 ± 300UHF ± 500 ± 500
6.2 Drift o f the local oscillator due to a change o f + 5 to —10% inthe supply voltage (IEC Publication 107, § 6.1.6) (kHz)VHF ± 200 ± 200UHF ± 300 ± 300
6.3 Minimum range o f lock-in (IEC Publication 107, § 6.2.3) (%)VerticalHorizontal
6.4 Minimum range o f hold (IEC Publication 107, § 6.2.3) (%)VerticalHorizontal
± 1 ± 1
± 2 ± 2
7. Reliability
The precise specification of reliability for a complete equipment is a subject under general study at the present time but manufacturers of receivers of the type considered in this Report should utilize as far as it is possible components already reliability tested under appropriate conditions. Since it is expected that these receivers will be closely based on ones already in quantity production, data on the reliability performance of such receivers should be available under normal operating conditions.
The following figures are only provisional objectives suggested for receiver manufacturers and should on no account be considered as part of any contract.
Type A Type BDesirable minimum mean operating time between failuresrequiring servicing, averaged over a production run (hours) 1000 1000
ANNEX I
SPECIFICATIONS FOR LOW-COST TELEVISION RECEIVERS
This Annex is attached for information.1. Television receivers manufactured in the U.S.S.R. [CCIR, 1970-74 b] are classified in four categories: 1, 2, 3 and 4.2. The classification is based on the differences in the basic technical characteristics which to a large extent determine picture and sound quality. Basically, these characteristics determine the cost of the receivers.3. Category 3 and 4 receivers are low-cost receivers possessing the following characteristics:

Rep. 483-2 109
Characteristics
Typical values of characteristics (See Note 1)
404) (See Note 2) 3(B)
(1) (2) (3)
1. Size (diagonal) of screen (cm) not less than 31 502. Frequency bands (See Note 3) I, II, III, IV, v I, II, III, IV, V
3. Noise limited sensitivity (dBm) of picture channel at a peak-to-peak VHF -6 8 VHF -6 8video signal-to-noise ratio of 20 dB UHF -5 8 UHF -5 8
4. Synchronization-limited sensitivity of picture channel (dBm) - 6 8 - 6 85. Characteristic of the automatic gain control which maintains output-signal
variations at 3 dB for input variations of the number of dB indicated 30 306. Minimum picture resolution (lines):
— horizontally 350 400— vertically 350 450
7. Maximum non-linearity of picture over a complete field (%): — horizontally ±10 ± 10— vertically ±10 ± 1 0
8. Maximum geometrical distortion (%) 3 39. Maximum detuning of the frequency detector during warming up (kHz) ± 25 ± 20
10. Minimum noise-limited sensitivity of the sound channel (dBm) - 6 8 - 6 811. Minimum mean (nominal) sound pressure (N/m2) 0-2 0-412. Frequency characteristic of the sound channel relative to sound-pressure
variations of not more than 14 dB; not worse than (Hz) 150 to 5000 125 to 710013. Non-linear distortion coefficient of the sound channel at a nominal value:
— in the band 200 to 400 Hz 10 7— above 400 Hz 8 5
14. Minimum selectivity (dB) band -1 -5 and less 28 30point —1*5 30 32band + 8-0 and above 30 34
15. Drift of local oscillator frequency due to a change of + 5 to —10% (kHz) Bands I-III ±300 ±300
16. Maximum admissible input signal level in dB(mW/mV) not less than - 1 0 - 1 017. Minimum brightness (cd/m2) 100 10018. Intermediate frequency (MHz) of:
— picture signals 380 380— sound signals 31-5 31-5
Note 1. — The parameters were measured in accordance with IEC Publication 107.Note 2. — Only portable receivers are manufactured to Category 4 specifications.Note 3. — Provision is to be made for reception of Bands IV and V by incorporating tuning units in the televisionreceivers at a later date.
REFERENCES
CCIR Documents[1966-70]: a. X I/53 (Italy); b. XI/132 (United Kingdom); c. XI/164 (France); d. XI/185 (Italy); e. XI/192 (India). [1970-74]: a. 11/120 (Netherlands); b. 11/127 (U.S.S.R.).[1974-78]: 11/148 (U.S.S.R.).

110 Rep. 484-1, 485
REPORT 484-1
RATIO OF PICTURE-SIGNAL TO SYNCHRONIZING-SIGNAL
(Question 1/11, Study Programme ID /11)(1970 - 1974)
Study Programme I D /11 considers the possibility of adopting one single figure for expressing the ratio of picture-signal to synchronizing-signal, for both the video and the radiated signals, independently of the systems employed.
It is considered desirable that such a ratio should reach as high a value as possible, compatible with receiver requirements.
It is felt that, to reduce the relative amplitude of the synchronizing signal below the values normally used, might give rise to difficulties in receivers and some types of studio equipment.
At the present time, the possible values of picture-signal to synchronizing-signal ratios that can be considered for a single standard are as follows: 7/3 and 10/4.
Since the ratio 10/4 is the higher of the two and is more generally used for radiated signals (some countries using it also for the video signal), Administrations should consider the possibility of adopting this value in the future.
Recent investigations in the Federal Republic of Germany have shown that it is possible with modern receivers to reduce the relative amplitude of the synchronizing signal significantly, below a value corresponding to a ratio of 10/4. A ratio of, for example, 8/2 can easily be afforded without affecting the synchronization reliability of the receivers [CCIR, 1970-1974]. Further studies should therefore be carried out to investigate the effect of a reduction to such a ratio on all parts of a television system. The cost of the necessary modification of the transmission facilities to a ratio of 8/2 must also be taken into account before Administrations can be asked to consider the adoption of such a value in the future.
REFERENCE
CCIR [1970-1974] Doc. 11/72 (Federal Republic of Germany).
BIBLIOGRAPHY
CCIR Documents
[1966-70]: XI/15-CMTT/3 (Italy); CMTT/81-Rev. 3; XI/151 (Italy).
REPORT 485
CONTRIBUTION TO THE PLANNING OF BROADCASTING SERVICES
Statistics of service (Question 4-1/11)
(1970)
1. The protection ratio is frequently used in the planning and assignment of broadcast stations and service, both visual and aural. It is usually defined as the minimum permissible power ratio of the wanted-to-interfering signals available at the receiver input, to provide the desired quality grade of service. Because the field strengths which induce the receiver input signals vary with time and from location to location it is necessary to include some of the statistics of this variability in the description of service and for the protection of this service.

Rep. 485 111
The television or frequency-modulation broadcasting service to a relatively small area in the presence of a single source of interference may be described by an algebraic-statistical equation (1). A small area is one for which changes in the type of terrain and in the distance from the pertinent transmitting antennae are negligible in terms of determining the median values of field strength.
R(Q) = ^(50,50) - Fu(50,50) + Gd - Gu - H(T) - H (L ) (1)where
H(T) = k(T)
H(L) = Ic(L)
l A 2 + °\ td u
\ id i
R (Q ) : protection ratio (dB) of the wanted to the interfering signal at the receiver input required toprovide a service quality Q under non-varying conditions. Subscripts d and u refer to thewanted and unwanted signals, respectively;
F(L', T ' ) : the level of field strength exceeded for T'% of the time in at least L'% of the locations (dB rel. 1 jiV/m);
F(50,50): median field strength in time and location (dB rel. 1 pV/m);G : effective receiving antenna gain in the pertinent direction (dB);k ( X ) : standard normal variate, tabulated in many statistical textbooks:
k(50) = 0; k(7 0 ) ------0.525; k (9 0 )------- 1.282; k ( 9 9 ) ------2.326;a t : standard deviation for variation in field strength with time (dB);a , : standard deviation for variation in field strength from location to location (dB).For the purpose of describing service, equation (1) may be interpreted as follows. If service of quality
grade Q is defined to be available at a given location only when the protection ratio at the receiver input exceeds the required value R(Q), i.e. the non-varying protection ratio is exceeded for T% of the time, then in the area for which equation (1) holds, at least L% of the locations will have this quality of service, Q. H(T) and H(L) are the factors which represent the effects upon the service to the area of the signal variability in time and with location, respectively.
In equation (1) the following assumptions have been made:— the various fields have approximately Gaussian distributions both in time and with location. Experience
[USA] indicates that this is a fair approximation between the 5% and 95% levels;— both the time correlation and location correlation between the desired and interfering signals are negligible.
Terms including these correlation terms may be added to the radicals of H(T) and H(L), if desired;— the variability in antenna gain throughout the small area is assumed to be negligible. Terms for the variability
in antenna gain may be added to the radical of H (L ) but such terms should be minor for outdoor installations compared with the location variability of the field strength.
It is noted from equation (1) that there are three interdependent parameters needed to describe the service to the area — i.e. Q, L, T. For convenience, Q and T are usually standardized and with these standard values of T and Q a value of L may be computed from (1). For example, Q may be chosen as “satisfactory” service and T as 90% or 99%. When several sources, /, of interference, including noise, are present at the area, the L, for each source of interference acting independently and alone may be computed from equation (1), and the resultant L may be computed as the product of the values of L, so long as the values of Q and T are the same for the individual computations of L, [USA].
i = nL = TL Li = LiL2 L n (2)
/ = l
The above resultant value of L is a reasonably good approximation for values of L equal to 50% or greater. Equation (1) may be rearranged to give:
R(Q) + H(T) + H (L ) - Fd(50,50) - Fu(50,50) + Gd - Gu (3)
The right-hand side of equation (3) is recognized as being equal to the ratio of the median value of the wanted-to-interfering signal powers at the receiver input. When the signals are of the non-varying type, H(T) and H ( L ) are zero and the ratio of the median values of the receiver input powers is equal to the ratio R(Q). But, when there is time and location variability (and T or L exceeds 50%) a greater ratio of median receiver input powers is required for the same quality of service Q, the increase being represented by H(T) and H(L) for time and location variability in signal strength, respectively. In effect, a statistical, multi-dimensional protection ratio may be created to represent the left-hand side of equation (3).

112 Rep. 485
For allocation and assignment computations R(Q) may be combined with 77(L) and sometimes 77(7) to create a new multi-dimensional power input statistical ratio which is more easily used with available propagation data. These ratios have often been confused with the non-varying protection ratios. When possible 77( 7) should be combined with the median values of field strength to avoid the creation of a statistical protection ratio which varies with distance.
For protection of service areas iso-service contours of equal location probability L(Q and T being preset) are drawn to depict the coverage of the broadcasting station and these iso-service contours are protected. Standard values for L need to be adopted by the CCIR in addition to presently recognized standards for T and Q, to set protection standards for iso-service contours under conditions of signals variable in time and with location.
2. Co-channel television interference
For this type of protection, 77(7,) is combined with R(Q), and 77(7) is merged with Fu(50,50). Thus, under the assumption that the time fading ranges of the interfering fields are at least twice as great as those for the wanted fields:
R(L,Q ) = R (Q ) + H (L ) « Fd(50,50) - F„(50,100-7) + Gd - Gu (4)Fu(50,50) + 77(7) « Fu (50,100-7)
R(L,Q) is convenient for use in computations to protect the service of the wanted station, especially since it is not dependent upon distance. However, R(L,Q) may be frequency dependent, since 77(L) is frequency dependent, as shown in Table I. This Table is given as an example only and for various types of terrain, the values of a may be higher or lower than those given.
3. Adjacent channel interference
When the fading of the interfering signal is much smaller than that for the wanted signal, 77(7) may be combined with Frf(50,50). Such would be the case for adjacent channel interference in System M, if the value of R(Q) = — 20 dB, as proposed in [CCIR, 1966-69] is adopted. For such conditions:
R{L,Q) = R(Q) + 77(L) « Fd(50,7) - Fo(50,50) + Gd - Gu (5)Fd(50,50) - 77(7) « Fd(50,7)
When the time fading of the wanted and interfering signals are approximately the same, 77(7) cannot be conveniently combined with one of the median field strength signals. 77(7) is then assumed to have a typical value which is independent of distance, and is combined with R(Q) and 77(L).
R(L,TfQ) - R(Q) + H (L ) + 77(7) « Frf(50,50) - F„(50,50) + Gd - Gu (6)
4. Conclusion
It is concluded that defining only the non-varying protection ratio for the broadcast services is not sufficient to define the quality of a service nor to define protection requirements for such service. It is also necessary to define the percentage of time T for which this ratio is to be exceeded as well as the percentage of locations L for which the desired quality of service Q is desired. Given this more completely specified statistical quality of service, available propagation and antenna pattern data may be employed to determine the ratio of wanted to interfering field strengths which may be needed to provide the required protection. From these field strengths the required service contours and station separation may be compiled.
T able I
Examples o f values for H (L )
Frequency (MHz) 70 100 200 700
aia — °i« = ai (dB) 7 7 8 1277(50) (dB) 0 0 0 077(70) (dB) - 5 - 5 - 6 - 977(90) (dB) - 1 2 - 1 2 - 1 5 - 2 277(99) (dB) -2 3 - 2 3 - 2 6 - 3 9

Rep. 485, 625-1 113
REFERENCE
USA Report of the ad hoc Committee for the evaluation of the radio propagation factors concerning the TV and FM broadcasting services in the frequency range between 50 and 250 Me. Vols. I and II — Available from Clearinghouse for Federal Scientific and Technical Information, National Bureau of Standards, US Department of Commerce, Vol. I PB 166696, Vol. II PB 166697.
CCIR Document[1966-69]: XI/35 (USA).
BIBLIOGRAPHY
CCIR Document [1966-69]: X I /143 (USA)
REPORT 625-1
CHARACTERISTICS OF TELEVISION RECEIVERS AND RECEIVING ANTENNAE ESSENTIAL TO FREQUENCY PLANNING
(Question 26-1/11 and Study Programme 26A-1/11)(1974- 1978)
1. Introduction
Many characteristics of television receivers may be defined, together with methods of measurement and practical values. Question 26-1/11 and Study Programme 26A-1/11 call for the study of the principal characteristics which may be required for frequency planning.
These characteristics are tabulated in § 4 of this Report in which it is suggested that the most recent mean numerical values should be collected.
The quality of the picture displayed and of the sound heard depends on characteristics of the complete television system from the studio to the receiver screen or loud-speaker, and in this context the main parameters of a television receiver, other than those primarily involved in frequency planning, may be of interest. The CCIR has collected a great deal of data which is embodied in various Recommendations and Reports, but much of this has been rendered obsolete by the development of receiver design techniques.
The definition of these characteristics, the measuring method applied and the presentation of the results in Tables IV and V should be taken, where available, from IEC Publication 107-1, and from Doc. 12A (CentralOffice) 98, and are provided purely for information purposes, since this latter document is provisional and still incomplete, but it is nevertheless the most recent version of the revision of Publication 107, which is now out of date. These tables will need to be brought up to date when the final version of this revision is issued.
It is important that CCIR definitions of receiver performance characteristics should not contradict those of the IEC. Where this occurs, action should be taken by both organizations to resolve the difference.
Attention is drawn to the importance of effective participation by the CCIR representatives in IEC work, especially in the field of definitions and methods of measurement of television receiver characteristics (Sub- Committee 12A). This information is important for planning and for achieving satisfactory quality targets in an overall television system, from picture source up to and including the receiver.
Apart from these characteristics, those relating to interference caused by television receivers should conform to the relevant CISPR recommendations.
2. Categories of receivers2.1 An overall appraisal of picture quality should take into consideration the category of receivers which willbe used in the broadcasting system envisaged.
It is proposed that data recorded in future for this Report should relate only to the mean values of characteristics for receivers that are typical of good, current engineering practice in the country in question. This is to avoid undue influence being exerted on future planning standards by receiver designs at the extreme upper and lower ends of the performance range.
A reference receiver could be defined taking into account the mean values and possible appropriate amendments to them.
2.2 Receivers for direct satellite broadcasts
No practical data are yet available. However, a few references are given below in which the results of the many studies on the subject may be found:CCIR Documents[1970-74]: 11/92 (France), 11/93 (France), 11/306 (Italy), 11/262 (United Kingdom), 11/315 (EBU).[1974-78]: 11/40 (Japan), 11/143 (ESA).

114 Rep. 625-1
3. Receiving antennae
The numerical values of antennae characteristics contained in Recommendation 419 and Reports 122-2 and 482 relate to antennae in situ. Only data relating to the directivity, forward gain and cross-polarization protection of antennae tested under idealized conditions in a suitable site need be recorded.
The necessary definitions and measuring methods are contained in IEC Publication 138, which is now being revised.
4. Principal characteristics required for planning
4.1 List o f characteristicsTABLE I
Item Characteristic
Publication IEC 107-1
Remarks
Definition MeasuringMethod
Presentation of results
1 Noise-limitedsensitivity
art. 103 and art. 109
art. 110 For a peak-to- peak luminance signal-to-nonweighted noise ratio of 30 dB
The most unfavourable value for each of the broadcasting bands
2 Protection ratios See § 3 of [CCIR, 1970-74] and § 4.3 in this Report
3 Rejection of adjacent picture carrier
art. 136 art. 137 art. 138
The most unfavourable value for each of the broadcasting bands
4 Rejection of adjacent sound carrier
art. 136 art. 137 art. 138
5 Image-frequencyrejection
art. 146 art. 147 art. 138
6 Intermediate-frequencyrejection
art. 144 art. 145 art. 138
7 Oscillator position High or low
8 Tuning tolerance art. 47 art. 48 art. 51 As a function of time
9 Receiverradiation
As specified in CISPR Recommendation No. 24/2
10 Susceptibility of receiver to external interference
Under studyInterference not entering by the antenna
11 Intermediate- frequency values
See Table H
For the determination of the value of the intermediate frequency, see the example given in Doc. 44 of the African Broadcasting Conference, Geneva, 1963

4.2 Examples o f intermediate frequencies for television receivers
Rep. 625-1 115
TABLE II
No. of lines Country StandardChannel limits at
intermediate frequency (MHz)
Intermediate frequency (MHz)
in systemSound-channel Video-channel
405 UK A 33-40 to 38-40 38-15 34-65
525 USA M 41 to 47 0 41-25 45-75
525 Japan M 54 to 60 (2) (4) 54-25 58-75
Spain, Norway, Netherlands, Federal Republic of Germany, Sweden, Switzerland, Italy(2), Yugoslavia
B, G 33-15 to 40-15 33-40 38-90
625
U.S.S.R. and some OIRT countries
D, K 31-25 to 39-25 31-50 3800
France L 31-00 to 39-50 39-20 (3) 32-70 0
UK I 33-25 to 41-25 33-50 39-50
African countries (5) K l 33-45 to 41-45 33-70 40-20
819 France E 25-10 to 39-50 39-20 (3) 28-05 (3)
(*) According to Electronic Industries Association Standard Recommendation No. 109 C.(2) Protected bands.(3) According to Recommendation No. 103 of the Syndicat des Constructeurs d’appareils radio recepteurs et
televiseurs (SCART).(4) Television receivers, all channels (VHF and UHF).(s) Calculated from Doc. 44 of the African Broadcasting Conference, Geneva, 1963.
The multiplicity of values of the intermediate frequency is a cause of increased cost of receivers, particularly those suitable for frontier regions where countries use standards with different radio frequencies.
Reception of television programmes with different standards may require as many as five pairs of values of the intermediate frequency involving the same number of multi-standard receiver types.
4.3 Radio-frequency protection ratios (see item 2, Table I)
Protection ratio as a parameter for frequency planning is defined as the ratio of wanted to unwanted signal levels at the receiver input, required to produce a specified grade of picture (or sound) impairment. Protection ratio cannot, in general, be obtained from objective measurements made of the parameters normally used to define receiver performance, for example, selectivity, overload, etc., but can be obtained by subjective tests made in accordance with Recommendation 500-1. The value will depend, among other things, on the nature of the wanted signal (monochrome, PAL, SECAM, etc.), on the type of unwanted signal (television, sound, pure CW, etc.) and on the frequency separation. The tests should be made on the types of interference described in Recommendation 418-3 and Report 306-3, except for co-channel interference.

116 Rep. 625-1
The information should be presented in the form of graphs and/or numerical values showing the protection ratio observed for interference assessed as a Grade 4 impairment “Perceptible but not annoying” (Recommendation 500-1), as a function of frequency separation between the wanted and unwanted signals for each type of unwanted signal. Any dependence of the protection ratio on the wanted signal level should be indicated (owing to the non-linearity of the input stages). The graphs should cover frequency separation from zero to 1 or 2 channel widths above and below the wanted signal frequencies.
For frequency planning purposes the protection ratio figures so obtained are modified to take account of the grade of impairment that can be tolerated, bearing in mind the percentage of time the impairment will be suffered. For this purpose additional observations for more than one grade of impairment are valuable.
Protection ratios for image channel interference are also relevant to some aspects of international frequency planning and should be noted.
5. Results
5.1 The numerical values listed in Tables IV and V are mean values taken from an extensive series of objectivemeasurements, carried out in accordance with IEC Publication 107. Table III will need to be amended accordingly when the revised version is published.
The following tables are an example of how the numerical values of characteristics may be presented.

5.2 Principal characteristics
Rep. 625-1
TABLE III
117
Item Characteristic
Country
Italy UnitedKingdom(*)
1 Noise-limited sensitivity (dBm)
Broadcasting band I
IIIIV/V
12 GHz
O O-6 0-6 0-5 5 -65
2 Protection ratio (dB)
Broadcasting band I
IIIIV/V
12 GHz
3 Rejection of adjacent picture carrier (dB)
Broadcasting band I
IIIIV/V
12 GHz
(3)
-3 5-3 5-3 5 -5 6
4 Rejection of adjacent sound carrier (dB)
Broadcasting band I
III IV/V
12 GHz
(3)
-4 0-4 0-4 0 -43
5 Image frequency rejection (dB)
Broadcasting band I
III IV/V
12 GHz
(4)
-4 0-4 0-3 0 -51
6 Intermediate frequency rejection (dB)
Broadcasting band I
IIIIV/V
12 GHz
(s)
-3 0-3 0-4 5 -47
7 Oscillator position
Broadcasting band I
IIIIV/V
12 GHz| High High

118
TABLE III (continued)
Rep. 625-1
Item Characteristic
Country
Italy UnitedKingdom(*)
8 Tuning tolerance (kHz)
Broadcasting band I
III IV/V
12 GHz
± 350 ± 350 ± 350 ± 50
(7)
9 Receiver radiationBroadcasting band
IIII
IV/V 12 GHz
(6)
(6)
10 Susceptibility of receiver to external interference
Broadcasting band I
IIIIV/V
12 GHz
11 Intermediate frequency values
Broadcasting band I
III IV/V
12 GHz
1 See > Table I J (Item 11)
(See Table I)
(') For a luminance signal-to-unweighted noise ratio of 30 dB and a normalised output level.(а) IEC Publication 107, Clause 3.3.2.(3) IEC Publication 107, Clause 4.2.(4) IEC Publication 107, Clause 4.5.2.(s) IEC Publication 107, Clause 4.4.2.(б) See CISPR Recommendation No. 24/3,1970.(7) With automatic frequency control.(*) The following characteristics relate to System I colour television receivers [CCIR, 1974-78]

Rep. 625-1 119
6. Data relating to the receiving station
This section gives data on typical television antennae.
6.1 Antenna characteristics
For each of the channels to be received, the antenna characteristics to be considered are given in Table IV, which contains references to the relevant publications of the IEC.
TABLE IV
Characteristic Definition Measuringmethod Remarks
Number of elements See Note 1
Impedance (ohms) IEC Publication 138Gain in the nominal band (dB)
IEC Publication 138A Arts. 2.4 and 2.5 Art. 6.3
In relation to the halfwave dipole
Passband (MHz) Derived from the above characteristic.Tolerance on each usable channel ± 2 dB
Directivity pattern IEC Publication 138 Art. 2.7 Art. 3.3
Angle of aperture (degrees)
Measured on the main lobe of the directivity pattern, with a 3 dB attenuation in relation to the maximum (see Fig. 3 of Report 215-4)
Attenuation of the back lobe in relation to the main lobe
Measured on the directivity pattern (dB).
Cross polarization attenuation (dB)
Measured as in Note 2 with a linearly polarized emission
Note 1. — For a Yagi-type antenna, the radiating elements are conductors designed to be excited by the wanted transmission.
The following may be distinguished:— the driven element which supplies the wanted radio-frequency power through its two output terminals;— the directors which are situated between the main radiator and the transmitter to be received;— the reflectors which are situated behind the main radiator.
Other types of antenna may include plane or corner conductor systems. In that case, they will be describedbriefly.Note 2. — The cross polarization attenuation is not taken into consideration in IEC Publication No. 138. Until the IEC fills this gap, the measuring arrangement for the directivity pattern or gain should be used, and the attenuation obtained should be measured by turning the relative polarization through 90°, between the emission and the antenna.Note 3. — For each channel which can be received, the gain should be expressed in relation to the half-wave dipole.
6.2 Results
Typical values for the characteristics listed in Table IV are shown in Table V.

120
TABLE V
Rep. 625-1
Characteristic Country
Number of elements Broadcasting band I
III IV/V
France
238
41022
Impedance (*) (S2)Broadcasting band I
IIIIV/V
757575
300300
75
Gain in the nominal band (dB) Broadcasting band I
III IV/V
4(3)510
8(3)1216
Passband (MHz)Broadcasting band I
IIIIV/V
111580
81580
Angle of aperture Broadcasting band I
IIIIV/V
59(3)5846
52(3)3626
Back lobe attenuation (dB) Broadcasting band I
IIIIV/V
10>20>20
1632
>22
Cross polarization attenuation (dB)(2)Broadcasting band I
IIIIV/V
1520
>20
20>20>20
(*) The 300 £1 nominal values are reduced to the nominal value of the antenna system used.(a) As indicated in Note(s) to Table IV, further studies are still required on this subject. However, protection against a linearly
polarized wave, whose polarization plane is perpendicular to that of the antenna, should be greater than 20 dB. This limit only applies to reception in the main lobe of the antenna.
(3) In band I (lower part of band 8), the very high value of the ratio A /// makes typical values measured at the picture-carrier frequencies more significant.
REFERENCES
CCIR Documents[1970-74]: 11/260 (United Kingdom).[1974-78]: 11/55 (United Kingdom).
BIBLIOGRAPHY: ANTENNAE
CCIR Document [1974-78]: 11/104 (France).
BIBLIOGRAPHY: RECEIVERS
CCIR Documents[1970-74]: 11/260 (United Kingdom), 11/267 (United Kingdom), 11/346 (France), 11/328 (Italy).[1974-78]: 11/55 (United Kingdom).

Rep. 626-1 121
REPORT 626-1
SIMPLIFICATION OF SYNCHRONIZING SIGNALS IN TELEVISION
(Study Programme IE /11)(1974 - 1978)
Proposals have been made that the television synchronizing signal should be simplified firstly by reducing the number of equalizing pulses [CCIR, 1963-66; 1966-69; 1970-74a, b and c; Recommendation 472-1, note (5)] and secondly reducing the number of broad pulses [CCIR, 1970-74a and b]. Study Programme 1 E /1 1 requests investigation into the effect of reducing the number of equalizing pulses.
The simplification of the synchronizing signal leads to a simplification of synchronizing generators and also makes available more line-periods of the field-blanking interval for injecting test or measuring signals, standard reference frequencies [CCIR, 1970-74d], commercial information (e.g. facsimile transmissions), auxiliary audio signals for bilingual programmes, sub-titles for the deaf, remote control and supervision of unattended centres [CCIR, 1970-74b] or for the transmission of any other information.
Studies [CCIR, 1970-74d] have been made which indicate that, in the member countries of OIRT, the characteristics of the receivers are such that the “second” sequence of equalizing pulses may be completely eliminated without deterioration of the quality of line interlace and, furthermore, the number of equalizing pulses in the “first” sequence may be reduced to one of standard duration, according to Fig. 1. These results are confirmed by experiments [CCIR, 1970-74c] carried out in the U.S.S.R., not only upon receivers, but also upon monitors, radio-relay equipment, transmitters, video tape recorders and industrial television equipment. These experiments have also shown an improved performance with video tape recorders, receivers and other equipment containing flywheel circuits [CCIR, 1970-74c]. In the U.S.S.R., the use of a single pre-equalizing pulse and no post-equalizing pulses (Fig. 1) is permitted. However, the reduction in the number of broad pulses leads to impairment of interlace and other disadvantages, and thus has been proved unacceptable [CCIR, 1970-74c and d]. Following laboratory studies and experiments carried out in operational conditions by the OIRT [CCIR, 1974- 78a], it was decided to continue to investigate the possibility of simplifying synchronizing signals.
FIGURE 1
A : Single equalising pulse at the end of each second field B, C, D, E, F : broad pulses
Note. — Experiments mentioned in [CCIR, 1970-74a and b] examined effect of deleting broad pulses F and E and replacing them by line sync, pulses where appropriate.

122 Rep. 626-1, 627-1
Laboratory experiments [CCIR, 1970-74b] and field trials conducted in Italy [CCIR, 1974-78b] seem to indicate that one pre-equalizing pulse and no post-equalizing pulses are satisfactory for domestic receivers, provided that the single pre-equalizing pulse, situated in the middle of line number 625 (Fig. 1) has a duration of about 2.8 ps. The same set of experiments included tests in which not only was the number of pre-equalizing pulses reduced to one and the post-equalizing pulses absent, but also the number of broad pulses was progressively reduced from five to two (see Note to Fig. 1). It was found that with this form of field-synchronizing waveform, the number of broad pulses could, in the foreseeable future, be reduced to three without appreciable increase in receiver instability.
Experiments carried out in the United Kingdom [CCIR, 1970-74a] on monochrome and colour receivers with a pre-equalizing pulse in the middle of line number 625, no post-equalizing pulses and only three broad pulses (Fig. 1 and Note), revealed that a small but significant number of receivers suffered impairment of interlace, probably due to the 2.5 ps duration of the single pre-equalizing pulse operating upon receivers having integrators with a time-constant less than 100 ps. The reduced number of broad pulses (three) also produced a tendency for the “vertical hold” controls of some receivers to require more critical adjustment.
REFERENCES
CCIR Documents[1963-66]: XI/115 (United Kingdom);[1966-69]: X I/55 (U.S.S.R.);[1970-74]: a. 11/266 (United Kingdom); b. 11/309 (Italy); c. 11/340 (U.S.S.R.); d. 11/34 (OIRT);[1974-78]: a. 11/53 (OIRT); b. 11/423 (Italy).
BIBLIOGRAPHY
CCIR Documents[1970-74]: 11/84 and Corr.l (OIRT).
REPORT 627-1
MINIMUM POWER FLUX-DENSITY FOR PLANNING A TERRESTRIAL TELEVISION SERVICE IN THE 12 GHz BAND (BAND VI)
(Recommendation 417-2)(1974 - 1978)
1. Introduction
Experimental amplitude modulation terrestrial television broadcasting systems in the 12 GHz band have been set up in the Federal Republic of Germany, in the Netherlands, and in Switzerland for system G, and in Japan for system M.
The frequency converters used at the receiving points in all cases have only to change the frequency from Band VI to a frequency within Bands IV and V. The converters have been mounted directly behind the parabolic reflector, giving rise to negligible feeder loss. The experiments have shown that a converter noise figure of 7 to 10 dB can be realized without excessive cost. Experience gained with the installation of the converters in different parts of the coverage area, urban areas as well as rural areas, has led to the conclusion that considering mounting facilities, beamwidth and influence of wind, an antenna diameter of 40 to 60 cm could be used.
Measurements in urban regions in Tokyo have shown that the picture quality, if echo disturbance is present, is better than grade 4 in the 5-grade scale, (Recommendation 500-1) where the field-strength is sufficiently high, i.e. the picture quality influenced by noise is better than grade 3, or the field-strength is not more than 20 dB below the free space value. This performance can be achieved by using a parabolic reflector receiving antenna of at least 40 cm diameter and a frequency converter having a noise figure of 6 dB. For mass production of converters, however, a noise figure of 8 dB seems to be more feasible.
For FM television systems only limited information is available. Further studies are therefore required.
2. Calculation of the minimum power flux-density
At frequencies above 1 GHz it is common practice to use the power flux-density, expressed in W /m 2, as a measure for the signal strength.
The signal strength in this band has been calculated taking account of the above considerations and of the necessity of having a figure for the planning of a terrestrial amplitude-modulation broadcasting network in Band VI.

Rep. 627-1 123
In the following Table I the characteristic parameters for the calculation of the minimum power flux-densities are given, derived from the experimental systems mentioned above.
The power flux-density O (dB(W/m2)) at the receiving point is given by:
O = F + 10 log kTB + (S / N ) rf - 10 log a dB(W/m2) (1)
TABLE I
Television system G(FRG)
G(HOL)
G(SUI)
M(J)
G/FM(SUI)
Noise figure of converter (dB) F 10 7 9 8 9
Radio-frequency signal-to-noise ratioat input to television receiver (dB)
(S/N)r f 43(‘) 36 40(2) 36 1 9 0
Diameter of parabolic reflector (m) D 0.6 0.6 0.6 0.4 0.6
Efficiency of antenna (%) h 50 50 50
Miscellaneous losses in reception (misalignment etc.) (dB)
L 2
Antenna gain (dB rel. isotropic radiator) G 34.5 34.5 34 31 34
Effective antenna area 10 log a (a in m2)
A -8 .5 -8 .5 -1 4
10 log k T B (dBW) —137(4) —137 (4) -1 3 6 .2 (5)
Minimum power flux-density (dB(W/m2)) P —75.5 —85.5 -8 0 -7 8 .2 -101
O (S/N)r f at the edge of the service area when using an antenna with a cosecant vertical pattern producing the same field- strength in the entire service area.
(2) Corresponds to grade 4.5 of Recommendation 500-1.(3) (S/N )ppat receiver input; modulation index m — 1.(4) Noise bandwidth B = 7 MHz.(s) Noise bandwidth B = 6 MHz.
The proposed minimum power flux-densities for a satisfactory grade picture at the receiving antenna range from —85.5 dB(W/m2) to —75.5 dB(W/m2). The differences in the values are due to different assumptions for the picture quality, the receiver noise performance and the receiving antenna gain, as shown in the Table.
3. Effect of interference
In planning a terrestrial network, interference can be a factor which determines the required flux-density of the wanted signal. Methods of calculating field-strength or transmission loss which are of interest for assessing interference probabilities are indicated in Reports 562-1 and 569-1.
BIBLIOGRAPHY
SAITO, T. et al., [1977] Propagation characteristics of the 12 GHz band in urban areas. NHK Laboratories Note, Serial No. 215.
CCIR Documents[1974-78]: 11/22 (Switzerland); 11/34 (Japan); 11/156 (Germany, (Federal Republic of)); 11/172 (The Netherlands); 11/308
(Japan).

124 Rep. 805
REPORT 805
SUBJECTIVE QUALITY TARGETS OF OVERALL TELEVISION SYSTEMS *
Characteristics of reference receiving installations (Question 14-1/11 and Study Programme 14B/11)
(1978)1. Introduction
Many characteristics of television receivers may be defined together with methods of measurement and practical values. Question 14-1/11 and Study Programme 14B/11 call for the study of the principal characteristics of television receiving installations which may be required in meeting the necessary subjective quality targets for an overall television system.
The quality of the picture displayed and of the sound heard depends on characteristics of the complete television system from the studio to the receiver screen or loud-speaker, and in this context the main parameters of a television receiver, other than those primarily involved in frequency planning, may be of interest. The CCIR has collected a great deal of data which is embodied in various Recommendations and Reports, but much of this has been rendered obsolete by the development of receiver design techniques.
Table I of § 4 of this Report lists technical parameters which contribute to the determination of overall picture quality. Table II of § 5 gives typical measured values by way of example.
The definition of these characteristics, the measuring method applied and the presentation of the results in Table I should be taken, where available, from IEC Publication 107-1 and from Document 12A (Central Office) 98, and are provided purely for information purposes, since this latter document is provisional and still incomplete. These Tables will need to be amended accordingly when the revised version is published.
It is important that CCIR definitions of receiver performance characteristics should not contradict those of the IEC. Where this occurs, action should be taken by both organizations to resolve the difference.
Attention is drawn to the importance of effective participation by the CCIR representatives in IEC work, especially in the field of definitions and methods of measurement of television receiver characteristics (Sub- Committee 12A). This information is important for planning and for achieving satisfactory quality targets in an overall television system, from picture source to receiver.
Table I relates only to monochrome receivers. The characteristics of colour receivers will be added at a later stage.
2. Categories of receivers
2.1 Overall picture quality should take into consideration the category of receivers which will be used in thebroadcasting system envisaged.
It is proposed that data recorded, in future, for this report should relate only to the mean values of characteristics for receivers that are typical of good, current engineering practice in the country in question. This is to avoid undue influence being exerted on future planning standards by receiver designs at the extreme upper and lower ends of the performance range.
A reference receiver could be defined taking into account the mean values and possible appropriate amendments to them.
2.2 Receivers for direct satellite broadcasts
No practical data are yet available. However, references are given below in which the results of the many studies on the subject may be found:
Report 473-2, [CCIR, 1974-78a, b].
3. Receiving antennae
The numerical values of antennae characteristics contained in Recommendation 419 and Reports 122-2 and 482 relate to antennae in situ. Only data relating to the directivity, forward gain and cross-polarization protection of antennae tested under idealized conditions in a suitable site need be recorded.
The necessary definitions and measuring methods are contained in IEC Publication 138, which is now being revised.
Additional data on antenna characteristics can be found in Report 625-1.
Information on specifications for low-cost monochrome television receivers is to be found in Report 483-2. Information on the characteristics o f television receivers and receiving antennae is to be found in Report 625-1.

4. Characteristics contributing to overall reception quality
Rep. 805 125
TABLE I
Item Parameter
Reference IEC Publication 107-1
Remarks
Definition Measuringmethod
Presentation of result
1 Passband (radio frequency and intermediate frequency)- video (MHz)- sound (kHz)
art. 136 art. 137 Under consideration
art. 138
For an attenuation o f 0 dB rel. to vision carrier
2 Maximum luminance white (cd/m2 )
2 .4 .1 0 2 .4 .1 .20 2 .4 .1 .3 0 For a black level of 2 cd/m2. The point at which the bars corresponding to.... MHz are no longer visible
3 Pictureresolution (lines)
2.6 .1 0 2.6 .2 0
4 Interlace ratio (%) art. 99
5 Geometrical picture distorsion (%)
art. 78 art. 79 art. 80 Total distortion
6 Scanning non- linearity (%)
art. 73 art. 74 art. 75
7 Sound: amplitude/ frequency response (Hz)
art. 27(2) art. 28(2) art. 29(2) Overall electrical characteristics
8 Maximum sound output power (W)
art. 17(2) art. 18(2) art. 19(2)
9 Inter-channelrejection— vision into
sound (dB)- sound into
vision (dB)
art. 45 or 51(2)
art. 151
art. 46 or 52(2)
art. 152
art. 47 or 53(2)
10 Maximum usable input signal (dBm)
art. 132 art. 133 The most unfavourable value for each broadcasting band
O These characteristics have not yet been taken into consideration by the IEC for inclusion in the new edition. It is proposed that the articles of IEC Publication 107, as indicated above, should be used as provisional references.
(2) Ref. IEC Publication 107-2, at present IEC Doc. 12A (Central Office) 98.

126 Rep. 805
5.1 The numbered values listed in Table II are mean values taken from an extensive series of objectivemeasurements.
TABLE II
5. Results
Country
Item Parameter Italy
1 Selectivity (dB)
VideoBroadcasting band I
IIIIV/V 12 GHz
SoundBroadcasting band I
IIIIV/V 12 GHz
0 )
- 6(2)
-2 6
2 Maximum luminance white (cd/m2)
(3)100(4)
3 Picture resolution (lines) 320(s)
4 Interlace ratio (%) 40/60(6)
5 Geometrical picture distorsion (%) 3 0
6 Scanning non-linearity (%) 5 to 8(‘)
7 Sound-amplitude/ frequency response (Hz)
120 to 7000(9)
8 Maximum sound output power (W)
1, 2( ‘°) 2
9 Inter-channel rejection Vision into sound (dB) Sound into vision (dB)
(" )-3 0-4 0
10 Maximum usable input signal (dBm)
-3 0
O Measurements carried out in accordance with IEC Publication 107, Clause 4.2(2) Rejection values for 4 MHz(3) Measurements carried out in accoriance with IEC Publication 107, Clause 2.4.1(4) For a black level of 3 cd/m2 (for a picture tube without a grey filter)(s) Measurements carried out in accordance with IEC Publication 107, Clause 2.6O Measurements carried out in accordance with IEC Publication 107, Clause 2.9O Measurements carried out in accordance with IEC Publication 107, Clause 2.3.3(*) Measurements carried out in accordance with IEC Publication 107, Clause 2.3.2 and for ± 3 dB relative to 1 000 Hz(9) Measurements carried out in accordance with IEC Publication 107, Clause 12.3(10) Measurements carried out in accordance with IEC Publication 107, Clause 13.2.5The power value of 1.2 W corresponds to a tube whose diagonal is < 51 cm (20 in.) and the power value of 2 W corresponds to
a tube whose diagonal is > 51 cm (20 in.)( “ ) Measurements carried out in accordance with IEC Publication 107, Clauses 4.8.2.3 and 4.8.2.5.

Rep. 805, 806 127
REFERENCES
CCIR Documents[1974-78]: a. 11/143 (ESA); b. 11/315 (EBU).
BIBLIOGRAPHY
CCIR Documents[1970-74]: 11/346 (France); 11/328 (Italy).
REPORT 806
TEST CONDITIONS AND MEASUREMENT PROCEDURES FOR THE DETERMINATION OF PROTECTION RATIOS
Terrestrial broadcasting service (television)(Study Programme 4B/11)
(1978)
For the terrestrial service, the same guidelines are proposed as those in Report 813 * with the exception that the level of interference for mean grade 3 should be used for interference occurring for a small percentage of time (1% to 10%) and mean grade 4 may be used provisionally for continuous interference. Administrations are invited to study this matter taking into account the specific conditions relevant to the terrestrial services.
* See Vol. XI, p. 300.

PAGE INTENTIONALLY LEFT BLANK
PAGE LAISSEE EN BLANC INTENTIONNELLEMENT

Rep. 629-1 129
SECTION I1E: TELEVISION SYSTEMS USING DIGITAL MODULATION
REPORT 629-1
TELEVISION SYSTEMS USING DIGITAL MODULATION
(Question 25-1/11, Study Programmes 25A/11, 25B/11)(1974 - 1978)
1. Introduction
The CCITT is studying the transmission standards to be used for future telecommunications networks employing digital methods and is considering, among the various types of signals, the baseband signal for broadcast television.
The CMTT, which is concerned with the transmission of television and sound signals over long distances, is studying possible digital coding methods, digital standards and monitoring methods which are suitable for such purposes.
The work of Study Group 11 is directed towards the coding methods, error protection strategies, digital standards and monitoring methods which are suitable for all the processes carried out on the picture signals and the associated sound signals within a studio complex (i.e. an area containing cameras, film scanners, video tape recorders, etc.), and for the purposes of direct broadcasting from terrestrial transmitters and from satellites.
Nevertheless, circumstances may arise (e.g. during the period when long-distance transmission chains contain both analogue and digital sections), when digital coding (and possibly redundancy reduction) is carried out both in the studio complex and in the long-distance transmission chain. Under such circumstances it is considered important that close co-operation be maintained between Study Group 11 and the CMTT.
To enable studies of coding methods to progress and to lead to fully satisfactory picture quality, information is urgently required which will permit the definition of a complete hypothetical reference chain from the output of the originating electronic picture source to the broadcast transmitter or, in the case of direct digital broadcasting, to the receiver. It is noted that the CMTT is already studying the hypothetical reference circuit for long distance transmission, but information on the number of coding and decoding operations in other parts of the complete chain is urgently required.
It is also considered important that the requirements of digital television are given due weight when the nature and performance of future integrated digital networks are being determined.
Further, the standardization of digital equipment interfaces for use within studios is urgently required.
2. Basic principles
Two different approaches to the coding problem have been proposed. In one, the composite colour signal (NTSC, PAL or SECAM) is coded in its composite form, while in the other, it is first separated into its luminance and colour-difference signal components, if the signal is not already available in this form. These are then digitally coded separately and transmitted as separate bit streams time-multiplexed together.
The first method is claimed to have advantages when, as is likely to happen during the period over which digital techniques are being introduced in broadcasting, the complete chain contains several digital and analogue sections in cascade. The second method is claimed to have advantages over the first in the cases where there are only a few digital and analogue sections in tandem, and also at a later stage in the introduction of digital techniques when it becomes possible for the signal to be transmitted in digital form all the way from the source to the receiver. Alternatively, the signal may be converted to the composite colour signal before broadcasting. Thus, at least for transmission purposes, the differences between NTSC, PAL and SECAM would disappear with a consequent simplification of the problems of the international exchange of programmes [CCIR, 1974-78a], except when different scanning standards are involved. In the case of countries using 625-line scanning standards, proposals for compatibility between the composite and separate-component coding approaches are beginning to emerge [CCIR, 1974-78j], and further studies are required.
In determining the digital standards to be used in studios it is important that account should be taken of the digital hierarchies being standardized by the CCITT as well as of digital framing structures, error correction systems and organization of the multiplex used for long distance transmission [CCIR, 1974-78k].
In [CCIR, 1974-781], the EBU recommends that, for programme exchanges between its members, a signal based upon the separate coding of the luminance and colour information signals be used.*
In the same document, the EBU states that the bit-rate of 34.368 M bit/s is the desirable objective for these exchanges.
The colour information signals are not necessarily the same as the components normally associated with a PAL or SECAM signal, but they can easily be derived from them.

130 Rep. 629-1
3. Coding methods
The initial processes in all digital coding methods which are under study are sampling and quantizing.
3.1 Bandwidths and sampling
The sampling process is determined by three basic factors:— the sampling structure, i.e. the relative position of the samples in space and time;— the number of samples per line;— the filtering process, which may be one-, two-, or three-dimensional.
The sampling structure mentioned above may, or may not, be repetitive with respect to the picture.Likewise, the number of samples per line may, or may not, be constant from line to line.
The classical theory requires the sampling frequency to be equal to or greater than, twice the highest signal frequency, i.e. Nyquist sampling. However, studies have shown that lower sampling frequencies (i.e. sub-Nyquist s |Tipling) can be used in practice. [Messerschmid, 1969].
3.1.1 For composite signals
The EBU [CCIR, 1974-781] suggests that for those countries digitally coding the composite PAL signal, a sampling frequency equal to either four times or twice the PAL sub-carrier frequency (fsc) should be used, and the sampling phase with respect to the sub-carrier specified.
The sub-Nyquist technique can be applied by sampling the PAL composite signal at a rate of twice the sub-carrier frequency [Devereux and Phillips, 1974]. The digital codec employing such sampling uses filtering which introduces minor losses of diagonal luminance resolution and vertical chrominance resolution. However, further filtering of this nature in any subsequent sub-Nyquist sampling process should not cause any further resolution impairment [Stott and Phillips, 1977].
The Doc. [CCIR, 1974-78m] proposes that a basic sampling frequency of 4 fsc be used in the PAL studio and suggests this should be further studied. However, where a lower bit rate is required sampling at 2 fsc is recommended; the document includes proposals for the parameters of such a digital signal.
For system M/NTSC there is a tendency to use a sampling frequency of three or four times the colour sub-carrier frequency. However, [CCIR, 1974-78n] describes studies of a coding system which uses a sampling frequency that is an integer multiple of line frequency, resulting in a sampling structure shown in Fig. la. The sub-Nyquist sampling technique has also been used with NTSC signals [Rossi, 1976].
• --------------- • ----------------• — —• ----------------• --------------• -------
- # ------------------------ + - --------------------- • # -------------- 4
- • • • • — • • <
# * - 0 - ♦ ------
• -----• • - - • ----------------• --------------• -------
« - » + ♦ - • -(
a Orthogonal structure b Line-interleaved structure
FIGURE 1 - Sampling structures
3.1.2 For component signals
The EBU [CCIR, 1974-781] suggests that those countries digitally coding the separate components should use a sampling structure repetitive from picture to picture. This approach is supported by [CCIR, 1974-78o]. Repetitive sampling structures may be either orthogonal (Fig. la) [CCIR, 1974-78p] or interleaved. Subjective tests comparing various repetitive structures are reported in [CCIR, 1974-78q]. A line-interleaved structure (Fig. lb) for coding the luminance component and an orthogonal structure for coding the colour difference signals are recommended in [CCIR, 1974-78r] and used in a codec described in [CCIR, 1974-78s].

Rep. 629-1 131
In both studies, 462 samples per active line are used for the luminance component for reasons of compatibility with the composite PAL signal. For the colour difference signals, 231 samples per active line are proposed in [CCIR, 1974-78t] studio applications, and in [CCIR, 1974-78s], 114 samples per active line where a lower bit rate is required.
Studies have been carried out on the filtering method to be applied to the luminance and colour difference signals before and after digital coding. Preliminary results are reported in [CCIR, 1974-78u, v, w].
Proposals for the parameters of a component sampling process are included in [CCIR, 1974-78r].
3.1.3 Compatibility between composite and component signals
In [CCIR, 1974-781] the EBU draws attention to the need for compatibility between the proposed methods for composite and component coding of 625-line signals.
A system is described, in [CCIR, 1974-78j] in which the composite PAL signal is sampled at four times sub-carrier frequency, and which provides luminance and colour information signals that are similar to those used for separate-component coding. These luminance and colour signals can be recombined to provide a composite PAL signal which is almost identical to that at the input. The system can also accept separate-component signals and provide either composite PAL signals or luminance and colour signals that are similar to the input signals; however, this system does not provide luminance and colour signals that are sampled in the manner preferred by the users of separate-component coding methods.
Furthermore, compatibility considerations have been taken into account when designing some of the above mentioned component sampling processes [CCIR, 1974-78s, r]. It appears in particular, that the value of 1136 as a generating frequency for component coding is so close to four times the PAL sub-carrier frequency, * that relatively simple processing will enable signals coded in composite form to be converted to those coded in the separate-component form and vice versa.
3.1.4 Change o f sampling frequency
Within a given system (using either composite or component coding) it may be necessary to change the sampling frequency.
A method is described in [CCIR, 1974-78x] which may be used with system M /NTSC for changing the sampling frequency from 4 to 3 times the NTSC sub-carrier frequency and vice versa.
In [CCIR, 1974-78m], which proposes the possible use of two sampling frequencies in the digital PAL studio, it is pointed out that a signal sampled at 4 fsc may be very easily converted to a signal sampled at 2 fsc and vice versa. However, when the sampling frequency is changed from 2 fsc back to 4 fsc the minor impairments associated with 2 fsc sampling remain; nevertheless, the effect upon resolution is not cumulative.
3.2 Linear PCM
The basic form of digital coding is linear PCM, where the value of each digital “word” represents the uniformly quantized amplitude of a sample of the baseband signal [CCIR, 1970-74a and b].
Preliminary results of an experiment using 7 PCM codecs in cascade when coding NTSC composite signals are presented in [CCIR, 1974-78y].
3.3 Bit-rate reduction methods
In order to minimise the bit-rate of digital signals, various techniques have been evolved and a comprehensive review of methods of coding colour television signals, including methods of bit-rate reduction, has been recently published [Limb et al.t 1977].
3.3.1 Non-linear PCM
In the case of separate-component coding, studies indicate that it may be advantageous to use non-linear PCM coding for the colour-difference signals [CCIR, 1974-78g and z]. Such methods may also be exploited to render the visibility of quantizing errors more uniform throughout the colour space.
3.3.2 Differential PCM (DPCM)
In DPCM the value of each digital word is related to the difference between the amplitude of a baseband-signal sample and a prediction which is based upon the preceding sample or upon a set of previous samples.
DPCM has been successfully applied to both the NTSC and PAL composite signals in digital form [CCIR, 1970-74a; Devereux and Phillips, 1974; CCIR, 1974-78n, aa].
* 4 fsc = 1135 fH + 4 fp (for definitions o f fH and fp see Recommendation 472-1).

132 Rep. 629-1
DPCM has also been successfully applied separately to the luminance signal and to the two colour-difference signals [CCIR, 1970-74b; 1974-78c, d, e, f and p]. A system is described in [CCIR, 1974- 78s] in which DPCM is applied to the luminance signal and to two other signals (U + V, U — V) that are derived from the colour-difference signals [Heitmann, 1976]. A system is described in [CCIR, 1974-78p] in which the digitized separate-component signals are time-multiplexed to form one signal, that is then converted to the DPCM form.
Studies are now being carried out to optimize the non-linear quantization used in the DPCM coder; these studies are based upon psycho-visual measurements [Kretz et a i, 1977].
3.3.3 Transform coding
In transform coding the digital equivalent of the baseband signal (e.g. in the PCM form), or the baseband signal itself, is segmented into blocks which undergo, in turn, a linear transformation to provide a further signal. This latter signal may have advantages with regard to bit-rate reduction or error susceptibility. The transformed signal, in coded form is passed through the digital chain and, at the output, is transformed back into the original form.
Transform coding has been applied to the composite NTSC signal [CCIR, 1970-74b, 1974-78i] the latter reference describing a system using a two-dimensional Hadamard/Slant transform having 4 rows of 8 elements with separate non-uniform quantization of the 32 transform coefficients. A comparison between the results obtained using, on the one hand, a simple one-dimensional Hadamard transform and, on the other hand, DPCM with two-dimensional prediction, indicated that DPCM may have advantages when coding composite PAL signals [CCIR, 1974-78aa]. Further study is required.
The application of transform coding to the luminance component of the separate components signal is described in [CCIR, 1974-78ab; Motsch, 1977]. Good results were obtained using a Hadamard transform block consisting of four rows each containing four elements. The system employed adaptive coding of the transform signal. This approach could provide an alternative to DPCM when using a separate-components signal.
3.3.4 Entropy coding
Entropy (statistical) coding is applied to signals already in digitally coded form and relies upon the principle whereby short code words are allocated to the more frequently occurring values, and longer code words are allocated to those values that occur less frequently.
This form of coding produces a variable rate of data flow and necessitates the use of buffer storage in order to smooth the flow. If the buffer storage is insufficient, overflow can occur and additional impairment of the signal will result, but the probability of this occurring can be made very small by suitable design.
A simple form of entropy coding has been used to reduce further the bit-rate of the DPCM signal representing the composite NTSC signal [CCIR, 1974-78n]. In this arrangement the buffer store had a capacity corresponding to one and one half television line periods.
A similar form of entropy coding was applied to the NTSC signal in the separate-component form [CCIR, 1974-78p].
Entropy coding has also been applied to the transform signal representing the luminance component of a separate-component signal [CCIR, 1974-78ab; Motsch, 1977].
4. Error protection
It is generally acknowledged that, in the digital studio complex, video recording will present the most serious error-protection problem. In [CCIR, 1974-78ac] some preliminary thoughts concerning digital magnetic tape recording are reported. In this document, taking into account the possible performance of digital video tape recorders, it is considered that it will probably be necessary to employ error protection methods to ensure acceptable picture quality. Implementation of error protection methods involves error detection and error correction * and/or error concealment **.
* Error correction consists of restoring the original lost information by use o f encoding procedures which require a degree of redundancy.
** Error concealment consists of replacing the original lost information by approximate but not completely accurate information.
Rep. 629-1 133
The quality of the digitally recorded television signals depends, among other factors, upon the number of:— undetected errors per unit time,— concealed errors per unit time,and the maximum values of both should be specified.
The document also draws attention to the error pattern, mainly bursts, which may occur in digital magnetic recording due to imperfections in the recording medium. Furthermore, the document points out that the effectiveness of the error concealment system will be strongly dependent upon the choice of coding technique and recording format.
5. Measurements
In general the picture impairments introduced in digital television systems are quite different from those introduced in analogue systems. Impairments may be caused by the coding equipments or by degredations of the digital signal, such as errors, jitter and slips. The former may be picture dependent.
5.1 Subjective assessment
At present subjective assessment is the only technique useful in practice for the evaluation of digital television systems and it is therefore important that the method used should be in accordance with Recommendation 500-1 and as suggested in Reports 313-4 and 405-3. Special attention should be paid to the choice of picture material. For example, in [CCIR, 1974-78,ad], the use of pictures involving either linear or rotational movement is proposed. This document also suggests that slow periodic fluctuations in picture signal amplitude may be useful.
5.2 Objective measurements
Studies are in progress to define objective parameters, measurements of which could be related to the subjective impairments [CCIR, 1974-78b; Kretz, 1977]. One approach consists of considering separately the various impairments which may affect different types of picture information (e.g. plain areas, contours, fine details). This has been applied to DPCM coding impairments [Kretz et al., 1977].
Combinations of analogue and digital equipments will continue to be employed in studios before all-digital studios come into operation. In this interim period the video signal will undergo a number of analogue-digital-analogue conversions. Each conversion in either direction is a potential source of picture impairments.
Present analogue test methods are suitable for many measurements of mixed analogue-digital-analogue signal paths in studios, but it is recognised that some measurements provide results which are made unreliable by digital signal processing.
New test signals to ease these difficulties have been proposed. The Doc. [CCIR, 1974-78ad] suggests the use of a sine-squared pulse of half-amplitude duration somewhat less than half the active line period, with superimposed colour sub-carrier, as a test signal for the measurement of quantization noise [Krivosheev, 1976].
The Doc. [CCIR, 1974-78ae] proposes a line-duration sawtooth signal with superimposed colour sub-carrier for the measurement of differential gain and differential phase.
The Doc. [CCIR, 1974-78ad] suggests that in digital television systems using redundancy reduction techniques, it is advisable to use test signals which may include changes in position and/or amplitude from line to line, field to field, or picture to picture, according to a predetermined pattern, so as to produce a signal which bears a statistical resemblance to typical television signals.
REFERENCES
DEVEREUX, V. G. and PHILLIPS, G. J. [1974] Bit-rate reduction of digital video signals using differential PCM techniques. IEE Conference Publ. No. 119, 83-89.
HEITMANN, J. [1976] Ein systemkompatibles digitales Farbfemsehsignal (System-compatible digital codec for 625-line colour television). Rundfunktecbn. Mitt., Vol. 20, 6, 236-241.
KRETZ, F. [October, 1977] Objective criteria o f the subjective quality of television signals in digital modulation; methodology and application to optimisation; examples. URSI Symposium on telecommunication measurements, Lannion, France.
KRETZ, F., BOUDEVILLE, J. L. and SALLIO, P. [September, 1977] Optimization o f DPCM video coding scheme using subjective quality criteria. Proc. o f IERE Conference No. 37.
KRIVOSHEEV, M. I. [1976] Osnovy televisionnykh izmerenii. (The basis o f television measurements). Sviaz Izd. Moskva, U.S.S.R.
LIMB, J. O., RUBINSTEIN, C. B. and THOMPSON, J. E. [1977] Digital coding o f colour video signals - a review. IEEE Trans. Comm., COM-25, special issue.

134 Rep. 629-1
MESSERSCHMID, U. [1969] Bandbreitenreduktion bei der Femsehubertragung durch Verringerung der Abtastfrequenz (Bandwidth reduction for television transmission by reducing the sampling frequency). Nachrichten Techn. Zeitschr., Vol. 22, 9, 515-521.
MOTSCH, R. [September, 1977] Adaptative bit-rate reduction by Hadamard Transform. Proc. o f IERE Conference No. 37.
ROSSI, J. P. [January, 1976] Sub-Nyquist encoded NTSC colour television. J. SMPTE 85.
STOTT, J. H. and PHILLIPS, G. J. [1977] Digital video: multiple sub-Nyquist coding. BBC Research Department Report No. 1977/21.
CCIR Documents
[1970-74]: a. 11/246 (United Kingdom); b. 11/298 (Japan).
[1974-78]: a. 11/64 (France); b. 11/65 (France); c. 11/94 (Germany (Federal Republic of)); d. 11/36 (Japan); e. 11/63 (France); f. 11/96 (France); g. 11/93 (Germany (Federal Republic of)); h. 11/147 (U.S.S.R.); i. 11/37 (Japan); j. 11/342 (United Kingdom); k. 11/359 (Japan); I. 11/374 (EBU); m. 11/410 (United Kingdom); n. 11/314 (Japan); o. 11/354 (France); p. 11/317 (Japan); q. 11/356 (France); r. 11/438 (France); s. 11/353 (Germany (Federal Republic of)); t. 11/355 (France); u. 11/349 (United Kingdom); v. 11/352 (Germany (Federal Republic of)); w. 11/356 (France); x. 11/329 (USA); y. 11/331 (USA); z. 11/357 (France); aa. 11/336 (United Kingdom); ab. 11/358 (France); ac. 11/414 (France); ad. 11/409 (U.S.S.R.); ae. 11/330 (USA).

Rec. 265-3 135
SECTION 11F: RECORDING OF VIDEO PROGRAMMES
Recommendations and Reports
RECOMMENDATION 265-3
STANDARDS FOR THE INTERNATIONAL EXCHANGE OF MONOCHROME AND COLOUR-TELEVISION PROGRAMMES ON FILM
(1956 - 1959 - 1963 - 1966 - 1970 - 1974)The CCIR
UNANIMOUSLY RECOMMENDS
that the films used for the international exchange of television programmes should meet the following definitions and standards:
1. Definitions
The types of film referred to in this Recommendation are designated by code words as defined below. The code words should be placed on the identification leader of any film intended for international exchange of programmes and should be used in any related correspondence. The code word consists of a letter and a number (or numbers) followed by a two- or three-syllable word, for example: C 35 COMOPT.
The first letter indicates either monochrome, B, or colour, C, film type. The number, usually 16 or 35, indicates the nominal width of the film in millimetres. The first syllable indicates either a combined sound and picture recording, COM, or separate sound and picture recording, SEP. The last syllable indicates whether the sound recording is magnetic, MAG, or optical, OPT:— 35-mm colour film with an optical track is C 35 COMOPT;— 16-mm monochrome film with a magnetic stripe is B 16 COMM AG;— 16-mm colour film with sound on a separate magnetic film, having one or more tracks, is C 16 SEPMAG.1.1 For picture films without sound, the designation is MUTE, for example: B 16 MUTE.1.2 If the picture and the sound films have the same width, this is indicated by a single number. If not, then two numbers separated by an oblique stroke are used, the first indicating the width of the picture film, for example:— 35-mm picture film with magnetic sound track on 16-mm film is 35/16 SEPMAG.
2. Types of film s recommended for international exchange of television programmes
2.1 The international exchange of recorded television programmes on monochrome and colour (types Band C) films should be effected by means of one of the following types:
1 - 35 COMOPT2 - 1 6 COMOPT3 - 1 6 COMMAG4 - 1 6 SEPMAG (the tracks used should be specified)5 - 3 5 MUTE6 - 1 6 MUTE7 - 3 5 COMMAG8 - 3 5 SEPMAG (the tracks used should be specified)An identification of the tracks utilized must be added after the word SEPMAG.For example: in 35 mm film SEPMAG (tracks 1 and 2)
or SEPMAG (track 1) or SEPMAG (tracks 1 and 3)
etc.in 16 mm film SEPMAG (edge track)
SEPMAG (both tracks) etc.
As indicated in § 4.3, there are at present four different sound track formats for 16 SEPMAG recording, namely:— the 5.1 mm (0.2 in.) centre track— the 5.1 mm (0.2 in.) edge track— the 4 mm (0.157 in.) centre track— the 4 mm (0.157 in.) edge track
Recordings made in conformity with any of the listed 16 SEPMAG formats may be exchanged without previous agreement.

136 Rec. 265-3
2.2 Films of types 7 and 8 cannot be exchanged unless there is agreement between the organizationsconcerned.Note. — Although the quality of sound obtainable with 16 COMOPT films is marginal, this type cannot be excluded because of its widespread use. A reduction of the number of recommended types of sound recordings appears to be impossible at present.2.3 The fundamental technical parameters of each type listed in § 2.1 should conform to the standards givenbelow.
3. Standards common to all types of film
3.1 Safety film must be used.3.2 Normally the image on the film should be a photographic positive.3.3 The picture (frame) frequency should be either 25 or 24 per second. The picture frequency shouldaccompany any reference to programme duration.3.4 For accurate reproduction of films in television systems some limitations should be placed on the filmdensity range. In colour systems the colour balance of films should also be defined.
All film densities specified below are measured in singly-diffused light.The spectral characteristic of the densitometer should conform with ISO * Recommendation R5-1955 for
diffuse visual density, Type VIb.3.4.1 For monochrome film the density corresponding to television white level should be 0.3 to 0.4 butin the case of dyed-base film the total density corresponding to television white level should notexceed 0.5.Note. - Television white level preferably corresponds to a fully-lit object in the scene, having a reflectance of about 60%. This results in reproduction of fully-lit human faces having reflectances of about 15% to 35% at film densities between 0.2 and 0.5 greater than the density corresponding to television white level.
The maximum density of a film is determined by the scene contrast and the film transfer characteristic. The gradation in areas in the film having densities in excess of 1.6 above that corresponding to white level may be distorted or lost entirely.3.4.2 For colour film the density corresponding to television white level should be 0.3 to 0.4.Note 1. — Television white level preferably corresponds to a fully-lit object in the scene, having a reflectance of about 60%. This results in reproduction of fully-lit human faces having reflectances of about 15% to 35% at film densities between 0.2 and 0.5 greater than the density corresponding to television white level.
The maximum density of a film is determined by the scene contrast and the film transfer characteristic. Shadow areas, in which the reproduction of detail is not essential to the picture, may have densities in the range of 2.0 to 2.5, but it must be recognized that in such areas both image gradation and colour may be distorted or lost entirely. The density range for optimum colour reproduction is expected to be between 0.5 and 1.7.
Since the white point of colour television systems is either CIE ** Illuminant C or CIE Illuminant D65, adequate prints of both 35 mm and 16 mm colour films may be obtained if the print is balanced for projection by an illuminant approximating in spectral distribution to a black body of a colour temperature of 5400 K. The print, when so illuminated, should provide a pleasing reproduction of neutral grey and skin colours.Note 2. — This neutral grey balance is very close to a metameric match with a neutral grey in the scene. (The metameric match of two colours of which the spectral compositions are different is obtained when the visual comparison of these two colours does not permit them to be distinguished by the CIE Standard Observer.)3.4.3 Optimum viewing conditions for films intended for colour television are specified in Recommendation 501.
3.5 The dimensions of the films and images recorded thereon should conform to appropriate international standards (see ISO Recommendation R73 for 35-mm film and ISO Recommendation R359 for 16-mm film).3.6 When films are produced for television by conventional cinematographic methods, allowances should be made for the loss of picture area that occurs both in film-scanning and in domestic receivers. The television- scanned area, the action field and the title and sub-title areas should conform with appropriate international (ISO Recommendation R1223) or equivalent national standards.
* ISO: International Organization for Standardization.
** CIE: Commission intemationale de l’eclairage (International Commission on Illumination).

Rec. 265-3 137
3.7 The normal position for the emulsion side of 35-mm films is internationally recognized as facing the lightsource when projecting on a reflecting-type screen.
For 16-mm film the position of the emulsion is dependent on the process of preparation and either emulsion-to-light source or emulsion-to-objective-lens orientations may be encountered. The actual position of the emulsion should be indicated on the leader and on the label of the film by clear statement or diagram.3.8 Film splices should be carried out in accordance with appropriate international or national standards.3.9 A leader for protection and identification should be attached to each film.
3.9.1 The minimum length of the protection and identification leader should be 3 m (10 ft).3.9.2 The minimum information given on the identification leader should be as follows:— name of sending organization,— title of programme,— code word (see § 1),— position of emulsion (see § 3.7),— total programme duration and picture frequency,— total number of reels,— reel number,— duration or length of the film on the reel.
Further information may be given, such as: production methods used, for example, telerecording or a code word according to ISO.3.9.3 The identification leader should have the same type of base and perforations as the film to which itis attached. Leaders should be attached to the film in such a manner that the emulsion on both leader andfilm is on the same side.
3.10 Films may be transported on flanged reels or on cores as specified in the appropriate international or national standards. The boxes in which films are transported should be identified with labels carrying the same information as the corresponding film leader (see § 3.9.2).3.11 The diameter of a flanged reel or the outer diameter of the film on a core should not exceed 380 mm(15 in.). It is desirable that 16-mm films exceeding 300 m (1000 ft) in length should be on flanged reels.3.12 Cores and reels intended for films with magnetic sound stripe should be made of non-magnetic material.
4. Special standards for certain types of film
4.1 COMOPT types
The preferred types of optical sound tracks are variable area, bilateral or double bilateral.The nominal optical sound-recording characteristic for 35-mm and 16-mm film is that which produces a
constant modulation of its optical transmission as a function of frequency within the given frequency range on the sound track of the film when a sine-wave signal of constant amplitude is fed into the input of the recording channel.
The corresponding nominal reproducing characteristic is that which produces a sine-wave output signalwhose level is independent of frequency when reproducing a sound-track recorded with the nominal recordingcharacteristic specified above.Note. — The preferred method of measurement of the recording characteristic of optical sound tracks is by reference to the output signal of an ideal replay chain. (An ideal replay chain is defined as having a signal output proportional to the modulation of the optical transmission of the sound-track when this is scanned by a slit whose width is negligible in relation to the shortest recorded wavelength on the film.) This condition may be verified by measuring the modulation of the optical transmission of the film by means of a microdensitometer adjusted to have a slit-width which is negligible in relation to the shortest recorded wavelength on the film.
The preferred method of calibrating a reproducing chain is by means of a standard test film recorded with a number of audio sine-waves producing constant modulation of the optical transmission.
4.1.1 35 COMOPT
The location and dimensions of picture frames and sound-track should conform with appropriate international standards (ISO Recommendation R73 and ISO Recommendation R70).
The useful audio-frequency range is 40 Hz to 8000 Hz.
4.1.2 16 COMOPT
The location and dimensions of picture frames and sound-track should conform with appropriate international standards (ISO Recommendation R359 and ISO Recommendation R71).
The useful audio-frequency range is 50 Hz to 5000 Hz.

16 COMMAG
4.2.1 The dimensions and position of the magnetic sound stripes should be as given in Fig. 1.4.2.2 The sound record should be in advance of the centre of the corresponding picture by28 ± Vi frames.4.2.3 The magnetic stripe should be on the side of the film that faces the light source of a projector arranged for direct projection onto a reflecting-type screen.4.2.4 The maximum additional thickness due to the magnetic coating should be 0.02 mm (0.0008 in.).4.2.5 If a balancing magnetic stripe is used, it should have the same thickness as the main magnetic stripe. No sound recording should be made on the balancing stripe.4.2.6 The recording and reproducing characteristics should be those standardized by the IEC (Publication 94) for magnetic tape at a speed of 19.05 cm/s (7.5 in./s). This includes a time constant tx of 70 ps.
Two other standards are still in use to a decreasing extent:— a time constant of 100 ps,— a time constant of 50 ps.
Magnetic sound stripe
Balancing stripe
Direction of travel
Dimensions
Millimetres Inches
A 2.s + 0 1 5 Z - 0
iio o
+ 1
8o
B 0127 max. 0 005 max.
C 0.8 + °0 8 - 0 1 0031 —0-005
D 0 05 max. 0 002 max.
F ig u r e 1
Sound recording on film type 16 COMMAG

Rec. 265-3 139
4.3 16 SEPMAG
4.3.1 Three standards for SEPMAG are used:
The first (see Fig. 2) is the preferred format and consists of a centre track and an edge track both of 4.0 mm (0.158 in.) width. An optional auxiliary track of 0.7 mm (0.028 in.) width is provided which can be used for cue or control information. The 4-mm tracks are fully compatible with the other two SEPMAG formats described below in this paragraph. This leads to a single 16 SEPMAG standard which also is intended to replace these formats in the future (see Report 294-4). The second and third formats (see Fig. 3) are:
— a 5.1 mm (0.2 in.) centre track according to ISO Recommendation R890, used to a decreasing extent in Europe;
— a 5.1 mm (0.2 in.) edge track according to ISO Recommendation R891 used in the United States of America and Canada. (This type of track can, if necessary be reproduced by a magnetic head designed for 16 COMMAG.)
4.3.2 The COM and SEP types should not be combined. That is to say, if one or more sound tracks are provided on a separate film, only the SEP tracks should be used for reproduction.
4.3.3 The recording and reproducing characteristics should be those standardized by the IEC (Publication 94) for magnetic tape for a speed of 19.05 cm/s (7.5 in./s). This includes a time constant tx of 70 ps.
Two other standards are still in use to a decreasing extent:
— a time constant of 100 ps,— a time constant of 50 ps.
4.4 35 COMMAG
4.4.1 The dimensions and position of the magnetic sound stripe should be as given in Fig. 4.
4.4.2 The sound record should be 28 ± Vi frames behind the centre of the corresponding picture.
4.4.3 The magnetic sound stripe should be on the side of the film towards the lens of a projector arranged for direct projection on to a reflecting screen.
4.4.4 If a balancing stripe is used, it should have the same thickness as the magnetic sound stripe. No sound recording should be made on the balancing stripe.
4.4.5 The recording and reproducing characteristics should be those standardized by the IEC for magnetic tape for a tape speed of 38.1 cm/s (15 in./s) having a time constant tx of 35 ps (see IEC Publication 94).
4.5 35 SEPMAG
4.5.1 The second (sound) film should be a standard 35-mm magnetic film.
4.5.2 The position of the sound tracks is specified in ISO Recommendation R162. If only one soundtrack is used, it should be track No. 1 (see Fig. 5). If a second sound track is used, it should betrack No. 2.
4.5.3 The COM and SEP types should not be combined. That is to say, if one or more sound tracks are provided on a separate film, only the SEP tracks should be used for reproduction.
4.5.4 The recording and reproducing characteristics should be those standardized by the IEC for magnetic tape for a tape speed of 38.1 cm/s (15 in./s) having a time constant tx of 35 ps (see IEC Publication 94).

140 Rec. 265-3
Millimetres Inches
A 2 05 ± 0 05 0-081 ± 0 002
B 8-00 ± 0 05 0-315 ± 0 002
C 15-50 ±0-05 0-610 ± 0 002
D 4-0 + 0 1- 0 0-157 I q 004
E 3-9 + 0 - 0 1 0 t—* 1 ±
o
o
F
© o
± 1
vy 0177 I® 004
G
6 o
± 1
o © o
± 1
00 O
O
H 0 6 - 0 1 0 024 ^ 0-004
J
o o
± 1
©
0-039 I q 004
F ig u r e 2
Sound recording on film type 16 SEPMAG (Preferred format)

Rec. 265-3 141
F ig u r e 3
Sound recording on film type 16 SEPMAG
Dimensions
Millimetres Inches
A 2-5 + 01 z 3 - 0 0100 ± 0 002
B 7 * + 0 1 7 6 - 0 0-300
C i.o + °1 8 -0-25 0
© 1
+
© ©
o
D 0-25 max. 0-01 max.
F ig u r e 4
Sound recording on film type 35 COMMAG

142 Rec. 265-3, Rep. 294-4
Dimensions
Millimetres Inches
I 5 08 ± 0 05 0-200 ±0-002
J 8*61 ± 0 1 0 0-339 ±0-004
K 17-50 ±0-10 0-689 ± 0 004
F ig u r e 5
Sound recording on film type 35 SEPMAG with one or more tracks
Note. — The Director, CCIR, is requested to transmit this Recommendation to the ISO and the IEC, in accordance with Opinion 16-2.
REPORT 294-4
STANDARDS FOR THE INTERNATIONAL EXCHANGE OF MONOCHROME AND COLOUR TELEVISION PROGRAMMES ON FILM
(1963 - 1966 - 1970 - 1974 - 1978)
1. Recommendation 265-3 * Standards for the International Exchange of Monochrome and Colour Television Programmes on Film, was reviewed. The current text is maintained.2. Recommendation 501-1 * was drafted to include a proposal from the U.S.S.R. on the appraisal of the density of film, a second note was added to § 3.8, and a new Annex II was prepared.
* Some subjects contained in Recommendations 265-3 and 501-1 are currently under study by the ISO. The Director, CCIR, in accordance with Opinion 16-2, is requested to transmit this Report, Recommendations 265-3 and 501-1 to the Director, ISO.

Rep. 294-4 143
3. Report 469-1, “Photographic film recording of colour television signals” is maintained.
4. Question 17-2/11, which refers to optical sound recording and reproducing standards, was modified to take account of [CCIR, 1974-78a] which recommends the specification of a de-emphasis network for telecine that will reasonably match the average recording characteristics of optical soundtracks.
5. Question 19/11, (Geneva, 1974) concerns the pre-emphasis time constant used in 16 mm magnetic recording. There is now widespread agreement on this matter as stated in Recommendation 265-3 and this Question has been deleted.
6. Question 20-1/11 deals with the problem of recording colour television signals to obtain colour film programmes. Report 469-1 summarizes the systems now in use for this purpose. It has been suggested that the development of high-quality television standards-conversion equipment may reduce the importance of telerecording in the international exchange of programmes. This Question was modified to make its purpose more understandable.
7. Question 21-1/11 § 1, seeks a definition of the telecine characteristics required to give optimum television reproduction of colour film. [CCIR, 1974-78b] points to a need to distinguish between two uses of film in television and hence a need for two modes of telecine utilization.
Note. — See Recommendations 265-3 and 501-1.
The first category of film used in broadcasting involves theatrical, documentary, and current events films. These films come to the broadcast organization with an artistic integrity that should not be altered. The characteristics of the telecine intended for this category of film should produce a television image that matches the projected film image under the conditions described in Recommendation 501-1.
The second category involves the use of film in television production. Here the film images may be intercut with material from electronic cameras and the artistic decisions are made within the television organization. The type of telecine intended for this category of film requires additional signal processing and controls to permit matching the images from film with those from the electronic cameras or the original scene.
It is believed that the answer to Question 21-1/11 § 1 should involve a specification of only the first type of telecine use.
Question 21-1/11, § 2 asks, “What telecine characteristics are obtained by typical present day colour telecine equipment?”. Contributions to this Question are requested.
Question 21-1/11, § 3 indicates a need for specifications of standards, tolerances, and methods of measurement of colour balance for films intended for international exchange of colour television programmes. The Doc. [CCIR, 1974-78c] presents data showing that the differing spectral selectivity of neutral images on various film materials makes it impossible to specify a simple objective measurement of colour balance using standardized measuring equipment normally used in laboratory practice. Reliable, objective measurements can only be made with densitometers having a spectral response closely matched to that of the CIE standard observer.
8. Question 22-1/11 and Report 468-2 deal with the synchronization of pictures and sound. The Report takes into account IEC Publication 461 on time and control code for video tape recording. Further contributions are expected on the problems of synchronizing film pictures and film sound. Question 22-1/11 was drafted to include the synchronization problems of “simulcast” broadcasting in which the same programme is simultaneously transmitted from a television transmitter with a monophonic sound signal and from a radio transmitter with stereophonic sound signals.
9. Question 28/11 concerns the addition to recorded television programmes of data for controlling automatic television station equipment and contributions on this subject are requested. Study Programme 28A /11 was adopted to consider this question for both film and magnetic recording.
10. The safe television title area and the safe television sub-title area for anamorphic films were the concern of [CCIR, 1970-74a]. It is to be hoped that the ISO will produce a Recommendation on this matter. *
11. The matter of the information to be placed on the label of the film container is still of interest and some countries have been using, to their mutual advantage, a standard multi-lingual format for this label. Contributions on this topic are also requested.12. Cueing leaders have been actively studied. [CCIR, 1970-74b] gives the EBU proposals for film leaders, which are also a matter for ISO/TC 36. The EBU proposals are reproduced in the Annex I to this Report. It is hoped that further contributions on this subject will be received and that agreement can be reached on a leader which, while being suitable for use in television broadcasting, would also be acceptable for cinema use.
* The Director CCIR has transmitted Report 294-4 and Doc. [CCIR, 1970-74a], to the Director ISO and this subject is under study by the ISO.

144 Rep. 294-4
ANNEX I *
UNIVERSAL FILM LEADER FOR CINEMA AND TELEVISION
1. Introduction
Many different film leaders have been designed during the history of motion picture films. Basically, the leader is a length of film attached to the head of the programme film to assist in lacing the telecine machine or cinematograph projector. If, however, it is marked with suitable visual information it may be used to ensure that the correct amount of time is allowed for the machine to run up to speed and to arrive at the beginning of the programme information at a specific moment. It is also usual for the leader to bear marks which facilitate the synchronization of the reproduction of the sound record with that of the picture information. General advice on leaders is contained in Recommendation 265-3.
The reason for the existence of many different leaders lies in the fact that the visual requirements for cinema projection tend to be different from those for television use. There is the further complication that there are some systems using 24 frames per second and others using 25 frames per second. The latter is encountered where the field rate of the television system is 50 Hz.
It is very desirable that there should be a substantial reduction in the number of leaders encountered because operational errors arise from failure to recognise the significance of certain marks (particularly marks concerned with the synchronization of the sound) when an unfamiliar leader is used. There would also be an advantage in having a leader which is suitable for use in cinematograph projectors and in telecine machines: it should also permit the synchronization of all commonly-encountered separate sound systems and give a sufficiently accurate run-up timing when used in systems having either 24 or 25 frames per second.
This Annex describes a draft leader intended to fulfil these requirements.The design incorporates a very small number of signs, and thus provides a basis for the possible
development of more elaborate national leaders. The intention is that this structure should enable any operator in any country to deal with familiar images. The original leader can thus be retained with any film that is exchanged.
The draft was developed by Sub-group G3 of EBU Working Party G, who based its work on various national or international proposals for leaders in order to produce a leader suitable for the maximum number of users. Copies of the leader were made by Sveriges Radio, which used them experimentally for cinema projection and showing on television. These experiments have confirmed that this leader is suitable for both applications.
2. Description of the leader
The general form of the proposal follows that of ISO Document ISO/TC 36 (October, 1968) entitled “Leaders and run-out trailers for 35 mm and 16 mm release prints”. Other relevant documents are AFNOR No. Pr S 25-003, DIN 15 698 BSI document 69/5182 and ASA PH22.55-1966. The changes incorporated in this draft are those considered necessary to provide a leader which is suitable for films used in television, as well as for presentation in motion picture theatres.
Leaders are normally divided into three sections:— a protective section of blank film,— an identification section,— a synchronizing section.
Only the last two sections are represented in the Fig. 1 (Universal film leader) of this Report and some details concerning the design are given below.
2.1 Identification section
The identification section will begin at frame No. 307 (marked HEAD) and will finish at frame No. 241. It will carry information in accordance with the provisions of Recommendation 265-3, § 3.9.
Frames Nos. 288 and 264 are allocated count numbers 12 and 11, respectively, and although they fallwithin the identification section, they are an extrapolation of the synchronizing section for use in certain dubbingoperations where a very long run-up time is necessary.
2.2 Synchronizing section
2.2.1 Projection speed
The distances between the principal marker frames (Nos. 48, 72, 96, etc.) are 24 frames, conforming to normal cinema leader practice. Thus the “blinks” caused by the projection of the lower-density image in the marker frames will occur at intervals of one second, once the projector has run up to speed.
* This Annex is based on [CCIR, 1970-74b].

Rep. 294-4 145
Direction of film travel
1
©
O Density ^ 0.35 * Density ^ 2.00
© '” U i^ 168215 ^ E ^ 9 191 J H M 167 H |
2U 190 166 j j j ^ ^ l
208 ,84 9 B 134 191 1,2 9 jjj j
^ 9 205 9 9 m 9 9 k? 9 b 133 m m w 9 9
9
m 199 176 151 127 ^ Q j j j j 103 77
D i9s i7i b 147 B 123 B 99 B
i :L~J
FIGURE 1 - Universal film leader
For part of the passage of the synchronizing section through the projector or telecine, the speed of the machine will be increasing from zero to the normal 24 or 25 frames per second and even when stability is reached, the importance of precise one-second measurements is not, as a rule, of great operational significance since the cue to start the machine must be made with a prior knowledge of its run-up characteristics.
For this reason, it is suggested that there is no substantial value in having leaders which are equally suitable for both 24 frames per second and 25 frames per second. The majority of systems function at 24 frames per second and, therefore, the leader should be based on this rate.
2.2.2 Frame-by-frame details o f the synchronizing section
Frame 240
Frames 239 to 217
Frame 216
Frames 215 to 193
Frame 192
The synchronizing section starts at frame 240 with the count number 10 surrounded by two circles with markings for every 15°. The number and the “clock” are in black-on-white, but the minimum density is controlled to prevent overload of telecines. A triangular black pointer marks 0°.
Count number 10 is in white-on-black. The rate of 24 frames/s is indicated by a white pointer rotating around a centrepoint 15° for every frame.
Count number 9. Otherwise as for frame 240.
Count number 9. Otherwise as for frames 239 to 217.
Count number 8. Otherwise as for frame 240. This frame corresponds to STARTof the Academy Head Leader or PICTURE START of the SMPTE Universalleader.

146 Rep. 294-4
Frames 191 to 188 Four black frames marked COLOUR REFERENCE (printed lengthwise with the film) and intended to be replaced by four frames of colour reference picture in the leader of all master material.
Frames 187 to 173 Count number 8. Pointer indications from 75° to 285°.
Frame 172 Indicator for position of sound reproducer for 16-mm film with magnetic stripe, 16 COMMAG SYNC, printed in white letters. (Correctly spaced with respect to frame 144).
Frame 171 Count number 8. Pointer indication 315°.
Frame 170 Indicator for position of sound reproducer for 16-mm film with an optical track, 16 COMOPT SYNC (correctly spaced with respect to frame 144).
Frame 169 Count number 8. Pointer indication 345°.Frame 168 Count number 7. Otherwise as for frame 240.Frames 167 to 165 Count number 7. Pointer indications from 15° to 45°.Frame 164 Indicator for position of sound reproducer for 35-mm film with an optical track:
35 COMOPT SYNC (correctly spaced with respect to frame 144).
Frames 163 to 145 Count number 7. Pointer indications from 75° to 345°.Frame 144 START. The reference image for synchronization of all sound tracks.
Frames 143 to 121 Count number 6. Pointer indications from 15° to 345°.
Frame 120 Count number 5. Otherwise as for frame 240.
Frames 119 to 97 Count number 5. Pointer indications from 15° to 345°.Frame 96 Count number 4. Otherwise as for frame 240.Frames 95 to 73 Count number 4. Pointer indications from 15° to 345°.Frame 72 Count number 3. Otherwise as for frame 240.Frames 71 to 49 Count number 3. Pointer indications from 15° to 345°.Frame 48 Count number 2. Otherwise as for frame 240.
Frames 47 to 1 Black.
Frame 0 White with black text “SPLICE HERE” with a pointer which marks the junctionbetween leader and programme, namely, between frames 1 and 0.
2.2.3 Technical design2.2.3.1 The following approximate densities are suggested:white or low density > 0.35 black or high density < 2.002.2.3.2 The backgrounds shall be of 4 x 3 format with a white frame line between the frames.2.2.3.3. The START-mark and the count numbers are confined to half picture-height to allow legibility when set up as a still frame in a flying-spot telecine.
2.2.4 Separate sound recording
In the case of the SEPMAG system, the sound film should have a very small perforation (approximately 1 mm square) at the point in the sound recording corresponding to the START reference point on the leader. So that the user may locate this point easily, a piece of adhesive tape may be attached to the sound film in advance.
Another method for ensuring that the picture and sound coincide at the start is to use the leader described above for the sound film.
REFERENCES
CCIR Documents[1970-74]: a. 11/231 (Italy); b. 11/257 (EBU).
[1974-78]: a. 11/20 (Italy); b. 11/71 (USA); c. 11/70 (USA).

Rec. 469-2 147
STANDARDS FOR THE INTERNATIONAL EXCHANGE OF TELEVISION PROGRAMMES ON MAGNETIC TAPE
(1970 - 1974 - 1978)The CCIR
UNANIMOUSLY RECOMMENDS
that the magnetic recordings used for the international exchange of television programmes should meet the following standards:
1. Recording systems
Recording on magnetic tape of television programmes which are the object of international exchange should be carried out in accordance with one of the following classes of television systems:— 625 lines; 50 fields per second— 525 lines; 60 fields per second
(see Report 624-1).The recordings should conform with the standards contained in Publication 347 of the International
Electrotechnical Commission (IEC), with the modifications and additions detailed in this Recommendation.
2. Speed of the tape
Television programmes should be recorded at the following nominal tape speeds:— 625-line, 50-fields/s systems: 39.7 cm/s (15.625 in./s).— 525-line, 60-fields/s systems: 38.1 cm/s (15 in./s).
3. Dimensions and positions of recorded tracks
The dimensions and positions of the recorded tracks are specified in IEC Publication 347, § 3.5.
4. Specification for video recording
4.1 Recordings of programmes should only be made using the “high band” characteristic frequencies indicatedin IEC Publication 347, § 4.2.4.2 The most convenient way, from an operational point of view, to define a recording standard, is by means of reference tapes, which are physical embodiments of the standard. Annex I to this Recommendation contains, as an example, the current specification of the European Broadcasting Union (EBU) for such reference tapes, for 625-lines, 50-fields/s television systems.
5. Specification for programme sound recording
5.1 The television programme sound shall be recorded on the audio track only. In accordance with IECPublication 94, the recording characteristic corresponds to a time constant of 35 ps, for a speed of 38.1 cm /s (15 in./s). (Many countries use an additional time constant of 2000 ps.)
5.2 The sound reference level shall correspond to a recorded short circuit flux of 100 ± 10 nW b/m of trackwidth, (r.m.s.), at 1000 Hz. (In some countries, a 400 Hz reference tone is used.) Normal operational practice willresult in programme peaks corresponding to a maximum short circuit flux between 250 and 310 nW b/m, (r.m.s.),i.e. about 9 dB above reference level. These maximum recorded levels correspond to the subjective overload level for television tape materials currently used for the international exchange of programmes.Note. — When the programme peaks are measured by means of a programme meter, due account should be taken of the integration time of the instrument (see Report 292-4).
6. Specification for cue signal recording
The cue track should not contain information which needs to be reproduced for the exchange of broadcast programmes, except by mutual agreement, when a time and control code signal, or contributions to the final programme sound, such as sound effects, may be recorded on the cue track.
RECOMMENDATION 469-2 *
* This Recommendation should be brought to the attention o f Study Group 10 and the CMTT.

148 Rec. 469-2
7. Specifications for the waveform of the edit pulse record current
The rise and fall times of the edit pulse record current, measured between the 10% and the 90% amplitude levels, shall be 15 ± 10 ps.
8. Editing
8.1 Mechanical editing splices
Tapes for international exchange should not contain mechanical editing splices. Where, by prior arrangement, tapes are exchanged which contain such splices they should be in accordance with the following:
8.1.1 The number of tape splices should be kept to a minimum.
8.1.2 The cut shall be located so as to maintain uniformity of timing of field synchronization signals andof edit pulses, and it shall be centred between two recorded tracks.
8.1.3 The separation between cut edges after splicing shall not exceed 0.025 mm (0.001 in.) at any point.
8.1.4 The longitudinal distance between corresponding points of the recorded transverse video tracksimmediately preceding and following the splice shall not depart from the average distance betweensuccessive tracks by more than ± 0.013 mm (0.0005 in.).
8.1.5 The splicing tape shall have the following dimensions:
— nominal width: 6.35 mm (0.25 in.)
— maximum thickness: 0.018 mm (0.0007 in.)
8.1.6 In a finished splice, the splicing tape shall be placed symmetrically over the cut and shall not extend beyond the edges of the television tape.
8.1.7 The edges of the television tape on the two sides of the splice shall be on a common straight line.The tape curvature shall meet the specification of IEC Publication 347, § 3.1, when measured with the splice centred within the specified length.
8.2 Electronic editing
All electronic editing shall maintain an off-tape synchronizing pulse train with a phase relationship to the playback reference of the machine sufficiently close to avoid visible disturbance of the picture.
9. Composition and duration of leaders and trailers
Leader and trailer sections should be located on the tape in conformity with the sequence shown inTable I.
10. Winding of the tape on the spools
10.1 The tape should be wound on the spools specified in IEC Publication 347, with the magnetic surfacetowards the hub of the spool.
Note. — The exchange of tapes wound on spools having a diameter exceeding 356 mm, specified in ISO Standard IS 1860, is subject to mutual agreement.
10.2 The tape must be wound in such a way as to minimize the possibility of damage during transport; e.g. by using a constant winding tension. To prevent unwinding, the head end of the tape should be secured during storage and transport, by a suitable mechanical means, e.g. Scotch 8125 tape or equivalent; the use of a tape collar during transport is recommended.
10.3 Recordings of a single programme of up to 90 min duration should preferably be on one spool.
10.4 Separate programmes shall always be on separate spools.
11. Packaging
Programme spools should be packed in containers affording protection against mechanical and enviro- mental damage.

Rec. 469-2 149
T able I
Tape section Duration(s) Picture Sound Control track
signal
Protection leader 10(minimum)
Blank tape
Alignment leader 60(minimum)
Alignment signal 0
1000 Hz at reference level (2)
Uninterrupted
Lea
der
Optional 5(maximum)
Blank tape
Identification leader 15(minimum)
Programmeidentification
Spoken identification
preferred, or silence
Cue-up leader 8(4)
Black or cue Silence or cue
2(4)
Black v ' Silence Uninterrupted
(3)Programme Playing time of programme
Programme
Run-out trailer 30(minimum)
(4)Black Silence
(1) Examples of suitable alignment signals for 625-lines, 50 field/s systems are given in Annex I.(2) See § 5.2.(3) Where the time and control code is recorded on the cue track (see § 6), the time indication of the programme start
should be shown on the label accompanying the tape (see § 12.3).(4) In the case of colour recordings the black signal should be colour black. It is desirable that the colour field sequence
(8 fields in PAL, 4 fields in NTSC) should continue uninterrupted in relation to the beginning and end of the programme recording.
12. Programme identification
12.1 At least the following information should be supplied with each recorded television tape:— name of the organization which made the recording;— title of programme, or title, sub-title and episode number;— total number of spools, and number of the spool in the sequence when the programme is contained on more
than one spool;— library number (reference number) of programme or of tape;— total playing-time, and playing-time of the programme material recorded on the tape;— line and field system (625/50 or 525/60);— recording standard (“high band” or “low band”);— indication of the colour system, for colour recordings.12.2 The information required in § 12.1 shall be provided in at least one of the official languages of the ITU.12.3 The information required in § 12.1 shall be provided on labels conforming to the standard formatexemplified in Annex II; the labels shall be affixed both to the programme spool and its container.
BIBLIOGRAPHY
IEC [1968] Magnetic tape recording and reproducing systems: dimensions and characteristics. IEC Publication 94, Third Edition, 1968, Geneva.
IEC [1972] Transverse track recorders. IEC Publication 347, First Edition, 1972, Geneva.IEC [1974] Time and control code for video tape recordings. IEC Publication 461, First Edition, 1974, Geneva.ISO [1974] Precision reels for magnetic tape used in interchange instrumentation applications. ISO/IS 1860, Geneva.

150 Rec. 469-2
ANNEX I
EXAMPLE OF TEST SIGNALS FOR USE IN ADJUSTING TELEVISION TAPE MACHINES
(625-line systems)
The present EBU recommendation for test signals to be used in adjusting television tape machines for 625-line television systems, is shown below.
In the original EBU recommendation for reference tapes, it is required that the recording be made on a specific type of television tape, which is chosen because it is representative of the tapes currently found in operation.
1. Test signals to be recorded on the leaders of television tapes
The alignment video signal on the tape leader indicated in § 9 of this Recommendation, for adjusting thereproducing machine so that the best picture quality may be obtained, should conform with the followingspecifications:1.1 for monochrome television recording and SECAM colour television recordings:— a black-level bar, a white-level bar and, if desired, a Gaussian pulse;— a frequency “multi-burst” ;— a grey-scale or a “saw-tooth” signal.
These signals should appear simultaneously. The part of the picture carrying each signal should be greater than the area scanned by one complete revolution of the head wheel:1.2 for PAL colour television recordings:— on the upper part (at least one third) of the picture, a conventional test pattern of colour bars;— on the lower part (at least one third) of the picture, a uniform area having the same signal as the red bar.Note. — The colour bar signal chosen for the leader is of the type 100/0/75/0 (according to the nomenclature of Recommendation 471). In the United Kingdom it is of the type 100/0/100/0 and may be followed by a length of dubbed colour bars.
2. Signals to be recorded on the EBU reference tapes
Two types of reference tapes for television tape machines have been standardized for the member organizations of the EBU. They are intended to satisfy two different requirements:— the physical embodiment of the recording standards used (see § 2.1);— verification of the characteristics and rapid operational alignment of television tape-machines (see § 2.2).
Tapes of these two types shall have the following characteristics:
2.1 Primary-standard reference tape
This tape consists of five successive parts, each of them having a duration of three minutes. The different parts are recorded with the following signals occupying the full frame:
2.1.1 a multiburst signal consisting of six bursts at different frequencies, as specified by the CCIR for insertion in line 18; but preceded by a signal giving the white- and black-reference levels;
v

Rec. 469-2 151
2.1.2 the signal specified by the CCIR for insertion in line 17, consisting of the following components: luminance bar, I T sine-squared pulse, composite 20T pulse and 5-riser luminance staircase without chrominance signal;
v
2.1.3 the signal specified by the CCIR for insertion in line 330 and consisting of the following components: luminance bar, 2 T sine-squared pulse and 5-riser luminance staircase with superimposed sub-carrier;
2.1.4 a uniform area generated by a sub-carrier of 0.7 V (peak-to-peak) on a luminance level of 50% of the black-to-white transition extending from the beginning to the end of the line (this signal is intended for measurements of moire and for verification of the correct reproduction of the phase of the colour sub-carrier);
v1 , 0 0 r ------------------------------------------------------------ 11 1 1111111 i l l 111111111'f l m i l 1111111111111] 111111111111111111 n 11111111111111 111 H
0,65 -
0,30 - — i ------------- ( ll lll l ll l ll l l l l l l l l l l l l ll l ll l ll l l ll l l l l l l l II l liu 111111111111111111111.11111111111111111 ....I imu | ,
1 I | ii i i i■ i i ' » i ' » i i i i i i i i i i i i i i i i i i i i i i i i____i _
0 6 31 32

152 Rec. 469-2
2.1.5 a uniform grey area obtained with a luminance level of 30% of the black-to-white transition (this signal is intended for noise measurement).
v0,51 -
0,30 -
0
All these signals shall include the standard PAL alternating sub-carrier burst during the line- blanking interval. The phase of the sub-carrier used in §§ 2.1.3 and 2.1.4 shall correspond to the B —Y axis referred to the PAL burst.
The recording of these signals shall conform to all the characteristics specified in the relevant EBU, CCIR and IEC documents.
The various recorded sections shall be separated by 15 s of black. The beginning and the end of the tape shall also consist of 15 s periods of black.
The cue track shall be without any recording.The sound track shall be recorded with alternate announcements in French and English, thus:
“EBU reference-tape — bande-etalon de l’U ER”, followed by the indication of the serial number of the tape, the date of the recording and the name of the manufacturer.
2.2 Alignment tape for quick verification o f the machines
This operational reference tape shall be recorded with a picture divided into two equal halves in the following way:
2.2.1 the upper half of the picture shall consist of the CCIR insertion signal specified for line 330 repeated on each line: luminance bar, 2T sine-squared pulse and 5-riser luminance staircase with superimposed sub-carrier;2.2.2 the lower half of the picture shall consist of the type 100/0/75/0 colour-bar signal (conforming to Recommendation 471 *).
Both these signals shall include the standard PAL alternating sub-carrier burst during theline-blanking interval. The phase of the sub-carrier used in §2.2.1 shall correspond to the B —Y axisreferred to the PAL burst.
The recording of these signals shall conform to all the characteristics specified in the relevant EBU, CCIR and IEC documents.
The cue track shall be without any recording.The sound track shall be recorded with alternate announcements in French and English, thus:
“EBU alignment tape — bande de reglage U ER”, these announcements being interrupted with a fewseconds of 1000 Hz tone at the reference level o f 100 nW b/m as indicated in this Recommendation.
ANNEX II
EXAMPLE OF A STANDARDIZED LABEL FOR TELEVISION TAPE-RECORDING
The European Broadcasting Union has drawn up a standardized design of a label containing all the information envisaged in § 12 of this Recommendation. The label has been designed to be stuck on the reel, but its size ( 8 x 5 cm) is such that it can be affixed to the containers in which the tapes are kept.
Below is a drawing of this label. The printed text, reading from top to bottom, indicates the following:— the name or acronym of the originating service; the blank space to the right of the symbol of this
organization is reserved for internal use by the organization which has recorded the programme;— reference number of the programme or tape;— complete title of the programme;
The colour-bar signal on the tapes intended for broadcasting organizations in the United Kingdom is o f the type 100/ 0/ 100/ 0.

Rec. 469-2 153
— total number of spools, and a number denoting the order of the spools, when the programme is recorded on more than one;
— playing-time of the programme material recorded on the tape;— indication of standards and, if necessary, of the colour system used; this information can be conveyed simply
by placing a tick in the squares relating to the various printed details;— notes: the first line is provided for any additional information; the second line is reserved for internal use by
the organization which has recorded the programme. (See [CCIR, 1966-69].)
Rat£ 8' N°-Titolo:Title
Bobina di bobineSpool o f spools
Durata:Duration
MONO- NTSC PAL - SECAM405 525 625 819
NoteNotes
LB HB
Drawing o f a label conforming to the EBU standard
REFERENCES
CCIR Document [1966-69]: X/181 (EBU).
ANNEX III
CODING OF CONTROL SIGNALS ON THE CUE TRACK
User bits and assignable bits in the EBU time-and-control code
The European Broadcasting Union, recognizing the growing interest in the user bits in the time-and- control code, recommends the following as the initial approach to their exploitation.1. It is possible to arrange user bits either according to the individual organization’s format or to one or more international standards.2. The combination of bits 27 and 43, previously unassigned, are now assigned within the EBU for use during recording to inform the decoding equipment, during playback, of the format that is employed in the user bits. At present, the following truth table applies:
Bit 27 Bit 43
No user bits, or in-house format 0 0ASCII characters 1 0Unassigned 0 1Unassigned 1 1
3. The data will consist of ASCII bytes only, each occupying two sets of four user bits, in sequence. The information carried in the ASCII bytes is as yet unassigned. Characters to control the display device if any, such as carriage return and line feed, must be included if they are required by the said display device. *
In the United Kingdom, the use of the “square bracket” characters of the ISO-7 digital code has been reserved to denote shift into and out of machine instructions in the time and control code.

154 Rec. 469-2, Rep. 630-1
4. Studies are continuing within the EBU on the details of the operational applications of such an ASCII message.5. If, within a reasonable length of time, no use is made of the two unassigned combinations of bits 27 and 43, it is possible that bit 43 can again become unassigned and thus available for other applications, while still retaining bit 27 to signal the presence of ASCII characters.6. Manufacturers are reminded that, in each frame, some user bits will be decoded before bits 27 and 43 are encountered. The data in these earlier user-bit locations must not be lost.
REPORT 630-1
INTERNATIONAL EXCHANGE OF TELEVISION PROGRAMMES ON MAGNETIC TAPE(1974- 1978)
1. Introduction
This Report outlines some of the studies currently under way which can lead to further improving the international exchange programmes recorded on magnetic tape.
2. IEC Publication 347
In June 1972, the IEC issued the first edition of Publication 347 “Transverse track recorders”. In the light of Opinion 16-2, Recommendation 469-2 has been drafted so as to make reference to Publication 347 whenever possible and appropriate.
3. Other publications
All the standards and Recommendations relating to the magnetic recording of television signals, which are in current use by the EBU, are given in EBU Document Tech. 3084, (2nd edition, May 1975), “EBU standards for television tape recordings”. It is hoped that other contributions will be submitted giving details of current standards and Recommendations.
4. Reference audio level
It is expected that it will be necessary to revise the values recommended for the reference and themaximum flux levels in Recommendation 469-2, § 5, when new recording techniques, or new tapes with adifferent magnetic coating having a higher coercivity begin to be used for the international exchanges of programmes.
5. Alignment signal to be recorded on the programme leader
Recommendation 469-2, § 9, indicates that an alignment video signal should be recorded for a minimum of 60 s, on the leader, but does not give details of the preferred alignment signal (or signals).
Studies are in progress in many organizations, and it is hoped that further contributions will soon besubmitted, so that the CCIR may formulate a Recommendation which would cover the (possibly different) alignment signals acceptable by all countries.
6. Time and control code
To help locate the required sequences on the tape for the editing of programmes, and also to actuate automatic equipment, time and control information may be usefully recorded on the cue track of television tapes. For such tapes and for separate sound recording that may possibly be associated with them, a format has been standardized for a time and control code; it is described in IEC Publication 461. Work is still in progress on the detailed specifications for recording such code on the tape, under Study Programme 22A-1/11.
The Doc. [CCIR, 1974-78a] proposes that the generated waveform, and the recovered waveform at normal playback speed, should have rise and fall times of 50 (+15 — 10) ps, and the recorded short circuit flux should be 580 nanowebers per metre (nWb/m) (+ 1 — 3)dB, peak-to-peak.
7. Data signals
It is expected that the insertion of data signals into video tape recordings will find increasing application for a variety of purposes.
A current example of such a practice is given in [CCIR, 1974-78b], which describes a data system employing line 16 for the identification of video tape cassettes.
It is hoped that further contributions will be received.

Rep. 630-1 155
8. Standard format for the programme label
Recommendation 469-2, § 12, requests that the fundamental information necessary for identification of therecorded programme should be provided on labels conforming with the standard format as exemplified inAnnex II of the same Recommendation.
Annex II shows an example of a label at present in use in a Member Organization of the EBU, which conforms with the standard format, as was adopted within the EBU some years ago.
The EBU has standardized the following elements of the label:
— the dimensions of the label,
— the information provided on the label,
— the space allocated to each item of information,
— the relative position of such spaces,
— the shape and layout of the tick-box area, and the position on it of the several boxes and their captions.
In the EBU, the label captions are printed in two languages, one of which is the official language of theoriginating Organization, the other being one of the two official languages of the EBU (English and French). For those EBU Member Organizations whose only official language is either English or French, the captions are printed in both English and French. Apart from being used within the EBU for the international exchange of recorded programmes, the same label is used by many EBU Member Organizations for their own internal purposes.
The information contained in the label is often supplemented on a separate sheet or label or punched card accompanying the recording.
It is hoped that contributions will be received suggesting a standard format for such information.
9. Specification of the timing stability of PAL broadcast video tape machines
The composite output signals from a broadcast video tape recorder contain small timing perturbations which result from mechanical imperfections in the head assembly, the tape transport system and the video tape itself.
The output of a typical machine after a single record/replay cycle is likely to contain timing perturbations of about 6 ns peak-to-peak, with frequencies in the lower part of the audio spectrum. Such errors build up with successive generations of recording and the subjective effects can become significant with the use of normal production techniques. Furthermore, the effect of timing perturbations on a receiver using PALD decoding is considerably augmented if static phase errors exist in the regenerated sub-carrier supplied to the U and V demodulators.
If four generations of recording are used, [CCIR, 1974-78c] suggests that, based on experiments carried out in the United Kingdom, the target specifications for a single record/replay cycle should be as follows:
— 2.5 ns quasi peak-to-peak for random perturbations,
— 0.4 ns peak-to-peak for periodic perturbations.
10. Picture shift following a Video Tape Recorder (VTR) edit in PAL systems
Various methods have been proposed for overcoming the problem of horizontal picture shift following a VTR edit point. When the picture content is similar before and after the electronic splice point, the shift may be easily visible and annoying; such picture jumps are especially irritating in the case of electronic animation. Such horizontal picture shifts are the result of a time-base-corrector action, and this action may be due to the PAL 8-field structure, or to changes in the relationship between sub-carrier burst and line-synchronizing pulse caused by equipment instability or adjustment, or by a change to a source with a different burst-to-sync. relationship. Even if the synchronizing pulse generator has a stable phase relationship between burst and sync, (despite such effects as those due to switch-off and switch-on), there is no system defining relationship between burst-phase and line-sync. pulse timing, so that neither equipment manufacturers nor broadcasters can work to an agreed standard.
In an effort to prevent this problem, [CCIR, 1974-78a] proposes that it should be specified that whenever it is desirable and expedient to establish a stable relationship between sub-carrier phase and line sync, pulse in PAL systems, then that relationship, in the VTR editing suite, should be standardized as 90° ± 15° at the half-ampli- tude point of the leading edge of the line sync, pulse at the beginning of line 7 on field 1 of the eight-field sequence.
Note. — A similar problem is experienced in 525 lines, 60 fields/s systems, with the NTSC four-field sequence.

156 Rep. 630-1, Rec. 501-1
11. Television recordings for programme evaluation
The Doc. [CCIR, 1974-78d] reports the adoption by the EBU of two domestic recording formats for theinternational exchange of recordings for viewing purposes.
The recording formats adopted by the EBU are:— the format making use of 12.7 mm tape contained in a coaxial cassette, as specified in IEC Publication 511
(1975);— the format making use of 19 mm tape, contained in a coplanar cassette, commonly known as U-format.
The international adoption of the U-format for programme evaluation is also supported in [CCIR, 1974-78e].
12. Measurement techniques
Measurement techniques in current use by the EBU are described in [EBU, 1976].An IEC document containing recommended measuring techniques is in course of preparation and will be
published shortly.It is hoped that contributions on this subject will be received.
REFERENCES
EBU [1976]: Operational adjustments and measurements on transverse-track television tape machines. Doc. Tech. 3219.
CCIR Documents[1974-78]: a. 11/347 (United Kingdom); b. 11/52 (United Kingdom); c. 11/341 (United Kingdom); d. 11/427 (EBU); e. 11/405
(Italy).
RECOMMENDATION 501-1
APPRAISAL OF FILM INTENDED FOR COLOUR TELEVISION(1974 - 1978)
The CCIR
UNANIMOUSLY RECOMMENDS
1. that the appraisal of films intended for the international exchange of programmes for colour television should be by means of optical projection. The optical projection arrangements must conform to standards of colour temperature and viewing conditions which are defined in § 3 (attention is drawn to the fact that the required viewing conditions are not the same as those which are conventionally accepted for the cinema theatre);
2. that broadcasting authorities should aim to provide a standard of telecine performance such that any film which appears to be of good technical quality when evaluated under the special optical viewing conditions can also be expected to appear to be of good quality when transmitted by colour television. They should not require the film to have any abnormal colour balance or special characteristic to suit a particular telecine specification;Note. — Recommendations concerning the technical parameters of colour motion picture films intended for the international exchange of colour television programmes are contained in Recommendation 265-3. To make a reliable visual appraisal of the technical quality of a colour motion-picture film intended for television presentation, it is necessary to take into account the different circumstances under which the picture will be viewed when it is so presented.
In colour television, the displayed picture is relatively small; it has a white point corresponding to Illuminant D65 and is normally viewed in familiar surroundings with a considerable amount of ambient light. The field of view of the observer therefore includes not only the television screen but also other objects in the room which provide a constant reference of colour balance and this increases his sensitivity to errors in colour reproduction in the picture. There are also frequent programme changes to signals derived from television cameras and these offer comparisons with a different type of picture source.
In the cinema the environment is dark and there are no external colour references; consequently there is a tendency for the observer to adapt to whatever balance the film may have. Furthermore, it is found that when a bright object, such as the projected picture, is viewed in an otherwise dark field, the eye exercises a contrast- reducing effect upon the viewed picture and the contrast (gamma) in film for cinema presentation is desirably

Rec. 501-1 157
made substantially greater than unity. This effect is much less pronounced under normal domestic television viewing conditions and less contrast, although still greater than unity, is desirable in the television display. Hence, the appraisal of films by optical projection in an otherwise dark review theatre is not the best procedure when films are intended for television presentation.
3. that colour motion pictures intended for television presentation should be appraised in optical reviewtheatres which have been arranged to give viewing conditions more suited to the purpose than the conventional review theatre. The projected picture should be surrounded by a relatively large illuminated area, of a standard fraction of the brightness of whites in the projected picture and a standard correlated colour temperature. The following characteristics are recommended:
3.1 the projection screen should be of such a size that the viewer is seated at a distance of between four timesand six times the height of the picture. The absolute dimensions of the screen will depend upon the number of observers that it is desired to accommodate simultaneously. (The experimental results upon which this Recommendation is based are known to be valid for screens having diagonals of between 50 cm and 1.5 m. For larger review theatres, it may be necessary for the broadcaster to carry out special experiments to confirm the consistency of results.);
3.2 either front projection or back projection may be used. The display must have reflectance or transmittance over angles wide enough to ensure satisfactory uniform brightness from all viewing positions;
3.3 the illuminated surround to the projection screen should extend the illuminated field of view symmetrically to an area which is preferably not less than three times the width and three times the height of the projection screen, with the latter placed centrally in this area;
3.4 the illumination of the surround may be from the front on to a reflecting surface or from the rear to adiffusing, translucent material;
3.5 since the white point of colour television systems is either International Committee on Illumination (CIE) Illuminant C or D65, the correlated colour temperature of the light reflected from, or transmitted by, the projection screen under open-gate conditions should be near to 6500 K for the most critical evaluation of television films. However, the range around 5400 K attained by Xenon projection systems will provide an acceptable white point for evaluation purposes;
3.6 the correlated colour temperature of the illumination of the surround should match that reflected from, or transmitted by, the projection screen, under open-gate conditions, to ± 200 K. There should be no significant departure from the black-body locus in either case, neither should the spectral emission have very pronounced peaks;
Note. — A simple check of the accuracy of the match of colour temperature between the surrounding illumination and that of the white point of the projection system can be made in the following manner:
The light flux from the projector, in open-gate condition, should be attenuated without changing its colour temperature and the brightness of the projection screen should be reduced until it closely approximates to that of the surround. It will then be possible visually to judge the colour match between the light reflected from the projection screen and that from the surround. A satisfactory match may be achieved by adjustment of the colour temperature of the projector or that of the surround; any remaining difference in colour should be significantly less than that created when a 05 CC Wratten colour compensating filter of appropriate colour is placed in the light path of the projector.
3.7 for screens as described in § 3.1, and fitted with illuminated surrounds as described in §§ 3.3 and 3.4, the brightness of whites in the projected picture should lie in the range 51 cd/m 2 (15 fL) to 68 cd/m 2 (20 fL). For films made in conformity with Recommendation 265-3, this corresponds to an open-gate brightness of not less than 115 cd/m 2 (33.5 fL) and desirably about 140 cd/m 2 (41 fL);
3.8 the surround to the screen should be illuminated reasonably uniformly to approximately one third that of picture whites, for example, 14 cd/m 2 (4 fL) to 22 cd/m 2 (6.5 fL);
Note 1. — The surround brightness is chosen as a compromise between light levels where the observer is most critical of quality and light levels where the eye suffers fatigue.
Note 2. — When it is important to visually appraise the density of colour film intended for the international exchange of television programmes, it is useful to have comparison fields, composed of reference luminance and chrominance areas, placed in the surround in the immediate vicinity of the projection screen (see Annex II).
3.9 care must be taken to ensure that the characteristics of the remainder of the review room do not affect the performance of the projection system, screen and surround. The wall facing the screen should be of low reflectance and the remaining walls, floor and ceilings should not reflect light onto the screen; their total reflectance should integrate approximately to a neutral grey;

158 Rec. 501-1
3.10 for normal appraisal purposes no ambient light should be used in the room since it would modify the standardizing effect of the surround. It may, however, be considered desirable for special test purposes, to have available a controlled degree of light of appropriate colour temperature which falls on the screen, further to reduce the luminance range.Note. — To create optical review room conditions which will give the most complete indication of the effects likely to be observed during television presentation, some users may find it desirable to cause a small amount of additional light to fall upon the screen in such a way that it simulates the effects of optical flare in the television system, and possibly that of ambient light in the room where television viewing takes place. The level of light which is intended to simulate optical flare in the television system and its colour temperature will be a function of the picture content; this can simply be produced by some mild diffusing means in the optical projection system. If also desired, the effect of ambient light falling upon the receiver could be simulated by a constant amount of light falling upon the projector screen. In either case, the precise arrangement used would be at the discretion of the user and a suitable choice would be based upon practical experience of the performance of the television system.
ANNEX I
OPTIMUM VIEWING CONDITIONS FOR THE ASSESSMENT OF FILMS INTENDED FOR COLOUR TELEVISION
The appraisal of films intended for the international exchange of programmes for colour television has frequently involved difficulties due to differing standards of performance in telecine channels. Telecine apparatus exists in a wide range of technical specifications which may vary from a highly complex design incorporating many refinements, both colorimetric and electronic, to a simple uncorrected colour analyser, and many problems of film quality are ultimately found to be attributable to telecine performance. Difficulties also arise because the majority of interests involved in the production of films, particularly film-processing laboratories, do not have television apparatus and are found to carry out their quality control under very variable conditions. It is clearly desirable that when a film is a subject of international exchange, the successive appraisals of its technical characteristics should be carried out in a standard manner.
In addition to its universal availability, optical projection has fewer variables than a colour television system and, until a world-wide standard for telecine performance can be realized, it is to be preferred for appraisal purposes.Note. — European Broadcasting Union (EBU) Technical document 3091 contains, besides the substance of this Recommendation, examples of installations at present used by members of the EBU.
BIBLIOGRAPHY
CTP [June, 1969] Canadian Telepractices Committee. Recommended practice CTP-1; Viewing conditions for the evaluation ofcolor film for television use. Joum. SMPTE, Vol. 78, 483-484.
SMPTE [1970] Colour and luminance of review room screens used for 16 mm colour television prints. Society o f Motion Pictureand Television Engineers (USA). Recommended practice RP41.
ANNEX II
APPRAISAL OF THE DENSITY OF FILM INTENDED FOR THE INTERNATIONAL EXCHANGE OF TELEVISION PROGRAMMES, BY MEANS OF OPTICAL PROJECTION
The accuracy of appraisal of colour film density may be considerably improved by means of comparison fields containing reference luminances and chromaticities.
Two of the comparison areas should be visually similar to neutral grey and have luminances corresponding to the film densities of 0.3 and 2.0 which correspond approximately to the picture-white and picture-black levels.
The luminance of the colour areas on the chart should correspond to that of the thematically important image details on the film. Each reference area should be between 1 to 2% of the projection screen area.
Comparison fields may be formed by means of a back-illuminated transparency in an assembly attached to the projection screen [CCIR, 1974-78]. This assembly contains a light source, a light diffuser and neutral grey and colour filters. The correlated colour temperature of the light from neutral greys in the comparison areas should fall between those of the main surround field and the light reflected from the screen under open-gate conditions.
REFERENCES
CCIR Document [1974-78]: 11/407 (U.S.S.R.)

Rep. 469-1 159
REPORT 469-1
PHOTOGRAPHIC FILM RECORDING OF COLOUR TELEVISION SIGNALS
(Question 20-1/11)(1970 - 1974)
1. Introduction
A serious limitation in the international exchange of colour television programmes has been the lack of ameans for transferring the electronic video-frequency signal to motion-picture film, wihout significant loss inquality. Although several systems are in limited commercial use at present, all rely upon some form of optical image-transducer and, in consequence, are limited by the aperture of the optical system and noise level characteristics.
Because of the limited use of the various systems, and shortcomings in the quality of recordings, it is premature to answer Question 20-1/11. Therefore, this Report is for information purposes only and describes practices used for photographic film recording of colour television programme material from video-frequencysignals. Also noted are systems under development which use direct electron beam recording or using laser optics,which may ultimately result in significant improvement in the film recording process.
2. Present-day systems
The following is a brief description of representative film recording systems in current use and those known to be under development.
2.1 Triniscope
This is a three-tube picture presentation, registered optically for colour photography through a system of dichroic mirrors. Although registration is a problem, this system provides enough brightness for photography with finer grain reversal and negative-positive film systems. It has been used for several years by a few organizations.
2.2 Shadow-mask
More common is a single-tube presentation using conventional or special shadow-mask tubes. Signal processing is frequently done to correct for colour, sharpness or contrast errors. Conventional tubes require the higher speed, daylight-balanced 16 mm colour reversal films for adequate exposure. A special tube with a clear face-plate is used to provide just enough brightness to expose a finer-grain 16 mm colour reversal film, from which inexpensive multiple copies can be made by photographic duplication. Otherwise, multiple copies are made by repeated recording from video tape onto high-speed reversal colour films.
This latter method is used by broadcasters for distribution of television news programmes, and for recording where few copies are required. The method employing the special tube and finer-grain printing master is used primarily to obtain recordings of commercials and other promotional material.
Some limited use has been made of 35 mm negative colour film for this photography, from which either 35 mm or 16 mm prints can be derived.
2.3 Sequential display
One organization is providing a recording service in which red-, blue- and green-separation records are made, sequentially, from a colour video-tape recording. These separate records on black-and-white film are combined by photographic printing, to provide a photographic colour print or a master from which multiple copies can be made.
3. New systems
3.1 Electron beam colour-film recording
A system using electron beam equipment has been developed for use in making colour separation records.
3.2 Colour-film recording using a laser beam
Several organizations are investigating the use of laser beams for producing colour-film recordings. Equipment is available for producing the colour television image.

PAGE INTENTIONALLY LEFT BLANK
PAGE LAISSEE EN BLANC INTENTIONNELLEMENT

Rec. 566 161
SECTION 11G: BROADCASTING-SATELLITE SERVICE (TELEVISION)
Recommendations and Reports
RECOMMENDATION 566 *
TERMINOLOGY RELATIVE TO THE USE OF SPACE COMMUNICATION TECHNIQUES FOR BROADCASTING
(1978)The CCIR
UNANIMOUSLY RECOMMENDS
that the following terminology should be used when referring to the use of space communication techniques for broadcasting:
1. Broadcasting-Satellite Service (Note 1)
1.1 A radiocommunication service in which signals transmitted or retransmitted by space stations are intended for direct reception (Note 2) by the general public.Note 1. — See No. 84AP of the Radio Regulations.Note 2. — In the Broadcasting-Satellite Service, the term “direct reception” shall encompass both individual reception and community reception. (See No. 84AP of the Radio Regulations.)
1.2 Broadcasting-satellite space stationA space station in the Broadcasting-Satellite Service, on an earth satellite.
1.3 Methods o f reception
1.3.1 Individual reception (in the Broadcasting-Satellite Service) (Note 3)
The reception of emissions from a space station in the Broadcasting-Satellite Service by simple domestic installations and in particular those possessing small antennae.Note 3. — See No. 84APA of the Radio Regulations.
1.3.2 Community reception (in the Broadcasting-Satellite Service) (Note 4)
The reception of emissions from a space station in the Broadcasting-Satellite Service by receiving installations, which in some cases may be complex and have antennae larger than those used for individual reception, and intended for use:— by a group of the general public at one location, or— through a distribution system covering a limited area.Note 4. — See No. 84APB of the Radio Regulations.
1.4 Reception quality
1.4.1 Primary grade o f reception quality (in the Broadcasting-Satellite Service)
A quality of reception of emissions from a broadcasting-satellite space station which is subjectively comparable to that provided by a terrestrial broadcasting station in its main service area **.
1.4.2 Secondary grade o f reception quality (in the Broadcasting-Satellite Service)
A quality of reception of emissions from a broadcasting-satellite space station which is subjectively inferior to the primary grade of reception quality but is still acceptable ***.
1.5 Power flux-densities
To permit individual or community reception with either grade of reception quality, broadcasting-satellite space stations may provide a high, medium or low power flux-density at the receiving site.
1.5.1 High power flux-density (in the Broadcasting-Satellite Service)
A power flux-density which enables signals radiated by broadcasting-satellite space stations to be received by simple receiving installations with a primary grade of reception quality.
* This Recommendation replaces Report 471-1, which is hereby cancelled. It should be brought to the attention o f the CMV.** Except for sound-broadcasting in bands 5 (LF) and 6 (MF) (see Recommendation 499), the main service area o f a
terrestrial broadcasting station is not defined but corresponds to a field-strength somewhat higher than the minimum values quoted in Recommendations 411-1, 417-2, 448-1 and 412-2.
*** See Report 409-2.

162 Rec. 566
1.5.2 Medium power flux-density (in the Broadcasting-Satellite Service)
A power flux-density which enables signals radiated by broadcasting-satellite space stations to bereceived either by simple receiving installations with a secondary grade of reception quality or by moresensitive receiving arrangements with a primary grade of reception quality.
1.5.3 Low power flux-density (in the Broadcasting-Satellite Service)
A power flux-density lower than the medium power flux-density, which enables the necessary grade of reception quality to be obtained using more specialized transmission and reception techniques than those required under §§ 1.5.1 and 1.5.2.
2. Definitions concerning the use of the Fixed Satellite Service for the distribution of broadcasting programmes to terrestrial broadcasting stations
2.1 Indirect distribution
Use of the Fixed Satellite Service to relay broadcasting programmes from one or more points of origin to various earth stations for further distribution to the terrestrial broadcasting stations (possibly including other signals necessary for their operation).
2.2 Direct distribution
Use of the Fixed Satellite Service to relay broadcasting programmes from one or more points of origin directly to terrestrial broadcasting stations without any intermediate distribution stages (possibly including other signals necessary for their operation).
3. Definitions concerning the planning of the Broadcasting-Satellite Service
3.1 Service area
The area on the surface of the Earth in which the Administration responsible for the service has the right to demand that the agreed protection conditions be provided.Note. — In the definition of service area, it is made clear that within the service area the agreed protection conditions can be demanded. This is the area where there should be at least the wanted power flux-density and protection against interference based on the agreed protection ratio for the agreed percentage of time should be achieved.
3.2 Coverage area
The area on the surface of the Earth delineated by a contour of a constant given value of power flux-density which would permit the wanted quality of reception in the absence of interference.Note 1. — In accordance with the provisions of No. 428A of the Radio Regulations, the coverage area must be the smallest area which encompasses the service area.Note 2. — The coverage area, which will normally encompass the entire service area, will result from the intersection of the antenna beam (elliptical or circular) with the surface of the Earth, and will be defined by a given value of power flux-density. For example, in the case of a Region 1 or 3 country with a service planned for individual reception, it would be the area delineated by the contour corresponding to a level of -103 dB(W/m2) for 99% of the worst month. There will usually be an area outside the service area but within the coverage area in which the power flux-density will be at least equivalent to the minimum specified value; however, protection against interference will not be provided in this area.
3.3 Beam area
The area delineated by the intersection of the half-power beam of the satellite transmitting antenna withthe surface of the Earth.Note. — The beam area is simply that area on the Earth’s surface corresponding to the -3 dB points on the satellite antenna radiation pattern. In many cases the beam area would almost coincide with the coverage area, the discrepancy being accounted for by the permanent difference in path lengths from the satellite throughout the beam area, and also by the permanent variations, if any, in propagation factors across the area. However, for a service area where the maximum dimension as seen from the satellite position is less than 0.6° (the agreed minimum practicable satellite antenna half-power beam width), there could be a significant difference between the beam area and the coverage area.
3.4 Nominal orbital position
The longitude of a position in the geostationary satellite orbit associated with a frequency assignment to a space station in a space radiocommunication service. The position is given in degrees from the Greenwich meridian.

Rep. 215-4 163
REPORT 215-4
SYSTEMS FOR THE BROADCASTING-SATELLITE SERVICE (SOUND AND TELEVISION)
(Questions 34-2/10 and 23-2/11)(1963 - 1966 - 1970 - 1974 - 1978)
1. Introduction
This Report describes the essential elements of broadcasting-satellite system design and their relationships. The object of the Report is to assist the system designer, frequency planner, and spacecraft and earth-station engineer in their choice of system characteristics. Such choices, as is the case in the design of systems in general, are bounded by various constraints: limitations imposed by the state of international agreement and, most important, by considerations of system economics.
Other relevant information on systems aspects of the Broadcasting-Satellite Service is given in the documents listed below:— Report 473-2, characteristics of ground receiving equipment for broadcasting-satellite systems.— Report 632-1, technically suitable methods of modulation.— Report 808, Broadcasting-Satellite Service — Space segment technology.— Report 810, Broadcasting-Satellite Service — Reference antenna patterns.
2. Major system parameters
There are different ways to approach the selection of system parameters. One method is given in thissection.
2.1 Factors affecting choice o f orbit
Among the factors to be considered in the selection of preferred orbits for satellite broadcasting are coverage, number of daily broadcast hours desired and antenna characteristics.
The satellite orbit for a broadcast service must provide coverage of selected regions of the Earth during desired viewing or listening hours, which may vary from several to twenty-four hours per day. For non-continuous broadcast periods, it is desirable to have these intervals occur at the same local time each day. Regardless of the duration of the broadcast period, it is desirable to have an orbit that does not require antenna tracking equipment of broadcast receiving installations.
A geostationary satellite (altitude 35 786 km above the equator) would permit a continuous broadcast service to areas as small as individual countries or as large as continents, up to about one-third of the surface of the Earth. The limitation imposed by the minimum usable angle of elevation can be determined from Fig. 1 of Report 206-4. A geostationary satellite also permits the use, if required, of a fixed receiving antenna of very high gain (and hence directivity).
A satellite in a sub-synchronous circular equatorial orbit can provide coverage at the same local time each day. The number of uninterrupted broadcast hours possible from such a satellite to a given area on the surface of the Earth is a function of the satellite altitude and the latitude of the receiving point. Representative visibility times are shown in Table I.
Because the sub-synchronous satellites in circular orbits have a lower altitude than a geostationary satellite, a stronger signal is available for a given transmitter e.i.r.p. Such satellites may therefore have an advantage when the maximum transmitting antenna gain is limited by size restrictions and when the receiving antenna can be nearly omnidirectional.
In band 8 (VHF), or at higher frequencies, a satisfactory signal-to-noise ratio can be achieved using frequency modulation with a geostationary satellite or other high-altitude satellite, so that the lower altitude satellites do not appear to present any advantage.
A satellite with a period of 12 hours, in an elliptical orbit having a plane inclined at about 63° to the equatorial plane and an apogee of 40 000 km well north of the equator, can provide a larger area of coverage in the northern hemisphere than a geostationary satellite. The use of several satellites in such orbits can provide an uninterrupted service. The times of visibility of one satellite are given in Table II for a particular latitude (60° N) of the receiving point, and a particular minimum angle of elevation (20°). In theory, because of the non-spherical shape of the Earth, an inclination of the orbit of 63.4° would ensure that the major axis does not drift in the plane of the orbit, and, therefore, that successive apogees will occur at the same terrestrial latitude.
In the example of Table II, the minor axis of the orbital ellipse is assumed to be parallel to the equatorial plane. The maximum period of visibility from a given point on the Earth at latitude 60° (10.6 hours) is then obtained when the apogee is at the same longitude as the point.
In selecting highly elliptical orbits, it is preferable to avoid passage through the van Allen belt, or to ensure that satellites pass rapidly through the radiation region in order to avoid damage to components.

164 Rep. 215-4
For the various orbits, uninterrupted reception is possible only when the satellite remains within the beam of the receiving antenna. Therefore, assuming the antenna is Fixed, it must have a sufficiently large beamwidth to ensure the desired service.
If a sub-synchronous circular orbit is used, it would not be possible to employ most of the available period of visibility, using a fixed receiving antenna, unless the antenna is of low gain (e.g. a half-power beamwidth of 110° corresponding to a maximum gain of 6 dB).
If a sub-synchronous highly elliptical orbit is used, a fixed antenna of higher gain could be used (e.g. a half-power beamwidth of about 30° corresponding to a maximum gain of 15 dB).
If a geostationary satellite is used, the antenna gain can be higher than in the examples above, but the maximum antenna gain might be limited (because of the consequent small beamwidth) either by practical considerations of the receiving installation or by the lack of stability of the position of the satellite.
TABLE I - Visibility times fo r satellites in stationary and sub-synchronous circular equatorial (non-retrograde) orbits
Approximateperiod
(h)
Altitude(km)
Passes per day over a given point
Approximate periods o f visibility above the horizon per pass (h)
At equator At ± 1 5 ° lat. At ± 3 0 ° lat. At ± 4 5 ° lat.
24(') 35 786 Stationary Continuous Continuous Continuous Continuous12 20 240(2) 1 10.1 10.0 9.9 9.38 13 940(2) 2 4.8 4.7 4.6 4.26 10 3 9 0 0 3 3.0 2.9 2.8 2.53 4 190(2) 7 1.0 1.0 0.9 0.6
(') Exactly: 23 h 56 min 4 s. (2) Approximate values.
TABLE II — Visibility times o f a satellite in a typical elliptical orbit inclined at about 63.4°
Approximateperiod
(h)
Approximateapogee
(km)
Approximateperigee
(km)
Approximate periods o f visibility per pass (h) over a reception point at 60° latitude, with an angle o f elevation
of the receiving antenna greater than 20°
Maximum Minimum
12 40 000 500 10.6 4.5
2.2 System input factorsAs a first step, decide on system input factors. That is, the desired quality for various percentages of time,
the number of channels (including the number of accompanying audio programme channels) and the area of coverage on the Earth. The subject of quality of reception is discussed in greater detail in § 4.
2.3 Frequency o f operation
2.3.1 GeneralIn selecting a frequency band for a broadcasting-satellite system, the choice obviously is cons
trained not only by the number of allocations established in the Radio Regulations for the Broadcasting- Satellite Service, but by other factors such as current or planned use of certain frequencies shared with other services within the desired area of coverage, or in areas subject to interference from the system being planned (e.g., see Report 634-1).
One consequence of the choice of frequency is the effect on the necessary margin. Certain effects such as man-made and cosmic noise, and the attenuation from passage of signals through the atmosphere and attenuation and depolarization from precipitations, depend on frequency. (Typically cosmic and man-made noise are greater at the lower frequencies, while atmospheric effects generally become worse as the frequency is increased. (See Report 205-4).
Frequency allocations for the Broadcasting-Satellite Service have been made in bands 9, 10 and 11. There is already considerable experimental activity in bands 9 and 10. The technological feasibility of the Broadcasting-Satellite Service in bands 9 and 10 is being demonstrated by these experimental activities, and propagation conditions are generally favourable, as discussed below. Exploitation of the allocations in band 11 will be influenced by the temporal behavior of the propagation medium, by advances in the state of the art, by a demonstrated need and by the service continuity and quality requirements of the users of the Broadcasting-Satellite Service.

Rep. 215-4 165
2.3.2 Effects o f propagation
2.3.2.1 Attenuation
Extensive measurements of sky noise temperature at 11.5 GHz covering the European region, have been carried out by the European Space Agency for a number of years. Atmospheric attenuation was expected to vary with the angle of elevation and with the local climate. However, in the European region and for the range of angles of elevation, (from 20° to 45°) covered by the experiment, these dependencies are so small that they need not be taken into account when compared with the random year-to-year variations in attenuation values. The values of the worst-month attenuation obtained from the measurements are listed in Table III. For system planning, it is proposed to use the median values, corresponding to the worst month in an average year.
TABLE III — Worst-month attenuation at 11.5 GHz (Europe)
Time fraction (%)
Attenuation not exceeded during worst months (dB)
90% value median value 10% value
20 0.3 0.4 0.65 0.4 0.6 0.91 0.9 1.1 1.4
0.3 1.2 1.8 2.40.1 1.5 3.3 6.00.03 3.1 7.3 11.0
Further information is contained in Reports 564-1 and 565-1.For any frequency /'(GHz), other than 11.5 GHz, the atmospheric attenuation A f may be calculated
from the values for 11.5 GHz, A n s , by means of the following formula which is valid from 11.0 to14.5 GHz:
Af = A u s [1 + 0.2 ( / - 11.5)] dB
For Region 3, measurements of atmospheric attenuation in the 12 GHz band have been carried out using radiometers in Japan since 1967 and in Malaysia over two years, which are situated respectively in the moderate and tropical climate areas in Asia. The results are summarized in Table IV. While the data presented should be regarded as provisional, they may be considered useful until more precise data become available.
TABLE IV — Worst month attenuation observed at 11.8 G H z in Tokyo and Klang
Location of measurement Period
Attenuation not exceeded during the worst month (dB)
99% o f the worst month in an average year
99.9% o f the worst month in an average year
Tokyo 1967-1973 0.9 4.2
Klang Oct. 1970 to Nov. 1972 L7 8.7
Table IV lists the results, where measurements were corrected with respect to an elevation angle of 45° by using the cosecant law.
Measurements of rain attenuation at 11.7 GHz are being carried out at Greenbelt, Maryland and Rosman, North Carolina in the United States by the NASA/Goddard Space Flight Centre by monitoring the beacon on the Communications Technology Satellite (CTS). Measurements commenced at Greenbelt, Maryland in June 1976 and are still in progress. The elevation angles to CTS from Greenbelt and Rosman are 29.5 and 36 degrees respectively.
Measurements of rain attenuation at 20 GHz and 30 GHz were also carried out at Rosman using the ATS-6 satellite [Ippolito, 1975].
Table V summarizes the results of these measurements for the two worst months of the measurement period.

166 Rep. 215-4
TABLE V — Rain attenuation observed at 11.7 G H z (CTS) and 20 and 30 G H z (A TS-6) in M aryland and North Carolina, USA
LocationFrequency
(GHz) MonthOne-minute mean attenuation (dB),
not exceeded during month for given percentage o f the time
99% 99.9% 99.99%
Greenbelt 11.7 June, 1976 <1 1.6 9.2(Maryland) August, 1976 <1 5.4 15.6
Rosman 11.7 July, 1976 1 1.8 8.3(North Carolina) 20 July, 1974 1.5 11.0 > 20
30 July, 1974 2.4 19.5 >35
2.3.2.2 Polarization
In addition to their effects on attenuation, clouds and rain can cause depolarization of the signal. Statistical analysis of measured results with circular polarization in Region 1 suggests that the level of the depolarized component (relative to the level of the co-polar component after attenuation) can be expressed approximately in terms of the attenuation caused by the atmosphere, according to the following equation:Relative level of depolarized component (for circular polarization)
* - [30 - 20 log A] dB
where A is the atmospheric attenuation, in decibels [CCIR, 1974-78f]. If, for purposes of planning, it were desired to adopt a single figure for the level of the depolarized component, it would be necessary to choose the fraction of the time for which the figure is to apply. If this were taken as 1% of the worst month, then on the basis of the median values given in Table III, —30 dB would be an appropriate value. If, however, it were necessary to take the case of 0.1% of the worst month, the value would become approximately —20 dB.
Also, depolarization measurements are currently being taken with the CTS satellite launched in 1976 in the 12 GHz region, using both circular and vertical polarization. Actual measurements statistics from this programme have been analyzed in Report 564-1.
Report 564-1 shows that the cross-polarization discrimination (XPD) due to rain may be predicted from the co-polar attenuation (CPA) by an equation of the form:
XPDdB = - [ £ / - V log (CPAdB)]
where parameters U and V are functions of frequency, polarization tilt angle, elevation angle, canting angle, distribution of the rain drops, and to a much lesser extent, on dropsize distribution.
For circular polarization over slanted paths, reasonable approximations for U and V result in the following equation:
XPDdB = - [(30 log fGHz - 40 log (cos e)) - 20 log (CPAdB)]where,
f: frequency (GHz) e: elevation angle (degrees).This provisional equation appears to be valid over the following parameter ranges:10° < e < 60°8 GHz < f < 40 GHz 1 dB < CPA < 15 dB 10 dB < | XPD | < 40 dB.Thus for 12 GHz circularly polarized transmissions, the cross-polarization discrimination due to
rain can be expressed by:XPDdB [32.4 - 40 log (cos e) - 20 log (CPAdB)]
(A more detailed discussion of depolarization effects due to precipitation can be found in Report 814.)

Rep. 215-4 167
2.3.3 Effects o f additive radio noise
Additive radio noise * is produced from both natural and man-made sources (power lines, electrical apparatus, automobile ignition systems). Fig. 1 indicates typical noise levels associated with these sources, and shows that in the lower part of band 10 and in the greater part of band 9 a minimum of noise is introduced depending upon the conditions.
FIGURE 1 — Noise temperature from natural and man-made sources**
A: Cosmic noise background (Report 205-4).B : Minimum cosmic noise (Report 205-4).C : Maximum cosmic noise (Report 205-4).D : Typical man-made noise in “rural” area (omnidirectional receiving antenna)
(Report 670, Fig. 3).E : Typical man-made noise in “urban” area (omnidirectional receiving antenna)
(Report 670, Fig. 3).F : “ Urban” noise, adjusted for a directional antenna orientated at angles of
elevation greater than 45: noise discrimination equal to one half the gain of the antenna (in dB) is assumed with a gain of 8 dB at 20 MHz and 25 dB at 2500 MHz.
G: Typical noise due to rainfall and atmospheric absorption for 0.1 % of the time: temperate latitudes: angle of elevation 30°.
H : Typical noise due to rainfall and atmospheric absorption for 1.0 % of the time: temperate latitudes: angle of elevation 30°.
J : Night-time atmospheric noise (Report 322-1).
Attention is drawn to the fact that while many measurements of noise level have been made, evaluation o f this data is as yet incomplete. Therefore, the assumed noise levels must be considered as provisional.
This graph should be extended to 100 GHz and curves G and H should be projected according to the best available data, so as to include performance predictions for the 40 and 80 GHz Broadcasting-Satellite Service allocations. It is realized that curve E is in conflict with Fig. 1 of Report 258-3 for frequencies up to 250 MHz. Therefore, Curve E and, as a result, Curve F, should be treated with caution. Administrations and the appropriate CCIR Study Groups are requested to study and submit data.

168 Rep. 215-4
At present, limited information on the subjective aspects of impulsive noise is available [Pacini et al., 1971]. There is insufficient knowledge regarding the dependence of man-made noise on the angle of arrival, polarization, frequency, height of antenna,etc., to make adequate engineering analyses of the levels likely to be present at the terminals of the receiving antenna.
In addition to the noise sources indicated in Fig. 1, a significant increase in noise level can occur for short periods when the Sun is within the antenna beam, if narrow-beam receiving antennae (beamwidth less than about 5°) are used. For geostationary satellite orbits, these periods occur in the day-time for a few consecutive days in spring and autumn.
2.3.4 Suitable frequency bands
The portion of the spectrum including band 9 (Band V and above) and the lower part of band 10 is preferred for satellite broadcasting due to the lower values of atmospheric attenuation, scintillation and radio noise from natural sources. The usable frequency range is wider, extending into band 7 at the lower end and approaching 20 GHz at the upper end (Report 205-4 and Report 631-1). For broadcasting services to urban locations, man-made noise can represent the principal limitation to reception at all frequencies throughout band 9. Because of this, the attention of Administrations is drawn to the possibility of reducing this type of noise by means of regulations.
2.4 Required margin
The choice of frequency and the desired quality for various percentages of time dictate an operating margin. (See Report 811).
In the case o f frequency m odulation it is necessary to keep the carrier-to-noise ratio above the threshold for as high as possib le a percentage o f tim e (usually 99.9%) and also to achieve a given signal-to-noise ratio objective for a specific percentage o f tim e (usually 99%). Thus it is necessary to choose a margin above threshold such that both requirem ents are met sim ultaneously. This margin should include the atm ospheric loss and other term s not specifically included in the pow er budget. Tables III and IV give the m argins for atm ospheric loss for the European broadcasting area, and for Japan and M alaysia respectively. N evertheless, independent o f thepreceding considerations, a margin o f a few dB must also be envisaged, to avoid the appearance o f thephenom enon o f truncation noise; this occurs under conditions when transm itting television by frequency m odulation [C CIR, 1974-78a and h]. A s an exam ple, for a radio-frequency bandw idth o f 27 M H z, and a peak-to-peak frequency-deviation o f 14 M H z, this margin is about 4 dB for 625-line telev ision system s with an associated sound subcarrier.
2.5 Carrier-to-noise ratio and modulation index
Having determined the desired output signal-to-noise ratio, that is the ratio of peak-to-peak picture excluding synchronized pulses (the luminance signal) to weighted rms noise, the necessary carrier-to-noise ratio and modulation index can be determined. The expression relating S /N and C /N is given § 3 below.
2.6 E.i.r.p.
The requirement for the carrier-to-noise ratio (C/N) (or the carrier-to-noise temperature ratio (C/T), sincethe bandwidth is also known) enables one to calculate the e.i.r.p. The e.i.r.p. depends on the required carrier level, the path loss and the figure of merit of the receiving installation.
2.7 Television using frequency modulation
2.7.1 Bandwidths required
Table IV gives the equivalent rectangular bandwidth required for reception of the picture and either one, or four, sound channels and the radio-frequency channel bandwidth of the satellite transmitter for the 525-line systems. Table VII provides corresponding values for the 625-line systems. In all cases it is assumed that the four sound channels are obtained by frequency multiplexing of sub-carriers modulated by these sound channels. In these evaluations, the effect of energy dispersal has not been included. The use of energy dispersal would complicate receivers and would increase the bandwidth occupied by the signal from the satellite by 1 to 2 MHz. However, it may be decided that in certain frequency bands energy dispersal should be used to facilitate sharing with other services, for example, terrestrial fixed services. Other details are given in Report 631-1.
In the 12 GHz band, laboratory tests discussed in [CCIR, 1970-74b] have shown that for frequency- modulation transmission of a 625-line colour television signal accompanied with sound transmitted by a frequency-modulation sub-carrier, a good compromise was obtained between the transmitter bandwidth and the quality of the signal for a radio-frequency bandwidth of about 25 MHz.
Some tests carried out in Japan [CCIR, 1974-78a] have shown that in the transmission of frequency-modulated television signals accompanied by sound signals in a single channel, using a multiplexed frequency-modulation subcarrier at 4.5 MHz, satisfactory results can be obtained with a bandwidth of 23 MHz. Moreover, advantage can be taken of over-deviation to transmit six supplementary sound signals of medium quality, by means of a second subcarrier using frequency modulation and time-division-multiplexing by pulses.

Rep. 215-4 169
The bandwidth occupied by a signal from a broadcasting satellite must be increased to accommodate one or more sound channels. Typically this increase is a quite small percentage of the bandwidth required for the video alone. The radio-frequency channel width of the satellite transmitter must also be larger than the occupied bandwidth to account for both transmitter frequency instability and to keep adjacent channel interference to acceptably small values.
The increase in bandwidth to accommodate both sound channels and guard bands is of the order of 10% of the radio-frequency bandwith, b.
2.7.2 Frequency deviation and pre-emphasis
Planning of the broadcasting-satellite service has been based on the use of pre-emphasis characteristics given in Recommendation 405-1. However this does not preclude the use of other pre-emphasis characteristics, provided that the use of such characteristics does not cause greater interference. [WARC-BS, 1977, Annex 8, § 3.1].
[CCIR, 1974-78b] considers a technique for improving the video signal-to-noise ratio on an FM satellite link by optimizing the frequency deviation and the pre-emphasis characteristic simultaneously. Further studies are required to establish the applicability of this technique to the broadcasting-satellite service.
TABLE VI — Required width o f radio-frequency channels (MHz) fo r frequency-modulation television systems (525-line)
Number of sound channels
Frequency (MHz)
700 2600 12 000
Equivalent rectangular bandwidth of receiver (')
One 16-22 16-22 22-30
Four 20-26 20-26 27-35
Radio-frequency channel width o f satellite transmitter (2)
One 18-24 18-24 24-34
Four 23-29 23-29 30-40
O The following equation can be used to determine the approximate video peak-to-peak deviation which is applicable: B ~ l . \ (Dp.p + 2fb),
where: B : equivalent rectangular bandwidth (MHz),Dp.p \ video peak-to-peak deviation (MHz),fb : top baseband frequency including highest sound sub-carrier (MHz).
(2) Equal to the radio-frequency channel spacing.
3. Formulae governing system performance
In a frequency-modulation system:S /N = C /N + FdB + k w
where,S / N : ratio of peak-to-peak luminance amplitude to weighted r.m.s. noise (dB)C / N : pre-detection carrier-to-noise ratio in the radio-frequency bandwidth (dB)F : 3(Dp.p/fy)2 • (b/2fv) (power ratio which equals when expressed in dB)Dp_p : peak-to-peak deviation by video signal (including synchronization pulses) f v : highest video frequency; (e.g. 4.2 MHz in the case of System M)b : radio-frequency bandwidth (usually taken as Dp_p + 2f v)k w: combined de-emphasis and weighting improvement factor in frequency modulation systems (dB)
(see Table VIII).As an example of this formula Fig. 2 shows for individual reception of 12 GHz frequency-modulation
television signals (antenna diameter 0.75 m, noise factor 9 dB) the variation of luminance signal-to-noise ratio with frequency deviation for various values of Field strength (full-line curves). These data, based on the formula given above, refer to unweighted noise in a 5 MHz band and may be applied for all standards adopted for

TABLE VII — Required width o f radio-frequency channel (MHz) fo r frequency-modulation television (625-line systems)
170 Rep. 215-4
Number of sound channels
Frequency (MHz)
700 (3) 2600 12 000
Equivalent rectangular bandwidth of receiver (')
One 20-22 20-22 27 (4)
Four 24-26 24-26
Radio-frequency channel width of satellite transmitter (2)
One 22-25 22-25 25-30 (5)
Four 25-28 25-28
(‘) The following equation can be used to determine the approximate video peak-to-peak deviation which is applicable:B ~ L I (Dp.p + 2fb),
where: B : equivalent rectangular bandwidth (MHz),Dpp \ peak-to-peak deviation at video-frequencies (MHz),f b : top baseband frequency including highest sound sub-carrier (MHz).
(2) The channel spacing may differ from the channel bandwidth, depending on the value chosen for the adjacent-channel protection ratio.
(3) These determinations are tentative and require further study.(4) Corresponds to a frequency deviation of 13 MHz/V, and distortion introduced by the receiver equal to 10° for the differential
phase and 15% for the differential gain, with a filter having a sharp cut off (6 poles), and with a sound sub-carrier producing a deviation of ±2.8 MHz of the carrier.
(5) Estimated limits for the channel spacing, with the parameters given in (4) above and with an adjacent-channel protection ratio of —6 dB.
frequency-modulation transmission. No pre-emphasis has been assumed; the extent of the advantage of preemphasis is still under study. The following additional data are provided in the Figure from calculation or experiment for a 625-line, System I, although they will be approximately correct for all other standards:— the upper horizontal scale gives the approximate radio-frequency noise bandwidth, assuming that one sound
sub-carrier near 6 MHz is used;— the dashed curves give the carrier-to-noise ratio in the radio-frequency bandwidth;— the right-hand vertical scale gives the subjective grade for colour pictures (PAL system), using the six point
impairment scale of Note 8, Report 405-3.It should be emphasized that the data in Fig. 2 take into account the noise contribution of the down-link
only and allowance must be made for other contributions to the video noise (picture source, terrestrial links, up-link, etc.).
The relationship between satellite e.i.r.p. and earth-station Figure of merit is:
C / N = e.i.r.p. — L — B + G / T — K ore.i.r.p. = C / T + L - G / T (dB)
where,C J T : carrier-to-noise temperature ratio of the space-to-earth path, in dB (W/K);K : 10 log Boltzmann’s constant in &B(W/(K ■ Hz));L : free space path loss on the space-to-earth path, in dB;n = 2 0 log 4%R/X (where R is the distance and X is wavelength measured in the same units);G / T : gain-to-noise temperature ratio of the earth receiving station in dB; ( T expressed in K );B = 1 0 log b (b in Hz).The required satellite e.i.r.p. can be converted into required satellite transmitter output power, Ps, if the
satellite antenna gain, Gr is known:Ps = e.i.r.p. — Gt (dB)
The half-power beamwidth 0O can be determined once satellite antenna gain is speciFied:
e0 ** /2 7 000 !Gt ^ 223 X/(nD)
where GT is the antenna gain expressed as a ratio and D is the diameter of the antenna expressed in the same units as X, the wavelength. An antenna aperture efFiciency of 55% has been assumed.

Rep. 215-4 171
4520
Radio-frequency noise bandwidth (MHz)
25 30 35
40
2 35
30
25
401 >
2 0 ^ ,
-
__
1 6 ^V " ••
/
52 ( - 9 4 ] // /
/
/ /*
' 7 / X / 12
/ /f /
✓
/ * (" 9 8 > / //
-
/ / y/
, / /✓
/ > / J
f /
/ a a ( - 1 0 2 ) / /
/ / // -
/
/ //
/
1,5
2,5
10 12 14 16 18 20 22 24 26 28
Peak-to-peak deviation (MHz) (Sync, tip to white level)
3.5 -
FIGURE 2 — Requirements for satellite broadcasting (625-line television)
: field-strength required (dB(/xV/m)) for individual reception in the 12 GHz band (power flux-density is given, in brackets, (dB(W/m2))
———— : carrier-to-noise ratio in the radio-frequency noise bandwidth (dB)
Determination of exact coverage area on the ground is complicated because of the difficulty of determining the intersection of the satellite antenna beam with the spherical surface of the earth. For beams directed near the sub-satellite point, a 1.5° beam produces a coverage area with a diameter of about 1000 km. The same beam directed towards higher latitudes, or towards areas far removed in longitude from the sub-satellite point will cover a much larger area on the surface of the Earth [Ostrander, 1967; Sollfrey, 1966].
The following relationship exists between the units of field strength and power flux-density.The straightforward conversion between the unit of field strength, E, (dB(pV/m)) and power flux-
density W, (dB(W/m2)) is:W = E — 145.8
— the noise power in a 1 MHz bandwidth is —144.0 dBW at a noise temperature of 290 K,— 1 pV e.m.f. in a 75Q source corresponds to an available power of —144.8 dBW,— 1 pV e.m.f. in a 500 source corresponds to an available power of —143.0 dBW.

172 Rep. 215-4
The relation between the e.i.r.p. o f a geostationary satellite and the pow er flux-density at the surface o f the Earth is:
For the point on the Earth at latitude (p° and relative longitude (sub-satellite point = 0°) a° and with cos A = cos X cos (p, we obtain the fo llow in g relationship:
A ngle A (degrees) spreading loss, dB (m 2) *
0 (sub-satellite point) 162.180 163.4
For an angle o f elevation e, with tan e = (cosA — 0.1513 )/s in A, we obtain the fo llow ing relationship:
A ngle e (degrees) spreading loss, dB (m 2) *
0 163.490 162.1
4. Quality of reception
4.1 General considerations
The quality o f the television im age on the receiving screen depends on the signal-to-noise ratio, the level and nature o f any interference and on the various distortions occurring in the transm ission chain (studio, terrestrial link, up-link, satellite transmitter, signal path, receiver). V arious m ethods o f m aking subjective assessm ents o f the quality o f television pictures and the parameters involved are given in the references o f Report 313-4. Scales for assessing the quality o f television pictures are considered in Report 405-3. The signal-to- noise ratio is a very im portant parameter in calculating television system s and planning transm ission networks and for this reason attention is focussed on this particular parameter. In selecting the required value o f the signal-to-noise ratio, account must in m any cases also be taken o f other television signal distortions. In television , the signal-to-noise ratio at v ideo frequencies is defined as the ratio, expressed in decibels, o f the nom inal peak-to-peak am plitude o f the picture-lum inance signal to the r.m.s. value o f the noise in the w orking video frequency band (R ecom m endation 567).
The quality o f service provided by a broadcasting-satellite system (w hich will be substantially uniform over the w hole service area) should be higher than that recom m ended for the edge o f a terrestrial broadcasting service area (in which the quality is very much better at the centre than at the edge). Two grades o f reception quality (prim ary and secondary) are defined in Report 306-3.
The objectives to be aim ed at for reception quality for com m unity reception should be good , to meet the special requirem ents o f educational program m es in television transm ission and should certainly not be low er than those considered appropriate to a terrestrial broadcasting system intended for individual viewing.
The subjective effect o f noise depends upon the spectral distribution o f the noise energy within the video-frequency band. W hen m easuring noise pow er, it is com m on practice to use w eighting networks which take account o f this fact, with the result that the weighted noise pow er at video frequencies is low er than the total noise pow er by a factor depending on the spectral distribution. For m ost television system s, the available w eighting netw orks are designed so that, for various spectral distributions o f the noise, the m easurem ents more closely represent the subjective im pression on m onochrom e pictures than do unw eighted noise m easurem ents; for colour telev ision , the subjective effect needs special consideration.
T A B L E V III** - Video-frequency noise weighting-networfc reduction factor for monochrome television
SystemWeighting (dB) W eighting including
de-em phasis, kw (dB)
White noise Triangularnoise Triangular noise
B, C, E, F, G, H and M (Japan) 8.5 16.3 16.3D, K, L 9.3 17.8 18.1I 6.5 12.3 12.9M (Canada, USA (') 6.8 10.2 13.8
O Weighting factors for 525-line System M (Canada, USA) are based on Recommendation 567. Values according to Report 637-1.
2 2* The e.i.r.p. (dBW) minus the spreading loss in dB (m ) is equal to the power flux-density (dB(W/m )), atmospheric loss notincluded.
** When using pre-emphasis according to Recommendation 405-1, the combined effect of weighting and de-emphasis for triangular noise is approximately the same as that of weighting alone. More details are given in Report 637-1.
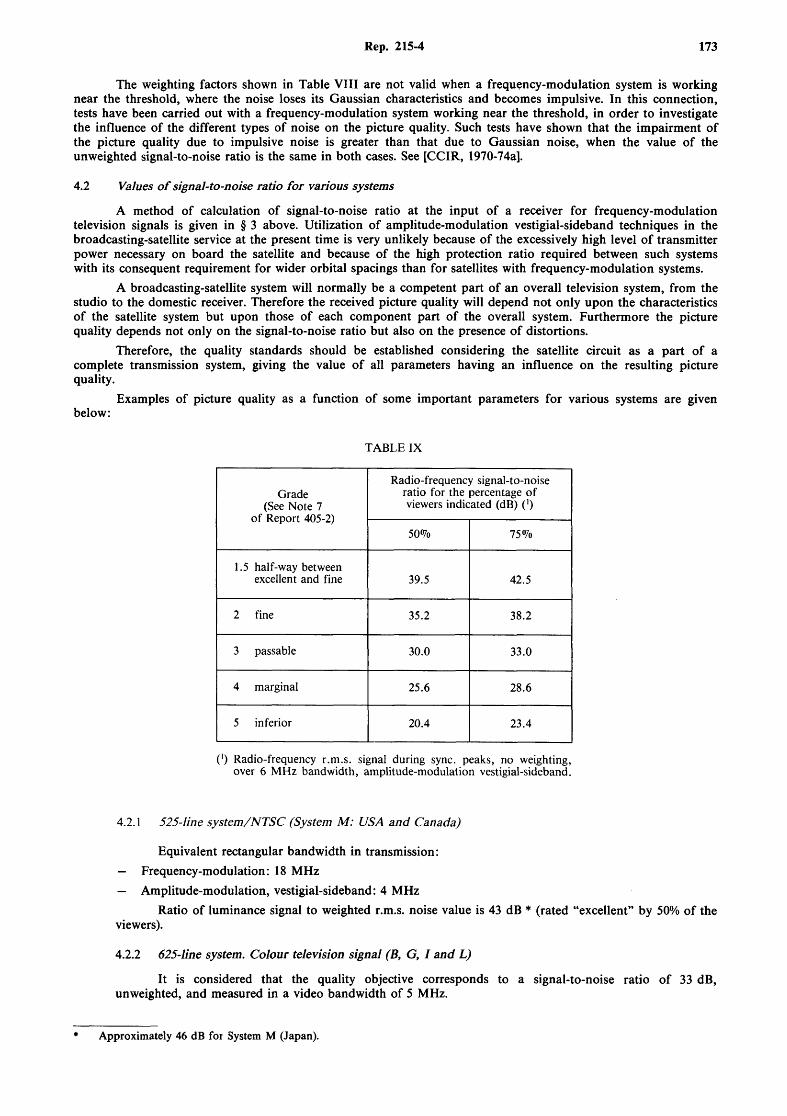
Rep. 215-4 173
The weighting factors shown in Table VIII are not valid when a frequency-modulation system is working near the threshold, where the noise loses its Gaussian characteristics and becomes impulsive. In this connection, tests have been carried out with a frequency-modulation system working near the threshold, in order to investigate the influence of the different types of noise on the picture quality. Such tests have shown that the impairment of the picture quality due to impulsive noise is greater than that due to Gaussian noise, when the value of the unweighted signal-to-noise ratio is the same in both cases. See [CCIR, 1970-74a].
4.2 Values o f signal-to-noise ratio for various systems
A method of calculation of signal-to-noise ratio at the input of a receiver for frequency-modulation television signals is given in § 3 above. Utilization of amplitude-modulation vestigial-sideband techniques in the broadcasting-satellite service at the present time is very unlikely because of the excessively high level of transmitter power necessary on board the satellite and because of the high protection ratio required between such systems with its consequent requirement for wider orbital spacings than for satellites with frequency-modulation systems.
A broadcasting-satellite system will normally be a competent part of an overall television system, from the studio to the domestic receiver. Therefore the received picture quality will depend not only upon the characteristics of the satellite system but upon those of each component part of the overall system. Furthermore the picture quality depends not only on the signal-to-noise ratio but also on the presence of distortions.
Therefore, the quality standards should be established considering the satellite circuit as a part of a complete transmission system, giving the value of all parameters having an influence on the resulting picture quality.
Examples of picture quality as a function of some important parameters for various systems are givenbelow:
TABLE IX
Grade (See Note 7
o f Report 405-2)
Radio-frequency signal-to-noise ratio for the percentage o f viewers indicated (dB) (')
50% 75%
1.5 half-way between excellent and fine 39.5 42.5
2 fine 35.2 38.2
3 passable 30.0 33.0
4 marginal 25.6 28.6
5 inferior 20.4 23.4
(') Radio-frequency r.m.s. signal during sync, peaks, no weighting, over 6 MHz bandwidth, amplitude-modulation vestigial-sideband.
4.2.1 525-line system/NTSC (System M: USA and Canada)
Equivalent rectangular bandwidth in transmission:— Frequency-modulation: 18 MHz— Amplitude-modulation, vestigial-sideband: 4 MHz
Ratio of luminance signal to weighted r.m.s. noise value is 43 dB * (rated “excellent” by 50% of the viewers).
4.2.2 625-line system. Colour television signal (B, G, I and L)
It is considered that the quality objective corresponds to a signal-to-noise ratio of 33 dB, unweighted, and measured in a video bandwidth of 5 MHz.
* Approximately 46 dB for System M (Japan).

174 Rep. 215-4
4.2.3 625-line system (System K)
Equivalent noise band of amplitude-modulation receiver: 4.6 MHz.Three main classes of picture quality are considered:
Class I: picture of excellent quality (on a picture tube of any screen size). When the picture is viewedfrom a distance equal to 5 to 6 times the height of screen, the noise is on the threshold of perception.
Class II: picture of very satisfactory quality (on picture tube of medium and small screen size). The noiseis perceptible, but causes no interference to the picture and is not objectionable to the viewer.
Class III: picture still acceptable on cheap television receivers with small screens. The noise is quitenoticeable and causes interference to a degree which can be accepted.
Appropriate values for the signal-to-noise ratio are given in Table X.
TABLE X
Class o f picture quality I II III
Ratio o f picture signal-to-weighted r.m.s. noise value at the picture tube control electrode (dB) 46 39 32
Carrier-to-noise ratio at receiver input (dB) 44 37 30
4.2.4 625-line system. Colour television signal (PAL system)
A ssum ing a chain consisting o f a studio, a terrestrial radio-relay link, a broadcasting-satellite system and a dom estic receiver, and w hen all the im pairm ents have values quoted in Table X I, the overall subjective quality grade will be 2.6 (on the 5-point scale; see R ecom m endation 500-1). The overall grade w ould be 2.9 if the signal-to-noise ratio o f the dow n-link were increased by 3 dB, the other im pairm ents rem aining at the sam e value.
TABLE XI — Parameter values
Component o f the chain
Parameter
Differentialphase
(degrees)
Differentialgain
(%)
Chrominance/ luminance
gain inequality (%)
Chrominance/ luminance
delay inequality (ns)
Signal-to-noiseratio
(weighted)(dB)
Studio ± 5(') ± 5(>) ± 5 0 ± 10 48
Terrestrial circuit ± 5 0 ± 10(>) ± 1 0 0 ± 50 56(J)
Satellite system ± 5 0 ± 1 0 0 ± 1 0 0 l+ O
Domestic receiver ± 1 0 0 ± 1 5 (5) 0 ± 100 46(4)
O Statistical variable and not exceeded at least for 80% o f any month.(2) Exceeded at least for 80% of any month.(3) It is assumed that the receiver distortion is equalized by manual chroma control.(4) This assumes an unweighted signal-to-noise ratio o f 33 dB, and a noise-weighting factor (including effect o f pre-emphasis)
o f 13 dB. The minimum performance would be achieved at the edge o f the service area in the least favourable case, for 99% of the time.
(5) Studies have shown that these tolerances can be achieved in practice with simple filters without correction circuits in the receiver, when the frequency deviation is about 14 M Hz/V and the —3 dB bandwidth is 27 MHz. As a first approximation, these values may be considered as constant with time.
4.3 Influence o f standards for television
Three categories of standards may be distinguished as follows: picture standards, transmitting standards, and channel standards. The picture standard describes the scan process, line structure, etc., as set forth in Report 624-1. The transmitting standard describes the radio-frequency radiated signal, giving its modulation mode, the spacing between the sound carriers, etc. This standard also appears in Report 624-1. The channel standard gives the radio frequency and assigned bandwidth.

Rep. 215-4 175
To provide a television broadcasting-satellite service, three approaches may be considered:— to match exactly the existing standards as employed for terrestrial broadcasting in the geographic area of
interest;— to provide a receiving device to convert the satellite signal into one usable by a standard receiver;— to provide a receiver designed specifically for the broadcasting-satellite service.
Factors relating to receiving converters are discussed in Report 473-2.
4.4 Influence o f the up-path
The characteristics of the up-path also have an effect on the overall system design. Studies carried out in France have shown that in the 11 and 14 GHz frequency bands system designs based on practically no noise contributions from the up-path are feasible and even desirable. In this case, the operating conditions and the modulation parameters of the system may be determined solely from the down-path data with a small allowance for up-path noise degradation. However, for high up-path frequency bands (30 GHz, for example), it may be necessary to strike a compromise between the ground e.i.r.p. and the satellite e.i.r.p. Here, the noise contribution and the percentage of time for which the up-path service is interrupted may have to be allowed for in calculatingthe system characteristics if efficient path diversity is not employed.
It is desirable that the carrier-to-noise ratio of the up-path should be maintained at a value such that the impairment of the down-path carrier-to-noise ratio does not exceed 0.5 dB for 99% of the time. To limit an impairment to about 0.5 dB, the difference between the carrier-to-noise ratios of the up-path must exceed that of the unimpaired down-path by about 10 dB. For example, to achieve an overall carrier-to-noise ratio of 14 dB requires an unimpaired carrier-to-noise ratio of 14.5 dB on the down-path and a carrier-to-noise ratio of the up-path of 24.5 dB. Similarly it is convenient that the carrier-to-noise ratio of the up link should be maintained at a value such that the overall carrier-to-noise ratio remains above the threshold during 99.9% of the time.
Attenuation margins for up-paths using the 11 or 14 GHz bands may be estimated by using the methods of § 2.2. Specifically, for the European region and for the range of elevation angles between 20° and 45°, up-path attenuation margins of about 1.1 dB at 11.5 GHz and 1.6 dB at 14.5 GHz for 99% of the worst month and about3.3 dB at 11.5 GHz and 4.5 dB at 14.5 GHz for 99.9% of the worst month are adequate.
Attenuation margins for up-paths using the 30 GHz band are significantly greater and are dependent onthe angle of elevation.
Estimates for the 30 GHz band are based on measurements made in the USA using the 30 GHz beacon on the Applications Technology Satellite 6 (ATS-6). These measurements were made in the Rosman NC area during the period July-August, 1974 and as such are representative of the attenuation on the earth-space path to be expected during the worst months. An attenuation of less than 4 dB and 14 dB was measured for 1.0% and 0.1% of the time, respectively, for an angle of elevation of 47° [Ippolito, 1975]. Extrapolation of the attenuation measured at an angle of elevation of 47° to an attenuation at an angle of elevation of 20° is accomplished by using
A {6) = A(S0)(cosec 8/cosec 80) dB (1)
where A(80) is the measured attenuation at an angle of elevation of 80(47° in this case) and A (8) is the predicted attenuation at an angle of elevation, 8, [Goldhirsh, 1975].
The required attenuation margins for 30 GHz up-paths must therefore exceed, for 99% of the time: 4 dB for an angle of elevation of 47°, escalating to 8.6 dB for an angle of elevation of 20°; and for 99.9% of the time: 14 dB at an angle of elevation of 47°, escalating to 30 dB for an angle of elevation of 20°.
It may be concluded that the use of the 30 GHz band will result in substantial over-dimensioning of the up-path. Alternatively, the use of up-path site diversity is suggested to minimize the up-path margins.
5. System examples
The tables in this section give, purely as illustrative examples *, the parameters of broadcasting-satellite systems, using a geostationary satellite of a type that might be possible in the future. It will be observed that some of the examples call for transmitter powers greater than those likely to be practicable for many years. Furthermore, these examples do not take into consideration frequency sharing with other services. However, the parameters of these examples might be modified to correspond to other possibilities which demand less satellite power.
Examples given are for the bands allocated by the World Administrative Radio Conference for Space Telecommunications, Geneva, 1971. Attention is drawn to the fact that different assumptions are made in the various examples, particularly regarding the reception quality, the receiving installation (noise factor, antenna size) and the area served as determined by the transmitting antenna beamwidth. For this reason, caution must be exercised when comparing the transmitter powers, etc., indicated in the tables.

176 Rep. 215-4
The way in which the values given in the tables for the transmitter power in the satellite may be modified, if adjustment is made to any of the assumed parameters, is summarized below:
— assuming the use of a transmitting antenna beam of circular cross section, halving the beamwidth will permit a reduction of power by 6 dB. Doubling the beamwidth will require 6 dB more power.
' — an increase in the signal-to-noise ratio, made in order to achieve better quality, will require a correspondingincrease (in decibels) in the transmitter power. Similarly a decrease will permit an equivalent decrease in thepower, but with frequency modulation, the deviation and radio-frequency bandwidth have to be lowered, if the region of the threshold of the discriminator is approached;
— an increase in the factor of merit of the receiving system will lead to a reduction (by an equal amount indecibels) of the transmitter power required and vice versa.
Thus the examples, modified as desired, can serve to indicate the conditions that would be required to enable the public to receive broadcast programmes whose technical quality would be comparable at all times with that of the services provided in the conventional way by a network of terrestrial transmitters.
These examples derive the field strength required for certain stated receiver characteristics. Other assumptions can be made (as for example in [CCIR, 1966-69b], which deals with colour television systems) which will result in different required field strengths, and different requirements for satellite e.i.r.p. The object of all of these examples is to establish a reasonable range of satellite power output requirements for a broadcasting-satellite service.
5.1 Television broadcasting
Tables XIIA and XIIB present examples of community reception and individual reception television systems respectively with different frequencies, operating and quality conditions. Columns 1, 2, 3, 8 and 10 refer to television system M, the first three for community reception and the fourth and fifth for individual reception. In these examples the sound channel has been left out.
Column 9 relates to individual reception with systems G, I or L; the calculations are based on angles of elevation, of 20° to 45°, adopting the value for the peak-to-peak deviation, namely 13.3 MHz for 1 V of video signal at the reference frequency of the pre-emphasis curve in Recommendation 405-1. In the example described by these two columns, the sound channel is constituted by the sub-carrier at a frequency of 6 MHz, modulated with a 50 kHz peak-to-peak deviation and producing a carrier deviation of ± 2.8 MHz.
For the examples relating to system M (USA, Canada) a value of 43.3 dB is assumed for the luminance signal-to-weighted r.m.s. noise ratio at the edge of beam, this value being representative of the primary reception quality; for secondary quality, a value of 36.3 dB could be adopted, which would require an e.i.r.p. only 1.5 dB below the value for primary quality.
For the example relating to systems G, I and L, and with the figure of merit given in Report 473-2, the signal-to-noise ratios remain respectively above the values of 33 dB (unweighted) for luminance and 50 dB (weighted) for sound for 99% of the most unfavourable month (in European climatic conditions) throughout the entire service area during the entire useful life of the satellite and the receiving installation and with the angle of elevation giving the least good result. Under the same conditions, the carrier-to-noise ratio at the receiver input remains above 10 dB for 99.9% of the most unfavourable month with the atmospheric margin defined in § 2.4 of this Report.
The system examples at 23, 42 and 85 GHz are shown in columns 5, 6, 7 and 12 of Table XIIA and XIIB. This is done for purposes of comparison with 12 GHz system, assuming that all systems use the existing 525-line television standard, though in some cases, these frequency bands might be used for different television standards not compatible with the existing systems [Report 801]. Therefore this is not to imply that the parameter values shown represent an optimum or even feasible system.
For comparison purposes, some parameters in columns 5 and 6 contain some of the same assumptions as the example in column 3 for 12 GHz, they are: beamwidth of the receiving antenna and luminance signal-to- weighted noise ratio. Thus the required satellite transmitter powers are 440 W, 1.7 kW and 43 kW, which are higher than those at 12 GHz, but this is not to say that these systems will not be implemented.
Some Administrations may find it necessary to use these bands to establish systems in the future because of frequency congestion in other bands, or because of heavy terrestrial use of lower bands, in particular 11.7 to12.2 GHz. In such cases, the use of lower values of S/N , less margin for atmospheric attenuation, and smaller satellite and receiving installation antenna beamwidths may be acceptable. These savings, in conjunction wit! lower loss and low°r noise temperature designs all have the effect of reducing the required satellite transmitter power to levels that may be technically and economically feasible.

Rep. 215-4 177
TABLE XII A — Examples o f community reception television system parameters
Parameter(') 1 2 3 4(15) 5 6 7
1. System
Frequency o f carrier (MHz) 700 2600 12 000 12 000 22 750 42 000 85 000
Type o f modulation FM FM FM FM FM FM FM
Angle o f elevation (degrees)
Approximate equivalent rectangular bandwidth(MHz) 19 20 17 25 40 40 44
Carrier-to-noise ratio before demodulation(exceeded for 99% o f the time) (dB) (2) 16 15 18 22 11 11 11
Number o f lines in system 525 525 525 525 525 525 525
Corresponding luminance signal-to-weightedr.m.s. noise ratio (edge o f beam) (dB) (3) 43.3 43.3 43.3 50 43.3 43.3
Luminance signal-to-unweighted noise ratiomeasured in a nominal bandwidth (edge o fbeam) (dB) (4) 31.8 31.8 31.8 36.2 38 31.8 31.8
Audio-frequency signal-to-weighted noise ratio(weighting specified in Recommendation 468-2pre-emphasis is 50 (is) measured in a 15 kHzaudio-frequency band (edge o f beam) (dB)
2. Receiving installationFigure o f merit, G /T , (dB) ( l3) 24
System noise factor (dB) (5) 5.6 5.6 5.6 4.4
System noise temperature (K) 750 750 750 500 1100
Noise power in radio-frequency bandwidth forthe above noise factor (dBW) (6) — 127 — 127 — 128 — 127.6 — 122.2 — 123.7 — 122.7
Carrier power required (dBW) — 111 — 112 — 110 — 105.6 — 111.2 — 112.7 — 111.7
Antenna diameter (m) (7) 3.4 3 1.5 3.66 0.8 0.5 0.254
Receiving antenna gain, relative to an isotropicsource (dB) (8) O 25 36 43 50.7 43 44 44
Effective area o f antenna, S (m2) 10 log S 7 6 0 7.6 — 5.6 —9.6 — 15.6
Required flux (edge o f beam) (99% o f the time)(dB(W/m2)) — 118 — 118 — 110 — 113.2 — 105.6 — 103.1 —96.1
Equivalent field strength (edge o f beam):(dB(jiV/m)) 28 28 36 32.6 42.9 49.9
(jiV/m) 25 25 63 42.7 140 310
Free-space attenuation between isotropicsources 39 000 km apart (dB) 181 192 206 206
Total atmospheric attenuation exceeded for lessthan 1% o f the time (dB) (10) 0 0 1
Free-space attenuation between isotropicsources 35 786 km apart (dB) 210.6 217 223
Additional free-space attenuation (dB) 2 (>4) 2(14) 2(14)
Additional loss equivalent to up-path noise(provisional value) (dB) 0.4 0.5 0.5 0.5
Atmospheric attenuation for 99% o f the mostunfavourable month 1 4 8 15
Required e.i.r.p. from satellite at beam edge(dBW) 45 44 54 51.2 62.9 69.3 83.3
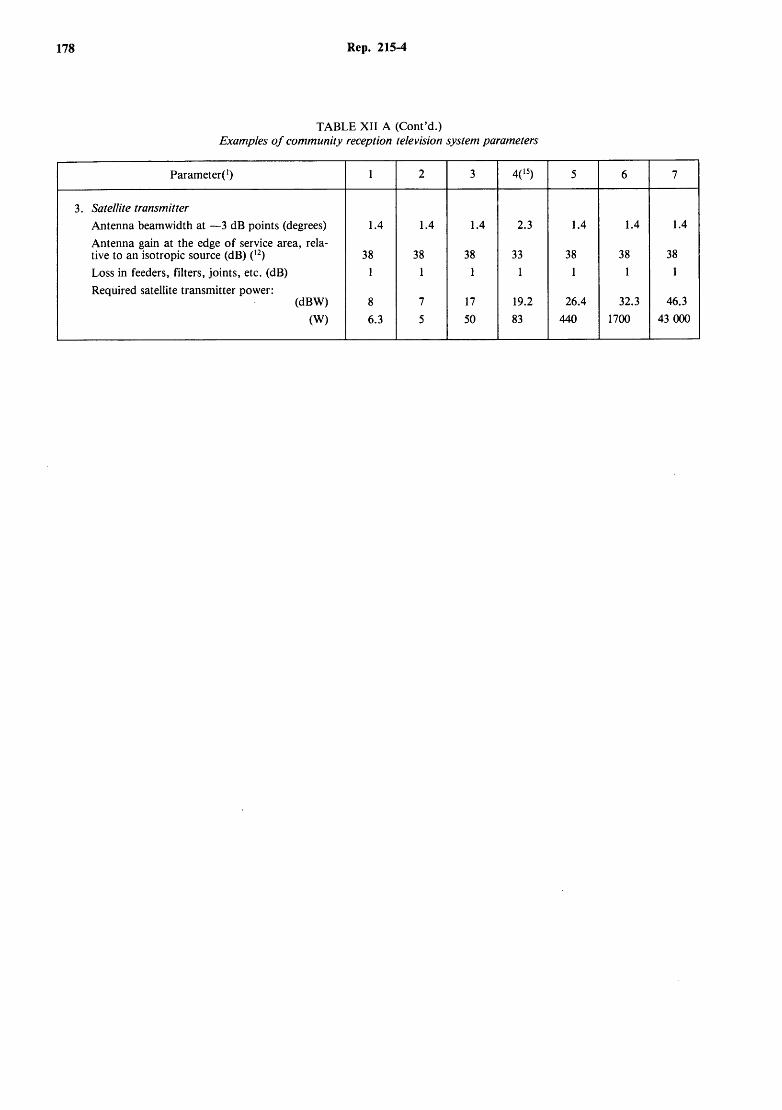
178 Rep. 215-4
TABLE XII A (Cont’d.)Examples o f community reception television system parameters
Parameter(') 1 2 3 4(15) 5 6 7
3. Satellite transmitterAntenna beamwidth at —3 dB points (degrees) 1.4 1.4 1.4 2.3 1.4 1.4 1.4
Antenna gain at the edge o f service area, relative to an isotropic source (dB) (12) 38 38 38 33 38 38 38
Loss in feeders, filters, joints, etc, (dB) 1 1 1 1 1 1 1
Required satellite transmitter power:(dBW) 8 7 17 19.2 26.4 32.3 46.3
(W) 6.3 5 50 83 440 1700 43 000

Rep. 215-4 179
TABLE XII B — Examples o f individual reception television system parameters
Parameter!') 8 9(») 10 IK 15) 12
1. SystemFrequency o f carrier (MHz) 700 12 000 12 000 12 000 22 750Type of modulation FM FM FM FM FMAngle o f elevation (degrees) 20-45 10(15)Approximate equivalent rectangular bandwidth (MHz) 19 27 23 18 40Carrier-to-noise ratio before demodulation (exceeded for 99% o f the time) (dB) (2) 16 14 13.5 17.7 11Number o f lines in system 525 625 525 525 525Corresponding luminance signal-to-weighted r.m.s. noise ratio (edge o f beam) (dB) (3) 43.3 43 44Luminance signal-to-unweighted noise ratio measured in a nominal bandwidth (edge o f beam) (dB) (4) 31.8 33.5 29.2 30.2 38Audio-frequency signal-to-weighted noise ratio (weighting specified in Recommendation 468-1, pre-emphasis is 50 ps) measured in a 15 kHz audiofrequency band (edge o f beam) (dB) 50
2. Receiving installationFigure o f merit, G /T , (dB) (13) 6 12System noise factor (dB) (5) 6 8 4.4System noise temperature (K) 1100Noise power in radio-frequency bandwidth for the above noise factor (dBW) (6) — 125 — 123 129 — 122.2Carrier power required (dBW) — 109 — 109.5 111.3 — 111.2Antenna diameter (m) (7) 1.0 1.0 0.5Receiving antenna gain, relative to an isotropic source (dB) (*) O 16 39.4 39.4 39Effective area o f antenna, S (m2) 10 log S —2 —3.6 —3.6 —9.6Required flux (edge o f beam) (99% o f the time) (dB(W /m2)) — 107 — 103 — 105.9 — 107.7 — 101.6Equivalent field strength (edge o f beam):
(dB(pV/m)) 39 42.8 40.3 38.1(pV/m) 89 138 103.5 80.3
Free-space attenuation between isotropic sources 39 000 km apart (dB) 181Total atmospheric attenuation exceeded for less than 1% o f the time (dB) ( ,0) 0Free-space attenuation between isotropic sources 35 786 km apart (dB) 205.1 205.9 205.9 210.6Additional free-space attenuation (dB) 0.8 1.0 2(14)Additional loss equivalent to up-path noise (provisional value) (dB) 0.5 1.0 0.4 0.5Atmospheric attenuation for 99% o f the most unfavourable month 2.5 4Required e.i.r.p. from satellite at beam edge (dBW) 56 62.2 61 56.7 66.9

180 Rep. 215-4
TABLE XII B (Cont’d.)Examples o f individual reception television system parameters
Parameter(') 8 9(") 10 IK 15) 12
3. Satellite transmitterAntenna beamwidth at —3 dB points (degrees) 1.4 1 1.8 2.3 1.4Antenna gain at the edge o f service area, relative to an isotropic source (dB) (12) 38 41 36 34 38Loss in feeders, filters, joints, etc. (dB) 1 1.5 1.0 1.0 1.0Required satellite transmitter power: (dBW) 19 24 26 23.7 30.4
(W) 80 251 400 235 1100
FOOTNOTES TO TABLES XIIA AND XIIB
(1) In co lu m n s 1, 2, 3 , 6 , 7 and 8 no a cco u n t was tak en o f pre-em phasis. F or co lu m n s 4 , 10 and 11 th e use o f pre-em phasis as spec ified in R eco m m en d a tio n 4 0 5 -1 w as assum ed.
(2) T he carrier level con sid ered is th e r.m .s. value o f th e u n m od u la ted carrier and th e carrier-to-noise ratio at th reshold is assum ed to be 11 dB in co lu m n s 1, 2, 3 and 8 and 10 dB in co lu m n 9 . In co lu m n s 9 and 10 , th e th resh old is assum ed to be reached for 0.1% o f th e m o st un favourable m on th .
(3 ) T h ese values w ill norm ally be degraded slightly (ty p ica lly by 0 .5 dB ) by th e n o ise co n tr ib u tio n o f th e E arth-to-satellite path. The values are derived assum ing w eightin g according to R eco m m en d a tio n 5 6 7 , A n n ex III.
(4) T h e term equ iva len t to th e n o ise o n th e E arth-to-satellite path w as e x p lic itly in trod u ced w ith a ten ta tive value in co lu m n 9. In th e sam e c o lu m n th e lu m in an ce signal-to-noise ratio is in d icated as an u n w eigh ted value, particularly ow ing to th e ex isten ce o f d ifferen t w eightin g n etw ork s in sy stem s G, I and L. F or th e sound signal-to-noise ratio , th e w eightin g is th at sp ecified in R eco m m en d a tio n 4 6 8 -2 .
(5 ) A pre-am plifier or frequency-chan ger near th e anten na is assum ed .
(6) T he figures listed in co lu m n s 1, 2, 3 and 8 are valid for an an ten n a tem p eratu re o f ab ou t 3 0 0 K. T h e anten na tem perature assum ed in co lu m n 10 is 100 K.
(7) F or ind ividu al recep tion at 7 0 0 M H z, th e receiving anten na is assum ed to be a crossed yagi or a helica l array w ith a gain o f16 dB : p arabolo id anten nae are assum ed for th e o th er cases. F or c o m m u n ity recep tion at 12 G H z, th e ch o ic e o f a 1 .5 m parab o lo id an ten n a was to som e e x te n t d ic ta ted by beam p o in tin g con sid era tion s and sate llite p o sitio n a l errors. F or co lu m n 10 o th er an ten n a sizes such as 75 cm m ay be used d epend ing on th e G/T ch osen .
(8 ) A n an ten n a e ffic ie n c y o f 55% is assum ed .
(9) C ircularly polarized anten nae are assum ed at b o th th e transm itting and receiving ends. A llow an ces for e llip tic ity losses due to im p erfec tio n s in th e anten na, m o v em en t o f th e supporting structures, e tc ., and perturbations in th e p o s itio n o f th e sa tellite have b een in c lu d ed in th e m argin ab ove th reshold .
( to ) T hese exam p les app ly to an angle o f e leva tion o f 3 0 and to tem p erate c lim ates, w here a tm osp h eric a tten u a tio n is neglig ib le at7 0 0 M Hz and 2 6 0 0 MHz and sm all at 12 G H z. In o th er regions, esp ec ia lly trop ical and sub-trop ical areas, a tm osp h eric a tten u ation w ill require a higher margin.
(11) T h ese exam p les app ly to E uropean c lim atic c o n d itio n s .
( 12) In th e exam p le tak en for co lu m n s 1, 2 , 3 and 6 , th e beam w id th w ou ld cover an area o f ab ou t 1 0 0 0 km in th e East-W est direct io n and ab o u t 1 0 0 0 km or m ore (d ep en d in g o n th e geographical la titu d e) in th e N orth -S ou th d irec tio n . T he ex a m p le taken for C olum ns 7 and 8 m ay corresp ond to th e coverage o f a E uropean cou n try o f average size. In th is exam p le , a red u ctio n o f A G q eq u al to 3 dB o f th e anten na gain at th e edge o f beam in relation to th e m axim um gain w as assum ed . F or th e sam e service area, th e param eter A G 0 m ay be ch o sen arbitrarily in a range from ab ou t 3 to 6 dB . T his results in a variation o f th e m axim um anten na gain , but th e required sa te llite transm itter pow er rem ains practically unch anged . In th e case o f an e leva tion angle o f 1 5 ° , i f w e tak e, for exam p le , A G 0 = 4 .3 4 dB , w hich corresp onds to th e th eo retica lly op tim u m value, th e m axim um an ten n a gain is 4 5 .6 dB (in stead o f 4 4 dB ) and th e transm itter pow er is red uced by 0 .3 dB.
(13) In accord an ce w ith th e d efin itio n in th e exam p le sh ow n in th e A nnex to R eport 4 7 3 -2 .
(14) Im p erfect po lar iza tion and anten na p o in tin g loss.
(15) T he ex a m p les show n in co lu m n s 4 and 11 reflect th e U S assessm en t o f th e an ticipated state-o f-the-art w ith regard to earth sta tion sen sitiv ity ; th e values g iven sh ow m ore sen sitive receiving system s than ad op ted at W ARC-BS (G eneva, 1 9 7 7 ). F or C om m u n ity R e cep tio n (co lu m n 4 ) th e assessm ent is based on system s w here very large num bers o f earth sta tion s are n o t required. It also refle cts th e p ossib ility for estab lish ing an im p roved en v iron m en t for sharing w ith th e fix ed -sa te llite service in R eg ion 2.

Rep. 215-4 181
TABLE XIII — Power flux-densities required at the edge o f the beam on the basis o f the examples given in Table A7(') (System M (USA, Canada), frequency-modulation television, primary service grade)
Category o f power flux-Power flux-density (dB(W /m 2)) at frequency (MHz)
density(2)700 2600 12 000
High — 101 (I, U) - 9 9 (I, U) — 99 (I, R)
Medium — 107 (I, R) — 110 (C, U) — 110 (C, R)
Low — 114 (C, U) — 118 (C, R)
— 118 (C, U) — 118 (C, R)
I : Individual U: UrbanC: Community R: Rural
(') The values in dB(W /m 2), are the total power flux-density as measured with an antenna that matches the polarization o f the transmitter. The required flux density is about 1 dB greater for 625-line systems. The required flux density is approximately1.5 dB less for secondary service rather than primary service. Since the values are the minimum requirements at beam edge, it should be noted that the values will be greater in other areas and when propagation conditions are favourable.
(2) These power flux-densities represent an attempt to categorize levels in accordance with Recommendation 565.
Table XIII is intended to illustrate a simplified form of presentation; numerical values should, of course, be revised if necessary to take into account any new contributions concerning system examples.
5.2 Sound broadcasting
Tables XIV and XV present alternative examples of parameters for providing a number of sound channels each suitable for monophonic services for individual reception at 12 GHz. Stereophonic broadcasts can be made using two (or more) such channels (see Report 632-1). Some sound channels could also be associated with television programmes, additional to the sound channel transmitted as proposed in § 5.1 for 625-line television systems.
5.3 Other applications to existing and new services
It is agreed as a basic premise that the introduction of these transmissions within a television channel must not create additional interference to other systems nor require additional protection over that required for the standard application of the Broadcasting Satellite Service, e.g. television transmission.
5.3.1 Broadcasting o f data in a frequency-modulated television channel
It is now possible to envisage the use of certain television signal lines for broadcasting data in the Broadcasting-Satellite Service.
The introduction of these new signals should not alter the characteristics of the television channel, the interference levels or the criteria for sharing with other services, as defined by the WARC (BS), 1977.
A study carried out in France showed the possibility of using this new broadcasting service within the satellite broadcasting channel [CCIR, 1974-78c].
This service, [CCIR, 1974-78g, h] uses a system of digital modulation made up in the baseband of an NRZ binary signal frequency limited to the video band. The bit rate is about 6 M bit/s. The sound sub-carrier of the television signal is superimposed on this signal.

182 Rep. 215-4
TABLE XIV — Examples o f system parameters fo r monophonic sound broadcastingfo r individual reception (')
Parameter Example 1 Example 2 Example 3 Example 4 Example 5
1. SystemFrequency o f carrier (MHz) 12 OOO(') 12 000 12 000 12 000 12 000Type o f modulation FM FM FM/FM FM/PSK FSKFrequency deviation (pre-emphasis 50 ps) (kHz) ± 75 ± 300Frequency deviation (kHz) ± 8600 ± 4000 ± 3000Audio-frequency bandwidth (kHz) 15 15Number o f audio channels 12 16 20Total radio-frequency bandwidth required (kHz) 180 800 22 000 18 000 12 000Carrier-to-noise ratio before demodulation (for 99% o f the time in the least favourable month) (edge o f beam) (dB) 19 13.3 14 14 14Corresponding audio-frequency signal-to- unweighted noise ratio (edge o f beam) (dB) 56 69 69 69 69Audio-frequency signal-to-weighted noise ratio (dB) 47 60 60 60 60
2. Receiving installationFigure o f merit, G /T , o f receiver (dB) (2) 4 4 4 4 4Required flux (edge o f beam) (99% o f time in most unfavourable month) (dB(W /m2)) — 117.5 — 116.7 — 103 — 103 — 105Equivalent field strength (edge o f beam):
(dB(pV/m)) 28.2 29.1 44 43 41(pV/m) 26 28 160 140 110
Free-space attenuation between isotropic sources 35 786 km apart (dB) 205.1 205.1 205 205 205Additional free-space attenuation for an angle o f elevation o f 40° (dB) 0.5 0.5 0.5 0.5 0.5Total atmospheric attenuation for 99% of the time in the most unfavourable month (dB) (3) 1.5 1.5 1.5 1.5 1.5Up-path noise (provisional value) (dB) 0.5 0.5 0.5 0.5 0.5Required e.i.r.p. from satellite at edge o f beam (dBW) 47 47.7 63 62 60
3. Satellite transmitter
Antenna beamwidth at —3 dB points (degrees) 1.4 1 1 1 1Antenna gain at edge o f service area relative to an isotropic source (dB) (4) 38 41 41 41 41Loss in feeders, filters, joints, etc. (dB) 1 1 1 1 1Required satellite transmitter power:
(dBW) 10 7.7 23 22 20(W) 10 6 200 160 100
(') These examples will probably not be valid for sound broadcasting alone, unless the receiving antenna and the preamplifier or frequency-changer were also used for television.
(2) In accordance with the definition in the example shown in the Annex I to Report 473-2.(3) Examples valid for an angle o f elevation o f about 40° and European climatic conditions.(4) An antenna efficiency o f 55% is assumed.

Rep. 215-4 183
TABLE XV — Multiple-channel systems assumed in examples fo r m onophonic sound broadcasting
Parameter Example 3 Example 4 Example 5
Number o f sub-carriers 12 8 —
Number o f audio channels per sub-carrier 1 2 —Sub-carrier channel spacing (kHz) 230 600 —
300, 530 1000, —
Sub-carrier frequencies (kHz) ... 2830 1600 —Sub-carrier modulation FM ... 5200 —
PSK
Peak deviation o f sub-carrier (kHz) ± 75 14- —
phase)Noise bandwidth o f sub-carrier channel (kHz) 180 350 —C /N in sub-carrier channel (dB) when main-carrier C /N = 14 dB 32 17.5 —Main-carrier peak deviation by each sub-carrier (radians) ± 1.0 ± 0.3 (FSK)Total quasi-peak main-carrier deviation (MHz) ± 8.6 ± 4.0 ± 3.0Bits per sample (with non-linear coding or companding) — 10 10Sampling rate (kHz) — 32 32
Total system bit rate (kbit/s) — 8 x 2 x 3 5 0 20 x 3 5 0(approx. with framing allowance) = 5600 = 7000
N ote on Example 3. — 12 sub-carriers are used, each modulated as analogue FM sound channels with ± 75 kHz deviation. The highest baseband frequency is below 3 MHz. An alternative system with 12 sub-carriers deviated ± 150 kHz, and each deviating the main carrier ± 0.5 radian would give similar performance in approximately the same r.f. bandwidth; the highest baseband frequency would be less than 5 MHz.N ote on Example 4. — 8 sub-carriers are used, each carrying two digitally coded sound signals by 4-phase PSK. The highest subcarrier is 5.2 MHz. The C /N o f 17.5 dB in the sub-carrier channel provides a 3 dB margin above a 1 in 106 error rate level. N ote on Example 5. — 20 sound channels are transmitted in digital form by a single 7 M bit/s stream. Frequency modulation o f the main carrier (FSK) by the binary NRZ signal is assumed. The system will then be similar to other systems in immunity to effects o f hard limiting in the satellite repeater or receiver. The baseband signal can be bandwidth limited to 5 MHz in the receiver. A carrier-to-noise ratio o f 14 dB provides a 3 dB margin above an error rate level o f 1 in 106.
The main conclusions to be drawn from this study are as follows:
— The error rate is only slightly dependent on the choice of the frequency deviation. However, adecrease in the amplitude of the digital signal from 700 to 500 mV is always favourable from thepoint of view of the error rate when the peak-to-peak deviation of the video signal is equal to 14 MHz.
— A level of interference C /I = 30 dB has no effect on the error rate.
— The following table gives the values of the C /N ratio for which the error rate is less than 10-4 and10- 6 :
Error rate 104 106
Theoretical results when the carrier is centred on the noise band C /N > 9.7 dB C /N > 1 1 .7 dB
Practical results obtained by simulation with interference C / /= 30 dB and an energy dispersal o f 600 kHz (peak-to-peak) C /N > 10.5 dB C /N > 12.7 dB
These results show that a margin of 1 dB must be maintained in relation to the theoretical results in order to take into account the frequency offset of the IF signal, dissymmetry of the noise band and the action of energy dispersal.

184 Rep. 215-4
5.3.2 Other potential new service applications being studied in Region 2
New and innovative applications of the broadcasting satellite service in the community reception mode are being investigated in the United States and Canada using the Applications Technology Satellite-6 (ATS-6) [IEEE transactions] and the Communications Technology Satellite (CTS-Hermes). Examples of such applications include distribution of educational, medical, informational and other specialized material, for example, to schools, hospitals and community centres. A more detailed discussion of these applications including examples of particular applications are given in [CCIR, 1974-78d]. Many of these applications are considered to fall within the definition of Community Reception (Radio Regulations No. 84APB).
A number of the applications also had associated with the broadcasting satellite transmission, a return communication connection — for example, to permit students in a classroom to interact with the remote instructor. In some cases this return or “interactive” link utilized satellite transmission. It is expected that the majority of such interactive links will consist of one or more sound channels. An example of representative parameters for a sound channel using a 12 GHz satellite link is given in Table XVI.
TABLE XVI — Examples o f system parameters fo r sound interactive satellite connections
Parameters Example
1. SystemFrequency o f carrier (MHz) 12 000Type o f modulation FMFrequency deviation (pre-emphasis 75 ps) (kHz) ± 25Audio-frequency bandwidth (kHz) 5Total radio-frequency bandwidth required (kHz) 60Carrier-to-noise ratio before demodulation (for 99% o f the time in the least favourable month) (edge o f beam) (dB) 19Corresponding audio-frequency signal-to-unweighted noise ratio including deemphasis (edge o f beam) (dB) 51.2Audio-frequency signal-to-weighted noise ratio (dB) (') 41.9
2 . Receiving installationFigure-of-merit, G /T , o f receiver (dB)(2) 16Required flux (edge o f beam) (99% o f time in most unfavourable month) (dB(W /m2)) — 134.3Free-space attenuation between isotropic sources 35 786 km apart (dB) 205.1Additional free-space attenuation for an angle o f elevation o f 40° (dB) 0.5Total atmospheric attenuation for 99% o f the time in the most unfavourable month (dB) (3) 1.0Up-path noise (provisional value) (dB) 0.5Required e.i.r.p. from satellite at edge o f beam (dBW) 29.3
3. Satellite transmitterAntenna beamwidth at —3 dB points (degrees) 1.4Antenna gain at edge o f service area relative to an isotropic source (dB) 38Loss in feeders, filters, joints, etc. (dB) 1Required satellite transmitter power (dBW)
For 6 carriers sharing transponder with video carrier For 50 carriers sharing linear transponder
0.19.3
(') Assuming weighting filter o f Recommendation 468-2.(2) In accordance with the definition in the example shown in the Annex to Report 473-2.(3) Examples valid for an angle o f elevation o f about 40° and Rosman, N.C. climatic conditions.

Rep. 215-4, 473-2 185
REFERENCES
EDENS, J. W. [1974] AM versus FM for direct reception of television broadcasts via satellite. Telecommunication Journal, Volume 41, VI.
GOLDHIRSH, J. [November, 1975] Prediction methods for rain attenuation statistics at variable path angles and carrier frequencies between 13 and 100 GHz. IEEE Trans. Ant. Prop., Vol. AP-23, 6, 786-791.
IEE [1968] Institution of Electrical Engineers. Colloquium on direct broadcasting from satellites. Colloquium DigestNo. 1968/24.
IEEE [November, 1975] IEEE Trans. Aerospace Electron. Systems. Special issue on ATS-6, Vol. AES 11,6.IPPOLITO, L. J. [November, 1975] ATS-6 millimeter wave propagation experiments at 20 and 30 GHz. IEEE Trans. Aerospace
Electron. Systems, Vol. AES 11, 6, 1067-1083.
JTAC [1968] Spectrum Engineering—the key to progress. Joint Technical Advisory Committee of the IEEE and the El A(Available from the Secretary, JTAC, 345, East 47th Street, New York, N.Y. 10017).
OSTRANDER, N. C. [September, 1967] The Rand Sync-Sat calculator. Memorandum RM-5228-NASA, Rand Corporation, Santa Monica, California.
PACINI, G. P., GAUDIO, R. and ROSSI DORIA, F. [1971] Experimental investigation on man-made noise in the 850 MHzand 12 GHz range. Alta Frequenza, 2.
RAY, K. E. and WINICOR, D. H. [1966] Large area solar cell array, space power systems engineering. Progress in Astronautics and Aeronautics, Vol. 16, Academic Press, 979-1003.
SOLLFREY, W. [February, 1966] Earth coverage patterns with high-gain antennae on stationary satellites. Memorandum RM-4894-NASA, Rand Corporation, Santa Monica, California.
CCIR Documents
[1966-69]: a. IV/311 (X/166, XI/153) (USA); b. IV/217 (XI/140) (United Kingdom).
[1970-74]: a. 11/116 (Italy); b. 11/90 (France); c. 11/337 (France).
[1974-78]: a. 11/41 (Japan); b. 11/419 (France); c. 11/416 (France); d. 11/396 (USA); e. 5/15 (Japan); f. 11/146 (ESA);g. CMTT/252 (France); h. 11/61 (France).
REPORT 473-2
CHARACTERISTICS OF GROUND RECEIVING EQUIPMENT FOR BROADCASTING-SATELLITE SYSTEMS
(Questions 5-3/11 and 20-3/10, Study Programme 23E/11)(1970 - 1974 - 1978)
1. Introduction
The characteristics to be adopted for ground receiving equipment for broadcasting-satellite systems offer a wide range of choice. These characteristics influence the size, mass and complexity of the satellite required to provide a given quality of service because of the compromise that must be made between receiver sensitivity and the power radiated by the satellite. They themselves are affected by the broadcasting standards selected. In particular, the characteristics of the ground receiving equipment will depend on whether it is required to receive only television signals (with only one or with more than one, accompanying sound signal), or only sound signals, or both. The present Report gives information about the most important of these characteristics on the basis of the results presented in the Documents listed in the bibliography of this Report. Many of the contributions received relate to equipments operating in the 12 GHz frequency band.
It appears that signals broadcast from satellites could be received, not only by equipments of new design, but in some cases by existing receivers fitted with adaptive devices, provided that suitable standards were adopted for the satellite transmission.
A distinction should be made between installations intended for community reception and for individual reception.
2. Overall characteristics of receiving equipments [CCIR, 1970-74a; 1974-78a]
A typical receiving system is comprised of an antenna, a low-noise receiver front end, an indoor unit containing intermediate frequency stages, programme selector, demodulation or adaptor stages, and a television monitor or television receiver.

186 Rep. 473-2
It would seem desirable to specify the overall characteristics of receiving equipments by the figure of merit G/T.\ which is the ratio expressed in dB, between the gain of the receiving antenna (including losses) and the total noise temperature expressed in Kelvin, referred to the point of measurement of the antenna gain. There is not complete agreement on whether, for receivers in the broadcasting satellite service, this figure should include the degradation due to ageing of equipment, pointing error, and polarization effects; it is therefore important when using G /T to indicate which of the factors have been included. The advantage of introducing the figure of merit parameter is that it is no longer necessary to specify separately the performance of the various parts of the installation, such as the noise factor, coupling loss, antenna gain, etc.. The latter parameters may then be chosen by the receiver manufacturers so as to obtain the required overall performance at lowest cost. A detailed definition of the figure of merit G / T, including ageing, pointing errors and depolarization effects, and an example of how to calculate it, are given in Annex I to this Report.
Annex II summarizes the environmental and performance specification of community reception ground receiving equipment used for experimental purposes in the Application Technology Satellite (ATS-6), the Communication Technology Satellite (CTS), and the Broadcasting Satellite for Experiment (BSE-Japan) programmes. In addition, actual cost experience is presented, where available, and extrapolated to larger quantities, using the methods of [Knouse, et al., 1973].
3. Antenna systems [CCIR, 1970-74b and c; 1974-78a, b, c, d and g; Day, 1976]
At 12 GHz, the most probable form of antenna for individual reception is one with a conventional or offset parabolic reflector 0.75 to 1 metre in diameter. Large diameters may, however, be used for community reception. Two feed arrangements are possible; either an antenna with direct illumination, or a dual reflector assembly. The choice of diameter and of feed device may depend on economic considerations since for a given figure of merit G/T, a lower antenna gain would necessitate a lower noise temperature for the receiving equipment. The antenna may be either of aluminium or a composite moulding, e.g., of plastics with a conductive coating or an embedded wire mesh. An effective surface accuracy of about 1 mm r.m.s. under all weather conditions is adequate, and the mounting must be sufficiently rigid to maintain correct pointing, better than 0.5° or 0.6°, for example, for the antenna dimensions envisaged (0.75 to 1 m).
Antennae for community reception must also be able to withstand the local environment, and must generally achieve a greater pointing accuracy than individual reception antennae. An example of environmental requirements is given in Annex II.
In the case of a linearly polarized system it will also be necessary to ensure correct rotational orientation, better than 2°, for example, in order to provide adequate protection against orthogonally polarized signals. From the point of view of aligning the antenna, it will be advantageous to use circular polarization. In this case, the antenna feed may be a little more complex to manufacture than if linear polarization were used.
Receiving antenna diagrams for various frequency ranges are given in Report 810 indicating the upper limit of the relative gain as a function of angle, to be assumed for planning purposes.
The choice of the feed arrangement may also be influenced by the associated feeder losses. At 12 GHz, to minimize the feeder loss, it is likely that the input stages will be located at or near the focus of the antenna. Thus a dual reflector or offset antenna could be preferred because of high aperture efficiency (65 to 70%) and low feeder losses. The WARC-BS (Geneva, 1977) has adopted the use of circular polarization for broadcasting satellites at 12 GHz. Thus a short microwave feeder may be desirable to assist in establishing the required polarization of the signal (i.e., linear or circular) and/or in obtaining a useful measure of first converter image-signal rejection. This microwave feeder contributes a small, additional coupling loss.
4. Input stages [CCIR, 1970-74b and c; 1974-78b and d; Konishi, 1974]
These stages are an important part of the receiver. They should consist of a frequency down-converter which may or may not be preceded by low noise radio-frequency amplifier stages. If the latter are required, they may be achieved by means of tunnel-diodes or special transistors, or even by parametric amplifiers in the case of community reception receivers. The converter can use Schottky-barrier diodes. For wideband reception, with frequency-modulation television, a solid-state direct local oscillator source, such as a Gunn device, may be used. However, even if some form of automatic frequency control of this or any subsequent oscillator, can be assumed, some care will still be necessary to minimize frequency drift with temperature.
The design of the a.f.c. loop will depend on whether d.c. or a.c. coupling is used in the frequency-modulation transmitter modulator.
The examples of fully tested systems for community reception given in Annex II indicate the techniques used in the radio-frequency head. Present-day performance and cost of components and circuits for receiver front ends are given in Tables I and II. Performance data is from [CCIR, 1974-78d] and [Walker and Crescenzi, 1976].
From all these studies, two techniques seem to have the best prospects for reception at 2.5 and 12 GHz:— gallium arsenide diode-mixer converters,— field-effect semiconductors (FET) followed by a converter. (For community-type installations, the use of
inexpensive parametric amplifiers may also be considered.)

Rep. 473-2 187
The present technology, as given in the Tables, suggests a slight performance advantage and a small cost penalty associated with the use of semiconductor pre-amplifiers, rather than image-rejection mixers at 12 GHz. Expected performance improvements and cost decreases in field-effect semiconductor amplifiers, coupled with the exclusive use of field-effect semiconductors for the RF amplifier stage, the mixer, the local oscillator and the first IF stage, in a single integrated circuit, could make that approach the preferred one in post-1980 manufacturing technology.
For community reception, an overall noise factor of 4 to 5 dB is considered feasible in all the frequency bands concerned. For individual reception, values of less than 6 dB can be readily achieved in the 700 MHz and2.5 GHz bands. Even at 12 GHz, a better performance than 6 dB would be conceivable but, taking into account the need to keep the cost of the equipment as low as possible, an overall noise factor of 6 dB is considered achievable in the near future in the case of individual reception at 12 GHz.
The above discussion has assumed that the unit containing the radio-frequency head is mounted on the receiving antenna to avoid additional RF losses which could be high at 12 GHz, even with the use of a waveguide feeder.
TABLE I — Present-day performance o f components and circuits fo r relatively simple 12 GHz receivers
Components Circuits
FET transistors (at 10 GHz) FET low-noise amplifier:Grid o f 1 [im N F —3.3 dB 11.7- 12.2 GHz
G = 6 .7 dB N F = 4.0 dB
Grid o f 0.5 frm N F = 2.S dB G = 11 dB (2 stages) G = 20 dB (3 stages)
Schottky diode: Mixers:Silicon (fco - 500 GHz) Wide-band
Gallium arsenide (Ga-As) (fco = 2000 GHz) Microstrip L c = 5 to 6 dB
With reactive load at the image frequency— Microstrip technique Lc = 4 .5dB— Planar technique Lc = 3.5dB— Waveguide technique Lc= 3 .6 d B
Bipolar low-noise silicon transistor at Low-noise amplifier:1 GHz: 1.1 to 1.4 GHz
N F - 1.5 dB AF(IF) = 2 .2d BG = 15 dB G = 30 dB
N F : Noise factor N F (Mixer) = L C+NF(IF)L c : Conversion loss G : Gainf co : Cut-off frequency
TABLE II — Performance and relative cost o f radio-frequency heads at 12 GH z
RF head configuration
Overall noise factor (dB)
Relative cost o f RF head
Ga-As mixer(')5.7
(2)6.2 1
2 FET + mixer 4.5 5.0 1.093 FET + mixer 4.1 4.6 1.33
(') At input to device.(2) At antenna, allowing 0.5 dB input loss.

188 Rep. 473-2
5. Intermediate-frequency stages [CCIR, 1974-78b, d, e and f]
For reception at 12 GHz the design will probably entail two frequency changes to ease problems of selectivity, image rejection and local oscillator radiation, but installations with only one frequency change cannot be ruled out. For the 700 MHz and 2600 MHz bands either arrangement may be attractive. When there is more than one frequency change, the first down-converter, equipped with a fixed frequency oscillator, should be placed close to, or on, the antenna. For 12 GHz reception, the choice of the value of the first intermediate frequencypresents some difficulties, since these frequencies must be chosen so as to avoid interference by terrestrialbroadcasting transmitters or by other services using radio transmissions of a certain power.
Apart from this constraint, certain criteria suggest that a fairly low value should be chosen, particularly since the noise factors of the IF amplifiers being equal, the higher the frequency, the higher the cost would be; thesame can be said for the cost of the down-lead coaxial cable.
Moreover, if this value is too low, it will be difficult to eliminate the image frequency. If the maximum width of the band to be received is in the region of 200 MHz to 250 MHz, the intermediate-frequency may be situated between television Bands III and IV. If it is necessary to receive a larger band, the intermediate-frequency should be situated above Band V (for example, at a frequency slightly higher than 1 GHz). Some economy in receiver design may be possible if the total frequency range containing the wanted emissions does not exceed 400 MHz.
The second intermediate-frequency (or the intermediate-frequency in single convesion receivers) will probably be chosen in the range 70 MHz to 450 MHz; one preferred frequency may be close to 120 MHz. The final converter will select the programme required. Provision must be made for adequate image and adjacent channel rejection, and automatic tuning control may be included [CCIR, 1970-74b, d and e].
6. Demodulation or adaptor stages
For television, use can be made of a frequency demodulator which will deliver the video signal (and possibly a frequency modulated sound signal) on a subcarrier, if a subacarrier is used for sound component transmission [CCIR, 1970-74b and c]. In the long term it is expected that these stages, together with the programme selection stages referred to in § 5, would be incorporated into television receivers designed for reception of both frequency-modulation satellite and amplitude-modulation terrestrial emissions. In the interim period, the video signal can directly feed a receiver at video frequency, or amplitude modulate a carrier, to produce a conventional signal which then feeds an ordinary type of domestic receiver. In the latter case, generation of a standard vestigial signal is ideally desirable, but in practice is not essential. Devices for direct FM /AM conversion without intermediate demodulation are under study [CCIR, 1970-74f) but the possible use of signal pre-emphasis and/or energy dispersal may complicate their design.
In order to reduce the possibility of interference to other services, a measure of energy dispersal is often required for satellite broadcast signals. For individual reception in the 12 GHz band, the 1977 WARC (BS) adopted the use of energy dispersal to ensure that the energy in any 4 kHz band is at least 22 dB below the total assigned power. For television signals, such dispersal may be achieved by adding to the video signal, before application to the up-link, a periodic sawtooth or symmetrical triangular waveform with a repetition frequency equal to a half, or a quarter, of the field frequency. A peak-to-peak carrier deviation of 600 kHz arising from the dispersal waveform is sufficient to meet the requirement. The dispersal waveform must be removed from the video signal obtained from the demodulator if it is not to cause visible effects on the displayed picture. Experience suggests that a simple low-cost d.c. restorer will be adequate for this purpose when using a dispersal waveform of the magnitude indicated.
In Region 2 a new energy dispersal technique [CCIR, 1974-78h] appears to be particularly suitable for community reception type receivers operating in the 12 GHz band. However, further study is required to determine the impact of its use on the design complexity and cost of the demodulator or adaptor stages.
7. Reception of sound broadcasts [CCIR, 1974-78b and d]
For individual reception at 12 GHz of sound-only broadcasts or of supplementary sound channels associated with television broadcasts, it would seem desirable to be able at least to use the same input stages as for the reception of television signals. To avoid the need for a highly stable local oscillator in the input stages and to simplify the demodulation stages, it is therefore possible that a number of sound programmes may be multiplexed within a video signal bandwidth, and used to frequency modulate a 12 GHz transmission, having a power and bandwidth comparable with that used for a satellite television transmission. This multiplexing could be achieved with analogue FM frequency division multiplex or with digitally modulated signals in frequency or time division multiplex (see Report 215-4 for system examples). Although less efficient than separate FM carriers in terms of use of bandspace and power, such arrangements would have significant advantages for tuning. Studies of such possibilities are in progress.
8. Effect of channel grouping
The interdependence of receiver design, channel grouping and sharing criteria may have a considerable influence on the development and the implementation of a plan for the broadcasting-satellite service [WARC-BS, Recommendation Sat-7].

Rep. 473-2 189
Measurements were carried out in Japan [CCIR, 1974-78i] using the down-converter type receivers with a double conversion structure, compatible with the technical characteristics and with the plan which was adopted at the WARC-BS (1977). The results indicate that the channel grouping of the plan for the broadcasting-satellite service in the 12 GHz band is unlikely to cause deterioration in the reception of television; measured levels of intermodulation were fairly low and the rejection characteristics of adjacent channels were satisfactory.
Further study of this matter is desirable.
9. Influence of cost
The relationship between cost and the overall performance of receiving equipment, measured by the figure of merit, G/T, involves other factors, such as the quality of workmanship, the extent of the tests carried out after manufacture, the reliability objective, installation costs, etc. Cost studies both for items of equipment and for complete installations [Knouse et al., 1973] have shown substantial differences between the estimates obtained from various sources; even after these estimates have been adjusted on a similar basis and for similar performance factors.
The following represent examples of cost estimates taken from various sources:— for a 2.6 GHz and a 12 GHz community receiving equipment, actual and extrapolated cost experiences are
shown in Annex II;— for 12 GHz adaptor equipment to be used with conventional receivers, assuming mass production of from
10 000 to 1 000 000 sets, the cost may vary in future from $ 220 to $ 440 for individual reception of four television programmes, depending on the value of noise factor; and about $ 1000 for community reception [CCIR, 1970-74c, 1974-78d].
REFERENCES
DAY, John [1976] Communication technology satellite, presented at the ITU Seminar on Broadcasting Satellites in the 12 GHz Band, Khartoum.
KNOUSE, G., HODGE, W. and SHAMESON, L. [April, 1973] A computer programme for evaluation and synthesizing broadcast satellite systems. Final report No. 4169-011 prepared for NASA, Washington, D.C., USA.
KONISHI, Y. et al. [September, 1974] SHF-FM receiver for satellite broadcasting. NHK Laboratories Note, Ser. No. 180.WALKER, M. G. and CRESCENZI, E. J., Jr. [June, 1976] A 12 to 18 GHz high-gain amplifier design using submicron gate
GaAs field effect transistors, International Microwave Symposium, Cherry Hill, New Jersey, USA.
CCIR Documents[1970-74]: a. 11/315 (EBU); b. 10/204 (11/262) (United Kingdom); c. 10/253 (11/306) (Italy); d. 11/92 (France); e. 11/93
(France); f. 11/338 (France);[1974-78]: a. 10/84 (11/133) (USA); b.10/10 (11/18) (United Kingdom); c. 10/14 (11/24) (EBU); d. 10/92 (11/43, PLEN.2/2)
(ESA); e. 10/31 (11/40 (Japan); f. 10/118 (11/164) (Philips Telecommunicatie Industrie); g. 11/408 (U.S.S.R.); h. 4/253 (USA); i. 11/442 (Japan); j. 10/358 (11/441) (Philips).
ANNEX I
EXAMPLE OF CALCULATION OF THE FIGURE OF MERIT OF RECEIVING EQUIPMENT FOR INDIVIDUAL RECEPTION IN THE 12 GHz BAND
For the present example, the figure of merit, G/T, is defined by the following formula, which allows for pointing error, polarization effects, and ageing:
ap Gra Ta -I- (1 — a) T0 + (n — l) T0
where,a : the total coupling losses, expressed as a power ratio,P : the total losses due to the pointing error, polarization effects and ageing, expressed as a power ratio,Gr : the effective gain of the receiving antenna, expressed as a power ratio and taking account of the
method of feeding and the efficiency,Ta : the effective temperature of the antenna, taken in the example below as 150 K,T0 : the reference temperature = 290 K,n : the overall noise factor of the receiver, expressed as a power ratio.In several years time, it should be possible to produce relatively cheap receivers having figures of merit of
6 dB. An example is given in Table I in which the figure of merit of 6 dB is obtained with an antenna of 1 m diameter and a receiver noise factor of 6 dB. It is, however, possible to obtain the same result with other combinations of the parameters, and Fig. 1 shows, for example, how the antenna gain and the noise factor may have a range of values.

190 Rep. 473-2
TABLE III — Example o f the calculation o f the figure o f merit*
Gain o f receiving antenna (1 m dia., 50% efficiency), Gr(') (dB) 38.7Coupling loss, a (dB) — 0.5Pointing and polarization losses, \ n ageing degradation f P
(dB)(dB)
— 1.0 — 1.0
Net gain, G, (ap G ,)(2) (dB) 36.2 36.2Antenna temperature, Ta (K) 150Coupling loss, a 0.891Ta, referred to the input, (CtTa) (K) 133.7Reference temperature, T0 (K) 2901 — a 0.109Noise temperature o f coupling, ((1 — a)T0) (K) 31.6
T0 (K) 290Receiver noise factor ( 6 dB) reduced by 1 (i.e., n — 1) 2.981Receiver noise temperature, {{n — 1)7 ,) (K) 864.5Total effective noise temperature, T (K) 1029.8— 10 log 10 T —30.1Figure o f merit, G /T * (dB) 6.1
(*) Calculated at 11.7 GHz.(2) Includes 1.1 dB o f atmospheric attenuation, which is representative o f the European region for a range o f elevation angles, 20°
to 45° (Report 215-4).
0 2 4 6 8 10 12
Receiver noise factor (dB)
FIGURE 1 — Relationship between noise factor and antenna gain for G /T =6 dB or 14 dB with losses, reference temperature and antenna temperature as in the example of Table III
In this example, the value of G /T would be 2 dB higher if the factor p were not included in the formula defining G/T.

Rep. 473-2 191
ANNEX II
This Annex summarizes the more important environmental requirements and characteristics of experimental ground receiving equipment used, or being planned, for community reception experiments with the Application Technology Satellite 6 (ATS-6), the Communication Technology Satellite (CTS) and the Broadcasting Satellite for Experiment (BSE-Japan). In addition, actual cost experience is presented where available and extrapolated to larger quantities using the methods of [Knouse, et al., 1973] (see § 8).
The characteristics of the ground receiving equipment are given in Table II.
The environmental requirements for the 2.5 GHz ATS-6 ground receiving antenna were that it should operate in winds up to 28 m /s with an ice loading of 7.5 cm and survive winds of 56 m/s. Both the antenna and the outdoor unit had to be capable of operating over the temperature range of — 20° C to +50°C.
Characteristics of other ground receiving terminals recently used at 860 MHz, 2.6 GHz, and 12 GHz with the ATS-6 and CTS satellites are given in [CCIR, 1974-78j].
TABLE IV — Experimental ground receiving equipm ent characteristics (Com m unity reception)
System ATS-6 ATS-6 CTS BSE-Japan
Frequency (GHz) 0.860 2.5 12 12
G /7X 1) (dB/K) —6 + 8 + 15 + 16
Antenna Dia. (m) 3 3 1.8 1.6
Material Expanded aluminium mesh
Epoxyfibreglass
Epoxyfibreglass
Aluminium press-stretch (3)
Tracking None Limitedmanual
Limited step track
None
Input stage Bipolar silicon transistor
Bipolar silicon transistor
Image enhanced diode mixer
Image enhanced diode mixer
Noise figure (dB) 6.5 4 6 4.5
Number o f channels 1 1 1 2
Number o f frequency changes 1 None 1 1
Intermediate frequency (MHz) 70 None 70 400
Costin quantity
$800(2400)
$4000(130)
$10 000 ( 1-10)
—
Estimated cost in quantity(2)
— $3200( 1000)
$4900( 1000)
—
Installation cost ..... $1000 — —
(') Not taking into account pointing and polarization losses and ageing degradation (0).(2) Using Q(n) - L 10®2”, L = 0.93 (see [Knouse et al., 1973]).(3) An example.

192 Rep. 631-1
REPORT 631-1 *
BROADCASTING-SATELLITE SERVICE: SOUND AND TELEVISION
Frequency-sharing between the broadcasting satellite service and terrestrial services
(Questions 20-3/10 and 5-3/11)(1974- 1978)
1. Introduction
As a result of the World Administrative Radio Conference for Space Telecommunications, Geneva, 1971, the broadcasting-satellite service has allocations, or is permitted to operate, under certain conditions in thefollowing shared bands (see Article 5 of the Radio Regulations):— 620 to 790 MHz, which is mainly used by the fixed, mobile, and terrestrial broadcasting services;— 2500 to 2690 MHz to be shared with the fixed, fixed satellite and mobile services;— 11.7 to 12.2 GHz (11.7 to 12.5 in Region 1) to be shared with the fixed, fixed satellite (in Region 2 only),
mobile and terrestrial broadcasting services;— 22.5 to 23 GHz in Region 3 only, where it is to be shared with the fixed and mobile services.
2. Parameters involved in frequency-sharing
For frequency-sharing between two types of service, careful consideration should be given to the order in which the assignments are made. This imposes certain limitations on the technical characteristics of each of the systems (e.g., maximum value for the power flux-density of the broadcasting satellites, inside and outside their service areas, adequate directivity for receiving earth station antennae, maximum value of the e.i.r.p. of the terrestrial service transmitters) and also certain conditions for their use (e.g., minimum distance between a terrestrial service transmitter and the boundary of the service area of a broadcasting satellite sharing all, or part of, the same channel). These technical or operational limitations may or may not be acceptable depending on the nature of the two systems in question.
2.1 Sound broadcasting
Frequency-sharing between the sound broadcasting-satellite service and terrestrial services may be feasible under one or more of the following conditions:— considerably lower protection ratios than those contained in Recommendation 412-2 are applied;— field-strengths having values considerably lower than those required for emissions from terrestrial stations as
shown in Recommendation 412-2 are utilized by the broadcasting-satellite service;— power flux-density limitations are placed on emissions from either satellite and/or terrestrial stations within
areas where interference may occur, noting that a satellite may produce interference over geographical areas of continental size;
— confinement of the potential zone of coverage for the broadcasting-satellite service to those areas where emissions from co- and adjacent-channel terrestrial stations do not exist at present and where the satellite service could be protected from interference due to terrestrial stations that might be installed in the future (primarily rural or sparsely settled areas).
The possibilities of sharing between the sound broadcasting-satellite service and terrestrial services require further study. Thus the remaining sections of this Report deal only with television broadcasting.
2.2 Television broadcasting
2.2.1 General equation for the limiting value o f power flux-density o f the unwanted signal to protect thewanted service
As previously noted, when a broadcasting-satellite service shares frequencies with a terrestrial service, it may be necessary to impose limitations on the power flux-density produced by the unwanted signal at the receiving stations of the wanted service. A general equation for determining the limit on power flux-density is: **
Fs = Ftqp ~ R q + D d + D p — M r — M j ( 1)
where:Fs : maximum power flux-density (dB(W/m2)) to be allowed at the protected station,Ftqp: minimum power flux-density (dB(W/m2)) to be protected, i.e. the power flux-density which, in the
face of thermal noise only, yields the output signal quality q that is to be exceeded for somespecified high percentage of the time p,
* The Director, CCIR, is requested to bring this Report to the attention of Study Groups 8 and 9.** This equation may not be valid when the satellite signal arrives near grazing incidence. In this case an additional margin
must be included.

Rep. 631-1 193
Rq : protection ratio (ratio of the wanted-to-interference signal power at the receiver input) (dB) forbarely detectable interference when the output signal quality has been degraded by the thermal noise to q,
Dd : discrimination (dB) against the interfering signal due to directivity of the receiving antenna,
Dp : discrimination (dB) against the interfering signal due to polarization of the receiving antenna. Thisfactor is often combined with Dd as a single term,
Mr : margin (dB) for possible ground reflection of interfering signal,
My: margin (dB) for possible multiple interference entries.
The limit on power flux-density given by equation (1) insures that the output signal quality at the receiving station of the wanted signal will be equal to q even when the power flux-density of the system has faded to the level Ftqp. During p% of the time, the power flux-density of the system will be higher than Ftqp and the output signal quality will be higher than q.
If it is desired to express Fs in terms of the median value of power flux-density from the wanted system, Ftqm, which yields the same output quality statistics, the equation is:
Fs = Ftqm - Mp - Rq + Dd + Dp - Mr - My (2)
where Mp is the difference (dB) between the median value of the wanted signal level and the level exceeded jM of the time.
Equations (1) and (2) can be applied to calculate the limits on the unwanted power flux-density, appropriate to any given wanted service. In the case of the terrestrial broadcasting service, the receiving station to be protected is assumed to be on the boundary of the potential service area of the terrestrial transmitter. This boundary is defined as the geographic contour within which the power flux-density from the terrestrial transmitter equals or exceeds that required to produce an output signal (television picture or sound) of acceptable quality in the absence of interference and man-made noise at 50% of the locations for at least p% of the time, where for example, p has a specified value in the range from 90% to 99%. In the terrestrial broadcasting service it is also traditional to describe the incident signal in terms of field-strength in dB(|iV/m) rather than in terms of power flux-density in dB(W/m2). The former can be obtained from the latter by adding 146 dB.
2.2.2 Power flux-density requirements
Report 215-4 discusses examples of the required power flux-densities for the broadcasting satellite service in some detail, and Table XII of that Report contains numerical values of such power flux-densities. Report 811 indicates power flux-densities relevant to planning this service in the 12 GHz band.
Corresponding values for terrestrial amplitude-modulation television broadcasting services are indicated in Report 627-1.
2.2.3 Field-strengths and power flux-densities to be protected
The field-strengths and power flux-densities requiring protection are discussed in the sections concerning each frequency band.
2.2.4 Protection ratios
Report 634-1 deals with this subject in some detail and presents required values of protection ratio for different systems.
2.2.5 Use o f special techniques to meet limitations on power flux-density
Energy dispersal techniques for frequency-modulation could be considered to “spread” the radiated power over a wide radio frequency band to meet power flux-density limitations. Careful consideration, however, should be given to technical and economic impacts of the application of such techniques on the systems.
Some examples of the use of energy dispersal are given in the sections concerned.
2.2.6 Calculation o f power flux-density produced by a geostationary satellite
Several methods may be used to calculate the power flux-density at a given point on earth as produced by a broadcasting satellite. One detailed method using graphs is presented in [CCIR, 1970-74a].

194 Rep. 631-1
Television broadcasting from satellites using frequency modulation only is dealt with in this section.
3. Sharing in the 620 to 790 MHz band
3.1 Sharing with the terrestrial broadcasting service
Frequency-sharing between a broadcasting-satellite system and a terrestrial broadcasting system requires that the receivers of each system be protected against interference from the emissions of the other system. The terrestrial receivers can be protected by imposing limits on the power flux-density produced by the broadcasting satellite at points within the terrestrial service area, as described in § 3.1.1. Conversely, the broadcasting-satellite system receivers can be protected against interference by requiring adequate separation between the terrestrial transmitter and the satellite receiver. An example of the separation required in a particular case is given in § 3.1.2.
3.1.1 Protection o f the terrestrial broadcasting service
To protect the terrestrial television broadcasting service from interference from a television broadcasting satellite, it is necessary to place a limit on the power flux-density that the satellite is allowed to produce at points within the service areas of the terrestrial television broadcasting stations.
A provisional value for this limit in the band 620 to 790 MHz is given in Recommendation No. Spa2 - 10:
- 129 dB(W/m2) 8 < 20°-1 2 9 + 0.4 (5 - 20) dB(W/m2) 20° < 8 < 60°-113 dB(W/m2) 60° < 8 < 90c
where 8 (degrees) is the angle of arrival of the satellite signal above the horizontal plane.
In Recommendation No. Spa2 — 10, the CCIR was urged to study the frequency-sharing criteria to be applied in this band and to recommend a value to be used in lieu of the provisional limit. Several Administrations subsequently conducted such studies and have made their individual suggestions regarding the limit on power flux-density that should be adopted.
In each case, the limit was calculated from an equation equivalent to equation (1) or equation (2). While there was not unanimity in the suggested limits on power flux-density the differences can be understood in terms of the differences between the values assumed for the parameters in the equations. These assumptions are summarized in Table I; they will be discussed in some detail in order to illuminate the problems involved in reaching agreement on a satisfactory limit on the power flux-density.
3.1.1.1 Minimum terrestrial power flux-density to be protected
Recommendation 417-2 gives the values 67 and 70 dB(|xV/m) for the field-strengths in Band V (610 to 960 MHz) corresponding to Ftqp and Ftqm in equations (1) and (2), respectively. The Recommendation also notes that “in a practical plan, because of interference from other television transmissions, the field-strengths that can be protected will generally be higher”. Nevertheless, some Administrations studying the question were agreed that advances in receiver technology and practical experience with terrestrial television reception suggested that consideration should be given to protecting lower values of field- strength.
In [CCIR, 1970-74b], the EBU suggests that in the service areas where a minimum median protected field of 70 dB(jj,V/m) at 50% of the locations is taken as a basis, there is often a considerable number of home receivers and relay stations providing satisfactory pictures with a lower field. It can be considered that points where the field is about 65 dB(|xV/m) provide a satisfactory coverage. In many cases it is the only way of providing a service, because no other frequency is available. It is therefore necessary to protect a field of 65 dB(jj,V/m) against the total interference. Nevertheless, if this value is increased to 68 dB(jiV/m) and if power-law addition is assumed, the field to be protected against interferences caused only by satellites should be taken as equal to 65 dB(pV/m). The minimum power flux-density to be protected for the terrestrial system is then — 81 dB(W/m2).
Table I shows examples of calculations of the limiting values of power flux-density from a broadcasting satellite required to protect the terrestrial broadcasting service. The example from the U.S.S.R. has taken into account that the values of power flux-density should be given, bearing in mind the following:
— frequency band occupied by the interfering signal;
— bandwidth of the amplitude-modulation, vestigial-sideband receiver;
— level of random noise at the output of the amplitude-modulation, vestigial-sideband receiver.

Rep. 631-1 195
TABLE I — Examples o f the calculation o f the limiting values o f pow er flux-density from a broadcasting satellite required to protect the terrestrial broadcasting service in the band 620 to 790 MHz
1. Data relating to the wanted signal
Source documents (1970-1974)
11/58(U.K.)11/126
(E.B.U.)11/331
(E.B.U.)
11/64(U.S.A.)
11/108(France)11/126
(E.B.U.)11/331
(E.B.U.)
11/126(E.B.U.)11/331
(E.B.U.)
11/333(U.S.S.R.)
1.1 Television system and standard I/PAL M/NTSC L/SECAM G/PAL K/SECAM
1.2 Assessment scaleImpairment
6-point (1: imperceptible)
Quality 5-point
(5: excellent)
1.3 Grade of picture quality ~ 1.6 3 4.5 4.5 Justvisible
interference
1.4 Picture signal-to-unweighted noise ratio (dB) > 41.5 27 38 to 43 41.5 38
1.5 Minimum field-strength to be protected against interference caused by satellite (dB([iV/m))
65 56(') 65 65 70
1.6 Minimum power flux-density, terrestrial, to be protected, F tqp (dB(W/m2))
—81 —90 —81 —81 —76
2. Data relating to the protection ratio
Source documents (1970-1974)
11/58(U.K.)11/321
(E.B.U.)
11/49(U.S.A.)
11/107(France)11/321
(E.B.U.)
11/126(E.B.U.)
11/321(E.B.U.)
11/333(U.S.S.R.)
2.1 Picture content of wanted signal Slides Slides and off-the-air
programmes
Slides Slides Electronic test chart and film
Picturecontent
Colour-bars Colour-barsand
off-the-airprogrammes
Colour-bars Colour-bars Mono- 1 chrome
test chart
2.2 Characteristics of unwanted signal
Frequencydeviationpeak-to-peak(MHz)
8 18 8 8 22
Pre-emphasis Yes No Yes Yes No
Dispersal No No No No No
2.3 Protection ratio, Rq (dB) 56 35 52 57 to 60 46 *
(') The assumed fading margins are those associated with an e.i.r.p. of 2 MW from an antenna at a height of 300 m in the terrestrial broadcasting service. Median field-strengths of —60 dB(jiV/m) and —65 dB(pV/m) would yield the same picture quality as above, for 90% and 99% of the time, respectively.

196 Rep. 631-1
TABLE I (contd.) — Examples o f the calculation o f the limiting values o f pow er flux-density from a broadcasting satellite required to protect the terrestrial broadcasting service in the band 620 to 790 M H z
Source documents (1970-1974)
11/58(U.K.)11/321
(E .B .U .)
11/49(U .S.A .)
11/107(France)11/321
(E.B.U.)
11/126(E.B.U.)
11/321(E.B.U.)
11/333(U.S.S.R.)
3. Directivity discrimination, D d (dB) (*)
4. Polarization discrimination, Dp (dB) 2 2 2
5. Reflection margin, M r (dB) 3 3 3 2
6 . Multiple interference entry margin, M, (dB)
7. Resultant limit on power flux-density, Fs (dB(W /m2)) — 138 — 125 — 134 — 142 — 124
(') No directivity discrimination can be assumed, since only angles o f elevation less than 20° are considered.
3.1.1.2 Protection ratio
The values of protection ratio given in Table I were measured under different conditions. More detailed results are given in Report 634-1, which also discusses the various measuring conditions and system parameters which affect the assessment of protection ratio. In that Report, it is suggested that, where possible, the protection ratio should be defined for a specified combination of conditions and parameters. Corrections which may be applied for different conditions and parameters are also given in Report 634-1. The value of protection ratio proposed by the EBU (see Table I) is based on the reference conditions.
3.1.1.3 Directivity discrimination
None of the examples take explicit account of the directivity of the receiving antenna; instead they consider the worst case in which the interfering satellite signal arrives from a direction close to the receiving antenna axis. However, all Administrations appear to accept the idealized antenna pattern for Band V given in Recommendation 419, although the USA Administration notes that in practice, more directive antennae are likely to be used at the service area boundaries in question. In any case, using the pattern of Recommendation 419 would lead to an escalation of satellite power flux-density with angle of arrival similar to that given in the provisional limit of Recommendation No. Spa2 — 10.
3.1.1.4 Polarization discrimiation
If circular polarization is used for the broadcasting satellite transmission, a discrimination of up to 3 dB may be expected from the linearly polarized terrestrial receiving antenna. Report 339-1 (New Delhi, 1970) contained data for the discrimination that will be achieved in the usual case where the satellite transmitting antenna and the terrestrial receiving antenna are not to be aligned with each other.
3.1.1.5 Margin for ground reflections
There is no direct experimental evidence ragarding this quantity, but the United Kingdom Administration reports that extrapolation to Band V of experimentally verified theoretical predictions of reflection from irregular terrain at 230 MHz suggest that 3 dB is a reasonable value. The Administration of France and the EBU agree with this assumption and cite extreme cases of near unity reflection of terrestrial signals from the sea which could enhance the interfering signal by 6 dB.
3.1.1.6 Multiple interference margin, Mj
In the service area of a terrestrial transmitter, a satellite can cause interference only where the receiving aerials point in a direction not very different from that of the satellite. It is therefore unnecessary to allow for interference from several satellites, if it can be assumed that there will never be more than one satellite emission at the same time on the same channel and in about the same direction.

Rep. 631-1 197
3.1.1.7 Summary and conclusionsFrom information provided by the Administrations of the United Kingdom and France, and by the
EBU, the numerical value has been calculated for the limit which should be imposed on the power flux-density to protect terrestrial broadcasting in the band 620 to 790 MHz, against the emissions from future satellites, using frequency-modulation television. The results are given separately for systems I/PAL, L/SECAM and G/PAL. For these three systems, the average figure is —138 dB(W/m2), the differences between the systems being due to the different measured values of protection ratio. This average is 9 dB lower than the provisional value recommended by the Space Conference of 1971.
The service area boundaries were defined in terms of very nearly the same minimum values of terrestrial field-strength to be protected as recommended by the CCIR, and possible fading of the terrestrial signal at the service area boundaries was neglected. The EBU study generally supported the conclusions reached by the Administrations of the United Kingdom and France.
On the other hand, the example presented by the Administration of the USA afforded protection to a much lower terrestrial field-strength, taking into account both an assumed better receiving installation, significant terrestrial signal fading, and a lower picture quality. In the USA, a lower protection ratio is used which corresponds to the lower assumed picture quality and is based on a wider frequency deviation for the interfering frequency-modulation satellite-signal, as well as picture contents more typical of off-the-air programming. The satellite power flux-density limit in the example presented by the USA Administration was —125 dB(W/m2), i.e. 4 dB higher than the provisional value recommended by the Space Conference of 1971.
Under the conditions presented by the Administration of the U.S.S.R. in Table I (2), the limit for the power flux-density was —124 dB(W/m2), i.e. 5 dB higher than the provisional value recommended by the Space Conference of 1971. In the calculations made by the U.S.S.R. Administration a coefficient y is introduced, which is defined as the ratio of the unwanted frequency-modulation signal total power to the portion of this power falling within the band of the amplitude-modulation, vestigial-sideband receiver. The value of y depends on the frequency deviation of the interfering frequency-modulation signal, and on the carrier separation between the two signals. For the conditions indicated in Table I, which correspond to the worst case for carrier separation, y is 5 dB.
Until greater agreement is reached concerning the values to be assumed for the relevant parameters, it is premature for the CCIR to recommend a single value for the satellite power flux-density limit necessary to protect terrestrial broadcasting. Indeed the possibility cannot be dismissed that it may be necessary to adopt different power flux-density limits for combinations of wanted and unwanted signals having different signal standards.
3.1.2 Protection o f the broadcasting satellite serviceProtection of the broadcasting satellite ground receiving stations is normally achieved by main
taining a minimum separation between them and the terrestrial transmitter. The minimum separation required depends on the characteristics of both the earth receiving installation and the transmitting station in the terrestrial broadcasting system. An example of the terrestrial power flux-density and separation distance required to protect the satellite service is given in Figs. 1 and 2 for the following characteristics.
3.1.2.1 Terrestrial broadcasting system— transmit station e.i.r.p.: 1 MW;— transmit antenna height above average terrain: 300 m;— luminance signal-to-unweighted r.m.s. noise, for just perceptible interference: 36 dB (525 lines), 45 dB
(625 lines);— minimum signal to be protected: 64 dB (jiV/m) (525 lines), 65 dB (pV/m) (625 lines);— receive antenna maximum gain Recommendation 419: 16 dB;— required protection ratio from satellite service: 42 dB (525 lines) and 52 dB (625 lines).
3.1.2.2 Broadcasting-satellite service for com munity receptionFrequency modulation with peak-to-peak deviation: 10.6 MHz (525 lines), 13 MHz (625 lines):
— luminance signal-to-unweighted r.m.s. noise (beam edge): 36 dB (525 lines), 45 dB (625 lines);— satellite power flux-density at beam edge:
-118 dB(W/m2) (525 lines),-1 1 0 dB(W/m2) (625 lines);
— receive antenna gain (3.3 m diameter, 9° beamwidth): 25 dB;— receive antenna discrimination (Report 215-4, § 4.1): (10.5 + 25 log (p/<Po);— required protection ratio from terrestrial service: 18 dB (525 lines), 28 dB (625 lines).Note. — The calculations do not include allowance for polarization discrimination nor for ground reflections or multiple interference. Note also that the example shown in this section uses a protection ratio of 18 dB which would result in a picture impairment level between 3.5 and 4 for less sensitive material. Report 634-1 now indicates that protection ratios as high as 32 dB may be required for lessimpairment of more sensitive material. Such protection ratios would result in larger required separationdistances and larger required angles of discrimination.

Powe
r flu
x-de
nsity
of
terr
estr
ial
tran
smis
sion
at
eart
h-sta
tion
rece
iver
(d
B(W
/m2))
198 Rep. 631-1
Ratio (p/<p0
FIGURE 1 — Example of maximum permissible power flux-density from a terrestrial transmitter to protect an earth-station receiver
<-p : direction of terrestrial transmitter relative to the axisof the main beam of the earth-station antenna
i-p0 : 3 dB beamwidth of earth-station antenna
---------------- : 525-line system M (Canada, USA)
----------------- : 625-line systems
Distance from terrestrial transmitter (km)
FIGURE 2 — Example of separation distance to protect earth-station receivers from terrestrial transmitters
Terrestrial transmitter e.i.r.p.: 1 MW
Antenna height above average terrain: 300 m
Frequency: 700 MHz------------- : 525-line system M (Canada, USA)-------------- : 625-line systems

Rep. 631-1 199
Limitations on power flux-densities which would have to be imposed on the broadcasting-satellite television service to protect fixed and mobile services, including trans-horizon radio-relay systems, at present allocated the same frequency bands as the broadcasting service, may cause difficulties in such sharing. Careful consideration is, therefore, necessary before introducing the broadcasting-satellite service. Tropospheric scatter systems which point towards the geostationary orbit are particularly vulnerable. Examples of the required power flux-density limits in the case of sharing with land mobile services are given in Annex I.
4. Sharing in the band 2500 to 2690 MHz
4.1 Sharing with the fixed service *
The terrestrial systems in the fixed service that are considered for frequency-sharing with a broadcasting- satellite system include line-of-sight and trans-horizon radio-relay systems and a certain type of television distribution system. Conditions of sharing between the television broadcasting-satellite service and other terrestrial services are not presented owing to the absence of relevant data.
The type of broadcasting-satellite system chosen for examination was one designed for community reception. An example of the parameters of such a system is given in Table II.
TABLE II — Example o f the characteristics o f a satellite television system fo r community reception (operating in the vicinity o f 2600 M H z)
3.2 Sharing with fixed and mobile services
(System M, USA and Canada)
Circularly polarized emission
Frequency-modulation
Equivalent rectangular bandwidth: 20 MHz
Earth-station receiving antenna gain (3 m paraboloid: 36 dB)
Earth-station receiving antenna discrimination:10.5 + 25 log (<p/(p0)
where:cp: angle o ff the main beam axis,cp(): angle between the half-power points, 2.6 degrees
Minimum side lobe gain: 0 dB
Satellite field-strength to be protected at beam edge: 28 (dB([iV/m))
Luminance signal-to-unweighted r.m.s. noise: 36 dB
Required protection ratio from ITSF ('): 17 dB
(*) ITSF: Instructional Television Fixed Service.
4.1.1 Sharing with line-of-sight radio-relay systems
Although this case could not be studied in detail owing to lack of relevant information, it should be noted that the establishment of circuits comprising a large number of relay stations often implies the repetitive use of frequencies according to a plan occupying a continuous section of the allocated band which cannot be departed from without difficulty (see Recommendations 283-3 and 382-2).
Co-channel operation between a broadcasting-satellite system and a terrestrial radio-relay system results in a number of limitations because the presence of a transmitter of a terrestrial radio-relay system within, or in the neighbourhood of, the service area of the broadcasting satellite system gives rise to a “hole” in the broadcasting service area. This makes planning of the radio-relay channelling very difficult.
To the extent that proposed fixed satellite systems used for television distribution are technically similar to broadcasting- satellite systems, they also are subject to these considerations.
200 Rep. 631-1
Frequency-sharing between broadcasting-satellite systems and trans-horizon radio-relay systems in the vicinity of 2600 MHz is technically feasible only to the extent that each system can accept certain technical and operational limitations required to protect it against interference from the other. (See also § 8.4.3 of the Report of the Special Joint Meeting, Geneva, 1971.)
4.1.2.1 Protection o f trans-horizon radio-relay systems
Trans-horizon radio-relay systems are subject to geographical and frequency constraints which limit planning flexibility and could make it difficult to avoid potential interfering configurations. Sharing would involve consideration of the pointing directions of the trans-horizon system antennae, to protect the trans-horizon system receivers as well as consideration of the directivity of the satellite antenna. When the trans-horizon receiver is within the coverage area of the broadcasting-satellite and suitable protection is not available, one possible remedy would be to re-engineer the trans-horizon system to use different frequencies. Alternatively, the broadcasting-satellite system would be required to restrict its power flux-density to low values in the immediate vicinity of the trans-horizon receivers. These constraints are not likely to be acceptable to either service except under special conditions where the number of systems is small and the flexibility of placement of both the satellites and the trans-horizon stations is large. When the trans-horizon receiver lies outside the coverage area of the broadcasting satellite the problem would be eased, depending upon the system configurations in each case and the radiation pattern of the satellite antenna.
4.1.2.2 Protection o f broadcasting-satellite systems
The receivers of the broadcasting-satellite service would be susceptible to interference from trans-horizon radio-relay transmitters within an elongated zone which extends for a considerable distance in the direction in which the trans-horizon antenna is pointed; the extent of this zone is a function of the antenna directivity and the relative directions of the trans-horizon link and the satellite. Similarly, the establishment of a satellite broadcasting coverage area would prevent the introduction of new transhorizon systems in that area and also, nearby, if the entire area were to be protected from interference.
4.1.3 Sharing with a certain type o f fixed terrestrial television distribution
An example of the characteristics of the type of terrestrial television distribution system in question is given in Table III. These characteristics are typical of the Instructional Television Fixed Service (ITFS) system used in parts of Region 2. Specifically, such systems utilize approximately 10 W transmitters with omnidirectional, or directional, antennae and specified receiving points (educational institutions) which employ directional parabolic receiving antennae. Recent technological advances permit the use of a low-noise preamplifier to reduce the system noise figure, allowing a corresponding reduction in receiving antenna gain, or a decrease in ITFS transmitter e.i.r.p., or an increase in the service range of the ITFS system. Examples of the ITFS receiving antenna gains and of the receiving antenna beamwidths associated with receiver noise figures (NF) of 9 dB and 3.5 dB are shown in Table III. In both cases, the type of service rendered is considered similar to community reception as defined for the broadcasting-satellite service.
Frequency-sharing in the vicinity of 2600 MHz between a broadcasting-satellite system and an ITFS system is technically feasible under certain conditions. A limit on the power flux-density of the satellite signal would have to be specified to protect the ITFS service and a “hole” or an area of interference within the satellite service zone would be created due to interference from the ITFS operation. The size of this area of interference depends on the transmitter power and height of the transmitting antenna of the ITFS system, the angular discrimination of the earth receiving antennae of the broadcasting-satellite system, and the angle of elevation of the satellite.
4.1.3.1 Protection o f the ITFS system
The maximum permissible power flux-density reaching the surface of the earth from broadcasting satellites in the 2600 MHz band is set forth in the Radio Regulations (470 NI). Systems in the ITFS can share the same frequencies without receiving unacceptable interference if the ITFS receiving antennae can provide isolation Resulting from angular discrimination. This required angular discrimination can be determined as follows:
Since the minimum useful satellite field-strength of 28 dB(pV/m) from Table II corresponds to a satellite power flux-density of —117.8 dB(W/m2), a minimum value of:
<p/<p0 = 1.4 (3)
4.1.2 Sharing with trans-horizon radio-relay systems
is required to protect the ITFS system.

Rep. 631-1 201
TABLE III — Examples o f characteristics fo r a typical ITFS system (operating in the vicinity o f 2600 M H z)
A BAmplitude modulation, vestigial sideband,
System M (USA and Canada) Omni-directional Narrow-beamdirectional
E.i.r.p. (dBW) 20 25
Service range (approximate) (km) 50 70
Received signal to be protected (dB (pV/m)) 56 56
Luminance signal-to-unweighted r.m.s. noise (dB) 36 36
Receiving antenna gainWith 9 dB N.F. receiver (dB) 31 33.5With 3.5 dB N.F. preamp. (dB) 23.6 26.1
Receiving antenna beamwidthWith 9 dB N.F. receiver (deg) 4.3 3.2With 3.5 dB N.F. preamp. (deg) 11 8
Receiving antenna discrimination where:
<p : angle off the main beam axiscp0 : angle between the half-power points
(dB) 10.5 + 25 log(cp/cp0) 10.5 + 25 log(q) / cp0)
Reported protection ratio from satellite signals (dB) 42 42
Thus, for the ITFS sites where the offset angle to the satellite is less than:6° for ITFS sites using a 9 dB noise figure and a 31 dB gain antenna;15.4° for ITFS sites using a 3.5 dB noise figure and a 23.5 dB gain antenna;
sharing will generally require careful site co-ordination because of insufficient antenna discrimination. Shielding by natural terrain and buildings has been shown to significantly ease sharing problems. The values indicated are for one satellite entry. No allowance has been made for multiple satellite entries, nor ground reflections.
Fig. 3 shows the satellite power-flux for values of <p/cp0 from 0.5 to 10 for which sharing is possible. It also shows the relationship of — 117.8 dB(W/m2) with <p/<p0 = 1-4 as well as the maximum likely power-flux derived from § 470 NI of the Radio Regulations, and an assumption of 1 MHz of dispersal. It shows that the maximum usable values of <p/<p0 are 2.4 for an ITFS transmitter e.i.r.p. of 20 dBW and 1.5 for an e.i.r.p. of 25° dBW.
Note that increasing the sensitivity of ITFS receivers by using preamplifiers with lower noise figures, increases the difficulty of sharing with the broadcasting-satellite service.
4.1.3.2 Protection o f the television broadcasting-satellite system
An earth receiving installation for community reception can be protected from ITFS interference provided that the power flux-density of the latter is limited to a maximum of —96 dB(W/m2) as seen from Fig. 4. This protection is achievable at a minimum angle of elevation for the satellite, of 28.3°. The necessary separation between the earth receiving installation location and the ITFS transmitter for different values of the ITFS power flux-density and discrimination angles in the range from 60 km to over 140 km is shown in Fig. 5. These values assume no site shielding, and were calculated from the following formula:
E, (d , r) E.i.r.p., - 10 log (And 2) - Lt (d , r) + 146 (4)where,E, (d , r ) : signal emitted by terrestrial transmitter (d B (p V /m ) at distance, d , w ith probability , r(%),d: distance from terrestrial transmitter,L, (d , r ) : attenuation in excess o f the spreading loss at d istance, d, not exceeded for r% o f the tim e
(here, assum ed 1%).

202 Rep. 631-1
Note that a protection ratio of 17 dB was used in this example. The note in § 3.1.2.2 discusses the consequence of higher required protection ratios.
The separation distances shown in the figures are theoretical, worst-case values. Some observations have been made of interference from ITFS transmitters to receivers similar to those that might be used in the broadcasting-satellite service. These interference values were obtained from experiments conducted recently with the ATS-6 spacecraft and a multiplicity of small receiving installations, some of which were sited near ITFS transmitters or at various locations within their antenna patterns.
Although the actual separation distances and discrimination angles were not, in several cases, sufficient to insure interference-free reception based on the criteria of this Report, no interference was noted even though such receivers were quite close to the transmitter or almost in its main beam.
Although these observations were not sufficiently detailed or extensive enough to dictate changes in the methods of calculation described in this Report, they do suggest that the methods herein are conservative, and that there may be more interference-free locations and areas than indicated by the curves in this Report.
The observations that were made, and which are described in detail in [CCIR, 1974-78a] also indicate the need for more precise measurements of interference in the vicinity of terrestrial systems in the band 2500-2690 MHz.
Ratio <p/<p0
FIGURE 3 — Example of maximum permissible power flux-density from satellite to protect terrestrial service
(ITFS service at 2.6 GHz)Energy dispersal: 1 MHz
<p : direction of satellite relative to axis of main beam of terrestrial receiving antenna
<p0 : 3 dB beamwidth of terrestrial receiving antenna
Curves A : Maximum power flux-denslty (based on Radio Regulation No. 470 NI)
B : ITFS, e.i.r.p. 20 dBWC : ITFS, e.i.r.p. 25 dBW

Terr
estr
ial
powe
r flu
x-de
nsity
at
eart
h-sta
tion
rece
iver
(d
B(W
/m2))
Rep. 631-1 203
Ratio <p!(p0
FIGURE 4 — Example of maximum permissible power flux-density from terrestrial transmitters to protect earth-station receivers
(ITFS service at 2.6 GHz)
<p : direction of terrestrial transmitter relative to the main axis of earth- station antenna
((P : 3 dB beamwidth of earth-station antenna
Distance from terrestrial transmitter (km)
FIGURE 5 — Example of separation distance to protect earth-station receivers from terrestrialtransmitters
(ITFS service at 2.6 GHz)
Curves A : e.i.r.p. 20 dBW B : e.i.r.p. 25 dBW
Angle
of
disc
rimin
atio
n of
earth
sta
tion
(deg
.)

204 Rep. 631-1
4.2 Energy dispersal
An example of the use of energy dispersal in the 2.6 GHz band is presented in [CCIR, 1970-74c], which also shows calculations of the required bandwidth and corresponding signal-to-noise ratio. The conclusion is that the performance of a 2.6 GHz broadcasting-satellite system using small receiving antennae can be severely limited by the need to provide energy dispersal.
4.3 Sharing with the radioastronomy service
Report 224-4 discusses sharing between the radioastronomy service and the broadcasting-satellite service. In the shared band, the possibilities of geographical sharing need to be explored. In making assignments, the attention of Administrations is drawn to the adjacent band problems discussed in Report 224-4 and in Report 809.
5. Sharing in band 11.7 to 12.5 GHz
This section presents the conditions for frequency-sharing in the 12 GHz band between the broadcasting- satellite and terrestrial services. Sharing between the broadcasting-satellite service and the fixed satellite service in the band 11.7 to 12.2 GHz (applicable to Region 2) is considered in Report 561-1 and in Report 809.
Rainfall attenuation in some climates may require large propagation margins if high service reliability is desired. The effect of this margin should be taken into account when considering sharing problems.
5.1 Conditions for the protection o f terrestrial systems against interference from broadcasting satellites
5.1.1 General considerations
The bandwidth of a 625-line satellite broadcasting emission is given as an example in Report 215-4, as 27 MHz. For conditions where no video information is present or where the video information is repetitive in certain ways, the power can collect itself in the form of spikes of energy. Since some terrestrial services may be affected by power spectral density rather than total interfering power it is important to try and relate the power of a broadcasting satellite emission to the power in different bandwidth values. This leads to consideration of applying energy dispersal to the broadcasting satellite emission or interfered-with service.
For terrestrial systems carrying analogue FM D/FM telephony, in which a 4 kHz bandwidth is considered when assessing interference levels, the advantages of energy dispersal are significant. Studies of energy dispersal in the broadcasting-satellite service have shown that “natural” dispersion values on the order of 10 dB exist [CCIR, 1974-78b, c and d].
The WARC-BS (Geneva, 1977) adopted the use of energy dispersal for the broadcasting-satellite service specifying the value of 600 kHz.
With such a value the advantage for terrestrial systems carrying television signals would appear to be negligible. The subjective effect of a dispersed FM-signal on an AM-TV signal actually gives a reduction in protection ratio of about 1.5 dB per MHz peak-to-peak deviation of the dispersed signal (see Report 634-1).
It is unlikely that there will be widespread use of energy dispersal by terrestrial services such as the fixed service.
The power flux-density in a 4 kHz bandwidth from a broadcasting satellite emission can be simply obtained by subtracting the appropriate value in Table IV from the total power flux-density in the 27 MHz bandwidth.
TABLE IV — Energy dispersal advantage relative to a 4 kH z band
Condition o f dispersal Energy dispersal (dB)
Natural 10
600 kHz (WARC-BS) 22
1 MHz 25
2 MHz 27
4 MHz 30
An additional protection advantage also dependent on the spectrum of a broadcasting satellite emission may be obtained in certain circumstances by offsetting the terrestrial channels from the broadcasting satellite channels. Such protection will of course depend on the terrestrial emission having a bandwidth equal to, or less than, the spacing between the satellite broadcast channels; and the precise advantage will depend on the spectrum of the two signals. Further study is required to produce numerical

Rep. 631-1 205
values but may lie in the range 0 to 10 dB depending on the aforementioned factors. Since Report 811 indicates that energy dispersal has an adverse effect on protection ratios it would appear to follow that energy dispersal would have an adverse effect on the advantage to terrestrial services from offsetting their emissions from those of broadcasting satellites.
The WARC-BS (Geneva, 1977) adopted circular polarization for the broadcasting-satellite service. Terrestrial systems employing linear polarization should not rely on more than 3 dB of polarization discrimination.
5.1.2 Sharing models
Three different sharing models are considered together with the appropriate sharing criteria:M odel I. — A broadcasting-satellite service which is not based on an orbital position/frequency
assignment plan and in which constraints in terms of either level of power flux-density or angle of arrival are imposed only if and when the need arises. Adherence to certain sharing principles that assure equitable sharing with the other space services allocated in the band and that promote efficient utilization of the spectrum orbit resource, is an important ingredient of this model.
M odel 2. — A broadcasting-satellite service which is based on the orbital position/frequency assignment plan and which meets the power flux-density needs of individual reception for the average sized country at the edge of its service area. This value of power flux-density, appropriate suppression of the satellite emission outside the service area and other factors pertaining to sharing form an integral part of the plan.
M odel 3. — A broadcasting-satellite service which is based on an orbital position/frequency assignment plan and in which power flux-density produced on the surface of the Earth on the territories of other countries by space stations in the broadcasting-satellite service, is limited to a value of less than that given in Report 811 for individual reception, and sufficiently low to enable sharing with analogue radio-relay systems for multichannel telephony, providing the latter observes specific sharing conditions [CCIR, 1974-78e].
5.1.3 Sharing conditions for M odel 1
For areas where terrestrial services are planned, power flux-density limits and angle of arrival restrictions and other sharing criteria will have to be established.
5.1.4 Sharing conditions for M odel 2
Fig. 6 shows the two essential elements of sharing in this model; that of the satellite antenna discrimination (which can be expressed as a function of the off beam angle, <p) and that of the terrestrial receiver antenna discrimination (which can be expressed as a function of the angle of arrival, 0).
To illustrate the concepts of this sharing model, the beam centre indicated in Fig. 6 is assumed to be aimed at a point 40° North and the beamwidth of the satellite antenna is assumed to be 2°. The resulting power flux-density on that longitude is shown in Fig. 7 by the solid line. The different values are as a result of the satellite antenna discrimination. The dashed line indicates for the example of a radio relay system carrying television (line 2 in Table VII), the interfering power flux-density which can be accepted. The different values are as a result of the radio relay antenna discrimination. Where the dashed line is above the solid line, sharing is feasible for any direction of azimuth of the terrestrial receiver. Where the solid line is above the dashed line, sharing is only feasible when the radio relay antenna is displaced in azimuth by a suitable amount from the satellite position on the geostationary orbit. This same example is plotted in Fig. 8 in the form of a contour map showing that with this particular example of terrestrial systems sharing is feasible in the non-hatched portions with no restrictions. Sharing is feasible in the hatched portions only with restrictions on the pointing direction of the radio relay antenna.
It should be noted that the above example only considers the case of a single satellite beam. Whilst a 2° beam at 40° N is considered a fairly worst case example, the precise geographical area over which sharing is feasible will depend on the outcome of the actual orbit position/frequency assignment plan which is established. The geographical area will also depend significantly on the sensitivity of the particular terrestrial services using the band.
The above example is for a single value of satellite antenna beamwidth. A more general way of expressing the sharing criteria for any satellite beamwidth is illustrated below for the example of a terrestrial broadcasting system [CCIR, 1974-78fJ.
In the example the necessary value for the protection ratio for just perceptible interference, PR0, is 56 dB (wanted signal AM-VSB, 625 lines; unwanted signal FM, nominal peak-to-peak frequency deviation 8 MHz). However, taking into account the masking of interference by random noise, a lower value, PR,, for the protection ratio, calculated according to the formula:
PR, = PR0 - (49 - S /N ) (5)
has been adopted in our calculations, where S /N is the peak-to-peak luminance signal-to-r.m.s. weightednoise, exceec^d for 99% of the time at the edge of the coverage area in the terrestrial broadcasting system.This signal-to-noisc ratio is assumed to be 39 dB.

206 Rep. 631-1
FIGURE 6 — Interference to receiver of terrestrial broadcast from broadcasting-satellite transmitter
A : off-beam angle of satellite antenna B : beam centre C : angle of arrival D : terrestrial receiver
Thus,PRX = 56 - (49 - 39) = 46 dB (6)
The minimum power flux of the wanted signal at the edge of the coverage area in the terrestrial broadcasting system, exceeded for 99% of the time is —85.5 dB(W/m2). Thus, the interfering power flux arriving from the least-favourable direction in the horizontal plane should not exceed —131.5 dB(W/m2).
On the assumption that a typical power flux produced on earth by the broadcasting-satellite at the beam-centre in clear weather is —98 dB(W/m2), a discrimination of about 33.5 dB must be ensured.

Rep. 631-1 207
0° 20° 40° N 60° 80° 90° 80° 60° s 40° 20° 0°
Angle of arrival at the surface of the Earth (degrees)
FIGURE 7 — Example for sharing model 2 showing feasibility offrequency sharing between a broadcasting satellite providing individual reception and a
radio relay carrying television
--------------- Power flux-denslty from broadcasting satellite;- aiming point of satellite beam 40° N- satellite antenna beamwidth 2°
------------------Maximum acceptable interfering power-flux density into a radio relaysystem carrying television (example in [CCIR, 1974-78 1]).
--------------- Equator
Curves A : terrestrial system B : satellite
The envelope side-lobe diagram of the receiving antenna in the terrestrial broadcasting system is assumed to comply with the reference curve A given in Report 810, Fig. 2. Values for the antenna gain according to this reference curve are shown in Table V.
TABLE V — Gain and angular discrimination fo r the receiving antennae in the terrestrial broadcasting system
Off-beamangle
0(degrees)
A ntenna gain (dB)
Relative to isotropic radiator
Relative to maximum main-lobe gain (34.5 dB)
1 0 13.5 —2 1 . 015 8 . 0 —26.52 0 5.5 —29.025 3.0 —31.5
> 29.65 1.5 —33.0

208 Rep. 631-1
353
Angle of elevation
FIGURE 8 — Power flux-density from a broadcasting satellite with a 2° beam aiming at a latitude of40°N
Note. - The hatched regions In the above diagram indicate the area of the surface of the Earth where the maximum permissible interference power flux-density into a television radio-relay link is exceeded, limits from [CCIR, 1974-78 m].
It appears from Table V that the required discrimination of 33.5 dB cannot be obtained from the angular response of the receiving antennae in the terrestrial broadcasting system alone. Thus, co-channel operation of the terrestrial service using amplitude modulation within the broadcasting-satellite service area is not possible.
However, outside the broadcasting-satellite service area additional angular discrimination is obtained, due to the angular discrimination of the broadcasting-satellite transmitter antenna (see Fig. 6).
The relative gain of the broadcasting-satellite transmitter antenna is assumed to comply with Report 810, Fig. 1, curve A. The required value of <p/<p0 (Fig. 6) to obtain sufficient additional angular discrimination has been calculated and is shown in Table VI.
TABLE VI — Required value o f additional angular discrimination o f B C -SA T transmitter antenna
BC-SAT elevation angle at
receiving point (degrees)
Required value for the angular discrimination o f
the BC-SAT transm itter antenna (dB)
Required value for
<P/<Po
1 0 12.5 0.9815 7.0 0.602 0 4.5 0.5425 2 . 0 0.33
> 29.65 0.5 0.25
Rep. 631-1 209
A nother exam ple o f a terrestrial broadcasting system in w hich the m inim um pow er flux-density at the fringe o f the service area is assum ed to be —78.2 d B (W /m 2), can accept an interfering pow erflux-density arriving from the least favourable direction in the horizontal p lane not exceed ing— 124.2 d B (W /m 2). Such a value w ould enable feasible sharing over larger geographical areas than isindicated for the exam ple in Table VI.
Other exam ples are given in [C CIR, 1974-78g, h, i, j and k].
5.1.5 Sharing con d ition s fo r M o d e l 3
In this m odel [C CIR, 1974-78e], the pow er flux-density at the surface o f the Earth produced by any space station in the broadcasting satellite service on the territory o f other countries is lim ited to a value o f the order o f — 128 d B (W /(m 2-4 kH z)) independent o f the angle o f arrival.
U nder these conditions it is possib le to form ulate restrictions on the choice o f a radio-relay pathwith w hich the associated interference pow er in the telephone channel o f a reference 50 station radio-relaylink does not exceed 1000 pW with the pow er flux-density at the surface o f the Earth being— 128 d B (W /(m 2-4 kH z)) independent o f an angle o f arrival.
The fo llow ing approxim ation is used in the calculations:
P = Ptn - W • (C ?(0)/Sj) * (7)
where,
W : perm issible pow er flux-density at the surface o f the Earth, assum ed in this case to be equivalent to- 128 d B (W /(m 2-4 kHz));
P : interference pow er o f the telephone channel (W);
Ptn : therm al noise in the telephone channel assum ed to be 20 pW ;
G (0) : radio-relay receiving antenna gain in the direction o f the interfering signal arriving from a space station,10 log G(0) = 35 - 25 log (0)
S; = 4n k T b /X 2
k = 1.38 x 10~ 23
X = 2.5 cm
r = 890 K
b = 4 kHzAs the calculations show, with the assumptions adopted, the associated interference power does not
exceed 1000 pW if, for example, the direction of one radio-relay receiving antenna differs from that to the interfering space station by 3°; and the directions of other antennae differ from the direction to interfering space stations by 16°, or if the directions of all antennae differ from the directions to interfering space stations by approximately 13°.
The limitations given can be realized both in low and high latitudes. It is also natural that restrictions on the choice of radio-relay paths are different in high and low latitudes.
5.2 Conditions for the protection o f a broadcasting satellite frequency-modulation television system against interference from terrestrial systems
Typical values of e.i.r.p. for some terrestrial services which use or may use the band 11.7 to 12.5 GHz and which may cause interference to an earth station receiver of the broadcasting-satellite service are indicated in Table VIII.
Equation (1) is also applicable for the case of protection for the satellite system provided that the factors are changed as necessary to represent the appropriate parameters of the satellite system.
Where the appropriate protection ratio is unknown an alternative approach may be used for the determination of the maximum interfering power flux-density at the earth station receiver, based on the effective receiver input noise power. If the maximum acceptable level of interference is limited to 10% of the effective receiver input noise power, then even under conditions of a severe fade of the wanted signal, the interference will not further degrade the output signal-to-noise ratio of the receiver, provided that the face of the wanted signal does not fall below the carrier threshold level.
If the protection ratios are known, similar curves to those given in Fig. 8 can be drawn. An example for a 625-line system is given in Fig. 9 of this Report and is based on a power flux-density of —103 dB(W/in2) and a single-entry protection ratio of 35 dB ** against frequency-modulation interfering signals for reception in the broadcasting satellite service. From Fig. 9 the maximum tolerable interfering power flux-densities can be determined depending on the elevation angle of the earth station receiving antenna and the difference in azimuth of the directions of the satellite and the interfering signal.
* Care must be taken to use consistent units in the calculations.** These values of p.f.d. are specified by the WARC-BS (Geneva, 1977) for Regions 1 and 3.

210 Rep. 631-1
Angle cp (deg.)
FIGURE 9 — Acceptable interfering power flux-density from a terrestrial transmitter not to be exceeded for 99% of the time at an earth receiver (individual reception) for the example given in § 5.2
(The angle of elevation of the satellite is shown as a parameter)
cp : Difference In azimuth between the directions of the satellite and the interfering signal.Earth-receive antenna maximum off-beam gain: see Report 810, Fig. 2, curve A, where: <p0: Antenna 3 dB beamwidth
: 2.0° (for Individual reception in Region 3) from Final Acts WARC-BS (Geneva,1977).
: Discrimination angle at the earth-receiver.
It should be noted that the expression Dd = 8.5 + 25 log ((p/<p0) dB for the antenna discrimination represents the envelope of the maxima of the antenna side-lobes and thus the minimum discrimination. (See Report 810, Fig. 2.)
If it is assumed that the mean discrimination at an angle is some 3 dB greater than the minimum discrimination at that angle, then it can be stated that, for example, in 90% of locations the interfering signal strength will not exceed a level 1.7 dB below the maximum permitted.
When the maximum acceptable power flux-density for any particular direction at the earth-station receiver has been determined from Fig. 9, then the separating distance required between an outside broadcasting link and the earth-station receiver may be determined from Fig. 10.

Rep. 631-1 211
0 40 80 120 160Distance from transmitter to earth-receiver (km)
FIGURE 10 — Required separation distance to protect an earth receiver from terrestrial transmitters
(based on propagation curves for 50% of locations and 1% of time)
Power flux-density produced by :A : Outside broadcast transmitter (e.i.r.p.: 34 dBW)B : Amplitude-modulation television broadcasting (e.i.r.p.:
38 dBW)*C : Frequency-modulation television terrestrial broadcasting
(26 dBW)*
Fig. 10 also gives the separating distances required for a given value o f pow er flux-density betw een an earth station receiver and transmitters o f an am plitude-m odulation terrestrial broadcast and a frequency-m odulation terrestrial broadcast. The Schm eller and U lonska propagation curve for 50% o f locations and 1% o f the tim e [G oes e t al., 1968] has been used in the preparation o f Fig. 10.
To protect a higher percentage o f locations for the broadcasting satellite service, w hich m ight be necessarybecause o f the uniform distribution o f the wanted pow er flux-density in the service area, a correction to the m axim um acceptable interfering pow er flux-density should be applied sim ilar to that given in Fig. 12 o f R eport 370-2.
It is evident from Fig. 10 that, for large areas, frequency sharing with a given broadcasting-satellite servicearea w ould best be accom plished over an appreciable portion o f that area i f the terrestrial service operated inportions o f the band not used by the broadcasting-satellite service w ithin that service area as suggested in [C C IR , 1974-78n],
5.3 E ffects o f p ro p a g a tio n
In m aking calculations o f interference, the effects o f propagation should be taken into account using the latest relevant m ethods o f the CCIR.
Transmitting antenna 75 m above the ground.

212 Rep. 631-1
TABLE VII — Examples fo r interfering pow er flux-densities acceptable by systems in the 12 GHz band(From [CCIR, 1974-78 b])
Wanted system Percentage o f time
Maximum interfering power flux- density (dB(W /m 2)) for angle o f arrival o f 0° relative to the
main axis o f terrestrial antenna
Antenna off-beam discrimination!1)
1 2 3 4
Line-of-sight FM-radio relay links carrying telephony (3)
99.9 — 128/4 kHz (2) at any angle o f arrival
35-25 log tp
Line-of-sight FM-radio relay links carrying television programmes!3)
99.9 — 125/5 MHz 10.5 + 25 log ( (p/ cp0)
Line-of-sight AM multi-channel systems carrying television programmes (3)
99.9 — 134/5 MHz 10.5 + 25 log ((p /(p 0 )
Terrestrial AM television system 99 — 130/5 MHz 9 + 20 log (<p/ cp0)
Terrestrial FM television system 99 — 130/27 MHz 9 + 20 log ( (p / cp0 )
Broadcasting-satellite system (individual reception)
99 — 131/27 MHz —(9 + 20 log (<p/(p0 ))(2) for 0.707tp0<cp< 1.26tp0
—(8.5 + 25 log10(<p/<Po)) for 1.26 (p0<tp^9.55(p0
(') Antenna off-beam gain.(2) See Report 810 § 5.15.(3) For further information on parameters o f these systems consult Report 608.
TABLE VIII — Examples fo r e.i.r.p. o f transmitters in the 12 G H z band
Service e.i.r.p. (dBW)
Line o f sight radio-relay links: TelephonyTelevision programme distribution
Television multi-channel
Broadcasting:Amplitude-modulation
Frequency-modulation
3641
23.5 to 46
23.5 to 38 26
Frequency-modulation (satellite system) 67.5
6. Sharing in band 22.5 to 23 GHz
Only limited studies are available for the 23 GHz band. The maximum acceptable power flux-density from a satellite in the fixed-satellite service has been indicated in Recommendation 358-2. As a result of an examination of the effect which this Recommendation would have on a broadcasting-satellite service in the band 22.5 to 23 GHz [CCIR, 1970-74d], it is considered that further study is needed concerning the power flux-density allowed for a broadcasting satellite, instead of applying the values given in Recommendation 358-2, because broadcasting-satellite transmissions would be expected to require a higher maximum power flux-density, although the transmissions would probably employ smaller beamwidths than the fixed-satellite service.

Rep. 631-1 213
REFERENCES
GOES, O. W., HEINZELMANN, G. and VOGT, K. [October, 1968] Transmitter-network planning for terrestrial television broadcasting in the 11.7 to 12.7 GHz band. EBU Review , Part A, 111-A, Technical.
CCIR Documents
[1970-74]: a. 11/73 (India); b. 11/331 (EBU); c. 11/48 (USA); d. 10/267 (11/324) (Japan).
[1974-78]: a. 11/124 (USA); b. 11/112 (Germany, Federal Republic of); c. 11/415 (France); d. 11/420 (France); e. 11/168 (U.S.S.R.); f. 11/172 (Netherlands); g. 11/170 (Netherlands); h. 11/143 (ESA); i. 11/163 (Switzerland); j. 9 /92 (Germany, Federal Republic of); k. 11/152 (U.S.S.R.); 1.11/142 (United Kingdom); m. 9/83 (United Kingdom); n. 11/174 (Australia).
BIBLIOGRAPHY
[1974-78]: a. 11/19 (United Kingdom); b. 11/22 (Switzerland); c. 11/34 (Japan); d. 11/108 (Canada); e. 11/141 (United Kingdom); f. 11/153 (USA); g. 11/156 (Germany, Federal Republic of).
ANNEX I
EXAMPLES OF POWER FLUX-DENSITY LIMITS REQUIRED TO PROTECT THE LAND MOBILE SERVICE AT ABOUT 800 MHz
For a single broadcasting satellite in the visible orbit, the acceptable value of power flux-density produced on the surface of the Earth by the satellite is:
— to protect a high grade service:
—133 dB(W/(m2 • 16 kHz)) at the receiving antenna of the mobile station;—146 dB(W/(m2 • 16 kHz)) at the receiving antenna of the base station;
— to protect a minimum grade service:
—127 dB(W/(m2 • 40 kHz)) at the receiving antenna of the mobile station;—134 dB(W/(m2 • 40 kHz)) at the receiving antenna of the base station.
These values are applicable only for the land mobile service at about 800 MHz.
The value of —146 dB(W/(m2 • 16 kHz)) is based on currently available information and is, for example,necessary to protect a system operating in the land mobile service at about 800 MHz having the followingcharacteristics:
— channel spacing: 25 kHz;
— receiver bandwidth: 16 kHz;
— receiver noise factor: 10 dB;
— improvement factor: 12 dB;
— antenna gain: 15 dB;
— radio-frequency protection ratio: 18 dB;
— polarization discrimination: 3 dB.
For different or additional characteristics, the power flux-density mentioned will change accordingly. This value takes into account low elevation angles of the broadcasting-satellite.
It should be noted that if several broadcasting-satellites are in a visible orbit, the power flux-density produced by each satellite must be correspondingly lower than that quoted above.
It would be desirable to obtain more data on parameters of systems in operation or under development from other Administrations before a general value of protection to systems in the land mobile service can be arrived at. Further studies should therefore be undertaken on receipt of additional data.
At the present time it seems premature to judge whether sharing between the broadcasting-satellite service and the land mobile is feasible at about 800 MHz.

214 Rep. 632-1
REPORT 632-1
BROADCASTING-SATELLITE SERVICE: SOUND AND TELEVISION
Technically suitable methods of modulation
(Questions 20-3/10 and 5-3/11)
(1974 - 1978)1. Sound broadcasting
For the frequency bands allocated by the World Administrative Radio Conference for Space Telecommunications, Geneva, 1971 to the broadcasting-satellite service, it seems preferable to use frequency modulation with the same standards as those used for terrestrial sound broadcasting (see Recommendations 412-2 and 450); but they could be different in certain cases. In particular, it may be desirable to use a higher deviation, to reduce the necessary satellite transmitter power, especially in the frequency bands where new receivers or additional equipment for existing receivers, would in any case be required.
For stereophonic broadcasting using a frequency-modulation multiplex system (Recommendation 450), it is necessary to increase by about 20 dB the values of field-strength, power flux-density, and satellite e.i.r.p. Stereophony could also use two identical channels, carrying the left and right signals, but there may be some problems for compatible monophonic reception.
2. Television
The two types of modulation best suited to the broadcasting-satellite service (television) seem to be vestigial-sideband amplitude modulation and frequency modulation. Systems using analogue video and PCM sound channel or channels could be envisaged in the future (Study Programme 12B/11). With further development pulse-code modulation techniques may also become practicable for video transmission for broadcasting satellites.
For a given quality of service and a given figure of merit of the receiving installation, frequency modulation permits a much lower satellite transmitter power than amplitude modulation. However, in frequency bands for which there are existing terrestrial television receivers, amplitude modulation would allow these receivers to be used without modification [CCIR, 1970-74a]. From the point of view of planning, frequency modulation requires wider channels, but the protection ratios are lower than for amplitude modulation, so either type of modulation may be advantageous, depending on the circumstances.
When frequency modulation is used, the video signal characteristics are unchanged (see Report 624-1), but the specifications of the transmission and channel characteristics are different (see Report 215-4, § 5). Particularly in the initial stages of development, it would be preferable to use a simple modulation converter, having an output signal conforming to the radio-frequency standard of the receiver normally used (that is, a vestigial-sideband amplitude-modulation vision signal, and a sound channel at the appropriate frequency spacing). Alternatively, dual-standard receivers or special receivers for the satellite transmissions could be used (see Report 473-2).
In frequency-modulation television, the signal bandwidth limitation arising from radio-frequency and intermediate-frequency filtering, causes non-linear distortion which may significantly impair the picture quality. The most critical part of the system in this respect is the receiver; this must have cheap and simple filters, which may not be phase-corrected. In the absence of sub-carriers for the sound signals, the most critical distortions for a colour picture are the differential phase and gain of the colour sub-carrier. These distortions should be taken into account when deriving the relationship between the frequency deviation and the equivalent rectangular bandwidth of the receiver. Studies made by EBU members have shown that it is possible to obtain reasonable values of the distortions, as mentioned in Table VIII of Report 215-4, with a frequency deviation of approximately 14 MHz/V at the reference frequency of the pre-emphasis characteristic, and a receiver bandwidth of 27 MHz [CCIR, 1970- 74b]. Studies carried out in Japan with the M/NTSC system have shown that it is possible to obtain satisfactory results with a sound sub-carrier, a pass-band of 23 MHz and a peak-to-peak video frequency deviation of 16 MHz [CCIR, 1974-78b].
Pulse-code modulation (PCM) techniques for television transmission by satellites are now under intensive study and experimentation [Chakraborty, 1975; Golding and Ball 1973; George and Hoffman, 1977; Ishiguro et al., 1975; Zschunke, 1975]. These efforts have shown that under certain conditions the results obtained (such as resolution and grey scale rendition) may be comparable to those obtained with frequency modulation.
For 525-line systems bit rates for television transmission may range from 70 M bit/s (megabits per second) down to 6 Mbit/s, with 11 M bit/s having been demonstrated on the CTS satellite [George and Hoffmann, 1977]. For 625-line high grade colour television systems, a bit rate of 34 M bit/s is considered to be the lowest realistic

Rep. 632-1 215
target even if bit-rate reduction techniques are employed. The lower bit rates result from the use of redundancy reduction techniques which increase the complexity and cost at both transmit and receive terminals. Redundancy reduction diminishes the channel bandwidth as the required bandwidth in hertz is numerically equal to approximately 0.7 times the bit rate in bits per second for four level phase modulation. It is considered at the moment that though digital modulation is not appropriate for individual reception because of the high cost of the digital receiving equipment, the cost may not be prohibitive for community reception or other services provided by satellite [CCIR, 1974-78a],
3. Sound channels in television
When only a single sound channel is required, it is desirable that, after demodulation, the composite vision and sound signals should be the same as in the terrestrial service in the given geographical area; this would simplify the design of compatible receivers. This implies the use of a sub-carrier for the sound signal. However, a sub-carrier of high amplitude can cause a visible beat pattern with the colour sub-carrier, and a buzz on the sound. Experiments by EBU members have shown that the receiver bandwidth need not be wider than is necessary to achieve a good quality of the picture alone, when the sound sub-carrier has an amplitude giving about 30% of the total peak-to-peak deviation of the carrier. Nevertheless, in some of these experiments the best signal-to-weighted-noise ratio which was achieved for the sound was 50 dB, as a result of buzz caused by variations in group delay of the receiver filter characteristics. If better sound quality is required (for example, with a signal-to-weighted ratio of 60 dB), it may be necessary to abandon the sub-carrier principle, and to transmit the sound by other methods. One suitable method could consist of using a separate carrier with the same modulation characteristics as those which may be used for sound broadcasting from satellites.
If several sound signals are to be broadcast with the picture, various techniques could be used. For example, digital modulation sound signals could be time multiplexed with the picture signal, as discussed in several studies (see Report 488-2). This is an interesting method, especially for community reception, because high-quality signals can be transmitted without widening the radio-frequency channel. A method for providing two high-quality sound channels with the picture is described in [CCIR, 1970-74c]. Another possible method would be to use several separate carriers.
Frequency-multiplexing of one or more sub-carriers modulated by the sound signals results in a particularly economical arrangement for the receiver, at the same time needing only a moderate increase in the width of the radio-frequency channel. However, intermodulation between the picture and sound signals, and between the various sound signals, may significantly impair the quality, and more studies are necessary [CCIR, 1970-74d].
Studies carried out in Japan have shown that a second frequency modulated sub-carrier and pulse time multiplexing may be used to transmit up to six additional sound channels without increasing the bandwidth.
If a two-carrier sound system were adopted in terrestrial television, it would be desirable that the sub-carrier frequencies in the satellite television system should be equal to the spacings between the vision carrier and the sound carriers in terrestrial television. Other methods of providing two or more channels are discussed in [CCIR, 1970-74a]. In a terrestrial system using amplitude-modulation sound, account should be taken of this feature to determine the technical characteristics of the broadcasting satellite, in particular the bandwidth.
REFERENCES
CHAKRABORTY, B. [November, 1975] Experiments with high-speed digital transmission via satellite links. Third International Conference on Digital Satellite Communications, Kyoto, Japan, 127-134.
GEORGE, D. A. and HOFFMAN, L. B., [May, 1977] The Carleton-Stanford curriculum sharing experiment, InternationalCommunications Association Conference, Berlin, Germany (Federal Republic of).
GOLDING, L. S. and BALL, J. E. D. [August, 1973] Satellite television cover the world. IEEE Spectrum, 24-31.
ISHIGURO, T., et al. [November, 1975] NETEC system: Interframe encoder for NTSC colour television signals. ThirdInternational Conference on Digital Satellite Communications, Kyoto, Japan, 309-314.
ZSCHUNKE, W. [November, 1975] Digital transmission of TV by satellite. Third International Conference on Digital Satellite Communications, Kyoto, Japan, 322-329.
CCIR Documents
[1970-74]: a. 11/65 (USA); b. 11/316 (10/263) (EBU); c. 11/302 (Germany, (Federal Republic of)); d. 11/317 (10/264) (EBU).
[1974-78]: a. 11/90 (USA); b. 11/41 (Japan).

216 Rep. 633-1
REPORT 633-1
ORBIT AND FREQUENCY PLANNING IN THE BROADCASTING-SATELLITE SERVICE
(Questions 20-3/10 and 5-3/11)(1974- 1978)
1. Introduction
The provision of broadcasting-satellite services to countries within a Region entails careful planning of frequency allocation and satellite location to reduce interference to an acceptable level. This Report deals with the problems of planning, mainly for the 12 GHz band, and outlines the parameters involved in preparing plans, together with methods of assessing the likely success of a plan and its efficiency. A further discussion of the frequency sharing between the broadcasting-satellite service and the fixed-satellite service can be found in Report 809. In all cases the satellites are assumed to be located in the geostationary orbit.
The following features of planning are mentioned initially as they are of a general nature, applying to services in all relevant bands:— it is assumed that all broadcasting-satellite services of the same kind, to the same area, would be provided
from the same geostationary orbital position to permit the use of fixed receiving antennae; (however, services designed for different audiences (e.g., programmes for individual reception and programmes for community reception) may well be provided from different orbital positions;)
— for the purpose of calculating the wanted-to-interfering signal ratio in the case of several interfering signals, the total interfering signal may be calculated on the basis of adding the component interfering signal powers received by the antenna;
— whenever possible, the coverage area should be the minimum necessary to provide the required coverage;— if it is proposed initially to operate a broadcasting-satellite service for community reception, and at a later
date to operate broadcasting-satellite services for individual reception in the same frequency band, both services should employ the same modulation system to facilitate compatibility. Under such circumstances, it would also be necessary to assume sharing criteria that would allow for the broadcasting services ultimately required. However, if a system is designed for community reception on a permanent basis with no plans for later use of the same frequency band for individual reception, the assumption of sharing criteria more stringent than those required for the planned system could be wasteful;
— all the signals transmitted from the same orbital position and meant for the same audience should be of the same polarization.
Sections 2 to 9 deal with the 12 GHz band, Section 10 with up-link and Section 11 with the other bands in which the broadcasting-satellite service has allocations.
2. Approaches to planning in Region 2
The WARC-BS (Geneva, 1977) adopted two different approaches to planning the broadcasting-satellite services in the 12 GHz band. Regions 1 and 3 adopted a detailed a priori orbital position and frequency assignment plan to become effective on 1 January 1979. Region 2 adopted a set of provisions to govern the use of the 12 GHz band pending the establishment of a detailed plan. These provisions include a Regional Administrative Radio Conference to be held not later than 1982 with a mandate to draw up a detailed orbital position andfrequency assignment plan for the broadcasting-satellite service in Region 2.
The method of planning the broadcasting-satellite services in Region 2 will probably include some of the same concepts as were used in Regions 1 and 3 in 1977. However, there are significant differences which will affect the work and outcome of the 1982 Regional Conference. The most important are the following:— in Region 2, the services sharing the 12 GHz band on an equal basis with the broadcasting-satellite service
include the fixed-satellite service. This is not true in Regions 1 and 3;— a detailed a priori plan for the broadcasting-satellite service in Region 2 need not be drawn up immediately.
Thus, technological advances and better definition of requirements may be included in the plan at the time of the Regional Conference;
— no urgent desire appears to exist at present of a Region 2 Administration for early development of terrestrial services in the 12 GHz band. Therefore, greater flexibility than was incorporated in the Plan for Regions 1 and 3 will be possible with respect to future modifications. As long as terrestrial and broadcasting-satellite systems are not actually implemented, any plan adopted by the Conference could be modified at a later date to accommodate changing technology and requirements, as long as such modifications are agreed upon by all Administrations concerned. This kind of flexibility decreases rapidly as systems (both broadcasting-satellite and terrestrial) are implemented, but should be recognized as long as it exists;
— there are indications that a greater variety of different kinds of broadcasting-satellite services, particularly for community reception, will be planned in at least some countries of Region 2, than were provided for in the Plan for Regions 1 and 3.

Rep. 633-1 217
3. Guidelines toward efficient planning
3.1 General principles
All planning should make use of the following principles, consistent with the service demands of individual Administrations and to the maximum extent practicable, in order to achieve a high efficiency of spectrum and orbit utilization.
3.1.1 Orthogonal polarization
Orthogonal polarization and co-ordination of polarization should be used to the maximum extent practicable. Note that adjacent satellites could use the same polarization if they serve widely separated areas.
3.1.2 Frequency interlea ving
The mutual interference between channels in different systems is usually a maximum when the two carrier frequencies coincide. When channelling design is such that frequencies are interleaved, or, more generally, such that coincidence of carrier frequencies is avoided, mutual interference can in many cases be greatly reduced.
3.1.3 Paired service areas
Widely separated service areas should be “paired” and served by collocated or adjacent satellites, which increases the number of satellites without increasing interference.
3.1.4 Crossed-path geometry
Adjacent satellites should serve areas separated by at least one other service area. This may not be possible if the available arc is very small.
3.1.5 Clustering
Appropriate clustering of satellites generally increases the efficiency of orbit utilization compared to a random mixing of satellites belonging to systems with grossly different characteristics.
3.1.6 Homogeneity
The greater the similarity between the characteristics of adjacent satellites, the higher the efficiency of orbit utilization.
3.2 Broadcasting-satellite systems for com m unity reception
One of the planning principles adopted by the WARC-BS is that all planning should be on the basis of individual reception. This may lead to inefficient spectrum-orbit utilization in those cases in Region 2 where there will be a permanent requirement for community reception. However, it may be possible, in some cases, to implement two or more community broadcasting-satellites within the spectrum and orbit assignment made to one individual broadcasting-satellite without affecting the plan, i.e., without causing unacceptable interference to, or receiving unacceptable interference from, systems operating in accordance with the plan. The extent to which this is possible depends on the technical characteristics of the systems involved and on the geographical separation of the various service areas affected. Spectrum and orbit utilization efficiency would generally be increased if this possibility is taken into consideration during the planning stage.
3.3 Consideration o f the fixed-satellite service in Region 2
In sharing the 12 GHz band with the fixed-satellite service in Region 2, the broadcasting-satellite service must take into consideration the essential dissimilarities between these two services. They arise primarily from the higher power required in the broadcasting-satellites to serve a large number of small earth station receivers, but also from the fact that the area served by the fixed-satellite service will usually be an entire country, which may include many time zones, while that served by the broadcasting-satellite service will normally be at most one, or two time zones. The sharing problems arising from this are discussed in Report 809.
The WARC-BS (Geneva, 1977) recognized these problems and, as a step toward their solution, included in the provisions adopted for Region 2 an orbital arc segmentation that, in accordance with the clustering and homogeneity principles (see §§ 3.1.5 and 3.1.6), groups the space stations of the two services in separate segments of the geostationary arc. Thus, the arc available for the broadcasting-satellite service is restricted to three segments. One extends from 75° to 100° (95° for service to Mexico, the US, and Canada) west longitude, a second one from 140° to 170° west longitude, and a third one exclusively for service to Greenland, from 55° to 60° West longitude. Space stations in the broadcasting-satellite service may occupy any position, including the edges, within their arc segments and will be protected from interference from the fixed-satellite service provided their characteristics are in accordance with those described in the Final Acts of the WARC-BS.
On the other hand, the fixed-satellite service has primary status in the remaining portions of the geostationay arc and also in the arc 55° to 60° West longitude, and any plan for the broadcasting-satellite service must take this status into consideration, notwithstanding the right of the broadcasting satellites to be located at the edge of their arc segments, in keeping with the previous paragraph.

218 Rep. 633-1
The item which eventually determines the effect of interference into a fixed-satellite system is the ratio of wanted-to-unwanted signal at the input to the earth station receiver. One important factor is the difference in e.i.r.p. between the space stations in the two services. In a homogeneous set of satellite systems, the mutual interference is independent of e.i.r.p., and therefore the e.i.r.p. does not affect spectrum-orbit utilization. But in non-homogeneous sets of systems, spectrum-orbit utilization is a sensitive function of the differences in e.i.r.p. of different systems. Thus it is important that space stations in the broadcasting-satellite service use the lowest values of e.i.r.p. by incorporating the latest economically feasible advances in earth station receiver design.
On the other hand, fixed-satellite systems should decrease their sensitivity to interference by letting their space stations use the highest values of e.i.r.p. economically feasible, without making corresponding changes to the earth station (such as decreasing antenna diameter or increasing system noise temperature) that would tend to increase its sensitivity to interference.
Additional items which will reduce interference into the fixed-satellite service and will increase spectrum- orbit utilization are a decrease in side lobe levels of satellite transmitting antenna patterns, and the positioning of higher power space stations in the broadcasting-satellite service as far away from the edges of their arc segments as considerations of service area coverage, elevation angle, and eclipse protection will allow.
3.4 Procedures for detailed a priori planning
3.4.1 General
When it is envisaged to make a complete plan at the outset, it may be useful to divide the task into two steps. First, a plan is made which permits the broadcasting of one television programme (or its equivalent) to each service area using a limited number, Cl5 of channels. Then this “plan with one programme per service area” is transformed into a more general plan which assigns the required number of channels to each service area having the same position in the orbit and the same polarization for channels serving the same area. A study [CCIR, 1974-78a] describes a method by which the construction of such a general plan may be worked out on the basis of regular channel distributions. This method may be used directly when it is required to assign the same total number of channels to each service area; and can, also, be modified to fit the case when this does not hold to be true (see § 3.4.4).
3.4.2 Definition o f regular distributionA regular distribution is characterized by the following parameters:
d : the difference between the ordinal numbers of the consecutive channels serving an area; t : the number of channels assigned to each area (a channel may carry one television programme or
many sound broadcasting programmes);Cj : the number of channels for a single programme per area.
It can be shown that C,, the number of channels for one programme per service area, is equal to the maximum number of areas served from one position on the orbit, when a channel is only used once from each position. For a given total bandwidth 5, the total number of channels C is given by:
C = tCxand A, the carrier spacing, by
A = B /C
3.4.3 Constraints on distributionsThe principal restrictions to which the regular distributions are subject are as follows:
— The value of d must be greater than 1 to avoid the assignment of two adjacent channels to the same country, which would give rise to difficulties when multiplexing the signals for the same transmitting antenna; dm ust also be small, so as not to make excessive the receiver tuning range necessary to receive all the programmes intended for one service area. If R is the bandwidth over which receivers can be tuned, it will be necessary that:
e.g., when C\ = 8, R = 400 MHz and B = 800 MHz, then d < 4 and only the values d = 2, d = 3 and d = 4 should, therefore, be considered.— the number of channels per country, f, should normally be chosen to be as high as possible, taking
account of the available bandwidth;— the number of channels for one programme per service area, C{, should be a multiple of d. Moreover,
it should lie between a minimum value (which corresponds to the case where it is possible to neglect adjacent channel interference, requiring a large channel spacing), and a maximum value which is determined:- by the necessity to have a sufficient number of positions on the orbit to take advantage of the
discrimination against interference given by the receiving antennae;- by the necessity to avoid a reduction of the channel spacing to such a degree that the increase in
the necessary adjacent-channel protection ratio would make planning impossible.

Rep. 633-1 219
For values of Cx between maximum and minimum, the carrier spacing is, in general, smaller than the channel bandwidth, and assignments must be made so as to protect both the same channel, and adjacent channels, as required by the corresponding protection ratios. The optimum value of Cx is the one which results in approximately equal importance for co-channel and adjacent-channel interference. According to preliminary studies involving some forty service areas in the European Broadcasting Area, optimum Cx there, would be equal to 8;
— to obtain advantage from the use of orthogonal polarizations, it is very useful to alternate polarizationfrom one channel to the next in a given orbit station, as well as from one station to the next, in agiven channel. This facilitates assignment of adjacent channels to adjacent areas from the same orbital position, and the assignment of the same channel to areas with modest geographic separation from neighbouring satellite stations. However, for all the channels serving a given area to have the same polarization, the difference d between the ordinal numbers of the successive channels of the area must be an even number. Then, as Cu the number of channels per programme per area, is necessarily a multiple of d, it must also be even;
— it may be helpful to introduce guard bands, on the one hand at the ends of the band allocated tosatellite broadcasting in order to reduce adjacent-band interference (see Report 809) and on the other,between the groupings of channels within the band in order to reduce the cases of adjacent-channel interference. The latter guard bands should be eliminated if it is intended to standardize the channel spacing for more than one Region.
All the above constraints severely lim it the number o f regular channel distributions o f practical interest to planning.
Fig. 1 gives two examples of channel utilization at a given orbital position. In the first the parameters chosen for a total bandwidth of 800 MHz are d = 4, t = 5, C, = 8. In the second, the parameters chosen for a total bandwidth of 500 MHz are d = 3, t = 5, Cx = 6. In accordance with the channel order, the service areas follow the sequence A, B, C, D; or A, B, C.
3.4.4 Non-regular distributions
When it is required to assign a number of channels varying from one service area to another, the preceding considerations still apply under the condition that the parameter t of the regular distribution is taken to be equal to the greatest common divisor of the different channel totals for the various service areas; the limiting case being t = 1. Moreover, it is necessary to make each area appear as many times as the number of groups of t channels assigned to it. In some particular cases, another method may consist of distributing a group of t channels amongst several service areas. The inconvenience of these non-regular distributions consists in increasing the difficulty of the problem of adjacent-channel interference. However, such situations may be unavoidable in practice.
3.4.5 Standardization o f carrier position and spacing
Standardization of the channel spacing and position of each channel in the whole allocated band may be desirable with a view to utilizing the frequency/orbit more effectively and simplifying interferencecalculations. The exact value of channel spacing and exact location of the channel may be determined,taking into account the relevant technical characteristics, and a detailed regular channel distribution may then be constructed.
4. Required input data
To prepare a plan and to assess its likely success, the following input data are required:
4.1 Factors relating m ainly to technical standards
— the carrier frequency separation of adjacent channels;— the preferred carrier frequency separation of channels allocated to the same service area;— the protection ratios for all broadcasting systems included in the plan (co-channel and adjacent channel);— receiver characteristics, including the figure of merit (G /T ), and local oscillator frequencies;— the radiation patterns (co-polar and crosspolar) of the satellite transmitting antenna and the earth receiving
antennae;— the pointing tolerance of transmitting and receiving antennae;— station keeping accuracy;— propagation data, including allowances for rain attenuation, clear air attenuation, and depolarization caused
by rain;— the limits of the usable arc of orbit for each area, as determined by the time of satellite eclipse and the
minimum elevation angle;— the minimum power flux-density required within the service area for the kind of service desired, e.g., indi
vidual reception or community reception.

CHA NNEL £ 1 2 3 4 5 6 7 8 9 10 11 12 13 14 15 16 17 18 19 20 21 22 23 24 25 26 27 28 29 30 31 32 33 34 35 36 37 38 39 40 //
A R E A S '4A B C D A B C D A B C D A B C D A B C D E F G H E F G H E F G H E F G H E F G H
/■
CHANNEL £ 1 2 3 4 5 6 7 8 9 10 11 12 13 14 15 % 16 17 18 19 20 21 22 23 24 25 26 27 28 29 30
A R E A S £ A B C A B C A B C A B C A B C V, D E F D E F D E F D E F D E F
FIGURE 1 — Examples of regular channel distributions occupying a total bandwidth of800 and500 MHz. In both examples, the number of channels, t, assigned to each service area is 5. In the first example, Cj, the number of channels for one programme per service area, is 8 and the difference, d, between channel numbers assigned to the same service area is 4. The corresponding numbers in the second example are 6 and 3. The 800 MHz bandwidth is then divided into 40 channels with carrier separation of 19.18 MHz and the 500 MHz bandwidth is divided into 30 channels with nominal carrier separation of 16.7 MHz. Channel assignments to service areas A, B, C, D ,... could be repeated ( to other service areas) for other positions on
the orbit.

Rep. 633-1 221
— the required number of television channels for each service area;— the number of service areas in each country;— the shape, dimension, and location of each service area, in the form of geographical co-ordinates of the
corners of a polygon which represents the area considered, with sufficient approximation; the geographical co-ordinates of several points within each service area resulting in a sufficiently representative sampling for purposes of calculating protection margins;
— the quality of service, including the required carrier-to-noise ratio, and signal-to-noise ratio, for specified portions of time;
— the preferred location of the satellite in the geostationary orbit, including the possible preference for some service areas to share, or not to share, the same orbital position;
— the kind of service desired in each service area, e.g., individual reception or community reception, and possibly in the case of the latter, the number of receiving installations;
— possibly the locations, antenna sizes, and e.i.r.p.s of all up-link transmitting stations in each service area;— possibly the frequencies to be used for the up-link transmissions.
5. Characteristics determined by the plan
In the broadcasting satellite service, the object of a plan is to specify, for each satellite emission, the following characteristics:— the shape, dimensions and orientation in space of the antenna beam used to cover the service area;— the transmitted power (or the e.i.r.p.);— the frequency (or the channel);— the satellite position in the geostationary orbit;— the polarization.
To present the channel, orbit position, and polarization assignments in a given plan, it is convenient to use a matrix in which each row corresponds to one channel and each column to one orbital position. The various service areas are then entered as the appropriate elements of the matrix together with a symbol indicating polarization.
4.2 Factors relating the required service
TABLE I — Plan fo r showing assignments in a plan with C channels (1, ... C), S orbit positions (at l o n g i t u d e s X , . \ s), and two polarizations (I, 2). Service areas are designated A , B, . . . N
6. Calculation of the total interference from a satellite transmission
When evaluating the interfering power produced at a given point by a satellite transmission, it is enough to add the powers of its different components incident on the receiving antenna with one polarization or the other. Using the notation below:
T, Tx : respectively co-polar and cross-polar relative gains o f the transm itting antenna o f the interfering satellite in the direction o f the locality under consideration (dB),
R, R x : respectively co-polar and cross-polar relative gains o f the receiving antenna in the direction o f the interfering satellite (dB),
D x : rain depolarization factor,

222 Rep. 633-1
the total interference power P{ is given by the following formulae in which the power is expressed in dB, neglecting a constant *:
Case 1. — when the polarizations of the wanted and unwanted signals are the same:
P, = 10 log [10- ( r + A)/IO+ + n , * + 1 0 - < 7 i + j y / 10 + 1 0 - ( 7 i + o , + «)/io] ( 1 )
Case 2. — when the polarizations of the wanted and unwanted signals are orthogonal:
Pj = 10 log [ i o - ( r - + * ) , l ° + 1 0 - (7i + ^ + V / |» + l O - <r + ^ ,/IO + l0 - ( r + C* + ' i , / l 0 ] ( 2)
Equations (1) and (2), in the form shown, apply to circular polarization; they are also valid for linear polarization provided that the polarization of the interference is parallel (or perpendicular) to the polarization of the receiving antennae for the given incidence. (If the angle between the polarizations of the two signals is of any other value, new interference components appear.)
In general, the interference power should be evaluated for the worst case, notably from the point of view of the propagation conditions. With reference to this matter, it should be noted that in many cases the interfering satellite will have a smaller elevation angle than the wanted satellite and, thus, rain attenuation may be greater on the path of the interfering signal and, in these circumstances, it is the propagation conditions in free space that are the least favourable.
In calculating the carrier-to-interference ratio it is necessary to take into account the attenuations suffered by the wanted signal and by the interfering signal. The calculation of the attenuation due to rain takes into account elevation angle, rain rate, and percentage of time (which should be the same for both). A possible formula to be used in this calculation, for circular polarization at 12 GHz is:
A = (0.0168 R h46)lwhere R is the rain rate in m m /h and 1 is the effective path length through the rain (km) as given, for example, in Fig. 1 of Report 564-1. Additional information on the formula can be found in Report 564-1. This attenuation factor has been examined in [CCIR, 1974-78j].
7. Principal planning stepsThe object of this paragraph is to give some indication of the successive planning steps.
7.1 Calculation o f transmitting antenna beam and e.i.r.p.For planning purposes, it is convenient to assume that all the beams of various service areas have circular
or elliptical cross sections. Some actual systems will probably employ shaped beams to suit the desired coverage and an alternative approach is to assume shaped beams in assessing the protection margin.
The parameters to be determined for circular or elliptical beams are:— the co-ordinates of the centre of the service area, defined as the point at which the beam axis touches the
surface of the Earth;— the dimension of the major axis and the minor axis of the elliptical section of the beam. These dimensions
should preferably be specified in such a way that the envelope of the elliptical section corresponds to the envelope of the transmitting antenna radiation pattern at the — 3 dB points;
— AG, the reduction of the transmitting-antenna gain between the centre and the nominal limit of the service area (see Report 810);
— the orientation of the major axis of the elliptical section, preferably in the form of the azimuth of the projection of the major axis on the surface of the Earth with respect to the meridian passing through the centre of the service area.
In the calculation of these parameters, it is necessary to take account of the accepted pointing error of the transmitting antenna so that the country being considered is still covered in all cases, and also of an eventual limitation of the dimensions of the transmitting antenna; (a limitation which corresponds to a minimum size of realizable beamwidth).
These parameters can be optimized according to specified criteria. EBU studies, described in Report 809, have been based on the following criteria:— the representation of the country boundaries is approximated by a polygon which should be completely
covered by the beam;— the optimization is carried out so that the ratio between the areas (measured on a projection plane
perpendicular to the beam axis) of the cross-section of the beam ellipse, and the projection of the polygon corresponding to a country, is as close as possible to unity.
In Canadian studies [CCIR, 1974-78f[, boundaries of countries are represented in the same manner as above, but optimization (through minimizing the beam cross-section) is made possible, by using projection on a sphere which is centred on the satellite.
This constant depends on the e.i.r.p. o f the interferer and the propagation attenuation, and is expressed in dBW.
Rep. 633-1 223
As the optimal beam for a service area depends on the position in orbit, it could be advantageous to carry out the calculations for a large number of positions on the orbit, spaced, for example, every 2.5° within the usable arcs ahead of time. In this way, a file of optimum beams for the various service areas would be established.
Once the beams have been determined, the necessary radiated powers can be calculated by the usual link-budget method (see Report 215-4). In practice the actual powers may differ from the nominal powers specified by the plan, by an amount designated as the operating power margin (see Report 810).
7.2 Calculation o f co-polar and cross-polar emission discrimination matrices
These matrices give, for the least-favourable point in each country, for the co-polar and cross-polar components respectively, the ratio:
wanted co-polar power flux-density_________________interfering co-polar (or cross-polar) power flux-densityThe terms in these matrices apply to all the possible pairs of interfered-with and interfering countries. The
calculations should take account of the least-favourable conditions of transmitting-antenna pointing. To a first approximation, these matrices are not affected by any change in the positions on the orbit, provided that the optimum beam is always used at each position. The matrices can therefore, be calculated with an arbitrary choice of provisional positions on the orbit.
These matrices can be used:— to indicate, independently of the positions on the orbit, and thus independently of the receiving-antenna
discrimination; the relative intensity of the potential interference between service areas;— to calculate the actual level of interference between two service areas when the positions on the orbit are
known. It is then necessary to add the receiving-antenna discrimination to the transmitting-antenna discrimination and to take account of the relative polarizations.
7.3 Interference m atrix for reception
When the positions on the orbit are provisionally assigned in advance, it is also possible to calculate an interference matrix which gives, for each pair of countries, the ratio of wanted power/interfering power at the receiving antenna output.
The main advantage of the interference matrix is that it permits the transmission causing the predominant interference to be identified for each interfered-with service area. If a critical case of interference arises and it is decided to adjust the plan being considered, the interference matrix acts as a guide to the assignments which it is necessary to modify to improve the plan.
Furthermore, the interference matrix gives a preliminary idea of the real distribution of interference since, to a first approximation, the effect of multiple interference can be included by using a correction factor estimated, for example, at 3 dB, which is applied, for a given interfered-with country, to the term in the matrix corresponding to the predominant interference.
7.4 Interference into the fixed-satellite service in Region 2
The interference into the earth stations of the fixed-satellite service are computed in the same way as described in §§ 6 and 7.2 above. For those fixed-satellite systems in existence or notified to the IFRB at the time when the plan is drawn up, the actual system parameters including earth station locations, should be used in the computation of interference. To protect future fixed-satellite systems the plan in Region 2 must be drawn up so as to meet the sharing criteria given in Annex 9 to the Final Acts of the WARC-BS (Geneva, 1977) or established by a future competent conference.
7.5 Algorithms for the assignment o f channels, positions on orbit and polarizations
The number of plans which are theoretically possible is so vast that there is no hope of evaluating them all. One valuable method can take the form of algorithms programmed on a computer which will enable a certain number of more-or-less satisfactory draft plans to be obtained. The aim of these algorithms should be to select assignments where the interference is weak. In other methods similar draft plans can be prepared manually without the use of computers.
Several computer programmes have been written in several countries (see Report 812). Some of these make it possible to produce plans in which either all the protection margins are positive with the minimum number of channels, or in which the lowest protection margin is maximized for a given number of channels. The plans thus obtained can be modified manually, in cases where the impact of the modification is minor — for example, beam orientation, e.i.r.p. etc. However some parameters cannot be modified without a destructive effect on the optimized plan.
Even when a computer is used, some of the planning steps may be done manually, in particular the assignment of polarization can be done systematically with the aid of certain simple rules. For example, in accordance with § 3.4.3, one can assign orthogonal polarizations to satellites using adjacent channels from the same orbital position, or using the same channel from adjacent orbit positions. However such manual rules are less flexible than the use of operation research algorithms on computers.

224 Rep. 633-1
8.1 Introduction
No matter which means are used for the establishment of plans for satellite broadcasting in the 12 GHz band, it is desirable to have available precise and, if possible, standardized methods to evaluate the performances which would be attained in adopting a given scheme, in order to be able to analyse a certain number of these plans and to choose the one offering the greatest advantages. The quality of a plan may be judged from several aspects, some of which may not necessarily be calculable.
8.2 Efficient use o f the orbit-spectrum resource
A fundamental criterion is the efficiency of use of the orbit-spectrum resource available to users of the plan. Orbit spectrum efficiency would be measured by the maximum number of programmes or channels which could be carried by a number of satellites using a limited orbital arc and a limited spectrum bandwidth. Several studies have been made on this subject (see Docs. [CCIR, 1974-78g]).
8.3 Protection margins
Another factor to be considered is the protection margin as described below:
8.3.1 Co-channel protection margin
The co-channel protection margin in dB is defined in the following expression where the powers are evaluated at the receiver input:
Wanted power _ co-channel protection7 7 T , . , , . (dB) _ ratio (dB)sum of the co-channel interfering powers
This defines the quality of the plan under consideration, in the sense that if the value is never negative, the co-channel interference is always acceptable. Unlike the interference matrix, the protection margin takes account of the interference caused by all the transmissions using the same channel. Its value must be calculated for all the receiving points being considered and, in order to give an idea of its statistical distribution within each interfered-with country, it is possible to note the values of the protection margin which are exceeded at 100%, 90%, 50% and 0% of the receiving points.
8.3.2 Adjacent-channel protection margin
The definition of the adjacent-channel protection margin is similar to that for the co-channel case except that the adjacent-channel protection ratio and the sum of the interfering powers due to transmissions in the adjacent channel are considered.
It is used in the same way as for the co-channel case since a negative value also implies, in theory, unacceptable interference.
8.3.3 Equivalent protection margin
At the receiver level one must not distinguish between co-channel and adjacent channel protection margins, but rather one should adopt an equivalent protection margin.
Given M x, M2, M3 the co-channel, upper and lower adjacent channel protection margins in dB, the equivalent protection margin will be given by:
8. Plan assessment
M = - .0 log [ l< T " '/10 + kT " - ' 10 +
A plan might be considered acceptable, in every service area, if the equivalent protection margins are positive or near zero.
9. Results of Plan for Regions 1 and 3 and of other studies
The Plan that was adopted by the WARC-BS for Regions 1 and 3 shows that generally five programmes per service area can be obtained with channel spacings of 19.18 MHz and nominal satellite spacings of 6°. The plan includes a few negative equivalent protection margins (of the order of — 1 to — 3 dB with respect to 31 dB protection ratio), but is generally considered satisfactory. Because of the differences between Regions (different number of countries involved etc.) these results are not necessarily applicable directly to Region 2.
A study [CCIR, 1974-78h] provides information on the required discrimination when two broadcasting satellites serve adjacent overlapping areas, using the same frequencies. Fig. 2 shows the protection ratio versus antenna discrimination angle for frequency sharing between broadcasting satellites. The studies undertaken by the EBU are summarized in the bibliography [Mertens et al., 1976].

a00<D3_4>00c<sc0eSc1o■3«cc«c<
225
10 12 14 16 18 20 22
Co-polarized protection ratio (dB)
24 26 28 30
FIGURE 2 — Protection ratio as a function of antenna discrimination angle for frequency sharingbetween broadcasting satellites
Protection between broadcasting satellites for individual reception (antenna diameter 1 m, beamwidth 1.7°, gain 39.2 dB)
Protection between broadcasting satellites for individual reception (antenna diameter 0.75 m, beamwidth 2.2°, gain 36.7 dB)
Protection between broadcasting satellites for community reception (antenna diameter 1.5 m, beamwidth 1.1°, gain 42.7 dB)
Protection of community reception from individual reception broadcasting satellites
10. Up-links *
U p-links m ay affect the planning o f the broadcasting-satellite service for tw o reasons: (1) the noise and interference present in the up-link will be retransmitted on the dow n-link and m ay constitute a non-neglig ib le part o f the total dow n-link n oise and interference; and (2) the up-link m ay require co-ord ination with satellite system s operating in a different frequency band and m ay, therefore, im pose additional restrictions on the orbital p osition s o f the broadcasting satellites. A brief d iscussion o f these problem s is given below . M ore com plete treatm ents are given in Report 561-1.
It is desirable to consider the possibilities of reducing the total bandwidth requirements for up-links by exploiting the greater directivity of the earth-station transmitting antennae, employing more advantageous methods of modulation, and by using polarization discrimination.
For maximum flexibility in the positioning of satellites for direct broadcasting it is necessary to have the same total bandwidth allocated for up-links as for broadcasting. This would allow all the broadcasting channels to be emitted from the smallest number of satellites or groups of satellites, but would be inefficient in the use of the up-link frequency spectrum.
* Consideration o f the up-link, which is in the fixed satellite service, is the subject of Study Programme 2K-2/4.

226 Rep. 633-1
Alternatively, to allocate separate orbital positions to all countries and to have sufficient angular separation between them to enable the same up-link frequencies to be used by every country, would be very economical in the use of up-link frequency spectrum but would occupy a large orbital arc and limit the choice of orbital positions for each country. It could also involve greater space-sector costs in the long-term.
Thus, an optimum situation should be sought in which both orbital arc and frequency spectrum are used economically without unnecessary restrictions on the broadcasting channel plans.
Studies similar to those cited in Report 561-1 show that there is an optimum point where one up-link channel is used to three broadcasting channels. For less than three channels there is a rapid increase in up-link bandwidth used, for little reduction in orbital positions, while for more than three channels there is little reduction in up-link frequency bandwidth, for a rapid increase in orbital positions. This amount of saving in up-link frequency spectrum is not too restrictive on broadcasting planning. Adjacent countries can still share orbital positions and programmes if they so desire.
Modulation methods requiring narrower frequency channels or the use of polarization discrimination might be effective in reducing the necessary up-link bandwidth; this may be more cost effective than using a greater number of orbital positions than the minimum required for a satisfactory broadcasting plan.
In this connection experimental measurements organized by the European Space Agency (ESA) [CCIR, 1970-74a] indicate that, for links operating near 12 GHz the discrimination between signals with orthogonal linear polarizations would probably be sufficient to permit frequency re-use, provided a PSK signal with digital modulation is employed.
In relation to the planning of up-links, § 7 of the Report by Interim Working Party 4/1 [CCIR, 1970-74b] indicates that it would be efficient to use the same frequency band (for example, 10.95 to 11.2 GHz) for both the down-path in the fixed satellite service and the up-path for broadcasting satellites. In this case, the need to protect the fixed-satellite service receiving terminals may require a large diameter earth-station antenna for the up-link transmitter in order to permit sufficient flexibility in the siting of earth stations.
The choice of frequency for the up-links depends on the total bandwidth required and on the satellite hardware design. If a conventional paraboloid is used, with a common feed unit to avoid excessive aperture blockage, then isolation between its up-links and the broadcasting channel will be difficult for low frequency separations (less than several hundred megahertz) between up-link and broadcasting bands. On the other hand, large differences in frequency (greater than about 3.6 GHz) cannot readily be combined in one feed unit to give similar illumination efficiencies in both the bands [CCIR, 1970-74i].
The use of offset-fed antennae would avoid the aperture blockage of separate feeds and much higher frequency separations could then be the most attractive to use, since the size of the feed would be smaller, permitting it to be located near the focal point of the paraboloid. In this respect the use of frequencies around 30 GHz would be advantageous.
In a recent study [CCIR, 1974-78i) interference characteristics in the up-links at 14 GHz, which are assumed to connect to broadcasting satellites using the 12 GHz band in an Asian and Western Pacific area, as planned by the WARC-BS, 1977, are examined in relation to satellite orbital positions and size of earth transmitting antennae. The results show that the interference situation depends to some extent on logitudinal postitions of satellites and in some cases, relatively smaller earth transmitting antennae may be used without causing interference.
However, the planning of up-links is especially important for interactive systems in which a very large number of individual or community receiver terminals have the capability to access the satellite for two way communication with the main earth terminal originating the broadcast programme. Such systems may require hundreds of up-link communication channels carrying voice, data, or possibly even video signals, thus making it imperative to apply bandwidth conservation and frequency reuse techniques, as well as random access, time-divi- sion and demand-assignment multiple access techniques. The problem of up-link frequencies for connection to broadcasting satellites is the subject of Question 5-3/11 and Study Programme 2M/4.
11. Planning considerations for other bands in which the broadcasting-satellite service has an allocation
11.1 Introduction
The other bands in which the broadcasting-satellite service has an allocation are from 620 to 790 MHz, from 2500 to 2690 MHz, from 22.5 to 23 GHz, from 41 to 43 GHz, and from 84 to 80 GHz. Very little is known about planning for the 23, 42, and 85 GHz bands except that phenomena associated with propagation through the atmosphere will be of major importance.
11.2 2.6 GHz systems
Under the provisions of the Space Conference of Geneva, 1971, the use of the 2.6 GHz band for satellite broadcasting is limited to domestic and regional systems for community reception. (See No. 36IB Spa2 of the Radio Regulations.)
In this Report, the results of a study [CCIR, 1970-74d] for community reception, are included in Table II.

Rep. 633-1 227
TABLE II
Protection SatelliteSystem Frequency Bandwidth ratio spacing Receiving
(GHz) (MHz) (dB) (degrees) pattern
1 2.6 22 30 4 A2 2.6 22 33 2.8 B
Pattern A: AG = 10-5 + 25 log (<pAp0) dBPattern B: AG = the smaller of: 10 log [1 + (2cp/<p0)6;v-9] or
3 + 10 log [80JV + (2 <p/9 o)N] dB
where: AG is the on-axis gain minus the gain at angle 9 .AG <40 dB for both patterns,and N is the exponential rate of decay as a function of the angle of the envelope of the side lobe; for example N = 2 for individual reception and N = 2-5 for community reception.
11.3 700 M H z systems
With regard to the efficient utilization of the geostationary orbit, studies indicate that for the broadcasting- satellite television service operating at frequencies around 700 MHz, the following criteria are appropriate for frequency modulation, assuming a peak-to-peak deviation of 8 to 16 MHz:
11.3.1 For frequency sharing between areas which do not overlap and which are served from the same geostationary orbital position, the total discrimination necessary to provide the required protection ratio must be achieved by side lobe reduction of the transmitting antennae. In general, this would require a minimum separation of the service areas approximately as great as that corresponding to the first minimum of the transmitting antenna pattern. The use of orthogonal circular polarizations could help in the case of closer spaced service areas.11.3.2 For transmitters which share the same frequency channel and are located at different orbital positions, a useful minimum separation may be approximately that which corresponds to the angle between the axis of the main beam and the first minimum of the receiving antenna pattern; assumed to be the same for all receiving installations. The transmitting and receiving antennae must together provide sufficient discrimination to achieve the required protection ratio.11.3.3 To keep propagation effects small and to conserve the geostationary orbital positions available, a broadcasting-satellite longitude should be within about 45° of the mid-longitude of its service area. Consideration should also be given to the sharing conditions with terrestrial television broadcasting services when determining the actual satellite position relative to the service area mid-longitude.A study of the number of frequency channels required to provide services to each of about thirty countries,
has been made [CCIR, 1970-74e]; and the results are shown in Fig. 3. A receiving antenna for community reception was assumed. These are provisional results for a single example and further study is required.
REFERENCES
MERTENS, H., ARNAUD, J. F., BROWN, A., GALIC, R. and PHILLIPS, G. J. [March, 1976] Satellite Broadcasting, design and planning of 12 GHz systems, Doc. Tech. 3220, EBU.
CCIR Documents[1970-74]: a. 11/347 (ESRO); b. 11/343 [CCIR Secretariat); c. 11/91 (France); d. 11/69 (USA); e. 11/30 (Japan);[1974-78]: a. 11/26 (EBU); b. 11/23 (EBU); c. 11/154 (USA); d. 11/140 (United Kingdom); e. 11/118 (Sweden); f. 11/105
(Canada); g. 11/155 (USA); h. 11/107 (Canada); i. 11/307 (Japan); j. 11/384 (Canada).
BIBLIOGRAPHY
IZUMI, T., MATSUSHITA, M., KANEDA, S. and OHMI, K. [December, 1976] A study for planning broadcasting-satellite service in the 12 GHz band. NHK Laboratories Note, Ser. No. 205.
REINHART, Edward E. [May, 1974] Orbit spectrum sharing between the fixed satellite and broadcasting satellite services withapplications to 12 GHz domestic systems. National Aeronautics and Space Administration, R-1463-NASA
SIOCOS, C. A. [1975] Broadcasting satellite service: Minimum elliptical beam determination. Journal o f the SMPTE , Vol. 84, 147-150.
CCIR Document [1970-74]: 11/312 (EBU).

228 Rep. 633-1, 634-1
FIGURE 3 — Number of radio-frequency channels required to provide one national programme to about thirty countries of a continent as a function of the carrier-to-interference ratio
(Example for a region typical of the East Aslan area)
Frequency: 700 MHz, community receptionDiameter of ground receiving antenna: approx. 3.5 m (beamwidth, 8°)Satellite at longitude of target area Beamwidth of satellite antenna 0: 7° > 0 > 3°
REPORT 634-1
BROADCASTING-SATELLITE SERVICE: SOUND AND TELEVISION
Measured interference protection ratios for planning television broadcasting systems
(Questions 5-3/11, Study Programmes 5H-1/11 and 5J-1/11)(1974 - 1978)
1. Introduction
A knowledge of interference protection ratios (the ratio of wanted-to-unwanted signal power at the receiver input) as a function of subjectively assessed picture quality is vital to the planning of television systems. Thus protection ratios for interference between two amplitude-modulation, vestigial-sideband (AM-VSB) signals have long been necessary in planning terrestrial broadcasting systems. With the allocation at the Space Conference of Geneva, 1971, of frequency bands to the broadcasting satellite service on a shared basis with various terrestrial services, the protection ratios for interference between frequency-modulation (FM) and amplitude-modulation, vestigial-sideband television signals, between two frequency-modulation television signals, and between a frequency-modulation television signal and the signals used by terrestrial services other than broadcasting have also become important. Indeed, the near future will very likely see a need for protection ratios, involving interference from and to digitally modulated television signals.

Rep. 634-1 229
This Report summarizes the results of protection ratio tests made by several Administrations in cases where the wanted and unwanted signals are modulated by colour television signals or other transmissions such as multiple sound channels. * In considering these results, it should be noted that particular combinations of signals are not, in general, confined to a single band of frequencies. Thus the protection ratio measured for interference between frequency-modulation and amplitude-modulation, vestigial-sideband signals is important not only for shading in the band 620 to 790 MHz but also for the bands 2500 to 2690 MHz and 11.7 to 12.5 GHz.
2. A reference case for measurements of protection ratios
2.1 Subjective measurements fo r television
Before presenting'the protection ratio data, it is useful to list the rather large number of parameters on which the values of subjectively measured protection ratios depend. Such a list is given in Table I together with a suggested reference case to establish a common set of test conditions for measurements made by different Administrations. Only when all of these parameters are known and measurements made in accordance with agreed test procedures, can a given value of protection ratio be properly interpreted and applied.
Tests should generally be performed under the reference conditions. If other test conditions and parameters must be used, they should be defined and correction factors given so that results for the reference conditions can be calculated.
TABLE I — Factors affecting subjectively measured protection ratios and a set o f reference caseconditions fo r these factors
Factor R eference case condition
Picture impairment assessment scale (See Rec. 500-1)Number o f levels 5Definition o f levels (perceptibility, annoyance, quality) ImpairmentFraction o f time interference effects are visible ContinuousImpairment level for tests 4.5 (Report 813)
Viewers (See Rec. 500-1)Number 10-20 minimumExpertise Note 1
Receivers Note 2Number and typesPerformance parameters (selectivity, sensitivity, overloadcharacteristics, etc.)
Viewing conditions (See Rec. 500-1)Distance to screenBrightness o f pictureBrightness o f background
Wanted signal characteristicsColour or monochrome Note 3Television standard (M, G, L, I, . . .) VariableColour system (NTSC, PAL, SECAM, . . .) VariableAccompanying sound Note 4Line synchronization Note 5Picture type (still, moving) and content Note 6Amount o f detail in picture Note 6Type o f modulation (AM /VSB, FM, Digital) Variable Note 7Modulation index Note 8Pre-emphasis characteristic for FM Rec. 405-1Energy dispersal characteristics NoneFading None
Unwanted signal characteristics Note 9Carrier frequency offset Note 10Frequency o f operation Note 11Video signal-to-noise ratios Note 12
Receiver noiseMan-made noisePicture source noise
Other interference and sources o f picture degradation Note 13Other interfering signalsMultipathReceiver distortion
Protection ratio data for interference between an amplitude-modulation, vestigial-sideband or a frequency-modulation television signal and the types o f signals used in the fixed and mobile services will be found in Report 449-1.

230 Rep. 634-1
Notes to Table I :
Note 1. — Both expert and non-expert viewers may be used. Tests with non-expert viewers are representative of the general population but tend to be quite lengthy. A greater number of variables can be examined by using a small group of expert viewers. For the particular interference being examined, the relationship between expert and non-expert opinion should be investigated.
Note 2. - The receivers used in the tests should represent equipment which is fairly sensitive to the particular type of impairment being investigated. Account should be taken of domestic receivers, and the type of receivers which may be used at re-broadcast relay stations. Measurement of RF and IF filter characteristics should be made to assist in the interpretation of results obtained when there are frequency offsets between the wanted and unwanted signals. As far as possible, filter characteristics should be adjusted to the standards applicable to the wanted signal. Baseband output frequencies should be limited to the minimum required for the television standard used for the wanted signal. Excessive filter bandwidths permit the observation of noise and interferences that would not be encountered with properly adjusted receivers.
Note 3. — Subjective tests should be based on colour pictures, unless there is reason to suppose that monochrome pictures would result in more stringent requirements.
Note 4. — If applicable standards exist for the accompanying sound channel(s), those standards should be used and the main carrier deviation caused by the sound sub-carrier(s) should be noted. If no standards exist one should additionally indicate the sound subcarrier frequency(ies) and the deviation of the sound sub-carrier(s).
Note 5. - The timing of the vertical and horizontal synchronization of the unwanted television signal should be such that when interference is visible, the interfering vertical and horizontal synchronizing bars are near the centre of the wanted picture.
The synchronizing signal of the wanted signal should be locked to the synchronizing signal of the unwanted signal, but with fields displaced so that sync bars from the unwanted signal interfere on the wanted picture. Greatly different sync frequencies cause flicker in the picture and produce subjectively more noticeable interference.
Note 6. — The test pictures used should be reasonably critical still pictures, as these may occur fairly frequently in practice. The scenes should contain bright, saturated colours. Slides provisionally suggested for future tests are Society of Motion Picture and Television Engineers subjective colour reference slides numbers 1 and 14, and Philips test slides numbers 8 and 14. As the unwanted signal a colour bars modulation is often used.
Note 7. — If applicable standards exist for the characteristics of either the wanted or unwanted signals, those standards should be used. If no standards exist, as for a frequency-modulation television signal for broadcasting, then the succeeding entries in Table I should be used. The sense of modulation should be such that a black-to-white transition corresponds to an increase in the instantaneous frequency.
Note 8. — A peak-to-peak frequency deviation sensitivity of 12 MHz/V should be used, if applicable. When other values are used, the peak-to-peak deviation should be indicated.
Note 9. — In most cases the unwanted signal has the same characteristics as the wanted signal. There is, however, also a need for the determination of protection ratios between dissimilar systems. In these cases the unwanted signal can have characteristics different from the wanted signal or can be another type of transmission such as multiple sound channels.
Note 10. - For co-channel protection ratio measurements there is no carrier frequency o ffset: Carrier frequency offset is defined as the difference between the unmodulated carrier frequencies of the unwanted and wanted signals, (fwanted ~ ^unwanted) ' ^ the same type of modulator is used in both channels. However, if the interference is sensitive to particular offset frequencies, these should be identified by the testing programme. For adjacent channel protection ratios, a series of measurements should be made for frequencies of the unwanted signal varying approximately ± 30 MHz from the wanted signal.
Note 11. — Tests may be conducted at either radio - or intermediate - frequencies. Protection ratios between wanted and unwanted signals are affected by the types of signal, their frequency separations, and other factors which do not depend on the frequency range used.
Note 12. — As far as possible, the only noise which should be present on the picture when assessing protection ratios is that of thermal noise in the receiver. The protection ratios should be measured for pictures having a signal-to-unweighted-noise ratio of not less than 36 dB, in order that system performance should not be limited by possible masking of interference by noise.
Note 13. — No account should be taken of other sources of interference, etc. (except thermal noise, as mentioned above), when assessing the protection ratio.
2.2 Objective measurements for sound transmissions
In all cases of sound broadcasting it is convenient to carry out the measurement of protection ratio by means of an objective method. Such a method consists in carrying out the measurement of the noise after demodulation in order to obtain the condition that the signal to noise ratio within the sound channel does not exceed a given value. Table II gives a list of parameters influencing the protection ratio for sound signals together with a suggested reference case to establish a common set of test conditions for measurements made by different Administrations.

Rep. 634-1 231
TABLE II — Factors affecting objectively measured protection ratios fo r sound signals and a set o f reference case conditions fo r these factors
Factor Reference case condition
Receivers Note 2Wanted signal characteristics Note 14Unwanted signal characteristics Note 9Carrier frequency offset Note 10
High quality Sound withsound television signal
Signal-to-weighted noise ratio (')The proposed reference case value may be arrived at from the two components being:
> 4 7 dB > 4 2 dB
Signal-to-weighted thermal noise ratio > 5 0 dB > 4 5 dBSignal-to-weighted noise ratio due to interference(2) > 5 0 dB > 4 5 dB
Other interference and sources o f sound degradation Note 13
Notes to Table II:Notes 1-13. - See Table I.
Note 14. - If the wanted signal is a multiple sound system several systems can be envisaged requiring the same or less bandwidth thana television channel. An example of such a system is given in the Annex, § 4.
(1) The indicated values represent the difference between the maximum signal level and the noise measured according to Recommendation 468-2. (Quasi-peak value and new weighting network).
(2) The objective method for the measurement of protection ratios in sound channels is described in Report 796.
3. Protection ratios for a wanted television signal
3.1 Interference from a television signal
3.1.1 Protection ratios fo r planning purposes
Based upon data in the Annex, the following protection ratios for multiple interference entries havebeen used (WARC-BS) for planning purposes for all television standards.
Protection ratio
Wanted signal Unwanted signalCo-channel Adjacent
channel
Amplitude-modulation vestigial sideband
Frequency-modulation50 dB Fig. 1, curve A
Frequency-modulation Amplitude-modulation vestigial sideband 30 dB Fig. 1, curve C
Frequency modulation Frequency-modulation 30 dB Fig. 1, curve B
When there is interference between two frequency-modulation television signals, when the modulation parameters of the wanted and unwanted signals are the same, and there is no carrier frequency offset, the value PR$, of the protection ratio measured under the reference conditions of Table I may be represented by the following formula:
PRo « 12.5 - 20 log (D /12) - Q + 1.1 Q 2 dB (1)whereDv : nominal peak-to-peak frequency deviation, MHzQ : the impairment grade, concerning the effect of interference only, measured on the 5-point scale of
Recommendation 500-1 [CCIR, 1970-74hJ.When one may wish to take into account the slight differences in protection ratios for the different
television standards or the differences resulting from the use of system parameters different from the reference case, the more detailed information given in §§ 3.1.2 through 3.1.6 should be consulted.

232 Rep. 634-1
3.1.2 Interference between two amplitude-modulation, vestigial-sideband television signals
Values of protection ratio for this important case will be found in Report 306-3.
3.1.3 Interference to an amplitude-modulation, vestigial-sideband television signal from a frequency- modulation television signal
Data in the Annex, for this case, is summarized in the following table of co-channel protection ratios (PRq) for just perceptible interference.
Wanted signalUnwanted signal deviation(')
(MHz) PR 0 dB
625-line standards I, G D v = 12 54
625-line standard K D v ~ 22 46
525-line standard M, 625-line standard L D y ~ 12 50
(') Nominal peak-to-peak frequency deviation.
More detailed information for different standards is given in Annex I, § 1.
3.1.4 Interference to a frequency-modulation, television signal from an amplitude-modulation vestigial- sideband television signal
In this case measurements have been made for 525-line standard M-NTSC and 625-line standard K-SECAM as the wanted signal. For standard M co-channel protection ratio values ranging from approximately 28 to 32 dB are indicated for the reference case. The adjacent channel protection ratios are given in Annex I, § 2, for 18 MHz/V deviation. These results may serve as a guide until more complete measurements are performed.
For standard K-SECAM, details are given in § 5 of Annex I.
3.1.5 Interference between two frequency-modulation television signals
When the modulation parameters of the wanted and unwanted signals are the same and there is no carrier frequency offset, the value PRq, of the protection ratio measured under the reference conditions of Table I may be represented by the following formula:
PRq = C - 20 log (D /1 2 ) - Q + 1.1 Q 2 (2)whereD v: nominal peak-to-peak frequency deviation;Q: the impairment grade, concerning the effect of interference only, measured on the 5-point scale
recommended in Recommendation 500-1 [CCIR, 1970-74h];C: a constant depending on the television standard which is:
12.5, for 625-line standards I, G, L;18.5, for 625-line standard K;13.5, for 525-line standard M.
For high Q values, 4 to 4.5, the measured co-channel protection ratios reported in § 3 of Annex I were found to fit equation (2) within 1 dB after adjustements were made for deviations from the “reference case”. Protection ratio data from Report 449-1 also was within 1 dB of equation (2). The limited data available for low Q values (see Annex I, §3.1) differed from equation (2) by approximately 4 dB. Equation (2) is useful for system design where high Q values are generally required. Refinement of equation (2) for low Q values requires additional data for the different modulation standards.
Detailed information on interference between two frequency-modulation television signals is given in Annex I, § 3, and in [CCIR, 1974-78d].
3.1.6 Interference between two dissimilar frequency-modulation television signals
Tests have been carried out by the BBC and TDF for interference between 625-line PAL and SECAM systems and in Japan for interference between 525-line system M-NTSC and different 625-line systems. As a general result it can be concluded that the measured television protection ratio for two dissimilar systems is not significantly different from the protection ratio measured for the more demanding system interfering with itself.

Rep. 634-1 233
3.2 Interference to a television signal from other types o f signal
Measurements have been carried out by the TDF for interference to a frequency-modulated television signal from a frequency-modulated sound multiplex signal and a PSK-telephony signal. The results concerning the co-channel protection ratio only are the following:
Wanted signal: Frequency-modulation televisionInterfering signal: FM-sound multiplex Telephony PSK
32 Mbit/s 52 M bit/s
PRq 27 dB 19 dB 19 dB
More information on the measurements is given in § 4 of Annex I and in [CCIR, 1974-78c].
3.3 Deviations from the reference case
Based on the information given in Annex I, the effects of several deviations from the reference case can be quantified and qualified as described below.
3.3.1 Viewer expertise
The relationship between expert and non-expert viewers has been examined for the 525-line standard M-NTSC amplitude-modulation vestigial-sideband protection ratio against barely perceptible frequency-modulation interference. The expert viewers were found to require 2 to 4 dB greater protection ratio (Annex I, § 3.1). For other wanted and unwanted signals, the relationship may be different and should be determined by experiments.
3.3.2 Deviation o f the main carrier by the sound sub-carrier
Tests carried out by the BBC for interference between two frequency-modulation television signals, standard I-PAL, indicate that a slight reduction of adjacent channel protection ratio can be achieved by reducing the deviation on the main carrier caused by the sound sub-carrier (from a value of ± 2.8 MHz). Tests carried out in Japan for interference between two frequency-modulation television signals, standard M-NTSC, showed that the presence of 1 or 2 sound subcarriers has negligible effect on the protection ratio.
3.3.3 Scanning synchronization
If the line-scanning frequencies of the wanted and the unwanted transmissions are not frequency- locked, the protection ratio is likely to be slightly higher than the reference condition.
3.3.4 Picture type
Protection ratios established with typical programme material as the wanted signal may be 5 to 10 dB lower than those obtained with reasonable critical still scenes.
3.3.5 M odulation index
Increasing the modulation index reduces the co-channel protection ratio for two frequency modulation signals as given by equations (1) and (2). To compare co-channel protection ratios measured at peak deviations different from the reference case with those measured at the reference case (12 MHz/V) the measured values should be modified by an additive correction constant of 20 log10 D / 12, where D v is the peak-to-peak frequency deviation in MHz.
This correction applies approximately to VSB-AM signals affecting FM signals, but a smaller correction applies when FM signals affect VSB-AM signals (see examples in Table III of Annex I and Report 634-1, § 3.5.2). It does not apply when appreciable frequency offsets exist.
3.3.6 Pre-emphasis
In the case of interference to an amplitude-modulation, vestigial-sideband system from a frequency- modulation system, the co-channel protection ratio decreases by 1.0 dB if pre-emphasis is not used on the interfering signal. To compare with measurements made at the reference conditions, the measured protection ratios, in this case, should be modified by an additive constant of 1.0 dB. In the case of interference between two frequency-modulation systems pre-emphasis has negligible effect on the cochannel protection ratio whereas for the adjacent channel a somewhat higher carrier offset is required to reach the same protection ratio when no pre-emphasis is used.

234 Rep. 634-1
3.3.7 Energy dispersal
In the case of interference to an amplitude-modulation vestigial-sideband system from a frequency-modulation system the use of energy dispersal reduces the co-channel protection ratio by 1.5 dB per MHzof peak-to-peak deviation caused by energy dispersion. To compare measurements made with energy dispersion to measurements made at the reference conditions, the measured co-channel protection ratio, in this case, should be modified by a constant of 1.5 dB/MHz.
3.3.8 Small carrier frequency offset
Generally near zero frequency offset the protection ratio is constant. In some cases variations are introduced by the susceptibility to interference of some components of the signal, such as the colour sub-carrier.
3.3.9 Effects o f noise
Some Administrations feel that system planning could take account of the masking of interference by random noise. In this case, a lower value, PRX of protection ratio could be adopted. If the peak-to-peak luminance signal-to-r.m.s. weighted-noise ratio is S /N results obtained for 525-line standard M suggest that
PR{ = PRo - (49 - S /N ) S /N < 49 dBPRX = PRq S /N > 49 dB W
where PRq is the protection ratio under the reference conditions of Table I, other Administrations haveobtained results where the presence of noise tends to raise the required protection ratio. The supportingdata for the effects of noise are given in §§ 1.1.3, 1.1.4, 1.2, 3.1 and 3.3 of Annex I.
4. Interference to a sound multiplex from other signals
Co-channel protection ratios have been measured by the TDF concerning the interference to a frequency- modulated sound multiplex signal from a frequency-modulated television signal, a PSK-telephony signal and a frequency-modulated sound multiple signal. The results obtained are the following:
Wanted: FM-sound multiplexInterfering: FM-TV PSK-telephony FM-sound multiplex
32 M bit/s 52 M bit/sCo-channel protectionratio (dB) 19 18 18 25
Adjacent-channel protection ratio tests have now to be completed. More information on these measurements is shown in § 4 of Annex I.
ANNEX I
RESULTS OF PROTECTION RATIO TESTS
This Annex summarizes protection ratio data obtained by several Administrations for signals involving both frequency modulation and amplitude modulation by television signals in formats M/NTSC, B/PAL, G/PAL, I/PAL, K/SECAM and L/SECAM. It also provides data on a sound multiplex system and digital telephony systems used in protection ratio measurements.
1. Interference to an amplitude-modulation, vestigial-sideband television signal from a frequency-modulationtelevision signal
1.1 525-line Standard M /N TSC
The following data are based on the preliminary results of tests conducted in the USA [CCIR, 1970-74a]and in Japan [Kaneda, 1972]. System M was used for both the frequency-modulation and the amplitude-modulation, vestigiai-sideband colour television signals.
1.1.1 Co-channel protection ratio
In the subjective assessment of the co-channel protection ratio of AM-VSB television signal against interference from the FM-television signal, the salient conditions used for the measurements made in Japan are the following:— Signal-to-unweighted noise ratio of video signal used is not less than 42 dB.— Picture slides of SMPTE Nos. 1,9, 14 and colour bar signal are used.— Number of observers is 24 including 12 experts.— Viewing distance is six times the picture height.

Rep. 634-1 235
Carrier-frequency offset, A f (MHz)
FIGURE 1 — Reference case protection ratios relative to co-channel values
4/"' (finterfering- Jwanted
Curve A : Television/vestigial sideband modulation-wanted, television/frequency modulation interfering, co-channel value: 50 dB
Curve B : Television/frequency modulation-wanted, television/frequency modulation interfering, co-channel value: 30 dB
Curve C : Television/frequency modulation-wanted, television/vestigial sideband modulation interfering, co-channel value: 30 dB
Table III shows the summary of co-channel protection ratios for just perceptible interference. It appears to be in fairly good agreement with the data described in § 1.1.2.
TABLE III — Summary o f co-channel protection ratios
Wanted signal: amplitude-modulation vestigial sideband television
Unwanted signal: frequency-modulation television
Wanted signal: frequency-modulation television Unwanted signal: amplitude-modulation
vestigial sideband television
^X For barely perceptible
interference level (dB)
For allowable interference level
(dB)D v
(MHz)For barely perceptible
interference level (dB)
For allowable interference level
(dB)
8 52 46 8 36 2816 49 42 16 30 2424 48 43 20 28 22
(') D v is the peak-to-peak frequency deviation o f the frequency-modulation television signal.

236 Rep. 634-1
1.1.2 Protection ratio as a function o f carrier-frequency offset
Tests performed by the USA and reported in §§ 1.1.2, 1.1.3, 1.1.4 used the following test conditions. The protection ratios measured were for just perceptible visual interference. Audio-frequency interference was not evaluated. The picture tube diagonal was 38 cm (15 in.). Viewing distances ranged from 135 to 165 cm (4V2 to 5‘/2 feet). The centre of the viewed picture was at the viewer’s eye level, and the maximum side-viewing angle was 30°. Peak white luminance was approximately 20 foot-candles (200 lux). The light from the area surrounding the picture tube measured approximately 0.1 foot-candles (1 lux). The wanted amplitude-modulation, vestigial-sideband signal carried “off-the-air” programme material. The interfering frequency-modulation signal carried various stationary test signals and used a peak-to-peak frequency deviation of 18 MHz. The modulating signal polarity was such that the deviation produced by synchronizing pulses was towards lower frequencies. No pre-emphasis was used with the frequency-modulation signal.
The amplitude-modulation, vestigial-sideband protection ratio against frequency-modulation interference is shown as a function of the carrier-frequency offset in Fig. 2 from [Miller and Myhre, 1970]. The amplitude-modulation, vestigial-sideband signal-to-random noise ratio for these tests was 49 dB (weighted). The judgments of just perceptible interference were made by a single expert observer.
The curves of Fig. 2 show that interference from still scenes is more easily perceived than interference from scenes with motion. The shaded area in Fig. 3 encompasses the data from the individual test curves and indicates the upper and lower limits of the amplitude-modulation, vestigial-sideband protection ratio. To guarantee no perceptible interference from both still and moving scenes, a protection ratio exceeding the upper boundary of the shaded area in Fig. 3 should be used.
Difference between unmodulated frequency-modulation carrier and amplitude-modulation,
vestigial sideband carrier (MHz)
S32
•8 £5 73 ”5. §S X><Dcog •B2 w>32 «“ <D
» §4>O
CL ^^ T3 Os
Difference between unmodulated frequency-modulation carrier and amplitude-modulation,
vestigial sideband carrier (MHz)
White window on frequency-modulation system
— — Bars on frequency-modulation system
(a) White window and colour bars on frequency modulation system
■“ -0 - -----
Kitchen scene on frequency-modulation systemGirl slide on frequency-modulation system“Off-the-air” programme material on frequency-modulation system
(b) Kitchen scene, girl slide, and “off-the-air” programme material on frequency-modulation system
FIGURE 2 — Protection ratio for an amplitude-modulation, vestigial sideband system as function of carrier frequency
offset
(fsYN C PK A v) AM! VSB
(Pa y ) f m

Rep. 634-1 237
-30 -2 0 -10 0 10
Difference between unmodulated frequency-modulation carrier
frequency and amplitude-modulation, vestigial sideband carrier
frequency (MHz)
FIGURE 3 — Protection ratio required for just perceptible interference in an amplitude-modulation, vestigial-sideband system subjected to interference by a frequency-modulation television system
(PsYNCPK Av) AM/VSB
(Pay) FM
1.1.3 Protection ratio as a function o f the signal-to-noise ratio
The amplitude-modulation, vestigial-sideband protection ratio against just perceptible frequency- modulation interference is shown in Fig. 4 as a function of the output picture signal-to-weighted noise ratio on the amplitude-modulation, vestigial-sideband television system [Miller and Myhre, 1970]. The data used in Fig. 4 is from tests with off-the-air programming on both the amplitude- and frequency-modulation systems. For signal-to-noise ratios of less than 45 dB the average protection ratio, as shown in Fig. 4, may be expressed by:
R-a m / f m — S / N w j-d + 2 dB (4)
The ranges of the test data at the various signal-to-noise ratios are shown by the vertical lines through the curve in Fig. 4. Changes in programme material during the tests account for most of the variations in the test data. The interference is more easily perceived in dark-coloured areas than in light-coloured areas. Pictures having large areas of uniform colour show interference more readily than scenes with multi-coloured detail. To guarantee no perceptible interference for varied programme material on both systems, an amplitude-modulation, vestigial-sideband protection ratio exceeding the upper limits of the data should be used. In this case the protection ratio for signal-to-noise ratios less than 45 dB would be expressed by:
R am /fm — S /N wth + 7 dB (5)
60
50
m32 40£
o 30
I20
1010
T J
T /]A
r
y $
Carrier frequency offset: 0.5 MHz
Peak-to-peak frequency deviation: 18 MHz
Protection ratio for just perceptible interference: 34 observations by one expert viewer, averaged at each value of signal-to-noise ratio (S/N)
S/ N =Whlte-to-blanking voltage
20 30 40 50Signal-to-noise ratio
in amplitude-modulation, vestigial-sideband channel (dB)
60
Rm.s. noise voltage in 4.2 MHz (WTD)
No pre-emphasis on frequency-modulation system
FIGURE 4 — Protection ratio for an amplitude-modulation, vestigial-sideband system as a function of signal-to-noise ratio in the amplitude-modulation, vestigial-
sideband channel
1.1.4 Protection ratio tests with m any viewers
The amplitude-modulation, vestigial-sideband protection ratio against just perceptible frequency- modulation interference is shown in Fig. 5 for tests with a total of 30 viewers. Each viewer witnessed a random sequence of test scenes having different ratios of wanted-to-unwanted signal power. The viewers were asked to judge only whether or not they could perceive any interference in the picture. The

238 Rep. 634-1
amplitude-modulation, vestigial-sideband picture was “off-the-air” programme material. The interfering frequency-modulation signal was either a kitchen scene, colour bars, the white window, or “off-the-air” programme material. The curve in Fig. 5 is the average of the percentage readings for the four different modulating signals on the frequency-modulation system. The ranges of the percentages over the four tests are shown by the vertical bars. At a given power ratio, the percentage of viewers perceiving no interference is a function of the amplitude-modulation, vestigial-sideband programme material. As in the tests with asingle expert observer, still scenes with dark areas or with large areas of uniform colour required a greaterpower ratio to cause the interference to be imperceptible. Test conditions were:
AM-VSB signal-to-noise ratio: 46 dB (weighted)Carrier-frequency offset: 0.5 MHz.
Of the 30 viewers, 3 were expert viewers. There were 3 female and 27 male viewers.On the basis of these limited tests, the amplitude-modulation, vestigial-sideband protection ratio,
such that 50% of the viewers wll perceive no interference, is given by the following expression:
R a m / f m = $ / N w t d dB (6)
The expert viewers used to obtain the barely perceptible interference test results shown in the figures were administered this same test. For these expert observers to perceive no interference, the measured amplitude-modulation, vestigial-sideband protection ratio is given by the following expression:
R a m / f m = <£/N w t d -I- 4 dB (7)
These results indicate the expert viewers used in the other tests to be 4 dB more critical than the group of 30 viewers.
Equations (1) and (4) are based upon two different impairment criteria, and consequently are not directly comparable. Equation (1) expresses the protection ratio measured for an expert observer to notice just perceptible interference, while equation (4) expresses the protection ratio measured for expert observers to perceive no interference.
1.2 625-line Standard I/P A L
Fig. 6 gives a summary of subjective tests performed by the BBC [CCIR, 1970-74b; Brown, 1971a]. The wanted amplitude-modulation, vestigial-sideband signal was modulated by a still picture of books, a box and silverware, and had a luminance-to-weighted-noise ratio of 43 dB. The interfering frequency-modulation signal was modulated by a colour bar using a nominal peak-to-peak deviation of 8 MHz, pre-emphasis according to curve B of Recommendation 405-1, and no energy dispersal.
' AM/FM (dB)Frequencymodulationoff
c4>e5 3o.s° 2u•aCOO
& °a ?
* ' 7' 6 /
- A " ' □ \>
\ V
* >■*
* CL* x y
62 58 54 50 46Protection ratio (dB)
42
FIGURE 6 — Grade of impairment caused by a combination of random noise and co-channel interference, present simultaneously
FIGURE 5 — Percentage of viewers perceiving no interference, as a function of
the protection ratio Ram/fm
— O - ' : greater than 39 dB— — □ — — : 35 to 39 dB inclusive - ——-A - — — - : less than 35 dB
signal -to -unweighted noise ratio (dB)

Rep. 634-1 239
Fig. 6 refers to video signal-to-unweighted-noise ratios; for weighted-noise (Standard I weighting) the numerical value is increased by 6.5 dB.
The results suggest that if the wanted signal has a signal-to-noise ratio of 36.5 dB, noise unweighted, or 43 dB noise weighted, a working protection ratio of 53 dB would cause a change of grade from less than 2.0 to about 2.5 *.
At high signal-to-noise ratios the protection ratio is 56 dB. It may be noted that from the shapes of the curves in Fig. 6, the impairment caused by interference is not significantly masked by the noise.
Reduction of this protection ratio may be permissible under the following conditions:— no pre-emphasis: 1.5 dB reduction;— deviation increased from 8 to 12 MHz peak-to-peak: 2 dB reduction;— use of energy dispersal: about 2 dB reduction per MHz of peak-to-peak deviation.
On the other hand, an interfering signal modulation of black level was found to require a higher protection ratio (by about 5 dB). Thus, for the reference condition the protection ratio may be taken as 54 dB.
1.3 625-line Standard G /PAL
The IRT in the Federal Republic of Germany [CCIR, 1970-74c], have carried out tests on System B/PAL, which for the present purpose can be considered as equivalent to System G/PAL. The signal-to-noise ratio (weighted) was approximately 50 dB. The protection ratio was assessed for an impairment grade of 2, on the 6-point scale. At a peak-to-peak deviation of 8 MHz for the interfering signal, and with no pre-emphasis, the average value of the protection ratio was 59.7 dB. A separate series of tests suggested that, on average, pre-emphasis does not significantly affect the results. (This conclusion differs somewhat from the BBC tests, which suggested that pre-emphasis may be expected to increase the protection ratio by about 1.5 dB. The difference may be due to the different picture content of the interfering signal.)
The observers in this test were all experienced, and the pictures used tended to be fairly sensitive to the effects of interference. On the other hand, it must be remembered that the impairment grade corresponded to greater impairment than the reference condition. Taking these factors into account, the protection ratio for the reference conditions may be taken as about 54 dB.
1.4 625-line Standard L /SE C A M
The ORTF, in France, [CCIR, 1970-74d and e] have investigated the case where the wanted signal is System L/SECAM, the interfering signal being PAL. In this case, the impairment grade was taken as 4, on the 5-point scale. In some separate tests, it was found that for an impairment grade of “just perceptible” (i.e., grade 2 on the 6-point scale), the protection ratio should be increased by about 5 dB. Using the conversion formula suggested in the Annex to Recommendation 500-1 this suggests that more than 5 dB should be added to obtain an impairment grade of 4.5 (5-point scale).
Pre-emphasis was included. The low frequency deviation was 3.8 MHz/V, so the equivalent value at the frequency of zero insertion loss (i.e. 1.5 MHz) would be 13.5 MHz peak-to-peak, and another correction is required (see § 3.3.5 of the Report) to obtain results applicable to the reference condition of 12 MHz.
Referring to the reference conditions described in Table I of the Report, the TDF measurements lead to the following results:
Measured protection ratio for grade 4: 45 dB Allowance to refer results to grade 4.5: +5 dB Allowance to refer results to 12 MHz deviation: +0.5 dBThus, the final value of the protection ratio, applicable to the reference conditions, becomes 50.5 dB.
1.5 Frequency offset
If the frequencies of the wanted and interfering signals are spaced by a few MHz, some reduction in protection ratio is possible, the difference depending on whether the interfering signal is of a higher or a lower frequency than the wanted signal. Tests by the BBC, IRT and TDF all showed that the protection ratio varies only with respect to the frequency spacing. Examples are shown in Figs. 7 and 8 which show results obtained by the IRT and TDF respectively (using deviations somewhat greater than the reference condition). Since the spacing between terrestrial channels in Systems G, I and L is 8 MHz, the best offset which could be used would be that giving equal protection ratios at ± 4 MHz about the point of symmetry of the intefering spectrum. Figs. 7 and 8 show that if this is done, the benefit is unlikely to exceed about 3 dB, compared with the case of using no offset.
* The scale used is the EBU impairment scale, which is:Interference GradeImperceptible 1Just perceptible 2Definitely perceptible, but not disturbing 3Somewhat objectionable 4Definitely objectionable 5Unusable 6

240 Rep. 634-1
Difference between wanted and Interfering signals, fi„,er/ering-fwanted (MHz) (The signs + and - refer to the two senses of modulation)
FIGURE 7 — Variation of the protection ratio with respect to frequency spacing forstandard G/PAL
FIGURE 8 — Variation of the protection ratio with respect to frequency spacing
Wanted signal:
Interfering signal:
L/SECAM colour bars (radio-frequency level:60 dB (juV/m))G/PAL slide, synchronized scanningMeasured without energy dispersal of the G/PAL signalMeasured with energy dispersal over 2 MHz of the G/PAL signal
2. Interference to a frequency-modulation television signal from an amplitude-modulation vestigial-sidebandtelevision signal
2.1 525-line Standard M /N TSCResults for this case have been provided by the USA [Miller and Myhre, 1970] and Japan [Kaneda, 1972].
In the USA a series of tests was conducted where a frequency-modulation television signal was placed at the same frequencies as an amplitude-modulation, vestigial-sideband television signal. The video output of a frequency- modulation television receiver tuned to the frequency-modulation signal was evaluated for interference. The signals used in the tests were the same as those described in § 1.1.2, except that the frequency-modulation signal was now the wanted signal and the amplitude-modulation, vestigial-sideband signal was the interfering signal.

Rep. 634-1 241
The results of the tests are shown in Fig. 9. The luminance signal-to-weighted noise ratio of the wanted picture signal used in these tests was approximately 54 dB. The judgements of just perceptible interference were made by a single expert viewer. Bandwidth of the frequency-modulation receiver was 30 MHz.
The curves of Fig. 9 show that interference from stationary scenes, having large areas of uniform colour, is more easily perceived than scenes with motion, as in most off-the-air programming. The shaded band in Fig. 10 encloses the curves of the measured protection ratios. To guarantee no perceptible interference from both still and moving scenes, a protection ratio exceeding the upper boundary of the shaded area in Fig. 10 should be used.
Difference between amplitude modulation, vestigial sideband carrier frequency and
unmodulated frequency-modulation carrier frequency (MHz)
O Colour bars on frequency-modulation system— — — “Off-the-air” programme material on frequency-modulation system
(a) Colour bars and “off-the-air” programme material on frequency-modulation system
Difference between amplitude modulation, vestigial sideband carrier frequency and
unmodulated frequency-modulation carrier frequency (MHz)
O',..1—1— Kitchen scene on frequency-modulation system — Girl slide on frequency modulation system
(b) Kitchen scene and girl slide on frequency-modulation system
FIGURE 9 — Protection ratio for a frequency-modulation system as a function of the carrier-frequency offset
( P a v ) f m
(PSYNC PK A v ) AM/VSB
-20 -10 10 20 30
Difference between amplitude-modulation, vestigial-sideband carrier frequency and
unmodulated frequency-modulation carrier frequency (MHz)
FIGURE 10 — Protection ratio required for just perceptible interference in a frequency modulation television
system subjected to interference by an amplitude-modulation, vestigial-sideband television system
( P a v ) FM
(PSYNC PK a v ) AM /VSB

242 Rep. 634-1
Table III also shows the results of the subjective assessment test carried out in Japan in the case of barely perceptible interference for a wanted FM-TV signal and an unwanted VSB-AM television signal under the same conditions as described in this Annex, § 1.1.1.
2.2 625-line Standard K /SE C A MMeasurements in the USSR [CCIR, 1970-74f] determined protection ratios for frequency-modulation
colour and monochrome signals against interference by CW, amplitude-modulation, vestigial-sideband, and frequency-modulation signals. To facilitate intercomparison of the results of the Standard K measurements, they are presented separately in § 5.
3. Interference between two frequency-modulation television signalsMeasurements of interference between frequency-modulated television signals of the types used in the
fixed-satellite service and the fixed service are presented in Report 449-1. Additional measurements for the broadcasting satellite service are given below.
3.1 525-line Standard M /N T SCTests were conducted in the USA with two frequency-modulation signals operating at carrier frequency
offsets in the range from —30 MHz to +36 MHz [CCIR, 1970-74a] using an experimental arrangement similar to that described in § 1.1.2. The video frequency output of a frequency-modulation television receiver tuned to the wanted signal was evaluated by a single expert observer for just perceptible interference when the picture signal-to-weighted noise ratio was 50 dB. The bandwidth of the frequency-modulation receiver was 30 MHz. Fig. 11 shows the measured protection ratios as functions of carrier frequency offset with off-the-air programming on the unwanted signal and various programmes on the wanted signal. The curves show that off-the-air programming, when there are scenes in motion, is less susceptible to interference than stationary scenes with large areas of uniform colour.
40
« in •O 30o tdc 20o
0-30 -2 0 -10 0 10 20 30 40
Difference between unmodulated carrier frequency (Unwanted system) and unmodulated carrier frequency
(Wanted system) (MHz)
Wantedsystem
Unwantedyystem
Peak-to-peak deviation Signal-to-noise ratio (weighted) Pre- and de-emphasis
18 MHz 50 dB none
18 MHz
none
CurveProgramme material
Wanted signal Unwanted signal
A white window off-the-airB colour bars off-the-airC kitchen scene off-the-airD off-the-air off-the-air
FIGURE 11 — Protection ratio for just perceptible interference in a frequency- modulation television system
subjected to interference by frequency-modulation television
(PavIfm (Wanted) Rfm/fm= (Pav)fm (Unwanted)

Rep. 634-1 243
Difference between unmodulated carrier frequency (Unwanted system) and unmodulated carrier frequency
(Wanted system) (MHz)
FIGURE 12 — Protection ratio for just perceptible interference in a frequency- modulation television system
subjected to interference by frequency-modulation television signals
Wantedsystem
Unwantedsystem
Peak-to-peak deviation S/N (weighted)Pre- and de-emphasis
18 MHz 50 dB None
18 MHz
None
The shaded band in Fig. 12 encloses the individual measured protection ratios. To guarantee no perceptible interference from both still and moving scenes, a protection ratio exceeding the upper boundary of the shaded area should be used.
The foregoing results display the dependence of protection ratio on carrier frequency offset and type of programming for a frequency-modulation television signal whose output picture signal-to-weighted noise ratio was held constant at 50 dB. As previously noted, a single expert observer was used. More recently, a new series of protection ratio measurements was made [CCIR, 1970-74g] to determine the dependence of protection ratio on output picture signal-to-weighted noise ratio for specified picture quality levels, as judged by non-expert observers.
In the new measurements, peak-to-peak frequency deviation of both wanted and unwanted frequency- modulation carriers was the same as before (18 MHz), but the offset between carrier frequencies was held at nearly zero (less than 0.5 MHz) and each carrier was modulated by different off-the-air commercial colour programmes having moderate movement within the pictures. Using video tape, thirty different scenes each of 20 s duration were recorded to display all possible combinations of five levels of output picture signal-to-weighted noise (31, 40, 43, 45 and 51 dB) and six carrier-to-interference ratios (3, 7, 11,15, 19 and oo dB).
To minimize the effect of the order of presentation of these scenes on the subjective evaluation of picture quality, a different random sequence of the thirty scenes was shown to each of five different groups of fifteen observers. Observers were seated at a distance equal to six times the height of the picture screen from a 48 cm diagonal consumer grade television receiver within an angle of 35° from the normal to the screen. The observers were asked to rate each scene on two different five-point scales (see Table IV), one indicating only the extent to which the combined interference and noise was visually perceptible, the other, the extent to which the observers found the interference and noise annoying.
From these data, the combinations of carrier-to-interference ratio C /X , or protection ratio, and output picture signal-to-weighted noise, S /N ^ j) , corresponding to two specific levels of picture quality of each of the two rating scales were determined. The First level was grade 2, corresponding to “barely visible” interference on the visibility scale, and “slightly annoying” on the annoyance scale. The other level was grade 4, corresponding to “quite noticeable” and “quite annoying” interference on the respective scales.
The entire experiment was conducted twice; once using high school students with an average age of 17 years as observers, and once using engineers and technicians with an average age of 40 years. The results for the tests group composed of engineers and technicians [CCIR, 1970-74g] are shown in Figs. 13 and 14. This group, though not experienced in viewing, rated the test scenes slightly lower than the group of high school students and might better be used as the basis of system design.
Fig. 13 shows the value of C /X associated with the selected picture grades for each of the five values of S /N wtq used in the sample scenes. In this figure, each pair of points was itself determined from a separate plot [CCIR, 1970-74g] of the average subjective picture ratings versus C /X for a fixed value of S /N ^ ttd-

244 Rep. 634-1
TABLE IV — Subjective rating scales used in measurements o f interference between two frequency-modulation signals
Visibility of interference (including noise)
Annoyance caused by the interference (including noise)
1. Could not see any interference (clear picture)2. Barely noticed the interference
3. Definitely noticed the interference (picture somewhat unclear)
4. Quite noticeable interference (picture unclear)
5. Extremely noticeable interference (difficult to make out the picture)
1. Did not annoy me at all2. Annoyed me slightly (I generally would watch it that
way)3. Definitely annoyed me (I might not watch it that way)
4. Quite annoying (I would watch it that way only if it were very interesting)
5. Extremely annoying (I generally would not watch it that way)
N ote. — The rating'scales used are a deviation from the 5-point scale in Recommendation 500-1. The two rating scales separate the dimensions o f visibility (perceptibility) and annoyance. Previous tests [C.C.I.R., 1970 - 74 g] had determined that a 5-point scale combining perceptibility and annoyance resulted in confusion o f the two variables when used by non-expert viewers. The separate scales proposed and used in the United States o f America [C.C.I.R., 1970 - 74 g] were further modified to make the word descriptions o f the grade levels more understandable to non-expert observers.
Ratio of peak-to-peak signal (white to blanking) to weighted r.m.s. noise in 4.2 MHz,
S /N vtd, (dB)
2 <N2 *£ <l>« — 05 ’O60 C g“ “ s ■3o o
O O01
25
30
35
40
45
50
tl-------O-W c
I\ a
r ^ ' ■ACsJ
V V\ \
st
Grade 4
Grade 2
Carrier-to-interference ratio, C/X, (dB)
FIGURE 13 — Protection ratios for picture grades 2 and 4 as functions of the output picture signal-to-weighted noise ratio
FIGURE 14 — Signal-to-noise ratios for picture grades 2 and 4 as functions of carrier-to-interference ratio
annoyancevisibility
— O- annoyancevisibility
Fig. 14 shows the values of S/N ^n-o associated with picture grades 2 and 4 for each of the six values of C /X used in the scenes. Here, each pair of points was determined from a separate plot [CCIR, 1970-74g] of average picture rating versus S /N ^ td f°r a given value of C /X .
Several conclusions may be drawn from an inspection of these figures. First of all, if the annoyance caused by the interference is taken as the criterion of picture quality, 1 to 3 dB lower protection ratios (1 to 3 dB higher interference levels) can be used at grade 2 than if visibility of interference is the criterion.
Another important conclusion deals with the interactive effect of interference and noise. Except for a somewhat anomalous situation at values of S /N w o exceeding 43 dB (see Fig. 13), the amount of interference that can be tolerated at a given level o f picture quality decreases as the noise level increases. Conversely, as shown in Fig. 14, the amount of noise that can be tolerated at a given picture quality level decreases as the interference level increases. This is exactly what one would expect since both noise and interference degrade picture quality, albeit to different degrees, depending on their individual natures. It in no way contradicts the previously noted conclusion (see §§ 1.1.2 and 5.1) that for a given noise level, the higher the noise level, the higher the “just perceptible” interference level.

Rep. 634-1 245
Finally, the numerical values of the protection ratios corresponding to a grade 2 picture (slightlyperceptible, or slightly annoying interference), are somewhat lower than those obtained for barely perceptibleinterference in the earlier frequency modulation-frequency modulation measurements (Figs. 11 and 12). This difference may be attributed largely to the fact that the more recent tests used a large group of non-expert observers while the earlier tests used only a single expert observer. Not only is the expert observer more critical in his judgement, but the protection ratios reported in Figs. 13 and 14 represent the average judgement of the non-expert viewers. The protection ratios corresponding to a picture that 90% of these viewers would rate as grade 2 or better would be in closer agreement with those of the expert viewer.
In a recent study [CCIR, 1974-78a] made in Japan, measurements were made on co-channel protection ratios between two FM television signals of 525-line standard M and between FM television 525- and 625-line standard signals under the conditions described as follows:— polarity of frequency-modulation is such that frequency of black level is lower than that of white level;
— receiving bandwidths are 23 MHz for 525-line system M/NTSC signal and 27 MHz for 625-line PAL andSECAM signals, respectively;
— peak-to-peak frequency deviations for the video signals of 525-line system and 625-line system are 12 MHz and 13 MHz respectively;
— there are three cases in using television sound sub-carrier for 525-line System M (none, or 4.5 MHz, or 4.5and 5.05 MHz) and no sound sub-carrier for 625-line television systems;
— characteristics of pre-emphasis of the video signal are those shown in Recommendation 405-1, System M. The same circuit is used for the 625-line system because of unavailability at the time of measurement;
— the value of protection ratio used in this document corresponds to just perceptible interference, defined as the power ratio of carrier-to-interference ratio at the receiver input when 50% of the observers give the grade 4 and the remainder gives grade 5;
— SMPTE No. 14 picture slide is used for the wanted signal, and No. 1 for the unwanted signal;
— ratio of viewing distance to picture height is 6;— number of observers is 45 including 22 experts.
Table V shows the value of the protection ratio for just perceptible interference, which is defined as the power ratio of carrier to inteference at the receiver input when 50% of the observers give the grade 4 and the remainder gives grade 5.
From this table, it may be concluded that there is no significant difference between protection ratios forsystems using different television standards. From the measurements reported in [CCIR, 1974-78b] it may beindicated that the presence of 1 or 2 sound sub-carriers has negligible effects on the protection ratio.
TABLE V — Summary o f measured co-channel protection ratios (dB) between tw o F M television signals
Wanted signal
525-line standard M
(NTSC)
625-line standard L (SECAM)
625-line standard I
(PAL)
Unwanted signal Video peak-to-peak ___| deviation (MHz)
12 13 13
525-linestandard M (NTSC) 12
Without pre-emphasis 31.5 32 32
With pre-emphasis 31.5 3 1 0 3 1 .5 0
625-linestandard L (SECAM) 13
Without pre-emphasis 31.5
— —With pre-emphasis 29.5(')
625-linestandard B, G (PAL) 13
Without pre-emphasis 30.5— —
With pre-emphasis 29.0(‘)
(') These data are for reference, because pre-emphasis network for standard M was only used.

246 Rep. 634-1
3.2 625-line Standard B /PAL, G /PAL, I/P A L and L /SE C A M
Measurements of protection ratio for two frequency-modulation television signals with the same value for frequency deviation have been made in the United Kingdom by the BBC [Brown, 1971b], in Italy by RAI, in France by the TDF and in the Federal Republic of Germany by the IRT and DBP. A summary of these results [CCIR, 1974-78d] is given in the Report in § 3.1.5 and in Fig. 1, Curve B. The protection ratios were measured with a deviation of the sound sub-carrier on the main carrier which was in every case ± 2.8 MHz. The sub-carrier frequency was 6 MHz for Standard I, used by the BBC, 5.5 MHz for Standards B and G used by the RAI, the IRT and DBP and 7.5 MHz used by the TDF. The protection ratio templet (Fig. 1, Curve B of the Report) is asymmetrical about the carrier rest frequency. For exercises in planning, it would often be useful to use a common value for the protection ratios relating to the lower— and upper — adjacent channels. In this case the following compromise values can be used.
Channel spacing 16 18 20 22 24 26 28 30(MHz)
Protection ratio 20 16 13 10 7 4 2 0(dB)
More detailed information is given in [CCIR, 1974-78d].
3.3 Co-channel protection ratio between wide-deviation frequency-modulation sound carriers
In the broadcasting-satellite service it may be desirable to use a separate carrier, instead of a sub-carrier, for transmitting the television sound. In this case it may be necessary to use a deviation of about ± 300 kHz [CCIR, 1970-74i]. It is therefore important to know the co-channel protection ratio which should be specified for such signals, and also to find the minimum permissible spacing between the carriers, if several carriers were grouped together in a part of the frequency spectrum.
The BBC has carried out objective measurements of the interference between two frequency-modulation sound signals. The interfering signal was modulated by a 1 kHz tone to a peak deviation of ± 300 kHz, and the resulting signal-to-noise ratio in the wanted sound channel was measured using a modified Niese noise meter * together with the recommended CCIR noise-weighting network (Recommendation 468-2).
For a signal-to-noise ratio of 50 dB, the co-channel protection ratio did not exceed 5 dB, the value depending to some extent on the exact frequency difference between the two carriers (over a range of about ± 200 kHz). For a signal-to-noise ratio of 60 dB, the protection ratio is not greater than 15 dB. The protection ratios determined for the sound signal are much lower than those for the television signal.
More tests were carried out to find suitable values for the carrier spacing (that is, the spacing between the carrier frequencies of adjacent sound channels). As in the case of television signals, it is assumed that the channel width is sufficiently large so that the adjacent-channel protection ratio is —6 dB. In this case, the tests showed that the carrier spacing should be about 0.8 MHz.
4. Protection ratio measurements between frequency-modulation television signals, a sound multiplex system and digital telephony systems
Concerning the tests performed by the TDF [CCIR, 1974-78c], the modulation characteristics were the following:
FM -TV
— the video signal and a sound sub-carrier at 5.5 MHz are multiplexed;
— peak-to-peak frequency deviation of the carrier: 14 MHz/V
— noise bandwidth: 27 MHz
— pre-emphasis for video: Recommendation 405-1
— frequency deviation of the sub-carrier: ± 7 5 kHz
— pre-emphasis for audio signal: 50 ps
— amplitude of the sub-carrier: 230 mV
For noise measurements this indicates the ratio of the r.m.s. signal to the r.m.s. noise.

Rep. 634-1 247
FM -sound multiplexThe carrier is modulated by an FDM /FM baseband made of 15 sub-carriers, each frequency modulated by
an audio-frequency signal (frequency deviation of the sub-carrier = ± 75 kHz, pre-emphasis for audio-frequency signal = 50 ps).
The radio-frequency bandwidth is 27 MHz. The frequency deviations of the carrier by the differentsub-carriers are such that the quality obtained is the same for each audio signal. Other transmission methods for agroup of sound channels have also been investigated [Mertens et al., 1976].
D igital telephonyThe type of modulation is PSK 4-phase.
5. Protection ratios for 625-line Standard K/SECAM
Measurements in the USSR [CCIR, 1970-74f] determined protection ratios for frequency-modulation signals against interference by CW, amplitude-modulation, vestigial-sideband and frequency-modulation signals.
5.1 Measurement conditions
Protection ratios were determined under the following conditions:— peak deviation of the wanted frequency-modulation television signal (allowing transmission of sound
component on a sub-carrier with a video signal/sound-component signal ratio of 4.5/1) was taken as ± 11 MHz;
— the ratio of the wanted signal to continuous random weighted noise at the frequency-modulation television receiver output was fixed at 57 dB (ratio of picture signal peak-to-peak amplitude, excluding synchronizing pulses, to the r.m.s. noise voltage in the frequency band from 10 kHz to the upper nominal limit of the video-frequency band). To establish this value, use was made of a low-pass filter and a weighting network with characteristics similar to those decribed in Recommendation 567, Annexes II and III for System K;
— coloured and monochrome test charts, coloured bars and real colour pictures were used for the tests;— a CW, an amplitude-modulation television signal, and a frequency-modulation television signal were used as
interfering signals;— the video signal of the monochrome test chart was used as modulating signal for the interfering amplitude-
modulation and frequency-modulation television signal;— a binary statement of the type “Yes-No” was used to assess picture quality;— the test group consisted largely of non expert viewers. Expert viewers were used to determine the proposed
central assessments. The test group consisted of ten to fifteen persons;— dimensions of test picture: 475 x 375 mm;— viewing distance: 5 to 6 times the picture height;— the centre of the screen of the test television receiver was set at eye level of the observers;— measurements were carried out in conditions of partial darkness;— the level of illumination of the screen by external light sources did not exceed 0.01 of maximum screen
brightness;— sequence of changes in noise level: random, in 3 dB steps; in each measurement series, the observers were
shown five values of signal-to-noise ratio. In consequence, the limits of the variation in noise level gave rise in each case to variations of ± 1 grade in the assessment picture quality;
— protection ratio measurements were made without a band-pass filter at the input to the frequency modulation receiver.
5.2 Measurement results
The results of the protection ratio measurements as a function of detuning of the carrier frequencies (carrier-frequency offset) of the wanted and unwanted signals, for transmission in colour (colour bars, colour test chart and real colour picture) are shown in Figs. 15 to 17, while Fig. 18 shows the results of transmission of a monochrome picture (test chart).
Fig. 15 describes the effect of CW interference on the wanted frequency-modulation television signal, Fig. 16, the effect of interference in the form of an amplitude-modulation signal and Fig. 17, the effect ofinterference in the form of a frequency-modulation signal with a peak frequency deviation ± 11 MHz.
Fig. 19 shows the measurement results for protection ratios as a function of the level of random noise at the output of the frequency-modulation television receiver. A colour test chart was used in recording thesecorrelations, while the detuning between the wanted and unwanted signal carriers was fixed by the maximum perceptibility of interference on the screen of the test television receiver.

Prot
ectio
n rat
io (d
B)
248 Rep. 634-1
Detuning of wanted and unwanted signal mid-frequencies, A f (MHz)
colour bars— real colour picture
colour test chartmodulation on wanted signal
FIGURE 15 — Frequency-modulation protection ratio against CW interference

Prot
ectio
n rat
io (d
B)
Rep. 634-1 249
Detuning of wanted and unwanted signal mid-frequencies, A f (MHz)
colour bars \real colour picture !■ modulation on wanted signalcolour test chart )
FIGURE 16 — Frequency-modulation protection ratio against amplitude modulation, vestigial-sidebandinterference

Prot
ectio
n rat
io (d
B)
250 Rep. 634-1
Detuning of wanted and unwanted signal mid-frequencies, A f (MHz)
O colour bars j □--------— real colour picture ) modulation on wanted signal• —— • a • —— • colour test chart )
FIGURE 17 — Frequency-modulation protection ratio against frequency-modulation interference

Prot
ectio
n rat
io (d
B)
Prot
ectio
n rat
io (d
B)
Rep. 634-1 251
30
20
10
/ iA ' l
z /
/ /
/ / A \\
*t \
/
0-30 -2 0 -10 0 10 20
Detuning of wanted and unwanted signal mid-frequencies, A f (MHz)30
—— — —— frequency-modulation television interference
— — — — amplitude-modulation television interference
. — . -— . — . CW interference
modulation on interfering signal
FIGURE 18 — Protection ratios in the case of frequency-modulation transmission of a monochromepicture (test chart)
Signal-to-random noise ratio at the output of the frequency-modulation television receiver (dB)
A: CW interferenceB : amplitude-modulation television interference C : frequency-modulation interference
FIGURE 19 — Frequency-modulation protection ratios as functions of signal-to-noise ratio

252 Rep. 634-1
The following conclusions can be drawn from these results:In the case of the wanted and unwanted signals in the same frequency channel (with identical
mid-frequencies), the protection ratio for frequency-modulated signals does not exceed 30 dB, for the reception of both monochrome and colour television signals, and is virtually independent of the picture content.
If the wanted and unwanted signal mid-frequencies are detuned, the protection ratio for the reception of monochrome television signals decreases.
For the reception of colour television signals, the protection ratio with frequency detuning initially rises, reaching a maximum (40 to 42 dB) with a detuning of ± 4 to 5 MHz, and then falls. This is due to the occurrence of wanted and unwanted signal frequency beat products in the transmission of colour television signals.
The value of the protection ratio depends basically on the random noise level in the channel at ratios of less than 50 dB between the wanted signal and the weighted r.m.s. voltage at the frequency-modulation television receiver output, and is independent of the level of random noise with ratios equal to or greater than 50 dB.
6. D iscussion of the results
Comparisons of the data presented in this Annex are difficult because of the varying test conditions used. For some parameters in the case of interference on an amplitude-modulation, vestigial-sideband system, correction factors have been deduced to enable results to be referred to the standardized conditions proposed in Table III of the Report. These parameters relate to:— deviation;— pre-emphasis;— quality grade;— energy dispersal.
For frequency-modulation systems some factors in determining the required protection ratio for common radio-frequency co-channel sharing are:— quality grade of the protection ratio assessment;— the picture signal-to-noise ratio of the wanted signal;— the deviation of the wanted signal;— the programme content of both wanted and unwanted signals.
The deviation and the signal-to-noise ratio for the unwanted signal have only minor effects upon the protection ratio. Over the range of deviations studied, the protection ratio decreases with increasing deviation of the wanted signal. Wanted signals which have large areas of colour or uniform luminance are more susceptible to interference; similarly unwanted signals having large single spectral components are more perceptible.
Results for 525-line Standard M /NTSC and 625-line Standard K/SECAM show that noise in the wanted signal tends to mask coherent interference by degrading the quality of the uninterfered with portion of the picture and by breaking up any interference patterns. Other measurements on 625-line systems show little masking by noise. It is possible that this apparent difference in system vulnerability to interference can be explained in terms of the nature of the pictures carried by the wanted and interfering signals in the various measurements and the use of different noise-weighting when specifying the luminance-to-weighted-noise ratio in different television systems. A definitive answer must await additional test data and analysis.
5.3 Conclusions
REFERENCES
BROWN, A. [1971a] Protection ratios for 625-line System I television transmissions impaired by interfering frequency-modulated television signals. BBC Research Dept., Report No. 1971/35.
BROWN, A. [1971b] Satellite broadcasting co-channel protection ratios for FM television. BBC Research Dept., Report No. 1971/19.
KANEDA [May, 1972] Carrier-to-interference ratio required for frequency sharing between FM and AM-VSB television signals, N HK Laboratories Note, No. 153.
MERTENS, H., ARNAUD, F., BROWN, A., GALIC, R. and PHILLIPS, G. J. [March, 1976] RadiodifTusion par satellites - Conception et planification des systemes k 12 GHz. Document Tech. 3220-F de l’UER, 34-35.
MILLER, E. F. and MYHRE, R. W. [1970] Frequency sharing between FM and AM-VSB television transmission systems. Communication Satellite Technology for the ’70s, Vol. I ll, AIAA, Progress in Astronautics and Aeronautics, Academic Press.
CCIR Documents[1970-74]: a. 11/49 (USA); b. 11/58 (United Kingdom); c. 11/126 (EBU); d. 11/107 (France); e. 11/339 (France); f. 11/332
(USSR); g. 11/291 (USA); h. 11/318 (EBU); i. 11/317 (EBU).
[1974-78]: a. 11/40 (Japan); b. 10/42 (Japan); c. 11/101 + 11/114 (France); d. 11/25 (EBU).

Rep. 634-1, 807 253
BIBLIOGRAPHY
MILLER, R. H. et al. [1973] Optimization in the design o f a 12 GHz low cost ground receiving system for broadcast satellites, Attachment I, Testing and assessment o f co-channel video interference on television. Center for Radar Astronomy, Stanford University, NASA, CR-121184.
CCIR Document
[1970-74] 11/321 (EBU).
REPORT 807 *
OUT-OF-BAND EMISSIONS FROM BROADCASTING-SATELLITE SPACE STATIONS OPERATING IN THE BAND 11.7 TO 12.2 GHz (12.5 GHz IN REGION 1)
(Questions 34/11 and 43/10)(1978)
1. Introduction
Space stations in the Broadcasting-Satellite Service may radiate high levels of e.i.r.p. and consequently the level of the out-of-band emissions may produce interference in networks using adjacent and harmonically related bands for other services. Some provisional results of studies are given in this Report regarding out-of-band emissions from a broadcasting-satellite space station at the lower and upper edges of the 12 GHz band.
2. Possible sources of out-of-band radiation from broadcasting satellites
The sources of out-of-band radiation into adjacent bands from a broadcasting-satellite transponder operating near the edge of a broadcasting-satellite frequency band are:— radiation due to frequency conversion;— third-order intermodulation products caused by insufficient suppression of signals in adjacent channels in the
satellite transponder branching network;— thermal noise power generated by the satellite transponder;— spreading of the signal spectrum due to non-linearities.
In the following, an attempt is made to deduce the variation of the spectral power flux-density (pfd) as a function of frequency from the band centre. The absolute values of the spectral pfd are related to the maximum pfd required for television broadcasting as given, for example, in Report 215-4.
2.1 Out-of-band radiation due to frequency conversion
Any out-of-band radiation generated by the frequency conversion process and the local oscillator source will normally be quite negligible.
2.2 Intermodulation products caused by insufficient suppression o f signals in adjacent channels
With a carefully designed branching filter inserted at a relatively linear portion of the transponder, it should be possible to suppress the signal in the adjacent channels so that the intermodulation products falling into the adjacent band are of an acceptable level.
2.3 Out-of-band thermal noise power generated by the broadcasting-satellite transponder
Thermal noise in the downlink is caused by interaction of the thermal noise and the RF carrier in the high-power amplifier due to non-linearity, by amplification and transmission of receiver noise, and by retransmission of received uplink noise.
Fig. 1 represents the calculated results [CCIR, 1974-78] for the thermal noise spectral pfd as s function of frequency. The two curves shown refer to different filtering conditions as noted in the Figure.
* This Report should be brought to the attention of Study Groups 2, 4, 8 and 9.

254 Rep. 807
t-H cd
fc' I2 aD 3
C 73
8.
O<Z>M £** 2 — J* C ^^■8 6 *GM>.
' PQ-c a ;>- TiZi u ~
2 £ £3S g.~ ■V S*6 S l B
£ Va S
O «a s
FIGURE 1 — Typical envelopes of the thermal noise power spectrum radiated by the high-power outputamplifier of a broadcasting satellite
Curves A : Transponder with typical filteringB : Estimated performance of transponder with additional filter before power amplifierC : Nominal channel bandwidth (27 MHz)
Note. — The spectra shown by curves A and B assume the presence of an rf-carrier corresponding to a power flux-density o f -94 dB(W/m2) at the centre of the beam and a carrier-to-noise power ratio of about 20 dB at the transponder output. In the absence of a carrier, the thermal noise spectrum envelopes increase by about 9 dB.
2.4 Spreading o f the spectrum o f the radio-frequency signal due to non-linearities
Band limiting on the uplink and in the transponder leads to carrier envelope variations at the input to the transponder high power amplifier. This is typically a saturated amplifier and also has AM/PM conversion, so the envelope variations will generate RF intermodulation, some of which will fall out of band. The transponder output filter is likely to be of limited loss, so it will not be likely to be very effective in removing out-of-band intermodulation near to the band.
This intermodulation will be reduced by increasing the bandwidth of the uplink and of the transponder preceding the high power amplifier, but this will increase the system noise bandwidth (see § 2 .3).
The actual spectrum radiated by the satellite largely depends upon the television signal transmitted. In Fig. 2 are presented computer calculated results on this subject [CCIR, 1974-78] for illustrative purposes. The signal used in the calculations of Fig. 2, curve B, was a television test signal in line 330, with a peak-to-peak deviation of 13 MHz. The signal used in the calculation of Fig. 2, curve A, consisted of 100% saturated colour bars. It should be noted that such a signal is not used in normal broadcasting. A sound sub-carrier with a peak-to-peak deviation of 5.6 MHz was associated with both television signals.
3. Protection of other services from out-of-band emissions
3.1 Fixed-satellite service
Report 712 addresses the protection of fixed-satellite earth stations operating in adjacent bands against out-of-band emissions from 12 GHz broadcasting-satellite space stations and gives the values of maximum allowable power flux-density (pfd) at the edge of the band that would produce no more than 500 pWOp of interference in the worst channel of an FDM /FM carrier in the Fixed-Satellite Service whose space station is collocated and serves the same area.
Guard bands necessary to protect the services operating in adjacent bands are discussed in § 3.9 of Annex 8 to the Final Acts of the WARC (BS).

Rep. 807 255
FIGURE 2 — Typical out-of-band envelopes of the radio-frequency spectrum radiated by atelevision broadcasting satellite
Curves A : Envelope for 100 per cent colour-bar baseband signal, modulator AC coupledB : Envelope for line 330 insertion test signal, modulator AC coupledC : Nominal channel bandwidth (27 MHz)
Note 1. — For the left-hand scale, it is assumed that the e.i.r.p. of the satellite corresponds to a powerflux-density of -94 dB(W/m2) at the centre of the beam for an unmodulated carrier.Note 2. — Minimum energy dispersal of ± 7.9 kHz is assumed.Note 3. — Pre-emphasis according to Recommendation 405-1 is assumed.
3.2 Fixed and mobile services
Out-of-band emissions from broadcasting-satellites into Fixed and Mobile Services are discussed in Report 789.
3.3 Radioastronomy Service
Harmonically related out-of-band emissions into the 23.6 to 24.0 GHz radioastronomy band are discussed in Annex II of Report 697.
4. Conclusions
It is concluded that the out-of-band radiation from a broadcasting-satellite space station may not be negligible and is caused primarily by thermal noise and by frequency modulation of the carrier by the video waveform chosen. Based on the most up-to-date information, the curves of Fig. 2 (which were calculated for different examples of television signals including the likely worst case) can be used, where appropriate, to deduce the width of possible guard bands between the 12 GHz band and adjacent bands used for other services. If it ispracticable to use improved filters at the output of the broadcasting-satellite transponder which have steeperchannel edge decay rates then the guard bands could be reduced [WARC-BS, 1977].
References have also been provided relating to the requirements of the Fixed-Satellite, Fixed, Mobile and Radioastronomy Services in terms of out-of-band emissions into adjacent and harmonically related frequency bands, which must be accounted for in the design of the space segment of the broadcasting-satellite system.
REFERENCES
WARC (BS), [1977] Final Acts: Recommendation No. SAT-6 “To the CCIR relating to spurious emissions in the Broadcasting Satellite Service”.
CCIR Document [1974-78]: 11/117 (Italy).

256 Rep. 808
REPORT 808 *
BROADCASTING-SATELLITE SERVICE
Space-segment technology(Questions 23-2/11, 34-2/10,Study Programme 34B/10)
(1978)1. Introduction
1.1 General
The large coverage area possible from a satellite-borne radio transmitter, especially on a satellite in the geostationary orbit, and the supporting technology which is available at present, will make possible the establishment of a broadcasting service to the general public. An earth-station transmitter could direct programme material to the satellite which, in turn, would broadcast this material over a wide area to individual or community receivers.
The technology applicable to the space segment of the broadcasting-satellite service is similar in many respects to the technology applicable to other satellite services. In a few areas, however, the technology needed for the broadcasting-satellite service will differ from that required in other services, and will require specialized research and development. These specialized areas include the generation of high RF power, high efficiency radio frequency generators, effective methods of heat conduction and dissipation from these high power RF sources, and the design and development of spacecraft antennae having low side-lobe levels and asymmetrically shaped beams.
The following sections of this Report are confined to discussions of these aspects of satellite design technology, apart from the last three mentioned above.
2. Primary power **
2.1 Solar arrays
As a result of the increase in power requirements, attention has been directed to the use of light-weight sun-oriented arrays. Most of the interest is centred around photo-voltaic cells mounted on a flexible substrate which is either folded, or rolled on a drum during launch and transfer orbit [Ray and Winicor, 1966]. Deployment methods take several forms, as indicated in Annex I.
A 1.5 kW roll-out array has been successfully flight tested. Present estimates suggest that a reliable 12 kW (decreasing to 10 kW at the end of five years) roll-out array could be designed. The performance characteristics which might be expected from new developments in light-weight, deployable solar array technology are summarized in Annex I.
The ratio of primary power capability to the mass of broadcasting satellites in the geostationary orbit is dependent to some extent upon the attitude stabilization utilized (spin stabilized or 3-axis stabilized). A spin stabilized spacecraft in general will require more mass than a 3-axis stabilized spacecraft to provide equal prime power. Fig. 1 shows the beginning of life; prime power and in-orbit mass for several representative spacecraft. The ratio o f “beginning-of-life” to “end-of-life” power for a lifetime of 7 years is of the order of 1.3 to 1. The figure also indicates the approximate date at which the particular design was “frozen”. The higher ratio of prime power capability-to-mass for the CTS and BSE spacecraft compared with the other examples results from the fact that they do not carry multiple transponders and the associated filters.
A solar array does not provide power during passage in the shadow of the Earth. With a geostationary satellite there is one eclipse each day, but only within the periods of approximately 27 February to 12 April and 1 September to 15 October. Near the centre of these periods, the eclipse lasts about seventy minutes about midnight at the satellite longitude; the duration is less towards the beginning and end of the periods (see Fig. 2). In the case of longer eclipses, sufficient warm-up time must be allowed after the end of the eclipse. In the past, about half an hour has been required.
Batteries can be employed to provide a limited operational capability during eclipse, but to provide a full operational capability would greatly increase the weight of the satellite. The practical consequences of eclipse outage can be minimized by having the service break occur after midnight in the service area, by placing the satellite to the west of its service area.
Arrays of silicon solar cells have served quite satisfactorily as the prime power source in satellites and are likely to be employed in this application for many years to come. The theoretical limit (approximately 25%) on the efficiency of silicon solar cells is much higher than the efficiencies now being realized. Therefore, several efforts are under way to improve the efficiency of the silicon solar cell [Lindmayer and Allison, 1973; Revesz, 1973; Arndt, 1974; Statler and Treble, 1974; Haynos, et al., 1974].
* This Report should be brought to the attention of Study Group 4.** See also Report 673.

Rep. 808 257
1000
500
200
100100 200 500 1000 2000 5000
Prime power (W)
FIGURE 1 — Relationships between in-orbit mass and prime power at beginning of life
CTS (Communications technology satellite)BSE (Japanese experimental broadcasting satellite)W/U (Western Union WESTAR)ANIK (Canadian communications satellite)DSCS (Defense satellite communications system)OTS (Orbiting test satellite)Note. — Dates in parenthesis indicate approximate date at which the design was finalized.
2.2 Other power sources
Nuclear reactors and fuel cells are possible sources of primary power, but additional development will be required before they will be competitive with solar arrays in terms of cost, mass and reliability.
Thermoelectric junctions and thermionic cells may also be considered as a means of converting heat from the Sun or from isotope sources into electrical energy, and offer the possibility of less total mass in the power unit for a given electrical input. Work is in progress on the development of such devices and their application to spacecraft [IEE, 1968].
3. Radio-frequency power
3.1 Summary o f radio-frequency power limits
The final stage of the broadcasting transmitter is the major consumer of power on the satellite. Solid-state transmitter modules for a frequency of about 860 MHz and at power levels of about 100 W have been demonstrated by the USA on the Applications Technology Satellite (ATS)-6 . Twenty-watt solid state transmitters at 2.6 GHz have also been demonstrated on ATS-6 . Appreciably higher powers, particularly at higher frequencies, will require vacuum tubes. For the frequency range 2 to 20 GHz, travelling-wave tubes or klystrons might provide maximum powers in the range of 1 to 7.5 kW, depending on the frequency. An efficiency of 35 to 65%, including any loss in power conditioning units, can be achieved with these systems. A 200 W travelling-wave tube with an efficiency of about 50% at 12 GHz is being used in the US/Canadian Communications Technology Satellite Programme.
• CO Ml>TAR
r e 9 4 wOT! >R : a S t kTCOM (1‘ 74)
</U (197
3SE (19 75) • • O _—1 _
_
'S (1973 )
AN IK (1972 ) • 3)

258 Rep. 808
March April« * «----------------
25 7 17 27 6 16
September October*------------------------------------------------------ ► 4-------------------
FIGURE 2 — Shadow time during equinoctial periods in the synchronous orbit
— —— Full eclipse— — — - Partial eclipse
A graphical summary of some of the technical factors that limit radio-frequency power is shown in Fig. 3. The total radio-frequency output power is limited by the solar array power, the losses in the power conditioning sub-system, and the transmitter efficiency. The output power of a single tube is limited by cathode loading and beam compression. The power in a waveguide component is limited by radio-frequency breakdown and heating. Other factors which impose practical constraints on spacecraft transmitter power include spacecraft weight, power flux-density limits applicable in particular frequency ranges, and the consequences of interference of the efficient use of the geostationary arc.
The data presented in Fig. 3 represents the technology applicable to economically viable spacecraft in the 1976-1990 time frame. It is recognized that terrestrial generation of radio-frequency power may considerably exceed these values.

Rep. 808 259
<M 0,2 05 1 2 5 10 20
Frequency (GHz)
FIGURE 3 — Technical factors limiting the maximum possible radio-frequency power from satellites asa function offrequency
A : single waveguide (radio-frequency breakdown)B : single tube (cathode loading)C : single waveguide (beating)
3.2 Equivalent isotropically radiated power
Combining the factors shown in Fig. 3 with gain limitations, an estimate of maximum e.i.r.p. that will be technically feasible can be derived as a function of frequency (Fig. 4). A 12 m antenna having been assumed, the zone of coverage obviously will decrease with increasing frequency.
For a given zone of coverage, say 2°, maximum values of e.i.r.p. of 75 dBW at 700 MHz and perhaps 70 dBW at 12 GHz can be expected with still higher powers likely to be technically feasible at a later date.
3.3 Thermal control
The major problems are associated with heat rejection from the power conditioning components and from the high-power stages of the transmitter. Solid-state components lend themselves to simple passive methods of control. However, the low operating temperatures (350 K to 390 K) require a significant amount of radiator area. Other devices, such as gridded tubes and microwave tubes, have high heat dissipation densities and high temperatures. The higher operating temperatures (470 K to 500 K) minimize the radiator area requirements.
The development of heat pipes provides a promising method of heat transfer from the source to the radiator. Heat pipes have been used for thermal control on spacecraft [Anand, 1968] and in heat rejection from high power tubes on the ground.
4. Station keeping and attitude control
4.1 Station keeping
The slight inequalities in the gravitational field of the Earth, together with the gravitational forces due to the Sun and Moon have perturbing effects on satellites which otherwise would remain stationary, but these can be encountered by orbit correction or “station-keeping” techniques.
A geostationary satellite will experience extremely slight eastward or westward forces which change the longitudinal drift of the satellite.

260 Rep. 808
Frequency (GHz)
FIGURE 4 — Factors limiting the maximum possible e.i.r.p. as a function of frequency
D: antenna size (12 m diameter)E : beam pointing accuracyF : surface tolerance of reflectorG : requirement for very reduced side lobes
Other perturbing forces tend to change the inclination of the orbital plane by approximately 0.8° per year, thereby causing the satellite to undergo corresponding daily variations in latitude.
Present station-keeping techniques develop corrective thrust to overcome the gravitational forces by the use of small propulsion jets on the satellite, operated by propellants stored on board. The extent to which correction is required depends upon the allowable displacement of the satellite.
East-West (longitudinal) station-keeping is usually essential, because the uncorrected drift may be relatively large and rapid. Fortunately, the required rate of propellant consumption is very low. North-South (latitudinal) station-keeping, to keep the orbit close to the plane of the equator, will become more important as satellites achieve longer life. Latitude station-keeping requires about ten times the amount of propellant as does longitude station-keeping.
For frequencies up to 1 GHz, where the required beamwidth of the receiving antenna is not expected to be less than 5°, a station-keeping accuracy of 1° will be sufficient to ensure that the satellite remains in the beam of receiving antennae. Above 1 GHz, accuracies of the order of 0.25° may be required. The longitudinal drift for satellites at present in the geostationary orbit can be held to 0 .1° during a satellite lifetime of at least five years. Satellites now under construction will be capable of controlling the daily variation in latitude to the same accuracy. Station-keeping techniques for achieving the orbital accuracy required for a geostationary broadcasting satellite are, therefore, technically feasible.
Station-keeping of the order of 0.1° is desirable to maximize the efficiency of utilization the geostationary satellite orbit spectrum space. As a general rule, satellite drift should be limited to 5% or less of the spacing between adjacent satellites.

Rep, 808 261
The pointing accuracy of the satellite antenna beams is very important in satellite broadcasting in order to obtain the best utilization of the antenna directivity. On the other hand, solar pressure and thermal gradient are the causes of depointing of the satellite antenna beams. To maintain the pointing of the antenna, it is therefore, necessary to control the attitude of the satellite with as high an accuracy as possible. This accuracy depends mainly on the type of sensor and on the system chosen for the attitude control.
Attitude control must be provided for at least the pitch and roll axes of a geostationary satellite having an axially symmetrical antenna beam. If the antenna beam is asymmetrical, then it becomes necessary to control the yaw axis as well, to maintain coverage of the desired service area and to minimize spillover.
The pointing accuracy which can be achieved depends on the types and quality of attitude sensors employed for each axis.
With the present state of technology for controlling the pitch and roll error of a spacecraft, the boresight error circle of the transmitting antenna should be capable of being maintained within 0.2°. With the introduction of improved systems (e.g., radio-frequency sensing; see § 4.4, Report 546-1) this radius could be reduced to 0.1°. Studies performed in the USA and Europe indicate that eventually an accuracy o f 0.05° can be achieved for a significant and predictable portion of the operational lifetime.
Stabilization of motion around the yaw axis (the line joining the satellite and the centre of the Earth) to within ±0.1° has already been demonstrated in orbit with the ATS-6 satellite by using star sensors [Redisch, 1975].
The relationships between attitude errors and movement of the antenna footprint on the Earth’s surface are described in Report 546-1. A range of values is given, reflecting future developments in recognition of the critical effect of pointing error on planning.
5. Transmitting antennae
The maximum gain of an antenna and the way in which the gain decreases as a function of angle is important in interference calculations. Therefore, guidelines are required as to the probable performance of transmitting antennae for satellite broadcasting and of receiving antennae on the ground. A detailed examination of antenna patterns and technology is given in Report 810.
6 . Coverage
The area of the Earth covered by a satellite antenna beam, and the shape of that area, depend on the satellite antenna pattern perse, and also on the pointing offset of the beam from the satellite nadir (the sub-satellite point). Since the satellite is not at the origin of the terrestrial co-ordinate system, the antenna pattern co-ordinates are not linearly related to the terrestrial co-ordinates. Methods for calculating Earth “footprints” of satellite antennae are available in the literature [for example, Jacobs and Stacey, 1971; Adamy, 1974].
7. Lifetime
Current system planning assumes a mean satellite life of about seven years. So far, studies and the performance of satellite systems encourage the view that a life expectancy of up to ten years can be achieved by careful design and provision of certain reserve equipments. In particular, the solar panels must be large enough to allow for the progressive deterioration that takes place in space. Fuel requirements for station-keeping and attitude stabilization may well be large, possibly of the order of 20% to 25% of the mass of the satellite if existing techniques are employed.
4.2 Attitude control
REFERENCES
ADAMY, D. L. [December, 1974] ESV (Earth Satellite Vehicle) antenna footprints. The M icrowave Journal.
AN AND, D. K. [June, 1968] Heat pipe application to a gravity-gradient satellite (EXPLORER XXXVI). Proc. o f the AMSE Aviation and Space Conference, Los Angeles, USA.
ARNDT, R. A. [1974] Effects o f radiation on the violet solar cell. COM SAT Tech. Rev. 4, 41-52.
HAYNOS, J., ALLISON, J., ARNDT, R., and MEULENBERG, A. [September, 1974] The COMSAT non-reflective silicon solar cell: a second generation improved cell. Intemat. Conference on Photovoltaic Power Generation, Hamburg, Federal Republic o f Germany, 487-500.
IEEE [1968] Institution of Electrical Engineers. Colloqium on direct broadcasting from satellites. Colloqium Digest No. 1968/24.
JACOBS, E. and STACEY, J. M. [1971] Earth footprints o f satellite antennae. IEEE Transactions on Aerospace and Electronic Systems, Vol. AES-7, 2.
LINDMAYER, J. and ALLISON, J. F. [1973] The violet cell: an improved silicon solar cell. C OM SAT Tech. Rev. 3, 1-21.

262 Rep. 808
RAY, K. E. and WINICOR, D. H. [1966] Large area solar cell array, space power systems engineering. Progress in Astronautics and Aeronautics, Vol. 16 Academic Press, 979-1003.
REDISCH, W. N. [1975] ATS-6 description and performance. IEEE Trans, on Aerospace and Electronic Systems, Vol. AES-11, 994-1003.
REVESZ, A. G. [1973] Vitreous oxide anti-reflection films in high-efficiency solar cells. COM SAT Tech. Rev. 3, 449-452.STATLER, R. L. and TREBLE, F. C. [1974] Solar cell experiments on the TIMATION III satellite. Intemat. Conference on
Photovoltaic Power Generation, Hamburg, Federal Republic o f Germany, 369-377.
ANNEX I
DEVELOPMENT OF LIGHT-WEIGHT SOLAR ARRAYS
The purpose of this Annex is to summarize the performance characteristics which might be expected from new developments in the technology of light-weight, deployed solar arrays. It provides a summary of development on light-weight solar arrays and may serve as a basis for determination of future research and development work in this area.
During the past several years there has been a considerable effort by a number of organizations to develop lightweight, deployed solar arays. Two distinct types of solar arrays have been studied; namely, deployed, rigid arrays and deployed, flexible arrays.
The deployed, rigid arrays have been exclusively the foldout type either folded around the satellite body during transfer orbit or contained in a flat pack, accordion fold, arrangement during transfer orbit. Deployment occurs in several steps usually commencing with the pyrotechnic release of latches or the cutting of cables. Depending on the type of array, the deployment continues with the solar panels unfolding, followed by the extension of a yoke mechanism to separate the array from the spacecraft. The deployed array is normally locked in place at the panel hinges. With a rigid array, transfer orbit power is readily obtained from the outer side of the stowed panels.
There are two basic types of deployable, flexible substrate arrays; foldout and rollout. The foldout solar arrays use a flat pack concept to contain the solar cell blanket during launch. The deployment sequence begins with the pyrotechnic opening of a box or release of latches or cables holding the array against the spacecraft body. Deployment of the folded blanket takes place by extension of a pantograph, a boom, or a telescopic mast system attached to the blanket. During transfer orbit, the rollout array is wrapped around a drum attached to the spacecraft. During deployment, the solar cell blanket is rolled out by the extension of a boom which is attached to the blanket. For both foldout and rollout systems a yoke is used to separate the array from the spacecraft.
A major advantage of flexible, foldout systems over flexible, rollout systems is their inherent higher packing density, since no drum is required. This allows for easier integration of a foldout system to a spacecraft within a launch fairing. Usually for both types of flexible arrays an additional array is required to provide transfer orbit power during launch to geostationary orbit. In some advanced foldout, flexible designs this power is provided by incorporating the transfer orbit panels into the flexible array.
Table I shows the weight-to-power and power-to-weight ratios for several deployed, rigid solar arays. This Table is based on a one kilowatt wing of a two kilowatt solar array system. It first lists the weight-to-power at beginning of life, equinox conditions, including the array with its blanket, deployment, yoke, and stowage systems. The orientation mechanism weight-to-power ratio is broken out separately as is an estimated miscellaneous category to cover redundancy items such as redundant orientation mechanism motor windings and/or electronics, redundant latching, insulation, etc. The power-to-weight ratio at end of life (5 years) summer solstice conditions is also given. Finally, the effect of advanced cells on the power-to-weight ratio is shown. The end effect on the overall array of changing to advanced cells was estimated at 15 per cent which was assumed uniformly. It should be noted in Table I and later, in Table II that in going from a designed or tested solar array system to a flight-qualified array, extra weight is estimated to provide for redundancy, temperature control, etc. It is even more evident when the Fleetsatcom or CTS and FRUSA numbers are compared to the typical early design numbers. Several examples of rigid solar arrays are shown. The first one listed which is being developed for an operational spacecraft is Fleetsatcom. The Fleetsatcom array is a rigid deployable array, initially folded around the periphery of the spacecraft. It uses conventional aluminium honeycomb substrates and solar cells.
The Messerschmitt-Bolkow-Blohm GmbH (MBB) improved composite structure (ICS) array uses aluminium honeycomb substrates and carbon fibre reinforced epoxy (CRFP) facesheets in a flat pack design with the deployment energy supplied by spiral springs on the panel hinges. This concept will be used on the ESA, OTS and MAROTS satellites. The ultra lightweight panel (ULP) is an advance on the ICS system using the same deployment approach but including a carbon fibre framework and very lightweight solar panels. The Matra system uses a flat pack design with aluminium honeycomb substrates and glass fibre faceskins. Deployment is by springs and hinges along with a cable and pulley system.
The MBB-ICS system shown utilizes 125 micron solar cells whereas the Matra analysis is based on 200 micron solar cells. Consequently, the MBB-ICS system is lighter and shows less degradation than the Matra system, at the end of five years. However, the availability of 125 micron cells in the large quantities necessary for production spacecraft is questionable. These systems may have to depend on the heavier cell.

Rep. 808
TABLE I — Comparison between deployable rigid solar arrays
263
Type o f array
FLEETSATCOM TRW - conven
tional, rigid
foldout
MBB-ICSfoldout(carbon
fibre)
MBB-ULP (very light materials)
Matra foldout
(glass fibre technology)
Flight type arrays
Next 3-5 years (ESTIMATE)
Flight type arrays
Post 1980 (ESTIMATE)
Array, including deployment and stowage, at beginning o f life Equinox (kg/kW) 54.0
A B0) A B0) A B0)
31.0 31.0 18 18 28.6 28.6
Orientationmechanism (kg/kW) 7.7 (4.3) (3.4) (4.3) (3.4) (4.3) (3.4)
Miscellaneous!2) (kg/kW) Included in above (1.5) (1.5) (1.5)
Total at beginning o f life Equinox (kg/kW) 61.7 36.8 34.4 23.8 21.4 34.4 32.0 35-50 25
Total at beginning o f life Equinox (W /kg) 16.2 27.2 29.1 42.0 46.7 29.1 31.3 20-29 40
Total at end o f life 5 years,summer Solstice (W /kg) 11.4 20.9 22.4 27.7 30.8 20.4 21.9 14-20 26
Total at end o f life(5 years) summer Solsticeif advanced cellsare used (W /kg) 13.1 24.1 25.8 31.9 35.4 23.5 25.2
Included in above
Reference [1 ] [2 ] [3] [4]
( ) Assumed value, since a real value is not provided.0) Column B uses a lighter weight suggested by the Royal Aircraft Establishment (RAE) for the orientation mechanism and
excludes any miscellaneous items.(2) Includes any redundancy required in the orientation mechanism; for example, motor windings, any insulation required,
redundant latches, etc.
The last two columns represent an estimate on weight-to-power for conventional, flight-type systems for near term application within the next 2 to 5 years and advances flight-type systems for use in the post-1980 time period, respectively.
Table II is similar to Table I except that it concerns flexible substrate solar arrays. It includes data on several solar arrays. The array developed by Societe Nationale des Industries Aerospatiales (SNIAS) uses a pantograph, foldout system with launch stowage in an aluminium honeycomb-walled box. The pantograph is spring loaded and self deploys when released. The rate is controlled by a winch and motor. The solar cells are mounted on a Kapton substrate designed in modular form to be useable for different power levels.
The Royal Aircraft Establishment solar array, based on the background of a 280 W hardware development programme, as proposed, would use a pneumatically actuated telescopic mast to deploy a lightweight flexible, foldout panel using 125 micron wrap around contact solar cells. The lightweight orientation mechanism is based on design estimates by Hawker-Siddeley Dynamics. RAE also indicates that transfer orbit power could be provided by a lightweight rigid panel which would be part of the flexible array. As with the MBB-ICS sytem, the RAE estimates are based on using the 125 micron cells; consequently, the degradation rate is less than with other systems.

264 Rep. 808
The Communications Technology Satellite (CTS) array is a flexible, foldout array deployed by a Bi-Stem boom. This satellite was launched in January 1976. The data given is based on direct scaling of the actual array. Since the CTS array consists of two wings with approximately one kilowatt total at end of life, it is not optimized as a one kilowatt/wing system. Consequently, the numbers shown are heavier than would be expected in a two-wing, one kilowatt per wing array. On the basis of one kilowatt per wing, the CTS system would be expected to achieve at least 20 W/kg at the end of life.
The flexible rolled-up solar array (FRUSA) system is a flexible rollout solar array deployed by a Bi-Stem boom. The FRUSA array was built by Hughes Aircraft Company and launched in 1971. It performed successfully and provided several months of useful data.
The last columns in Table II are the estimates on weight-to-power for flight-type flexible solar arrays for use in the next three to five years and, similarly, for advanced flight-type systems for use in the post-1980 time period. It must be stressed that in both Tables I and II these are estimates based on information available at present. Particular missions or new, unique types of arrays could change these estimates.
TABLE II — Comparison between deployable, flexible solar arrays
Type o f arraySNIASflexiblefoldout
RAEflexiblefoldout
CTSflexiblefoldout
HughesPRUSAflexiblefoldout
Flight- type
arrays Next 3-5 yrs
(ESTIMATE)
Flight- type
arrays Post-1980
(ESTIMATE)
Array, including deployment and stowage, at beginning o f lifeEquinox (kg/kW ) 23.0 16.6 37.7 35.8 .
Orientationmechanism (kg/kW) 4.3 3.4
Included in above
Included in above — —
Miscellaneous (') (W /kg) 1.5Included in
aboveIncluded in
above — —
Total at beginning o f life Equinox (kg/kW ) 28.8 20.0 37.7 35.8 25-35 18
Total at beginning o f life Equinox (W /kg) 34.7 50.0 26.5 27.9 29-40 56
Total at end o f life 5 years, summer Solstice (W /kg) 22.9 36.2 17.5 18.4 19-26 37
Total at end o f life(5 years) summer Solsticeif advanced cells are used (W /kg) 26.3 41.6 20.1 21.2
Included in above
Reference [5] [6 ] [7] [ 1]
(') Includes any redundancy required in the orientation mechanism; for example, motor windings or electronics; any insulation required; redundant latches, etc.
The data in Tables I and II are based on the following sources:
[1] BILLERBECK, W. J. and CURTIN, D. J. [1974] Flexible solar array applications in communications satellites. Proc. Intersociety Energy Conversion Engineering Conference, San Francisco, California, USA.
[2] CRABB, R. L. and SCHNIEDER, K. [1973] Development o f an advanced lightweight rigid solar array. Conf. Rec. Tenth IEEE Photovoltaic Specialists Conference, 306-316.
[3] KOELLE, D. E. [1974] Advanced lightweight rigid solar arrays based on carbon fibre technology. Intemat. Astronaut. Fed., XXVth Congress, Amsterdam, Holland.

Rep. 808, 809 265
[4] LARSSON, H. [1973] Problems o f development and test o f large lightweight solar arrays. Proc. Intemat. Congress, “TheSun in the Service o f Mankind”, Paris, France.
[5] BARKATS, G. [1973] Development o f flexible, fold-out solar aray. Proc. Intemat. Congress, “The Sun in the Service o fMankind”, Paris, France.
[6] TREBLE, F. C. [1974] The RAE lightweight solar array. Royal Aircraft Establishment Technical Report 73172. (Numbers contained in this report were upgraded to a 1 kW system by F. C. Treble).
[7] SACHDEV, S. S. QUITTNER, E. and GRAHAM, J. D. [September, 1974] The communications technology satellitedeployable solar array sub-system. Intemat. Conference on Photovoltaic Power Generation, Hamburg, Federal Republic of Germany.
ANNEX II
Annex II gives a representative summary of pointing accuracies obtained with American communication satellites in 1976.
Error (degrees)Item North-South East-West
Long-term variations:— station keeping, ± 10.02 ± 0.01— attitude determination, ± 0.01 ± 0.01— antenna thermal distortion ± 0.04 ± 0.04— attitude drift ± 0.1 ± 0.1
Sum of square roots ± 0.11 ± 0.11Short-term variations:
— spin (pitch), not available ± 0.035— nutation, ± 0.04 ± 0.02
Total error ± 0.150 ± 0.185
REPORT 809 *
SHARING OF THE 11.7 TO 12.2 GHz FREQUENCY BAND BETWEEN THE BROADCASTING-SATELLITE SERVICE
AND THE FIXED-SATELLITE SERVICE
(Study Programmes 20C-2/10 and 2G-2/11)(1978)
1. Introduction
1.1 WARC-BS
The World Administrative Radio Conference for planning the Broadcasting-Satellite Service in the frequency band 11.7 to 12.2 GHz (11.7 to 12.5 GHz in Region 1) met in Geneva, Switzerland, in January 1977 and took the following action [WARC-BS, 1977]:— it adopted a detailed orbital position and frequency assignment Plan for the Broadcasting-Satellite Service in
Regions 1 and 3.— it adopted a set of provisions governing the Broadcasting-Satellite Service in Region 2 pending the
establishment of a detailed plan. These provisions include division of the available orbital arc into separate segments for the Broadcasting-Satellite Service and the Fixed-Satellite Service, and a Regional Administrative Conference to be held not later than 1982 for the purpose of carrying out detailed planning for the Broadcasting-Satellite and Fixed-Satellite Services in Region 2 (see Recommendation No. Sat-8 of the WARC-BS, 1977.
Note. — Regions 1, 2 and 3 are defined in Article 5, Section 1 of the Radio Regulations (1976).
1.2 Problems o f Region 2
Region 2 is the only one of the three ITU Regions in which the services to which the 12 GHz band is allocated include the Fixed-Satellite Service. Therefore, sharing between the Broadcasting-Satellite Service and the Fixed-Satellite Service is primarily of concern to Region 2; although some sharing problems exist between the Broadcasting-Satellite Services of Regions 1 and 3 on the one hand and the Fixed-Satellite Service of Region 2. These latter problems will be discussed in § 7.
This Report should be brought to the attention of Study Group 4.

266 Rep. 809
There are additional significant differences between Region 2 on the one hand and Regions 1 and 3 on the other. There appears to be little interest in terrestrial services in the 12 GHz band in Region 2 since other, more desirable frequency bands are available and little exploited, while in Regions 1 and 3 the desire for early implementation of terrestrial services in this band was the main motivation for the 1977 WARC-BS. Most of Region 2 is separated from the other regions by large bodies of water with the regional boundaries running predominantly from north to south. There appears to be considerable interest from at least some countries of Region 2 in a variety of Broadcasting-Satellite Services; in addition to individual reception, which might be included in the community reception category. And the total number of Administrations in Region 2 is only about one quarter (about 35) of those in Regions 1 and 3 (about 140). All these factors affect the sharing problems between the two space services in Region 2.
Some of the rules governing this sharing have been adopted by the WARC-BS in 1977.
1.3 Uplinks
By definition, the Earth-to-space links of broadcasting-satellite systems are part of the Fixed-Satellite Service. The problems associated with the sharing of these uplinks are discussed in Report 561-1 and will not be treated in this Report.
2. Sharing among dissimilar networks
The problem of sharing between the Broadcasting-Satellite Service and the Fixed-Satellite Service, particularly on the space-to-Earth paths, is a problem of sharing between dissimilar (inhomogeneous) networks. In general, situations of this kind tend to decrease the total number of available channels (though not necessarily the total number of downlinks) unless steps are taken to circumvent it. The factors that tend to enhance orbit-spectrum utilization are reasonably well understood. The extent to which these factors can actually be exploited depends on many operational, economic and design constraints.
3. Sharing approaches for Region 2
Two basic approaches to sharing between the two space services appear technically feasible; spectrum division and orbit division. They are described below as if they were mutually exclusive. However, it must be remembered that certain combinations of the two are also possible.
The WARC-BS, Geneva, 1977, made a decision with respect to these two approaches by adopting an arc segmentation plan for Region 2. This is in full accord with the clustering principle discussed below (see § 4.6), but does not rule out the use of spectrum division in some cases involving systems with widely differing characteristics.
3.1 Spectrum division
Sharing between the Broadcasting-Satellite and the Fixed-Satellite Services represents a problem primarily because of the disparity normally encountered in typical system parameters for these two services. This difficult interface can be eliminated by the simple expedient of dividing the band in question into two non-overlapping bands and allocating one to each of the two services. Although each service has only a part of the spectrum in the band, it can use the entire orbital arc visible from its service area without co-ordination with the other service.
As explained in § 6 , spectrum permits a utilization by each service, of the orbit and spectrum that is very nearly equal to the fraction of the spectrum asigned to that service. Apart from the difficulty of knowing what the appropriate division is, the overriding potential disadvantage of this method is economic since a given traffic flow may require a greater number of satellites than would be necessary if each service could use the entire band, provided of course, that a particular user’s needs are sufficiently large and that bandwidth limitations are a significant factor. This is less likely to be the case with high-powered broadcasting satellites. The necessity for multiple satellites, if it arises, further complicates both the transmitting and receiving earth stations, which generally would have to be able to access all the satellites. Depending upon the operational constraints, these multiple satellites may have to be accessed simultaneously; this implies multiple antenna feeds, or possibly separate antennae if the satellites are sufficiently separated.
3.2 Orbit division
By orbit division is meant that approach in which the entire ban/* is available to both the Fixed-Satellite and the Broadcasting-Satellite Services, and where efficient use of the orbit is maintained by careful co-ordination of the positions assigned to the satellites of different services.
As explained in § 6 , orbit division permits utilization of the orbit and spectrum to a degree equal to, and in some cases greater than, that possible with spectrum division. This was recognized by the WARC-BS, 1977 when it adopted an arc segmentation plan for Region 2. It is believed that, under certain assumptions about system characteristics, particularly e.i.r.p. differences between different systems, the economic and technical advantages of orbit division [Reinhart, 1974] outweigh its possible operational disadvantages. However, spectrum division may be preferable in some cases when system characteristics differ widely, provided that no additional interference is created nor additional protection is required.

Rep. 809 267
4.1 Need for principles
It has been shown in several studies [Reinhart, 1974] and also in Report 633-1 that the capacity of the spectrum-orbit resource can be increased significantly by adherence to certain sharing principles as described below. Some of these techniques are also discussed in Report 453-2 and in Annex 7 to the Final Acts of the WARC-BS, 1977.
4.2 Orthogonal polarization
Orthogonal polarization offers a potential for a significant decrease in mutual interference and, therefore, increased spectrum orbit utilization. When used in conjunction with frequency interleaving, it may produce a degree of discrimination sufficient to allow re-use of the frequency band in the same satellite system. When used in adjacent satellites, the additional discrimination may allow the spacing between them to be decreased to about one half, in many cases. For some systems, maintaining the correct polarization angle at all the receiving installations may introduce undesirable complexities which must be considered before the principle can be implemented.
It should be noted that the principle does not say that adjacent satellites should always use opposite polarization. Rather, it says that polarization should be used in the most efficient manner. For example, if the service areas of two satellites are far enough apart, the satellites can be placed very close together even when co-polarized. A third satellite possibly serving an area much closer to the area served by the first one, may then use an opposite polarization.
These observations are largely based on the design practices of existing 4 and 6 GHz systems. The full realization of these advantages in the 11.7 to 12.2 GHz band has yet to be confirmed. The use of these techniques is also discussed in Report 555-1 and in Report 814.
4.3 Frequency interleaving
Frequency interleaving, or the technique of offsetting the carrier frequencies of one satellite (or one set of transponders in a single satellite) relative to the carrier frequencies of another, is used in order to reduce interference. The principle proposed is that this technique should be used wherever practical. Again, the principle does not say that frequency interleaving should be used on adjacent satellites. Rather, it should be used in such a way as to lead to the most efficient spectrum orbit utilization. Generally, that means that the frequencies should be interleaved in satellites serving relatively near areas, but need not be in satellites serving widely separated areas.
The implementation of the frequency interleaving principle may encounter difficulties when different systems use transponders with widely varying bandwidths, and with multi-carrier signals. Some advantage may still be possible from the use of frequency interleaving, but the principle must be stated in a generalized form in terms of avoiding coincident carrier frequencies.
4.4 Paired service areas
Widely separated service areas permit greatly reduced satellite spacings. When all the reasonable service areas both of the northern and of the southern hemisphere of Region 2 are surveyed, it is found that they can be paired in such a way that the minimum spacing between the members of a pair is large enough to allow the total number of satellites to be doubled (as compared to a homogeneous set serving adjacent areas) by placing an additional satellite serving a remote area between two satellites serving adjacent (or near) areas.
The possibility of arranging service areas in sets of three, with the service areas of any two of the three separated by some minimum amount, should not be dismissed. It would lead to a further increase in spectrum-orbit utilization, but was not further considered here.
The application of this principle may be somewhat restricted by geographical considerations. In some cases, the areas best suited to be paired with a given service area are entirely over water. Nevertheless, most service areas in South America have corresponding service areas in North America with which they can be paired. Thus, this principle is a useful one in Region 2.
4.5 Crossed-path geometry
The principle proposed here is that adjacent satellites should serve areas separated by at least one other service area. This is referred to as “crossed-path geometry”. It can be shown that use of this technique may lead to considerable improvements in orbit-spectrum utilization. However, when the total available arc is small the use of adjacent satellites for the same service area may become unavoidable.
4.6 Clustering
Analyses have shown that appropriate clustering of satellites leads to more efficient utilization of the orbit than the random mixing of satellites belonging to systems with grossly different characteristics. For a given set of satellites there exists some clustering arrangement which maintains a high level of orbit-spectrum utilization.
An arc segmentation plan, such as was adopted by the WARC-BS, 1977, is a highly formalized example of clustering. Where only a very few clusters or segments are planned, there may be severe and perhaps disadvantageous restrictions on orbit locations for all systems from the point of view of elevation angle and eclipse protection.
4. Sharing principles

268 Rep. 809
5. Hybrid satellites
For some Administrations in Region 2, it may be desirable, for economic reasons, to use the same space station both for Broadcasting-Satellite Services and for Fixed-Satellite Services. The two services may operate in different frequency bands, or in different portions of the 12 GHz band. Such a use violates the clustering principle and could lead to inefficient utilization of the spectrum-orbit resource. Furthermore, it would not be in conformance with the arc segmentation plan adopted by the WARC-BS, 1977.
Nevertheless, multiple-service space stations could be placed in one or the other of the segments, with the service not operating in its assigned segment having effectively secondary status, i.e., not enjoying protection from unacceptable levels of interference. Such operation might be desirable and economically advantageous for a limited period of time, while not enough other systems are in operation to create unacceptable levels of interference. As more systems are implemented and the level of interference increases, these systems would generally be phased out and replaced by others operating in their own segments. By then the economic advantages of the former systems may have disappeared, or be no longer of importance.
For some Administrations, it may also be desirable, in order to provide extended services or for economic reasons, to operate in more than one frequency band, either as a Broadcasting-Satellite Service or as a Fixed-Satellite Service exclusively. Such operation would not necessarily violate the clustering principle since the space station may belong to the same cluster-type in each of its frequency bands. It may however place further restrictions on acceptable orbital locations and, in the case of the Broadcasting-Satellite Service, will greatly increase the difficulties in carrying out detailed planning.
6 . Examples applicable in Region 2
6.1 Compatible satellite deployments for domestic systems in the USA
A document on sharing analysis [Reinhart, 1974] treats a wide variety of broadcasting-satellite and fixed-satellite system designs, deployments, and sharing principles, but is limited to systems serving the contiguous states of the United States. This section summarizes the conclusions of that study regarding sharing approaches and techniques. It should be noted, however, that this analysis was carried out prior to the WARC-BS, 1977 and does not reflect the system parameters adopted there.
With the system characteristics postulated in the study, the Fixed-Satellite and Broadcasting-Satellite Services can share the spectrum-orbit resource at 12 GHz equitably and effectively. Both orbit-division and spectrum-division approaches permit utilization of the resource to almost the same degree as would be possible if either service had use of the entire resource by itself, indicating that sharing does not significantly jeopardize spectrum-orbit utilization.
With spectrum division there is no interservice interference so that the degree of utilization for each service is very nearly proportional to the fraction o f spectrum allocated to it, and the total degree of utilization is almost the same as would be achieved if either service had use of the entire resource by itself. The spectrum may be divided between the services in any desired proportion independent of the characteristics of the satellite systems.
With orbit division, interservice interference is controlled by careful separation of satellites in the orbit and the preferred satellite deployment, depends on both the equipment and the signal parameters of the sharing systems. However, the problem differs only in degree from that of finding compatible spacings for intraservice sharing and, for any given combination of systems, a deployment can be found for which the degree of utilization is as great as would be possible without sharing. For certain combinations of systems, the total degree of utilization can significantly exceed that; although in these cases there is a limitation on the relative size of the orbit shares that can be assigned.
Compared with an orbit-division approach using the same types of systems, spectrum division imposes a serious economic penalty; each service has to use more satellites to provide the same total capacity. Since an orbit-division approach can provide equally high, and in some cases higher utilization factors, it is concluded that orbit division is to be preferred to spectrum division.
With an appropriate division of the orbit and the 12 GHz spectrum between the two services, but without co-ordination of frequencies and polarization, the Fixed-Satellite Service can provide at least 200 000 telephone channels and the Broadcasting-Satellite Service can provide about 100 television channels for individual reception, or 200 television channels for community reception. These capacities are roughly equal to the aggregate capacity of the 20 domestic fixed satellite systems originally planned for the 4 GHz band in the United States. With careful frequency and polarization co-ordination the total number of channels can be quadrupled and still further increases are possible through the use of other sharing techniques.

Rep. 809 269
An example of the effect on orbit utilization of having dissimilar satellites serving adjacent areas is shownin Fig. 1 for broadcasting satellites sharing frequency with fixed satellites used for television distribution. Sincebroadcasting satellites would normally have higher power than fixed satellites, protection of the latter would be more critical and the graphs of Fig. 1 show this case. They were based on the following values:
Broadcasting satellite e.i.r.p.: 64 dBW for individual reception53 dBW for community reception.
Fixed-satellite e.i.r.p.: 45 dBW.Fixed-satellite receiving earth station sidelobe pattern:
G = 32 — 25(log 0), where G is the gain in dBi and0 is the angle off the main beam axis in degrees.
It can be seen that the greater the discrepancy between the satellite powers, the less the efficiency of orbit utilization. For example, with a 30 dB ratio for protection of the Fixed-Satellite Service, having a receiving antenna diameter of 4.5 m, the required angle of discrimination when sharing with broadcasting satellites for community reception is 5.4°. When sharing with the higher-power broadcasting satellite for individual reception the required angle is 14.3°. Economy in the orbital arc can also be accomplished by increasing the size of the receiving antenna for the Fixed Satellite Service as will be seen from curves A to D.
6.2 Required angles o f discrimination
Co-polarized protection ratio (dB)
FIGURE 1 — Protection ratio versus antenna discrimination angle for fixed-satellite systems frequency sharing withbroadcasting satellite systems
—— —— Fixed-satellite sharing with Individual reception broadcasting satellite— — Fixed-satellite sharing with community reception broadcasting satellite
Curves Fixed-satellite earth station antennaA Diameter, 4.5 m (beamwidth, 0.37°); gain, 52.2 dBB Diameter, 6.0 m (beamwidth, 0.28°); gain, 54.7 dBC Diameter, 8.0 m (beamwidth, 0.21°); gain, 57.2 dBD Diameter, 10.0 m (beamwidth, 0.17°); gain, 59.2 dB

270 Rep. 809
7. Sharing between the Broadcasting-Satellite and Fixed-Satellite Services in Region 2 and the Broadcasting- Satellite Service in Regions 1 and 3
Sharing between the Broadcasting-Satellite Service serving Regions 1 and 3 and the Fixed-Satellite Service serving Region 2 is a case of sharing between dissimilar networks with two special features:— The areas served by the two services are separated generally by large bodies of water with the boundaries
running North-South, which facilitates sharing as the side lobe discrimination of the space station antenna will tend to reduce the interference; and
— Regions 1 and 3 have established a detailed Plan for the Broadcasting-Satellite Service while no such plan exists for the Fixed-Satellite Service in Region 2.
This means that the burden of sharing rests with the Fixed-Satellite Service provided that the Broadcasting- Satellite Service operates within the characteristics specified by the Plan.
Sharing criteria between these services can be established, in principle, in terms of a power flux-density limit over the area to be protected, or in terms of a minimum separation of space stations in the two services, or in terms of a combination of both. The Final Acts of the WARC-BS, 1977, deal with the problem according to the last of these choices.
Considering, in addition, that the nominal spacing between space stations in the western portion of the arc serving Region 1 is 6° according to the Plan, this means that a space station in the Fixed-Satellite Service with characteristics specified in the Final Acts (on-axis gain of the earth-station receiving antenna of 53 dB and side-lobe gain following the law:
Gain (dBi) = 32 - 25 log 0,
where 0 is the off-axis angle in degrees) could be placed midway between two broadcasting satellites serving Region 1 providing its characteristics are such that it can tolerate an interfering flux-density of about —161 dB(W/m2) at the specified test point. This imposes restrictions on the kind of service that can be provided by the fixed-satellite system, and may prevent certain sensitive systems, such as single-channel-per-carrier (SCPC) or 24-channels-per-carrier systems from using these orbital positions at certain frequencies. However, not all orbital locations in the Plan use all possible frequencies, and it may be possible to accommodate such carriers at these frequencies.
8 . Summary and conclusions
8.1 Of the two possible technical approaches, spectrum division and orbit division, orbit division is preferred for sharing between the Broadcasting-Satellite and Fixed-Satellite Services according to the results of several studies, and was the method adopted for Region 2 by the WARC-BS, 1977. These studies are based on assumptions which appear reasonable for the present and immediate future; such as moderate inhomogeneities between systems and space stations that are not power limited when using the entire available frequency band. However, even though orbit-division was adopted by the WARC-BS, 1977, spectrum division is not necessarily excluded and may have advantages in some applications.
8.2 Several studies have shown that, with orbit division, reasonable efficiency of spectrum-orbit utilization can be achieved provided that certain basic sharing principles are adhered to.8.3 Sharing between the two services in Region 2 is governed by the sharing criteria adopted by the WARC-BS, 1977.8.4 Sharing between different regions is governed by the sharing criteria adopted by the WARC-BS, 1977. The system characteristics adopted in the Plan for the Broadcasting-Satellite Service in Regions 1 and 3 impose restrictions on the use of certain orbital positions near and between the space stations of the Plan for certain sensitive Fixed-Satellite Services.8.5 The sharing analyses cited in this Report were made prior to the WARC-BS, 1977, and the results must be viewed with this in mind. Further studies based on the parameters adopted by the WARCS-BS, Geneva, 1977, are required.
REFERENCES
REINHART, Edward E. [1974] Orbit-spectrum sharing between the Fixed-Satellite and Broadcasting-Satellite Services with applications to 12 GHz domestic systems. The Rand Corporation, R-1463-NASA.
WARC-BS [1977] Final Acts, Geneva, Switzerland.

Rep. 810 271
REPORT 810
BROADCASTING-SATELLITE SERVICE (SOUND AND TELEVISION)
Reference patterns and technology for transmitting and receiving antennae
(Questions 34-2/10 and 23-2/11 and Study Programmes 34C/10 and 23F/11)
(1978)1. Introduction
The WARC (B-S), 1977, agreed to certain reference patterns for satellite transmitting and earth-station receiving antennae for planning the Broadcasting-Satellite Service at 12 GHz. The conference selected, for this planning, only certain options among those presented in this Report. For further information, see Annex 8 to the Final Acts of the WARC (B-S), 1977.
The purpose of this Report is to introduce new reference antenna patterns for spacecraft transmitting and ground receiving equipment. This information can be used in system planning. The reference patterns are presented in § 2 and a description of the present state of technology, including experimental data which justifies the reference patterns, is presented in § 3.
2. Reference patterns
For planning a future Broadcasting-Satellite Service, it is necessary to make certain assumptions concerning the maximum gain of the antenna (both for transmitting and receiving), and the way in which the gain decreases as a function of the angle measured from the axis of the beam. This information is essential for calculating interference between the transmissions for different service areas.
This section proposes reference patterns which can be used for this purpose. They are not intended to represent specifications of the best performance which may be possible, but they are reasonable practical targets which should be feasible when good design techniques are used.
The patterns are given as functions of the relative angle (p/(p0, where (p is the angle measured from the axisof the beam, and (p0 is the angular width of the beam measured between the — 3 dB levels. The levels areexpressed in dB relative to the maximum (on-axis) gain of the antenna.
Patterns are specified separately for the co-polar and the cross-polar component. They apply equally to linear and circular polarization. It is intended that they should be applicable throughout the whole of the broadcasting band under consideration, and for all angles of azimuth.
2.1 Satellite transmitting antenna
It is likely that initial planning will be based on the assumption that the beams emitted from the satellite have elliptical or circular cross-sections, and the reference patterns in this Report are based on this case. *
2.1.1 Co-polar component
It is convenient to consider the reference pattern as comprising three sections, namely:— the main lobe, corresponding approximately to 0 < cp/cp0 < 1.6 ;— the near sidelobes, corresponding approximately to 1.6 < <p/<p0 < 3.2;— the far sidelobes, corresponding approximately to cp/cp0 > 3.2.
As discussed in Report 558-1, the envelope of the main lobe can be satisfactorily approximated by a curve of the form — 12(<p/<p0)2. This is confirmed by measurements on a number of antennae already produced in the USA [CCIR, 1974-78b].
The level of radiation in the region of the near sidelobes is particularly important for broadcasting satellites, because it will have a significant effect upon the interference between different service areas. For this reason, it will be essential to employ antennae which are designed to reduce the level of the near sidelobes.
Through the use of offset-fed configurations, such as a Cassegrain horn, sidelobe levels less than— 30 dB can be achieved [Janky and Barewald, 1977].
Nevertheless, antenna with specially-shaped beams may be very useful for broadcasting satellites, because they would facilitate the suppression of undesirable spillover to neighbouring countries, while maintaining an effective coverage in the intended area. Information on such an antenna is given in § 3 and in Report 676.

272 Rep. 810
For the far sidelobes, the measurements made in the USA show that, with current technology, the level can be kept within an envelope defined by the curve:
-[17.5 + 25 log10 (cp/cpo)]-
The studies made by ESA show that, if necessary, it would be possible to design antennae in which the level of the far sidelobes falls off more rapidly, with respect to (p/cp0> than indicated by the above expression.
It is recognized that, in practice, there must be some lower limit to which the level asymptotes. For the reference pattern, this is taken as being equal to minus the on-axis gain of the antenna.
Taking account of the above discussion, the proposed reference pattern for the co-polar component of the satellite transmitting antenna is defined in Fig. 1.
2.1.2 Cross-polar component
A study by the European Broadcasting Union [CCIR, 1974-78c] suggests that the upper limit for the cross-polar component can be expressed in the form:
— (a + b log10 [(<p/<Po) ~ !]) dB 0 )
where a and b are constants.Account is taken of the discontinuity which occurs at (p/(p0 = 1 by applying a limit to the
permitted values of the envelope.Theoretically, the level can be kept arbitrarily low at all angles, and some studies have indicated
that this could be as low as —40 dB [CCIR, 1974-78d]. However, until more practical experience is obtained in the design and construction of antennae with a very low cross-polar radiation, it is prudent to adopt, for a reference pattern, a somewhat less stringent specification.
In practice, the level of cross-polar response depends primarily on the characteristics of the feed. If the feed for the transmitting antenna is used exclusively for transmission and does not have to be part of a multi-function feed assembly, then excellent cross-polar responses can be obtained in the range of —35 to — 40 dB over the main beam [Janky and Barewald, 1977].
Taking account of the limited amount of information on measured results which is so far available, it is proposed to make a and b equal to 40, in expression (1), with an upper limit of —33 at <p/<p0 < 1-5, and a limit equal to minus the on-axis gain at <p/<p0 > 1.5.
This proposed pattern is shown in Fig. 1.If the feed assembly is used for both transmitting and receiving, or if a multiple-feed assembly is
used to generate an irregularly-shaped beam, then it may not be possible to achieve the cross-polar performance indicated in Fig. 1.
2.2 Receiving antenna
2.2.1 Co-polar component
Because broadcasting systems involve the use of numerous receiving antennae (whether for individual or community reception), the standards of performance that are reasonable on economic grounds will tend to be poorer than for transmitting antennae. Moreover, when specifying the reference pattern, account must be taken of the probable inaccuracy of pointing the antenna towards the wanted satellite.
It is suggested that, to take account of the pointing error, the reference pattern should correspond to a relative gain of 0 dB for relative angles up to (p/cp0 = 0.25. Thereafter, the curve may be expected to follow a square-law (that is, the relative level is equal to —12 (q>/cp0)2 dB), in the same way as in the case of the transmitting antenna discussed above in § 2.1, to a level of —3 dB.
At larger angles, the relative level will depend on the degree to which sidelobe-suppression techniques will be practicable, for inexpensive antennae.
For individual-reception antennae, without the use of such techniques, the upper limit of the relative level decreases from the — 3 dB point at a rate given by the expression
— [9 + 20 log10 (cp/(p0)] dB
up to <p/<Po = 1.26, and from this point decreases at a faster rate given by
— [8.5 + 25 log10 (tp/cp0)] dB
up to (p/cpo = 9.55. Beyond this point, a constant level of —33 dB is taken for the remainder of the envelope.

0
m -103c*3“ -20
« -30<L>>0>04 - 4 0
-500,1 0,2 0,5 1 2 5 10 20 50 100
Relative angle (<p/<p0)
FIGURE 1 — Reference patterns for co-polar and cross-polar components for a single-feed satellite transmitting antenna producing a beam of circular or elliptical
cross-section
Curve A: Co-polar component— 12 (<p/<p0)2 for 0 ^ (p < 1.58 <p0— 30 for 1.58 <p0 < (p ^ 3.16 <p0— [17.5 + 25 log10 (<p/<p0)\ for 3.16 <p0 < <p After intersection with Curve C : as Curve C
Curve B : Cross-polar component— (40 + 40 logl0 (ip/i-p0)) for 0 <p <g 0.33 <p0— 33 for 0.33 <p0 ^ <p < 1.67 <p0— (40 + 40 log10 (cp/<p0)) for 1.67 cp0 < <p After intersection with Curve C : as Curve C
Curve C: minus the on-axis gain
At the WARC (B-S), 1977, the above Curve A for individual reception (in Region 2) applies to avalue of (p/<Po of 15.14 and a constant value of —38 dB beyond that (see Annex 8 to the Final Acts of theWARC (B-S), 1977).
For community reception, without sidelobe suppression techniques, the relative level is given by the expression
— [10.5 -I- 25 log ]0 (cp/cp0)] dB
starting from <p/<p0 = 0 .86 , and continuing until the level corresponding to minus the on-axis gain is reached.
If sidelobe-suppression techniques are employed, the curve —12 (cp/cp0)2 could be continued to a relative angle of <p/<p0 = 1-44, corresponding to a relative level of —25 dB. The sidelobes could becontained at less than this level to a relative angle of <p/<p0 = 3.8, and thereafter the level falls accordingto a curve defined by
-[10.5 + 25 log ]0 ((p/<p0)] dB
The pattern corresponding to the use of the sidelobe-suppression is shown as curve A” in Fig. 2. This curve may be feasible for both individual and community reception when sidelobe-suppression techniques are used.
2.2.2 Cross-polar component
The level of the cross-polar component can be defined in the same way as in the case of the transmitting antenna, but a less stringent performance must be expected. Moreover, account must be taken of the probable pointing inaccuracy of the antenna. Thus, it is proposed that the level should be —25 dBto a relative angle <p/<Po = 0.25. It then rises according to the curve
- ( 3 0 + 40 log10 [(<p/cp0) — H)
to a maximum of —20 dB, which is maintained to a relative angle (p/cp0 = 1.4. It then decreases according to the curve
- ( 3 0 + 25 log10 [(cp/cpo) - ID
to a level of — 30 dB.

274 Rep. 810
The resultant pattern is shown in Fig. 2. It may be taken as applying to both individual and community reception.
« -103c* -20cca>S -30<D>
1 -40
-50
AA’A”
XM
X i s
\ B S
s
■ HXL
0,1 0,2 0,5 1 2 5 10Relative angle (<p/<p0)
20 50 100
Relative antenna gain (dB):
Co-polar componentA : Individual reception w ith ou t sid e lob e suppression
0 for 0 ^ <p ^ 0 .25 <p0— 12 (<p/<p0) for 0.25 <p0 < cp ^ 0 .707 cp0— [9.0 + 20 lo g 10 (cp/<p0)] for 0 .707 (p0 < cp 1.26 y0— [6.5 + 25 lo g 10 (<p/<p0)] for 1.26 cp0 < cp <c 9 .55 <p0— 33 for 9.55 cp0 < q>
A ' : co m m u n ity reception w ith ou t sid e lob e suppression
0 for 0 <p/<p0 ^ 0.25— 12 (<;p/<p0)2 for 0.25 < <p/<p0 ^ 0 .86— [10.5 + 25 lo g 10 (y/<p0)] for 0 .86 < cp/cp0
A" : feasible for co m m u n ity and possib ly for ind ividu al reception w h e n sid e lob e- suppression tech n iq u es are used
0 for 0 ^ <p/cp0 ^ 0.25— 12 {<p/cpoy for 0.25 < <p/(p0 < 1.414— 25 for 1.414 < <p/<p0 ^ 3.8— [10.5 + 25 logjg (<p/<p0)] for 3.8 < cp/%
B : Cross-polar component (both types o f reception)— 25 for 0 ^ cp ^ 0.25 <p0— (30 + 40 lo g 101 (<p/<p0) - 1 1) for 0 .25 <p0 < <p ^ 0 .44 tp0— 20 for 0 .44 (p0 < <p ^ 1.4 <p0— (30 + 25 lo g l0 1 (<p/(p0) - 1 1) for 1.4 cp0 < tp <c 2 cp0— 30 until in tersection w ith co-polar com p o n en t c u r v e ; th en as for co-polar
com p on en t
C : Minus the on-axis gain
FIGURE 2 — Reference patterns for co-polar and cross-polar components forreceiving antenna
Note. — The flat portion of the curves up to <p/<po = 0.25 takes account of the pointing error of the antenna.

Rep. 810 275
2.3 Suggested values o f <p0
The suggested values of (p0 to be assumed for different types of broadcasting service are given in Table I:
TABLE I — Half-power beam widths, (p0 o f ground receiving antennae (typical diameters are given in brackets)
FrequencySatellite-broadcasting service
Terrestrial broadcasting serviceCommunity
receptionIndividualreception
12 GHz 1.2° 2.4° 3.0°(‘)(1.5 m) (0.75 m) (0.6 m)
2600 MHz 2.7° 8°(3 m) (1 m)
700 MHz 9° 15° to 30°(3.4 m) (2 m) (Yagi) See Recommendation 419
(’) Some Administrations propose a different value for this parameter.
Higher-gain antennae may be used in some receiving installations, for example, to obtain a better signal-to-noise ratio, but the Table is intended to indicate the values of <p0 for the types of antenna expected to be used in the majority of receiving installations.
Attention is drawn to the fact that antennae with smaller beamwidths will require careful alignment and careful mounting to prevent degradation in reception, and that they may also call for a specification of maximum satellite motion more demanding than that of satellites for other services.
3. Antenna technology and experimental data
This section presents a summary of the documents submitted on spacecraft and ground-station antenna technology. New sidelobe envelopes have been presented in § 2, and the salient experimental data justifying these envelopes are also included.
3.1 Spacecraft transmitting antennae
3.1.1 Sidelobe levels
Effective spectrum utilization of the geostationary orbit for broadcasting satellite transmission depends to a large extent upon directional control of the antenna radiation. The most effective means of serving a desired broadcasting service area with the required e.i.r.p. while maintaining low levels of radiation outside of this area is through active or passive control of the satellite antenna radiation pattern, particularly in the areas of the near-in sidelobes. This applies to both the co-polar and cross-polar patterns. (The Earth’s disc as seen from the geostationary orbit subtends approximately 17.5 degrees, and it is in this region that the reduction of sidelobes is most advantageous.) Much effort has been directed toward this vital aspect of effective spectrum usage.
3.1.2 Reflectors and lenses
It is a standard practice to taper the illumination of parabolic reflectors to increase sidelobe suppression. Extension of this technique in conjunction with other techniques has shown [Thomas, et al., 1970] that with deliberate design, first sidelobe levels can be held to the —40 dB level relative to the main beam through application of aperture blockage compensation and active zone suppression techniques.
Passive techniques are also used to control sidelobe levels in reflectors. A common technique uses a stepped zone in the reflector, usually at the centre or outer edge. The height of the step produces the desired phase change and determines the width and position of the desired cancellation pattern.
In principle, any desired degree of lobe suppression can be obtained with these techniques. Practically, however, cumulative errors in amplitude, phase and position, limit the degree of lobe suppression to approximately — 40 dB referred to the peak of the main beam. This degree of suppression, however, has not been demonstrated in space qualified hardware. For this reason, a higher level has been adopted in the reference pattern.
An effective design technique for a horn-reflector antenna of arbitrary beam cross-section has been recently presented [Katagi and Takeichi, 1975]. The technique is simple in nature. The shape of the wave-front near the aperture is first determined, for a desired beam shape, and the reflector shape is then based on optical path considerations. Such antennae may be useful in the design of broadcasting-satellites.

276 Rep. 810
3.1.3 Beam shaping
Several studies have been performed concerning the applicability of satellite-borne multi-element arrays to the solution of broadcast and communication coverage requirements.
Active arrays appear to offer a capability of providing greatly reduced interference effects and increased spectrum re-usability because of the greater flexibility and efficiency with which they can be made to operate.
Phased arrays allow virtually unlimited control over the amplitude and phase of aperture illumination, and a single aperture can be used to provide any required number of parallel beams (assuming a separate phasing matrix for each beam to be generated). Arbitrarily shaped portions of the aperture can be selected to provide arbitrarily shaped beam cross sections such that a geographical boundary may be closely approximated. Arrays appear to be capable of providing first sidelobe isolation to the —40 dB level from the main beam [Hult et al., 1968].
Other approaches to the shaped beam antenna involve the use of multiple-feed reflectors and lenses. In these devices, each feed element of a multiple-element feed array separately illuminates the reflector or lens to generate a component beam in the far field. By properly adjusting the main aperture distribution phase and amplitude from each feed and summing the feed inputs in hybrids, the secondary pattern can be shaped to provide arbitrary area coverage. Several engineering models of these antennae have been built, and satellite antennae now in orbit (INTELSAT IV-A) and planned (DSCS-III) make use of such techniques. There are a number of sophisticated computer programs available for calculating phase and amplitude distribution for the feed element array. Additional information on development of these techniques in the US is given in Report 676.
An antenna with specially-shaped beams developed in Japan for the Experimental Broadcasting Satellite (BSE) consists of an elliptical reflector and three primary feed horns to conform to the shape of the service area in which the mainland and the remote islands of Japan are included [CCIR, 1974-78a]. The frequency of the down link is 12 GHz. The measured patterns were in good agreement with the theoretical calculations. Such an antenna would facilitate the suppression of undesirable spillover to neighbouring countries, while maintaining an effective coverage in the intended area.
Another study also indicates that an improvement in sidelobe suppression can be obtained by the use of offset feed horns for this type of antenna [CCIR, 1974-78f]. Further study of this matter is desirable.
It is possible to use beam-shaping techniques with multiple feeds to achieve a main lobe patternwhich is different from the conventional Gaussian shape. Specifically, it is possible to maintain a moreuniform amplitude level over the intended service area. Such equalization of the radiation pattern may have distinct advantages under some circumstances. The principal advantage is that less spacecraft prime power is needed to provide the minimum e.i.r.p. required at the edge of the service area. This means that a smaller transmitter and smaller solar cell panels could be used, with consequent economic savings. For some applications, these savings could be significant.
A disadvantage of this technique is that the more uniform pattern may slightly exceed the presentGaussian envelope within the desired service area, but not outside the intended — 3 dB contour. In thisevent, an Administration which desired to use such beam-shaping techniques would have to co-ordinate with its neighbour in advance. Further study of this technique is desirable.
3.1.4 Multiple beams
The use of multiple beams to provide multiple independent coverages within a desired service area has been shown to increase the total spectrum capacity through frequency re-use.
Multiple beams can be produced from a single aperture by employing reflector, lens or array technologies.
Multiple off-set horn feeds operating in conjunction with a reflector or a lens provide a viable solution to the Broadcasting-Satellite Service’s performance requirements, for spacecraft as well as earth station antennae. Allowing a separate beam to be devoted to each group of users permits the desirable re-use of frequency bands. A proposed multi-beam microwave antenna [Ohm, 1974] using an off-set multiple horn feed system and Cassegrain reflector has been shown to essentially eliminate aperture blockage, reduce coma aberrations and provide good isolation between beams (40-45 dB).
Much effort has been devoted to studies of the zoned lens for producing multiple independent beams. Analytical techniques and some experimental results of a wave guide lens antenna have been presented [Dion and Ricardi, 1971] indicating the capability of providing a variable coverage radiation pattern. This variable coverage is obtained through selective excitation of derived feeds to produce the proper aperture illumination and phase distribution.
Phased arrays offer good potential for future satellite antennae in the higher frequency ranges. Multiple independent beams can be produced through selective element excitations.
Phased array antennae of the lens type have been developed for ECM and telemetry applications, and designs producing several independently steerable beams over octave bandwidths have been demonstrated. Selective summing of groups of beams produces even narrower beams which are independently “steerable”.

Rep. 810 277
This section gives the results of some measurements on antennae of a type suitable for individual or community reception. In addition, the results of some sidelobe-suppression experiments are presented to justify the recommended —25 dB plateau for community-reception in the reference pattern.
3.2.1 Measured data
Data extracted from measured antenna patterns for the co-polar component is shown in Fig. 3a. All the antennae were linearly polarized. The list of antennae from which the data was taken is given in Table II. The data is presented in groups. Each group is represented by a vertical bar spanning the range of gain variation of the sample of data points in that group. Such partitioning into groups is done with due caution to ensure that sufficient data is encompassed by each group. The upper circle on each vertical bar represents the point above which 20% of the data lies. The lower circle is the corresponding lower 20% point. The median is shown as an open circle. In addition to the measured data, Fig. 3 a also includes a plot of the reference antenna pattern given in § 2 .
Similar data extracted from a group of 3.3 metre antennae at 12 GHz are shown in Fig. 3b. The antennae were linearly polarized. Median values fall well below curve A of Fig. 2 at all angles measured, and peak values fall below the reference pattern out to six or eight times the half-power beamwidth. These data were generated with no efforts made toward sidelobe suppression.
For antennae in the size and cost range considered suitable for broadcasting-satellite applications, it is unlikely that gains below isotropic will be consistently achieved in the far sidelobes and backlobes.
Measurement of radiation patterns of linearly polarized receiving antennae with a diameter of 40 cm to 1.6 m were carried out in Japan [CCIR, 1974-78e]. Fig. 4 shows some measured data for a parabolic antenna with a diameter of 60 cm.
These results, and the test results obtained by the measurements of the antenna patterns with 1.0 and 1.6 m diameter, which were manufactured with the objectives of high efficiency, light weight and low cost, show that the patterns for the co-polar components fall within the reference pattern for individual reception.
Measurements of the cross-polarized component were made on eight of the antennae listed in Table II. The results are shown in Fig. 5, the data being presented in the same way as in Fig. 3a and b.
Analysis of limited data on the cross-polarized response of small-aperture antennae, where no special attention was paid to sidelobe levels, indicates that a minimum discrimination level of 20 dB is attainable, and the maximum level is 32 dB both on-axis and elsewhere. In the case where sidelobe suppression techniques are employed, the minimum level of discrimination can be reduced to 25 dB.
3.2.2 Sidelobe suppression techniques
There are numerous ways to reduce sidelobes, ranging from extremely simple to extremely complicated [Han, 1972].
A reduction can be achieved by increasing the taper of the feed pattern across the aperture of the reflector [Han, 1972; Silver, 1949]. The penalty paid is a loss of on-axis gain, but overall efficiencies of 50% are still achievable. With simple under-illumination, the sidelobe levels are reduced in all planes of rotation about the boresight.
In theory, a circular aperture with uniform illumination results in sidelobes some 15 dB below the peak of the secondary pattern. With an aperture distribution proportional to (1 — y/2), where y is the radial function normalized to the aperture radius, the sidelobes drop to 24.5 dB below the pattern peak. Patterns at 6 GHz using a 1.22-metre dish with an aperture edge illumination of —12 dB, show first sidelobes 26 dB below the mainlobe peak [Silver, 1949]. If the feed remains at the focus of the reflector and a portion of the reflector is removed, thereby creating an offest-fed reflector, the sidelobes can be lowered an additional several dB because the aperture blockage is reduced. However, the aperture is also reduced so that the main beam is broadened and reduction in gain occurs. This can be compensated for by increasing the size of the reflector.
Another method of sidelobe reduction in one plane is through the use of a duopod feed support. The duopod is a two-armed rigid feed support oriented in one plane with guy-wire support in the orthogonal plane. In operation, the low sidelobe plane is aligned with the equatorial plane, thus reducing sidelobe levels in the direction of neighbouring satellites. This duopod construction provides low sidelobes in the plane of the supports because the blockage discontinuity in the aperture plane is the smallest in this plane [EDUTEL, 1977]. Envelope A" of Fig. 2 can be met easily in the equatorial plane with a duopod-supported feed antenna.
A selective reduction in sidelobes can be obtained by the use of microwave absorber material attached at appropriate points on the surface of the reflector [Han, 1972; Albernaz, 1972]. This method introduces some loss of gain in the main beam, and increases the noise temperature of the antenna in proportion to the ratio of the area covered by the absorber material to the remaining area of the reflector. For selective reduction in a particular sector of the azimuthal plane of the aperture of the dish, these absorbers are relatively small.
3.2 Antennae for earth receiving equipment

278 Rep. 810
TABLE II — List o f antennae fo r the data given in Fig. 3a
Company Diameter (m) Frequency (GHz) D /A Remarks Date
Andrew Corporation 5 3 . 7 - 4 . 2 ~ 6 1 1 0 / 7 4
Andrew Corporation 5 5 . 9 2 5 - 6 . 4 2 5 ~ 9 2 toAndrew Corporation 4 3 . 7 - 4 . 2 ~ 4 9 3 / 7 5
Andrew Corporation 4 5 . 9 2 5 - 6 . 4 2 5 - 7 3
Prodelin 3 2 . 7 - 6 6 From NASA Goddard 1 9 7 5
Prodelin 1 . 2 1 0 . 5 - 4 3 From Philco Ford 1 9 7 2
Scientific Atlanta 3 3 . 7 - 4 . 2 - 4 1 Prime focus 1 9 7 5
Scientific Atlanta 3 5 . 9 2 5 - 6 . 4 2 5 - 6 1 Prime focus 1 9 7 5
RCA Ltd. o f Canada 2 . 1 1 1 . 7 - 1 1 . 91 2 . 0 - 1 2 . 31 4 . 0 - 1 4 . 5 L
i i
QO
OO
OO
c* 4^ Prime focus 1 9 7 5
Sumitomo Electric Industries 1 . 0 1 1 . 7 - 1 2 . 2 — 4 0 Prime focus 1 9 7 5
Sumitomo Electric Industries 1 . 6 1 1 . 7 - 1 2 . 2 ~ 6 4 Prime focus 1 9 7 5
FIGURE 3a — Measured co-polar peak sidelobe levels and reference antenna pattern
Upper iim it
Upper 20 % point
med)an point
" ------------------- lower 20 % point
------------------- lower limit
Curve A : reference pattern for individual reception
“ I H ,,Nr
\ A
i f - s -
I S
Nn N
;
srs
P
1 2 5 10 20Relative angle (95/%)

Rela
tive
gain
(dB)
Rep. 810 279
Relative angle (<p/cp0)
FIGURE 3b — Measured co-polar peak sidelobe levels and reference earth station antenna pattern at 12 GHz
Curve A : Reference pattern for individual reception B : Regions 1 and 3 C : Region 2
- Upper limit
Upper 20 % point
Median point
~ Lower 20 % point
Lower limit
0,1 0,2 0,5 1 2 5 10 20 50 100
Relative angle (q>/(p0)
FIGURE 4 — An example of co-polar pattern of terrestrial parabolic antennae(12 GHz)
Curve A : Reference pattern for individual reception Curve M : Measured results for a 60 cm parabolic antenna

280 Rep. 810
Relative angle (9 /% )
FIGURE 5 — Measured data for cross-polar response
--------------- reference pattern' ’--- --------- upper limit
--------- upper 20 % point0 --------- median point
lower 20 % point lower limit
This method is mainly useful in situations where reduced sidelobes in the area 1 < <p/<p0 < 5 are desired at the expense of some increase in sidelobe levels at angles beyond <p/(p0 = 5.
In theoretical and experimental work by [Albernaz, 1972] and [Han, 1972], a 1.27-metre reflector was equipped with rectangular absorbers designed to provide a maximum suppression of the first and second sidelobes, without regard to the others. The predicted and the measured patterns are shown in Figs. 6 , 7, 8 and 9. The feed pattern had an 8 dB taper. In the (p = 0° plane, the highest sidelobe level is reduced by 7 dB, while the beam centre gain is reduced by 0.7 dB. From Fig. 7 it can be seen that the radiated energy in the sidelobes has been diverted to the <p = 90° plane. The sidelobe levels relative to the maximum beam centre gain stay below —27 dB up to the plane <p = 30°.
The relative insensitivity of this sidelobe-suppression technique to azimuthal variation makes alignment and adjustment in the field quite simple and non-critical.
The experimental results presented in Figs. 8 and 9 correspond to measurements in the planes <p = 0° and <p = 2.5°, respectively. The maximum sidelobe-level reduction is over 12 dB with a beam- centre gain reduction of 1.6 dB.
Measurements performed using a 1.22-metre reflector at 6 GHz with a 50 cm shroud lined with microwave absorber showed significantly reduced sidelobes in the region beyond (p/<p0 = 10 [EDUTEL, 1977]. Special feed designs were used to provide equal tapers in the E- and H-planes of the feed pattern. Combinations of techniques such as specially designed feeds, low aperture blockage feed supports such as tripods and duopods, plus absorber-lined shrouds show promise of reducing the sidelobes on small aperture antennae (diameter less than 4.57 metres) well below the A" curve of Fig. 2.
The extra costs associated with the use of these techniques are primarily for non-recurring engineering and testing to obtain a production design; the additional production costs are minimal. Therefore, if a fairly large quantity of antennae is required, the sales price increase could be fairly small.

Rep. 810 281
Off-axis angle (degrees)
Theoretical results
— without compensation— with compensation
Diameter: 130 cm (50 in.) Frequency: 12 GHz
FIGURE 6 — Radiation pattern with and without the pair of absorbers
(8 dB taper illumination) [Albernaz, 1972]

0
FIGURE 7
1 2 3 4 5 6Off-axis angle (Deg.) (<p = 0°)
— Two dimensional radiation contours with compensation on the aperture field distribution
(8 dB taper illumination) [Albernaz, 1972]Theoretical results

Rela
tive
powe
r (d
B)
Rep. 810 283
20° 15° 10° 5° 0° 5° 10° 15° 20°Angle (degrees)
FIGURE 8 — Measured radiation patterns of a reflector— with and without absorber[Han, 1972]
Curve A : without absorbers B : with absorberC : cross-polar component (with absorbers)
Frequency: 10.5 GHzDistance between absorber: 0.67 m (26 in.)Absorber size: 0.23 X 0.35 m (9 X 13 in.)Absorber location: H-plane
Pattern plane: <p = 0°Reflector diameter: « 1.20 m (4 ft.)
F/D=0A

284 Rep. 810
20° 15° 10° 5° 0° 5° 10° 15° 20°Angle (degrees)
FIGURE 9 — Measured radiation patterns of a reflector— with and without absorber[Han,1972]
Curve A : without absorber B : with absorbers
Frequency: 10.5 GHzDistance between absorber: 0.66 m (26 in.)Absorber size: 0.23 X 0.35 m (9 X 13 in.)Absorber location: H-plane Pattern plane: <p = 2.5°Reflector diameter: » 1.20 m (4 ft.)FID = 0.4
REFERENCES
ALBERNAZ, J. C. F. [November, 1972] Side-lobe control in antennae for an efficient use o f the geostationary orbit. Ph.D.dissertation, Standford University.
DION, A. R. and RICARDI, L. J. [February, 1971] A variable coverage satellite antenna system. Proc. IEEE, Vol. 59, 2, 252-262. EDUTEL Communications and Development, Inc. [January, 1977] Comparative study of sidelobe suppression techniques for
small aperture earth terminals. Report prepared for COMSAT General Corporation. Palo Alto, California.HAN, C. C. [June, 1972] Optimized earth terminal antenna systems for broadcast satellites. Ph.D. dissertation, Standford
University.HULT, J. L. et al. [1968] Technology potentials for satellite spacing and frequency sharing. Rand Corporation RM-5785-NASA. JANKY, J. M. and BAREWALD, J. [September, 1977] 1977 Conference Proceedings, IEEE Electronics and Aerospace Systems
Convention (EASCON).JANKY, J. M., LUSIGNAN, B. B., LEE, L., HAY, E. C., and REINHART, E. E. [June, 1976] New sidelobe envelopes for small
aperture earth stations. IEEE Trans. Broadcasting, Vol. BC-22, 2.KATAGI, T. and TAKEICHI, Y. [November, 1975] Shaped-beam hom-reflector antennae. IEEE Trans. Ant. Prop., 6, 757. OHM, E. A. [October, 1974] A proposed multiple beam microwave antenna for earth stations and satellites. BSTJ, Vol. 53, 1657. SILVER, S. [1949] Microwave antenna theory and design. MIT Radiation Laboratory Series, Vol. 12, McGraw-Hill,
New York, 195.THOMAS, R. K., MEIER, R. and GOEBELS, F. J. [April, 1970] Sidelobe suppression techniques for reflector antennae on
satellites. Progress in Astronautics and Aeronautics, Vol. 24, 299.
CCIR Documents[1974-78]: a. 11/39 (Japan); b. 11/134 (USA); c. 11/157 (EBU); d. 11/135 (USA); e. 11/40 (Japan); f. 11/315 (Japan).

Rep. 810, 811 285
BIBLIOGRAPHY
ATIA, A. E. and DiFONZO, D. F. [December, 1974] Sidelobe reduction techniques. Presented at 1975 IEEE National Telecommunications Conference, December 1-3, New Orleans, La., USA.
DIJK, J. et al. [June, 1973] The polarization losses of offset antennae. Eindhoven University o f Technology, Netherlands.HULT, J. L. [June, 1972] Shaped coverage patterns with satellite array antennae. International Conference Communications,
Session 26, No. 15.IEE [1968] Institution o f Electrical Engineers. Colloqium on direct broadcasting from satellites. Colloqium Digest No. 1968/24.KREUTEL, R. W. and ENGLISH, W. J. [October, 1974] Design and measurements o f satellite antenna systems for frequency
re-use. EASCON 1974, 513.PRINS, D. W. and KREJCI, D. W. [December, 1975] Multibeam antennae. Signal, November/December 1975 issue, 7.RUBIN, P. A., JANKY, J. M. and RUSSELL, S. P. [March, 1977] Sidelobe levels attainable in small-aperture antennae. IEEE
Trans. Broadcasting, Vol. BC-23, 1.SCHROEDER, K. G. [October, 1970] Technology trends in spacecraft phased arrays. EASCON 1970, 113.SCHROEDER, K. G. [September, 1971] International Symposium on Antennae and Propagation. Paper II-C1, Sendai, Japan.SCHROEDER, K. G. [February, 1972] Beam shaping potential of high-gain antennae for geostationary spacecraft with high
interference rejection. Aerospace Corporation.SIELMAN, P. F., SCHWARTZ, L. and NOJI, T. T. [April, 1972] Multiple beam communicating satellites with remote beam
steering and beam shaping. Progress in Astronautics and Aeronautics, Vol. 32, 265.
CCIR Documents[1974-78]: 11/393 (USA); 11/412 (France).
REPORT 811
BROADCASTING-SATELLITE SERVICE
Planning elements required for the establishment of a plan of frequency assignments and orbital positions for the
Broadcasting-Satellite Service in the 12 GHz band(Study Programmes 20C-2/10 and 5G-2/11)
(1978)1. Introduction
The first step in establishing a plan of frequency assignments and orbital positions for the Broadcasting- Satellite Service is to select various system characteristics in the light of their implications for planning. This paper considers the fullest possible list of such characteristics to serve as a basis for a plan in the band 11.7 to 12.5 GHz in Region 1 or in the band 11.7 to 12.2 GHz in Regions 2 and 3.
2. Type of emission
Several kinds of Broadcasting-Satellite Service may be contemplated. The example selected here is FM television broadcasting with accompanying sound on a sub-carrier for individual reception, which is regarded as the most critical likely case from the planning standpoint. Such a plan would allow for various developments in the future, such as sound programme broadcasting or digital modulation, providing such alternatives do not cause any additional planning constraints. Such a plan would also allow initial implementation of broadcasting-satellite systems for community reception which later could be converted to systems for individual reception. If planning were done on the basis of community reception, such conversion later on would, in general, not be possible. Nevertheless, in those cases in Region 2 where systems for community reception will be planned on a permanent basis and subsequent conversion is not foreseen, planning on the basis of individual reception could be wasteful of the spectrum-orbit resource, and planning should be done on the basis of the system actually to be implemented.
From economic considerations and in order to keep power flux-density values within reasonable values from sharing considerations, the use of amplitude modulated television broadcasting has been excluded.
3. System characteristics
3.1 Choice between linear and circular polarization
The WARC-BS (Geneva, 1977) adopted circular polarization for the Broadcasting-Satellite Service for planning purposes. The technical factors determining the choice of polarization are treated in Report 814, and its effect on sharing is treated in Reports 809 and 631-1.

286 Rep. 811
3.2 Angle o f elevation
The required e.i.r.p. of the satellite becomes greater as the elevation angle is decreased, but this effect is not very marked for angles of elevation above 20°. Shadowing effects and the possibility of interference from terrestrial service transmitters will also increase with decreasing angles of elevation. From these considerations, notwithstanding the comments below, a minimum elevation angle of 20° would be desirable in most cases. However, for service areas subject to high precipitation (e.g., rain-climatic zone 1 *), elevation angles as high as 40° would be preferred.
For coverage zones located in latitudes above about 60°, the elevation angle is often bound to be less than 20°. In favourable terrain conditions almost normal service might be provided with elevation angles as low as 10°. Special measures are needed, however, if acceptable service is planned to be extended under this angle or to areas with a less favourable terrain. For mountainous areas even an elevation angle of 20° may be insufficient. In the Alpine valleys, for example, which are deep and populated, an angle of at least 30° may be essential to provide an acceptable service.
3.3 Percentage o f time
It is considered that planning should be on the basis of achieving the following carrier-to-noise ratio objectives at the edge of the service area:— 14 dB for 99% of the worst month— 10 dB for 99.9% of the worst month.
3.4 Sound channel
The requirements of the previous paragraph will ensure adequate sound channel quality as well as vision quality on the assumption that a sound sub-carrier is employed with a frequency compatible with inter-carrier spacing of the relevant terrestrial television standards. Examples of system parameters are given in Report 215-4.
The question of supplementary sound channels has not been considered in detail. However, in a television channel, the television signal may be replaced by an analogue or digital multiplex, of 12 sound channels, for example. The signal-to-noise ratio will be somewhat greater than that required for television sound.
It may be emphasized that the indicated parameters for the sound channels are for the purposes of planning and this does not preclude developments which fall within the same constraints.
4. Receiving installation
4.1 Figure o f merit and type o f receiver
The preferred figure of merit G /T (with T in K) depends on both economic and technical factors. The value may be considered to range from 4 dB to 12 dB for individual reception, and from 8 dB to 24 dB for community reception, the most economic value depending on the size of the service area and, in particular, on density of receivers within that service area. The WARC-BS (Geneva, 1977) adopted values of 6 dB for individual reception and 14 dB for community reception for planning purposes.Note. — The definition of G /T should be that given in Report 473-2.
4.2 Co-polar reference pattern o f the receiving antenna
See Report 809.
4.3 Cross-polar reference pattern o f the receiving antenna
See Report 809.
4.4 Frequency stability o f receivers
It is considered that receiver technology is such that no special planning consideration needs to be given to the frequency stability of receivers.
4.5 Intermediate frequency response curve
The effects of the IF response are taken into account in deriving the protection ratio for a given channel spacing (see Report 634-1).
4.6 Receiver tuning range
Receivers may be marginally cheaper if they only had to cover 400 MHz instead of the entire band but this may restrict programme choice in certain situations. This aspect is regarded as a matter of choice by individual Administrations.
See AP28-37 of the Radio Regulations for a definition of rain-climatic zones.

Rep. 811 287
4.7 Protection ratio for a given channel spacing
Some studies based on a spacing between satellites of the order of 7.5 to 10° have indicated a preference for a 20-MHz spacing between 27 MHz wide channels. The optimum value may depend on the spacing chosen between satellites. The 1977 WARC-BS adopted a channel spacing of 19.18 MHz with a spacing of 6° between satellites in the Plan for Regions 1 and 3. Report 634-1 gives values for protection ratios for different channel spacings.
4.8 Energy dispersal
The WARC-BS (Geneva, 1977) adopted the following:“For planning, an energy dispersal value has been adopted which reduces by 22 dB the spectral power
flux-density measured in a 4 kHz bandwidth in relation to that measured in the entire bandwidth; this reduction corresponds to a peak-to-peak deviation of 600 kHz.” The basis for this choice is discussed in Docs. [CCIR, 1974-78a and b].
5. Satellite transmitter
5.1 Antenna beams
For planning purposes, it is convenient to deal only with beams of elliptical, and, as a special case, circular cross-sections. In the implementation of actual systems, it may be possible to use shaped beams that conform to the actual service areas, which may be of irregular shapes, much better than simple ellipses or circles. This would tend to lower the power required to produce a given power flux-density within the service area and, at the same time, reduce the power flux-density produced outside the service area, thus reducing the interference produced. The level of sidelobe suppression that can be obtained with shaped beams requires further study.
Because of launch vehicle and other technological constraints, a satellite antenna beamwidth of about 0.6° is considered the smallest practical size.
5.2 Antenna gain at edge o f coverage area
The difference between the satellite antenna gain value towards the centre of the coverage area and the value towards the edge of the coverage area is termed AG. Normally, the antenna gain is assumed to be 3 dB below the maximum at the edge of the coverage area, i.e., AG = 3 dB.
For a given coverage area, a value for AG can be selected between 3 and 6 dB. The maximum antenna gain is therefore modified, but the satellite’s transmission power remains more or less constant.
The theoretically optimum value of AG is usually about 4 dB. Some different considerations apply to the case of small service areas which would require a beam smaller than that corresponding to the maximum practicable size of the transmitting antenna. In these cases, the optimum value of AG is less than 4 dB.
5.3 Co-polar reference pattern o f satellite transmitting antenna
See Report 810.
5.4 Cross-polar reference pattern o f satellite transmitting antenna
See Report 810.
5.5 Loss in the output circuit
When a number of radio-frequency channels are to be multiplexed to feed a common satellite antenna, the following constraints arise from implementations of present-day technology:— a spacing between any two channels assigned to a country of not less than 52 MHz would not cause any
technical problems;— a spacing of approximately 40 MHz would be feasible, providing power levels were not excessive;— a spacing of less than approximately 40 MHz would not be feasible.
The 1977 WARC-BS adopted a nominal minimum value of 40 MHz with a spacing between satellitesgenerally of 6° in the Plan for Regions 1 and 3.
5.6 Variations in output power
Owing to the tolerances in the output powers of satellite travelling wave tubes, the nominal output power at the start of service may be 0.4 dB above the design value.
This output power can be expected to decrease by 0.1 dB yearly, according to the experience of the European Space Agency. Thus, there will be a loss of 0.6 dB after 6 years. Taking account of this loss, and allowing for the 0.4 dB tolerance referred to above, the travelling wave tube may give a power 1 dB higher than the planned value at the start of service. This value of 1 dB is termed the operating power margin.
The Final Acts of the 77 WARC-BS state that the output power of a space station in the Broadcasting- Satellite Service must not rise by more than 0.25 dB relative to its nominal value throughout the life of the satellite.

288 Rep. 811
5.7 Frequency stability o f satellite transmitter
The values arising in practical systems indicate that this need not be taken into account in planning.
5.8 Satellite station-keeping
It is considered feasible to achieve a satellite station-keeping accuracy in both the N-S and E-W directions of less than ± 0.1°. These values will lead to a maximum excursion of the satellite from nominal of ± 0.14°.
5.9 Pointing accuracy o f the antenna beam
With the present state of the art for controlling pitch and roll error of a spacecraft, the boresight errorcircle of the transmitting antenna should be capable of being maintained within 0 .2°.
With the introduction of improved systems (e.g., radio-frequency sensing: see § 4.4, Doc. [CCIR, 1974-78c]) this radius could be reduced to 0 .1°.
Studies performed in the USA [CCIR, 1974.-78d] and Europe [ESA, 1976] indicate that eventually an accuracy of 0.05° can be achieved for a significant and predictable portion of the operational lifetime.
Motion around the yaw axis (the line joining the satellite and the centre of the Earth) can presently be stabilized within ± 1°, as has been demonstrated with the CTS satellite. Greater accuracy is already technically feasible, but this would require more complex design [Redisch, 1975].
A range of values is given above, reflecting future developments in recognition of the critical effect of pointing error on planning. The WARC-BS (Geneva, 1977) has, in fact, adopted the values of 0.1° and ± 2° for the tolerance in pointing accuracy and motion about the beam axis, respectively, for planning purposes.
6 . Up-links
6.1 System considerations
In most cases, broadcasting-satellite systems will have a single up-link for each set of down-links within a single service area. Such up-links will normally use an earth station of comparatively high power and with a comparatively large antenna. The noise and interference restrictions described in §§ 6.2 and 6.3 below are applicable to such up-links.
However, for some applications entirely different kinds of up-links may be required. For example, the usefulness of some types of educational and health delivery services is greatly enhanced by the inclusion of a response capability. This possibility is mentioned in Report 633-1 and needs further study.
The choice of the up-link frequency band and the restrictions that may arise from sharing considerations in that band may have a major impact on planning for the Broadcasting-Satellite Service.
6.2 Up-link signal-to-noise ratio
It is estimated that the signal-to-noise ratio of the up-path will be about 9 dB greater than that of the down-path. This would seem to be a reasonable compromise minimum value both for the size of the transmitting earth station and the transmission power of the satellite. It is considered that up-path noise will result in increased down-path noise. A reduction of 0.5 dB in the signal-to-noise ratio of the down-path, representing the effects of the up-path, shall be considered the maximum for planning purposes.
6.3 Up-link interference
The Earth-to-satellite path is not any more impervious to interference than the satellite-to-Earth path. The total interference must not result in an impairment worse than the 4.5 grading on the scale given in Recommendation 500-1 at any point of reception. Since the sources interference in the satellite-Earth path, namely, the broadcasting satellites, are numerous and since this type of interference is liable to reduce the number of programmes broadcast to each country, it is proposed that, for planning purposes, the interference due to the Earth-satellite path should be 10% of the total interference and that the interference due to the satellite-Earth path should be 90%.
7. Power flux-density required
T he pow er flux-density required for satisfactory television reception in a broadcasting-satellite system depends on the desired dow n-link carrier-to-noise ratio ( C / N , dB), the receiver figure o f merit ( G / T , dB), the frequency (f, G H z) and the receiver bandw idth (B, M H z) in the fo llow ing way.
PFD = (C /N) - (G/T) + 20 log / + 10 log B - 147.1
where PFD is the power flux-density in dB (W /m2). Table I lists the characteristics of several representative receiving systems and the resulting power flux-densities. It also lists the values adopted by the WARC-BS (Geneva, 1977) for planning purposes.

Rep. 811 289
TABLE I — Characteristics o f representative receiving systems and resulting pow er flux-densities
Type o f receptionIndividual Com m unity
A B c D A B C D
HP beamwidth (degrees) 2.4 1.5 2.0 1.8 1.0 0.75 1.0 1.0
Antenna diam. (m) 0.75 1.2 (0.9) (1.0) 1.8 2.4 (1.8) (1.8)
Noise factor (dB) (') 6.2 3.7(2) (5.9) (6.7) 4.2 2.2(2) (4.2) (4.2)
G /T (dB) 4 12 6 6 14 20 14 14
Overall C /N required (dB) 14 14 14 14 14 14 14 14
Frequency band (GHz) 12 12 12 12 12 12 12 12
Bandwidth (MHz) 18 27 27 18/23 18 27 27 18/23
PFD(dBW /m 2)(3) — 103 — 109 — 103
( - 1 0 5 ) / — 104 — 112 — 117 — 111
( - 1 1 2 ) / — 111
(') Computed by assuming the same losses and conditions as in the example in Annex I o f Report 473-2, except that an antenna efficiency o f 55% was used.
O In these cases the losses assumed in the example were reduced by 1 dB.(3) Includes an allowance o f 0.5 dB for retransmission o f up-link noise.A: readily achievable B: achievable at additional cost C: adopted by WARC-BS for Regions 1 and 3D: adopted by WARC-BS for Region 2Numbers in parentheses were not adopted explicitly, but are implied by adopted numbers.
Report 473-2 indicates achievable noise factors of 4 to 5 dB for community reception and of 6 dB for individual reception. The values of the required power flux-density adopted by the WARC-BS are generally based on the receivers with relatively poorer performance, reflecting the concern with receiver cost in systems requiring a large number of receivers. For many countries of high population density, this may, in fact, represent an economic solution which is close to the optimum with respect to total system cost, bearing in mind that the use of higher power flux-density reduces receiver cost but increases satellite cost, and vice versa. In other situations, the optimum system may require the use of receiving terminals whose size and performance is closer to the ones under heading “B”. Furthermore, high power flux-densities, requiring high power emissions from the space station, lead to decreased spectrum-orbit capacity and thus reduce the total amount of services that can be provided in this frequency band. The economic value of these services (many not well defined at this time) cannot be assessed easily, and therefore some conclusions based on the economics of a particular broadcasting-satellite system of narrowly defined scope may not be valid when the total range of possible services is considered.
The values listed in Table I are those required from the point of view of the Broadcasting-Satellite Service; they do not take into account any requirements for sharing with other services operating in the band.
The requirements corresponding to a value of C / N of 14 dB are to be met for 99% of the worst month at the edge of the service area. Typically, the clear weather power flux-density values will be 1 to 2 dB greater at the service edge (no rain attenuation) and 4 to 5 dB greater at the centre of the service area.
REFERENCES
Document ESA/SBAG [1976] 3, Annex 3, European Space Agency.REDISCH, [November, 1975] ATS-6 Description and Performance, IEEE Trans. Aerospace Electron. Systems, 999-1001.
CCIR Documents[1974-78]: a. 11/415 (France); b. 11/420 (France); c. 2 /94 (Draft Revisions on Report 546); d. 11/129 (USA).

290 Rep. 811, 812
BIBLIOGRAPHY
SIOCOS, C. A. [December, 1973] Broadcasting-satellite coverage: geometrical considerations. IEEE Trans. Broadcasting, Vol. BC-19, 84-87.
SIOCOS, C. A. [March, 1975] Broadcasting-Satellite Service: minimum elliptical beam determination. Journal o f the SMPTE, Vol. 84, 147-150.
REPORT 812
COMPUTER PROGRAMS FOR USE IN PLANNING BROADCASTING-SATELLITE SERVICES IN THE 12 GHz BAND
(Study Programmes 20C-2/10 and 5G-2/11)(1978)
1. Introduction
Plans for the implementation of broadcasting satellites at 12 GHz are currently under study by many Administrations. Preparation of such plans requires an extensive and complete evaluation of a large number of technical and economic factors. The task is further complicated by the need to preserve the rights of many nations when developing a plan for any one country or group of countries. A variety of computer programs have been developed to assist in carrying out these tasks.
The purpose of this Report is to summarize the types of planning tasks for which computer programs have been developed to provide a general summary of the features, inputs, and outputs of the programs presently available for the planning of Broadcasting-Satellite Services at 12 GHz.
The programs can be divided into two groups: synthesis and analysis. It is recognized that any synthesis program must contain analytic portions, but the purpose, constraints, and methods will in general be different from those associated with pure analysis programs.
2. Summary of synthesis programs
Synthesis programs are available to determine optimum beam size for arbitrary borders, optimum equivalent isotropically radiated power (e.i.r.p.), corresponding optimum receiver figure-of-merit G/T, and to plan compatible orbit locations, channel frequency, and polarization assignments, according to a variety of performance criteria and user requirements.
The following paragraphs provide a general description of the topics treated in the various programs. A summary of the important features, inputs, and outputs of the programs described in documentation submitted to the CCIR is given in Tables I and II.
2.1 System configuration synthesis and cost evaluation
2.1.1 Purpose o f the programs
The purpose of these programs is to determine a minimum cost satellite communication system subject to a variety of performance constraints and demands for service (both in terms of number of channels and station locations). The object is to determine the combination of key parameters, i.e., spacecraft e.i.r.p., ground station antenna diameter, receiver noise temperature, and ground station transmitter power, which minimizes a cost criterion, such as capital cost, or present worth. All the programs perform an exhaustive search, thereby guaranteeing that a global minimum is found. Two programs are aimed specifically at broadcasting satellites, while the third program treats telephony service and video together to find an overall system optimum.
A fourth program examines the cost impact of employing various spectrum saving techniques for both broadcasting and fixed service satellite systems, and provides a tool for maximizing the use of the orbit-spectrum. This program does not make orbital, frequency, or polarization assignments. More complete descriptions of the various programs are given in the reports submitted to the CCIR as listed in the Annex.

Rep. 812 291
2.1.2 Description o f Table I entries
The entries in Table IA, IB, and IC indicate by means of a Y (yes) or N (no) the features, inputs, and outputs available with the programs. In Table IA, the first two entries indicate the program’s ability to accommodate broadcasting satellite and fixed service systems for the signal types indicated. The third entry indicates whether cost determination is accomplished via table look-up using cost input data for the required quantity or by applying learning curves to adjust computer-stored cost models as a function of quantity. “Earth station antenna options” allows the user to synthesize systems having a broad range of earth station antenna diameters while “beam pattern determination” allows the user to determine the “best” spacecraft antenna pattern for covering a specified area. “Multiple beam capability” makes it possible to accommodate more than one beam when optimizing system parameters. The final entry indicates whether the program has the capability to take into account the effects of non-linear operation at both the uplink transmitter and the satellite transponder. This implies defining the operating point of the transmitters in order to optimize efficiency while minimizing intermodulation distortion.
The input and output parameters are mostly self-explanatory with the possible exception of entries 12 and 13 in the input Table. These entries make it possible for the user to constrain the final satellite and launch vehicle options, e.g., a body-stabilized spacecraft and/or a specific type of launch vehicle.
TABLE IA — System configuration synthesis and cost evaluation — features
Features
Reference number / Administration / program
1.1us
“ STAMP”
1.2US
CSC
1.3us
STANFORDM ITCHELL
1.4US
STANFORDRUSSELL
1. Broadcasting satellite:— Audio Y N Y Y— Video Y Y Y Y
2. Fixed service:— Telephony Y N Y Y— Data Y N Y Y— Video Y N Y Y
3. Cost determination:— Table look-up N N Y Y— Learning curves Y Y Y Y
4. Earth station antenna options:— Small, i.e., less than 4.5 m (15 ft) Y Y Y Y— Large, i.e., 4.5 to 9 m (15 to 30 ft) N Y Y Y
5. Beam pattern determination Y Y N N6. Multiple beam capability Y Y N N7. Intermodulation distortion:
— Earth station (up-link) N N Y Y— Transponder (down-link) Y Y Y Y
Y: Yes N: No

292 Rep. 812
TABLE IB — System configuration synthesis and cost evaluation programs — inputs
Reference number / Administration / program
Inputs 1.1us
“ STAMP”
1.2us
CSC
1.3us
STANFORDM ITCHELL
1.4US
STANFORDRUSSELL
1. Frequency Y Y Y Y
2. Number o f video channels per programme Y Y Y Y
3. Number o f audio channels per programme N N Y Y
4. Number o f telephony channels N N Y Y
5. Type o f modulation FM FM FM Any
6. Beam pattern options Y Y N Y
7. Atmospheric model: — Rain Y Y Y Y— Depolarization N N Y Y— Sky temperature Y Y Y Y
8. Signal quality Y Y Y Y
9. Number o f earth stations introduced per year N N Y Y
10. Telephony requirements: — Traffic demand N N Y Y— Demand growth N N Y Y
11. Raw cost data Y N Y Y
12. Satellite options and cost N Y Y Y
13. Launch vehicle options and cost N N Y Y
14. Acceptable interference criteria N N N Y
Y: Yes N: No
TABLE IC — System configuration synthesis and cost evaluation programs — outputs
Reference number/Administration/program
Outputs 1.1us
“ STAM P”
1.2us
CSC
1.3us
STANFORDMITCHELL
1.4US
STANFORDRUSSELL
1. Optimize (least cost) Parameters:— Satellite e.i.r.p. Y Y Y Y— Earth station e.i.r.p. N N Y Y— Earth station G /T Y Y Y Y— G (antenna diameter and gain) Y Y Y Y
— T (system noise temperature) Y Y Y Y— Up-link radio-frequency power N N Y Y
2. Transponder gain N N Y Y
3. Capital costs o f major components Y Y Y Y
4. Annual costs N N Y Y
5. Present worth o f system N N Y Y
6. Installation/maintenance costs Y Y Y Y
7. Satellite launch sequence N N Y Y
8. Measures o f orbit spectrum utilization N N N Y
Y: Yes N: No

Rep. 812 293
2.2 Assignment o f orbit, spectrum, and polarization for multiple users o f broadcasting satellites
Two programs provide a computerized method for generating frequency, orbit, and polarization assignments for broadcasting satellites. Both computer programs devise a plan to transmit one television programme per service area.
In the computer programs developed by Telediffusion de France (TDF), the program is divided into three parts which separately and successively assign channels, positions on the orbit, and polarizations. In the case of the channels, co-polar and cross-polar matrices of the emission discrimination are considered and assignments are chosen to avoid the same or adjacent channels being used by service areas which are potentially the most subject to mutual interference, that is, service areas corresponding to the smallest terms in the matrix. The aim of the assignments is, therefore, to eliminate those cases having the highest potential for interference. The orbital positions and the polarizations are then determined so as to give the maximum possible value of protection margin to the service area which is the most subject to interference. From this aspect, the method does in fact optimize the plan.
In the computer programs developed by the RAI, the initial step is to assign positions on the orbit according to the particular requests of the various service areas. As these positions are specified from the start, it is not necessary to calculate several beams for each service area nor to calculate the emission discrimination matrices, and it is possible to proceed directly to the calculation of the interference matrix. The assignment algorithm is based on the examination of a compatibility matrix, which shows whether two service areas can, or cannot use the same channel or the adjacent channel and the same polarization. Using operational-research methods, polarizations and then channels are assigned in such a way as to minimize the total number of channels required in the planning, subject to the condition that no service area has a negative protection margin. The initial assignments of positions can then be modified and the cycle of calculations repeated, in order to improve the results.
3. Summary of the interference analysis programs
The interference programs submitted cover a wide range of parameters, and there is no single program which does everything. The programs from particular regions tend to reflect the needs of that region, and so many are adequate only for a specific region. Analysis programs are directed primarily at determining inter- and intra-system interference of proposed broadcasting satellite and fixed satellite systems sharing the same frequency band. This includes terrestrial sources as well. These programs calculate a wide range of parameters, and a general description of the features is given in § 3.1 and Table III. The IFRB analysis program was used during the WARC-BS, Geneva, 1977 to analyse the plans produced.
TABLE IIA — Orbit-spectrum-polarization assignment program features
Features
Reference number and agency
2TDF/France
3RAI/Italy
Optimum beam determination Y Y
Assignment sequence Frequency-orbit- Orbit-polarization-polarization frequency
Protection margins
— co-channel Y Y— adjacent channel Y Y— equivalent Y Y
Limits o f usable orbital arc Y Y
Selective orbital assignment option Y Y
Y: Yes N: No

294 Rep. 812
TABLE I IB — Orbit-spectrum assignment program inputs and outputs
Reference number and agency
2TDF/France
3RAI/Italy
Inputs:Boundary point coordinates for each country Y Y
Test point coordinates Y Y
Satellite longitude N Y
Protection ratios Y Y
Satellite e.i.r.p. O O
Antenna beam parameters O O
Number o f channels Y N
Orbital positions available Y Y
Type o f channel distribution Y Y
Outputs:Orbital location Y Y
Channel frequency assignment Y Y
Polarization Y Y
Antenna beam parameters Y Y
Protection margin Y Y
Y = Yes N = No O = Optional
3.1 Summary o f features
Assigning the orbit-spectrum at 12 GHz for satellites requires an evaluation of inter- and intra-system interference. The basic techniques used in the general programs all calculate the desired carrier power to interfering carrier power ratio from the basic link equation, using reference antenna patterns, actual geometric determination of the off-axis angle of the interfering signal at each particular test point, and all other necessary parameters with as little approximations as possible. For the case of interference to fixed service systems with FDM /FM telephony, a determination of the actual contributed baseband noise power in picowatts is desirable. This requires a calculation of a convolution integral, and several programs have been generated to do this. There are quite a large number of variables which must be accounted for in the overall analysis process, and many of these parameters are listed as inputs in Table III.
3.2 Description o f Table I I I entries
The entries in Tables IIIA, IIIB, and IIIC indicate the features, inputs, and outputs available with theprograms by means of a Y (yes) or N (no). The first three features refer to the program’s capability to accommodate interference among other space or terrestrial services. A “Y” in flexible atmospheric model means it is possible to account for attenuation and rain depolarization effects, according to a given percent service outage. Most computer programs consider a plan for one program per service area and analyze any given plan with respect to this single program. For more than one program per service area the analysis process is either abbreviated in the case of regular distribution or continued in the case of irregular distribution. For information on the distribution methods, see Report 633-1. “Optimum beam option” refers to the capability to determine, if required by the user, the best-fit elliptical antenna beam from the spacecraft for coverage of any service area from any allowable orbital position.
“Cross-polarization analysis” refers to the ability to calculate interference arising from cross-polarization phenomena including non-orthogonal alignment of adjacent beam patterns and rain depolarization effects. “Baseband signal-to-thermal noise ratio” refers to the calculation of the signal-to-thermal noise ratio without regard to possible interference. “Baseband signal-to-interference ratios” refers to the ability to account for the non-linear demodulation process, usually with a convolutional technique. For mutual interference among broadcasting satellite systems, the most important information required is the protection margins. Additional useful information are the carrier-to-noise ratios and the baseband signal-to-noise ratios. For inter-system interference to FDM /FM systems, it is necessary to employ convolution and determine a signal-to-noise ratio for accurate results. “Up-link interference” indicates the ability to account for up-link contributions from both noise and distinct interfering sources as well. “Reference patterns option” indicates whether the program has appropriate patterns built in or not. “Protection against margin option indicates the types of protection margins which can be calculated, and “equivalent” indicates the sum total effect on a given radio-frequency channel from both co-channel and adjacent channel contributions.

TABLE IIIA — Interference analysis — features
Features
Reference number/agency/Administration/program reference
4EBU
5.1ORI/US
SOUP
5.2RAND/US
5.3FCC/USCONVOLUTION
5.4FCC/US
COORDINATION
5.5NASA/USFDM/FM
PSD*1*
6Canada
7ESA
8Japan/NHK
91FRB
1. Broadcasting satellite Y Y Y X X X Y Y Y Y2. Fixed satellite N Y Y X X X Y N N Y3. Terrestrial service N N N X Y X Y Y N N4. Flexible atmospheric model Y Y N X X X Y Y Y Y5. Channel distribution:
— regular Y Y Y X X X Y Y Y Y— irregular Y Y Y X X X Y Y Y Y
6. Optimum beam option Y N N X X X N Y Y N7. Cross-polarization analysis:
— orthogonal Y Y Y X Y X Y Y Y Y— arbitrary Y Y Y X N X N Y Y N
8. Carrier-to-noise and baseband signalto thermal noise ratio Y Y Y Y Y N Y Y Y Y
9. Baseband signal to interference ratios:— FDM /M F N Y Y Y N Y Y N N Y— digital N N N N N Y Y N N Y— SCPC N N N N Y Y Y N N N— video N Y N N N Y Y Y N Y
10. Up-link interference:— noise Y Y Y X X X Y Y Y Y— other source N Y Y X X X Y N N Y
11. Reference patterns option Y Y Y X Y X Y Y Y Y12. Protection margin options:
— co-channel Y Y Y Y Y X Y Y Y Y— adjacent channel Y Y Y N N X Y Y Y Y— equivalent Y Y Y N N X Y Y Y Y
(') PSD: Power spectral density.Y = Yes N = No X = Not applicable

TABLE IIIB — Interference analysis — inputs
Reference number/agency/Administration/program reference
Inputs4
EBU
5.1ORI/USSOUP
5.2RAND/US
5.3FCC/USCONVOLUTION
5.4FCC/US
COORDINATION
5.5NASA/USFDM /FM
PSD
6Canada
7ESA/FR
8Japan/NHK
9IFRB
1. Orbit location Y Y Y X N X Y Y Y Y
2. Channel frequency Y Y Y X Y X Y Y Y Y
3. Polarization Y Y Y X Y X Y Y Y Y
4. Beam parameters Y Y Y X Y X Y Y Y Y
5. E.i.r.p. Y Y Y X Y X Y Y Y ’ Y
6. Test point location Y Y Y X Y X Y Y Y Y
7. Modulation parameters (deviation bandwidth, C /N ratio) Y Y Y Y Y Y Y Y Y Y
8. Receiver characteristics (noise figure, diameter, bandwidth) Y Y Y X Y X Y Y Y Y
9. Atmospheric model data Y Y N X Y X Y Y Y Y
10. Antenna reference patterns Y Y Y X Y X Y Y Y Y
11. Satellite antenna pointing error Y Y Y X X X N Y Y Y
12. Protection ratios Y Y Y Y Y Y Y Y Y Y
13. Allowable telephony baseband noise due to interference N Y N Y N Y N N N N
Y: Yes N: No X: Not applicable

TABLE IIIC — Interference analysis — outputs
Reference number/agency/Administration/program reference
Outputs4
EBU5.1
ORI/US5.2
RAND/US
5.3FCC/USCONVOLUTION
5.4FCC/US
COORDINATION
5.5NASA/USFDM/FM
PSD
6Canada
7ESA
8Japan/NHK
9IFRB
Protection against interference From: To: BC sat. — BC sat. Y Y Y N X Y Y Y YBC sat. — Fixed sat. N Y Y Y X Y N N YBC sat. — Terrestrial BC N Y Y Y X Y N N NBC sat. — Terrestrial fixed N Y Y N. X Y N N NTerrestrial BC — BC sat. N Y Y Y X Y Y N NTerrestrial fixed — BC sat. N Y Y Y X Y Y N NPower flux-density at test points: Y Y Y Y X Y Y Y YLocation o f worst case test points: Y Y Y Y X Y(2) Y Y Y— Interference sources Y Y Y Y X Y Y Y Y— Geometry N Y Y Y X Y Y Y Y— Statistics(‘) Y Y Y Y X N Y Y NGraphical outputs N N N N X Y Y Y NTelephony baseband signal/ interference N Y N Y N Y Y N N Y(3)
(') Margin exceeded at specified percentage or standard deviation o f margin.(2) Manually.(3) Approximate relations for wide band FM carriers [Jeruchim and Kane, 1970].
Y - Yes N = No X = Not applicable

298 Rep. 812
4. Description of other analysis programs
In addition to the interference analysis programs, there are four other programs whose purpose and application are related to that of the interference programs. Their features, inputs, and outputs are also summarized in Table III. The following is a brief description of each program.
4.1 Convolution [FCC, 1975]
This program, written in FORTRAN V for a Univac 1106 computer, calculates the noise power ratio (NPR) of, and the interference power into, the top baseband of a 1200 telephone channel frequency modulated signal from an interfering signal. This is done by using convolution integrals to combine the two normalized radio-frequency power density spectra. Thus, the radio-frequency power spectral densities of both the desired and interfering signals are required as inputs to the program.
4.2 COORD [FCC, 1974]
This program, written in FORTRAN V for a Univac 1106 computer, ,is a computerization of the earth station coordination procedure set forth in Annex 18 to Appendix 28 of the Final Acts of the World Administration Radio Conference for Space Telecommunications (WARC-ST) 1971. COORD can perform the Appendix 28 coordination procedure for either transmitting or receiving earth stations. It should be noted that similar programs have also been developed by other Administrations, see Report 382-3.
4.3 Power spectral density o f F D M /FM carriers [Harper, 1976]
This program, written in BASIC for the Hewlett-Packard 9830 calculator, calculates the power spectraldensity of a sinusoidal carrier frequency or phase modulated at baseband by Gaussian noise of arbitrary powerspectral density. The method of analysis is based on the work of Ferris [1968]. Because the computational method is the Fast Fourier Transform (FFT), the input data must consist of 2N samples, where N is an integer. The input subroutine is presently configured to input either a flat or a baseband as defined in Report 275-3, although arbitrary baseband power spectral densities can be accommodated. One restriction on the input is that the mean square phase deviation of the sinusoidal carrier be finite. The power spectral-density of the modulated carrier is computed by taking the FFT of these samples.
The program will either print out the data or plot it. Accuracy of the output is maintained over a 100 dB dynamic range using 12 digit precision.
The program is currently limited to about 256 input data points due to storage limitations of the 9830 calculator (8000 words).
5. Conclusions
The use of computer-aided evaluations for the synthesis and analysis of orbit-spectrum-polarization assignments has been shown to be valuable. The use of such programs requires the assembly of a comprehensive data base which would include the following:
— test point location (Note 1)
— acceptable orbital arc range
— associated technical parameters for assessing protection margins
— optimum satellite antenna beam characteristics or a description of the border contour of the service zone.
Note 1. — The test points define receiving locations at which the level of interference is to be determined. For practical reasons it is necessary to limit the number of geographical coordinates to be handled in the calculations. Experience has shown that for the European countries 20 test points, evenly distributed on the fringe and over the service area, and 10 additional points outside each country (for the assignment of the inevitable spillover) are generally adequate. This number of test points does not necessarily apply to all situations, and each case should be assessed on its own merits.

Rep. 812 299
ANNEX I
LIST OF DOCUMENTS AND REFERENCES
A ll o f the document numbers refer to the period 1974-1978 Synthesis programs
1. System configuration synthesis and cost evaluation
CCIR Doc. 11/136 (USA) [1974-78] Computer programs for planning broadcasting-satellite systems.“STAMP”: Satellite telecommunications analysis modelling program; by Stagl, T. W. et al., [October 1973]
“Computer-aided communication satellite system analysis and optimization”, Washington University Report R(T)-73/2.
Computer Sciences Corp. [1973] A computer program for evaluating and synthesizing broadcasting satellite systems by G. Knouse, W. Hodge, L. Shameson. Final Report No. 4169-011, Prepared for NASA, Washington, DC.
Communication satellite optimization program, by W. C. Mitchell [June 1975] The use of satellites in meeting the telecommunications needs of developing nations, Ph. D. Dissertation, Stanford University Communication Satellite Planning Center Technical Report No. 1, prepared under NAS A-Ames Grant NGR 05-020-659.
Minimum-cost satellite systems with maximum use of the orbit-spectrum program, by S. P. Russell [June, 1976] Techno-economic considerations in orbit-spectrum utilization, Ph. D. Dissertation, Stanford University Communication Satellite Planning Center Technical Report No. 3.
2. Assignment of orbit, spectrum, and polarization for multiple users of broadcasting satellites
CCIR Doc. 11/59 (TDF/France) [1974-78] Description of software used for planning a broadcastingsatellite system.
Sauvet-Goichon, D. [February, 1976] Method of planning a broadcasting-satellite system. EBU Technical Review, 155.
CCIR Doc. 11/119 (RAI/Italy) [1974-78] Computer program for frequency planning of broadcasting-satellite systems.
3. Interference analysis programs
CCIR Doc. 11/75 (EBU) [1974-78] Evaluation of a pre-determined plan for the assignment of channels,positions on the orbit and polarizations.
Mertens, H. [October, 1975] The evaluation of interference in a plan for satellite broadcasting in the 12 GHz band. EBU Technical Review, 153.
CCIR Doc. 11/136 (USA) [1974-78] Computer programs for planning broadcasting-satellite systems.ORI [1974] Spectrum orbit utilization program user’s manual. Technical Report 830 prepared for NASA/
GSFC, Greenbelt, MD.Reinhart, E. E. [1974] Orbit-spectrum sharing between the fixed-satellite and broadcasting-satellite services
with applications to 12 GHz domestic systems. Rand Corp., Report R-1463-NASA prepared for NASA/GSFC, Greenbelt, MD.
FCC [1975] Convolution method of interference calculation, User’s Manual and Results, FCC Report No. RS75-04, Washington, D.C.
FCC [1974] User’s manual for “COORD” (FCC coordination center program for domestic satellite earth stations) FCC Report No. RS74-03.
Harper, E. L. [1976] A computer program to calculate the spectral density of multi-channel FDM /FM carriers. In preparation, NASA/GSFC, Greenbelt, MD.
Reference: Ferris, C. C. [1978] Spectral characteristics of FDM /FM signals. IEEE Trans, on Communication Technology, Vol. COM-16, No. 2.
CCIR Doc. 11/138 (Canada) [1974-78] A computer simulation used in planning for the WARC-BC.CCIR Doc. 11/145 (ESA) [1974-78] Programs prepared for the World Administrative Radio Conference,
Geneva, 1977.CCIR Doc. 11/167 (Japan) [1974-78] Computer program for evaluation of preliminary plans based on
assumed input information.Document No. 27 submitted to the WARC (BS) of 1977 by the IFRB 29 December, 1976.Jeruchim, M. C., and Kane, D. A. [1970] Orbit/spectrum utilization study, Vol. IV (Available through the
US Government NTIS)
300 Rep. 813
REPORT 813
BROADCASTING-SATELLITE SERVICE (TELEVISION)
Guidelines for the establishment of a standardized set of test conditions and measurement procedures for the subjective and objective determination
of protection ratios for television(Question 5-3/11 Study Programmes 5J-1/11 and 5H-1/11)
(1978)1. Introduction
The protection ratio is the minimum value of the wanted-to-unwanted signal ratio (expressed in dB) at the receiver input, which produces, under specified conditions, a selected grade of impairment of the wanted signal at the output of a receiver *. The protection ratio is useful in planning and operations where multiple transmissions require frequency and orbit sharing between similar or dissimilar transmissions.
Protection ratios for monochrome television systems and for colour television systems using vestigial-sideband amplitude-modulation are found in Recommendation 418-3 and Report 306-3 respectively.
The assessment of protection ratios for television signals is made following the method established in Recommendation 500-1 and taking into consideration Report 405-3.
For satellite broadcasting, numerous measurements of protection ratios have been made by various Administrations under measurement conditions that have differed widely (see Report 634-1). Attempts to reconcile results obtained under differing conditions have not been completely successful. In order to obtain correlation between measurements made by different investigators and to make available to system designers a larger body of common measurements, it would be useful for future measurements to be made under an agreed upon set of conditions, or an equivalent set of conditions. In addition due consideration should be given to correlate measurement procedures with those already established in the CCIR.
This Report presents guidelines for the establishment of a standardized set of test conditions and measurement procedures for the subjective and objective determination of protection ratios (see Decision 17, § 1.1). The Annex I identifies additional protection ratio measurements that would be useful.
2. Measurement procedure
2.1 Protection ratio test arrangements
The values of subjectively measured protection ratios depend on a number of factors which are listed in Table I of Report 634-1.
In order to allow that the results of subjective measurements of the protection ratio made by different Administrations may be properly interpreted and applied, a set of reference case conditions for the factors affecting these subjective measurements must be established. A suitable set of reference case conditions is found also in Table I of Report 634-1.
2.2 Laboratory assessment o f protection ratios
The reference case conditions given in Report 634-1 are suggested.The test pictures used (see Recommendation 500-1) should be chosen from a set available to all
Administrations, so as to allow comparisons of results. Not only is the subjective evaluation of the interference dependent upon the test picture, but also the amount of baseband interference is dependent upon the modulated spectral densities of both signals, and the spectral densities depend on the video content. Test slides generally available are those of the Society of Motion Picture and Television Engineers (SMPTE) subjective colour reference slide series and the Philips test slides for colour television. The test slides from the SMPTE series are selected stills from the SMPTE reference test film. Two slides from each series are provisionally suggested as suitable for the wanted signal during tests on the impairments caused by interference. These are:
I. SMPTE
Colour Television test slides Slides Cat # TV CS-3 No. 1 Beach scene No. 14 Girl in green dress
II. PHILIPS
Test slides for colour television
No. 8 Basket of fruit No. 14 Make-up scene
This definition is in line with the definition of protection ratio found in Report 625-1 (§ 4.3).

Rep. 813 301
In performing television protection ratio measurements, highest priority should be given to tests at the “reference case” conditions given in Report 634-1, and as further qualified by the considerations in this Report. If other test conditions and parameters must be used, they should be defined and correction factors given so that results applicable to the reference test conditions may be deduced. Correction factors for a different modulation index, lack of pre-emphasis, and use of an energy dispersal technique are given in Report 634-1. For other deviations from the reference test conditions, the correction factors are to be determined by the experimenter.
When the use of a video tape recorder will not add to the interference present or will not diminish ormask those interferences; and where the experiment design allows repetitive signals and sequences, it isrecommended that presentations to viewers be made from video tapes. The use of video tape permits presentation to large numbers of viewers with comparative ease, guarantees duplication of test conditions and accompanying commentary, and permits post-test verification of the test conditions shown.
For protection ratio measurements, interferences should be evaluated on the five grade impairment scalegiven in Recommendation 500-1. Wherever possible, information should be provided on the variation ofprotection ratio with the subjective grade. For the purpose of comparing results, it is desirable to provide the results for a mean subjective grade of 4.5 together with the corresponding standard deviation.
ANNEX I
SUGGESTED PROTECTION RATIO MEASUREMENTS
A large body of television protection ratio data already exists for analogue television systems (Reports 306-3 and 634-1). Protection ratios for two AM-VSB television signals, for two FM television signals, and for AM-VSB and FM television signals interfering with each other, have been measured for different frequency offsets, with differing programme material, and for different signal-to-noise ratios. Measurements have been made using the commonly used standards: 525-line standard M(NTSC); 625-line standards B(PAL), G(PAL), I(PAL), K(SECAM) and L(SECAM). However, these measurements have been made under widely differing test conditions. To provide a common reference point among protection ratios measured for the different systems, it is suggested that the following protection ratio measurements be made for each television standard for the “reference case” conditions in Report 634-1 and using the considerations given in the body of this Report.
Wanted signal Interfering signal
FM FMFM AM-VSB
AM-VSB FMAM-VSB AM-VSB
The conditions for the tests should include:— zero frequency offset;— an agreed-upon set of still pictures as test pictures;— use of expert viewers only.
In digital television transmission, protection ratio measurements are needed to determine the susceptibility of digital systems to unwanted analogue modulated signals and unwanted digital signals. The following test matrix is suggested:
Wanted signal Unwanted signal
DigitalDigital
FMDigital
AM-VSB
DigitalFM
DigitalAM-VSB
Digital
The test conditions and procedures for the determination of the protection ratio developed in this Report and in Report 634-1 have not been formulated specifically for digital modulation. Further studies are needed to define more precisely the test conditions and procedures for digital modulation. In the meanwhile, testing should be performed according to the considerations discussed in this Report. To allow comparisons between protection ratios required for the different digital modulation techniques, priority should be given to performing tests under the “reference case” conditions given in Report 634-1.

302 Rep. 814
REPORT 814
FACTORS TO BE CONSIDERED IN THE CHOICE OF POLARIZATION FOR PLANNING THE BROADCASTING-SATELLITE SERVICE
(Study Programmes 20C-2/10 and 5G-2/11)(1978)
1. IntroductionFor purposes of planning the Broadcasting-Satellite Service in the band 11.7 to 12.2 GHz (12.5 GHz in
Region 1), the World Broadcasting-Satellite Administrative Radio Conference, Geneva, 1977, adopted right- and left-hand circular polarization. This Report presents a summary of the factors that were considered in making this choice, both for the record, and for the planning of future systems in other bands that are, or may be, allocated to the Broadcasting-Satellite Service. It is also suggested that the data in this Report be periodically updated.
2. Comparison between linear and circular polarizationThe comparative advantages and disadvantages of linear and circular polarization for use in the
Broadcasting-Satellite Service are summarized in Table I. The symbols in the last two columns of the Table indicate for each factor which type of polarization, linear (L) or circular (C), is considered to have the advantage. In evaluating these comparative advantages and disadvantages, it must of course be recognized that the different factors are not all of equal practical importance and that their relative importance is also a matter of engineering judgement.
TABLE I — Some aspects o f linear as compared with circular polarization
Factor Remarks Advantage (*)
1. Alignment o f receiving antenna
Alignment o f the polarization direction is not necessary for circular polarization
C
2. Effect o f misalignment on cross-polarization
Misalignment o f polarization direction o f both transmitting and receiving antennae required with linear polarization, 2 to 4 dB extra cross- polar protection margins in comparison with circular polarization
C
3. Orientation o f satellite antenna
With linear polarization, the plane o f polarization will not in general correspond to the major or minor axes o f a beam with elliptical cross- section; therefore:
c
(a) it may be difficult to produce a good cross-polar response with linear polarization (in particular for elliptical beams)
c
(b) transfer to a spare satellite at a different orbital position would probably be more difficult with linear polarization because o f the need to realign the polarization plane
c
4. Sharing with other services
(a) If circular polarization is chosen for the broadcasting-satellite service and other services use linear polarization, 3 dB protection between these services and the broadcasting-satellite service is assured
c
(b) If both the broadcasting-satellite and other services, e.g., fixed- satellite and terrestrial services, use linear polarization, then in isolated cases, where the dominant interference arrives near the main beam o f a receiving antenna, it may be possible to increase the isolation by the use of orthogonal polarization
L
5. Propagation effects Circular polarization is more affected by atmospheric conditions than linear polarization for high rainfall rates (greater than 12.5 mm/hour) and low angles o f arrival
For example, the cross-polar attenuation may be 20 dB for 1% of the time with circular polarization according to some measurements in Switzerland [CCIR, 1974-78]. This disadvantage o f circular polarization may not be significant if compared with linear polarization transmission on or near a 45° plane [Shkarofski and Moody, 1976]
L
6. Cost o f receiving antenna
(a) The cost o f circular polarized antennae is somewhat higher than linear polarized antennae
L
(b) If switching between two senses o f polarization is required, the cost of equipment for circular polarization would be somewhat higher.
L
(') C: circular L: linear

Rep. 814 303
To aid in evaluating the importance of satellite antenna orientation on the choice of polarization (item 3 in the Table), a short, quantitative discussion of the effects of system geometry on linear polarization is given in Annex I.
Likewise, for assessing the effects of propagation on the choice of polarization (item 5 in the Table), additional information on depolarization due to rain, including preliminary measured data, is given in Annex II.
BIBLIOGRAPHY
SHKAROFSKI, I. E. and MOODY, H. J. [September, 1976] Performance characteristics o f antennae for direct broadcasting- satellite systems including effects of rain depolarization. RCA Review, Vol 37.
CCIR Document [1974-78]: 9/248 (Switzerland).
ANNEX I
EFFECTS OF SYSTEM GEOMETRY ON LINEAR POLARIZATION
For linear polarization, the received polarization angle will vary as a function of the latitude and longitude of the ground receiving terminal relative to the sub-satellite longitude. The reason for this is the variation in orientation of the reference system (the local horizontal and vertical) with relative geographic location.
The polarization angle of the incident linearly polarized wave, assuming the polarization vector of thetransmitted wave is parallel to the equatorial plane, is given by (ignoring Faraday rotation which is negligible at12 GHz):
Qp = arc tan [(sin AX/tan cp) V\ + [sin 0/(p — cos 0)]2}
where,0p: polarization angle of the incident wave relative to the local horizontal plane,AX,: relative longitude of the receiving ground terminal,0 : earth central angle between the sub-satellite point and the receiving ground terminal
(0 = arc cos [cosAX coscp]), and P : 6.62 (the radius of the geostationary orbit divided by the radius of the earth).This variation of the polarization angle is illustrated in Fig. 1 for various latitudes and relative longitudes.
The angle, 0p is given by the angle that the small vector makes with the AX axis. Contours for elevation angles of 0 and 20 degrees are also shown.
0° 10° 20° 30° 40° 50° 60° 70° 80° 90°Relative longitude, AX (degrees)
FIGURE 1 — Variation of received angle of polarization on the Earth

304 Rep. 814
The polarization angle is seen to vary over a large range with geographical location. Consequently, it seems to be impractical to adjust the polarization of the transmitted wave to insure that it would be received horizontally at all points in the service area.
Because of this variation of polarization angle with latitude and relative longitude, the simple choice of horizontal polarization (the polarization vector parallel to the equatorial plane) for the space station in the broadcasting-satellite service will not insure that it will be received orthogonal to the desired polarization vector (usually vertical) in terrestrial systems.
ANNEX II
DEPOLARIZATION EFFECTS OF RAIN
1. Introduction
In addition to their effects on attenuation, clouds and rain can cause depolarization of the signal. This is due to the nonspherical nature of the water drops in clouds and rain, which results in differential attenuation and differential phase shift for orthogonal polarizations, thus depolarizing the received signal. The magnitude of the effect can be expressed in terms of the cross-polar discrimination D, defined as the ratio in dB of the component of the received signal having the original polarization to the component having the opposite polarization. Dc refers to the case of circular polarization and DL refers to the case of linear polarization.
2. Empirical equations for dependence on attenuation
Statistical analysis of measured results with circular polarization in Region 1 suggests that the cross-polar discrimination can be expressed approximately in terms of the attenuation caused by the atmosphere [CCIR,1974-78a; 1974-78b]. This is quite reasonable because both the differential attenuation and phase shift whichdepolarize the signals increase monotonically with the atmospheric attenuation; thus the depolarization should also increase monotonically with the attenuation. The following empirical equations reflect the Region 1 measurements for three frequencies of interest [CCIR, 1974-78b; 1974-78c].
Dc = 30 — 20 logjo A 11 GHz (1)
Dc = 33 - 20 logio A 18 GHz (2)
Dc = 38 - 20 log10 A 30 GHz (3)
where A is the attenuation in dB.A comparison of these equations with measured data on depolarization due to rain is provided by Figs. 2,
3. and 4. Fig. 2 shows good agreement between Eq. (1) and calculations based on an 11 GHz model derived for ahorizontal propagation path [Taur, 1975].
Attenuation, A (dB)
FIGURE 2 — Comparison between Taur’s calculated data and equation (1) at 11 GHz for circular cross-polar
discrimination, Dc
Curves A: equation (1)B : calculated data [Taur, 1975]

(HP)
Rep. 814 305
30
ffl .T3 w 20
cT
10
0„0 10 20 30 40 50
Attenuation, A (dB)
FIGURE 3 — Comparison between Semplak’s measured data and equation (2) at 18 GHz for circular cross-polar
discrimination, Dc
Curves A : equation (2)B : measured data [Semplak, 1973]
40
30
20
10
00 10 20 30 40 50
Attenuation, A (dB)
FIGURE 4 — Comparison between Chu’s calculated data for median depolarization and equations (1), (2) and (3) at 11, 18 and 30 GHz Jor circular cross-polar discrimination Dc
Curves A: equation (1), 11 GHz D: calculated data for 11 GHzB : equation (2), 18 GHz E : calculated data for 18 GHzC : equation (3), 30 GHz F : calculated data for 30 GHz

306 Rep. 814
Fig. 3 compares Eq. (2) with the median of data points measured at 18 GHz [Semplak, 1973]. Note that the amount of depolarization is a random phenomenon and that Eq. (2) represents a “worst-case” model for the observed data with a margin of about 10 dB relative to the median.
Fig. 4 compares Eqs. (1), (2), and (3) with data on median depolarization calculated for the three frequencies in question [Chu, 1974]. It is seen that, as in Fig. 2, the equations provide margins of from 5 to 10 dB relative to the medians of the measured data. Thus, they can be expected to give reliable worst-case estimates of depolarization effects for designers of systems using circular polarization.
If, for purposes of planning, it were desired to adopt a single figure for the cross-polar discrimination, it would be necessary to choose the fraction of the time for which the figure is to apply. If this were taken as 1% of the worst month, then on the basis of the median values of attenuation given in Table III of Report 215-4, 30 dB would be an appropriate value for the cross-polar discrimination. If, however, it were necessary to take the case of0.1% of the worst month, the value would become approximately 20 dB.
In the case of linear polarization, no approximation formulae similar to Eqs. (1), (2), and (3) have hitherto been proposed, and statistical analysis of measured data is limited. The following approximation formulae are suggested as a preliminary guide for the dependence of cross-polar discrimination on attenuation for linear polarized signals.
Dl = 41 - 20 logjo A 11 GHz (4)
Dl = 44 - 20 logjo A 18 GHz (5)
DL = 49 - 20 logjQ A 30 GHz (6)
Fig. 5 compares Eq. (5) with some measured data obtained in Japan [Shimba et al., 1974] for horizontal linear polarization at 20 GHz.
Fig. 6 compares Eqs. (4), (5), and (6) with measured data obtained in England [Watson and Arbabi, 1973] at 11 GHz, in the USA at 17.71 GHz [Barnett, 1972; Chu, 1974] and at 60 GHz [De Lange et al., 1975]. Figs. 5 and 6 show that Eqs. (4), (5), and (6) generally correspond to the worst points of the measured data.
50
40
30
m■o
20
10
0 10 20 30 40 50 60Attenuation, A (dB)
FIGURE 5 — Measured data in Japan for horizontal linear cross-polar discrimination DL at 20 GHz compared with the curve of equation (5) for 18 GHz. Dots and circles
are measured at two different locations
0
Curve A: equation (5), 18 GHz

Rep. 814 307
Fig. 7 compares Eqs. (4), (5), and (6) with calculated median curves [Chu, 1974] for horizontal depolarization at 11, 18 and 30 GHz. Just as in Fig. 4, the approximation formulae parallel Chu’s curve, but include a margin of about 5 to 8 dB to account for the random variation of the actual depolarization effects. However, more data are still needed to more completely substantiate the approximate expressions.
Recent research shows that the correlation between cross-polarization and attenuation also has a dependence on elevation angle for both circular and linear polarization and a dependence on the polarization direction for the linear case [Watson and Soutter, 1975]. Fig. 8 is one of the calculated results reflecting this effect at 11 GHz. However, curve (3) in Fig. 8(a) and curve (4) in Fig.8(b) represent the worst case for a European satellite system, and they match Eqs. (1) and (4) for 11 GHz to within a few dB. This agreement further demonstrates that the model of Eqs. (1) through (6) gives a good statistical envelope for the observed data covering the worst points. This envelope applies when the elevation angle is much higher than 20° or when the linearly polarized signal is approximately parallel or orthogonal to the plane containing the propagation path and local vertical direction. When the angle of elevation is 20° or less, the empirical curves tend to represent the median depolarization rather than the worst case as confirmed for circular polarization in Fig. 2. Report 546-1 gives an explicit expression for the dependence on the angle of elevation, along with an extensive description of the physics of the propagation mechanisms.
In general the depolarization effects of rain are less when using linear polarization than with circular polarization as long as the polarization vector is aligned with the canting angle of the falling raindrops. This angle is generally within ± 20° of the local vertical. Alignment of the polarization vector orthogonal to the canting angle of the raindrops produces slightly greater depolarization. For the intermediate case, when the polarization angle is oriented 45° with respect to the canting angle of the raindrops, the depolarization is identical (at least theoretically) to that which would be experienced by a circularly polarized wave.
0 10 20 30 40 50
Attenuation, A (dB)
FIGURE 6 — Some measured data and curves for equations (4), (5), and (6) at 11, IS, and 30 GHz for linear
cross-polar discrimination DL
Curves A: equation (4), 11 GHzB: equation (5), 18 GHzC: equation (6), 30 GHz
• • 11 GHz, measured in England
0 © 17.71 GHz, measured in Georgia
OO 60 GHz, measured by DeLange

(dB)
308 Rep. 814
0 10 20 30 40 50Attenuation, A (dB)
FIGURE 7 — Comparison between Chu’s calculated data for median horizontal cross-polar discrimination DL and
equations (4), (5), and (6) at 11, 18, and 30 GHz
Curves A : equation (4), 11 GHz B : equation (5), 18 GHz C : equation (6), 30 GHz D: calculated, 11 GHz E : calculated, 18 GHz F : calculated, 30 GHz

(gp) 3a
(ap)
Rep. 814 309
0 5 10 15 20 25
Attenuation, A (dB)(a) Circular polarization
0 5 10 15 20 25
Attenuation, A (dB)(b) Linear polarization
FIGURE 8 — Calculated cross-polar discrimination as a function of attenuation for a satellite-to-Earth link at 11 GHz
Angle of elevation of satellite: (C): 20° (beam edge, north)(D): 40° (beam edge, east-west,
(A): 60° and polarization angle, 17°)(B): 40° (beam centre)

310 Rep. 814
3. Recent experimental measurements
Measurements at 11.7 GHz of depolarization of circularly polarized waves on a satellite-to-Earth path are being made in the United States and Canada using the beacon on the joint NASA/Canada Communication Technology Satellite (CTS). Preliminary results from a single thunderstorm event are shown in Fig. 9 [Wiley et al., 1976]. These results were obtained in the Blacksburg, Virginia area at an elevation angle of about 40°.
Attenuation, A (dB)
FIGURE 9 — Comparison between measured data and three models for predicting cross-polarization discrimination at 11.7 GHz
Curves A: Switzerland )B : ESA (equation (1)) > modelC : Canada (equation (7)) j O : measured data for the storm
of 14 June 1976 (USA)
Similar measurements have been conducted in Ottawa, Canada where the elevation angle is about 25°. Preliminary results [Nowland and Strickland, 1976] indicate that the observed cross-polar discrimination was more favourable than indicated by the ESA formula. The Canadian results can be expressed by:
D c = 34 - 20 log A (7)
where A is the co-polar attenuation in dB.Figure 9 also includes a plot of the Canadian results and of the ESA formula, which is seen to differ by
4 dB from Eq. (1).Additional measurements at Blacksburg, Va of circular cross-polar discrimination at 11.7 GHz using the
CTS satellite are shown in Fig. 10. The elevation angle to the satellite is 33 degrees and the data are based on continuous monitoring of the CTS beacon during the summer of 1976. The measured data points for individual events are displayed by the different point symbols on the figure. The solid curves on the figure represent theoretical curves for predicted values of D c based on 11 GHz scattering coefficients for oblate drops [Oguchi and Hosoya, 1974] and for spherical drops [Morrison and Cross, 1974]. The upper curve assumed that 60% of the drops are oblate spheroids, and the lower curve assumes 100% oblate spheroids. The measured data are seen to agree closely with the theoretically derived curves.

Rep. 814 311
Depolarization measurements using linear polarization at 20 GHz have also been made at Blacksburg, Va and Holmdel, New Jersey in the United States with the ATS-6 satellite [Ippolito, 1975], and are summarized in Fig. 11. The co-polarized linear component from the satellite transmitter was oriented about 20° from the local vertical at both measuring sites. The figure shows the effects of atmospheric attenuation, primarily due to rain, on depolarization.
The heavy rain event at Holmdel consisted of direct signal attenuation in excess of 50 dB, with the cross-polar discrimination degrading to a value of approximately 15 dB. The light rain event at Blacksburg extended over a 2-hour period with peak rainfall rates of 10 to 15 millimetres per hour.
The two curves shown with dashed lines on the figure are calculated for circular and vertical polarized waves developed for 18.1 GHz [Chu, 1974] and are included for purposes of comparison. They indicate the expected bounds on cross-polarization discrimination based on a theoretical analysis. It has been shown that when the linear polarization is oriented in directions other than vertical and horizontal, the expected depolarization should lie at a value between those for linear polarization and circular polarization. Fig. 11 shows exactly this case.
The snow depolarization data was measured at Blacksburg during a snowfall. However, it is not clear how much of the depolarization may have been caused by rain mixed with the snow or by other residual effects.
REFERENCES
BARNETT, W. T [1972] Some experimental results on 18 GHz propagation. Conf. Rec. 1972 Nat. Telecommunications Conf.
CHU, T. S. [October, 1974] Rain-induced cross-polarization at centimeter and millimeter wave-lengths. BSTJ, Vol. 53, 1557-1579.
DE LANGE, O. E., DIETRICH. A. F., and HOGG, D. C. [January, 1975] An experiment on propagation o f 60 GHz waves through rain. BSTJ, Vol. 54, 169-180.
IPPOLITO, L. J. [November, 1975] ATS-6 millimeter wave propagation and communications experiments at 20 and 30 GHz. IEEE Trans. Aerospace Electron. Systems, Vol. AES-11, 6, 1067-1083.
MORRISON, J. A. and CROSS, M. J. [August, 1974] Scattering of a plane electromagnetic wave by axisymmetric raindrops. BSTJ, Vol. 53, 955-1019.
NOWLAND, W. L. and STRICKLAND, J. S. [October, 1976] Attenuation and depolarization using the 12 GHz transmissions from the Communications Technology Satellite. Presented to Meeting 5 National Committee URSI, Commission F, University of Mass., Amherst. Mass., USA.
OGUCHI, T. and HOSOYA, Y. [1974] Scattering properties of oblate raindrops and cross-polarization o f radio waves due to rain (part II): Calculations at microwave and millimeter wave regions. J. Radio Res. Labs., Vol. 21, 105, 191-259.
SEMPLAK, R. A. [July, 1973] The effect of rain on circular polarization at 18 GHz. BSTJ, Vol. 52, 6, 1029-1031.
SHIMBA, M., MORITA, K. and AKEYAMA, A. [May, 1974] Radio propagation characteristics due to rain at 20 GHz band. IEEE Trans. Ant. Prop., Vol. AP-22, 507-509.
TAUR, R. P. [November, 1975] Rain depolarization measurements on a satellite-earth propagation path. IEEE Trans. Ant. Prop., Vol. AP-23, 854-858.
WATSON, P. A. and ARBABI, M. [October, 1973] Rainfall cross-polarization, comparison o f theory and measurement. IUCRM Colloquium Proc., 1.3-1-1.3-6.
WATSON, P. A. and SOUTTER, D. J. [1975] Dual polarization frequency re-use in satellite communication systems at 11 GHz. IEE Publication No. 126 on Satellite Communication Systems Technology, 294.
WILEY, P. H., STUTZMAN, W. L., MANNS, E. A., MARSHALL, R. E., BASTEAN, C. W., HOLT, S. B., and KAUFFMAN, S. R. [October, 1976] Rain depolarization and attenuation measurements at 11.7 GHz on the CTS spacecraft downlink. Virginia Polytechnic Institute and State University, Blacksburg, Virginia, USA.
CCIR Documents
[1974-78]: a. 10/74 11/123 (EBU); b. 4/102, 10/95, 11/146 (ESA); c. 5/194 (Switzerland).

Cros
s-pol
ar d
iscrim
inat
ion
D
312 Rep. 814
10 20Attenuation, A (dB)
30 40
FIGURE 10 — Cross-polar discrimination Dc at 11.7 GHz measured at Blacksburg, Va with the CTS Satellite
Curves A : calculated for 60 % oblate spherlodlal raindrops B : calculated for 100% oblate spheriodial raindrops
45
40
35
30
25
20
15
10
\
I
V *• ®( 'A />
V
<
\ .
>
».:! c e > ^ ^
//
•* • .. • *>
•••
---------
• •* •
* *■»—
• •
.....
•
10 15 20 25 30Attenuation, A (dB)
35 40 45
FIGURE 11 — Depolarization measurements with ATS-6 at 20 GHz
Curves A: calculated for 18 GHz vertical polarization [Chu, 1974] B : calculated for 18 GHz circular polarization [Chu, 1974] C : heavy rain (Holmdel, N.J.)D : light rain (Blacksburg, Va)E : snow (Blacksburg, Va)

QUESTIONS AND STUDY PROGRAMMES, DECISIONS, RESOLUTIONS AND OPINIONS
Q. 1/11, S.P. 1A/11 313
QUESTION 1/11
COLOUR TELEVISION STANDARDS(1955)
The CCIR
CO N SID ER IN G
(a) that Question 64 did not cover all aspects of the problems arising in the standardization of colour television;(b) that, in Europe at least, the situation in Bands I and III differs from that in Bands IV and V, and that, in deciding on colour systems for Bands I and III, individual Administrations may find it convenient to use systems compatible with their monochrome systems already working in these bands;(c) that, as Bands IV and V have not yet been exploited in many countries, it is desirable and theoretically possible for these countries to achieve a common standard for these bands;( d ) that, in choosing a colour system for Bands IV and V, Administrations may well be influenced by any colour systems which they may have adopted for Bands I and III, and that this possibility complicates the choice of common standards,
U N A N IM O U SL Y D EC IDES that the following question should be studied:
what standards can be recommended for colour television for public broadcasting? Account should be taken of such points as:— satisfactory picture (colour and monochrome) and sound quality;— economical use of bandwidth;— reliable receivers of reasonable cost;— operation of studio, transmitting and relaying equipment;— susceptibility to interference;— compatibilities (see Note 1);— frequency planning;— international exchange of programmes;— scope for development;— the differences between Bands I and III, as compared with Bands IV and V.Note 1. — A compatible colour television system is one that produces acceptable monochrome versions of the colour pictures on existing monochrome receivers. A reverse compatible colour television system is one that produces acceptable monochrome pictures on colour receivers from existing monochrome transmissions: in either case, bandwidths of the colour and monochrome systems may be the same or different.Note 2. — See Report 624-1 and Recommendations 470-1, 471.
STUDY PROGRAMME 1A/11
STANDARDS FOR VIDEO COLOUR-TELEVISION SIGNALS(1965)
The CCIR
UNANIMOUSLY DECIDES that the following studies should be carried out:
1. the preferred colorimetric parameters for representing the television picture;2. the gamma pre-correction;3. the scanning standards that can be recommended, e.g. sequential (field, line, dot), simultaneous or mixed;4. comparison of the various methods of coding and decoding the colour picture information;5. the minimum acceptable bandwidths for the signal components, corresponding to these parameters.Note. — See Report 476-1.

STUDY PROGRAMME IB /11
STANDARDS FOR RADIATED COLOUR-TELEVISION SIGNALS(1955)
The CCIR
UNANIMOUSLY DECIDES that the following studies should be carried out:
comparison of different colour television systems, in terms of the criteria listed in the text of Question 1/11.
This comparison should pay particular attention to colour television systems which are either in operation, or which are, or have been, the subject of experiment.
314 S.P. IB/11, 1C/11, ID/11
STUDY PROGRAMME 1C/11
CONSTITUTION OF A SYSTEM OF STEREOSCOPIC TELEVISION(1958)
The CCIR,
CONSIDERING
(a) the possible future development of stereoscopic television broadcasting;(b) the great utility this form of television may have,
UNANIMOUSLY DECIDES that the following studies should be carried out:
1. Stereoscopic monochrome television
1.1 investigation into the development of methods of providing stereoscopic television, not requiring the use ofspectacles;1.2 study of the possibility of decreasing the bandwidth of stereoscopic television broadcasting, e.g., bytransmitting one picture of the stereoscopic couple with the full standardized bandwidth and the other with a reduced bandwidth on a sub-carrier within the first frequency spectrum;1.3 study of the influence of noise on stereoscopic television pictures and determination of the permissiblesignal-to-noise ratio;1.4 investigation of the design of receivers with direct reproduction of stereoscopic pictures, e.g., by taking the structure o f receiving-tube displays as a basis for the lay-out of the phosphorescent elements;
2. Stereoscopic colour television
2.1 the carrying out of tests, to assess the quality of colour reproduction with binocular mixing of its components, in respect of the stability of picture detail (“field-clash”);2.2 study of the possibility of decreasing the frequency band for stereoscopic colour television, e.g., bytransmitting the green field of the stereoscopic couple with the full standardized band, the red and blue fields being transmitted by means of a sub-carrier within the first frequency spectrum;2.3 research into the design of receivers for the direct reproduction of stereoscopic colour television.Note. — See Report 312-3.
STUDY PROGRAMME ID /11
RATIO OF PICTURE-SIGNAL TO SYNCHRONIZING-SIGNAL(1970)
The CCIR,
CONSIDERING
(a) that it is desirable that both the video and radiated signals should have the same ratio of picture-signal to synchronizing-signal;(b) that it is also desirable that all television systems should employ the same ratio of picture-signal to synchronizing-signal;

S.P. ID/11, IE/11, Q. 2-2/11 315
(c) that modern television receivers might be able to function with a higher ratio of picture-signal to synchronizing-signal than at present used, thus improving transmitter performance,
UNANIMOUSLY DECIDES that the following studies should be carried out:
determination of a single value for the ratio of picture-signal to synchronizing-signal which could be recommended in the future for both the video and radiated signals of all television systems.Note. — See Report 484-1.
STUDY PROGRAMME I E /11
SIMPLIFICATION OF SYNCHRONIZING SIGNALS IN TELEVISION(1970)
The CCIR
UNANIMOUSLY DECIDES that the following studies should be carried out:
the effect of a reduction of the number of equalizing pulses upon:— the quality of field synchronization in monitoring equipment and in domestic receivers;— the quality of interlacing in monitoring equipment and in domestic receivers;— the vulnerability of domestic receivers to interference, especially when the frequency of the interfering signal
has a precise offset from that of the wanted signal;— the sensitivity of domestic receivers with respect to synchronization;— the reliability of synchronization of domestic receivers when operating with an asynchronous power supply;— the special problems that may arise in video tape recording as a result of modifications to the synchronizing
signal.Note. — See Report 626-1.
QUESTION 2-2/11
EXCHANGE OF TELEVISION PROGRAMMES(1966 - 1970 - 1974)
The CCIR,
C O N SID E R IN G
(a) that it is desirable to exchange television programmes between countries;(b) that a variety of television standards is in use;(c) that the number of scanning standards used throughout the world tends to be reduced to two, namely;525-lines, 60 fields per second and 625-lines, 50 fields per second, the line frequencies of which are very close,
U N A N IM O U SL Y D EC IDES that the following question should be studied:
what methods can be used to enable television programmes to be exchanged between countries in the following cases:
1. when the nominal line and field frequencies are the same;2. when both the nominal field frequencies and the numbers of lines are different;3. when the nominal line and field frequencies are the same but the colour television systems are different?Note 1. — Programme exchanges should be considered:— between different monochrome systems,— between different colour systems,— and between monochrome and colour systems.Note 2. — See Report 311-4 and Recommendation 472-1.

316 S.P. 2A/11, Q. 3-1/11, S.P. 3A-1/11
STUDY PROGRAMME 2A/11
TRANSCODING OF COLOUR TELEVISION SIGNALS FROM ONE SYSTEM TO ANOTHER
(1970)The CCIR
UNANIMOUSLY DECIDES that the following studies should be carried out:
1. methods of transcoding from one colour television system to another having the same nominal line and field frequencies;2. tolerances required of a colour television signal to ease the problem of transcoding it into another system. Note. — See Report All-2.
QUESTION 3-1/11
ASSESSMENT OF THE QUALITY OF TELEVISION PICTURES(1951 - 1956- 1970)
The CCIR,
CONSIDERING
(a) that appreciable discrepancies may exist between assessments by different experts of the quality of the pictures given by the television systems now in use or proposed;(b) that these discrepancies are due to the fact that it is usually impossible to obtain simultaneous viewing of the pictures under comparison, to possible variations in quality between apparatus nominally using the same system and to alterations that may occur with time in the characteristics of the equipment used;(c) that, consequently, it would be eminently desirable to have some standard method of measuring television picture quality, which would permit objective comparison of the results obtained in different places and would serve as a guide to the efficient and uniform working of the equipment in service;(d) that the quality of television pictures is determined by the transmission parameters of equipment which can be measured objectively and which can be related to the subjective picture quality,
UNANIMOUSLY DECIDES that the following question should be studied:
1. what standarized methods and means of test, independent of the television standards employed, can be used to measure accurately, and whenever possible, objectively, the deterioration introduced into monochrome and colour pictures by television, taking into account the system, the equipment and the transmission processes;2. what are the relationships between the objective parameters of television signals and the subjective assessments of displayed picture quality?Note. — See Report 313-4 and Recommendation 500-1.
STUDY PROGRAMME 3A-1/11 *
SUBJECTIVE ASSESSMENT OF THE QUALITY OF TELEVISION PICTURES
(1963 - 1966 - 1978)The CCIR,
CONSIDERING
(a) that subjective methods of testing are frequently necessary to assess the relative quality of televisionpictures and the effect of interference and other impairments upon them;(b) that a method for the subjective assessment of the quality of television pictures has been agreed (seeRecommendation 500-1);(c) that the results of subjective tests depend upon the conditions under which they take place and that newtechniques such as digital coding introduce new problems which may require more detailed specification of the recommended method;
This Study Programme is also of interest to the CMTT.

S.P. 3A-1/11, 3B/11, Q. 4-1/11 317
(d) that the results of subjective tests can be analysed and presented in many ways;(e) that the results of subjective tests can be interpreted in many ways;(f) that it is highly desirable to increase the degree of standardization in the methods of testing, analysis,presentation and interpretation of the results of subjective tests, so that true comparisons may be made between results obtained by different workers,
UNANIMOUSLY DECIDES that the following studies should be carried out:
1. on the modifications, if any, to the testing method recommended in Recommendation 500-1 that may be necessary to improve the degree of standardization in the assessment of the quality of television pictures, particularly in relation to problems arising from new techniques such as digital coding;2. on the analysis and presentation of the results obtained in subjective tests;3. on the interpretation of the results;4. on the possible use of the methods mentioned in §§ 1 and 2 during international transmissions.Note. — See Report 405-3.
STUDY PROGAMME 3B/11
SUBJECTIVE ASSESSMENT AND OBJECTIVE MEASUREMENT OF IMPAIRMENTS TO TELEVISION PICTURES
(1978)The CCIR,
CONSIDERING
(a) that the subjective quality of television pictures is determined by the performance quality of eachcomponent in the overall chain, from the picture source up to and including the receiver, and on the laws of addition of the subjective effects;(b) that picture impairment may result from deformation or distortion of the image signal itself, as well asfrom the presence of unwanted signals such as background noise or interference by other radio emissions,
UNANIMOUSLY DECIDES that the following studies should be carried out:
1. the establishment, in an appropriate form facilitating their application as far as possible, of therelationships between the objective parameters of television signals, which are deformed or polluted by unwanted signals, and the subjective assessment of displayed picture quality;2. the establishment of the laws of addition of subjective effects when several causes of picture impairmentare present simultaneously.
QUESTION 4-1/11
RATIO OF THE WANTED-TO-UNWANTED SIGNAL IN TELEVISION(1955 - 1963 - 1970)
The CCIR,
CONSIDERING
that the satisfactory operation of a television service renders it necessary to specify the maximum field strength of interfering or unwanted signals which can be tolerated, without unduly affecting the reception of television programmes,
UNANIMOUSLY DECIDES that the following question should be studied:
1. what is the protection ratio required when two or more television transmitters are operating:— in the same channel,— in adjacent channels,— with dissimilar but partially overlapping bandwidths;
2. what is the protection ratio required against services, other than television, in the shared bands?Note 1. — The reply to the Question should give the protection ratios required when all the transmitters are radiating monochrome signals on the one hand, or colour signals on the other hand, and when the wanted

318 Q. 4-1/11, S.P. 4A-1/11, 4B/11
transmitter is radiating monochrome signals and the others are radiating colour signals and vice versa; and it should take into account all the different signal standards that may be used and should also indicate percentage of time during which protection is desired. Separate answers may be required for various grades of service.Note 2. — See Recommendation 418-3 for monochrome television and Report 306-3 for colour television.Note 3. — See Recommendation 565 for protection against radionavigation transmitters.Note 4. — See Reports 306-3, 481, 485 and Recommendations 418-3, 565.
STUDY PROGRAMME 4A-1/11
RATIO OF THE WANTED-TO-UNWANTED SIGNAL IN TELEVISION
Use of the offset method, when there are large differences between the carrier frequencies of the interfering stations
(1959 - 1963 - 1974)The CCIR,
CONSIDERING
(a) that, when there is partial overlapping of the channels occupied by a wanted and an unwanted signal, offset operation makes it possible to reduce the protection ratios for monochrome television and thus facilitate the planning of television networks over territories where different television standards are used (see Recommendation 418-3);(b) that a similar advantage may possibly be obtained for colour television,
UNANIMOUSLY DECIDES that the following studies should be carried out:
an investigation of the extent to which offset working can be used in colour television, when there are large differences between the carrier frequencies of the wanted and unwanted signals.Note. — See Report 306-3 for information on protection ratios for colour television.
STUDY PROGRAMME 4B/11
RATIO OF THE WANTED-TO-UNWANTED SIGNAL IN TELEVISION
Subjective impairment grades for specifying protection ratios(1978)
The CCIR,
CONSIDERING
(a) that Recommendation 500-1 provides information about the preferred method to be used in subjectivelyassessing impairments in television pictures;(b) that Recommendation 418-3 quotes protection ratios for interference occurring for a small percentage ofthe time (usually between 1% and 10%), but gives no indication of the subjective picture impairment involved;(c) that Recommendation 418-3 also states that protection ratios for “just perceptible” interference would besome 10 to 20 dB greater;(d) that Report 306-3 considers an impairment defined as “definitely perceptible but not disturbing” forinterference that is present for about 10% of the time can be equated to “just perceptible” if present for almost all of the time;(e) that Annex I to Report 634-1 proposes an experimentally obtained protection ratio for continuousinterference equivalent to impairment grade 4.5 using the 5 point scale of Recommendation 500-1 and also contains contributions based on other criteria and other scales;( f) that Report 481 considers the subjective effect of a combination of several co-channel interfering signals ofconstant, but not necessarily equal, levels;

S.P. 4B/11, Q. 5-3/11 319
(g) that Annexes II and III to Report 405-3 provide information that can be of benefit in combining the effect of a number of impairments which may arise simultaneously;(h) that Report 485 concludes that defining only the non-varying protection ratio is not sufficient to define the quality of service nor to define the protection requirements for such service,
UNANIMOUSLY DECIDES that the following studies should be carried out:
1. the impairment grade appropriate for assessing protection ratios of continuous interference and in thevirtual absence of other impairments;2. the relationship between the grade appropriate for continuous interference and those corresponding togreater impairments but present for only small percentages of the time.
QUESTION 5-3/11 *
BROADCASTING-SATELLITE SERVICE (TELEVISION)
Protection from interference(1965 - 1966 - 1970 - 1974 - 1978)
The CCIR,
CONSIDERING
(a) that the World Administrative Radio Conference for Space Telecommunications, Geneva, 1971, allocated certain frequency bands to be shared equally by the broadcasting-satellite service and other space and terrestrial services;(b) that such sharing can lead to mutual interference among services and can affect the efficiency with which the geostationary orbit is utilised;(c) that, in planning systems for shared-frequency operation, it is necessary to specify, for each of the services involved, both the level of wanted signal (field-strength or power flux-density) necessary for satisfactory reception and the level of unwanted signal for interference that may be considered acceptable;(d) that in the case of the broadcasting-satellite service, it would be useful to have specific numerical values for the power flux-density from space stations which would permit distinction between the requirements for “individual reception” and “community reception” (see Recommendation (Spa2 — 15), § 2.13);(e) that the efficiency of frequency and orbii-sharing is sensitive to a number of the technical characteristics of the systems involved, including transmission standards, modulation parameters, and the design of the transmission and reception equipment;(f) that, in view of the already intensive use of existing terrestrial broadcasting bands below 1 GHz in some regions, there is particular interest in the feasibility of using frequencies above 1 GHz for broadcasting from satellites;(g) that, according to the Radio Regulations, the earth-to-space paths used for connection between earth stations at specified fixed points and satellites used for space services other than the Fixed Satellite Service, are part of the Fixed Satellite Service;(b) that the amount of spectrum allocated for earth-to-space paths in the Fixed Satellite Service is substantially less than the aggregate amount allocated for space-to-earth paths in the Fixed Satellite Service and in the other space services whose connecting earth-to-space paths are part of the Fixed Satellite Service;(j) that this disparity in allocations can adversely affect orbit and spectrum utilisation by both the Fixed Satellite Service and the other space services including the Broadcasting-Satellite Service,
UNANIMOUSLY DECIDES that the following question should be studied:
1. what accuracy of orbit positioning or station-keeping can be achieved;2. what are the values of field-strength or power flux-density necessary to provide satisfactory reception of a broadcasting-satellite service for:— individual reception,— community reception;
This Question is analogous to Question 20-3/10 and should be studied in conjunction with Question 34-2/10 and Question 23-2/11; contributions to the study of this Question should be communicated to Study G roup 10 and the results o f the study should be communicated to Study Groups 1, 2, 4, 8 and 9.

320 Q. 5-3/11, S.P. 5G-2/11
3. what is the ratio of wanted-to-unwanted signal required for the prescribed grade of service (protectionratio) and what are the effects of interference reduction techniques, such as polarisation discrimination, carrier interleaving and carrier energy-dispersal, considering all relevant combinations of signal standards and modulation parameters for analogue and digital transmissions;4. what values for the amplitude of interference caused by other terrestrial and other space radiocommunication services, and what statistical distribution in time, may be considered acceptable in the broadcasting-satellite service;5. what acceptable modifications to the preferred characteristics of communication satellite systems in otherservices, could assist the sharing of allocated frequency bands, taking into account typical demands for service, total system costs, and the efficient use of both the spectrum and the geostationary orbit;6. with which terrestrial services and space services other than the Fixed Satellite Service would it be feasibleto share frequencies with earth-to-space paths used for connection to broadcasting-satellites;7. what sharing criteria and conditions of use should be adopted to facilitate such sharing?Note 1. — Besides the Study Programmes derived from the present Question, reference can be made to StudyProgramme 25D/11.Note 2. — See Reports 631-1, 632-1 and 633-1.
STUDY PROGRAMME 5G-2/11 *
BROADCASTING-SATELLITE SERVICE (TELEVISION)
Use of the 12 GHz band(1972 - 1974 - 1978)
The CCIR,
CONSIDERING
(a) that the World Administrative Radio Conference for Space Telecommunications, Geneva, 1971, allocated a band of frequencies at about 12 GHz on a primary shared basis to the broadcasting-satellite service and to other services, the requirements of which must be respected;(b) that the World Broadcasting-Satellite Administrative Radio Conference, Geneva, 1977, established a plan for Regions 1 and 3 assigning frequencies and orbital positions for broadcasting-satellites allocated to this band;(c) that, in view of the decision to hold a Regional Administrative Radio Conference for the detailed planning of the space services in the 12 GHz band in Region 2 not later than 1982, (see Resolution No. G of the Final Acts of the World Broadcasting-Satellite Administrative Radio Conference, Geneva, 1977) a considerable amount of technical information will be required to insure the success of this Regional Conference;(d) that additional studies are required to determine the protection ratios necessary to prevent unacceptable interference between the broadcasting-satellite service and other services, especially when systems in the broadcasting-satellite service employ digital modulation;(e) that it is necessary to make the best possible use of the geostationary-satellite orbit and of the frequency bands allocated to the broadcasting-satellite service;(f) that, whenever possible, the service area should be the minimum necessary to provide the required coverage;(g) that it may be necessary to take into account the effects of propagation anomalies such as sand and dust storms and precipitation attenuation and depolarisation at low angles of elevation in all rain-climatic zones,
UNANIMOUSLY DECIDES that the following studies should be carried out:
1. determination for Region 2 of the essential technical parameters to be recommended for the preparation of a plan assigning both geostationary-satellite positions and frequencies for the broadcasting-satellite service in the 12 GHz band, or, if appropriate, for application of other techniques to ensure equitable use of the geostationary satellite orbit and of the frequency spectrum;2. determination of the necessary protection ratios affecting interference from other services allocated to this frequency band, into the broadcasting-satellite services, especially when systems in the broadcasting-satellite service employ digital modulation; **
* Similar to Study Programme 20C-2/10.** The need for studies to determine the necessary protection ratios to prevent harmful interference from the broadcasting-
satellite service to other services in the 12 GHz band should be brought to the attention of Study Groups 2, 4, 8 and 9.

S.P. 5G-2/11, 5H-1/11 321
3. determination of upper limits for the signal level from transmissions of other services allocated to this frequency band, to ensure that no more than an acceptable degree of interference is caused, taking into account the necessary protection ratios as well as the directivity and polarisation discrimination of the receiving antennae;4. determination for Region 2 of practicable techniques for carrier energy-dispersal of broadcasting-satellite transmissions that would be expected to reduce interference to other services;5. determination for Region 2 of whether some sharing criteria are necessary and, if so, the values thereof;6. relationship between those sharing criteria that result from laboratory tests on the one hand, and the sharing criteria that result from any actual field trials, on the other hand;7. the effects of propagation anomalies, especially sand and dust-storms and precipitation attenuation at low angles of elevation in all rain climatic zones;8. determination of the level of the cross-polarised component relative to the co-polarised component.Note. — See Reports 809, 811, 812 and 814.
STUDY PROGRAMME 5H-1/11
BROADCASTING-SATELLITE SERVICE (TELEVISION)
Criteria to be applied for frequency sharing between the broadcasting-satellite service and the terrestrial broadcasting
service in the frequency range 620 to 790 MHz(1974 - 1978)
The CCIR,
CONSIDERING
(a) that the World Administrative Radio Conference for Space Telecommunications, Geneva, 1971, recommended provisional values for the maximum power flux-density at the surface of the Earth, by a space station in the broadcasting-satellite service, operating in the frequency range 620 to 790 MHz;(b) that these values should not be exceeded within the territory of a country without the agreement of the Administration of that country;(c) that the transmission of unmodulated carrier waves should be avoided;(d) that, at present, insufficient data exist to permit definite values for the power flux-density to be specified;(e) that additional information is needed on the protection ratio required from a frequency-modulationtelevision system into a vestigial-sideband television system for both 525-line and 625-line systems;(f) that the values for minimum field-strength to be protected given in Recommendation 417-2 may require examination for currently employed terrestrial television systems;(g) that it may be necessary to take into account the effects of ground reflections;(h) that the values of protection ratio may be reduced if methods of carrier energy dispersal are used,
UNANIMOUSLY DECIDES that the following studies should be carried out:
1. consideration of the provisional values for power flux-density quoted in § (a) with a view to replacing them by definitive values;2. determination of values of the protection ratio for 525-line and 625-line vestigial-sideband television systems for interference from a frequency-modulation television or sound signal;3. what effect does the level of random noise have on the permissible value of the signal-to-interference ratio measured within the passband of an amplitude-modulation, vestigial-sideband receiver for various systems of television;4. the minimum values of field-strength to be protected for the terrestrial television service taking into account the current state of development;5. the effects of ground reflection;6. determination of the number of broadcasting satellites that may be visible from a terrestrial broadcasting-receiver;7. the effects of polarisation discrimination;8. the effects of the directivity patterns of the antennae employed;

322 S.P. 5H-1/11, 5J-1/11
9. the advantages, if any, to be gained from the use of carrier energy-dispersal techniques in the television broadcasting-satellite service;10. methods of taking into account the effect of interfering signals from terrestrial broadcasting and broadcasting-satellite services that may be present simultaneously;11. the effect of the characteristics of conventional amplitude-modulation, vestigial-sideband receivers of various television systems on the permissible value of the signal-to-interference ratio measured in the receiver;12. how the ratio of the total power of an unwanted frequency-modulation signal to the power of that signal falling within the passband of an amplitude-modulation, vestigial-sideband receiver (for various television systems) varies as a function of the frequency deviation and the separation of the carrier frequencies of the wanted and unwanted signals;13. the effect that the bandwidth of transmission or reception would have on the frequency sharing criteria;14. consideration of the establishment of correlation between simulated laboratory test results and the results of any field trials;15. the effect that synchronisation, or lack of it between the wanted and unwanted signals, would have on the protection ratio.Note. — See Reports 634-1 and 813.
STUDY PROGRAMME 5J-1/11
BROADCASTING-SATELLITE SERVICE (TELEVISION)
Criteria to be applied for frequency sharing between the broadcasting-satellite service and the terrestrial and
space services in the frequency range 2500 MHz to 2690 MHz(1974 - 1978)
The CCIR,
CONSIDERING
(a) that the World Administrative Radio Conference for Space Telecommunications, Geneva, 1971, established values for the maximum power flux-density at the surface of the Earth from a space station in the broadcasting- satellite service to provide adequate protection to the fixed and mobile service allocations in the 2500 to 2690 MHz range;(b) that additional studies are required to determine the necessary protection ratios to prevent unacceptable interference between the broadcasting-satellite service and the fixed satellite service allocations in this frequency range in Regions 2 and 3; *(c) that it is necessary to make the best possible use of the geostationary satellite orbit and of the frequency bands allocated to the broadcasting-satellite service;(d) that, whenever possible, the service area should be the minimum necessary to provide the required coverage;(e) that, at present, insufficient data exist to permit definite values for the maximum power flux-density to be specified;(f) that it may be necessary to take into account the effects of propagation anomalies,
UNANIMOUSLY DECIDES that the following studies should be carried out:
1. determination of the necessary protection ratios for interference to the broadcasting-satellite service from the fixed satellite service in the range 2500 to 2690 MHz;2. determination of upper limits for the signal level from transmissions of the fixed satellite service allocated to this frequency band, to ensure that no more than an acceptable degree of interference is caused, taking into account the necessary protection ratios, as well as the directivity and polarisation discrimination of the receiving antennae;
The need for studies to determine the necessary protection ratios to prevent unacceptable interference from the broadcasting-satellite service to the fixed satellite service with allocations in this frequency range in Regions 2 and 3 should be brought to the attention of Study Groups 2, 4, 8 and 9.

S.P. 5J-1/11, 5L/11 323
3. determination of practicable techniques for carrier energy-dispersal of broadcasting-satellite transmissions which would be expected to reduce interference to other services;4. relationship between those sharing criteria that result from simulated laboratory tests on the one hand, andthe sharing criteria that result from any actual field trials on the other hand;5. determination of the essential technical parameters;6. consideration of the values for maximum power flux-density with a view to revising the present values;7. consideration of the effects of propagation anomalies.Note. — See Reports 634-1 and 813.
STUDY PROGRAMME 5L/11 *
FREQUENCIES FOR THE CONNECTION TO A BROADCASTING SATELLITE (TELEVISION)
(Question 5-3/11)(1978)
The CCIR,
CONSIDERING
(a) that under the Radio Regulations, the Earth-to-space paths used for the connection between earth stations at specified fixed points and satellites used for services other than the fixed satellite service (including the broadcasting-satellite service, all the mobile satellite services, all the radionavigation satellite services, the meteorological satellite service, and the Earth exploration satellite service) are a part of the fixed satellite service;(b) that the demands such other services may place on the spectrum allocated to the fixed satellite service(Earth-to-space) may be great;(c) that the amount of spectrum allocated to the fixed satellite service (Earth-to-space) is substantially lessthan the aggregate amount allocated to the fixed satellite service (space-to-Earth) and the aforementioned other space services;(d) that the use by one service of an Earth-to-space frequency may prevent a co-located satellite of anotherservice from using, not only that frequency, but also a corresponding frequency for the space-to-Earth path, thus reducing orbit and spectrum utilisation;(e) that the World Broadcasting-Satellite Administrative Radio Conference, Geneva, 1977, recommended thatthe CCIR study up-links for broadcasting satellites and prepare a Report for the Special Preparatory Meeting of CCIR Study Groups to be held for the preparation of technical data for the 1979 World Administrative Radio Conference;(f) the need for ample information on the characteristics of up-links for planning the broadcasting-satelliteservice;(g) that the protection ratios in the up-links to broadcasting-satellites may be greater than those in thedown-links;(b) that in the implementation of broadcasting-satellite systems, consideration must be given to all aspects ofassociated space operation service functions (tracking, telemetry, telecommand and ranging) in connection with the operation of broadcasting-satellites;(j) that in the implementation of Earth-to-space connections serving the broadcasting-satellite service, fullconsideration should be given to the operational requirements of that service,
UNANIMOUSLY DECIDES that the following studies should be carried out:
1. determination of techniques and criteria for sharing the frequencies allocated to the fixed-satellite service between up-links for broadcasting-satellites and links for fixed satellites, in a way that permits both services to utilise their existing allocations for space-to-Earth paths to the maximum extent possible, while respecting the imperatives of broadcasting operation;
* This Study Programme is analogous to Study Programme 20D /10, and is o f interest to Study Group 4. Account should be taken o f Studies carried out under Study Programme 2K-2/4.

324 S.P. 5L/11, Q. 6/11, S.P. 6A/11
2. determination of techniques and criteria for sharing frequencies between Earth-to-space paths used forconnection to broadcasting satellites and terrestrial services and space services other than the fixed satellite service (such as the mobile satellite services, the radionavigation satellite services, the meteorological satellite services and the Earth exploration satellite services) using the same frequency band;3. determination of the radiation and polarisation characteristics of receiving antennae of space stationsserving the broadcasting-satellite service which, singly or in combination with other means of discrimination, would give the necessary protection ratios for the up-links of broadcasting-satellites occupying a given position in the geostationary satellite orbit;4. determination of the requirements for adjacent-channel isolation in up-links for broadcasting-satellitesoccupying a given position in the geostationary satellite orbit.
QUESTION 6/11
GHOST IMAGES IN TELEVISION(1966)
The CCIR,
CONSIDERING
(a) that it is often necessary to locate a television transmitting antenna in the vicinity of other antennastructures;(b) that this can result in undesirable ghost images in the received picture,
UNANIMOUSLY DECIDES that the following question should be studied:
1. what factors must be considered to ensure satisfactory ghost-free operation;2. how can these factors be evaluated?Note. — See Report 478.
STUDY PROGRAMME 6A/11
GHOST IMAGES IN TELEVISION
(1966)The CCIR
UNANIMOUSLY DECIDES that the following studies should be carried out:
1. the ratio of direct-to-delayed reflected signal required for satisfactory television service, taking into account:— polarity of the ghost images;— displacement of ghost images from wanted images;
2. the methods of calculation to be used to determine the ratio and displacement of the direct and reflected signals which result from antenna structures in the vicinity of television radiators, taking into account factors such as radiation, polarization, etc.

Q. 7-1/11, S.P. 9A-1/11 325
QUESTION 7-1/11
RECOMMENDED CHARACTERISTICS FOR INDIVIDUAL OR COLLECTIVE TELEVISION ANTENNA SYSTEMS FOR DOMESTIC RECEPTION OF SIGNALS FROM TERRESTRIAL TRANSMITTERS
(1965 - 1970)The CCIR,
CONSIDERING
(a) that the antenna and its associated components are important elements of the transmission chain;(b) that their characteristics have an influence on the performance of receivers,
UNANIMOUSLY DECIDES that the following question should be studied:
what characteristics should be recommended for individual or collective domestic television antennae and associated equipment?Note. — See Report 482.
STUDY PROGRAMME 9A-1/11 *
DISTORTION OF TELEVISION SIGNALS IN THE RECEPTION OF VESTIGIAL-SIDEBAND EMISSIONS
(1956 - 1974)The CCIR,
CONSIDERING
(a) that vestigial-sideband emission of television signals is an accepted practice in broadcasting;(b) that this class of emission, in receivers using envelope-detection, results in overall distortion, which is a combination of:— quadrature distortion inherent in the method,— distortion caused by non-uniformity of group-delay in transmitter circuits,— distortion caused by non-uniformity of group-delay in receiver circuits;(c) that synchronous detection when used in the receiver can eliminate quadrature distortion in the absence of any carrier phase-modulation introduced at the transmitter;(d) that the method of detection might affect some parameter tolerances at the transmitter;(e) that vestigial-sideband emission of television signals in several applications involves international transmissions,
UNANIMOUSLY DECIDES that the following studies should be carried out:
1. the quantitative assessment of the respective distortion introduced in a television system using vestigial- sideband emission, when envelope-detection is used in the receiver, due to:— quadrature error,— group-delay error at the transmitter,— group-delay error at the receiver;2. the quantitative assessment of distortion introduced in a television system using vestigial-sideband emission when synchronous detection is used at the receiver, with particular reference to carrier phase-modulation introduced at the transmitter;3. suitable methods to be adopted for measuring and correcting such distortion;4. the extent to which such corrections should be introduced at the transmitter.
* This Study Programme does not derive from any Question at present under study.

326 S.P. 11 A-1/11, 12A-2/11
STUDY PROGRAMME 11A-1/11 *
REDUCTION OF THE BANDWIDTH REQUIRED FOR A TELEVISION SIGNAL
(1958 - 1974)The CCIR,
CONSIDERING
that the large channel bandwidth required for the transmission of television signals introduces both technical and economic problems,
UNANIMOUSLY DECIDES that the following studies should be carried out:
the ways in which removal of redundant information and knowledge of the visual characteristics of the human observer can be exploited to reduce the bandwidth required for transmission without perceptible reduction in the quality of the reproduced picture.Note. — See Report 315-4.
STUDY PROGRAMME 12A-2/11 *
INSERTION OF SPECIAL SIGNALS IN THE FIELD-BLANKING INTERVAL OF A TELEVISION SIGNAL
(1962 - 1963 - 1966 - 1974 - 1978)The CCIR,
CONSIDERING
(a) that it is already current practice in a number of countries to insert special signals in the field-blanking interval of a television signal;(b) that such signals can be used for checking the performance of the circuits over which the television signal is transmitted;(c) that such signals can be used as a reference and certification tool for adjustment of the waveform characteristics of a distorted programme signal so that the original characteristics of the picture are restored;(d) that such signals might also be used for various other purposes, for example:— supervision and control,— transmission of information associated with the programme,— transmission of sound,— transmission of other information,
UNANIMOUSLY DECIDES that the following studies should be carried out:
1. whether special signals can be inserted in, and removed from, the field-blanking interval of the television signal, without detriment to the quality of the television picture itself;2. the purposes for which such signals should be used internationally;3. the points at which these signals should be inserted in the international television connection and, possibly,removed again;4. the provisions to be made to avoid confusion between signals for national and international use;5. the forms of special signals to be recommended for international use;6. the position in the field-blanking interval of signals for measuring the characteristics of television networks;7. the position in the field-blanking interval of signals associated with control functions and the transmission of operational or other information;8. the best system of encoding for the signals referred to in § 7.
* This Study Programme does not derive from any Question at present under study.

S.P. 12B/11, Q. 13/11 327
STUDY PROGRAMME 12B/11 *
REDUCTION OF CHANNEL BANDWIDTH IN TELEVISION BROADCASTING BY INCORPORATING THE SOUND INFORMATION IN THE VIDEO SIGNAL
(1978)The CCIR,
CONSIDERING
(a) the importance of an efficient utilization of the frequency spectrum, particularly with a view to the forthcoming World Administrative Radio Conference;(b) that techniques are available to reduce the channel bandwidth of terrestrial television broadcasting systems by incorporating the sound information in the video signal;(c) that the same techniques might be used to reduce the difficulties arising from certain system parameters in satellite television broadcasting;(d) that the consequent change in the television system might result in:— an improvement in the picture quality by eliminating the need for a combining filter in transmitters and a
sound trap in receivers;— an improvement of sound quality by eliminating the problems inherent in intercarrrier sound detection;— the elimination of the problem of sound-to-vision intermodulation in certain transmitters and in cable
distribution systems;(e) that there would be serious compatibility problems in introducing such techniques into existing television broadcasting services, especially for receivers,
UNANIMOUSLY DECIDES that the following studies should be carried out:
1. the transmission of sound information in the video signal while maintaining compatibility with existing television broadcasting systems;2. the required channel bandwidth and the necessary protection ratios for television broadcasting systems without a separate sound carrier.
QUESTION 13/11 **
SPECIFICATIONS FOR LOW-COST TELEVISION RECEIVERS(1968)
The CCIR,
CONSIDERING
(a) Resolution 163 (VIII) adopted by the Economic Commission for Africa at its Eighth Session, Lagos,13-25 February 1967;(b) that the advantages of television should be made more easily available to the populations of the countries where at present the density of receivers is particularly low for economic, geographic or technical reasons;(c) that, to this end, it is desirable that efficient television receivers should be available at prices low enoughto secure their wide distribution in these countries;(d) that general agreement on the performance of suitable television receivers would prove most useful toradio receiver manufacturers by assisting them to produce suitable receivers having an agreed adequate standard performance at the lowest possible cost,
UNANIMOUSLY DECIDES that the following question should be studied:
what performance specifications should be drawn up for one or more types of television receiver, suitable for production in large quantities at the lowest possible cost, the receivers to meet the requirements applying to the countries mentioned in § (b)l Note. — See Report 483-2.
* This Study Programme does not derive from any Question at present under study.** This Question also concerns Study Group 1, the Chairman of which should be kept informed o f the results obtained by
Study Group 11 as they become available.

328 Q. 14-1/11, S.P. 14A-1/11
QUESTION 14-1/11
SUBJECTIVE QUALITY TARGETS OF OVERALL TELEVISION SYSTEMS
(1970 - 1978)The CCIR,
CONSIDERING
(a) that, in some parts of the world, television transmission circuits much longer than 2500 km and including satellite links, either exist or are under construction;(b) that, with the advent of communication satellites, new types of television service are possible;(c) that the evaluation and planning of systems to provide these services requires a knowledge of desirable subjective quality targets,
UNANIMOUSLY DECIDES that the following question should be studied:
1. what are the desirable subjective quality targets of an overall television system, from picture source to receiver, for the various types of service;2. when defining these targets, what characteristics of reference receiving installations should be considered? Note. - See Report 805.
STUDY PROGRAMME 14A-1/11
SUBJECTIVE QUALITY TARGETS OF OVERALL TELEVISION SYSTEMS AND ALLOCATION OF TOLERANCES
(1970 - 1978)The CCIR,
CONSIDERING
(a) that the performance of a television service is determined by the performance of all the component parts of the equipment used in providing it;(b) that the relationship between subjective picture quality, the objective measurement of impairment and the law of addition of these effects are under study (Study Programme 3B/11);(c) that Study Programme 13D/CMTT, § 2, deals with the determination of the objective performance of reference chains consistent with the desirable subjective overall quality,
UNANIMOUSLY DECIDES that the following studies should be carried out:
1. the quality targets that must be specified in the design of the various kinds of television services planned or in existence;2. the typical composition of overall television systems from the picture source up to, and including, the receiver, likely to be designed for the various services;3. the laws of addition of impairments throughout the chain;4. the allocation of the total tolerances specified among the component parts of the chain, from the picture source up to, and including, the receiver, taking into account the statistical behaviour of departures from the nominal performance figures of the equipment.Note. — See also Study Programme 13C/CMTT.

S.P. 14B/11, Q. 15/11 329
STUDY PROGRAMME 14B/11
SUBJECTIVE QUALITY TARGETS OF OVERALL TELEVISION SYSTEMS
Reference receiving installations(1978)
The CCIR,
CONSIDERING
(a) that television receiving installations are important factors in making subjective appraisals of an overall television system from picture source up to, and including, the receiver;(b) that the definition of a reference receiving installation would be of value,
UNANIMOUSLY DECIDES that the following studies should be carried out:
1. the assembly and presentation of data, duly kept up to date, which define the principal characteristics of receivers and antennae, which together form a receiving installation, to be used in meeting the required subjective quality targets for an overall television system. Studies should take account of the relevant documents of the International Electrotechnical Commission (IEC);2. the analysis of the data and preparation of a draft specification for a reference receiving installation.
QUESTION 15/11
AUTOMATIC MONITORING OF TELEVISION STATIONS *(1970)
The CCIR,
CONSIDERING
(a) that the number of television broadcasting and relaying stations is constantly growing;(b) that the increasing demands on television stations (especially in connection with the introduction of colour television) call for higher accuracy and objectivity in monitoring;(c) that the considerations in §§ (a) and (b) above impose exacting requirements for monitoring and . jring equipment and on the qualifications of servicing staff, with the result that the operation of television stations is becoming more costly;(d) that the introduction of fully automated television stations necessitates the automation of monitoring and the automatic maintenance of quality parameters;(e) that Administrations are interested in the greatest possible unification of methods and equipment used in monitoring and measurement at transmitting stations and in the video and sound channels of long distance international links,
UNANIMOUSLY DECIDES that the following question should be studied:
1. what characteristics and quality parameters of television stations must be monitored automatically during transmission;2. what are the most effective methods of automatic monitoring;3. what signals are best suited to automatic monitoring;4. how should the automatic monitoring system be organized;5. what are the basic requirements regarding equipment and the methods used for automatic monitoring;6. what are the effects of automatic monitoring during transmission upon the extent to which routinemeasurements are required and the equipment required for them;7. to what extent is it possible to unify the methods and devices for monitoring television stations with themethods and devices used in other sections of a television chain;8. what are the most efficient ways of using monitoring results for the automatic maintenance of qualityparameters and to ensure the satisfactory operational control of the station?Note. — See Reports 628-1 and 804.
This Question, which is intended to cover both the picture and the associated sound transmitters, has been brought to the notice of Study Group 10.

330 Q. 17-2/11, 18-1/11, S.P. 18A-1/11
QUESTION 17-2/11
OPTICAL SOUND RECORDING AND REPRODUCING STANDARDS FOR THE INTERNATIONAL EXCHANGE OF TELEVISION PROGRAMMES
(1966 - 1970 - 1974 - 1978)The CCIR,
CONSIDERING
(a) that, when films intended for the international exchange of television programmes have optical soundtracks, these sound tracks do not always give satisfactory reproduction in telecine equipment;(b) that compression of the sound signal is invariably used to obtain a satisfactory signal-to-noise ratio;(c) that the signals reproduced from optical sound tracks have noticeably different quality from thoseoriginating from other programme sources;(d) that the sound programme of feature films originally produced for screening in motion picture theatres is often recorded on an optical track, having a recording characteristic differing from that specified in Recommendation 265-3, § 4.1,
UNANIMOUSLY DECIDES that the fo llow in g question should be studied:
1. what is the optimum compression characteristic for optical sound tracks, consistent with satisfactory signal-to-noise ratio;2. is it possible, by the use of volume expansion in telecine reproducing equipment, or by other means, to reduce the difference between the sound quality obtained from optical tracks and that obtained from other programme sources;3. is it possible to approximate by a single average the recording characteristic most frequently used for recording the optical sound track of feature films and to recommend the adoption on telecine chains, when broadcasting feature films, of a de-emphasis network which will reasonably match the average characteristic, giving, at the same time, a satisfactory signal-to-noise ratio?
QUESTION 18-1/11
RECORDING OF TELEVISION PROGRAMMES ON MAGNETIC TAPE(1963 - 1970 - 1978)
The CCIR,
CONSIDERING
that various types of equipment are being developed for the magnetic recording of television programmes in both analogue and digital form,
UNANIMOUSLY DECIDES that the following question should be studied:
1. what are the methods which can be adopted by broadcasting organisations for the magnetic recording of television programmes, using either analogue or digital signals;2. what standards should be established, for both analogue and digital signals, to facilitate the international exchange of such recordings?Note. — Account should also be taken of studies being carried out under Question 25-1/11.
STUDY PROGRAMME 18A-1/11
RECORDING OF TELEVISION PROGRAMMES ON MAGNETIC TAPE(1965 - 1970 - 1978)
The CCIR,
CONSIDERING
(a) that there is at present a system of magnetic recording of television programmes used for the international exchange of programmes;(b) that a study should be made of possible improvements to both the mechanical and the electronic aspects of the system,

S.P. 18A-1/11, 18B-1/11, 18D/11 331
UNANIMOUSLY DECIDES that the following studies should be carried out:
1. standards for the geometric and kinematic characteristics of the machines, with a view to facilitating theinternational exchange of programmes using any CCIR television system;2. the best methods of dealing with analogue or digital video signals in relation to the overall quality of thesystem;3. standards relating to the use of tracks for the analogue or digital recording of sound;4. the establishment of a single format for the international exchange of recorded programmes in digital form.Note 1. - Account should also be taken of studies being carried out under Study Programmes 22A-1/11, 25A /11 and 25B/11.Note 2. — See Report 630-1 and Recommendation 469-2.
STUDY PROGRAMME 18B-1/11
STANDARDS FOR THE INTERNATIONAL EXCHANGE OF TELEVISION PROGRAMMES ON MAGNETIC TAPE
Helical-scan recording (full broadcast quality)(1970 - 1978)
The CCIR,
CONSIDERING
(a) that the quality of helical-scan magnetic recordings of television programmes obtainable with some equipment is proving acceptable for the exchange of programmes;(b) that a variety of standards would be wasteful and impede the international exchange of programmes,
UNANIMOUSLY DECIDES that the following studies should be carried out:
1. the minimum requirements necessary to specify the performance of magnetic helical-scan recorders, inorder to define the standards for the international exchange of programmes;2. the tape width, spool dimensions, and recording format.Note 1. — Account should also be taken of studies being carried out under Study Programme 18F/11.Note 2. — See Report 803.
STUDY PROGRAMME 18D/11
INTERNATIONAL EXCHANGE OF TELEVISION RECORDINGS FOR PROGRAMME EVALUATION
(1974)The CCIR,
CONSIDERING
(a) that, for the purpose of evaluating the contents of television programmes offered for subsequentbroadcasting, there is the need for the international exchange of recorded television programmes;(b) that it may prove convenient and economical to use, for these exchanges, recordings conforming tostandards which have technical characteristics inadequate for transmission, but still adequate for satisfactory viewing of the programmes (black-and-white and colour),
UNANIMOUSLY DECIDES that the following studies should be carried out:
1. the recording formats that can be used for international exchange, without prior bilateral agreement;2. the characteristics that should be met by the recording to ensure interchangeability, within each of thechosen formats.

332 S.P. 18E/11, 18F/11, Q. 20-1/11
STUDY PROGRAMME 18E/11
RECORDING OF TELEVISION PROGRAMMES ON MAGNETIC TAPE
Colour-field sequence(1978)
The CCIR,
CONSIDERING
(a) that television programme production techniques demand the extensive use of electronic editing in magnetic tape recording;(b) that lack of continuity of the colour-field sequence in recordings can result in undesirable disturbances in the picture on replay,
UNANIMOUSLY DECIDES that the following studies should be carried out:
1. the appropriate techniques to ensure continuity of the PAL 8-field sequence immediately before and after an electronic edit, for the various magnetic tape formats that are in use or proposed;2. the appropriate techniques to ensure continuity of the NTSC 4-fleld sequence immediately before and after an electronic edit, for the various magnetic tape formats that are in use or proposed.
STUDY PROGRAMME 18F/11
RECORDING OF TELEVISION SIGNALS ON MAGNETIC TAPE FOR ELECTRONIC NEWS GATHERING
Helical-scan recording(1978)
The CCIR,
CONSIDERING
(a) that some helical-scan videotape recordings of acceptable quality are being used in electronic news gathering;(b) that a variety of standards would be wasteful and impede the international exchange of recordings and, possibly, the compatibility of equipment,
UNANIMOUSLY DECIDES that the following studies should be carried out:
1. the minimum requirements necessary to specify the performance of magnetic helical-scan recorders used for electronic news gathering, in order to define the standards for the international exchange of recordings and, if possible, for the compatibility of equipment;2. the tape width, spool or cassette dimensions and recording format.Note 1. — Account should also be taken of studies being carried out under Study Programme 18B-1/11.Note 2. — See Report 803.
QUESTION 20-1/11
RECORDING OF COLOUR TELEVISION SIGNALS ON FILM(1968 - 1970 - 1978)
The CCIR,
CONSIDERING
(a) that colour films are a medium for the international exchange of colour television programmes;(b) that direct filming of programmes is not always utilised because of programming considerations;(c) that no simple and satisfactory system seems to be available in practice for recording colour televisionsignals on colour film;(d) that systems are in development, or in process of evaluation, that will record colour television signals on colour film,

Q. 20-1/11, 21-1/11, 22-1/11 333
UNANIMOUSLY DECIDES that the following question should be studied:
1. what system or systems are most satisfactory for producing colour films from live colour television programmes or those recorded on magnetic tape;2. what are the optimum recording characteristics which would meet the standards that may be adopted for films intended for the international exchange of colour programmes?Note. — See Report 469-1 and Recommendation 501-1.
QUESTION 21-1/11 *
STANDARDS FOR THE INTERNATIONAL EXCHANGE OF MONOCHROME AND COLOUR TELEVISION PROGRAMMES ON FILM
(1968 - 1970 - 1974)The CCIR,
CONSIDERING
(a) that the wide range of performance achieved in different telecine equipments has caused inconsistencies in the appraisal of films used for the international exchange of television programmes;(b) that a method for appraisal by optical projection has now been agreed (see Recommendation 501-1);(c) that it is also desirable to define an objective method as simple as possible of evaluating the colourbalance of films when subjective assessment is inconclusive;(d) that it is desirable to achieve optimum television reproduction of films intended for the international exchange of television programmes,
UNANIMOUSLY DECIDES that the following question should be studied:
1. what telecine characteristics are required to give optimum reproduction of television films;2. what telecine characteristics are obtained by typical present-day colour telecine equipment;3. what methods of measurement and what specifications should be used to define the permissible colour deviations from the ideal colour balance for films intended for the international exchange of colour television programmes?Note. — See Report 294-4 and Recommendation 265-3.
QUESTION 22-1/11 **
METHODS OF SYNCHRONIZING VARIOUS RECORDING AND REPRODUCING SYSTEMS
(1968 - 1970 - 1978)The CCIR,
CONSIDERING
(a) that Question 18-2/10 concerns the simultaneous transmission of two or more sound channels in television;(b) that television tape recordings at present standardized by the CCIR provide for only one sound channel of broadcast quality;(c) that there is an increase in use by broadcasting organizations of video tape or filmed programmes having a synchronous stereo audio recording for transmission by the same or different transmitters;(d) that there is a growing interest in the international exchange of these programmes between broadcasting organizations;
* This Question replaces Question 16/11, which is hereby cancelled.** This Question should be brought to the attention o f Study Group X and the CMTT.

334 Q. 22-1/11, S.P. 22A-1/11, Q. 23-2/11
(e) that, for the purpose outlined in §§ (c) and (d), an international system or systems should be adopted;(f) that in other cases, it may also be necessary to synchronize a number of audio and/or video signals witheach other;(g) that no single method or system is in general use which will meet all the different possible requirements for synchronization,
UNANIMOUSLY DECIDES that the following question should be studied:
1. what are the required capabilities of such methods of synchronizing;2. what methods are applicable to the synchronization of the various types of recording and reproducingdevices;3. in so far as it may be necessary, in what form should the signals/including coding and frequency of repetition of the timing information, be recorded;4. what use should be made of any audio signal processing techniques;5. what format and media should be used?
STUDY PROGRAMME 22A-1/11
RECORDING OF CODED INFORMATION ON THE CUE TRACK OF TELEVISION MAGNETIC TAPES
(1970 - 1978)The CCIR,
CONSIDERING
(a) that the use of coded signals recorded on the cue track of television tapes for various purposes is increasing rapidly;(b) that such coded signals could also be useful in connection with the international exchange of television tape programmes;(c) that, for the latter purpose, the time and control code as specified in IEC Publication 461 (1974) has been adopted,
UNANIMOUSLY DECIDES that the following studies should be carried out:
1. the types of information carried by the time and control code for the international exchange of programmes;2. the further technical parameters of the time and control code signal which could usefully be standardized.
QUESTION 23-2/11 *
SYSTEM CHARACTERISTICS FOR TELEVISION BROADCASTING FROM SATELLITES
(1966 - 1970 - 1974 - 1978)The CCIR,
CONSIDERING
(a) that the World Administrative Radio Conference for Space Telecommunications, Geneva, 1971, madeprovisions for the broadcasting-satellite service in several frequency bands;(b) that there are many parts of the world with little or no broadcasting service;(c) that there is considerable interest in the possibility of broadcasting from satellites,
This Question, which is analogous to Question 34-2/10 should be studied in connection with Questions 20-3/10 and 5-3/11. Contributions to the study of this Question should be brought to the attention of Study Group 10.

Q. 23-2/11, S.P. 23A /ll 335
UNANIMOUSLY DECIDES that the following question should be studied:
1. what are the preferred technical characteristics of broadcasting-satellite systems;2. what are the satellite orbits most satisfactory for broadcasting from satellites from the point of view oforbit and frequency sharing;3. what accuracy of attitude control can be achieved;4. what maximum primary power is likely to be available to operate a transmitter in a satellite, and whatother factors associated with the space environment operate to limit the power that could be developed in thetransmitter at the various frequencies that might be used;5. what gain, directivity and stability of orientation are attainable for satellite transmitting antennae atvarious frequencies;6. what is the probable working life of a satellite, bearing in mind that failure in accurate positioning orantenna orientation may end the useful life;7. what technology is available for limiting coverage to specified geographic areas?Note. — See Reports 215-4 and 808.
STUDY PROGRAMME 23A/11 *
BROADCASTING-SATELLITE SERVICE
Television standards(1966 - 1974 - 1978)
The CCIR,
CONSIDERING
(a) the allocations made to the broadcasting-satellite service by the World Administrative Radio Conference for Space Telecommunications, Geneva, 1971;(b) that use of the wide coverage possibilities of television broadcasting from satellites may be simpler if a single standard is used within the coverage area;(c) that a new transmission standard may be desirable,
UNANIMOUSLY DECIDES that the following studies should be carried out:
1. determination of the preferred standards for transmission and conditions for individual and community reception, including the method of modulation which could provide high-quality monochrome and colour reception, and also acceptable monochrone reception with low-cost receivers;2. determination of techniques for transmitting the colour information within the video spectrum of the luminance signal;3. the number of sound channels which could be provided and the manner in which they could be transmitted;4. determination of the values of the parameters controlling picture and sound quality (resolution, permissible contrast range and brightness, etc.) and, if these values differ from those of existing standards, the reasons for the differences;5. the technical problems connected with, and the economic aspects of the modification of existing equipment, in keeping with the new standards which may be proposed.
Formerly Study Ftogrimme 5A-1/11.

336 S.P. 23B/11, 23C/11
STUDY PROGRAMME 23B/11 *
COMPOSITE 625-LINE SIGNAL FOR TELEVISION BROADCASTINGFROM SATELLITES
(1966 - 1978)The CCIR,
CONSIDERING
(a) that television broadcasting from satellites is inherently a wide area service;(b) that transmitting on existing television standards on bands currently used may be a method of institutingsuch a service;(c) that there are numerous variations between existing standards, especially in the 625-line systems,
UNANIMOUSLY DECIDES that the following studies should be carried out:
1. the possibility that satisfactory results can be obtained on receivers built to existing standards, withoutchange, or with a minimum number of changes, when receiving a composite 625-line transmission, composed ofone vision signal plus two, three or more sound signals;2. the possibility of accomplishing any necessary changes by adapters (introduced, for example, between thepicture tube and its connecting socket);3. the increases in receiver complexity that would be incurred if dual standard receivers were to be developedfor reception of an existing standard and the composite signal.
STUDY PROGRAMME 23C/11 **
POSSIBLE BROADCASTING-SATELLITE SYSTEMS (TELEVISION)AND THEIR RELATIVE ACCEPTABILITY
(1970 - 1974 - 1978)The CCIR,
CONSIDERING
(a) that technology has developed sufficiently for experimental broadcasting-satellites to be brought into use;(b) that studies are continuing to investigate the technical characteristics of broadcasting-satellite systems(television) including systems based on individual or community reception, and the use at some locations of cablesystems or re-broadcasting to distribute satellite signals to viewers;(c) that, to supplement these technical characteristics, the cost of such systems (covering both the capital cost and the running cost) should be taken into account;(d) that the characteristics of the receiving equipment are of considerable importance in determining the total system cost;(e) that these technical and economic factors may influence the choice of systems;(f) that comparative cost though not the absolute deciding factor is an important consideration to be borne in mind,
UNANIMOUSLY DECIDES that the following studies should be carried out:
1. evaluation of the effects on systems cost of the specifications and technical design of the receivingequipment and the number of receivers required, and of the specification, design and extent of any distributionsystem, using cable or re-broadcasting, which may be used in community installations;
* This Study Programme, formerly Study Programme 5B/11, should be brought to the attention o f Study Group 10 and theCMTT.
** This Study Programme, formerly Study Programme 5C-1/11, is analogous to Study Programme 20B-1/10.

S.P. 23C/11, 23D/11, 23E/11 337
2. comparison between the different broadcasting-satellite systems (television) for individual or community reception, including reception via re-broadcasting, taking the technical aspects and the initial and running costs into account;3. evaluation of the feasibility and possible uses of each system in the light of the technical and economic factors involved.Note. — These studies will be carried out, taking into account the more detailed economic studies made by Interim Working Party PLEN/2 set up by Resolution 38-1. Exchange of information between Study -Group 11, Interim Working Party PLEN/2 and the Technical Co-operation Department of the ITU should be of practical assistance in the execution of these studies.
STUDY PROGRAMME 23D/11 *
TECHNICAL CHARACTERISTICS OF BROADCASTING-SATELLITE SYSTEMS (TELEVISION)FOR COMMUNITY AND INDIVIDUAL RECEPTION
(1970 - 1974 - 1978)The CCIR,
CONSIDERING
(a) that developing countries are especially interested in the study of community reception;(b) that the desired quality of reception and consequent system design parameters and standards for community reception of signals from broadcasting-satellites are expected to be appreciably different from those for individual reception;(c) that this difference in the desired quality of reception and consequent system design parameters and standards may enable community television broadcasting-satellite systems to be established at an earlier date than those intended for individual reception,
UNANIMOUSLY DECIDES that the following studies should be carried out:
1. the optimum characteristics of television broadcasting-satellite systems for community and individual reception to provide economical coverage of the areas to be served within one country or a group of countries;2. the modulation standards and video-frequency characteristics which would ensure the desired service at lowest cost;3. the power flux-densities required for community and individual reception with a view to specifying numerical values which will distinguish between these types of reception.
STUDY PROGRAMME 23E/11 **
CHARACTERISTICS OF RECEIVING SYSTEMS OF THE BROADCASTING-SATELLITE SERVICE (TELEVISION)
(1970 - 1974 - 1978)The CCIR,
CONSIDERING
(a) the frequency allocations made to the broadcasting-satellite service by the World Administrative Radio Conference for Space Telecommunications, Geneva, 1971;(b) that it is technically possible to implement television broadcasting satellites;
* This Study Programme, formerly Study Programme 5D-1/11, is analogous to Study Programme 34A-1/10.
** This Study Programme, formerly Study Programme 5F-1/11, should be brought to the attention o f Study Group 10 and the CMTT.

338 S.P. 23E/11, 23F/11
(c) that the characteristics of the ground receiving systems determine the capacity of both the orbit and thespectrum;(d) that the choice of frequency bands to be used and the transmission standards are of great importance indeciding the following characteristics of the receiving equipment:— figure of merit, G /T,— antenna gain pattern,— channel bandwidth,— reliability,— ease of control;— cost;(e) that the equipment used for community reception and individual reception may differ, substantially intechnical performance and cost,
UNANIMOUSLY DECIDES that the following studies should be carried out:
determination of the optimum characteristic of receiving equipment, for individual and for community reception, in the frequency bands allocated to the broadcasting-satellite service, taking into account:— the different modulation techniques for transmitting the vision and sound signals,— the need for sharing frequency bands and orbital arc with other satellite systems,— the cost of the equipment and its technical performance.Note. — See Reports 473-2 and 810.
STUDY PROGRAMME 23F/11 *
TRANSMITTING ANTENNAE FOR THE BROADCASTING-SATELLITE SERVICE (TELEVISION)
(1978)The CCIR,
CONSIDERING
the need for ample information on transmitting antennae for the planning of the broadcasting-satelliteservice,
UNANIMOUSLY DECIDES that the following studies should be carried out:
1. reference patterns for the co-polar and cross-polar components of transmitting antennae for the broadcasting-satellite service for both individual and community reception;2. practicable means of achieving improved side-lobe suppression and the economic implications thereof;3. the technical characteristics necessary to achieve a pointing accuracy for transmitting antennae such that:— the deviation of the antennae beam from its nominal direction shall not exceed 0.1°;— where the transmitted antenna beam has an elliptical cross-section, the orientation of the major axis can be
maintained within ± 2° of the specified value;4. the practical means and economic implications of achieving a pointing accuracy for satellite transmitting antennae which is improved beyond the limits of § 3 above.
This Study Programme is analogous to Study Programme 34C/10.

Q. 25-1/11, S.P. 25A /l l 339
QUESTION 25-1/11 *
STANDARDS FOR TELEVISION SYSTEMS USING DIGITAL MODULATION
(1972 - 1974)The CCIR,
CONSIDERING
(a) that the CCITT is studying the transmission standards to be used in future digitally coded systems for the transmission of television signals;(b) that, in view of the development of digital methods of processing, transmitting and recording signals, it ispossible that these techniques will be widely used in television;(c) that, to facilitate international exchanges of programmes and to rationalize the design of equipment, itwould be desirable to standardize, as far as possible, the methods used for the digital coding of television signals;(d) that methods for the digital coding of television signals are being studied with regard to the transmissionof these signals over terrestrial and satellite channels;(e) that digital signal processing, if used in television studios, could lead to improved reliability andperformance,
UNANIMOUSLY DECIDES that the following question should be studied:
1. what methods should be used for the digital coding of picture signals and the associated sound signals,and what would be the resulting advantages:— inside the studio complex, including the recording of television signals;— in direct broadcasting from terrestrial transmitters and from satellites;2. is there a single method of digital coding which would be suitable for all the uses described in § 1;Note. — Account should also be taken of studies being carried out under Question 14/CMTT,Programme 14A/CMTT;3. what digital standards should be recommended for the applications mentioned in § 1;Note. — Account should also be taken of studies being carried out under Question 14/CMTT,Programme 14A/CMTT;4. what is the simplest and most effective technique for monitoring digitally coded television sound signals within the studio complex?Note. — See Report 629-1.
STUDY PROGRAMME 25A/11 **
STANDARDS FOR TELEVISION SYSTEMS USING DIGITAL MODULATION
Reduction in the bit rate in the digital coding of television signals(1974)
The CCIR,
CONSIDERING
that the large channel capacity required for the digital transmission and recording of television signals introduces problems which are both technical and economic,
UNANIMOUSLY DECIDES that the following studies should be carried out:
the ways in which removal of redundant information, and knowledge of the visual characteristics of the human observer, can best be exploited to reduce the bit rate, without perceptible reduction in the quality of the reproduced picture.Note. — See Report 629-1.
§ 2 and Study
§ 3 and Study
and associated
* This Question is analogous to Questions 39/10, 14/CMTT and Study Programme 14A/CMTT.** Contributions in response to this Study Programme are o f interest to the CMTT.
340 S.P. 25B/11, 25C/11, 25D/11
STUDY PROGRAMME 25B/11 *
STANDARDS FOR TELEVISION SYSTEMS USING DIGITAL MODULATION
Encoding of colour television signals(1974)
The CCIR
UNANIMOUSLY DECIDES that the following studies should be carried out:
comparison between the digital coding of the composite colour television signal for the system NTSC, PAL and SECAM, and the coding of the separate signal components, such as the luminance and colour-difference signals or the primary colour signals, R, G and B.Note. — See Report 629-1.
STUDY PROGRAMME 25C/11 **
STANDARDS FOR TELEVISION SYSTEMS USING DIGITAL MODULATION
Protection against digital errors, jitter and slip(1978)
The CCIR,
CONSIDERING
that digital television signals associated with the studio complex or with direct broadcasting from terrestrial transmitters and satellites may be subject to impairments due to errors, jitter and slip,
UNANIMOUSLY DECIDES that the following studies should be carried out:
1. preferred methods whereby digital television signals may be modified, if neccessary, by the addition offurther digital signals, so that errors, etc. are either corrected or their effects upon the picture minimized;2. other methods for correcting or concealing the effects of errors, jitter and slip.
STUDY PROGRAMME 25D/11 ***
DIGITAL TECHNIQUES IN THE BROADCASTING-SATELLITE SERVICE(TELEVISION)
(1978)The CCIR,
CONSIDERING
(a) that the World Administrative Radio Conference for Space Telecommunications, (Geneva, 1971), allocated certain frequency bands to be shared equally by the broadcasting-satellite service and other space and terrestrial services;(b) that such sharing can lead to mutual interference among services and can affect the efficiency with which the geostationary orbit is utilized;(c) that, in planning systems for shared-frequency operation, it is necessary to specify, for each of the services involved, both the level of wanted signal (field-strength or power flux-density) necessary for satisfactory reception and the level of unwanted signal for interference that may be considered acceptable;
* Contributions in response to this Study Programme are o f interest to the CMTT.** Account should be taken of studies being carried out under Study Programme 14A/CMTT.
*** The studies may be associated with those carried out under Question 5-3/11. This Study Programme is analogous to Study Programme 39B/10.

S.P. 25D/11, 25E/11 341
(d) that particularly for community reception a digital modulation system may be economically feasible and could reduce both the radiated power from the satellite and the signal bandwidth;(e) that the state-of-the-art is continually advancing in the area of digital modulation and bandwidth compression,
UNANIMOUSLY DECIDES that the following studies should be carried out:
1. to assess various digital coding methods, including those proposed for broadcasting signals in telecommunication, studio and recording installations, to determine their suitability for signals radiated by broadcasting satellites;2. to estimate the bit-rate requirements for television signals of good broadcast-reception quality;3. to consider appropriate bit-rate reduction methods;4. to evaluate error-correction coding and/or error-concealment processes and hence to deduce the optimumparameters from bandwidth and cost considerations;5. to investigate suitable carrier modulation systems for the digital signal and the bandwidths in which thesignal may be efficiently transmitted;6. to determine what protection ratios are required between two digital signals and between a digital signaland other types of signal likely to be transmitted in the band allocated to the broadcasting-satellite service;7. to ensure that the above studies are carried out with adequate subjective evaluation of the broadcast signalquality, and that investigations are made relevant to practical situations in respect to noise level, interference levels and equipment limitations.
STUDY PROGRAMME 25E/11 *
QUALITY PARAMETERS AND MEASUREMENT AND MONITORING METHODS TO BE USED IN THE STUDIO COMPLEX AND IN DIRECT BROADCASTING
FROM TERRESTRIAL TRANSMITTERS AND FROM SATELLITES USING DIGITAL OR ANALOGUE-AND-DIGITAL MODULATION
(1978)The CCIR,
CONSIDERING
(a) that for the design and testing of real systems, it is essential to define objective quality parameters as well as associated measurement and monitoring methods, for the studio complex and in direct broadcasting from terrestrial transmitters and from satellites;(b) that for the use of the concept of the hypothetical reference circuit and for the testing or real systems, the CMTT is studying in Study Programmes 14B/CMTT and 16A/CMTT the quality parameters and measurement methods for digital or mixed analogue-and-digital transmission systems;(c) that in a digital system, picture impairments may be caused either by the coding equipments or by degradations affecting the digital signal such as: errors, jitter and slips,
UNANIMOUSLY DECIDES that the following studies should be carried out:
1. the objective parameters to be applied in characterizing the quality of a codec or of a digital-to-digitalconverter; **2. the parameters to be applied in specifying the performance of digital television equipments in respect todigital signal degradation;3. methods to be used for measuring and monitoring the parameters defined in §§ 1 and 2 for the digital television studio complex and the direct broadcasting from terrestrial transmitters and from satellites;4. methods to be used for measuring and monitoring the parameters for the mixed analogue and digital television studio complex and in direct broadcasting from terrestrial transmitters and from satellites.
* These studies should be carried out in collaboration with the CMTT, to avoid a proliferation of testing methods and equipments.
** Basic investigations into the relationships between the objectively measurable parameters o f television signals and the corresponding picture quality are carried out under Study Programme 3B/11.

342 S.P. 25F/11, Q. 26-1/11
STUDY PROGRAMME 25F/11
STANDARDS FOR TELEVISION SYSTEMS USING DIGITAL MODULATION
Filtering and sampling for colour television signals(1978)
The CCIR,
CONSIDERING
(a) that digital systems should be based upon common characteristics wherever possible and the number of different systems should be minimized;(b) that the signal representing a television picture can be described in terms of the two spatial dimensions and the time dimension;(c) that the sampling and associated filtering of the signal may be based upon one, two or all three of the dimensions outlined in § (b);(d) that, although studies have been in progress under Study Programme 1A/11 for some time, the specifications of the bandwidths of the signal components of the colour systems, even in conventional terms, remain rather imprecise;(e) that, because filtering, sampling frequencies and sampling structures are necessarily inter-related, it is essential that these parameters be chosen with care if irreversible impairments of picture quality are to be avoided;(f) that, Annex II of Decision 18-1 indicates that the overall subjective performance of a digital system should not be worse than that of the equivalent analogue system;(g) that the digital coding of colour television signals is envisaged for both composite and separate-component signals,
UNANIMOUSLY DECIDES that the following studies should be carried out:
1. bandwidths required for luminance and colour-difference signals in the digital coding of separate components;2. specification in the time and frequency domains of the characteristics of the shaping filters used before the sampling process, and after digital-to-analogue conversion;3. characteristics of the component signals resulting from the demodulation of composite colour television signals;4. definition of the sampling frequencies and sampling structures which are most appropriate for coding colour television signals:— in the composite form,— in the separate-component form;5. methods permitting sampled composite signals to be changed to sampled separate-component signals, and vice-versa;6. methods for changing the sampling frequency within a given system which uses either composite or component coding.Note. — The results obtained under this Study Programme should be brought to the attention of the CMTT.
QUESTION 26-1/11 *
CHARACTERISTICS OF TELEVISION RECEIVERS AND RECEIVING ANTENNAE
(1974 - 1978)The CCIR,
CONSIDERING
(a) the importance of certain characteristics of television receiving installations, receivers and antennae in the work of Administrative Conferences, the IFRB and other organizations concerned with establishing frequency plans;
* Contributions in response to this Question should be brought to the attention of Study Group 1.

Q. 26-1/11, S.P. 26A-1/11, Q. 27/11 343
(b) that under the organization of the CCIR, Study Group 11 should deal with matters concerning television receiving installations, receivers and antennae;(c) that account should be taken of the methods of measuring characteristics specified by the International Electrotechnical Commission (IEC),
UNANIMOUSLY DECIDES that the following question should be studied:
what are the principal characteristics of television receivers and antennae for which values might be useful in frequency planning undertaken by Administrative Conferences, the IFRB and other organizations concerned?Note. — See Report 625-1.
STUDY PROGRAMME 26A-1/11 *
CHARACTERISTICS OF TELEVISION RECEIVERS AND RECEIVING ANTENNAE
(1974 - 1978)The CCIR
UNANIMOUSLY DECIDES that the following studies should be carried out:
assembly of the necessary data, duly kept up to date, of the principal characteristics of television receiving installations, receivers and antennae, which might be useful in frequency planning work, such as that of Administrative Conferences, the IFRB and other organizations concerned, in a special section of the CCIR books. Such studies should take account of the relevant publications of the International Electrotechnical Commission (IEC).Note. — See Report 625-1.
QUESTION 27/11 **
HIGH-DEFINITION TELEVISION(1974)
The CCIR,
CONSIDERING
(a) that present systems for television are not ideal in respect to picture quality, for example sharpness andreality;(b) that transmission of wideband video signals in bands for terrestrial and broadcasting-satellite systems aswell as over cable systems will be possible;(c) that progress in the development of displays will permit the use of large-screen, high-definition televisiondisplays for domestic reception;(d) that Question 14-1/11 does not cover all aspects of the problems presented by the introduction ofhigh-definition television systems,
UNANIMOUSLY DECIDES that the following question should be studied:
what standards should be recommended for high-definition television systems intended for broadcasting to the general public?Note 1. — Account should be taken of the following factors:— the target to be set for picture quality at the next stage of development (colour and monochrome) and for
sound quality;— the scanning standards and the resulting necessary video-frequency bandwidth;
* Contributions in response to this Study Programme should be brought to the attention o f Study Group 1.** This Question is identical to Question 22/CMTT.

344 Q. 27/11, 28/11, S.P. 28A /l l
— the transmission system, including the methods of modulation and multiplexing for both the video and the sound-channels;
— determination of the frequency band most appropriate for this service;— the production of reliable receivers at reasonable cost;— compatibility with existing systems of television;— susceptibility to interference in the international exchange of programmes.Note 2. — See Report 801.
QUESTION 28/11
INTERNATIONAL EXCHANGE OF RECORDED TELEVISION PROGRAMMES
Addition to television programmes (on film or magnetic materials) of data for controlling automatic equipment
(1974)The CCIR,
CONSIDERING
(a) that automatic programming of television broadcasting stations is in widespread use in several countries, and gaining interest in others;(b) that all relevant parameters of the controlling data, such as format, medium, signal specifications, required for the operation of automatic equipment should be standardized, in order to facilitate the international exchange of recorded television programmes,
UNANIMOUSLY DECIDES that the following question should be studied:
what information should be provided and by what means on or with television recordings, for example, tape and film programme, for the control of automatic station equipment?
STUDY PROGRAMME 28A /11
INTERNATIONAL EXCHANGE OF RECORDED TELEVISION PROGRAMMES
Addition to television programmes (recorded on magnetic tape, film or other materials)
of data for controlling automatic equipment(1978)
The CCIR,
CONSIDERING
(a) that automatic programming for television broadcasting stations is growing in importance;(b) that it may be convenient to exchange programmes between such stations using existing formats ofrecorded programmes;(c) that both video and sound records of a programme recorded on magnetic tape, film or other materialcould carry control information ahead of the start of the programme,
UNANIMOUSLY DECIDES that the following studies should be carried out:
1. the practicability of automatic programming when magnetic tape, film or other materials is the recording medium;2. the minimum information necessary to ensure that a programme recorded on magnetic tape, film or other materials can be identified by machine interrogation;3. the preferred method of recording such programme identification references;4. the minimum information necessary to ensure thatjthe machines start and stop at the required time;5. the preferred method of recording such start and stop information on each medium;6. the minimum information necessary to locate the programme in and out points;7. the preferred method of recording such information on each medium.

Q. 29-1/11, S.P. 29A-1/11 345
QUESTION 29-1/11
BROADCASTING OF STILL PICTURES AND OTHER INFORMATION INTENDED FOR THE PUBLIC AND USING A TELEVISION CHANNEL
(1974 - 1978)The CCIR,
CONSIDERING
(a) that it is possible to define new systems for broadcasting which make use of a television channel;(b) that these new systems, which allow broadcasting in the same channel of several kinds of information, for example still pictures and text, may contribute to the expanding use of the radio-frequency spectrum;(c) that, as a result of technological developments, particularly in the fields of recording devices and digital technology, it may be possible to apply these systems to broadcasting services for the public generally, or certain categories of the public;(d) that to facilitate international exchange and to rationalize the design of equipment, it would be desirable to standardize, as far as possible, the methods used in these new systems;(e) that the degree of mutual compatibility between such services and of their compatibility with existing television broadcasting services should be defined,
UNANIMOUSLY DECIDES that the following question should be studied;
1. what types of services should be introduced;2. what system parameters should be adopted;3. what degree of compatibility should be ensured with the reproduced sound and pictures of the existing television services;4. what are the requirements for the mutual compatibility amongst different programme sources when the signals are programme related?Note. — See Report 802.
STUDY PROGRAMME 29A-1/11
BROADCASTING OF ANALOGUE TELEVISION SIGNALS FOR STILL PICTURES(1974 - 1978)
The CCIR,
CONSIDERING
(a) that still picture television signals can be broadcast extremely efficiently if a recording device is provided at the receiver;(b) that this technique and other multiplexing would make it possible to broadcast still picture television programmes consisting of still colour pictures and accompanying sound, by using a television channel exclusively, or by multiplexing with existing television signals;(c) that such broadcasting systems may be useful for the purpose of information and education services,
UNANIMOUSLY DECIDES that the following studies should be carried out;
1. the types of services which should be introduced;2. the methods which should be used to transmit still picture signals and accompanying sound signals;3. the characteristics to be recommended for the broadcasting of still picture signals and accompanying soundsignals.

346 S.P. 29B/11, 29C/11
STUDY PROGRAMME 29B/11 *
STANDARDS FOR A NEW BROADCASTING SERVICE
Teletext **(1978)
The CCIR,
CONSIDERING
(a) that the broadcasting of alphanumeric or graphic information to the public at large or to certain categories of the public, is technically feasible, particularly through the use of digital signals multiplexed in the television signal;(b) that a new broadcasting service called teletext is under development for broadcasting magazines made up of pages sent out in a continuous sequence, or once only; these pages consisting of alphanumeric or graphic displays,
UNANIMOUSLY DECIDES that the following studies should be carried out:
1. the essential characteristics of such a service;2. identification of the operational features required for this service;3. codes to be used to transmit the various categories of information and their arrangement into language;4. the manner in which the service quality should be defined;5. provision to be made for connecting the terminal equipment or certain parts of it, to other communication networks, should the need arise.
STUDY PROGRAMME 29C/11
SPECIFICATION FOR MULTIPLEX BROADCASTING OF INFORMATION IN THE TELEVISION CHANNEL
(1978)The CCIR,
CONSIDERING
(a) that it is possible to broadcast simultaneously (multiplex) in a television channel, a picture and sound signal and data or other information signals possibly issued from different origins and related to, or not related to, the picture and sound signals;(b) that the broadcasting of supplementary information or data may serve a useful purpose and can do so even without the simultaneous broadcast of typical picture and sound;(c) that it is desirable to encourage development of compatible or possibly common multiplexing specifications in order to facilitate international exchange of programmes and to rationalize the design of equipment;(d) that it is important to protect the quality of the television picture and sound service,
UNANIMOUSLY DECIDES that the following studies should be carried out:
1. the way in which the multiplex should be organized and, in particular, the identification of the information issued from a given origin and the specification of the corresponding information transmission link;2. the modulation and coding specifications to be used;3. the way in which the quality of the information transmission links should be specified and measured;4. the means of protecting the television service when the need arises;5. for digital information, the interfaces to be employed at the originating point and at the receiver.
* As teletext may use other transmission networks, this Study Programme should be brought to the attention of the CCITT.** This new term, which has not yet been adopted definitively is proposed to refer to the service as defined in § (b) of this
text.

S.P. 29D/11, 29E/11 347
STUDY PROGRAMME 29D/11 *
SPECIFICATIONS FOR A PROGRAMME DELIVERY SERVICE(1978)
The CCIR,
CONSIDERING
(a) that it is technically possible to use digital channels multiplexed with television signals for the remote control of television receiving and recording apparatus which can be used by the general public or by certain categories of the public;(b) that a new broadcast service, known as the programme delivery service, is now being developed, providing for remote control from a source of transmission of a recording made by a receiving equipment, capable of pre-selecting the television programme to be recorded,
UNANIMOUSLY DECIDES that the following studies should be carried out:
1. the essential characteristics of such a service;2. identification of the operational features required for such a service;3. the codes which should be used to transmit the various categories of information and their arrangement into language;4. the manner in which the quality of service should be defined.
STUDY PROGRAMME 29E/11 *
SPECIFICATIONS FOR A NEW “AUDIOGRAPHY” BROADCASTING SERVICE(1978)
The CCIR,
CONSIDERING
(a) that it is technically possible to use digital channels multiplexed with television signals for broadcasting still or slow-moving graphic information with sound commentary intended for the public;(b) that a new broadcasting service, known as “audiography”, can be envisaged, consisting of the joint broadcasting of sound and coded data representing graphic information,
UNANIMOUSLY DECIDES that the following studies should be carried out:
1. the essential characteristics of such a service;2. identification of the operational features required for this service;3. the coding system to be used to transmit the data required by the service and the associated sound;4. the methods which should be used to transmit the graphic pictures and the associated sound signals;5. provision to be made for connecting the terminal equipment or certain parts of it to other telecommunication networks, should the need arise.
* This Study Programme should be brought to the attention of Study Group 10 and the CMTT.

348 Q. 30/11, 31/11
QUESTION 30/11 *
METHODS OF REDUCING INTERFERENCE TO THE BROADCASTING SERVICE (TELEVISION) FROM OTHER SERVICES
OPERATING IN ADJACENT BANDS(1974)
The CCIR,
CONSIDERING
(a) that the number of stations in the bands adjacent to the broadcasting bands is continually increasing;(b) that an even more rapid growth of these services can be foreseen in the future;(c) that harmful interference has been recorded arising from inadequate selectivity of television receivers;(d) that this interference renders difficult expansion of other services in bands adjacent to the broadcastingbands;(e) that there is a considerable variation in the performance of television receivers made by different manufacturers with respect to protection against out of band signals;(f) that improvement of television receiver selectivity characteristics would improve frequency utilization,
UNANIMOUSLY DECIDES that the following question should be studied:
to what extent should the selectivity of television receivers be improved especially for channels adjacent to the edges of the bands to increase the possibility of efficient use of frequencies in adjoining bands?
QUESTION 31/11
PERFORMANCE AND TESTING OF WIRED DISTRIBUTION SYSTEMS FOR TELEVISION SIGNALS
(1974)The CCIR,
CONSIDERING
(a) that, in a number of countries, the use of cables for the distribution of television programmes to the home is rapidly growing, and that this method of distribution could ultimately have a profound influence on the whole pattern of television broadcasting;(b) that the effect of this growing industry on receiver designs will be considerable, and it might even ultimately influence broadcasting standards;(c) that the International Electrotechnical Commission (IEC) is already studying methods of defining and measuring the performance of cable television distribution systems and is preparing recommended codes of practice for such systems;(d) that the general problems of transmission over cable, for all types of modulation, are within the technical responsibility of the CCITT,
UNANIMOUSLY DECIDES that the following question should be studied:
1. are there any matters arising from the introduction of television distribution to the home by cable that are of international significance to the efficient utilization of the radio-frequency spectrum and which should therefore be studied by the CCIR;2. should allowances be made in the overall design of television broadcasting systems for the signal impairments introduced by cable distribution systems and should overall allocation of tolerances be made with this factor in mind?Note. — The Director, CCIR, is requested to draw this Question to the attention of the Director, CCITT, which, for its part, may wish to study the specific problems of transmission over cable and of equipment associated with transmission over cable.
Contributions in response to this Question should be brought to the attention of Study Groups 1 and 8.

S.P. 31A/11, Q. 34-1/11 349
STUDY PROGRAMME 31A/11
RADIATION FROM CABLE DISTRIBUTION NETWORKS(1978)
The CCIR,
CONSIDERING
(a) that in a number of countries the use of cable networks for the distribution of television programmes isgrowing rapidly, particularly in urban areas;(b) that the frequency bands used for cable transmissions often lie entirely or partly outside the bandsallocated to broadcasting;(c) that unwanted radiation from cable networks could cause interference to users of these bands,
UNANIMOUSLY DECIDES that the following studies should be carried out:
1. evaluation of the risks of interference from radiation from cable distribution networks as a function offrequency;2. determination and evaluation of the factors affecting the radiation from cable distribution networks as afunction of frequency;3. determination of acceptable levels of radiation as a function of frequency and appropriate measurement methods;4. precautions to be taken to restrict radiation from such networks, with respect to the design, constructionand operation of equipment;5. methods of supervising radiation from these networks.Note. — The Director, CCIR is requested to forward this text to the Secretary General, IEC.
QUESTION 34-1/11 *
RADIATION OF SPURIOUS EMISSIONS FROM SPACE STATIONS IN THE BROADCASTING-SATELLITE SERVICE (TELEVISION)
(1977 - 1978)The CCIR,
CONSIDERING
(a) that the radiation of spurious emissions by space stations in the broadcasting-satellite service could cause interference to other services sharing the same frequency band or operating in adjacent or harmonically related frequency bands;(b) that spurious emissions could cause interference to other stations of the broadcasting-satellite service andmight reduce the efficiency of the use made of the geostationary satellite orbit;(c) that suppression of spurious emissions from space stations to very low levels may involve major technical problems;(d) that the various radio services differ greatly in sensitivity to interference;(e) that the Radio Regulations do not define limits for spurious emissions for transmitters operating onfundamental frequencies above 235 MHz;(f) that any necessary suppression of spurious emissions must be effected prior to launching;(g) that, in the planning of the broadcasting-satellite service, account must be taken of the need to reduce toacceptable levels, interference to services operating in adjacent bands;(b) the World Broadcasting-Satellite Administrative Radio Conference, Geneva, 1977 has invited the CCIR, asa matter of urgency, to study the technical and operational aspects of spurious emissions from space stations in the broadcasting-satellite service to enable the Special Preparatory Meeting of CCIR Study Groups to draw up a report for the 1979 World Administrative Radio Conference,
UNANIMOUSLY DECIDES that the following question should be studied:
what limits of radiation of spurious emissions from space stations of the broadcasting-satellite service are required to protect this service, and other services operating in accordance with the Radio Regulations?
* This Question is analogous to Question 43/10 and should be brought to the attention of Study Groups 1, 2, 4, 7, 8 and 9.

350 Q. 35/11, 36/11
QUESTION 35/11 *
SYNCHRONIZATION NECESSARY FOR THE SATISFACTORY RECEPTION OF SOUND AND PICTURE SIGNALS
(1978)The CCIR,
CONSIDERING
(a) that in many television programme operations the sound and picture signals are recorded on separate media at some point, at least, of the overall system;(b) that the sound and picture components of television programmes may be transmitted over long distances, in which the transmission time is not negligible and wherein the sound and picture signals may be transmitted by different routes or methods;(c) that there may therefore be an error of timing between the sound and picture signals at the receiver;(d) that lack of synchronism between the sound and picture signals can produce unacceptable impairment of the programme,
UNANIMOUSLY DECIDES that the following question should be studied:
1. what are the acceptable overall tolerances for the accuracy of synchronization of the sound signal withrespect to the picture signal;2. what tolerances in synchronism are required for the recording processes used;3. what tolerances in synchronism are available for other parts of the overall system;4. what are the preferred points at which synchronization corrections (if necessary) should be applied?
QUESTION 36/11
POLARIZATION OF EMISSIONS IN THE TERRESTRIAL BROADCASTING SERVICE (TELEVISION)
Advantages of circular or elliptical polarization(1978)
The CCIR,
CONSIDERING
(a) that emissions from terrestrial television broadcasting stations are usually transmitted with either horizontal or vertical polarization;(b) that multiple reflections within reception areas in rough terrain and/or in cities with high buildings can result in undesirable ghost images in the received picture;(c) that orthogonal polarization for television broadcasting stations operating in the same frequency channel has been used in some areas in discriminating against the reception of undesired signals,
UNANIMOUSLY DECIDES that the following question should be studied:
1. are there advantages, both in improving the quality of the received picture where multiple reflections are present and in minimizing interference from other stations operating in the same frequency channel, in using circular or elliptical polarization for emissions from terrestrial television broadcasting stations;2. what types of antennae can be used for transmission and reception;3. would the use of circular or elliptical polarization be compatible with the use of horizontal and/or vertical polarization in the same reception area?
♦ Studies in response to this Question are also of interest to Study Group 10 and the CMTT.

D. 17-1 351
DECISION 17-1
PROTECTION RATIOS FOR THE BROADCASTING-SATELLITE SERVICE FOR THE PURPOSE OF FREQUENCY SHARING (TELEVISION)
Study Group 11,
CONSIDERING
(a) that Recommendation Spa2 — 10, § 4 of the World Administrative Radio Conference for SpaceTelecommunications, Geneva, 1971 recommends “that the CCIR urgently study the sharing criteria to be applied to frequency sharing between the Broadcasting-Satellite Service and the Terrestrial Broadcasting Service in the Band 620 to 790 MHz...” and study in particular, in § 5.1, “the required protection ratio for both 525— and 625-line systems for interference from a frequency modulation television signal into a vestigial-sideband television signal” ;
(b) that Recommendation Spa2 — 15, § 2.10 recommends that the CCIR study “the conditions for frequency- sharing in those bands allocated to the Broadcasting-Satellite Service...”, and that these conditions depend critically on the protection ratio requirements for television signals” ;
(c) that Recommendation Spa2 — 12, invites the CCIR “to study this subject (i.e technical standards for the assessment of harmful interference)... for the frequency bands above 28 MHz allocated to space... and terrestrial radiocommunications” ;
(d) that Report 634-1 and Report 813 call for additional measurements of protection ratios involving bothanalogue and digital television systems;
(e) that several Study Programmes call for the development of sharing criteria among systems which mayemploy digital techniques for which there are neither measured protection ratios nor agreed test procedures;
(f) that the results of subjective measurements of the protection ratio made by different Administrations are difficult to compare unless carried out under standardized test conditions,
(1974 - 1978)
DECIDES
1. that Interim Working Party (IWP) 11/2 should be continued within the general terms of reference of StudyGroup 11, and with the following specific terms of reference;
1.1 to agree upon, and to circulate to the Member Administrations of the CCIR at the earliest possible date, a standardized set of test conditions and measurement procedures for the subjective and objective determination of protection ratios for interference between television broadcasting-satellite systems and vestigial-sideband television terrestrial broadcasting systems and among satellite television broadcasting systems; taking into account any modulation system under consideration for television broadcasting from satellites, in particular digital modulation;
1.2 to encourage Administrations to participate in a co-ordinated programme of measurements of protectionratio, utilizing the standardized conditions and procedures, such measurements to encompass all monochrome and colour systems, and all modulation methods likely to be involved in shared frequency operation;
1.3 to prepare draft Reports and Recommendations that describe the standardized test conditions andmeasurement procedures, and to compare and interpret the results of the protection ratio measurements for consideration at Interim Study Group Meetings in the period following the XlVth Plenary Assembly;
2. that IWP 11/2 should as far as possible conduct its work by correspondence;
3. that the results of the work of IWP 11/2 should be reported to Study Group 11 for consideration;
4. that IWP 11/2 should be composed of representatives appointed by the Administrations of FederalRepublic of Germany, Brazil, Canada, United States of America, France, India, Italy, Japan, United Kingdom, Switzerland, U.S.S.R., Yugoslavia (Socialist Federal Republic of), and by the EBU;
5. that the Chairman of IWP 11/2 shall be a representative of the Administration of Brazil.

352 D. 33, Res. 65
DECISION 33
BROADCASTING SERVICES INTENDED FOR ALPHANUMERICAL AND/ORGRAPHIC DISPLAY
Teletext * services (Study Programme 29B/11)
(1978)Study Group 11,
CONSIDERING
(a) that “Teletext” * systems were or will be implemented in the near future in several countries;(b) that the CCITT will immediately undertake the study of public network-based interactive information retrieval systems (“Videotex” **);(c) that, under certain conditions, the subscriber terminals should have access to both the “Teletext” * services and to the “Videotex” ** services,
DECIDES
1. that an Interim Working Party (IWP 11/3) should be set up within the general terms of reference of CCIR Study Group 11 and with the following specific terms of reference:1.1 to establish and submit to CCIR Study Group 11, within the framework of Study Programme 29B/11 and at the earliest possible date, a definition of the “Teletext” services and a set of standards for these services taking account of the work of the ad hoc Joint Working Party CCIR/CCITT established under Resolution 65;1.2 to invite Administrations to participate in a programme for the measurement of the conditions of reception of digital data signals multiplexed in a television signal and the effect of the presence of these data signals on the signal quality for various television systems and various methods of modulation;1.3 to maintain contact with CCITT Study Groups responsible for the study of the “Videotex” services and, as far as possible, to participate in the work of the CCITT and to invite the CCITT to take part in the work of the IWP 11/3;2. that IWP 11/3 should, as far as possible, work by correspondence; however, it may meet, upon proposal of its Chairman, following consultation with the Director of the CCIR;3. that IWP 11/3 will consist of representatives of Australia, Canada, Denmark, France, Germany (Federal Republic of), Italy, Japan, Norway, Spain, Switzerland, United Kingdom, United States of America, U.S.S.R., BBC, EBU, RAI;4. that the interim Chairman of this IWP will be a representative o f the Administration of Italy.
RESOLUTION 65
ALPHANUMERIC AND/OR GRAPHIC DISPLAYS ON TELEVISION RECEIVERS(1978)
The CCIR,
CONSIDERING
(a) that considerable progress has been made within the CCIR on broadcast “Teletext” * in use in some countries (ANTIOPE, CEEFAX, ORACLE, for instance), the characteristics of these systems are outlined in Report 802;(b) that several Administrations are already studying the provision of complementary facilities *** by the interconnection of terminals to data banks, via the public networks, such as the telephone network;
* The term “Teletext” has not yet been adopted definitely by the CCIR.** The term “Videotex” is used temporarily by the CCITT.
*** Complementary to the telephone service.

Res. 65, Op. 38 353
(c) that the CCITT will take into account the need for urgent studies of such public network based service;(d) that it is clearly necessary to give urgent and detailed attention to the problem of compatibility betweenthe symbol sets and the two modes of operation of the receiving terminal;(e) that the terminology at present used by the CCIR and the CCITT for different services and systems gives rise to confusion,
UNANIMOUSLY DECIDES
1. that in analogy with No. 423 of the International Telecommunication Convention, Malaga-Torremo-Iinos, 1973, the Director, CCIR, in collaboration with the Director, CCITT, should set up an ad hoc C C IR /CCITT Joint Working Party under the administration of the CCIR as soon as possible with the following terms o f reference:1.1 to determine the compatibility and interface requirements needed to ensure with a minimum o f cost to the users, that the television receiver can be used as the display device for both broadcasting services o f the “Teletext” type and interactive services using the public networks for telephone and /o r data transmission (“Videotex” *);1.2 to propose an appropriate terminology for these two systems taking into account the aspects o f copyright;2. that the study o f the systems set out under § 1.1 in view of their standardization should be continued by the competent Study Groups of the CCITT and the CCIR according to their working procedures taking into account the finding of the Joint Working Party;3. that the Joint Working Party should, as far as possible, work by correspondence; however, it may meet, upon proposal of its Chairman, following consultation with the Director of the CCIR;4. that the Joint Working Party will consist of representatives of Australia, Canada, Denmark, France, Germany (Federal Republic of), Italy, Japan, Norway, Spain, Switzerland, United Kingdom, United States of America, U.S.S.R., BBC, EBU, RAI as far as the CCIR is concerned;5. that the Chairman of this Joint Working Party will be a representative of the Administration of Sweden;6. that the results of the work of this Joint Working Party should be transmitted to CCIR Study Group 11 and the competent Study Groups of the CCITT.
OPINION 38 **
EXCHANGE OF MONOCHROME AND COLOUR TELEVISION PROGRAMMES VIA SATELLITES
(1970)The CCIR,
CONSIDERING
(a) the importance of facilitating the exchange of television programmes via satellites;(b) that, if this exchange is to be made between countries using the same standard or the same system, any conversion or any transcoding at intermediate points could lower the quality of the signal,
IS UNANIMOUSLY OF THE OPINION
that the attention of Administrations and organizations responsible for the transmission of international television programmes should be drawn to the desirability of conserving, in the transmission over their networks, the original standard and system, to provide a better quality of service.
* The term “Videotex” is used temporarily by the CCITT.** This Opinion has been brought to the attention o f Study Groups 4, 9 and the CMTT.

354 Op. 40, 60
OPINION 40
SUBJECTIVE ASSESSMENT OF THE QUALITY OF TELEVISION PICTURES
(1970)The CCIR,
CONSIDERING
(a) that is has already done considerable work on the subjective assessment of the quality of television pictures (see Report 405-3);(b) that the International Electrotechnical Commission (IEC) is also making a similar study with special reference to receivers;(c) that it is important to develop analogous assessment procedures to obtain consistent results,
IS UNANIMOUSLY OF THE OPINION
that the Director, CCIR, should remain in close contact with the IEC to keep it informed of the wishes of the CCIR and to obtain the results of the work of the IEC with a view to arriving at one or more common methods of assessing picture quality and preventing duplication of work.
OPINION 60
TELETEXT SERVICES(1978)
The CCIR,
CONSIDERING
(a) that considerable progress has been made within the CCIR on broadcast teletext systems in use in somecountries (ANTIOPE, CEEFAX, ORACLE, for instance); the characteristics of these systems are outlined in Report 802;(b) that several Administrations are already studying the provision of complementary facilities by theinterconnection of terminals to data banks, via the wired networks, such as the telephone network;(c) that the broadcast and network modes are entirely complementary and will increase the appeal of suchdata systems;(d) that it is clearly necessary to give urgent and detailed attention to the problem of compatibility betweenthe symbol sets and the two modes of operation of the receiving terminal,
IS UNANIMOUSLY OF THE OPINION
that the Director, CCIR, should draw the attention of the Director, CCITT, to the CCIR documentation on the teletext service and invite the CCITT to take into account the need for urgent studies of a possible public network-based data-bank service, bearing in mind the desirability for terminal-equipment compatibility with broadcast teletext systems, and the fact that the latter are already in public use in some countries.

ISBN 92-61-00761-9
Copyright © 2022 FDOKUMEN