Exploring Projects - American Statistical Association
170
ALGEBRA TEACHER'S EDITION ... Exploring Projects ERRTHUM, MASTROMATTEO, O'CONNOR, SCHEAFFER DATA-DRIVEN MATHEMATICS D A L E S E Y M 0 U R P U B L I C A T I 0 N S®
-
Upload
khangminh22 -
Category
Documents
-
view
0 -
download
0
Transcript of Exploring Projects - American Statistical Association

ALGEBRA TEACHER'S EDITION
...
Exploring Projects
ERRTHUM, MASTROMATTEO, O'CONNOR, SCHEAFFER
DATA-DRIVEN MATHEMATICS
D A L E S E Y M 0 U R P U B L I C A T I 0 N S®


Exploring Projects: Planning and Conducting Surveys and Experiments .
TEACHER'S EDITION
DATA-DRIVEN MATHEMATICS
Emily Errthum, Maria Mastromatteo, Vince O'Connor, and Richard Scheaffer
Dale Seymour Publications® White Plains, New York

This material was produced as a part of the American Statistical Association's Project "A Data-Driven Curriculum Strand for High School" with funding through the National Science Foundation, Grant #MDR-9054648. Any opinions, findings, conclusions, or recommendations expressed in this publication are those of the authors and do not necessarily reflect the views of the National Science Foundation.
This book is published by Dale Seymour Publications®, an imprint of Addison-Wesley Longman, Inc.
Dale Seymour Publications 10 Bank Street White Plains, NY 10602 Customer Service: 800-872-1100
Copyright© 1999 by Addison Wesley Longman, Inc. All rights reserved. Printed in the United States of America.
Limited reproduction permission: The publisher grants permission to individual teachers who have purchased this book to reproduce the Activity Sheets, the Quizzes, and the Test as needed for use with their own students. Reproduction for an entire school or school district or for commercial use is prohibited.
Order number DS21165
ISBN 1-57232-398-1
1 2 3 4 5 6 7 8 9 10-ML-02 01 00 99 98
@ This Book Is Printed On Recycled Paper
DALE SEYMOUR PUBLICATIONS®
Managing Editor: Alan MacDonell
Senior Mathematics Editor: Carol Zacny
Project Editor: Nancy R. Anderson
Production Manufacturing Director: Janet Yearian
Senior Production Coordinator: Fiona Santoianni
Design Manager: Jeff Kelly
Text and Cover Design: Christy Butterfield
Cover Photo: Uniphoto, Inc.

Authors
Emily Errthum Homestead High School Mequon, Wisconsin
Richard Scheaffer University of Florida Gainesville, Florida
Consultants
Jack Burrill National Center for Mathematics Sciences Education University of Wisconsin-Madison Madison, Wisconsin
Henry Kranendonk Rufus King High School Milwaukee, Wisconsin
Maria Mastromatteo Brown Middle School Ravenna, Ohio
Vince O'Connor Milwaukee Public Schools Milwaukee, Wisconsin
Pat Hoplettsperger Homestead High School Mequon, Wisconsin
Jeffrey Witmer Oberlin College Oberlin, Ohio
Oata-Orillen •alllematics Leadership Team
Gail F. Burrill National Center for Mathematics Sciences Education University of Wisconsin-Madison Madison, Wisconsin
Kenneth Sherrick Berlin High School Berlin, Connecticut
Richard Scheaffer University of Florida Gainesville, Florida
James M. Landwehr Bell Laboratories Lucent Technologies Murray Hill, New Jersey
Miriam Clifford Nicolet High School Glendale, Wisconsin

Acknowledgments
The authors would like to thank the following people for their assistance during the preparation of this module:
• The many teachers who reviewed drafts and participated in the field tests of the manuscripts
• The members of the Data-Driven Mathematics leadership team, the consultants and writers
• Nancy Kinard, for her advice and suggestions in the early stages of the writing
• Kathryn Rowe and Wayne Jones for their help in organizing the fieldtest process and the Leadership Workshops

Table al Contents
About Data-Driven Mathematics vii
Using This Module viii
Unit I: Censuses
Exploratory Lesson: Collecting and Analyzing Data 3
Lesson 1 : Conducting a Census 8
Lesson 2: Looking at the U.S. Census 12
Activity: Taking Your Own Census 18
Unit II: Surveys
Lesson 3: Conducting a Survey 23
Lesson 4: Asking Questions 28
Lesson 5: Selecting a Sample 33
Lesson 6: Studying Randomization 39
Lesson 7: Sampling in the Real World 43
Lesson 8: Critiquing a Printed Article 51
Lesson 9: Understanding Sampling Error (Extension) 57
Activity: Conducting Your Own Survey 63
Unit Ill: Experiments
Lesson 10: Conducting an Experiment 67
Lesson 11 : Experimenting to Answer a Question 71
Lesson 12: Measurement Variability and Bias 76
Lesson 13: Experiments in the Real World 80
Activity: Conducting Your Own Experiment 85
Unit IV: Projects
Lesson 14: A Reference Guide 93
Lesson 15: Doing a Project 103
Lesson 16: Representing the Same Data in Different Ways 109
Information Sheet: Informing Others 116

Teacher Resources
vi TABLE OF CONTENTS
Assessment Ideas 121
Quizzes 125
Solutions to Quizzes 129
Activity Sheets 130
The 1990 Census Questionnaire 142

About Data-Driven Mathematics
Historically, the purposes of secondary-school mathematics have been to provide students with opportunities to acquire the mathematical knowledge needed for daily life and effective citizenship, to prepare students for the workforce, and to prepare students for postsecondary education. In order to accomplish these purposes today, students must be able to analyze, interpret, and communicate information from data.
Data-Driven Mathematics is a series of modules meant to complement a mathematics curriculum in the process of reform. The modules offer materials that integrate data analysis with high-school mathematics courses. Using these materials helps teachers motivate, develop, and reinforce concepts taught in current texts. The materials incorporate the major concepts from data analysis to provide realistic situations for the development of mathematical knowledge and realistic opportunities for practice. The extensive use of real data provides opportunities for students to engage in meaningful mathematics. The use of real-world examples increases student motivation and provides opportunities to apply the mathematics taught in secondary school.
The project, funded by the National Science Foundation, included writing and field testing the modules, and holding conferences for teachers to introduce them to the materials and to seek their input on the form and direction of the modules. The modules are the result of a collaboration between statisticians and teachers who have agreed on the statistical concepts most important for students to know and the relationship of these concepts to the secondary mathematics curriculum.
A diagram of the modules and possible relationships to the curriculum is on the back cover of the Teacher's Edition.
ABOUT DATA-DRIVEN MATHEMATICS vii

Using This Module
Why the Content Is Important
The most important application of mathematics today for a large part of the population involves both the collection and the analysis of data. Thus, students need to have some experience in this area while in high school. Projects, however, are not trivial, and the process of conducting a project is usually not taught. The lessons in this module lead students step by step through the process of creating and carrying out a survey or an experiment. The lessons develop the overall framework and key components, such as the use of random sampling, that are necessary for a successful project. As they work through a project on a single theme or topic of interest to them, students tie together the major areas of statistical work: problem formulation, data collection, data analysis, and data interpretation. In the process, they gain practical experience in working on a team, organizing field work, and managing data.
Exploring Projects: Planning and Conducting Surveys and Experiments is made up of four units.
Unit I deals with conducting a census. The exercises help students understand what a census is. The U.S. Census is discussed specifically as perhaps the most important and most well-known census.
Unit II gives information about sample surveys. After a discussion of the need to do sample surveys, the concepts of bias and randomization are explained and exercises are given that help to clarify these concepts. The need to critically read the results of sample surveys is stressed. Enrichment is offered for those students ready to deal with the concept of sampling error. At the end of the unit, ideas for student surveys are suggested along with a sample survey plan.
Unit III focuses on conducting experiments. The concepts of variability and bias are once again stressed as students investigate how questions can be answered through experiments. Suggestions for simple experiments that can be carried out by the class are given at the end of the unit.
Unit IV helps the student to complete a project of his or her own. There is a lesson that gives specific directions about conducting student projects. There are exercises that show how the same information can be graphically displayed in several ways. A reference lesson reminds students of the types of graphical displays they can use and gives information on how to make them. There is also a reference lesson that reminds the student of the writing process.
viii USING THIS MODULE

Mathematical Content
• representations of data in tables and graphs • percentages, proportions, and rates • elementary probability • estimation
Statistical Content
• census • sample survey: questionnaire design, randomization, data manage
ment, estimating population quantities • experiment: treatment, control, randomization, data management,
drawing conclusions • inferences and conclusions • bias
Instructional Model
The instructional emphasis in Exploring Projects: Planning and Conducting Surveys and Experiments, as in all of the modules in DataDriven Mathematics, is on discourse and student involvement. Each lesson is designed around a problem or a mathematical situation and begins with a series of introductory questions or scenarios that can be used to prompt discussion and raise issues about that problem. These questions can provoke students' involvement in thinking about the problem and help them understand why such a problem might be of interest to someone outside the classroom.
Once the stage has been set for the problem, students begin to investigate the situation mathematically. As students work their way through the investigations, it is important that they have the opportunity to share their thinking with others and to discuss their solutions in small groups and with the whole class. Many of the exercises are designed for groups, in which each member of the group does one part of the problem and the results are compiled for a final analysis and solution. Multiple solutions and solution strategies are also possible, and it is important for students to recognize these situations and to discuss the reasoning that leads to different approaches. Each student thus is provided with a broad base upon which to build his or her own understanding of the mathematics.
In many cases, students are expected to construct their own understanding by thinking about the problem from several perspectives. They do need, however, validation of their thinking and confirmation that they are on the right track, which is why discourse among students and between students and teacher is critical. In addition, an important part of the teacher's role is to help students understand the concepts within an investigation and to provide an overview of the "big picture" of the mathematics within the investigation. To facilitate this, a review and
USING THIS MODULE ix

formalization of the mathematics is presented in a summary following each unit and within some lessons.
Teacher Resources
At the back of this Teacher's Edition are the following:
• Assessment Ideas with sample Evaluation Sheets • Quizzes • Solutions to Quizzes • Activity Sheets • The 1990 Census Questionnaire
Use of Teacher Resources
These items are referenced in the Materials section at the beginning of the lesson commentaries.
LESSON RESOURCE MATERIALS
Unit I: Censuses
Lesson 1: Conducting a Census • The 1990 Census Questionnaire
Unit I Activity: Taking Your Own Census • Activity Sheet 1 •Unit I Quiz
Unit II: Surveys
Lesson 5: Selecting a Sample • Activity Sheet 2
Lesson 6: Studying Randomization •Activity Sheets 2 and 3
Unit II Activity: Conducting Your Own Survey • Activity Sheet 4 •Unit II Quiz
Unit Ill: Experiments
Lesson 12: Measurement Variability and Bias • Activity Sheet 5
Activity: Conducting Your Own Experiment • Unit Ill Quiz
Unit IV: Projects
Lesson 15: Doing a Project • Activity Sheets 6-10 • Assessment Ideas: Evaluation Sheets
x USING THIS MODULE

Where to Use the Module in the Curriculum
Depending upon the mathematical content of the projects, this module could be used anywhere in the curriculum from general classes in the middle school to statistical-studies classes in the high school. Some of the activities involve more background knowledge than others, but all can be modified for a given class.
Student projects can be assigned at any level of mathematical sophistication and need not wait until the student has studied formal statistical procedures. The time allotted to complete a project can range from a few weeks to an entire term, and projects can be assigned concurrently with the study of other mathematics.
You do not need to start at page one in this book and proceed to the end. Each unit can stand alone. If your goal as a teacher is to have your students conduct sample surveys, you may use just that unit. Also, you can complete many of the lessons independently of the others. For example, if your goal is to have students read critically, then you should use Lesson 7, "Sampling in the Real World," and Lesson 8, "Critiquing a Printed Article."
Prerequisites
Students should have worked with ratios and percents and should be familiar with stem-and-leaf plots, box plots, and graphing points in a plane. For those who might need review, a possible resource is Exploring Data by Landwehr and Watkins, Dale Seymour Publications, 1995.
USING THIS MODULE ld

Pacing/Planning Guide
The table lists objectives and provides a possible sequence and pacing of the lessons.
LESSON OBJECTIVES PACING
Unit I: Censuses
Exploratory Lesson: Collecting Give students a brief introduction to first 1/2 class period and Analyzing Data three sections of this module.
Lesson 1 : Conducting a Recognize a census and give some of its 1 class period or more Census characteristics. Address problems associated
with taking a census.
Lesson 2: Looking at the U.S. Recognize the uses of U.S. census data. 1 class period Census Calculate population increase and decrease.
Understand population density and how it is calculated .
Activity: Taking Your Own Demonstrate through hands-on experience 1 class period or more Census aspects of planning, conducting, and
reporting a census.
Unit II: Surveys
Lesson 3: Conducting a Recognize a sample survey. Design a sample 1 class period Survey survey.
Lesson 4: Asking Questions Learn to minimize bias in constructing survey 1 class period or less questions.
Lesson 5: Selecting a Sample Apply randomization in sample selection . 1 class period , Recognize and analyze sampling bias.
Lesson 6: Studying Recognize that randomization reduces sampling 2 class periods or less Randomization bias.
Lesson 7: Sampling in the Understand how surveys are conducted in the 1 class period Real World real world . Find similarities and differences among
real-world surveys. Use proportions and percents to make comparisons.
Lesson 8: Critiquing a Printed Critically analyze surveys reported in the real 1 class period Article world. Use proportions and percents to make
comparisons. Read a graph.
Lesson 9: Understanding Identify characteristics of sampling error. 1 class period Sampling Error Compute sampling error.
Activity: Conducting Your Practice designing and conducting surveys. 1 class period or more Own Survey
ldi USING THIS MODULE

LESSON OBJECTIVES PACING
Unit Ill: Experiments
Lesson 10: Conducting an Conduct an experiment, and reflect on the 1 class period Experiment results . Analyze data for clusters, gaps, and
outliers. Make graphs from collected data .
Lesson 11 : Experimenting to Design and conduct an experiment to answer 1 class period Answer a Question specific questions.
Lesson 12: Measurement Understand that all measurement processes 1 class period Variability and Bias are subject to variabil ity and bias. Estimate
lengths and measure in inches and quarter inches. Graph and interpret collected data .
Lesson 13: Experiments in the Appreciate how experiments are conducted . 1 class period Real World Recognize how results are used in the real
world. Calculate percents and proportions, standard deviation of a sample proportion, and confidence intervals.
Activity: Conducting Your Design, implement, and analyze the results of 1 class period or more Own Experiment an experiment.
Unit IV: Projects
Lesson 14: A Reference Guide Use a reference guide as a tool when working 1 class period on individual projects.
Lesson 15: Doing a Project Complete a project following correct 1 week to entire procedure. semester
Lesson 16: Representing the . Organize data in many different forms for 1 class period or more Same Data in Different Ways clearer understanding. Construct a box plot.
Read and interpret a graphical display. Compute and compare percents.
Information Sheet: Write effective reports. teacher's discretion Informing Others
approximately 4 to 5 weeks total time
USING THIS MODULE xiii

Technotoo
Technology can vary according to the level of the students and the level of the projects. Computers with graphing software, graphing calculators, and word processors would be advisable to use for the projects, but are certainly not necessary. Some lessons do require at least a four-function calculator.
Grade Level/Course
This module is appropriate for students in grades 7-12. The scope of the project can vary in difficulty depending on the class level.
xiv USING THIS MODULE

UNITI
Censuses


EXPLORATORY LESSON
Collecting and Analyzing Data Materials: none
Technology: none
Pacing: 1/2 class period
Overview
This lesson is designed to give students a brief introduction to the first three units of the module: Censuses, Surveys, and Experiments. It explains the three ways to collect data and has students read short articles or look at graphs to tell whether what they have read or inspected is a census, a survey, or an experiment. As the lessons progress, students will learn in more detail how to distinguish the three collection methods and how to design their own censuses, surveys, and experiments.
Teachinc Note•
You might facilitate the lesson by assigning the reading as homework. It would be very helpful if students could get into groups to read the articles or to look at the graphs and then determine how to classify each article or graph as a census, a survey, or an experiment. Another approach is to divide the class into five groups and let each group study one of the selections. Each group should describe its article and draw a conclusion as well as explain its decision. Students might begin collecting articles from the media that could be used later as examples of censuses, surveys, and experiments.
COLLECTING AND ANALYZING DATA :J

EXPLORATORY LESSON
4 EXPLORATORY LESSON
STUDENT PAGE 3
EXPLORATORY LESSON
Collecting and Analyzing Data
What is a census?
What is a survey?
What is an experiment?
T he practice of statistics involves both collecting and analyzing data. Data is usually collected through a census,
a survey, or an experiment.
EXPLORE
In a census, you must obtain information on every person in the group (population) you wish to study. A population can be a very large group, such as in the U.S. Census where the group under investigation is the people of the United States. Your population could also be a smaller group, such as the student body of your school or the fish in your tank.
When gathering opinions or facts about an issue, data collectors usually find it impossible to study an entire population. For example, to find the most popular television show in the U.S., you might interview a small group and generalize your findings to the entire population. When you interview only a portion of the population, you are conducting a sample survey. The purpose of a sample survey is to estimate some characteristics of a population, such as the percentage of television viewers watching a specific show.
A third way to gather information is through experiments. Experiments are controlled studies of a topic or problem to answer a specific question concerning the effect of one or more treatments. For example, you might be concerned about whether plants grow better in salt water or fresh water.
'' Study the characteristics
of a census, a survey, and an experiment
Review data-analysis techniques
Carry out a data-analysis project

EXPLORATORY LESSON
Solution Key
Investigate
1. The article "Exercising Options" is a survey. The population was highschool students. Of the population, 11,631 students were surveyed.
z. The article "Love is Not Blind, and Study Finds it Touching" is an experiment. Information given in the article explains how this experiment was carried out. The goal is to decide if loved ones can be identified by touch; the goal is not to estimate some population characteristic.
STUDENT PAGE 4
Throughout this module, you will study these three methods of collecting data. You will discover important ideas that will help you analyze studies and determine if a survey or an experiment is accurate. You will look at surveys and experiments that experts have done, and you may design and carry out a survey or an experiment of your own.
Your class will tie together a full menu of statistical ideas including problem formation, data collection, data analysis, and data interpretation-all built around a theme that interests you.
Data Collection and Analysis
Read the following articles and graphs and determine whether each is a census, a survey, or an experiment.
1. Exercising Options
High school kids are exercising less, with almost equal numbers sweating over a game of Nintendo as a game of basketball
Around 37 percent of high school students surveyed say they exercise vigorously and ·regularly, according to a Center for Disease Control and Prevention study. But 35 percent say they spend at least three hours a day watching TV or playing video games The study, based on a survey of 11,631 high school students from 124 schools nationwide, did find that this percentage declined as students got older. Boys were consistently more active than girls in all age categories And girls became increasingly less active as they grew older-31 percent of ninth graders said they exercised three or more times a week, while only 17 3 percent of twelfth graders made the same claim.
Source: NEA Today, February, 1995
2. Love is not Blind, and Study Finds it Touching
How well do lovers know each other? A new study suggests that if blindfolded, they might recognize each other just by feeling their partners' foreheads. And if he's a man, touching his hand might do
Seventy-two blindfolded people in the study tried to distinguish their romantic partner from two decoys of similar age, weight and height.
The blindfolded participants stroked the back of each person's right hand in one test, and the forehead in another. Each time, they were asked to pick out the lover.
Random guessing would be right 33 percent of the time But the blindfolded people were correct 58 percent of the time in the forehead test, and women identified their man's hand 69 percent of the time.
COLLECTING AND ANALYZING DATA S

EXPLORATORY LESSON
:5· The graph "Women Off and Running" is a census because all women running for U.S. House seats and gubernatorial races were counted.
4. The article "If Women Ran America" is a sample survey. A poll was used by Life magazine to gather the information.
• EXPLORATORY LESSON
STUDENT PAGE 5
"I think that in real life we could probably do a whole lot better" said researcher Marsha Kaitz. The stress of being in a laboratory experiment and the carefully matched decoys probably hindered the real-world ability of recognition by touch, she said
"I think that probably everyone can do it," Kaitz, a psychologist at Hebrew University in Jerusalem, said in a telephone interview Touch recognition is "just a skill that has not been tapped before," she said
Source: Associated Press, June 22, 1992
3. Statistics That Change the Nation
Many more women from major political parties are becoming candidates
~ House nominees • Gubernatorial nominees
1984 1986 1988 1990 1992 1994
Source: data from National Women's Political Caucus, 1994
4. If Women Ran America
Two sexes differ on the issues affecting the nation
NEW YORK-A poll comparing men's and women's attitudes on public issues
suggests women want stricter law enforcement against drunken driving, guns
and drug dealing.
The poll was commissioned by Life magazine for a story in the June issue head
lined "If Women Ran America " Life said its poll found women interested in
"safety first. But fairness also, especially fairness for women at work"
Two in three women polled said they consider unequal pay for the same work to
be a very serious problem for women in the workplace~ Just half the men
responded similarly.
Half the women but only a third of the men think discrimination in promotions is
a very serious problem for women at work.
The poll said 78 percent of women, compared with 64 percent of men, think
businesses should be required to provide paid maternity leave.

EXPLORATORY LESSON
s. The article "Back Treatment: Lay Off" is really just observation about a particular population. It is neither a true experiment nor a true survey.
STUDENT PAGE 6
The poll was taken by the Gallup Organization, which surveyed a national sample of 614 women and 608 men by phone March 30-April 5.
The margin of error ranges from plus or minus 3 percentage points for the whole
sample, up to 6 points for comparisons of results of men and women
In other words, the poll indicates a gender gap, rather than chance variation,
accounts for differences of opinion such as this: 55 percent of women but only 46 percent of men said the government should make fighting crime and violence
an extremely important priority.
Seventy-six percent of women and only 58 percent of men said the justice system wasn't hard enough on drunken drivers. On drug dealing, 88 percent of
women and 77 percent of men wanted the system to be tougher. Seventy per
cent of women and 63 percent of men wanted to be tougher on illegal gun pos
session
Women were more compassionate than men on some issues: 85 percent would
approve of a law requiring businesses to all~w employees an unpaid 12-week
family medical leave. Women were more likely than men to approve of such a
leave for homosexual couples, and to say they would vote for a gay candidate
Source: Gainesville Sun, May 5, 1992
5. Back Treatment: Lay Off
By Tim friend, USA Today
less may be best when it comes to treating back pain ,
A study out today suggests that people whose doctors prescribe the least pain
medicine or physical restridion get as much relief as those treated with more
pain medicine and bed rest.
The researchers, writing in the Annals of Internal Medicine, studied 1,213 people
with back pain and the 44 dodors who treat them at the Group Health
Cooperative of Puget Sound, Seattle.
They divided doctors into groups-those prescribing the most medicine and rest,
those in the middle, and those prescribing the least. Outcomes of patients one
and two years after the initial visit reveal:
• No difference in how patients rated their care, and none in their level of pain.
• Those who took the least medicine and restriction were the most satisfied
with efforts to each them how to deal with pain.
• Total cost of care was 79% higher in patients prescribed the most medi
cine and bed rest
• About 85% of people have back pain at some time, making it the second
leading reason to see a doctor, behind colds.
Source: USA Today, 1993
COLLECTING AND ANALYZING DATA 7

LESSON 1
Conducting a Census Materials: none Technology: search tools and CD ROMS (optional)
Pacing: 1 class period or more
Overview
When most people hear the word census, they think of the U.S. Census that is conducted every ten years. This lesson asks students to discuss their knowledge of the census. It also deals with the difficulties involved in taking the census. The problems involved in collecting information from an entire population are highlighted. The overall focus of this lesson is on general knowledge of the census. Students should understand that a census need not deal with the total population of the United States. It is a census if any entire subsection of the population is surveyed.
For example, if you want information on all the students in your school and you call everyone and get the required information, you have a census on the population of students. The difficulty, however, is getting responses from the entire population, which is a focus of this lesson.
Teaching Notes
You may wish to bring in a school census used to determine how many students.of school age the community will have during the next year. Discuss with students why the school system needs such information. Other censuses may be available from the city or regional offices, or from religious organizations.
A population undercount is a serious matter for large urban areas. If too many of the population are not counted, the funds allocated for financial assistance and for health and police services are reduced.
8 LESSON 1
Authorities strive to find better and more efficient methods to ensure that everyone is counted. In the 1990 census, the technique employed was similar to the Capture/Recapture problem in Exploring Surveys and Information from Samples, Landwehr and Watkins, Dale Seymour, 1986.
You may want to have groups of students do some brief research on the U.S. Census and then present their findings for Problems 1-5 to the class. Individuals or groups could also brainstorm answers for Problems 6-8 and then present their ideas to the ' class. Students could use search tools and CD ROMS to obtain more information about the U.S. Census.

LESSON 1: CONDUCTING A CENSUS
STUDENT PAGE 7
LESSON 1
Conducting a Census
How do all the students in your school feel about the daily schedule?
How do all the people in your state feel about highway speed laws?
Recogn ize a census and give some of its characteristics.
Address problems associated with taki ng
a census.
)
A r the beginning of a data-gathering project, it is important to identify the population of people, animals, or objects
that you will study. When data are collected from the entire population, the srudy is referred to as a census. Some examples of a census could be a study of the entire student body in your school or all the students in a particular grade level, a study of all the mammals in a zoo, or an investigation into all the tennis balls a team uses to practice.
In one sense, your teachers conduct a census daily when they take attendance. Taking a census at a hospital or taking an inventory at a business are two more census like procedures that occur rather frequently and have been developed into routine events. Each procedure has prescribed times and methods established to ensure accuracy.
Taking a census can be a very difficult task. The difficulty in doing a census, even within your school, is to be sure that every person is counted once and only once. For example, suppose you want to know how many students in your school sang the school song at a pep rally yesterday. This becomes difficult because some of those students are not present today and yet those students must be included in the data collection.
INVESTIGATE
The U.S. Census
One of the most familiar censuses is the U.S. Census, provided for by the original draft of the Constitution in 1787. What do you know about the U.S. Census? .
CONDUCTING A CENSUS 9

LESSON 1: CONDUCTING A CENSUS
Solution Key
Discussion and Practice
•· Answers will vary but the following are typical reasons why the U.S. Census is conducted.
• to determine the number of Representatives each state is allotted in Congress
• to find out about the standard and the quality of living of U.S. citizens
• to determine income levels to better distribute funds to communities for programs such as education
• to determine Congressional, state, and local election district boundaries
• to find out how many elderly people there are
• to determine the need for transportation, medical, and educational facilities
z. To find out what types of questions are asked on the Census, see The 1990 Census Questionnaire included at the end of this Teacher's Edition.
~. The U.S. Census is taken every ten years in the decade years, 1970, 1980, and so on .
4. a. Some of the problems involved in conducting the U.S. Census are including everyone, getting accurate responses, and collecting and recording data correctly.
b. Consequences of inaccurate data can alter or halt projects and can cause federal, state, or local funds to be allocated unfairly. Being missed in the count can affect the people missed as well as their neighbors.
c. Census population counts for each state must reach the president within nine months after
10 LESSON 1
STUDENT PAGE 8 .
Discussion and Practice
1. Why is the U.S. Census conducted?
a. What questions are asked?
:J, How often is the U.S. Census conducted?
You can imagine the difficulties involved in conducting a census of the United States.
4, Answer the following questions and be prepared to report to the class.
a. What are some problems involved in conducting a census?
b. What are some possible consequences of missing people or counting them twice?
c. Find out how long it takes to count the population of the United States.
The difficulties in conducting the U.S. Census are enormous. People are not going to stand still while officials come by to count them. Life goes on. How can the government get areasonable count of the actual population? This "nightmare" task can be handled if you consider some essential factors.
Practice and Applications
Make some decisions on the following issues involved in taking a census of the United States. Be prepared to present your ideas to the class.
Countinll People
5, Decisions about who should be counted and who should not be counted must be made.
a. Give some categories of people that might be difficult to count.
b. Give a description, specifying who will be counted, that could be used in the next U.S. Census to be taken on April 1, 2000.
Counting Everyone Just Once
6. Mailing a form to each residence might seem co be an easy
Census Day, which has been April 1 of the Census year since 1930.
Practice and Applications
s. a. People who might be difficult to count are soldiers at home or overseas, travelers, U.S. citizens who work abroad, people who are born or die on Census Day, college students, homeless individuals, and so on.

LESSON 1: CONDUCTING A CENSUS
STUDENT PAGE 9
b. Answers will vary.
6. a. Some difficulties with mailing a questionnaire are recording people who move, who own more than one home, or who are homeless.
b. Answers will vary.
7. a. If one city or state had several thousand more people than were counted in the Census, it would have more representatives in Congress and more funding for education, service, and other programs at the expense of those regions in which the count was accurate.
b. Answers will vary.
c. Answers will vary.
and accurate task, but there are difficulties with this procedure as well.
a. List some difficulties in counting people by mailing a form.
b. Write a paragraph explaining how you would count everyone just once.
Contro1Ung Errors
7. Following up on incomplete questionnaires, missing questionnaires, and other sources of error is an important feature of the U.S. Census effort.
a. Many political decisions are made by using the data the census provides. What are some of those decisions? How would errors affect them?
b. What other errors might occur?
'" How would you check for errors and locate missing questionnaires?
8. Extend Design a census you could use to count the number of people living on your block on April 1 of next year. Be sure your questionnaire makes clear exactly who should be counted.
.
CONDUCTING A CENSUS II

LESSON 2
Looking at the U.S. Census Materials: none Technology: calculators
Pacing: 1 class period
Students could work individually or in small groups to do the calculations and to answer the questions.
Overview
This lesson takes a closer look at one of the uses of the U.S. Census-determining population density. The effects of population density and its percent of increase are key factors when discussing the Census. They are also important mathematical ideas placed in a real context.
You may wish to share The 1990 Census Questionnaire with your students as· additional information.
Teaching Notes
Students can use this lesson as a stepping stone to research on the Census~ Background information about the Census-its history, its purpose, and its procedures-is given below. Students can use the media center to find out about the Census and do either oral or written reports on it. The first known census was given for tax purposes in Babylonia in 3800 b.c. The following is a brief history of the U.S. Census. The resource is Educator's Guide to the 1990 Census, from the U.S. Department of Commerce, Bureau of the Census, August 1988.
The need for a national census of the new United States arose soon after the thirteen colonies broke their ties with Great Britain. The costs of the Revolutionary War ( 177 5-83) had been high, and the new nation had to find ways to pay the debt;
1Z LESSON 2
one way was to divide it equally among the people. Another reason for a census was to establish a truly representative government to sit in the two Houses of Congress. While each state, regardless of size, would have two Senators in the Senate, the number of Members of the House of Representatives would be apportioned-divided up-among the states according to their population. The only way to find out how many people there were was to count them, so for the first time in history, a nation decided to make a census part of its constitution. As adopted in 1787, the U.S. Constitution included these words in Article I, Section 2:
"Representatives and direct Taxes shall be apportioned among the several States which may be included with this Union, according to their respective Numbers .... The actual Enumeration shall be made within three Years after the first Meeting of the Congress of the United States, and within every subsequent Term of ten Years, in such Manner as they shall by Law direct."
From its beginnings, the decennial census has been more than a simple "headcount." Gathering information on sex and age in 1790 was done "undoubtedly, to obtain definite knowledge as to the military and industrial strength of the country." Through the years, the nation has changed and so has the decennial census. The size, composition, and distribution of the population; the laws; and the complexity of the country have changed-and with them, the needs for statistical information. To stay in step, the content of the census has varied over time, "in such Manner as they shall by Law direct." Since 1940, the decennial census has been limited to items on population and housing.

To summarize the growing number of census returns, mechanical tallying machines were first introduced in the 1870 census. Despite their presence, publishing all the reports from the 1880 census took nearly a decade. These growing processing problems led directly to the development of the punch card and. an electric tabulating machine by Herman Hollerith, an employee of what was then called the U.S. Census Office. This revolutionary means of coding and tallying information was used to process the 1890 census.
The first commercial electronic computer, UNIVAC-1, was used to compile some of the statistics from the 1950 census .... Dealing with everincreasing processing complexities, Census Bureau employees created another revolutionary machine known as FOSDIC (Film Optical Sensing Device for Input to Computers) for use in tabulating the 1960 census. After high-speed cameras microfilm census questionnaires, FOSDIC reads the "fill-inthe-dot" answers directly onto computer tape. To enhance accuracy in collecting and tabulating census information, the 1990 census will be [was] marked by the Census Bureau's creation of a new digital mapping and geographic referencing system known as TIGER (Topologically Integrated Geographic Encoding and Referencing).
It was only in 1902 that a permanent census office was established in the Interior Department. In 1903 it was transferred to the new Department of Commerce and Labor. When that department was split in 1913, the Bureau of the Census was placed in the Department of Commerce.
Census population counts for each state must be reported to the President within 9 months after Census Day, which has been April 1 of the census year since 1930. Within 1 week of the opening of the next session of the Congress, the President must send to the Clerk of the House of Representatives the census count for each state and the number of Representatives to which each state is entitled, following the method of apportionment selected by the Congress. Within 15 calendar days, the Clerk of the House then notifies the Governor of each state how many Representatives that state will be entitled to in the next Congress ....
While the Census Bureau is best known for the national Census of population and Housing conducted every 10 years, the agency also conducts national agriculture, economic, and governments censuses every 5 years. Besides censuses, the Census Bureau administers about 250 sample surveys each year (many for other Federal agencies) and prepares estimates and projections. These data collection efforts result in thousands of statistical reports each year. All of this has earned the Census Bureau the name Fact Finder for the Nation.
The following information from the same source answers some more specific questions about the Census.
How was the 1990 Census taken?
Just before the day of the Census, most households in the United States received a questionnaire in the mail. Census workers delivered other questionnaires to rural areas and to some urban, multifamily complexes. The Census asked 95% of the households to mail the completed form right away. If they didn't, a Census worker went to that home to get the information. The rest of the Census included people in sparsely settled rural areas and in group quarters-such as nursing homes, college dormitories, military barracks, and boarding houses. A Census-taker either picked up forms from these places or did interviews there. A completed form included information about everyone that lived at the house except visitors. Babies born on the day of the Census were included.
What happened then?
Returned forms were checked for completeness. If Census employees saw that information was missing, illegible, or inconsistent, they contacted the household to correct the form. After making these checks, the employees tallied the answers to the same questions from all the forms. This created statistical totals for a variety of geographic areas.
What was asked?
Most of the questionnaires asked only a limited number of questions about each household member-such as race, national origin, age, and marital
LOOKING AT THE U.S. CENSUS 13

status-and about the house unit-such as owner or renter status. It took about 15-20 minutes to complete. The remaining households completed more elaborate forms that asked about education, employment, income, occupation, ancestry, the age of the building, the source of water, the type of fuel used for heating, and so on. The average completion time for this form was about 45 minutes. A sampling pattern selected these households. Their responses were very important because they statistically depicted the total population on items such as education. The Census used the sampling method to minimize demands made on the public, but still get useful and reliable data.
How are the Census summary data used?
The questionnaires included only questions that addressed important policy and program needs. For instance, questions on plumbing facilities provided data for Federal studies on housing standards and quality. Likewise, summary statistics from the income questions were widely used by Federal, state, local, Native American tribal, and Alaskan Native village governments in the distribution of funds to communities for a variety of programs, including education. The 1990 population totals were used to determine Congressional, state, and local election district boundaries.
Governments draw heavily on census data in planning and implementing community projects and developments, such as planning for new schools. Business and industry make use of these statistics, especially those for small geographic areas, to decide where to build new plants or offices. Social-service providers are increasingly using Census data to understand and help their clientele. The 1980 Census Neighborhood Statistics Program made Census information available for approximately 28,000 neighborhoods, giving community leaders a better understanding of their areas. Individuals also use Census-summary information for personal decisions, such as planning a small business or choosing a place to live. By law, the personal information collect~d by the Census cannot be given to anyone or any organization. Much more information is available through the Bureau of the Census.
14 LESSON 2
Students could work individually or in small groups to do the calculations and to answer the questions.
Follow·Up
You may want to invite a speaker from the Bureau of the Census Department to give a presentation about the department to your class. If you write to the Census Department and include your zip code and your county, they will send you a report of statistics for your community. These statistics can suggest very interesting projects for the class.
Bureau of the Census Department of Commerce Washington, D.C. 20233

LESSON 2: LOOKING AT THE U.S. CENSUS
Solution Key
Discussion and Practice
x. Population density is important for economic reasons, such as housing, water consumption, food supply, and air purity.
STUDENT PAGE 10
LESSON 2
Looking at the U.S. Census
What kind of information is collected by the U.S. Census?
Why is it collected?
Who uses the information?
U .S. Census data provide a wealth of information. These data help determine housing needs, state and local fund
ing, education levels, and gender- and race-equity issues. They are also valuable for making predictions and forecasting events: where people are moving; how many elderly people will be in the United States in ten years; and how many new schools will be needed. Census data are used to report changes in population after each decade. These data also determine the number of representatives each state has in Congress and the amount of funds states receive for federal programs, such as grants for low-cost housing.
INVESTIGATE
Population Density
Census data can be used to study population density. Population density is the average number of people living in a specified unit of area. The density is calculated by dividing the number of people in the population by the area covered by that population.
Discussion and Practice
:1. Why do you think population density might be an important jssue?
. : Recognize the uses of
U 5. Census data, Calculate population
increase and decrease. Understand population density and how it is
calculated.
LOOKING AT THE U.S. CENSUS IS

LESSON 2: LOOKING AT THE U.S. CENSUS
STUDENT PAGE 11
z. See table below.
Year Total Land Area Population Population (square miles) Density
1950 151,325,798 3,552,206 a. 42.6
1960 179,323, 175 b. 3,543,936 50.6
1970 203,302,031 3,540,023 c. 57.4
1980 226,542, 199 d. 3,539,722 64.0
1990 248,718,301 e. 3,537,956 70.3
I6 LESSON 2
:a. The table below represents data found in the 1997 Statistical Abstract of the United States. On another sheet of paper, write the numbers that belong in the empty cells to complete the table below.
Year Total Land Area Population Population (square miles) Density
1950 151,325,798 3,552,206 a,
1960 179,323, 175 b. 50.6
1970 203,302,031 3,540,023 o.
1980 226,542,199 d, 64 0
1990 248,718,301 e. 70 3
f, What unit of measure should be attached to population density?
g. Describe the trend over time in U.S. population density.
h. Describe what impact this trend could have in the future.
31, The table below represents data on the population of the United States from the 1997 Statistical Abstract. Calculate the percent of increase for each ten-year interval from 1960 to 1990. Write your answers on another sheet of paper.
Year Total Percent Population of Increase
1950 151,325,798
1960 179,323, 175 a.
1970 203,302,031 b.
1980 226,542, 199 o.
1990 248,718,301 d.
e. If you want to find the percent of population increase from 1950 to 1990, can you add the numbers in the "percent of increase" column? Explain why it does or does not work.
f, Calculate the actual percent of increase from 1950 to 1990.
f. The unit of measure that should be used with population density is "people per square mile."
g. The population density of the United States in increasing.
h. Increased population density could cause shortages in food, water, natural resources, and clean air. More money most be appropri-ated to cover cost of education, cost of caring for the elderly, or the cost of transportation in densely populated regions.

LESSON 2: LOOKING AT THE U.S. CENSUS
~-
Year Total Percent Population of Increase
1950 151,325,798
1960 179,323, 175 a. 18.5%
1970 203,302,031 b. 13.4%
1980 226,542,199 c. 11.4%
1990 248,718,301 d. 9.8%
To calculate percent of increase for 1960, compute the following:
1960 population - 1950 population 1950 population
e. You do not add the numbers in the percent increase column to determine the percent of population increase from 1950 to 1990. If you did, you would get 53.1 % increase. The 1950 population of 151,325,798 and the 1990 population of 248, 718,301 clearly indicate more than a 53.1 % increase.
f. The actual increase from 1950 to 1990 is 64.4%.
1990 population - 1950 population 1950 population
4. Answers will vary. Take the number of people in the class divided by the area of the room in square yards.
STUDENT PAGE 12
SUMMARY
In a census, you must obtain information on every member of the population you are studying.
• The group you are interested in studying is called the population.
• The U.S. Census, which is conducted every ten years, is an official enumeration, or count, of the number of people living in the United States. It is used for political, social, and economic purposes.
Practice and Applications
4. Find the population density of your classroom or the school auditorium using the number of people per square yard.
LOOKING AT THE U.S. CENSUS J.7

UNIT I ACTIVITY
Taking Your o~census
Materials: Activity Sheet 1 Technology: computers (optional), calculators (optional)
Pacing: 1 class period or more
Overview
This activity demonstrates to students through a hands-on experience many of the aspects of planning, conducting, and reporting a census of their own. It shows students what goes into the production of statistical information, how individual responses on a questionnaire are merged to create summary data, and the usefulness of the summarized information. Students will also be able to work with personally relevant data.
Teaching Notes
This material is from "That's Easy for You to Say!" by the Department of Commerce, Bureau of the Census, August 1988. Students can prepare their own census questionnaire and not use the one provided. One suggestion is to divide the class into committees to consider the separate aspects of the projectquestionnaire design, data collection, and data processing. Each committee should have a decision leader and a scribe.
If students design their own questionnaires, they should only use about ten questions with answers that can be circled or checked, not filled in. Make sure they include two or three "background demographic" items, so students can correlate data and make statements such as, "The girls were more likely to say .... " Students who use computers to process the forms should sequentially number each form or record so they can reference them easily should coding errors or strange values appear.
X8 UNIT I ACTIVITY
The assessment aspect of this activity lies in how each student or group of students follows through on his or her assigned task. You'll find more information on assessment in the Assessment and Quizzes section at the end of this book.

UNIT I ACTIVITY: TAKING YOUR OWN CENSUS
STUDENT PAGE 13
UNIT I ACTIVITY
Taking Your Own Census
Demonstrate through hands-on experience the
aspects of planning, conducting, and
reporting a census.
U se Activity Sheet 1 or make a copy of these two pages to complete the census. Pass out the list of questions to every
student in your class (or grade or school, if you wish to have a larger population). Assure the people you ask to fill out the questionnaire that their answers will be completely confidential and that only summary data will be reported. Be sure to thank them for taking the time to fill out the questionnaire.
:I, How old are you?
_Younger 13 16 19
than 12 14 17 Older than 19
12 15 18
z. What is your gender?
Male Female
"' Do you plan to get married?
Yes No
4, Do you plan to have children?
Yes __ No (if no, skip to question 6)
s. How many children would you like to have?
2
3
4
5
6
7 or more
•· After high school, which of the following do you plan to do?
__ Attend a two-year college
__ Attend a four-year college
Go to a trade or vocational school
__ Join the Armed Forces
TAKING YOUR OWN CENSUS I9

UNIT I ACTIVITY: TAKING YOUR OWN CENSUS
STUDENT PAGE 14
ZO UNIT I ACTIVITY
__ Get a full-time job
None of these
7. Of the following occupations, which one would you most like to pursue after school?
Doctor Hairdresser
Teacher Mechanic
Social Worker __ Carpenter
__ Lawyer Truck Driver
__ Computer Programmer Law Enforcement
Stockbroker Farmer
__ Firefighter None of these
8. Of the following occupations, which one would you least like to pursue after school?
Doctor Hairdresser
Teacher Mechanic
Social Worker __ Carpenter
__ Lawyer Truck Driver
__ Computer Programmer Law Enforcement
.~tockhrnker former
__ Firefighter None of these
Source: "That's Easy for You to Say!" Department of Commerce, Bureau of the Census, August 1988
Once the questionnaire has been completed by every class member, you can begin to analyze your results. Decisions you will need to make are:
How will you record the information you have gathered?
Will you break into groups to analyze each question?
How much time will you devote to this study?
How will you communicate your results?

UNIT II
Surveys


LESSON 3
Conducting a Survey Materials: none
Technology: none
Pacing: 1 class period
Overview
This lesson was designed so students understand that it is not easy to write good survey questions. Students will also practice analyzing and writing questions.
Teaching Notes
When students answer the questions on the initial survey, the responses will vary greatly. Some will answer in glasses, some in ounces, some in cans, and so on. Students will find when they attempt to collate these answers that there is no common measure, and some changes need to be made to the original survey questions. Students should work in small groups to complete this lesson.
Follow-Up
Students might practice writing a survey to find an answer to a question for which they have a special interest.
CONDUCTING A SURVEY 2~

LESSON 3: CONDUCTING A SURVEY
STUDENT PAGE 17
Solution Key
Discussion and Practice
•· Students should answer survey questions on a separate piece of paper.
Z4 LESSON 3
LESSON 3
Conducting a Survey
In the last section, you learned about taking a census. Is it always possible to take a census?
If you have your blood tested, does the doctor use all of your blood for the test?
B ecause taking a census is a difficult and sometimes impossible task, it is often necessary to take a portion of the
population and to study that group. Collecting information from a portion of a group is referred to as a sample survey.
INVESTIGATE
Survey Methods
Frequently, people want to gather opinions or facts about an issue or an idea. One method of gathering this information is to stop people at grocery stores, malls, bus stations, and so on, and to ask them the desired question(s). Another method is to call people on the phone. You or someone in your family may have answered sample-survey questions before.
Discussion and Practice
1. The survey below deals with soda (or soft-drink) consumption. It is a first attempt at designing survey questions. Your goal is to find out how much soda is consumed by your class. Individually, write a response to each of the following survey questions.
a. What is your name?
b. Are you male or female?
c. How much soda do you drink?
d. Are you an athlete or a nonathlete?
,, Recognize a sample
survey
Design a sample survey.

LESSON 3: CONDUCTING A SURVEY
2. a. The questions in parts b and e were probably harder to answer because there were many possible ways to answer.
b. Yes, this survey seems to want to find out how many people drink a certain amount and type of soda.
c. Only the question in part b is needed to answer the question, "How much soda is consumed by your class?" The last few questions may be of interest, but they do not directly address the issue.
d. Students might eliminate the questions in parts d, e, and f because they do not directly deal with the main question.
e. Students might add questions that narrow the choices in amount of soda and that set a time frame for the questions.
f. Although the second question addresses the main question, it is very vague. Students will use many units of measure, so collecting class data will be very difficult. Also, no time period was set, so answers could be vastly different. This questions should be reworded. Student rewrites of the questions will vary.
:1. a. For a complete census, you would have to ask every student if he or she would attend the game. This would be very difficult. On the other hand, if the principal assumed the same number of students would attend the game as the week before, she is not taking into account factors such as who the opponent is or what the weather will be like. These would affect game attendance.
b. Factors that might affect next week's attendance include the weather, the opponent being played, and the time the game is played. Other things going on in the community might have an
STUDENT PAGE 18
e. What is your favorite soda?
f. Do you prefer caffeinated or noncaffeinated soda?
z. In your group, work together to answer the following questions. Collect and organize the data from your group. Select one person to report your conclusions to the class.
a. Which questions were difficult to answer? Why?
b. A survey usually is taken to determine how many people hold a certain opinion or act in a certain way. Does that appear to be what this survey is about? Explain.
e. Were all of the questions necessary? Why or why not?
d. Which questions would you eliminate? Explain.
e. Which questions would you add? Explain.
f. Which questions would you reword? Write these questions more clearly.
You probably found that you didn't need all of the questions. Some information you gathered was not helpful in finding out how much soda your class consumes. Some questions were very vague and unclear, and students answered using different units. Collecting or organizing the data became difficult.
Being able to design good survey questions is an important skill to develop. In this lesson, you will experience firsthand the difficulties of designing survey questions. Then you will learn the techniques of writing good survey questions.
3. Here is another situation that calls for a survey. Your school principal needs to know how many students will attend the football game on the weekend so she can reserve enough student seats. You need to gather reliable information on this issue. One way is to ask each student if he or she will attend the game. Another is for the principal to assume that the amount of space needed would be the same as the number of seats needed last week.
a. Do you think either of these is a good strategy? Why or why not?
b. What factors might affect the attendance at the game?
4. Another technique is to conduct a sample survey of the students and ask the sample students if they will be requesting a seat for the game. Calculate the proportion of "yes" responses to the number of students in the sample. Then use
impact on attendance. Students may have other reasons.
4. This is a good technique, provided a random sample of students is selected and the sample size is at least 10% of the student body, as you will want to avoid small samples. Multiply the sample proportion who will request seats by the population size of the school to obtain the total number of seats needed.
CONDUCTING A SURVEY ZS

LESSON 3: CONDUCTING A SURVEY
STUDENT PAGE 19
Practice and Applications
5. Each of these steps is integral to selecting a good sample.
• If the objective is not clear, the questions asked may not give you the information you are seeking.
• If the target population is not clear, members of a group other than the population of interest may be surveyed. This would invalidate the results because the responses may not be representative of the group in which you are interested.
• The questions must be clear and unbiased, and ask what you want to know. If this is not the case, the results of your survey will nol answer the original question.
• The field test is important to see if you are getting responses that answer the question you are asking.
• The randomness of your sample, relative to the population, is very important. All segments of the population must have a chance to be in the sample to assure that the population is represented fairly.
• It is important to choose enough people in your sample to get a fair idea of what your population is thinking, but not too many people. You don't want to waste your time and money.
• There must be consistency in collection and management of data so there is accuracy in the results.
• Data analysis shows the results of your survey. Thoroughness and accuracy are most important to have accurate conclusions.
Z6 LESSON 3
that proportion to estimate the number of seats required for next week. Do you think this is a good strategy? Why or why not?
This scenario is typical of sample survey problems. A question related to "how many?" or "how much?" is asked about a specific group of objects. Remember, the group of objects is called the population. In the seating problem, the entire student body is the population. An approximate answer to the question is found by surveying a sample of the population.
The answer based on the sample will be a close (or good) approximation only if the sample actually represents the population. One method of making sure a sample does represent a population is called randomization. Randomization means the sample is selected at random from the population. This means that every member of the population has an equal chance of being included in the sample.
Here are the key steps in conducting a survey:
State the objectives clearly.
Define the target population carefully.
Develop good survey questions.
Use a field test to try out the questionnaire. (You fieldtested a questionnaire when you completed Problem 1.)
• Design Lhe sample sdeCLiun plan using iandumiialiun. (Remember, randomization means that every member of the population has an equal chance of being included in the sample.)
Choose an appropriate sample size.
Organize the data collection and data management.
Plan for careful and thorough data analysis.
Write conclusions based on the original objectives.
Practice and Applications
5. Why do you think each of the key steps outlined above is important?
f>. Designing and conducting a good survey involves many steps. Use the questions and statements below as a guide to design your own sample survey for soda consumption.
• Your conclusion should reflect all of the work done in the other eight steps of this process. It should be based on actual results and should answer the question you originally asked.

LESSON 3: CONDUCTING A SURVEY
6. A possible survey might include the following:
a. We want to know how much soda is consumed by people who live in the homes of this class in one day and if their preferences are diet or regular soda.
b. Our target population is the people who live in the homes of the students in this class.
c. Sample questions: "How many 8-ounce glasses of soda do you drink in a day?" and "Do you prefer diet drinks?"
d. Students will try this survey out on people who live in their homes. When they write their paragraphs it is important to
• Make sure they use factual information from the data they gathered.
• Insist on correct grammar and spelling.
• Make sure they answer the questions as listed in Problem 4.
STUDENT PAGE 20
a. What is it you want to find out? State your question clearly.
b. Whom do you want to survey? Define the target population carefully.
c. Develop a few good questions. Remember, a survey often is taken to determine how many or how much. (How many people prefer diet drinks?) It may be that each question may only ask for an opinion. (Do you prefer diet drinks?) The questions must be clearly stated so the answers are as accurate ·as possible, and so the answers are comparable across the respondents. (Does family mean the same to everyone?)
d. Field-test your survey with five to ten people. Write a paragraph that tells how your survey worked. Indicate whether your questions were clear and had acceptable answers. What difficulties did you have? Proofread and correct grammar and spelling.
e. Conduct your survey and report your results.
CONDUCTING A SURVEY Z7

LESSON 4
Asking Questions Materials: none
Technology: none
Pacing: 1 class period or less
Overview
This lesson was designed so that students understand that the concept of bias is crucial when writing survey questions. The wording the questioner uses, the tone or manner of asking, or the tenor of the topic, may cause the respondent to give a response different from what he or she would give if the item were asked in a nonbiased way.
Teaching Notes
The issue of bias is a hot topic in contemporary America. This lesson will elicit many opinions from students. Discussion is important both in small groups and within the class as a whole.
Z8 LESSON 4

LESSON 4: ASKING QUESTIONS
STUDENT PAGE 21
LESSON 4
Asking Questions
How many people are in your family?
Would you prefer to have class in a large new building or in an old run-down school?
T her.e are many things to watch for when creating a survey questionnaire. Questions need to be well-stated to get
exactly the information you want. When the respondent does not understand the question, it may be that the question is ambiguous. In the question, "How many people are in your family?" the word family can be interpreted in many different ways. If the goal is to know how many family members are living in your home, you first have to agree on a definition of family. If the goal is to know how many brothers a person has, then the question might be, "How many living brothers and stepbrothers do you have?" You, as the survey designer, have to understand clearly what question you want to be answered.
INVESTIGATE
Bias in Surveys
Bias, too, is a very important issue that needs to be understood. Questions should not be asked in ways that influence their answers. If responses to a question tend to lean toward one side of the "truth," then the responses are said to be biased. For example, if the bathroom scale is set 5 pounds light, the measurements produced by the scale will be biased. Anyone who gets on the scale will see a reading that is on the light side of the truth.
Discussion and Practice
When analyzing statistics, bias can interfere with a true picture of what is happening in the population. You must minimize all types of bias. Here are some examples.
•:
Learn to minimize bias in constructing survey
questions.
ASKING QUESTIONS Z9

LESSON 4: ASKING QUESTIONS
Solution Key
Discussion and Practice
I. You are offering your opinion by asking it that way. You are "leading" people you are surveying into giving responses you desire rather than allowing them to give their own opinions.
z. a. The desire to please the person asking the question may be a factor. An example might be an African American asking questions about Martin Luther King Day. Fear of offending the questioner may cause the person to alter his or her response. The example in Question 1 might also apply. A person may not be willing to take the time necessary and instead give any response. Other reasons may be given by the class.
b. A student may want to please the teacher or be fearful of a response showing little time on homework.
3. The question in part b may be better than the one in part a because you have given no value judgment of your own to the question. Respondents are more free either to favor or to oppose capital punishment.
30 LESSON 4
STUDENT PAGE 22
I. Biased question: The question, "You don't drink Coke®, do you?" is a leading question and is considered biased. Why do you think this is a biased question?
:z. Biased response: Bias can also occur when the people surveyed do not tell the truth in their responses to a given question. There is more to this than lying. ,Some people cannot recall the truth, and others may intentionally try to mislead.
a. Why might someone lie when responding to a survey?
b, Would the following question lead to a biased response? The teacher asks a student, "How much time do you spend doing your math homework each week?" Explain your reasoning.
It is important to keep in mind that if a survey involves people, the questions become very important. Responses to questions are greatly influenced by the wording of the questions. This fact has been observed over and over in actual studies of survey questions.
J. Do you think the following questions are biased?
a. Do you favor the use of capital punishment? Why or why not?
b. Do you favor or oppose the use of capital punishment?
Responses to questions can be drastically altered by the choice of words. This can be seen in a study by Schuman and Presser (Questions and Answers in Attitude Surveys, Academic Press, 1981). Consider the following questions:
Do you think the United States should forbid public speeches against democracy?
Do you think the United States should allow public speeches against democracy? .
In one study, those presented with the first question gave 21.4% yes responses, while those presented with the second question gave 47.8% no responses. People are somewhat reluctant to forbid public speeches against democracy, but they are much more willing to not allow such speeches. "Forbid" is a strong word that brings out a negative feeling that many people cannot favor. "Allow" is a much milder word that does not elicit such strong feelings. The important point to remember is

LESSON 4: ASKING QUESTIONS
Practice and Applications
4. a. Students will have many examples. One example is: Do you think the mighty Green Bay Packers will win the game Sunday?
b. Who do you think will win the game Sunday, Green Bay or Pittsburgh?
c. Line plots, bar graphs, box plots, circle graphs, or stem-and-leaf plots can show the data students gathered. Students can also write a conclusion comparing the results of the two questions.
Practice
s. a. The presence of the officer could bias the response. The word respect is not clearly defined. Possible rewrite: A nonpolice officer asks, "Do you think police officers are doing a good job or could they improve in their enforcement of the laws?"
b. Annette is influencing the result. Possible rewrite: "What do you think of Bob Bellrichard?"
c. This can be a sensitive issue, and people may inflate or deflate their responses. A possible way to rewrite the question would be to have several options with a range of salaries. For example, "Do you earn under $20,000, between $20,000 and $40,000, or over $40,000?" The answers should be confidential, perhaps anonymously placed in a box.
d. This is an acceptable situation.
6. Part a is probably the best answer of the four given. The words outlaw, prosecute, and freedom are all emotionally charged words and may direct the response of the person being surveyed.
STUDENT PAGE 23
that the tone of the question set by the words employed can have a significant impact on the responses.
Pr,actice and Applications
4, Think of a survey topic.
a. Write an intentionally biased question about your topic. Ask 30 people to respond to your biased question and record the results.
b. Write the same question in what you consider a nonbiased way. Ask 30 different people to respond to your nonbiased question and record the results.
'" Compare the results of the two versions.
5. Indicate if there is bias in the sample survey questions below. Rewrite the question to eliminate the bias if it exists.
a. The Grotop Police Department would like to know if the students respect methods the police use to enforce the laws of the community. Officers in full uniform survey a sample of students in person.
b. Annette Smith, a girl at Steffen Middle School, wants to find out if any of her classmates like Bob Bellrichard. In conversation with all the girls in her class, she says, "Isn't Bob Bellrichard a creep? What do you think about him?"
c. "How much money do you earn?"
d. Nancy French had each member of her English class fill out an unsigned sample survey that posed the following question, "Do you drink alcohol?" She had their responses put in a large collection box.
•· Sam Sinclair wants to find out how people feel about political demonstrations. Select the best question or write your own. Defend your choice.
a. Should political demonstrations be allowed?
b. Should all political demonstrations be outlawed?
c. Should people who participate in political demonstrations be prosecuted?
d. Should all citizens have the freedom to express their political views through public demonstrations?
ASKING QUESTIONS 3I

LESSON 4: ASKING QUESTIONS
7. Answers will vary.
8. Answers will vary. Survey results are often reported in newspapers or special-interest magazines.
Notice how the responses are obtained. Some are simply voluntary responses from those who choose to write or call. This type of bias is addressed in Lesson 5.
3Z LESSON 4
STUDENT PAGE 24
7. Write two sample survey questions tbat contain bias. Share your questions with another group. Have the members of tbat group rewrite them to minimize bias.
8. Find an article in a magazine tbat contains tbe actual questions in a survey. Many teen magazines such as Seventeen include sucb articles. Other magazines, such as Time or Newsweek, often contain polls. Decide if the questions are biased.

LESSON 5
Selecting a Sa1nple Materials: random-number tables or Activity Sheet 2, or
ten-sided dice
Technology: graphing calculators (optional)
Pacing: 1 class period or less
Overview
To obtain representative information, the subject must be selected on a random basis. Students are familiar with using dice, spinning a spinner, or selecting numbers from a hat. They may not be familiar with using a random-number table or a random-number generator on a calculator. This lesson first shows how and why a random-number table is used. It then asks students to determine if samples taken in different situations are randomly selected.
Teaching Notes
This lesson will engender discussion about randomness. Students often believe they can be fair in their selections without using random means. They also believe "random" means by accident or without any plan. The next lesson goes into more detail about randomness.
The lengths to which pollsters such as Gallup go to make sure randomness is achieved is very interesting. You may want to have students research these methods. There is some information about this in Lesson 7. Often, there are research agencies that have offices in shopping malls. These agencies have speakers who are available to come into the classroom and speak with students.
Technology
Graphing calculators (optional) can be used to generate random numbers. On the TI-83 calculator, MATWPRB/rand will give a decimal between 0 and 1. The sequence int (10 x rand) + 1 will give a random number between 1and10. For more information, see the calculator manual.
SELECTING A SAMPLE 33

LESSON 5: SELECTING A SAMPLE
Solution Key
Discussion and Practice
1. Yes. The sample asked was not representative of the total population of the school.
2. No. The survey represented only one portion of the student body.
~. a. He is not likely to catch any big fish or those who live in very deep water. As a result, the sample is not representative of the target population.
34 LESSON 5
STUDENT PAGE 25
LESSON 5
Selecting a Sample
Can just anyone be asked to participate in a survey?
How should you choose people to participate?
C hoosing a sample that does not represent the target population is sampling bias. Randomization is a statistical
method that is used to minimize sampling bias .
INVESTIGATE
Sampling Blas
When a survey reflects sampling bias, its results cannot be considered valid . So it is very important to ensure against this type of bias when constructing and conducting a survey.
Diseussion and Praetiee
Cheerleaders of one school wanted to recognize the most popular activity in the school. They decided to interview the first 25 students they met. Their survey results indicated that band was the most popular activity. The only problem was that band practice had just ended, and the 25 people they asked were all members of the band.
1. Were the methods used in this survey likely to produce a sample that was representative of all the students in the school? Why or why not?
z. Did the methods reflect sampling bias?
~. Describe the sampling bias in these examples:
a. Frankie Rivera wants ro find out what type of fish are in Lake Michigan. His method of data collection is standing on the shoreline and scooping up the fish in a net.
Apply randomization in sample selection.
Recognize and analyze sampling bias.

LESSON S: SELECTING A SAMPLE
b. If the World Series is on television, the fans are more than likely at home watching the game. As a result, the sample is not representative of the target population.
STUDENT PAGE 26
b. Alicia Ball wants to find out what percentage of people are baseball fans. Her method of data collection is to
. survey people in a shopping mall during a World Series game.
There are many ways to reduce sampling bias. If you want a sample from a particular grade level, you might go to the classroom of a specific grade and ask every third person who enters. If the classes are arranged randomly by a central computer, you might be able to use an entire class as a sample of the population.
Randomization allows all elements in the population to have an equal chance of being selected. In other words, with randomization you are able to obtain a sample that is representative of the target population and to reduce sampling bias.
One of the best ways to minimize sampling bias is to use a random-number table as part of the process of selecting a sample. The numbers in the random-number cable below have been randomly generated by a computer. Random-number tables are easy to use. A much larger Table of Random Numbers is shown at the end of this lesson on page 29.
39634 62349 73088 65564 16379 19713 39153 69459 17986 24537
14595 15050 40469 27478 44526 67331 93365 54526 22356 93208
30734 71571 83722 79712 25775 65178 07763 82928 31131 30196
64628 89126 91254 24090 25752 03091 39411 73146 06089 15630
42831 95113 43511 42082 15140 34733 68076 18292 69486 80468
80583 70361 41047 26792 78466 03395 17635 09697 82447 31405
00209 90404 99457 72570 42194 49043 24330 14939 09865 45906
How co use random numbers:
1. Drop your pencil randomly on page 29 and begin reading at the number closest to the point of the pencil.
II. Choose a direction and read the numbers in that direction. The numbers can be read up or down, or to the right or left.
lll. If you want one-digit numbers from 0 to 9, use each single digit in the order that you choose.
IV. If you want two-digit numbers, group the numbers in pairs and read in whatever order you choose.
SELECTING A SAMPLE ~S

LESSON 5: SELECTING A SAMPLE
Practice and Applications
4. Students 30 and 4
s. a. You might go diagonally or select the first number in each group of five.
b. Any time you need a truly random sample in a situation, a random number table is helpful. One specific example might be in the selection of students to take a standardized test such as the NAEP test. Only a certain number of students is required, and the makers of the test want a truly random sample.
c. You could use the lottery method of putting balls in a bag and select from the bag . You could toss a die or spin a spinner. Students may come up with other methods.
6. a. Answers will vary. Be sure to look for randomness in the method of selection and for correct grammar and spelling.
b. There will certainly be some overlapping numbers, but you might point out that the likelihood all six numbers will be the same is very small .
36 LESSON 5
STUDENT PAGE 27
Suppose you want to give prizes to the 30 students in your class in random order. Assign each student a two-digit number. Then use the random-number table to select the number of the student who will receive a particular prize. Student number 1 will be 01, student number 2 will be 02, and so on, for each of the 30 students in your class.
You might have started with the numbers below for your class of 30 students.
73088 65564 16379
40469 27478 44526
You can read these data horizontally as 73, 08, 86, 55, 64, 16, 37, 94, 04, and so on. Since there is no student 73, disregard that number. Student number 8 is then selected. Disregard 86, 55, and 64. Student 16 is the next person to be selected. Continue selecting in this manner. You can also generate random numbers using a calculator.
Practice and Applications
4, You might have read the table by reading the numbers in the small sample above vertically: 74, 30, 04, 86, 89, 62, 57, and so on. Which student(s) would receive a prize from this set?
s. a. Besides reading left and right, or up and down, what other patterns can you use to generate numbers from the random-number table?
'b. In what ways might a random-number table be useful?
.,, What other methods could be used to choose a random sample?
ft. In Ohio, there are 4 7 numbers in the weekly lottery. Six numbers are selected.
a. Use a random-number table to select six numbers. Explain how you did this.
b. How likely do you think it will be to have an overlap (the same number repeated within a set of six)? How large was the overlap? Compare your six numbers to numbers someone else generated.
Determine whether or not the samples in Problems 7-12 are randomly generated. If not randomly generated, explain why not.

LESSON 5: SELECTING A SAMPLE
7. This is not a random sample. All the students in calculus class will probably go to college.
8. This is not a random sample. All of the answers will be "yes" because they are going through the line to get food prepared by the cafeteria staff.
9. This will not reach people who never go to the mall, such as housebound individuals, some elderly people, or people who do not like to shop.
10. This is not a random selection. The students most likely to be picked are in the middle of the grade book.
11. This is probably okay if the mall draws from the entire community.
1.2. A certain type of tree may be diseased and, therefore, an entire block may be affected. Conversely, an entire block of diseased trees may be missed. This could adversely affect the outcome of the sample survey.
1~. Answers will vary. The topic should be modified to suit individual classes.
STUDENT PAGE 28
7. Nick Lilja wants to sample a portion of the senior class to find out how many will attend college next year. He asks calculus students.
s. Lakisha wants to do a survey to find out how many students eat the food prepared by the cafeteria staff. She stands at the end of the serving line and conducts her survey.
9. Marie is collecting data to find out how many people in her community recycle. She stands outside the main entrance of a town mall and asks every fifth person three questions.
10. Ms. Madonio teaches fourth grade at Oriole Lane. She needs three volunteers to help the principal, Ms. Matuk, deliver mail. Almost all of the students eagerly want to help Ms. Matuk. To select her three volunteers, Ms. Madonio pulls out her class list and without looking points to three student names.
11. Chris is designing a project to estimate the percentage of American-made vehicles in her community. She decides to count the cars at the local shopping mall on Friday evening and observe how many of them are American-made.
1:11. A city government needs to estimate the number of diseased trees in the city. A city crew drives down two city streets that intersect. They count diseased trees in each block. The average number of diseased trees per block can then be multiplied by the total number of blocks in the city to produce the final estimate.
13. Extend You wish to find out if permitting students to wear shorts should be part of your school's dress code. Have each group member explain how the collection of the data to answer this question could be randomized. Share your datacollection methods with another group.
I
SELECTING A SAMPLE 37

LESSON 5: SELECTING A SAMPLE
38 LESSON 5
STUDENT PAGE 29
Table of Random Numbers
59718 77768 50032 53440 41359 33021 01938 86092 87426 80010 91977 35682 34043 26290 40447 12411 32837 12151 21227 81491 88224 92826 92683 66928 95518 70106 92397 62132 97206 26324 01288 56565 78378 72344 12566 58325 40257 93212 49208 51320 19483 45024 12857 46267 94007 98674 54199 29738 24084 91964
33652 12588 55326 05702 43815 61284 13606 65461 70415 91440 32207 57357 18841 61415 57755 46846 41422 35285 37870 55929 99945 87321 41676 70537 39341 45154 93823 14053 81888 11464 29773 64388 95180 80750 12815 77661 89578 42194 99329 21247 92329 55414 05162 94197 19267 68846 27895 12005 80292 49745
75834 71767 45378 40316 61259 13140 66115 61564 76757 62599 22755 89933 41019 18996 13005 31853 72795 22193 59897 62049 09056 73260 95209 33157 15608 37565 93590 85486 80932 76059 66250 96883 74585 74550 89984 28356 77938 69704 19034 19744 37052 83115 38995 52825 93308 75276 21274 48777 75400 62004
81653 74197 85789 50614 52742 48213 94759 80701 08234 44686 41417 37426 42282 34323 83341 38345 83018 25015 68282 94820 27862 25188 15227 90981 06296 86815 04322 44750 01554 91302 85083 13673 29208 17587 12217 24032 52318 83860 81936 29114 05649 48381 63320 11822 11590 75112 54027 56579 81397 14691
91654 28637 01627 24482 33119 29924 69390 85040 66927 63521 43540 82299 18928 35588 55113 78385 61536 49596 05202 40993 33276 99974 62800 97999 56683 61505 85617 32656 16834 88980 18139 96384 07488 32049 53532 12159 75508 10924 25298 96474 07403 42795 55422 49346 44612 61632 81241 04660 95163 16285
05374 34289 66087 74636 64247 73598 42730 79472 79834 72702 bjlLl 17926 84377 16927 91950 26475 10086 61879 03475 64750 66148 59081 34743 69023 50306 63739 14717 32374 19119 96284 92153 23320 34180 78025 42391 35908 73996 49173 47360 92856 06629 93991 80847 49133 45105 34818 10122 31369 33312 94856
74784 07080 13104 64110 98440 56468 88959 67988 58764 70414 59043 74797 24791 65130 97918 99820 32673 44512 36847 14028 58572 79127 74870 47218 03752 92434 71791 28040 60536 37429 75069 76687 43795 50161 20794 95015 42376 33178 10265 03394 72258 09820 54814 84454 32761 59316 14974 80017 37524 25760
16186 64983 27652 53966 75826 16790 13767 52267 65505 56954 54047 17961 92967 27968 12463 85270 13763 96297 43279 93087 42301 36874 19357 14982 22806 69213 79929 48973 21969 28172 87940 43389 26009 52702 03148 70789 88539 19084 59200 88168 91551 24267 81423 17461 09300 11928 98793 97748 95430 11644
03166 69589 65596 56997 70092 63418 92825 91586 76847 51167 64280 45356 96248 79274 15733 72317 44107 80124 99627 44523 28464 37825 88800 20180 28989 75914 46882 28736 60408 63180 36861 76806 80789 30886 71013 56044 52405 81063 04283 41256 43125 34876 18177 22382 37920 77067 93319 29881 37050 32533
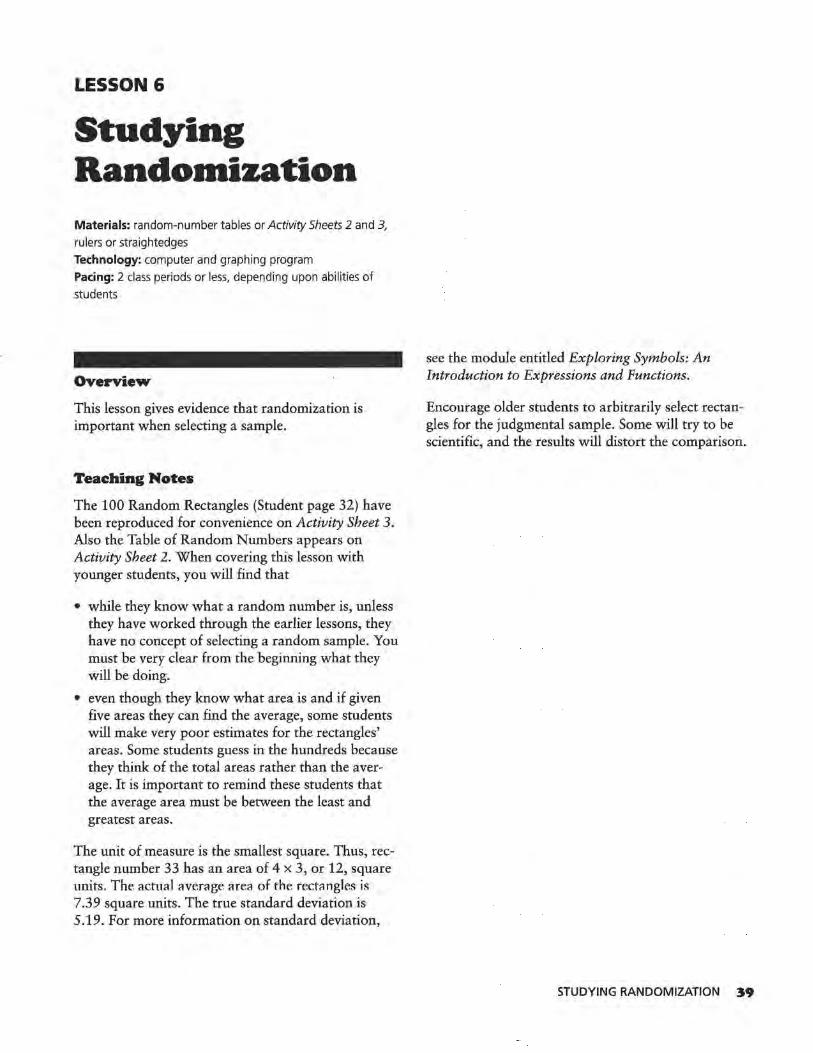
LESSON 6
Studying Rando1nization Materials: random-number tables or Activity Sheets 2 and 3,
rulers or straightedges Technology: computer and graphing program Pacing: 2 class periods or less, depending upon abilities of
students
Overview
This lesson gives evidence that randomization is important when selecting a sample.
Teaching Notes
The 100 Random Rectangles (Student page 32) have been reproduced for convenience on Activity Sheet 3. Also the Table of Random Numbers appears on Activity Sheet 2. When covering this lesson with younger students, you will find that
• while they know what a random number is, unless they have worked through the earlier lessons, they have no concept of selecting a random sample. You must be very clear from the beginning what they will be doing.
• even though they know what area is and if given five areas they can find the average, some students will make very poor estimates for the rectangles' areas. Some students guess in the hundreds because they think of the total areas rather than the average. It is important to remind these students that the average area must be between the least and greatest areas.
The unit of measure is the smallest square. Thus, rectangle number 33 has an area of 4 x 3, or 12, square units. The actual averaBe area of the rectangles is 7.39 square units. The true standard deviation is 5.19. For more information on standard deviation,
see the module entitled Exploring Symbols: An Introduction to Expressions and Functions;
Encourage older students to arbitrarily select rectangles for the judgmental sample. Some will try to be scientific, and the results will distort the comparison.
STUDYING RANDOMIZATION 39

LESSON 6: STUDYING RANDOMIZATION
Solution Key
Discussion and Practice
1. The following is a set of data col-· lected from the eighth graders at Brown Middle School in Ravenna, Ohi,o.
a. Guess: 12, 9, 13, 12, 9, 10, 7, 12, 13, 11, 11, 10, 22, 7, 7, 12, 7, 7, 16, 18, 15, 9, 8, 14, 18, 17
Mean= 11.8
b. Judgmental Sample: 9, 11 .2, 10.6, 8.7, 10.2, 9.5, 9.8, 12.2, 6.7, 8.5, 10, 8.6, 11, 9, 3.3, 10, 9.3, 9, 12, 17.4, 15.8, 8.5, 9.3, 13.6, 17.4, 7.3
Mean= 10.3
40 LESSON 6
STUDENT PAGE 30
LESSON 6
Studying Randomization
Why do newspapers and magazines often emphasize that samples used in polls (sample surveys) have been randomly selected?
Could an intelligent person do better than a random sample by carefully choosing respondents to represent various groups?
Recognize that randomization reduces
sampling bias .
INVESTIGATE
The Importance of Randomization
The following activity deals with the average area of 100 rectangles. This lesson will emphasize why randomization is important in a sample selection.
Discussion and Practice
Suppose you want to estimate the average area of 100 rectangles. How can you do this without calculating the area of each rectangle?
1. Estimate the average area for all the rectangles pictured on page 32. Use each of the methods listed below. Note that rectangle 45 has area of 2 x 5 = 10 square units.
a. Guess Write your guess for the average area of the rectangles on the sheet.
b. Judgmental Sample Select five rectangles you think are representative of the rectangles on the page. Write the rectangle numbers and their areas. Compute the average of the five areas and compare it to the average you guessed.

LESSON 6: STUDYING RANDOMIZATION
c. Random Sample: 8.2, 4.5, 11.1, 5, 9.3, 9.5, 7.8, 9.5, 8, 5.3, 6.2, 9.2, 8.2, 7.7, 8.5, 7.5, 8.7, 6.7, 9, 4, 7.3, 6.7, 2, 5.5, 9, 2.8
Mean= 7.2
Practice and Applications
:z. Line Plots of Three Sample Methods
x Guess Mean (11 .8) x x x x x x x x x x x x xxxxxx x x x x x x x
3 5 7 9 11 13 15 17 19 21 23
Judgmental Sample xx Mean (10.3) xx x
xxxxxx x x xx x x x x x x x
3 5 7 9 11 13 15 17 19 21 23
x Random Sample xx x Mean (7 .2)
x xx x xxxxx x x xxxxxxxxx x
3 5 7 9 11 13 1 5 17 19 21 23
3. You will want students to note that while there is variability in all three samples, it certainly lessens in the random sample compared to the other two samples. It is also important to note that the mean of the random sample will probably be much closer to the actual population (the mean of all of the rectan" gles on the page).
4. a. It is good here to have students explain how they got their guesses and their judgmental samples. Some take the smallest and the largest and find the average of those. There are a variety of other techniques students use in making their guesses and picking the rectangles for their samples.
b. Just as in part a above, visual selection involves the bias of the selector.
c. The answers students give should be very different from those
STUDENT PAGE 31
'" Random Sample Use the random-number table (reproduced on Activity Sheet 2) to select five different twodigit numbers. These random numbers will represent 5 of the 100 rectangles. Use 00 to represent rectangle 100. Write the rectangle numbers and their areas. Compute the average of the five areas and compare it to your guess and judgmental-sample average.
Practice and Applications
a. Collect the data from all students for each of the three methods so you will have one set of data that includes the guesses, one set that includes the averages from the judgmental samples, and one set that includes the averages from the random samples. Then construct line plots of the data from each method using the answers from everyone in class.
:1. Compare the three line plots. Describe any similarities and differences in the patterns.
4, Get the actual mean value for the areas of rectangles from your teacher.
a. Describe any sampling bias in the three methods.
b. Explain why visual selection is not random.
c. Suppose someone tells you that it is not necessary to select the respondents to a survey randomly because personal judgment is just as good. What would you tell this person?
5, How would the pattern of the line plots change if you selected random samples of n = 10 and n = 15 rectangles instead of n = 5?
f>. Describe another method you could use to produce a random sample for the average area of the rectangles.
they would have given before encountering this lesson.
s. The larger the sample, the closer the average would be to the actual mean.
6. The student could put tickets numbered 1 to 100 in a bag and select one ticket at a time until five are selected. The ticket would need to be replaced each time so you were always selecting from 100 rectangles. Or a spinner with the num-
bers 1 to 100 could be used. The students may have other ways to achieve randomization.
STUDYING RANDOMIZATION 41

LESSON 6: STUDYING RANDOMIZATION
4Z LESSON 6
STUDENT PAGE 32
~99o 9 El El±§ 9 EE 9o R+i \;i ~ D ' ; Fl I 11 11 11 r::l+:1 " 16 ttij 11 12 13 LJjj
EE EHE ~ " E§ " " s"111l11~Eijl3,, ~ [tj'" 11U11 ,, ~ 29
30 D=rJ E8 D ~ E3 EHE I I I I I I I
. 28 ITIJ 44 ta B EHE 39
ffi I I I I I I I I I 42 43
45 46
47 E§ ~ o EE! 41
I I I I I I I I I I I §E§ I I I I I 48 ta 50
'" E!3 UJJE qi §E§ ~ LQ±fo 11'i 111 ~ EEEB ~ fill ~1 11 i} I I ~ [fl
~ 1 rn §E§ 61
Fl I 11 I 1163 ta 66
EE Em§ B rn §E§ B 72 74 E§ EE 76 77
§l,~"~·,;$11 E "cp ~Eijl3 "' " ~ "' " "' " 1001 I I I M E§ I I 1921 I ~ 1111 111 E§ Em§ 97 EE8 §E§ E§
94 95 96 98 99 100

LESSON 7
Sa1npling in the Real World Materials: none
Technology: none
Pacing: 1 class period
Overview
This lesson should help students understand the descriptions of surveys they encounter in magazines and newspapers and on television.
Teaching Notes
Students should be encouraged to read critically. Gallup and A.C. Nielsen Co. are examples of professional polling organizations. A.C. Nielsen does most of the polling for television ratings. Businesses often coriduct polls or hire professional organizations to do so.
Some things to consider before assigning the problems in this lesson are:
• Younger students may need help analyzing the articles.
• The introductory article, the article about the Gallup polls, and the article about Nielsen ratings deal with national surveys. You may want to discuss how the articles compare before students read the selection.
• To facilitate students' analyzing of the articles, have them work in small groups to compare and contrast their findings.
This lesson can be done by having students describe the articles, then follow with a discussion. This would probably take one class period. It could be done in much more depth by using small groups, describing the surveys, and having students write their results to the Practice questions.
SAMPLING IN THE REAL WORLD 43

LESSON 7: SAMPLING IN THE REAL WORLD
44 LESSON 7
STUDENT PAGE 33
LESSON 7
Sampling in the Real World
What should you look for when reading about a survey?
Do all surveys really have the results they claim?
Read the following article about what Americans believe.
Faith in God at Heavenly Heights
By Leslie Miller, USA Today
When it comes to religion, the USA is a land of believers Not only do 96% believe in God, but a new USA Today/CNN/Gallup Poll shows most Americans also believe in:
Heaven, 90%.
Miracles. 79%.
Angels. 72%.
Belief in heaven is up 6% from 1981 ; angels and miracles were asked about just
this year. Do findings reflect wishful thinking? Not necessarily Belief in hell and the devil also were up from past years Results don't surprise religion researchers_ "Americans have a tendency to take their religion straight, like their whiskey. That means don't water it down with an awful lot of intellectualism," says Conrad Cherry, Center for the Study of Religion and American Culture at Indiana University and Purdue University, Indianapolis, The poll of 1,016 adults also shows more believe in:
Reincarnation, 27% (up from 21% in 1990)
Contact with the dead, 28% (18% in 1990)
This seems consistent with other surveys, says Jeffrey S Levin, Eastern Virginia Medical School, Norfolk. He's found "mystical" beliefs appear "more common with each successive generation," But increases don't necessarily mean people didn't believe before, Levin says , "Over the last decade or two, there's
Understand how surveys are conducted in the
real world.
Find similarities and differences among real-world surveys.
Use proportions and percents to make
comparisons.

LESSON 7: SAMPLING IN THE REAL WORLD
Solution Key
Discussion and Practice
1. Gallup polled 1,016 adults in 1994.
z. The exact questions are not given in the article, but the responses indicate that they asked if Americans believed in heaven, miracles, angels, hell, the devil, reincarnation, and contact with the dead.
~- Since this is a poll about what Americans believe, most people would be interested. Most would compare their own beliefs with those stated in the poll.
Sample answers are given.
a.
Advantages of Telephone Surveys
Easy to randomize
Cost-effective
Quicker
Very standardized
Advantages of Personal Interviews
May be more accurate
People not at home
Disadvantages of Telephone Surveys
Not everyone has a phone
No personal contact
Often annoying to people
Disadvantages of Personal Interviews
Higher cost
b. Mailing questionnaires might be another method.
STUDENT PAGE 34
less of a social stigma to talking about one's faith," he says, including religious experiences. "Mystical things are more openly acknowledged ,"
Source: USA Today, December 21, 1994
INVESTIGATE
Analyzing Results
When reading an article like the one above, you need to consider a number of things in order to evaluate the validity of the results.
Discussion and Practice
1. How did the authors get their information?
:11. What questions did they ask?
3. Who cares about the results?
4. Polling organizations conduct most national surveys either by telephone interviews or by personal interviews.
a. Brainstorm ideas concerning the advantages and disadvantages of each method.
b. Can you think of another method they might use?
Large survey organizations print explanations of their polling methods. The task of polling is not an easy one. A great deal of planning, organizing, and time is spent on conducting a survey. One good example is the compilation of information for the Nielsen ratings of television programs.
Almost everyone watches television and, as a result, has some awareness of the fact that the Nielsen ratings help determine what is broadcast. A show that does poorly in the Nielsens is not going to be on a major network very long. The article "NBC sitcoms still dominate Thursday night" reprinted in part below shows the Nielsen ratings for a week in March 1995. Read the explanation in this article before reading the discussion that follows.
NBC Sitcoms Still Dominate Thursday Night
The Peacock can strut again . For the fifth consecutive week, NBC won the prime time ratings crown behind top-rated Seinfeld and Top 10 performances from four other shows in its Thursday lineup.
For the week, NBC averaged an 11 .5 rating and a 19 percent audience share ABC, the season-to-date frontrunner. finished second with an 11 . 1 rating, 19 share. CBS was third, with a 9.2 rating, 16 share.
SAMPLING IN THE REAL WORLD 4S

LESSON 7: SAMPLING IN THE REAL WORLD
STUDENT PAGE 35
46 LESSON 7
Top 20 listings include the week's ranking, with rating for the week, season-todate rankings in parentheses, and total homes, An "x" in parentheses denotes one-time-only presentation, A rating measures the percentage of the nation's 95.4 million 1V homes. Each rating point represents 954,000 households, as estimated by Nielsen Media Research
1. (1) Seinfeld NBC, 21 4, 20 4 million homes
2. (2) Home Improvement ABC, 20.5, 19 6 million homes
].. (3) ER NBC, 19 8, 18 9 million homes
4. (11) Friends NBC, 19.8, 18 ,9 million homes
5. (4) Grace Under Fire ABC, 19.6, 18.7 million homes
Source: Gainesville Sun, March 26, 1995
Of the 95.4 million households in the United States, Nielsen Media Research randomly samples approximately 4,000 households on which to base ratings. This is accomplished by randomly selecting city blocks (or equivalent units in rural areas), having an enumerator (person who counts) visit the sampled blocks to list the housing units, and then randomly selecting one housing unit per block. These sampled housing units are the basic unit for all of the ratings data.
After a housing unit is selected, an electronic device is attached to each television set in the house. This device records when the set is turned on and the network it is tuned to. Information from the network determines which show is actually playing at any time.
This device gives information on what is happening on the television set, but it doesn't tell which or how many people are viewing the programs. For viewer information, Nielsen must rely on individuals in the household to keep a record of these details.
The rating for a program is the percentage of the sampled households that have television sets on and tuned to that program. In the estimated ratings, the denominator of the sample proportion is always 4,000. So a rating is an estimate of the percentage of households tuned to a particular program.
But not all households have a television turned on at a particular time. Those that do are called viewing households. A share for a program is an estimate of the percentage of viewing households that have a television tuned to that particular program. When shares are calculated, the denominator varies from show to show and is less than 4,000.

LESSON 7: SAMPLING IN THE REAL WORLD
s. In the shares, only "viewing households" are counted. This means the denominator will differ from show to show and will be less than or equal to the total number of possible viewers. In the rating, the denominator is always the total number of possible viewers. The share will, therefore, be higher.
•· Individuals in households may be lax about keeping records on who is viewing. People may turn on the television and leave the room, then report what they would have watched but really did not. However, generally it seems to be an effective method.
Practice and Applications
7. Possible responses if referring to the Gallop Poll articles:
a. Gallup Poll
b. The United States is divided into eight geographical regions. These are divided into zones, and the zones are divided into localities. A few localities are randomly sampled from each zone. Clusters of blocks are sampled from each urban locality. Segments of the same size are sampled from urban areas. A randomly selected starting point is set. A travel path is mapped out. Interviewers continue on path until a set number of interviews with male and female respondents has been completed.
c. There is a minimum of 1,000 to 1,500 respondents.
d. A plus or minus 4% tolerance is standard.
e. Allowance is made for persons not at home by a "times-at-home" weighting procedure rather than a return visit. This reduces sample bias that would result from under
STUDENT PAGE 36
In reality, the ratings and shares are slightly more complicated. A rating for any program is taken minute by minute and then averaged over the length of the program. This average attempts to adjust for the fact that not all viewers watch all of a program. Thus, the final rating for 60 Minutes would be the average of all ratings taken over the hour duration of the show. The final rating for a basketball game would be the average ratings taken over the entire time-perhaps several hours-the game was on the air.
Review the Nielsen article once again. Discuss any points that are misleading or unclear, specifically the following:
5, Why are the shares always greater than the ratings?
r.. Are there sources of potential bias in the data collection plan?
Practice and Applications
Two articles that tell about the processes used by local and national surveys are on pages 37-39.
7. To understand and appreciate the survey process better, your group will be responsible for reading one of the following articles, answering the questions, and reporting to the class. The report should include answers to the following:
a. Which poll did your group investigate?
b. How was the poll or survey conducted?
c:. What sample size did the poll use?
d. What sampling error did your poll report? Sampling error means the amount by which the survey may differ from the actual population.
e. When a person being surveyed did not respond, what happened?
f, Assuming that 250 million adults live in the United States, what is the probability that a person would have been interviewed in the poll?
g. Select someone from your group to report your findings.
8. After listening to the reports, answer each question.
a. How are the surveys alike?
b. How are the surveys different?
representation of persons who are seldom at home.
f. 250~~~~~000 = 0.000006 is the
probability an adult would be surveyed.
g. A student will report on this survey.
Possible responses if referring to TAPS:
a. The Teenage Attitudes and Practices Survey (TAPS)
b. The survey contacted a random selection of households from across the country and interviewed all teenagers between 12 and 18 years of age living in those households. The design for selecting the households was more complex than a simple random sampling, in order to guarantee that all areas of the country were covered.
c. The survey reached 9, 135 teenagers through telephone interviews and another 830 through mailed questionnaires.
SAMPLING IN THE REAL WORLD · 47

LESSON 7: SAMPLING IN THE REAL WORLD /
(7) d. The sampling error is not reported, since the exact calculation methods are complex. It does say that the sampling errors would be greater than those for simple random sampling-approximately
1 .,Jg 965 = 0.01 .
e. There was a low nonresponse from the telephone survey. There is no mention of follow-up to the nonresponse from the mail survey.
r. To answer this question, you need to know the number of teenagers in the U.S. That number was about 23.5 million in 1989. Thus, a rough approximation of the chance that any one teenager would have been interviewed is
1 23 500 000 = 0.00000004.
g. A student will report on this survey.
8. Possible answers are given.
• The scope of the survey can be international, national, or local.
• The sample size of the survey can be large or small.
• The way the survey is randomized in different ways.
• The survey can be a census or a sample survey.
• The survey can be conducted by telephone, in person, or by mail.
48 LESSON 7
STUDENT PAGE 37
Articles About Gallup Poll Surveys
The Sample
Although most Gallup Poll findings are based on telephone interviews, a significant proportion is based on interviews conducted in person in the home. The majority of the findings reported in Gallup Poll surveys is based on samples consisting of a minimum of 1,000 interviews The total number. however, may exceed 1,000, or even 1,500 interviews, where the survey specifications call for reporting the responses of low-incidence population groups such as young public-school parents or Hispanics.
Design of the Sample for Telephone Surveys
The findings from the telephone surveys are based on Gallup's standard national telephone samples, consisting of unclustered directory·assisted. random·digit telephone samples, The random·digit aspect of the sample is used to avoid "list· ing" bias Numerous studies have shown that households with unlisted tele· phone numbers are different from listed households. "Unlistedness" is due to household mobility or to customer requests to prevent publication of the tele· phone number. To avoid this source of bias, a random-digit procedure designed to provide representation of both listed and unlisted (including not-yet-listed) numbers is used
Telephone numbers for continental United States are organized into four regions of the country, and, within each region, further arranged into three strata based on the size of the community. The sample of teleph9ne numbers produced by the described method is representative of all telephone households within the continental United States ,
Within each contacted household, an interview is sought with the youngest man 18 years of age or older who is at home. It no man is home, an interview is sought with the oldest woman at home. This method of respondent selection within households produces an age distribution by sex that closely approximates the age distribution by sex of the total population
Up to three calls are made to each selected telephone number to complete an interview The time of day and the day of the week for callbacks are varied to maximize the chances of finding a respondent at home. All interviews are conducted on weekends or weekday evenings in order to contact potential respondents among the working population
Design of the Sample for Personal Surveys
The design of a sample for personal (face-to-face) surveys is that of a probability sample down to the block level in the case of urban areas and to segments of townships in the case of rural areas.
After stratifying the nation geographically and by size of community according to information derived from the most recent census, over 350 different sampling locations are selected on a mathematically random basis from within cities, towns, and counties that, in turn, have been selected on a mathematically random basis

LESSON 7: SAMPLING IN THE REAL WORLD
STUDENT PAGE 38
The interviewers are given no leeway in selecting the areas in which they are to conduct their interviews. Each interviewer is given a map on which a specific starting point is marked and is instructed to contact households according to a predetermined travel pattern. At each occupied dwelling unit, the interviewer selects respondents by following a systematic procedure that is repeated until the assigned number of interviews has been completed
Sampling Tolerances
Readers are cautioned that all sample surveys are subject to the potential effects of sampling error, a divergence between the survey results based on a selected sample and the results that would be obtained by interviewing the entire population in the same way. The risk of this kind of divergence is necessary if probability sampling is used, and probability sampling is the basis for confidence in the representativeness of sample survey results
The chance that sampling error will affect a percentage based on survey results is mainly dependent upon the number of interviews on which the percentage is based. lri 95 out of 100 cases, results based on national samples of 1,000 interviews can be expected to vary by no more than 4 percentage points (plus or minus the figure obtained) from the results that would be obtained if all qualified adults were interviewed in the same way. For results based on smaller national samples or on sub-samples (such as men or persons over the age of fifty), the chance of sampling error is greater and therefore larger margins of sampling error are necessary in order to be equally confident of our survey conclusions~
In addition to sampling error, readers should bear in mind that question wording, and practical difficulties encountered in conducting surveys, can introduce additional systematic error or "bias" into the results of opinion polls . Unlike sampling error, it is not possible to estimate the risk of this kind of error in a direct way, but survey organizations can protect against the effects of bias on survey conclusions by focusing careful attention on sampling, questionnaire construction, and data collection procedures and by allowing adequate time for the completion of data collection
Sou~ce: The Gallup Poll Monthly, Odober 1 993
The Teenage Attitudes and Practices Survey (TAPS)
The TAPS was a targeted population study of U.S. teenagers 12-18 years of age. The study was conducted by the National Center for Health Statistics' National Health Interview Survey (NHIS) and cosponsored by the Centers for Disease Control Office on Smoking and Health (OSH) and the National Cancer Institute (NCI).
The TAPS was designed to obtain national household data about current cigarette-smoking behavior and lifetime smoking practices of adolescents and their beliefs about smoking Selected correlates of smoking uptake were also addressed in the study.
The TAPS sample was derived from NHIS's household interviews conducted during the final two quarters of 1988 and the first two quarters of 1989 All
SAMPLING IN THE REAL WORLD 49

LESSON 7: SAMPLING IN THE REAL WORLD
STUDENT PAGE 39
SO LESSON 7
teenagers living in households contacted and interviewed during this period who were 12-18 years of age as of November 1, 1989, were included in the sample.
The eligible sample for the TAPS was 12,097 persons,
The TAPS utilized two modes of data collection, The primary method consisted of computer-assisted telephone interviewing (CATI) in households where a tele
phone number was provided during the original NHIS interview. In addition, self
administered questionnaires were mailed to sample teenagers living in households without telephones or an available telephone number. Mail questionnaires were also sent to those teenagers living in households with an original telephone number but who were never reached using the CATI method. Telephone interviews and all other data collection activities were performed by U.S. Bureau of the Census personnel , Data collection began in August 1989 and, except for late receipt of some mail questionnaires, concluded in December 1989.
Unlike the original NHIS interview, all teenagers responded for themselves However, prior to the initial telephone contact, advance letters were mailed to a responsible related adult and to each eligible teenager in the household explaining the sponsorship and objectives of the upcoming survey and assuring confidentiality.
The total interviewed TAPS sample included 9,965 adolescents, 9, 135 from CATI interviews and the remaining 830 cases from completed mail questionnaires The total combined response rate for the TAPS from these 2 data-collection proce" dures was 82 percent Most of the nonresponse resulted from teenagers' failure to return the mail questionnaire Only 3.7 percent of interviews of adolescents reached by telephone ended in a refusal either because of the parent's or teenager's initial refusal and subsequent termination of the interview Item nonresponse was less than 1 percent for the questions discussed in this report.
Because estimates shown in this report are based on a sample of the population rather than on the entire population, they are subject to sampling error. When an estimate of the numerator or denominator of a percent is small, the sampling error may be relatively high. In addition, the complex sample design of the NHIS has the effect of making the sampling errors larger than they would be had a simple random sample of equal size been used.
Source: U S Department of Health and Human Services Center for Disease Control
and Prevention, 1993

LESSON 8
Critiquing a Printed Article Materials: none
Technology: none
Pacing: 1 class period
Overview
This lesson will lead students to critically analyze an article that contains survey material. Students should read the report of any survey in light of questions such as these: Who gave the survey? What questions were asked? How was the survey administered? When was the survey given? What were the results?
Teaching Notes
Students often believe that if something is in print, it is true. Students need to read critically. This lesson gives students some guidelines to use to look at an article and read it carefully. The sample article includes text and a graph to illustrate the results. It may be helpful to group the students to answer the questions, and then discuss the answers as a class. Check recent newspapers for polls or surveys to share with the class. Discussion might focus on issues such as why the survey is useful, whether the headline matches the results, or if a graph would enhance the article.
CRITIQUING A PRINTED ARTICLE SI

LESSON 8: CRITIQUING A PRINTED ARTICLE
S2 LESSON 8
STUDENT PAGE 40
LESSON 8
Critiquing a Printed Article
What should you think about as you read the results of surveys described in a newspaper or magazine?
Is there any specific information you should look for?
1 :
Critically analyze surveys reported in the real
world .
Use proportions and percents to make
comparisons.
Read a graph.
I n previous lessons, your group compared two surveys that were done at the national level. You looked at how the sur
vey was designed and conducted, who was polled, and the sample size. Now you will have the opportunity to critique, or analyze, an article reprinted from a newspaper.
INVESTIGATE
The Printed Word
The following typical election-pull article appeared in a newspaper near the end of the presidential race among George Bush, Bill Clinton, and Ross Perot. Read the article carefully, and then answer the questions that follow.
Undecided Will Sway Florida
The fate of Florida's 25 electoral votes apparently lies in the hands of the 3 percent of the voters who still don't know who they will vote for, according to results from the latest Florida Opinion Poll.
Those few voters will break the deadlock between Republican President George Bush and Democratic challenger Bill Clinton in Tuesday's presidential election, While independent candidate Ross Perot does not have a chance to captu1e the state, he apparently has a tight grip on about a fifth of the vote~ The poll showed that:
• 39 percent support or are leaning toward Bush
• 37 percent support or are leaning toward Clinton.
• 21 percent support or are leaning toward Perot.

LESSON 8: CRITIQUING A PRINTED ARTICLE
STUDENT PAGE 41
• 3 percent are undecided_
The Florida Opinion Poll, which is sponsored by the New York Times newspapers in Florida, contacted state residents in a random telephone sample. Along the political spectrum, Bush is heavily dependent on conservatives in Florida, while Clinton captures nearly half the moderate voters and nearly three quarters of the liberals Perot pulls almost identical support from liberals and conservatives, while drawing a quarter of moderates.
The poll found that among conservative voters:
• 63 percent back Bush,
• 18 percent back Clinton,
19 percent back Perot
Among moderate voters:
• 28 percent back Bush.
• 46 percent back Clinton,
• 26 percent back Perot
Among liberal voters:
• 11 percent back Bush
• 71 percent back Clinton,
• 18 percent back Perot.
While Perot pulls support from across the political spectrum, he is taking away more of Bush's Republicans than Clinton's Democrats,
Among Republicans:
• 64 percent back Bush.
• 12 percent back Clinton.
• 22 percent back Perot
• 2 percent were undecided.
But Perot takes Democratic votes from Clinton, but not as many, and there are more registered Democrats in Florida than Republicans
Among Democrats:
• 20 percent back Bush.
• 61 Percent back Clinton
• 17 percent back Perot,
• 2 percent were undecided,
Of the 6 5 million registered voters in Florida, 3,3 million, or 51 percent, are registered as Democrats, while 2,7 million voters, or 41 percent, are registered as Republicans and 550,292 or 8 percent are registered as independents or members of third parties.
CRITIQUING A PRINTED ARTICLE S3

LESSON 8: CRITIQUING A PRINTED ARTICLE
STUDENT PAGE 42
54 LESSON 8
By age, candidates seem to appeal equally across all age groups, with each drawing in the 30 percent range, except for the 45-64 year-olds.
By gender, there appears to be no major difference in the number of women or men going for one candidate more than the others.
Source: The Gainsville Sun, Oc.lober 30, 1 992
How the Polls Were Conducted
The latest Florida Opinion Poll was conducted by telephone from OcL 24 to 27
with 77 3 voters considered most likely to go to the polls on Election Day. The telephone numbers used in the survey were formed at random by a c~mputer programmed to ensure that each area of the state was represented in proportion to its population~ The results based on responses from all 773 most likely voters have a margin of sampling error of 3 5 percentage points. That means if the New York Times newspapers in Florida asked every voter in the state the same questions, in most cases, the results would be within 3 S percentage points of the results obtained by the survey. Interviewers used a series of three questions to determine voters who were most likely to go to cast their ballots Tuesday. In questions where onty the answers of smaller groups are used, the margin of sampling error is larger. For example, the margin of sampling error for just registered Democrats or only registered Republicans will be higher.
In addition to sampling error, the practical difficulties of conducting any poll can induce other forms of error.
Source: The Gainsvil/e Sun, October 30, 1992
Prul-tlal Race in Florida Too ClooetoC.11
Don't Know 3%
Source: The Florida Opinion P°'I. October 24-27, 1992
Rush 39%

LESSON 8: CRITIQUING A PRINTED ARTICLE
Solution Key
Discussion and Praetiee
1. The New York Times newspapers in Florida conducted the survey. Bias can result if the person or group conducting the poll has a political affiliation. No special interest seems to be shown here nor would the pollsters gain anything from favorable results.
z. The poll attempted to answer the question of who would win the presidential race if it were held on October 30, 1992. The specific question asked was, "If the presidential election were today, would you vote for George Bush, Bill Clinton, or Ross Perot?'' Secondary
·questions dealt with subgroups of voters, such .as conservatives versus liberals and Republicans versus Democrats. Such questions allow you to make comparisons and connectioris among subgroups of the population.
3. The population under study here was not the entire population of Florida nor even the entire population of registered voters in Florida. It was the population of voters most likely to go to the polls on election day. Whether or not a voter falls into this population was determined by a series of questions not presented in the article.
4. The article describes a sample survey.
s. The sample was chosen by randomly selecting telephone numbers from different areas of the state.
6. The sample size was 773.
7. The data were presented both by describing the results of the survey
STUDENT PAGE 43
IMscusslon and Practice
1. Who conducted the poll? Do you think they had a special interest in the outcome?
z. What main questions did the survey address?
~. What was the population?
4, Did the article describe a census or a sample survey?
5. How was the sample selected?
6. How large was the sample?
7. How were the data presented?
8. How were the data analyzed?
9. Were the conclusions stated fairly in light of the original question?
10. What would you like to know that was not reported?
11. a. What questions might have been asked to determine if a person were a "likely" voter?
.,, How do you think randomization might have been accomplished?
e. Why was the state divided into areas, with randomization done within the areas?
d. How do you think 773 was chosen as the number of people to be surveyed?
Information was collected by telephone conversations. The question was straightforward, so bias does not appear to be a problem. The data are nicely summarized using percents and presented on a pie chart. Little analysis is presented beyond this summary. The principle conclusion is that the race between Bush and Clinton was too close to call.
Practice and Applications
u. Why would the pollsters make the conclusion that the · race was too close to call when it is clear that Bush had the highest percentage of votes in the sample?
1~. What would you change if you were doing the survey?
14. Problems 1-10 in this lesson cover all the important points of a critique. Use them to help you write a critique of the poll.
15. Use a printed article that contains the results of a survey. Write a critique of the article.
in words and by showing a pie chart.
8. First, the findings were given. These were compared and percents were given for each category. The percents were then compared. The margin of error was given. It was pointed out that if the margin of error were added or subtracted from the percents of the various candidates, this could tie the results . Therefore, the result of the
survey was that the election was too close to call.
9. There did not appear to be bias in the results, if randomization was truly achieved. Therefore, it appears the conclusions were fairly stated .
10. You might want to know what questions were used to determine if a person is likely to vote. The students may come up with other questions of interest to them.
CRITIQUING A PRINTED ARTICLE SS

LESSON 8: CRITIQUING A PRINTED ARTICLE
u.. a. People were probably asked how many times they have voted in the last number of years.
b. Telephone numbers were formed at random by a computer. Each area of the state was represented in proportion to its population, probably through area codes.
e. Certain ethnic or age groups may reside in a specific part of the state. To make sure all groups were equally accounted for, people from areas were selected according to their proportion of the total.
d. 773 was the number of likely voters.
Practice and Applications
1z. The 3% margin of error could have meant all three percent votes were going to be Clinton votes. In that case, Clinton would have had a higher percentage of votes than Bush had.
1~. Answers will vary. The poll seems to have been fair.
14. Critiques should include the information listed in the lesson.
• The survey was conducted by the New York Times newspaper in Florida. Their particular interest was getting news on the upcoming election .
• The main question was, "If the presidential election were today, would you vote for George Bush, Bill Clinton, or Ross Perot?" There was no bias involved.
• The population of interest was those most likely to vote on election day in Florida.
• This was a sample survey.
• There was randomization as described in part b of question 11.
S6 LESSON 8
• The sample consisted of 773 people surveyed.
• Findings were listed in print and also shown on a pie chart.
• The findings were discussed as were the differences when only Democrats or only Republicans were surveyed.
• The conclusions seemed fairly stated .
• The report answered the question well. Students may have other areas about which they would like to know.
1s. Answers will vary. Be sure students include a copy of the article and give the source from of the article.

LESSON 9
Understanding Sa1npling Error Materials: none Technology: 4-function or scientific calculators Pacing: 1 class period
Overview
This lesson is provided for those students who wish to investigate sampling error. The margin of error or sampling error tends to decrease as sample size increases. Sampling error accounts for the variability in taking samples.
Teaching Notes
This lesson is divided into two sections. Problems 1, 2, and 3 deal with sampling error in general. Problems 4-10 deal with a specific article and then generalize from that article. Students who have studied statistics may be familiar with sampling error. The formula for sampling error for a sample proportion is a function of the proportion and the sample size. If your students have studied sampling error, they should be able to complete Problems 7-10. If not, you may want to stop the lesson at Problem 6. The students must know some basic algebra to be successful with this lesson. They must know how to substitute in an equation and how to do simple work with square root.
UNDERSTANDING SAMPLING ERROR S7

LESSON 9 : UNDERSTANDING SAMPLING ERROR
Solutions
Discussion and Practice
1. a. The sampling error could be close to 1.0 - 0.4 = 0.6 if nearly all the students like the cafeteria food.
b. The sampling error is 0 if the population proportion equals the sample proportion of 0.4.
S8 LESSON 9
STUDENT PAGE 44
LESSON 9
Understanding Sampling Error
How do you know how well a sample reflects the population?
Is there any way to tell?
. ' Identify characteristics
of sampling error.
Compute sampling error.
R andomization is used in selecting samples to ensure that the samples. have a good chance of accurately representing
the population from which they were selected. The sample data will not, however, look exactly like the population data.
INVESTIGATE
Sampling Error
How can you tell, then1 how close sample quantities will be to their corresponding population quantities? In general, chis is a difficult question, but there is a reasonably simple answer if proportions are used. The answer will be given after you've had a little practice thinking about sampling error.
Discussion an.d Practice
1. Suppose you randomly sample 50 students from your school and find that 20 of the 50, or 40%, like the cafeteria hours. The sampling error is the difference between this sample proportion of 40% and the true proportion of students in your school who like the cafeteria hours. •
a. What is the maximum value the sampling error could be?
b. What is the minimum value the sampling error could be?

LESSON 9: UNDERSTANDING SAMPLING ERROR
z. The best choice is part a. It would be quite unusual to have the population proportion close to 1 and yet have a sample proportion of only 0.4 in a random sample of size 50.
3. a. No; the sampling error will be less than 3% approximately 95% of the time such sample sizes are used.
b. The true percentage who think the school year should be lengthened is estimated to be between 37% and 43%. Most likely the results will be here, but there is a chance it will be out of this interval.
4. a. No; the sampling error for random samples of size 1,000 will be less than 4% approximately 95% of the time this sample size is used.
STUDENT PAGE 45
z. What if you did many school surveys? Each time, you ask only a sample of students out of the entire student body. You will have different sampling errors. ·For these sampling errors, will most of them be
•· close to the minimum you selected?
b. close to the maximum you selected?
c. evenly distributed between the minimum and the maximum?
d. Explain your reasoning.
Read the following article from the June 5, 1985, New York Times. A New York Times/CBS News poll was based on interviews conducted May 29, 1985, through June 2, 1985, with 1,500 adults around the United States, excluding Alaska and Hawaii.
The sample of telephone exchanges called was selected by a computer from a complete list of exchanges in the country. The exchanges were chosen to insure
that each region of the country was represented in proportion to its population. For each exchange, the telephone numbers were formed by random digits, so
both listed and unlisted residential numbers could be called.
In theory, in 19 cases out of 20, the results based on such samples will differ by no more than 3 percentage points in either direction from what would have been obtained by interviewing all adult Americans~ In other words, the difference
between the sample percentage and the population percentage is less than 3%
with probability~or .95.
The article from the New York Times states that, in addition to sampling error, the practical difficulties of conducting any survey of public opinion may introduce other sources of error into the poll.
~. •· For random samples of size 1,500, will the sampling error always be less than 0.03? Explain.
b. Suppose a New York Times poll says that 40% of the 1,500 people interviewed think the school year should be lengthened. What can you say about the true percentage of Americans who think the school year should be lengthened?
4. Read the part of the Gallup Poll article from Lesson 7 dealing with sampling error, called sampling tolerances.
•· For random samples of size 1,000, will the sampling error always be less than 4%? Explain.
UNDERSTANDING SAMPLING ERROR S9
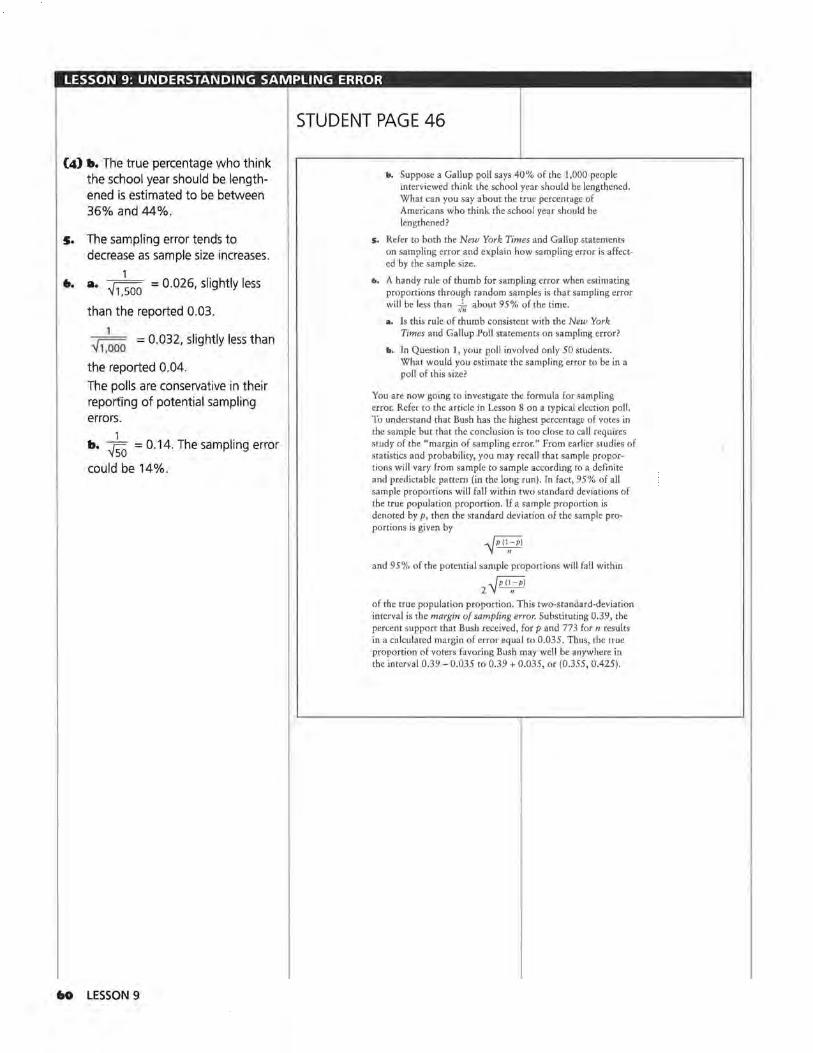
LESSON 9: UNDERSTANDING SAMPLING ERROR
(4) b. The true percentage who think the school year should be lengthened is estimated to be between 36% and 44%.
5.
••
The sampling error tends to decrease as sample size increases.
1 . a. -Vi,soo = 0.026, slightly less
than the reported 0.03.
..J 1
= 0.032, slightly less than 1,000
the reported 0.04.
The polls are conservative in their reporting of potential sampling errors.
b. Jso = 0.14. The sampling error
could be 14%.
60 LESSON 9
STUDENT PAGE 46
b. Suppose a Gallup poll says 40% of the 1,000 people interviewed think the school year should be lengthened. What can you say about the true percent.age of Americans who think the school year should be lengthened?
s. Refer to both the New York Times and Gallup statements on sampling error and explain how sampling error is affected by the sample size.
b. A handy rule of thumb for sampling error when estimating proportions through random samples is that sampling error will be less than +.- about 95% of the time.
a. Is this rule of thumb consistent with the New York Times and Gallup Poll statements on sampling error?
b. Jn Question 1, your poll involved only 50 students. What would you estimate the sampling error to be in a poll of this size?
You are now going to investigate the formula for sampling error. Refer to the article in Lesson 8 on a typical election poll. To understand that Bush has the highest percentage of votes in the sample but that the conclusion is too close to call requires study of the "margin of sampling error." From earlier studies of statistics and probability, you may recall that sample proportions will vary from sample to sample according to a definite and predictable pattern (in the long run). In fact, 95% of all sample proportions will fall within two standard deviations of the true population proportion. If a sample proportion is denoted by p, then the standard deviation of the sample proportions is given by
-'1 P (Jn- Pl
and 95% of the potential sample proportions will fall within
2~ of the true population proportion. This two-standard-deviation interval is the margin of sampling error. Substituting 0.39, the percent support that Bush received, for p and 773 for n results in a calculated margin of error equal to 0.035. Thus, the true proportion of voters favoring Bush may well be anywhere in the interval 0.39 - 0.035 to 0.39 + 0.035, or (0.355, 0.425).

LESSON 9: UNDERSTANDING SAMPLING ERROR
1. a. For Clinton, p = 0.37 and n = 773. The margin of sampling error is 0.035, which means the proportion of voters favoring Clinton was anywhere in the interval 0.37 - 0.035 to 0.37 + 0.035 or (0.335 to 0.405).
b. Bush intervals go from 0.355 to 0.425 and Clinton intervals go from 0.335 to 0.405. There is a great overlap in these intervals and so no clear winner could have been selected.
c. For Perot, p = 0.21andn=773. The margin of sampling error is 0.029, which means the proportion of voters favoring Perot may well have been anywhere in the interval from 0.21 - 0.029 to 0.21 + 0.029 or (0.181 to 0.239).
d. The margin of error is the same value, 0.035, for bcith leading candidates. It is smaller for Perot, but the more conservative value is usually reported.
8. a. If the number interviewed were 1,000 instead of 773, the margin of error for Bush would be 0.030 instead of 0.035. As the denominator increases (that is, the number of people polled increases), the margin of error decreases.
b. To cut the margin of error in half, the sample size must be multiplied by four.
9. a. There is no information given on the number of conservative, moderate, and liberal voters. Therefore, a margin of error cannot be calculated.
b. The margins of error would be larger than 0.035 because the sample size would be smaller.
c. The article states 51 % of the voters were registered Democrats and 41 % were registered Republicans. For a random sample, you expect the percentage in the
STUDENT PAGE 47
7. a. Find the corresponding two-standard-deviation interval for Clinton.
b. Explain why the pollsters do not want to call this race.
"· Find the corresponding interval for Perot.
d. .Why did the writers of the article report only one value for the margin of error?
8. Notice that the sample size is the denominator of the margin of sampling error formula.
a. Would increasing the number in the sample size reduce the margin of error? Explain why or why not.
b. Look back at one of the surveys you conducted earlier in this unit. Find the margin of error for a proportion in that survey and then find the sample size that would be required to cut this margin of error in half.
9. Study the article in Lesson 8 carefully to determine the breakdowns of the percentages among conservative, moderate, and liberal voters.
a. Is there any way to attach a margin of sampling error to these percentages?
b. If you could find these margins of error, would they be greater or less than 0.035?
e. Can you attach a meaningful margin of error to the percentage of Democrats and Republicans who backed Clinton?
10. It would be nice to know more about the sampling scheme used in that political poll.
a. How do you think randomization might have been achieved?
b. Do you think the questions that were used or the phone calls that were rejected might have caused a bias in the results?
error is
2 (0.12) (0.88)
317 ""0.036.
sample to be close to the percentages in the population. Thus, about 773 (0.51) = 394 sampled voters should have been Democrats. The article says 61 % of Democrats backed Clinton. So the margin of error is
2 (0.61) (0.39)
1.0. a. Telephone numbers, within exchanges, were probably formed and dialed at random by a computer.
394 ""0.049.
About 773(0.41) = 317 sample voters should have been Republicans, 12% of whom backed Clinton. So the margin of
b. The fact that data came only from people willing to answer the phone and answer the questions could have caused some bias.
UNDERSTANDING SAMPLING ERROR 6I

LESSON 9: UNDERSTANDING SAMPLING ERROR
6Z LESSON 9
STUDENT PAGE 48
SUMMARY
To have a representative sample, you must design a fair and random method of choosing the sample, using randomization techniques.
You need to minimize bias in the questions you ask.
Many large professional organizations select samples and conduct surveys.
There are ways to critique reports of sample surveys given in newspapers, magazines, and other media.
A sample survey measures only a portion of the population in order to make generalizations about the entire population. For a good survey, you must be careful to do the following:
Be clear about your objective. Know precisely what you want to find out.
Define your target population carefully.
Develop good survey questions that minimize bias.
Design the sample-selection plan using randomization to minimize bias.
Choose an appropriate sample size.
It is important be critical when you read a printed survey. Always ask yourself if the survey is accurate and unbiased.

UNIT II ACTIVITY
Conducting Your o~survey
Materials: Activity Sheet 4 Technology: graphing calculators and computers (optional)
Pacing: 1 day to several weeks at your discretion
Overview
The suggested activities provide students with practice designing and conducting surveys.
Teaching Notes
The topics listed are just suggestions; students may select their own, but it is a good idea to have them receive your approval before they begin. Students may work individually, in pairs, or in groups. They can carry out the survey in several days or over several weeks depending on class schedule. One way to evaluate the results is to have each group report to the class and have the class members assign a score to the report based on an agreed-upon rubric. Compile the scores for the final grade. Suggestions for evaluation from the section on Assessment Ideas, pages 121-124, might also be useful here.
Technology
Students may choose to do their analyses and graphs using technology. Be sure they turn in hard copies. Encourage them to use a word processor for their reports.
CONDUCTING YOUR OWN SURVEY 63

UNIT II ACTIVITY: CONDUCTING YOUR OWN SURVEY
64 UNIT II ACTIVITY
STUDENT PAGE 49
UNIT II ACTIVITY
Conducting Your Own Survey
Practice designing and conducting surveys.
Y ou have read about surveys. Now try your hand at one. The Statistical Sample Survey Plan on Activity Sheet 4
will help you get started. Further help in working through your survey is offered in Unit 4 of this module.
Survey Ideas
I, Favorite NFL, NBA, NHL, or NCAA team at your school
2. Trends in clothing, including styles, shoe types, and brand names
:J, Students' food preferences
4, Family issues, such as required chores, dating rules, and allowances (You can compare what goes on in your family to families of other students at your school.)
5. Political preferences, particularly at election time
6. Religious and moral issues, such as feelings about abortion, birth control, cheating, or prejudice
7, School issues, such as dress codes, school rules, and cafeteria menus
Remember the concepts you learned in this unit as you plan your survey. Keep the concept of bias in mind when you decide on your survey questions, and remember that randomness is very important when selecting your sample.

UNIT Ill
.Experi1nents


LESSON 10
Conducting an Experi1nent Materials: clock with a second hand visible to all students;
self-adhesive notes; butcher paper, adding-machine tape, or
other material to make a number line on the wall
Technology: none
Pacing: 1 class period
Overview
This is an introductory lesson about experiments and is intended to raise questions and issues. Students should realize that an experiment must be wellplanned and organized prior to collecting any type of data. By collecting data without carefully thinking about what variables are important, students come to realize their data are not very useful.
Teaching Notes
As class begins, have students find their pulse rates. Do not give advance warning to students-you want them to see that this is not an experiment; it's just a way of collecting background data. It is essential to conduct an experiment under controlled conditions, and this is not what you are doing.
The data collected do, however, pose interesting questions. Based on the extremes your class generates, create a number line with intervals about 1 foot apart. The tiles on the floor are a helpful guide. Have students stand where their pulse rates fit in this "human line plot." Students should have the questions with them as they stand in the plot. They will need to take notes on the first question. The rest of the questions can be done in their groups.
Student will struggle with the definition of an athlete. As a class, come to some consensus or analyze the data using different definitions and compare the results.
CONDUCTING AN EXPERIMENT 67

LESSON 10: CONDUCTING AN EXPERIMENT
68 LESSON 10
STUDENT PAGE 53
LESSON 10
Conducting an Experiment
What is an experiment?
Do surveys and experiments have anything in common?
A n experiment is different from a survey. In an experiment, the objective is to see if a set of experimental units treated
one way behave differently from a set of similar experimental units treated another way. For example, does a heated tennis ball bounce higher than a cold one? The objective of a survey is to estimate certain characteristics of a population, such as how many people hold a certain opinion.
Just as in a survey, an experiment must involve a good datacollection plan. If you want to find out how many times a ball bounces before it comes to rest, you bounce a ball and count the bounces. If you want a measure of how fast an ice cube freezes, you put water into the freezer and determine the length of time it takes to freeze. Both of these are experiments you might repeat several times to be sure you have consistent results.
INVESTIGATE
Cheeklnc Pulses
Everyone should find his or her own pulse rate and record the number of heartbeats per minl)te.
You will then use the collected data for your class to make two visible displays of the data. One will be a human line plot, and the other will be a sticky note (such as Post-it™) line plot on a wall.
Conduct an experiment, and reflect on the results.
Analyze data for clusters, gaps, and
outliers.
Make graphs from collected data.

LESSON 10: CONDUCTING AN EXPERIMENT
Solution Key
Discussion and Practice
x. a. The range within the class will vary. Differences in pulse rates might be due to students' coming from gym class or running up the steps so they wouldn't be late, weight (a sensitive issue), or physical fitness.
b. Same answer as part a.
c. Answers will vary. Clusters are data points that are grouped together. Gaps are spaces between data points.
d. Answers will vary. Outliers are data points that lie far away from most of the other data points.
e. You may want to discuss the mean and the median. This might be a good time to show how the mean is affected by outliers.
f. Answers will vary. The distribution is usually quite mound-shaped and symmetrical.
:z. a. There are a variety of ways to calculate pulse rate. Students will respond with a variety of answers from counting for a minute to counting for 15 seconds.
b. Students' responses may differ. Counting for 15 seconds and multiplying by 4 may mean fewer miscounts. Counting for a full minute may be more accurate.
c. Other possibilities include counting for 30 seconds and multiplying by 2 or counting for a full minute.
d. The class will make a decision as to the way pulse rate will be measured.
Practice and Applications
~. a. Answers will vary. Different measurements could be due to the
STUDENT PAGE 54
Discussion and Practice
Your teacher will make a number line along one side of the room. When instructed to do so, bring your pencil and the sticky note you have been given to the number line. Place the note on the wall over the number that corresponds to your pulse rate. Then, stand in front of the line at the number that corresponds to your pulse rate. When the class has completed this task, you will answer several questions.
1. Use the class data to answer each question.
a. What was the highest pulse rate? What might account for that?
b. What was the lowest pulse rate? What might account for that?
c:. Where are the clusters and gaps in the line plot?
d. Do there appear to be any outliers in the line plot?
e. Where does the line plot appear to center?
f, What other observations can you make about the shape of the line plot?
z. Consider the process used in making the measurements.
a. How did rou count? Did everyone count for a full minute?
b. Is it better to count for a full minute or to count for 15 seconds and multiply by 4?
c:. Discuss other possibilities for measuring pulse rate.
d. Corne to a consensus on how to measure pulse rate.
Practice and Applications
:t. Take your pulse rate again, using the measurement method decided upon by the class.
a. Are your results the same as the first time? Why might the two measurements for the same person differ?
b. Suppose a student just came from gym class. Where might that student's pulse rate fit on the line plot and why?
c:. Suppose a student is late for class. Where might that student's pulse rate fit on the line plot? Explain.
new method or to miscounting the first time.
b. The student's pulse rate would probably be high on the line plot due to the physical activity usually associated with a gym class.
c. The student's pulse rate might be high on the line plot if he or she probably ran to class in an attempt to be on time. On the other hand, the student's rate could be low if he or she walked slowly to class, not caring about the time.
CONDUCTING AN EXPERIMENT 69

LESSON 10: CONDUCTING AN EXPERIMENT
STUDENT PAGE 55
(3) d. The student's pulse rate would probably be low on the line plot. He or she probably did not rush from next door to class.
4. a. Probably not. Perhaps only males.came from gym and females did not. Thus, we could not tell if high pulse rates were due to rushing to class or to gender. b. Answers will vary, but unplanned data usually do not provide good answers to specific questions.
70 LESSON 10
d. Suppose a student just came from a class next door. Where might that student's pulse rate fit on the line plot? Explain.
4. Make a plot based on the data you collected.
a. From the data you collected, can you obtain a good answer to the question of whether or not those who came from gym class tend to have higher pulse rates than those who came from the classrooms nearby? Why or why not?
b. Pose other questions you might like to answer. Do you think the data already collected would provide a good answer for these questions?

LESSON 11
Experi1nenting toAns~era
Question Materials: clock with a second hand visible to all students Technology: graphing calculators (optional)
Pacing: 1 class period
Overview
In this lesson, students learn to conduct an experiment. An experiment is a carefully developed plan that considers all of the variables surrounding a question, controls some of them, and investigates what happens as the others are systematically varied. Students redo the pulse-taking activity, but this time they begin with a specific question, consider the variables, control those they can, and choose one variable as a treatment. For example, to study the effect of cholesterol on heart function, physicians may control gender, weight, and age, and then assign one group to a low-cholesterol diet while others remain on their regular diets. Amount of cholesterol in the diet is the treatment, while some technical measure of heart function is the response.
Teaching Notes
The question of interest is whether a longer period of exercise has more effect on pulse rate than a short period, and whether the effect of period length differs between athletes and nonathletes. In the Investigate part of the lesson, students are asked to exercise for one minute and then for three minutes. If all students exercise for one minute and a few minutes later exercise for three minutes, you are really answering a different question about consecutive exercise periods. The pulse rates may be different and skew the data. To control the effect of being athletic and more accustomed to exercise, students must first define what athletic means. Some will select only those who
engage in regular supervised athletic activities (baseball, track, basketball, tennis). Ask questions such as, "Are those who jog or ski for recreation athletic?" Once the issues are resolved, half of those classified as athlete and half of those classified as nonathlete should be randomly assigned to each group.
According to the medical profession, the best way to find your pulse rate is to count for 15 seconds and then multiply by 4. The following formulas are estimates for any age and for either sex. Minimal aerobic heart rate is (220 minus your age) times 0.7. The maximal aerobic heart rate is (220 minus your age) times 0.85.
Follow-Up
As an extension, you might ask students to bring in examples of experiments performed in science classes, so that the class can discuss the key elements in the design. Or, you might check with science teachers to get information on these experiments.
EXPERIMENTING TO ANSWER A QUESTION 71

LESSON 11: EXPERIMENTING TO ANSWER A QUESTION
7Z LESSON 11
STUDENT PAGE 56
LESSON 11
Experimenting to Answer a Question
What makes a good experiment?
Why do people conduct experiments?
. : Design and conduct an experiment to answer
specific questions.
O ne key variable in an experiment is the response in which you are interested, such as pulse rate. If you want to study
the effect of exercise, then the variable "exercise" is called a treatment and is intentionally set at different levels. Other variables that might affect the response, such as gender, are balanced across treatments in the design.
Consider the following example and think about the elements involved in carrying out a good experiment.
Does listening to radio music while doing homework help or hinder? What variable might affect the outcome? A carefully planned experiment can help to answer specific questions like this. What is the response? Help or hinder what? This question could be made more specific by choosing to measure scores on a history quiz as the response of interest.
This experiment has one treatment-status of the radio, with two levels: the radio is on or the radio is off. Some students are directed to study with the radie on and some with the radio off. Treatment levels are to be compared by scores on a history quiz given to all students in the experiment.
There are other variables that might affect the outcome, as well. Perhaps those who study in the afternoon learn more than those who study in the evening. The effect of time of day can be eliminated by having all students study in the evening. Perhaps girls do better than boys in this course. The effect of gender can be balanced by having equal (or nearly equal) numbers of girls at each treatment level. Then the difference in

LESSON 11: EXPERIMENTING TO ANSWER A QUESTION
STUDENT PAGE 57
average score for the two treatment groups cannot be attributed to gender. You are controlling for gender. Ability levels could affect outcomes. Even though all students might be from the same-level history class, there are still differences in ability. Since it is difficult to directly control the assignment of students based on ability, you could randomly assign boys and girls to the treatments. This should help to balance out any differences in ability among the students.
INVESTIGATE
Key Elements in an Experiment
The key elements to be considered in any experiment are listed below.
Both the question to be investigated and the response variable must be clearly defined.
Key variables to be used as treatments must be identified.
Other important variables that can be controlled directly must also be identified.
Important background, or lurking, variables that cannot be controlled directly should be identified and then balanced by randomization.
Treatments should be randomly assigned to the experimental units.
The method of measurement should minimize measurement bias. (Measurement bias will be discussed in the next lesson.)
Data collection and data management should be organized.
Careful and thorough data analysis should be included.
Conclusions should be written in light of the original question.
A follow-up study to answer the question more completely or to answer the next logical question about the issue should be planned.
Discussion and Practice
To determine why the key elements are important, answer the following questions.
EXPERIMENTING TO ANSWER A QUESTION 73

: PERIMENTING TO ANSWER A QUESTION
Solution Key
Discussion and Prac:tic:e
J:. a. Similarities between an experiment and a sample survey:
• The question must be clearly stated in both cases.
• Both try to minimize measurement bias.
• Both use randomization .
• Both organize data collection and data management.
• Both plan for careful and thorough data analysis.
• Both write conclusions based on the original objectives.
Differences between an experiment and a sample survey:
• In a survey, you define the target population. In an experiment, you identify the key variables used as treatments and variables that can be controlled directly.
• In a survey, you randomly select the sample. In an experiment, you randomly assign treatments to the experimental units.
b. Student responses will vary. They might consider the question, "Does light affect plant growth?" The variables could be length of time in light, degree of light, type of plant, amount of water given, and age of plant. Controlling for age, type of plant, and water, they might assign a treatment where half of the plants are given a certain number of hours of sunlight in an eastern window and half given the same number of hours of sunlight in a southern window. The measurement would be the amount of growth in the plants throughout the experiment.
74 LESSON 11
STUDENT PAGE 58
1. a. ·Compare the key elements for an experiment with those for a sample survey in Lesson 3, pages 17-20. What are the similarities between sample surveys and experiments? What are the differences?
I». A student is planning to enter the school science fair with an experiment on the effect of light on plant growth. Help this student design the experiment by discussing each of the key elements.
Practice and Applications
Think back over the earlier discussion on pulse rates. How would pulse rates differ after exercising for one minute? After exercising for three minutes? Your next task is to carefully design and conduct an experiment on pulse rates.
:a. •· Clearly define a question about exercise and pulse rate.
I». From the question, identify the key variable to be used as a treatment.
e. Identify factors that might influence the experiment and that can be controlled.
d. Identify other factors that cannot be easily controlled directly, but may be balanced by randomization. Is it important to randomize the students to the treatments in this study?
•· Outline how you would carry out a study to answer your question.
J. Suppose you want to know if a longer period of exercise for instance, three minutes, will elevate pulse rate more than a short period of exercise of one minute.
•· The physical process of conducting the experiment begins with the random assignment of treatments to the experimental units, namely the students in the class. But results might differ for athletes and nonathletes. How can you control the experiment to account for athletes and nonathletes? If this experiment is done in a short time frame, such as within the first ten minutes of class you need different people for each part of the experi- ' ment. Why?
I». Agree on the method of measurement for pulse rates. The method should provide an accurate measure of
Prac:tic:e and Applications
z. a. Does exercise affect pulse rate?
b. Amount of exercise is the key variable. The experiment has been designed for one-minute and thr~e-minute exercise periods. e. Athlete/nonathlete; male/female d. Health, individual fitness, nerves, and weight are possible variables. It is important to randomize.
e. Answers will vary.
3. a. Athletes and nonathletes need to be randomly assigned to each exercise group, so a comparable number of each type is in each group. Point out to students that if the experiment is done in a short time frame, different people are needed in each group. Those exercising one minute would have to return to their normal pulse rates before exercising for three minutes.

LESSON 11: EXPERIMENTING TO ANSWER A QUESTION
A quicker way is to randomly assign athletes and nonathletes to the one-minute and the threeminute groups.
b. Physicians suggest tim ing and counting for 15 seconds and then multiplying by 4, but counting for 30 seconds and multiplying by 2 provides a better set of numbers. c.-1. Answers will vary.
STUDENT PAGE 59
pulse rate, and should be used in the same way by all students in the study.
c. Organize the data collection and data management tasks so all data are recorded the same way immediately and accurately. Conduct the experiment and record the data in a table similar to the one shown here.
Exercise One Minute Exer<ise Three Minutes
Athlete
Nonathlete
d. Analyze the data in a way you think is appropriate. The analysis should contain both graphical and numerical summaries of the data.
e. Write a paragraph about your conclusions from this experiment. What do the data tell you about the question? How does being an athlete affect pulse rate?
f. Share your conclusions with the class. From these various conclusions, what is the consensus of the class about the effect of exercise on pulse rate? What question would the class like to have answered in a follow-up study?
SUMMARY
An experiment is different from a survey. In an experiment, the objective is to detect differences between treatment levels. Variables that might affect these differences must be controlled or balanced by randomization in the design of the experiment.
EXPERIMENTING TO ANSWER A QUESTION 7S

LESSON 12
Measure1nent Variability and Bias Materials: rulers and yardstick; two different-sized pieces of string measuring between 36 and 48 inches; staples, scissors,
and glue for each group; Activity Sheet 5 copied on cardstock or stiff paper for each group Technology: graphing calculators (optional)
Pacing: 1 class period
Overview
Regardless of how carefully students measure, there will be variability in the measures they get. Occasionally, there is bias in the measurement. When a measurement is biased, the result will vary from the true measurement by a predictable amount. Random variability cannot be predicted. Students should be aware that such bias exists, learn how to identify it, and find out as much as possible how to overcome any such bias.
Teaching Notes
After students complete part a of Problem 1, ask five students to actually measure the desk using the ruler or meter stick. Have each one write the results so the others who measure will not be influenced by the measures of the other students. The five students will probably get different measurements.
For Problem 2, you will need two strings of different lengths between 40 and 48 inches. Students' estimates are biased and you can predict ahead of time that most estimates will be too low. As in most cases in statistics, you are not analyzing the responses of a given individual, but rather looking at the overall patterns. Have students write down their estimates for both string lengths on pieces of paper. Then collect
76 LESSON 12
the papers and read and record the results. If students report their own estimates aloud and theirs are very different from the other estimates, they may adjust theirs to "fit" the others.
Group students to work on Problems 3 and 4. Before the lesson, make copies of Activity Sheet 5 on cardstock or stiff paper, and give a copy to every group.

LESSON 12: MEASUREMENT VARIABILITY AND BIAS
Solution Key
Discussion and Practice
~. a. The following are some reasons why measurements probably differ:
• If using a 12- or 6-inch ruler, error can occur when marking each ruler movement.
• Some students will not measure parallel to the edge. A slight slant will throw off the data.
• If using a string to measure and then a ruler, error can occur due to the elasticity of the string.
• Some students may not know how to measure to the nearest quarter of an inch.
•· The variability in measuring pulse rate has two main sources, the counting method used and the fact that pulse rates actually vary from person to person and time to time. The variability in your desktop is due entirely to the measuring instrument and techniques used by different people.
STUDENT PAGE 60
LESSON 12
Measurement Variability and Bias
While surveys can be biased, is it possible to have biased experiments?
What is the main cause of bias in experiments?
Understand that all measurement processes are subject to variability
and bias.
Estimate lengths and measure in inches and
quarter inches.
Graph and interpret collected data.
W hen you do an experiment, you must think about the variables that might affect the outcome.
INVESTIGATE
Recall from Lesson 11 some of the variables that might affect the outcome of the pulse-rate experiment. Others might include room temperature, time of day, and type of clothing students are wearing.
Diseu.nlon and Praadc:e
1. The pulse rates of students in the class produced a line plot that showed variability in the data. That was not surprising, since students differ in physical size and condition as well as in emotional status at the time the pulse was taken. Now, suppose five students measure the length of the teacher's desk to the nearest quarter inch. Would all five get the same measurement?
a. Discuss whether or not all five students would tend to get the same measurement of the length of the teacher's desk, and why or why not. Record your conclusion.
b. Describe the differences between the variability produced by the pulse-rate measurements and the variability obtained by the measurements of desk length.
MEASUREMENT VARIABILITY AND BIAS 77
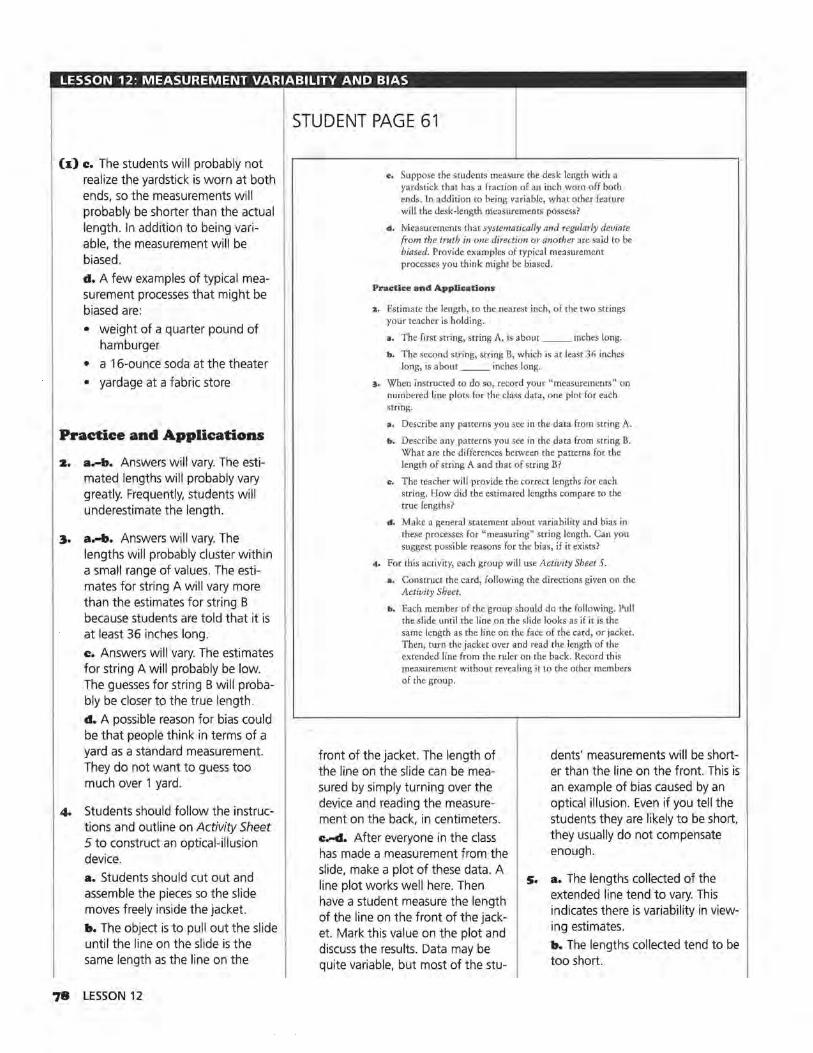
LESSON 12: MEASUREMENT VARIABILITY AND BIAS
(I:) c. The students will probably not realize the yardstick is worn at both ends, so the measurements will probably be shorter than the actual length. In addition to being variable, the measurement will be biased.
d. A few examples of typical measurement processes that might be biased are:
• weight of a quarter pound of hamburger
• a 16-ounce soda at the theater
• yardage at a fabric store
Practice and Applications
z. a.-b. Answers will vary. The estimated lengths will probably vary greatly. Frequently, students will underestimate the length.
~. a.-b. Answers will vary. The lengths will probably cluster within a small range of values. The estimates for string A will vary more than the estimates for string B because students are told that it is at least 36 inches long.
c. Answers will vary. The estimates for string A will probably be low. The guesses for string B will probably be closer to the true length.
d. A possible reason for bias could be that people think in terms of a yard as a standard measurement. They do not want to guess too much over 1 yard .
4. Students should follow the instructions and outline on Activity Sheet 5 to construct an optical-illusion device.
a. Students should cut out and assemble the pieces so the slide moves freely inside the jacket.
•· The object is to pull out the slide until the line on the slide is the same length as the line on the
'78 LESSON 12
STUDENT PAGE 61
c. Suppose the students measure the desk length with a yardstick that has a fraction of an inch worn off both ends. In addition to being variable, what other feature will the desk-length measurements possess?
d. Measurements that systematically and regularly deviate from the truth in one direction or another are said to be biased. Provide examples of typical measurement processes you think might be biased.
Practice and Applications
2. Estimate the length, to the nearest inch, of the two strings your teacher is holding.
a. The first string, string A, is about __ inches long.
b. The second string, string B, which is at least 36 inches long, is about __ inches long.
3, When instructed to do so, record your "measurements" on numbered line plots for the class data, one plot for each string.
a. Describe any patterns you see in the data from string A.
b. Describe any patterns you see in the data from string B. What are the differences between the patterns for the length of string A and that of string B?
c. The teacher will provide the correct lengths for each string. How did the estimated lengths compare to the true lengths?
d. Make a general statement about variability and bias in these processes for "measuring" string length. Can you suggest possible reasons for the bias, if it exists?
4. For this activity, each group will use Activity Sheet 5.
a. Construct the card, following the directions given on the Activity Sheet.
b. Each member of the group should do the following. Pull the slide until the line on the slide looks as if it is the same length as the line on the face of the card, or jacket. Then, turn the jacket over and read the length of the extended line from the ruler on the back. Record this measurement without revealing it to the other members of the group.
front of the jacket. The length of the line on the slide can be measured by simply turning over the device and reading the measurement on the back, in centimeters.
c.-d. After everyone in the class has made a measurement from the slide, make a plot of these data. A line plot works well here. Then have a student measure the length of the line on the front of the jacket. Mark this value on the plot and discuss the results. Data may be quite variable, but most of the stu-
dents' measurements will be shorter than the line on the front. This is an example of bias caused by an optical illusion. Even if you tell the students they are likely to be short, they usually do not compensate enough.
s. a. The lengths collected of the extended line tend to vary. This indicates there is variability in viewing estimates.
b. The lengths collected tend to be too short.

LESSON 12: MEASUREMENT VARIABILITY AND BIAS
6. Other examples of measurement bias might be:
• measuring the length of a perceived minute
• guessing the height of a tall building or tree
7. a. Bias could occur if the coach cannot hold the ruler level above the players' heads. The heights would probably be consistently greater.
b. Bias could occur when recording times. The mechanic probably will round up to the nearest quarter of an hour.
c. Depending upon the weight at which the students want to wrestle, they may overweigh or underweigh themselves. These weights could be biased. Some may weigh themselves with clothes on, wearing heavy shoes, or with keys in their pockets if they want to weigh more. If they want to weigh less, they may weigh themselves with a minimal amount of clothing and not eat much prior to weighing themselves.
d. Bias could occur when recording the length of time spent in the hospital. It is doubtful hospitals calculate to the nearest half hour. Even if this were so, estimating half hours for many patients could add up to a great deal of extra time.
STUDENT PAGE 62
c. After everyone has made a measurement, measure the length of the line on the surface of the card. Share the results in the group and briefly discuss. what happened.
d. The teacher will instruct you where to place your measurements so the data set can be collected for the class. Make a line plot of the data.
5, a. Do the lengths of the extended line all tend to be the same? What does this say about variability in the way we view things?
b. Do the lengths of the extended lines appear to be systematically too long or too short? What does this say about bias in our viewing?
r.. Describe two real-life situations in which measurement bias might occur.
7, Do you see the possibility of bias in any of the following scenarios?
a. The heights of players on the basketball team are being measured by an assistant coach.
b. The lengths of time to repair cars are being recorded by a mechanic who is paid according to the length of the job.
c. Students trying out for the wrestling team are reporting their weights to the coach.
d. A hospital is attempting to predict the lengths of time current patients will remain in the hospital.
Sometimes, things appear to be different from what they actually are. If someone interprets an event only in terms of person-· al experience, this interpretation would be a biased view.
MEASUREMENT VARIABILITY AND BIAS 79

LESSON 13
Experi1nents in the Real World Materials: none
Technology: 4-function calculators
Pacing: 1 class period
Overview
In this lesson, students look at a carefully controlled study that may have direct consequences on their lives.
Teaching Notes
Questions 1 through 6 deal with concepts that seventh- and eighth-grade students should know. Questions 7 and 8 are more difficult, and more mathematical knowledge is necessary. The article may be difficult to read, as students may find unfamiliar words, such as double blind and placebo. It is probably a good idea to read this summary together and discuss what the authors mean.
80 LESSON 13

LESSON 13: EXPERIMENTS IN THE REAL WORLD
STUDENT PAGE 63
LESSON 13
Experiments in the Real World
Who conducts experiments?
What do they do with the results?
E xperiments in the real world take place all the time. Use your knowledge of experiments and consider what a real
world experiment might be like.
What follows is a summary of the article, The Physicians' Health Study-Does Aspirin Help Prevent Heart Attacks?
During the 1980s, approximately 22,000 male physicians over the age of 40 agreed to participate in a long-term health study for which one important question was to determine whether or not aspirin helps to lower the rate of heart attacks, or myocardial infarctions. The treatments for this part of the study were aspirin or a placebo, which looks like aspirin but contains no aspirin.
One group in the study took aspirin, and the other took the placebo. The physicians were randomly assigned to one medication or the other by a randomization device equivalent to the toss of a coin. Neither the medical examiners nor the participants knew to which group the physicians were assigned. This is called a double blind experiment. The method of measurement was to observe the physicians carefully for an extended period of time and to document all heart attacks, as well as other problems, that occurred.
The following table shows how the randomization divided the subjects according to exercise and to cigarette smoking.
Appreciate how experiments are
conducted .
Recognize how results of an experiment are
used in the real world.
Calculate percents and proportions, standard deviation of a sample
proportion, and confidence intervals
EXPERIMENTS IN THE REAL WORLD 8I

LESSON 13: EXPERIMENTS IN THE REAL WORLD
Solution Key
Discussion and Practice
1.. a. Yes, the balance between aspirin and placebo is good in each group.
b. No, because the nonsmokers are divided nearly equally between the aspirin and placebo groups.
c. No, because that number is nearly equal to the number who do not exercise in the aspirin group.
d. It is important for both the experimenter and for the physicians to be unaware of the type of treatment they are being given. The physicians could obviously be influenced if they knew the treatment. Experimenters could choose to give certain physicians specific treatments, therefore altering the findings of the study.
82 LESSON 13
STUDENT PAGE 64
Aspirin Placebo
Exercise vigorously
Yes 7,910 7,861
No 2,997 3,060
Smoke cigarettes
Never 5,431 5,488
In the past 4,373 4,301
Currently 1,213 1,225
Source: "The Final Report on the Aspirin Component of the Ongoing Physicians' Heallh Study." TheNewEnglandJourna/ofMedicine, Vol 231, No 3, 1989, pp 129-135
INVESTIGATE
A Randomized Experiment
Remember, in any experiment, a variety of variables could affect the outcome. The amount of exercise the doctors took part in and whether or not they smoked were two prime examples of variables in the study described above. They were controlled so the true effect of aspirin could be measured.
Discussion and Practice
In small groups, write answers to the following questions. Be prepared to share your results with the rest of the class.
•· a. Do you think the randomization scheme did a good job in controlling the variables?
b. Would you be concerned about the results for aspirin being unduly influenced by the fact that most of the aspirin takers were also nonsmokers?
e. Would you be concerned that the placebo group possibly has too many who do not exercise?
d. Why is the double blinding important in a study like this?
The study reported 139 heart attacks among the group of aspirin users and 239 in the placebo group. This finding led to the conclusion that aspirin was a possible preventative of heart attacks. In small groups, write your conclusions to the following situations.
z. To see why the researchers drew this conclusion, use yo11r knowledge of statistics to work through the following. There were approximately 11,000 subjects, the physicians, in the study.

LESSON 13: EXPERIMENTS IN THE REAL WORLD
139 z. a. 11 ,000 ""0.013
239 b. 11 000 "" o.on
' .
~. a. The pool of men willing to participate were randomly assigned, essentially by the flip of a coin, to one of the two treatment groups.
b. Yes; if people were arbitrarily placed in groups, you would not necessarily get this balance. Subjective assignments would not have produced the balance on exercise and smoking groups, for example, that is seen here.
4. a. A treatr:ient is assigned to an experimental subject: each physician in the study was asked to take a pill. A factor to be controlled is part of the background characteristics: each physician exercised or did not exercise coming into the study; subjects were not told to exercise. The treatment was taking the pill. It was the behavior change.
b. In this experiment, exercise was a factor to be controlled. (See part a.) It was balanced between the treatment groups by the randomization.
s. No; the participants were a highly select group, not a random sample of all males in the population. The goal was not to estimate a population characteristic.
Practice and Applications
6. Answers will vary.
Extend
7. Standard deviation for the aspirin group:
(0.013) (0.987) 2 ""0.002 11,000
0.013 ± 0.002 .or (0.011, 0 .015)
STUDENT PAGE 65
a. Calculate the proportion of heart attacks among those taking aspirin.
b. Calculate the proportion of heart attacks among those taking the placebo.
3. a. How was randomization used in this experiment?
b. Was it important to use randomization?
.4. a. What is the difference between a treatment and a factor to be controlled?
b. Is exercise a treatment or a factor to be controlled?
5. Could the data from this experiment be used to find a good estimate of the proportion of males who smoke? Explain.
Practice and Applications
6. Find another printed article that explains the results of an experiment. Identify the key elements, state the evidence used to verify the conclusions, and write a summary of the experiment and its main results. The summary may contain comments on how you think the experiment or the report of it could have been improved.
Extend If you have studied confidence intervals for proportions, you can do Problems 7 and 8 for the aspirin study.
7. Calculate the standard deviation for each of the proportions of heart-attack victims in the two groups. Use the results to form confidence intervals for each group.
8. Looking at the two confidence intervals, can you see why the researchers in this study declared that aspirin had a significant effect in reducing heart attacks? Explain.
SUMMARY
You can design and conduct an experiment to answer specific questions.
All measurement processes are subject to variability and bias.
Results of an experiment can be used in the real world.
An experiment is different from a survey. In an experiment, the objective is to detect differences between treatment levels. Variables that might affect these differences must be controlled
Standard deviation for the placebo group:
(0.022) (0.978) 2 ""0.003 11,000
0.022 ± 0.003 or (0.019, 0.025)
8. The two-interval estimates of proportions of heart attacks are not close to each other. There is no overlap. It looks as if the placebo group has a significantly higher rate. ·
EXPERIMENTS IN THE REAL WORLD 83

LESSON 13: EXPERIMENTS IN THE REAL WORLD
84 LESSON 13
STUDENT PAGE 66
or balanced by randomization in the design of an experiment. A good experiment utilizes the following steps:
Clearly define the question to be investigated and the response to be measured.
Identify the key variables to be investigated.
Identify other important variables that can be controlled directly.
Identify important background variables that cannot be controlled directly but that should be balanced by randomization.
Randomly assign treatments to the experimental units.
Decide on a method of measurement that will minimize measurement bias.

UNIT Ill ACTIVITY
Conducting Your O~n Experilnent Materials: rulers and yardstick or meter stick for each group;
graph paper
Technology: 4-function calculators
Pacing: 1 class period or more (first experiment)
Overview
These experiments are much more open-ended than experiments in previous lessons. The highlights or the processes of the experiments are given, but students need to make many decisions: exactly what question is asked, how to standardize measurements throughout the group; and how to evaluate the data gathered. The first experiment is outlined in detail. Suggestions for other experiments students can conduct are provided at the end of the lesson.
Teaching Notes
This activity offers a quick way to help students through the process of conducting an experiment. It is structured, but it also allows students to make decisions. They need to consider these questions:
• Which end of the ruler will be toward their hands and which end will be up?
• What measure will they use to measure? Centimeters generally work well, but this can vary depending upon what you want students to learn.
• How high above the hand should they hold the ruler?
• Are they measuring dominant versus nondominant hand; are they measuring boys versus girls? What exactly are they trying to find out?
• How many trials should each person have?
• Once they've gathered the data, what should they do with them?
• Do the data tell them something? Can they generalize or make predictions from what they discovered?
• What happens if they don't catch the ruler?
Students should carefully identify the variables and think about how to design an experiment to answer their questions for any of the other situations. You might have everyone in class do the same experiment or divide those suggested among class groups. Students may offer some alternative ideas for experiments. A science teacher may be very helpful in providing ideas, equipment, and suggestions for scoring.
Other scoring help can be found in the Assessment section on page 121.
CONDUCTING YOUR OWN EXPERIMENT 85

UNIT Ill ACTIVITY: CONDUCTING YOUR OWN EXPERIMENT
Solution Key
For all problems, answers will vary depending on decisions made by the group. Below are listed the data of one student, Katie, from Brown Middle School in Ravenna, Ohio. Katie is righthanded. The measurements are in centimeters.
Right Hand: 8, 15, 19.5, 16.4, 19 Mean 15.6
Left Hand: 15, 9.5, 10.5, 2, 2 Mean 7.8
This class decided to compare their right hands to their left hands and compare the results . Below is Katie's graph.
Graph of Reaction Time
32 30 28
- 26 g 24 =a; 22 ';'.:: 20 ~ 18 ~ 16 ~ 14 ~ 12 Ci 10
8 6 4 2
-0
• ' , / / '
/
1
/ ~
--
2
-right hand - - - left hand
/'.._ ,,,.. ~
-· ' '
' .. '
3 4 5 Tries
Katie believed the results of this experiment showed that she did better with her nondominant hand than with her dominant hand.
After students recorded their own results, they decided to display the results for boys and girls separately for their dominant hand to determine if there was a difference.
The mean score for the boys was 15.8. The mean score for the girls was 15.5. Of course, the conclusion the girls made was that their reaction time was faster. This conclusion needs to be analyzed. Were enough samples taken?
86 UNIT Ill ACTIVITY
STUDENT PAGE 67
UNIT Ill ACTIVITY
Conducting Your Own Experiment
How fast are student reaction times?
Can a person react with his or her dominant hand faster than with the nondominant hand?
Do females have faster reaction times than males?
T hese questions, and others, can be investigated with a simple experiment that consists of measuring how far a
dropped ruler falls before it is caught. The length the ruler falls is directly proportional to the length of time it takes to catch the ruler. The key elements of an experiment provide the guide for our discussion of how to conduct such an experiment. The details on how to set up the experiment are provided below.
1. What are the questions the class would like to answer about reaction times?
a. From the questions raised, what are the variables to be used as treatments?
3, What variables that might affect the results can be controlled directly in the design of the experiment?
4, What variables that might affect the results cannot be controlled directly but might be partially controlled by randomization?
5, Now, you must randomly assign treatments to the experimental units. Suppose, for example, the treatment of interest is dominant versus nondominant hand. A controllable factor is the gender of the person being tested. Thus, we need some males and some females in each of the two treatment groups, and the assignment of students to the groups
Were enough students in the experiment? Would the results be the same if the experiment were done again? These are important concepts for the students to discuss.
Design. implement, and analyze the results of an
experiment.

UNIT Ill ACTIVITY: CONDUCTING YOUR OWN EXPERIMENT
STUDENT PAGE 68
should be random. How might this be done? NOTE: It is convenient, but not necessary, to have the same number of subjects in each treatment-gender combination.
6. What method of measurement will minimize bias and allow for fair comparisons among the treatment groups? The ruler should be above the opening between the thumb and forefinger of the subject being tested, and then dropped without warning the subject. The subject then catches the ruler as quickly as possible, and the distance the ruler drops is recorded. Should practice runs be allowed? Should other distractions be used to make sure the subject does not know when the ruler will fall? What other issues should be considered in trying to get a fair measurement of reaction time for all the subjects being tested?
7. The data management should be organized so data is correctly recorded on a chart. Should the subjects being tested record their own data?
s. Analyze the data recorded from the experiment. What graphical and numerical summaries provide the best descriptions of interesting features of the data?
9. What conclusions did your group reach in light of the original question(s)? Prepare a presentation to share these conclusions with the remainder of the class.
10. If your group were to design a follow-up study on the issue of student reaction times, what question might you investigate? How would you change the design of the experiment?
Now try your hand at one of the seven experiments described below. Remember experiments are best if they allow a fair amount of data to be collected. If you need help working through your experiment, refer to Unit 4 of this module.
FLY RIGHT
Materials: at least three sheets of paper
Description: Make three airplanes using different designs. Which is the best airplane design? It may depend on what is meant by "best." Work in groups to define at least two different outcome measures of flight performance, such as length of time in the air and accuracy at hitting a target. Then, decide on acceptable ways to measure these outcomes in an experimental situation. Each design/paper combination should be tested at least three times on each of the two outcome measures of
CONDUCTING YOUR OWN EXPERIMENT 87

UNIT Ill ACTIVITY: CONDUCTING YOUR OWN EXPERIMENT
88 UNIT Ill ACTIVITY
STUDENT PAGE 69
quality. How can bias in the measurement process be reduced? Where should randomization be used?
HOPPING Al.ONO
Materials: a stopwatch or watch with a second hand
Description: What is your hopping rate? Do you hop faster on your dominant foot? What physical attributes make us fast hoppers? This experiment is to be designed to answer these questions .. Work in teams of two. One hops along the marked distance, about 20 meters, and is timed by the other; the return hop is on the other foot. Then, the roles are reversed; the original hopper times while the timer hops. The whole process should be repeated so you have two measures of time on each foot for each person. The times along a specified distance may be turned into rates for further analysis.
Brainstorm and agree on another factor, such as a physical attribute, that could affect hopping speed. Then, analyze the data to see if the foot used, dominant or nondominant, makes any difference or if the other physical attribute, such as height perhaps, makes any difference in hopping rates. Where does randomization come into the design of this experiment?
POPPINOOUT
Materials: two popcorn poppers, one a hot-air and one of another type, such as an oil popper; two different brands of popcorn
Description: I am about to purchase a new popcorn popper. Should I buy a hot-air popper or some other type? Get some data on which to base a decision. Try equal amounts of popcorn in each popper and see what happens. Before doing the popping, however, decide upon a meaningful outcome to measure quality. Aie you looking for high volume of popped corn, low number of unpopped kernels, or some other measure of popcorn quality? Make sure each brand is tested in each popper. Set up a data recording sheet, collect the data, and a!lalyze them. Write a report of your findings, including a recommendation on which popper to purchase.
BOATJILOAT
Materials: two equal sized pieces of aluminum foil; two trays of water; salt; a bag of beans

UNIT Ill ACTIVITY: CONDUCTING YOUR OWN EXPERIMENT
STUDENT PAGE 70
Description: Do things actually float better in salt water? Does the surface area between a boat and the water or the shape of the boat make a difference in the boat's ability to float? To help answer these questions, design two different boats to be constructed out of the sheets of aluminum foil. Each will be floated on both fresh and salt water. The salt water should contain a large dose of salt, so that there is a definite difference in the water types. The measure of floating ability is the number of beans the boat can carry before it sinks. Before carrying out this experiment, think carefully about how to order the steps in the data collection process and how to reduce bias.
HOT STUFF
Materials: two disposable hot cups, one plastic foam and one paper; hot water; two thermometers
Description: Which cup is the better insulator? An experiment will help you find the answer. Heat water to boiling and place equal amounts in a plastic foam cup and a paper cup. Quickly place a thermometer into each cup; the thermometers should have nearly equal readings at the outset. Now, how should insulation effectiveness be measured? ls it the amount by which the temperature decreases in a certain period of time such as ten minutes, or the time it takes to drop a fixed number of degrees such as 20 degrees, or something else? Agree on an appropriate measure and make sure you have at least five such measurements for each type of cup. How can you start the measurement process at the same water temperature each time? What happens if you do not have the same initial water temperature each time? Analyze your data and write up an answer to the original question.
SEEING NEAR AND FAR
Materials: measuring tape or some other method of measuring longer distances
Description: Place one object at a distance of about 20 meters from a designated spot and a similar object at a distance of about 200 meters from the same spot. Do people with a great deal of outdoor experiences, such as hiking, camping, hunting, and skiing, have a better perception of distance than those without that experience? To shed some light on this question, conduct this experiment. First, you must agree on a definition of "experienced outdoor person." Then, a number of students from each group, experienced and not experienced, should be
CONDUCTING YOUR OWN EXPERIMENT 89

UNIT Ill ACTIVITY: CONDUCTING YOUR OWN EXPERIMENT
90 UNIT Ill ACTIVITY
STUDENT PAGE 71
asked to judge the distances to the two objects. After collecting their guesses, what could be used as the outcome measure of accuracy? When analyzing the data to answer the question on perception of distance, keep in mind there will be much difference in the responses gathered. Can randomization be used here? Write a brief report on the results of this experiment.
TH£ ORAVJTY or TH& 188U&
Materials: two pairs of identical objects such as two tabletennis balls or two small wooden blocks; a device to accelerate an object horizontally, such as a rubber band
Description: How does the effect of gravity on an accelerated object compare to its effect on free-falling objects? To check this out, construct a device that will accelerate a small object, such as a table-tennis ball, horizontally at the same time an identical object is dropped. Start both objects at the same time and from the same height, such as from the top of a stepladder. To measure the outcome, you might try timing how long it takes the object to hit the floor, but this is a difficult task, as you must be very quick. As an alternative, just record which object hits the floor first. Collect data on the same pair of objects at least ten times, and try the experiment with at least two types of paired items. What did you discover?

UNIT IV
Projects


LESSON 14
ARelerence Guide Materials: none
Technology: none
Pacing: 1 class period
Overview
Often when students have gathered their data, they either forget the types of graphical displays they can make or they know what they want to make but have forgotten how to make it. This lesson helps students create the displays they wish to make, basically covering three areas:
• types of data the student can gather
• measures of center and spread
• types of graphical displays
The types of data covered are categorical data and measurement data.
Measures of center are the mean and the median. The measures of spread are range, interquartile range, and standard deviation. The types of tables, graphs, and charts that are looked at are stem-and-leaf plots, line plots, box plots, histograms, circle graphs or pie charts, picture graphs, scatter plots, and bar graphs. The student edition gives an example of each type along with some direction for its use and construction. This is a resource guide for students. There are no exercises given. The material can be reviewed as a class, or students can use this section as they need it when they are working on their projects.
A REFERENCE GUIDE 93

LESSON 14: A REFERENCE GUIDE
94 LESSON 14
STUDENT PAGE 75
LESSON 14
A Reference Guide
What are some graphical representations that can display data in a meaningful way? What are the measures of center? of variability?
How do these two measures help you to understand the data?
T his section will help refresh your memory about these topics and ideas you have covered:
types of variables you will be using
measures of center and spread
types of graphical displays
Types ol Variables
You may recall learning about two types of variables: measurement variables (quantitative) and categorical variables (qualitative) .
Measurement data result when you determine the extent, size, quantity, or capacity of something. An example is your height or weight. You can also use measurement variables to determine how far you can jump, to determine how long you can hold your breath, or to make a guess as to how many candies are in a bag.
Categorical data tend to be information about classification of objects or people, for example, males or females; lefthanded or right-handed people; or brands of shoes students are wearing.
Measures of Center and of Spread
When thinking about the measurements you gather in your project, you may want to consider using tools that help you
Use a reference guide as a tool when working on individual projects.

LESSON 14: A REFERENCE GUIDE
STUDENT PAGE 76
think about the center of your data and the variables in your data. This may help you analyze the information you have gathered. Measures commonly used are
Center
mean
median
Variability
range
interquartile range
standard deviation
Types of Graphical Displays
The type of data you collect and the questions you are trying to answer should help you to determine the types of tables, graphs, and charts you will use to display your data.
When using measurement data, you may want to consider making
stem-and-leaf plots
line plots
box plots
histograms
picture graphs
scatter plots
When using categorical data, you may want to consider making
bar graphs
circle graphs
picture graphs
The following example shows the measures of center and spread and the types of graphs and plots you can use. Today many people are very health-conscious. People are watching calories and fat grams. The Mars" candy company has been watching this trend and has created a new low-calorie, low-fat bar called Milky Way If.
A REFERENCE GUIDE 9S

LESSON 14: A REFERENCE GUIDE
96 LESSON 14
STUDENT PAGE 77
The following table compares calories and fat content of the top-selling candy bars. It also tells us the new Milky Way II bar has 190 calories and 8 grams of fat.
A Candy Comparison
Here's how the top-selling chocolate candies compare to the new Milky Way II, which has 190 calories and 8 grams of fat.
Calories Fat
1. M&M"s" (plain) 230 10 g
M&Ms" (peanut) 250 13 g
2. Snickers® 280 13 9
3. Reese's® Peanut Butter Cup'"' 250 15 9
4. H""11oy"<" Kisses (six) 150 99 5. Milky Way• 280 11 g
6. Hershey's® Milk Chocolate (plain) 240 14 g
Htr>lio\' ... Milk Chocolate (almonds) 230 14 g
7. Kit Kati!) 230 12 g
8_ Twix® 280 lg
9 Three Musketeers® 260 9g
10. (tie) Nestle® Crunch'~ 210 10 g
Nestle® Butterfinger '" 280 II g
Source: data from USA TODAY, 1993
First examine the measures of center and spread of the fat content of the data.
The mean amount of fat in these 13 candy bars is 11.385. We added the 13 numbers in the fat column and then divided the sum by 13.
The median amount of fat is 11. This means the number of candy bars with a fat ,content greater than 11 is the same as those with a fat content less than 11.
The range is 8. This is the difference between the greatest amount of fat, 15, and the least amount of fat, 7.
When comparing these measures to the new Milky Way II bar, you see that the amount of fat in the new bar is far less than either the mean or the median of the top-selling candy bars. The variability in the number of calories and grams of fat is really not useful information to help you to decide if you would like to try the new bar. Consider how a plot can help you understand the distribution of fat in candy bars.

LESSON 14: A REFERENCE GUIDE
STUDENT PAGE 78
Stem·and·Leat Plot
Fat Content In Top-5eWng Cendy Ban
017 9 9 I 0 0 1
1 5
2 3 3 4 4
Key: 1 I 5 means 15 grams offat
This stem-and-leaf plot shows that the range of fat content in top-selling candy bars is from 7 to 15 grams with the majority of the bars containing between 10 and 14 grams.
This display gives us some information about the fat content in candy bars. However, a stem-and-leaf plot is more helpful when the minimum number of data points is 25.
line Plot
Fat Content In Top-5elllng Candy Ban
x x x x x x xxx xxx x
6 7 8 9 10 11 12 13 14 15 Grams of Fat
The mean is 11.385. This line plot generally shows that there is variability in the fat content of top-selling candy bars. The standard deviation is 2.3. Since the Milky Way II bar has 8 grams of fat, you can see from the plot that only one bar has less fat.
A REFERENCE GUIDE 97

LESSON 14: A REFERENCE GUIDE
98 LESSON 14
STUDENT PAGE 79
Box Plot
Fat Content In Top-Selling Candy Bara
20
18 -
16 -
14
0 12
e 10
~
4
n = 13
This box plot indicates that the interquartile range is 4 grams. Therefore, 50% of the top-selling candy bars contain between 9.5 (lower quartile) and 13.5 (upper quartile) grams of fat. It shows the range of fat content is between 7 and 15. The median amount of fat is 11 grams. Furthermore, if you placed the Milky Way II bar on this plot, it would be in the lowest 25% of fat content among the top-selling candy bars.
Histogram
Fat Cont.at of Top-Selling Candy Bar•
~ :b, I, I, I, f:Cib 8 9 10 11 12 13 14 15 16
Grams of Fat
The histogram generally shows that while there is variability in the fat content in the bars, the frequency is relatively stable. In other words, the least number of candy bars that has any one amount of fat is one and the greatest is two.
The following three graphical representations show how measurement data can be displayed in categorical formats if you use grouping.

LESSON 14: A REFERENCE GUIDE
STUDENT PAGE 80
Circle Graph, or Pie Chart
Fat Caatant In Tap-Selling Candy Ban 15-19
10-14 grams 69%
grams 8% 5-9
To make a circle graph, or pie chart, with these data, the data points needed to be grouped into categories. The three categories used were 5-9 grams; 10-14 grams; and 15-19 grams. This grouping can also be used in developing a histogram or a picture graph.
To make a circle graph, you must divide the number of data points in that category by the total. For example, three data points fell between 5 and 9 grams of fat. Three was divided by 13, the total, for 0.23 or 23%. This decimal was m:ultiplied by 360, the number of degrees in a circle, to get the number of degrees for that category. In this case, it was 83'.
Histogram Using Grouping
Fat Content In Tap-SeWn11 Candy Ban
'§ 0 u
10
9
8
7
6
s .\
3 -
2 -I
-0
---
I 5- 9 10-14 15-19
Grams of Fat
A REFERENCE GUIDE 99

LESSON 14: A REFERENCE GUIDE
IOO LESSON 14
STUDENT PAGE 81
Picture Graph
Fat Centent In Top&Ulng C8ncl)' Bara
15-19 grams II lO-l 4 grams 1111111111111111
5-9 grams 111111 II means a bar of candy
All of these graphs show that the grcacest number of candy bars have between 10 grams and 14 grams of fat. The new Milky Way II has less fat than che majority of the bars.
Since the measurement data were divided into categories, categorical data can also be used to make circle graphs, pie charts, histograms, or picture graphs.
Scatter Plots
Scatter plots are used to determine if there is any relationship between paired measurements. The table below and on the next page shows the cigarette consumption per adult per year and the number of deaths per 100,000 people per year due to coronary heart disease in 21 countries. The plot that follows the table shows that there seems to be a strong association among the variables.
Country Cigarette Consumption CHD Mortality per Adult per Year per 100,000 (ages 35-64)
United States 3,900 257
Canada 3,350 212
Australia 3,220 238
New Zealand 3,220 212
United Kingdom 2,790 194
Switzerland 2,780 125
Ireland 2,770 187
keland 2,290 111
Finland 2,160 233
West Germany 1,890 150
Netherlands 2,820 125
Greece 1.800 41
Austria 1,770 182
Belgium 1,700 118

LESSON 14: A REFERENCE GUIDE
STUDENT PAGE 82
Mexico l.680 32
Italy 1,510 114
Denmark 1.soo 145
France 1.410 60
Sweden 1,270 127
Spain 1,200 44
Norway 1,090 136
Source: Exploring Data by James M L.mdwehr and Ann E. Walldns, 1966
300
275
250
0 225 0 0 200 0 ~ 175 :;; .s 150 l:'
~ 125 0 :; 100 0 :i: u 75
50
25
£.ample of a Scatter Plot
.... ·····-······· ················ .... ........ ..
.......... ... ~ . ..... ............. .. ..... ......... . ..... ····• ·•·· ......... .
.......... -..... - _ .. - ..... ~ ............. -· .. ..
. ........ 1 .......... ·~··· ...... • '9• "'"' ............... .
............... .......... . ................................ ,
......... .............................................. ..... 00! OH•• •• • • • ooo ''''' ''''' o••O• 0000• oOO_, 00000 00000 00000
1000 1500 2000 2500 3000 3500 4000
Cigarette Consumption (per adult per year)
Bar Graph Here is an example of a bar graph with unusual pictorial bars.
Cosmetics Used by Teenage Glrlo
72%
60% SS%
1 I Nail lipstick Mascara Eye Blush
polish shadow
Source: data from USA TODAY, July 7, 1994
A REFERENCE GUIDE

LESSON 14: A REFERENCE GUIDE
I02 LESSON 14
STUDENT PAGE 83
Notice a few things about this graph. There are no "raw" data given-<:mly percents. Also, no details are given about how the information was gathered. You might also notice that the traditional bars are replaced by pictures of the objects described. It does show you that nail polish is the most common type of makeup used by teenage girls, with lipstick following a close second. Blush is the least common type of makeup used by teenage girls.
SUMMARY
This summary of types of variables, measures of center and spread, and types of graphs and plots can be helpful to you both before you begin to gather data and when you are ready to display and analyze the data. Some things to remember are:
Pie charts, picture graphs, and bar graphs are best used for describing categorical data. Remember this when you design your project. If you want more variety, you may want to consider some data that produce a measurement result. Line plots, stem-and-leaf plots, box plots, and histograms are most useful for measurement data.
All graphs must have a title explaining the general topic of the graph.
If graphs have axes, they must be labeled as to what each axis represents.
There should be an explanation for each graph following the display.
How a graph looks is very important. Remember to use a ruler. Color can also enhance both the appearance and the comprehensibility of your graph.

LESSON 15
Doing a Project Materials: 4-by-6-inch cards; paper clips, rubber bands, or
large envelopes (optional), art materials for graphs and cover
sheets; Activity Sheets 6-10 (Materials other than those listed
here may be needed according to the projects chosen.)
Technology: computers and statistical software (optional)
Pacing: 1 week to entire semester, depending upon
projects selected
Overview
An important part of this module is having students actually do a project. The process has been broken down into ten separate steps with specific assignments following many of the steps.
Teaching Notes
The solutions here will give a brief description of what to look for when the students turn in their work or ask questions about their work. It is divided into the ten steps students follow for doing a project.
Students often have difficulty starting their projects and getting organized. Two different project requirement sheets, Activity Sheets 6 and 7, are provided to help them and to give you a structure to use for assessing student work. Activity Sheet 6 is more directed and may be more effective with younger students.
In Problem 6, students are asked to turn in a progress report. You should have students put all their work to that point in large envelopes, or secure their work with paper clips or rubber bands, so you can review their progress. Quickly return the materials so students can continue their work. For Problem 7, you may have students write a statistical summary of their data. Be sure students use the evidence they have gathered to make their conclusions. Graphs, statistical summaries, and words placing these in context should be a part of their summary. Students can then include these summaries in their final project write-ups.
If there is a local chapter of the American Statistical
Association, they may be able to provide a statistician who would be willing to serve as a consultant for the groups as they work on their projects. Most groups find such input extremely helpful. Information about local chapters is available from:
American Statistical Association 1429 Duke Street Alexandria, VA 22314-3415 (703) 684-1221
After students complete their projects, you should decide how best to evaluate them. This module offers several options. Each of these evaluating methods is described in detail in the Assessment Ideas section on pages 121-124.
• Peer evaluations (see page 122)
• Portfolios (see page 122)
• Rubrics (see page 123)
• Holistic grading with comments (see page 124)
• Grading by points (see page 124)
Technology
The amount of technology needed depends upon the projects the students choose. A computer with statistical software would be useful. Some easy to use statistical software packages are Data Insights™ (for Apple II and IBM) and Statistics Workshop™ (for Macintosh). Both are from Sunburst® Productions, Inc. and are very student-friendly. Many other software packages are available. Students should be encouraged to use a word processor to write up their results.
DOING A PROJECT I03

LESSON 15: DOING A PROJECT
I04 LESSON 15
STUDENT PAGE 84
LESSON 15
Doing a Project
How do you start a project?
What are some ideas you might use?
. : Complete a project following correct
procedures.
I n this module, you have studied censuses, surveys, and experiments. In this lesson, you will work in a group to
follow a given series of steps for a project.
INVESTIGATE
Steps lor Doing a Project
An overview of the whole procedure is outlined below. It is important to understand each step in the process, so study the steps and make sure you have a clear understanding of what each step involves.
Select a topic. Determine a question you want to answer.
Decide whether your question should be answered by data from a census, a sample survey, or an experiment.
Determine your target population if a census or sample survey is involved.
Determine your treatments and experimental units if an experiment is involved.
Determine the procedure for gathering your data.
Field test your project.
Collect your data.
Organize the data into tables, graphs, and plots.
Analyze the data.
Report your results, conclusions, and predictions.

LESSON 15: DOING A PROJECT
Solution Key
Discussion and Practice
1. The Question-When students bring you their project topic on a 4-by-6-inch card, check the following:
• Is the project too broad? Would a part of the project be better?
• Is the task "doable"? Can students gather the data or do the experiment successfully?
• Are there legal or moral ques~ tions students need to consider? For example, if surveying in a mall, do students need to contact the security service of the mall before they begin?
• Is the topic redundant; that is, have many students chosen the same topic?
• Be sure to approve all topics before students begin to collect data.
STUDENT PAGE 85
Write recommendations for follow-up studies.
Present an oral report.
Discussion and Practice
The Question
Selecting a topic is probably the most difficult part of the process. Your goal is to write a question for which you would like an answer.
If the question involves the estimation of a population characteristic, then you might conduct a census or survey. For example:
How many students have jobs?
What percentage of households have at least one pet?
What is the average age of automobiles in my neighborhood?
What would you change about your school if you could?
How many of you have ever cheated on a test?
If the question involves the comparison of treatments, then you might conduct an experiment. For example:
Do tennis balls of brand A bounce higher than those of brand B?
• Does adding salt to water cause boats to float better?
1. Decide on your question. Write down your question and make a sketch of your plan on a 4-by-6-inch card. Submit it to your teacher for suggestions and approval.
Target Population or Treatment.I
Your selection of a census, a sample survey, or an experiment will determine how you proceed. Each is explained below.
If you are conducting a census or a sample survey, your goal is to determine what units are in the population and how many will be in your sample. Remember the importance of randomness when selecting your sample. Everyone should have a chance of being selected.
• If you are conducting an experiment, you need to determine your treatments and experimental units. Suppose the questi.on is, "Which type of hot cup, plastic foam or paper,
DOING A PROJECT IOS

LESSON 15: DOING A PROJECT
z. The Target Populations or Treatment-After students have decided on their questions, they must then decide whom they will survey or on what they will experiment. Check the following:
• If students are doing a survey, are they clear on the difference between the population and the sample?
• If they are doing a survey, have students chosen a random way to select their samples?
• If they are doing an experiment, do students understand the difference in the treatment group(s) and the control group?
3. The Procedure-Make sure students have considered the following:
• In a survey, the questions should be free from bias.
• In an experiment, the procedure should give unbiased measurements of the effect being studied.
106 LESSON 15
STUDENT PAGE 86
holds heat longer?" Cups of a certain brand and size are filled with hot water and temperature is measured after five minutes and ten minutes. The tre.atment is the type of cup. Be sure to carefully describe: what your procedure will be and the persons or things you will test; the number of experimental units (the number you will test); and how the process will be arranged and conducted. For instance, will you test only plastic foam cups in the morning and only paper cups in the afternoon?
z. If you are conducting a census or a sample survey, what population will you use and approximately how many will be in your sample? If you are performing an experiment, what treatments will you use and what will be the experimental units? Submit your plan to your teacher for suggestions and approval.
Procedure
The next step in completing your project is to decide how you will gather your data.
If you are conducting a census or a sample survey, you need to write the questions you will ask. Remember to minimize the bias in your questions.
• If you are performing an experiment, you need to determine the procedure your group will use :Jnd how you will standardize the procedure so that each person is doing exactly the same activity.
:t. Determine how you will gather your data. If you are writing a census or sample survey, give a copy of your questions to your teacher for suggestions or approval. If you are writing an experiment, demonstrate your procedure to your teacher or write out the procedure you will use. Work with your teacher if changes are needed.
1'1eldT-
You now need to test your questionnaire or experimental procedure to make sure it will answer the original question.
4. If you are doing a census or sample survey, try out your survey on about five people within your classroom. Determine if the information you are getting will answer your ques-

LESSON 15: DOING A PROJECT
4. Field Test-Students will test their designs. They need to articulate problems they had with their trials and make changes that will make their plans more effective.
s. Collect Data-If the projects are to be done in the classroom or in the school, you can help with the organizational structure of the data collection. This will be dependent upon the structure of your school setting.
6. Organize-The goal is to use graphical displays to help answer the original question. Your help in setting up the graphs may be required. Some quick guidelines are:
• Label the axes and title the graphs.
• Make sure graphs are appropriate for the data.
• Use rulers so work is neatly done.
If students have not already completed Lessons 14 and 16, now would be a good time to complete them.
If students are following the checklist on Activity Sheet 7, ask for a progress report from each student or group. Give students the large envelopes and ask them to enclose their data, copies of questionnaires or surveys, graphs they have used, a brief progress report, and a list of references they have used. Review these progress reports quickly to make sure students are on the right track, and return them so students can begin their drafts of their projects.
7. Analyze-You need to make sure the conclusions students make are based on the data they gathered. Also, unusual findings need to be addressed.
a. Report-Prior to beginning their reports, students need to be very
STUDENT PAGE 87
tion. If you are successful, continue to the next part. If you are having difficulty, make revisions and talk to your teacher. If you are doing an experiment, determine if your procedure will provide an answer to your question. If you are successful, continue to the next part. If you are having difficulty, make revisions and talk to your teacher.
Collect Data
5, Now gather the information you need to answer your question. If you are working in a group, be sure all members are aware of their tasks. Make sure each person asks questions in the same way or does the experimental procedure in the same manner.
Orpnlae
•· Organize the data you gathered and display it so the information is easily understood. Lesson 15 of this module contains a summary of some types of graphs you could make. Lesson 16 will help you decide how best to represent data for your project. Prepare and give your teacher a progress report.
7. Carefully answer your original question based on the data you collected. Look for any unusual results and try to figure out what might have been the cause. Write a statistical summary of your findings.
Report
8. Write a report of your results. Before starting, read the Information Sheet, Informing Others found on page 95. It will help you to write a good report. Follow these guidelines:
Type or neatly write your report on 8.5-by-11-inch paper.
• Carefully mount all graphs, charts, and tables.
• Illustrate your cover sheet and include the project title, the names of the persons in your group, and the date.
clear on what is expected in the report. The text states exactly what is required and this should be stressed. Often this analysis is the most difficult part for the student. Conference time with each group is helpful. Activity Sheet 6 also has clear guidelines for students. Before writing their reports, students should do Lesson 17.
DOING A PROJECT X07

LESSON 15: DOING A PROJECT
9. Recommendations-Projects do not always run smoothly. Students should not consider these signs of failure, but explain what happened and how they resolved the situation. Frequently, the data do not support the hypothesis students had in mind. This again does not signal failure nor necessarily the need to collect more data. They have to accept the fact their theory was not valid. Once again, students may need assistance in determining what conclusions are appropriate based on the information they gathered. They often want to make recommendations that are not based on fact but rather on perception. This is an important distinction to bring out.
IO. Oral Report-This is the chance for students to present their findings to the class or to some other significant group. This is a good time to set up some type of evaluation tool for yourself and for the group to use for each project as it is presented .
I08 LESSON 15
STUDENT PAGE 88
Your report should include:
the question that was investigated.
a description of the target population or treatments and experimental units used.
the procedure you used.
the raw data, tables, and plots.
analysis of the data, using the plots. Note any difficulties or unusual results.
a statement of conclusions about your question and any predictions you can make.
recommendations for follow-up studies that could be done.
Recommendation•
9· Make recommendations or suggestions for changes in your design. Describe any problems you encountered and how you solved them.
Oral Report
10. After you have completed your project, drawn conclusions, and made predictions, make an oral presentation of your findings to the class. Include in your presentation all of the topics you usecl in yn11r fin"I report.

LESSON 16
Representing the Sa1ne Data in Dilferent Ways Materials: none Technology: 4-function calculators Pacing: 1 class period or more
Overview
Data can be represented in a variety of ways. Some ways make certain data easier to understand. This lesson takes the same data and shows them in a variety of ways so students understand how the display selected has an effect on the reader.
Teachin& Notes
It may be necessary to review the purposes and features of the various types of graphs and plots that are commonly used to help readers to understand data and see relationships and trends.
Technology
Spreadsheets and graphing calculators can help students "see" things in the data. If you have access to a computer lab, this activity lends itself well to the use of a spreadsheet or graphing package.
REPRESENTING THE SAME DATA IN DIFFERENT WAYS J'.09

LESSON 16: REPRESENTING THE SAME DATA IN DIFFERENT WAYS
110 LESSON 16
STUDENT PAGE 89
LESSON 16
Representing the Same Data in Different Ways
What do different graphs tell you?
Is one kind of graph better than another?
Once your data have been gathered, you should display the data so you and others can see relationships or trends.
You want to see what new information you can get from the data. You want to make the data-gathering process productive.
The trouble is that data can be so overwhelming, you can hardly see anything in the data at all. That is where statistics can help. By offering many different ways to organize and display data, statistical techniques can help find relationships or trends that are virtually invisible in data.
As you collect information for your project, you will want to start thinking about bow you will display the results in a way that will be interesting, eye-catching, and informative.
One natural method of organizing data is in a table. Tables can be very effective in organizing frequency data. However, sometimes the relationships can be lost in a "sea of numbers."
INVESTIGATE
Frequency Tables
The table that follows shows the number of participants in the Olympic games since 1896. When you look at the number of competitors from the first Olympic games through the twelfth Olympic games, you can see that participation increased.
Organize data in many different forms for
clearer understanding.
Construct a box plot.
Read and interpret a graphical display.
Compute and compare percents.

LESSON 16: REPRESENTING THE SAME DATA IN DIFFERENT WAYS
STUDENT PAGE 90
Summer Olympia Game•
Competitors Games Year Site Men Women
1896 Athens, Greece 311
1900 Paris, France 1,319 11
Ill 1904 St. Louis, USA 681 6 rv 1908 London. GB 1.999 36
v 191.2 Stockholm, Sweden 2.490 57
VI 1916 Berlin, Germany
VII 1920 Antwerp, Belgium 2,543 64
VIII 1924 Paris, France 2,956 136
IX 1928 Amsterdam, Holland 2,724 290
x 1932 Los Angeles, USA 1,281 127
XI 1936 Berlin, Germany 3,738 328
XII 1940 Tokyo, Japan
XIII 1944 London, GB
XIV 1948 London, GB 3,714 385
xv 1952 Helsinki, Finland 4,407 518
XVI 1956 Melbourne, Australia 2,958 384
XVII 1960 Rome, Italy 4,738 610
XVIII 1964 Tokyo, Japan 4,457 683
XIX 1968 Mexico City, Me><ico 4,750 781
xx 1972 Munich, Germany 5,1348 1,299
XXI 1976 Montreal, Canada 4,834 t,251
XXll 1980 Moscow, USSR 4,265 1,088
XXlll 1984 Los An9ole}, USA 5.458 1,620
XXIV 1988 Seoul, South Korea 6,983 2,438
xxv 1992 Barcelona, Spain 9,364 2,705
XXVI 1996 Allont•, USA
*No Olympics held
Source: Wallechinsky, David. The Complete Book of the Olympics, 1992 Edition. Wallechinsky, little Brown and Company, 1992.
If you enter the data into a spreadsheet, you can easily obtain more information. For example, you can determine the total number of Olympic participants or the increase or decrease of competitors from one year to the next. Whatever statistical information you might want to obtain from the data, the spreadsheet is a tool that can do the mathematics. Statistics in the next table examine the percent of Olympians that were female for each Olympic competition.
REPRESENTING THE SAME DATA IN DIFFERENT WAYS

LESSON 16: REPRESENTING THE SAME DATA IN DIFFERENT WAYS
Solution Key
Discussion and Practice
I. See table below.
Jobs
Athletes Non athletes
Male 12% 4%
Female a. 20% b.12%
Totals c. 32% d.16%
IIZ LESSON 16
STUDENT PAGE 91
Porcont o( OIJ'ntPl• n• Who Affl f omalo
Competitors Percent Games Year Site Men Women Women
1896 Athens, Greece 311 0%
1900 Paris, France 1.319 11 1%
Ill 1904 St. Louis, USA 681 6 1%
IV 1908 London, GB 1,999 36 2%
v 1912 Stockholm, Sweden 2,490 57 2%
VI 1916 Berlin, Germany
VII 1920 Antwerp, Belgium 2,543 64 2%
VIII 1924 Paris, France 2,956 136 4%
IX 1928 Amsterdam, Holland 2,724 290 10%
x 1932 Los Angeles, USA 1,281 127 9%
XI 1936 Berlin, Germany 3,738 328 8%
XII 1940 Tokyo, Japan
XIII 1944 London, GB
XIV 1948 London, GB 3,714 385 9%
xv 1952 Helsinki, Finland 4,407 518 11%
XVI 1956 Melbourne, Australia 2,958 384 11%
XVII 1960 Rome, Italy 4,738 610 11 %
XVIII 1964 Tokyo, Japan 4,457 683 13%
XIX 1968 Mexico City, Mexico 4,750 781 14%
xx 1972 Munich, Geuf!an;• 5,848 1,299 18%
XXI 1976 Montreal, Canada 4,834 1,251 21%
XXll 1980 Moscow, USSR 4,265 1,088 20%
XXlll 1984 Los Angeles, USA 5,458 1,620 23%
XXIV 1988 Seoul, Soulh Ko1ed 6,983 2,438 26%
xxv 1992 Barcelona, Spain 9,364 2,705 22%
XXVI 1996 Atlanta, USA
-No Olympks held
Discussion and Practice
:l. The frequency dara below are from a sample student survey conducted at RufUs King High School, Milwaukee, WI, May 1992, to study the number of students who had part-time jobs during the school year,
Jobs No Jobs Athletes Nonathletes Athletes Nonathletes
Male 6 4
Female 10 9
Totals 16 13 13
The following table shows percentages for several groups. On anothenheet of paper, give the missing percentages, The
No Jobs
Athletes Nonathletes
and half are not (26% each). The percentage of athletes with a job is double the percentage of nonathletes with a job. 8% 8%
e.18% I. 18%
g. 26% h. 26%
i. These answers show in each cell the percentages of students out of the fifty students polled. One relationship is apparent in the "no job" category-half are athletes
j. Answers will vary.
k. Male-about 295
Athlete-about 535
Job-about 443
Female with job-about 295

LESSON 16: REPRESENTING THE SAME DATA IN DIFFERENT WAYS
STUDENT PAGE 92
denominator of each fraction is 50, the total number of students in the study.
Jobs No Jobs Athletes Nonathletes Athletes Nonathletes
Male 12% 4% 8% 8%
Female a. 7 b.7 e. 7 I. 1
Totals e.? d. 7 h.?
i. List relationships you see in this data table.
I· Write about one relationship. Pick one that may have surprised you and explain why.
k. If Rufus King has a total school population of 923 students, how many would you expect to
• be male?
• be an athlete?
• have a part-time job?
• be a female with a part-time job?
Once data are in a spreadsheet, you can create graphs to provide additional information. Graphic displays can help to highlight trends and get the reader's attention. You may notice many new types of graphs as you look at newspapers and magazines. Artists are employed to make these displays eye-catching and colorful. The graph that follows is a double-bar graph using information from the Summer Olympics table you saw earlier. It shows the frequency of categorical data for male and female participation each year from 1896 to 1984.
REPRESENTING THE SAME DATA IN DIFFERENT WAYS 113

LESSON 16: REPRESENTING THE SAME DATA IN DIFFERENT WAYS
:z. To construct a box plot (also called a box-and-whisker plot), the data points must be arranged sequen-ti ally.
Participants in the Olympics
Lower quartile median
Median
Upper quartile median
No. of Males
311
681
1,281
1,319
1,999
2,244.5
2,490
2,543
2,724
2,956
2,958
3,714
3,738
4,265
4,407
4,457
4,738
4,744
4,750
4,834
5,458
5,848
6,983
No. of Females
0
6
11
36
57
60.5
64
127
136
290
328
384
385
518
610
683
781
934.5
1,088
1,251
1,299
1,620
2,438
Be sure to remind students that the median is part of the data set because there is an odd number of data points. For this set of data, the medians of the lower and upper quartiles are not data points but are averages of the points between which they fall.
II4 LESSON 16
STUDENT PAGE 93
Summer Olympia Games Participants 7,000
6,000 •Men Dwomen
i 5,000
:~ 15 4,000
" ~ ~ 3,000
2,000
1,000
0 I I b I
Years
Other plots are box plots, stem-and-leaf plots, line plots, and scatter plots. The line plot below shows participation in the Olympic games by gender since 1896. Note that the discrepancy between males and females is quite obvious.
Number ol Competitor• In Olympics by Gender F F F =Female F M =Male F F F r F F F F F F F M M F F F F F M M M M M f M M M M F M M M M M M M M M M
0- 300- 900- 1,500- 2, 100- 2,700- 3,300- 3,900- 4,500- 5,100- 5,700- 6,300- 6,900-299 600 1 ,200 1 ,800 2,400 3,000 4,200 4,200 4,800 5,400 6,000 6,600 7,200
:1. Construct two box plots, one for male competitors and the other for female competitors. Write a paragraph comparing the two plots,
~. Use the information on Summer Olympic Games to answer the following:
a. Which years seem to stand out in the data? Explain,
Olympic Participants 0 1,000 2,000 3,000 4,000 5,000 6,000 7,000
I
I
-[CJ----Males
Female5
The box plot is a dramatic display of the disparity between men and women participating in the Olympics. The median number of men participants is 3,714, while the median number of female participants is a scant 384. The highest number of women participants is only
slightly higher than the median of the lower quartile for the men.
~. a. 1916, 1940, and 1944 stand out because there were no Olympic games due to the wars. 1980 showed a drop in the number of both men and women.

LESSON 16: REPRESENTING THE SAME DATA IN DIFFERENT WAYS
(3) b. The general trend is that the number of both men and women participating in the Olympics is increasing. This might be due to changes in events.
The percent of women participating is increasing although it was still only at 26% in 1988. Students may come up with other trends.
c. The trend of increasing participation was easiest to see on the bar graph. The trend about the increase in percentage of women participating was easiest to see in the table.
4. An appropriate plot is a scatter plot. There is a slight negative association between horsepower and gas mileage. As horsepower increases, mpg has a tendency to decrease.
a. Scatter Plot of MPG vs. Horsepower
45
x \.'.) x x CL ~ x ~30 x x Xx x x x x
x x x
90 120 150 180 210 Horsepower
b. Other factors affecting miles per gallon might be weight, driving style (fast, slow), city versus country driving, and options on the car (such as air conditioning).
c. Data can be obtained on factors related to the car, such as weight, but may not be able to be obtained on factors relating to the driver, such as driving style. Often, gas mileage is reported for both city and highway driving.
STUDENT PAGE 94
b. Do you notice any trends in the data? List the trends.
c. Explain one of your observations, or trends, and determine which display makes it easy to "see" your observation.
Practice and Applications
4, The data below show horsepower ratings and average miles per gallon for a selection of cars.
a. Construct an appropriate plot to see if there is any relationship between horsepower and miles per gallon.
b. What factors other than horsepower might affect the gas mileage of a car?
c. What additional data would you need in order to investigate the relationship between the factors you listed in part band gas mileage?
l:lorsepo-wc.r and MPG
Car Model Horsepower Miles per Gallon
Acura lntegra 140 31
BMW 535i 208 30
Buick Riviera 170 27
Chevrolet Corsica 110 34
Chevrolet Astro 165 • 20
Chrysler LeBaron 141 28
Dodge Spirit 100 27
Eagle Vision 214 28
Ford Mustang 105 29
Ford Crown Victoria 190 26
Honda Civic 102 46
Hyundai Scoupe 92 3~
Lexus SC300 225 23
Mazda Protege 103 ) 6
Mercedes-Benz 190E 130 29
Mitsubishi Mirage 92 33
Nissan Quest 151 23
Oldsmobile Silhouette 170 23
Pontiac Sun bird 110 31 Saab 900 140 26
Subaru Legacy 130 30
Toyota Camry 130 29
Volkswagen Passat 134 30
Volvo 850 168 28
Source: Journal of Statistics Education, Vol I, No 1, 1993
REPRESENTING THE SAME DATA IN DIFFERENT WAYS IIS

INFORMATION SHEET
lnlor1ning Others Materials: none
Technology: word processors (optional)
Pacing: variable
Overview
This lesson is a resource guide to help students become better writers in general and to communicate mathematical concepts in particular.
TeaehinC Notes
Writing in mathematics classes has not been emphasized over the years. Convincing students that you really do want them to write, revise, rewrite, edit, and so on, will not be easy. Share ideas with teachers in your Language Arts department. They might be able to give you some ideas about what to do to help students develop their writing skills.
The written part of this lesson will take only minutes to do. The time necessary for the remainder of the lesson is up to your discretion.
116 INFORMATION SHEET

INFORMATION SHEET: INFORMING OTHERS
STUDENT PAGE 95
INFORMATION SHEET
Informing Others
How do you write a good report?
What should you say in your report?
How long should your report be?
Write effective reports. W riting your project report does not begin after all the other work has been done. A good project report is
developed throughout the project. In her book Writing to Learn Mathematics, Joan Countryman uses a five-step process to analyze formal writing in mathematics.
Prewriting
In the early stages of writing, you are developing your own mind-set about the project. A journal, an activity log, and your team reports can be excellent ways to keep track of these early ideas about the project.
Drafting
As you move from developing these early ideas to a focus in your project, you can begin to produce early drafts of your report. These could include an outline of the report (just headings and brief phrases to explain the parts as necessary), rough sketches of graphs or layouts, or a concise statement of the problem and an outline of the procedures you plan to use in solving or investigating the problem. Again, a journal, a log, and team reports can help you during this phase of the project.
Revising
This phase of the writing process is actually ongoing and overlapping with the next two steps. You need to develop an attitude that the written word is as easy to reflect on and revise as
INFORMING OTHERS II7

INFORMATION SHEET: INFORMING OTHERS
STUDENT PAGE 96
II8 INFORMATION SHEET
the spoken word. Technology, that is, word processing, has helped develop that attitude in recent years. It is more difficult when you are doing your work by hand or by typewriter. In the case of your project, early revisions may have been major at first. You might have had three big ideas for your team's focus and then found that two of them really fizzled. Back to the drawing board! Find a new focus. Revising also includes checks on your progress-are you making progress toward your goals?
Later revisions may be more minor, restricted to changing words, changing labels on graphs, and so on.
Editing
This sounds like revising again, and it is. This time you are nearing completion of the project and are checking for big ideas that are important. As you read our draft copy, think about grammar, spelling, accuracy of displays, format of the pages, and the style points that will mean a high-quality report. The reader can be very easily distracted by errors in writing and might assume that such sloppiness carries over to the data collection itself.
Final Report
This is the final draft. You have read and reread. You have checked and double-checked everything to be sure totals match, graphs correspond, the conclusions are stated, and the sources of your data are well-documented. If you have a computer, save a final copy, lock the computer file, and make a backup disk. Print the report on your best paper with your best printer and turn in a professionally done, on-time report.

Teacher Resources


ASSESSMENT IDEAS
Overview
MATHEMATICAL CONTENT
The lessons of this module give you and your students opportunities to develop, use, and extend knowledge and skills of mathematics in the context of the data from real-world situations. Unlike other modules in this series, the focus of much of the mathematics will be open to choices, both yours and your students'. All of the modules in Data-Driven Mathematics are based on the four themes outlined in 1989 by the National Council of Teachers of Mathematics Curriculum and Evaluation Standards for School Mathematics:
Mathematics as Problem Solving Mathematics as Communication Mathematics as Reasoning Mathematical Connections
In addition, the standards specifically addressed in this module are:
GRADESS-8
Standard 5, Number and Number Relationships
• Understand and apply ratios, proportions, and percents in a wide variety of situations.
• Represent numerical relationships in one- and two-dimensional graphs.
Standard 8, Patterns and Functions
• Describe and represent relationships with tables, graphs, and rules.
Standard 10, Statistics
• Systematically collect, organize, and describe data.
• Construct, read, and interpret tables, charts, and graphs.
• Make inferences and convincing arguments that are based on data analysis.
• Evaluate arguments that are based on data analysis.
Standard 13, Measurement
• Extend understanding of the process of measurement.
• Estimate, make, and use measurements to describe and compare phenomena.
GRADES 9·1.2
Standard 6, Functions
• Represent and analyze relationships using tables, verbal rules, equations, and graphs.
Standard 10, Statistics
• Construct and draw inferences from charts, tables, and graphs that summarize data from realworld situations.
• Understand and apply measures of central tendency, variability, and correlation.
• Understand sampling and recognize its role in statistical claims.
ASSESSING STUDENTS' KNOWLEDGE AND SK.ILLS
Opportunities to assess students' knowledge, understanding, and use of these objectives occur daily as the class explores the lessons in the module. The following are ways you may assess students during and after this module. They are described in detail below.
• Peer Evaluations-Have students evaluate each other's work based on a set of criteria.
• Portfolios-Have students select evidence of their work and progress in notebooks or portfolios.
• Observations-You may record evidence in the form of observations. The observation checklist is described on page 122.
TEACHER RESOURCES IZI
<{
@ Vl c 0
·.;:;
-~ :0 :J c...
:J 0 E ~ vi
..9! re 0 @ ..... ..c Q")
·~ 0 u

• Journals-Have your students develop journal entries that constitute self-reflection and are appropriate for inclusion in a portfolio.
• Rubrics-Use a holistic scoring rubric to rate performance for whichever form of assessment you choose. This is described on page 123.
• Holistic Grading-Comment on general aspects of student performance and assign grades based on comments.
• Grading by Points-Assign points to certain components of students' final projects.
• Quizzes-You may obtain further written evidence by using formal assessments. Included in this section of the Teacher's Edition are short quizzes, which focus on specific knowledge and skills, and performance tasks, which encourage the use of mathematics in integrated, problem-solving situations.
PEER EVALUATIONS
Students can be a part of the assessment process. Place projects from another class (with anonymity guaranteed) around the room. Have the students evaluate the projects on overall clarity by rating them on a 1-to-10 basis. Use this as part of the grade. Groups can also make class presentations on their projects and have the others rate them on a 1-to-10 basis. Class members should be given a set of criteria for rating the projects. Here are some possible criteria:
• clear purpose
• use of graphs
• use of statistics
• clarity of presentation
• contributions by all group members
• ability to respond to questions
As a part of the process, students should record their ratings and their comments in terms of the criteria. These should be shared with the group presenting the project.
You might also want to have students write comments on other members of their groups. Some possible areas they might reflect on are how well each member:
• contributed ideas and information
~zz ASSESSMENT IDEAS
• acted seriously and maturely about the group work
• listened to others
• stayed on task
• did his or her fair share of the work
• was cooperative throughout the project
PORTFOLIOS
Portfolios are collections of student work that show . students' progress through the module. Included are assignments, worksheets, or other material students create. Students select materials to show how they have learned and progressed through the module.
OBSERVATIONS
Observation checklists provide a structure for you to delve beneath the surface of classroom activities and focus on how your students are demonstrating their knowledge, skills, interests, and attitudes. This is important for two reasons. First, you may use the information to give better feedback to students, parents, and others about the progress your students are making mathematically-this is important, in-depth information about students that helps determine their report-card grades. Secondly, ongoing observation ·plays a key role in instructional planning. When the textbook or curriculum guide forces you along its scope and sequence, you might take a path that does not fit your students. By observing your students' interests, understandings and misunderstandings, and skill development, you can tailor that curriculum plan to maximize their growth and achievement. If these checklists are readily available, you can keep track of student progress and at the same time demonstrate to students that the learning activities count.
To manage the entries, simply write students' names in the spaces on a record sheet like the one at the top of page 123. Then use the checklist to tally evidence about how students are doing on the primary objectives of the module. To tally entries for your class, you could use a three-symbol system: for example, -, +, and *.These can represent observations that indicate inadequate progress, adequate progress, and exemplary work. At the end of a section or grading period, the compilation of observations will present a visual rating scale. This scale can be factored into a grading plan according to an appropriate weighting system along with tests, quizzes, projects, and portfolio ratings.
<(
@) Vl c 0
·.,:::; ro -~ ::0
:::J Cl...
~ 0 E >, Q) Vl Q)
(ij 0 @ ..... ..c 01
·.:: >, Cl. 0 u

Name Number Sense
Student 1
Student 2 -+-+-++
JOURNALS
Reading/ Interpreting
--++++
Problem Solving
--+-
Journal entries are opportunities for student selfreflection. These entries are suitable material for portfolios. A form for a journal entry is provided on Activity Sheet 10, which can be used after students complete a unit or even individual lessons.
RUBRICS
You can build a holistic scoring rubric to rate student performance. An assessment system that includes observations, interviews, quizzes, portfolios, and performance assessments implies a different philosophy of measurement than would be applied in traditional grading systems. Students usually have to operate on a deficit model; that is, we test to see what students don't know, we do it often, and then we apply some weighted averaging to determine grades.
In contrast to that philosophy, the assessment system suggested in this module is one that focuses on what students can do. It values their work in progress, it views their work as being steps toward a solution, it emphasizes growth, and it focuses on the whole product, rather than the individual parts. This view of assessment recognizes that tests are really "ondemand" performances and that, in such a situation, it is important for you to have access to the processes the student is using to reach a solution. Unfortunately, many students are not used to leaving such traces of their thoughts in mathematics class. For students to do well in measures of performance, they will need to have practice showing their work, documenting their thought processes, validating their procedures, and defending their methods.
These are exactly the kinds of things the NCTM Curriculum and Evaluation Standards for School Mathematics emphasize in the first four standards. It is our job as teachers to help students to see the value in these activities and to inform students about the assessment standards that we will be employing to rate their work.
You will need to develop a scoring rubric for each type of assessment you employ. It helps to be consis-
Extension of Patterns
--+*+
tent within your own system and to any external system that may be used to measure your students at the district or state level. Here are some basic suggestions:
1. Use terminology that refers to the student work, not the student. For example, talk about a proficient response or an adequate response, not about an inadequate student.
2. Keep it simple. A 40-point scale is not going to be helpful. Remember the notion of measurement error. You will not add any precision or accuracy by having too many numbers in your rubric.
3. Be holistic. Although you may consider four or five characteristics of the response, don't let one of them be the overwhelming force.
The sample rubrics below may help you form your own scoring rubric for assessing final projects. But, remember, projects should be work in progress, so encourage rev1s10n.
SIX-POINT SCALE
0 = no evidence 1 = clearly inadequate 2 = some progress shown 3 = mixed but mostly inadequate 4 = mixed but mostly adequate 5 = predominantly positive 6 = exemplary
FIVE-POINT SCALE
0 = no evidence 1 =clearly inadequate 2 = low borderline 3 = high borderline 4 = clearly adequate 5 = exemplary
FOUR·POINT SCALE
0 = no evidence 1 =clearly inadequate 2 =marginal 3 = clearly adequate 4 =exemplary
TEACHER RESOURCES IZ:J
::i 0 E >, (jJ Vl
~ ru 0 @ +-' ..c 01 -~ o_ 0 u

HOLISTIC GRADING
You might also use a holistic form of grading by commenting on the following areas and assigning an overall grade from your comments: Graphs Explanations Organization of survey/experiment Following directions Group work Conclusion
GRADING BY POINTS
There are two possible ways to give grades to the projects. You may give points to each section of the project, such as cover page, question answered, and so on. You choose how to weight each section. A sample form for this type of grading is shown below. Or you may assign points by category, such as following directions, oral presentation, and so on. A sample form for this type of grading is shown at the right.
GRADING EVALUATION SHEET 1
Award points in each of these sections of the project.
_Cover page (name, participants, cover design)
_Question to be answered (well-written, clear)
_Sample surveyed or experiment (specific, thorough)
_Graph 1 (labels, title, explanation)
_ Graph 2 (labels, title, explanation)
_ Graph 3 (labels, title, explanation)
_Statistics (if appropriate)
Data
Conclusion
1. What are your main conclusions from this project?
2. What would you do differently if you were to repeat this project?
3. What additional work could be done on this project if you had time?
Total
Comments:
I:Z4 ASSESSMENT IDEAS
GRADING EVALUATION SHEET z Award points in each of these categories.
_Ability to organize procedures and follow directions 25 points
Comments:
_ Clarity of tables and graphs
Comments:
_ Quality of written report
Comments:
_ Quality of oral presentation
Comments:
_Additional points for creativity
Comments:
QUIZZES
25 points
25 points
25 points
10 points
The quizzes for the units in this module begin on page 125. As with other activity sheets in this module, these may be reproduced and distributed to students. The answers are on page 129.
:J 0 E >QJ VI
~ ro 0 @ ...... _c 01 -~ Q_ 0 u

UNIT I QUIZ
Censuses
NAME
:1. You wish to take a census of your school to find out how many students say the Pledge of Allegiance during morning announcements.
a. Describe your plan for carrying out this census. Be sure to define your population and to tell exactly how your plan will work.
b. Name two problems you expect to have while carrying out your census.
z. For each situation below, tell if the data set collected is a census or not. If you think it is a census, describe a method that will ensure that every member of the population will be counted only once. If you think it is not a census, explain why.
a. Marcus checks the price of the latest Boyz II Men CD at every store listed in the yellow pages of the telephone book.
b. Maria stops everyone coming out of the biggest grocery store in town and asks if he or she prefers paper or plastic.
c. A forest ranger sets a squirrel trap every night. If a squirrel is caught, it is weighed and tagged and then released. If a tagged squirrel is caught, it is released. The ranger figures that in a year he will have weighed and tagged every squirrel in the forest.
TEACHER RESOURCES :IZS
<i'. @ Vl c 0 ·.;::; ru -~ :0 ::J
CL
::J 0 E >, Q! VI Q!
ro 0 @ +-' ..c CTl -~ 0. 0 u

UNIT II QUIZ
Surveys
NAME
1. For each survey below, tell if bias is present or not. Explain your answer.
a. A telephone survey beings with, "How about those Red Sox! Think they'll make the playoffs this year?"
b. A police officer asks students in the eighth grade if they smoke or not.
e. A nicely dressed woman asks department store customers if they have eaten chicken this week.
Read the following article con~erning the baseball strike.
Minor Leaguers Set To Sign On
By Mel Antonen, USA Today, January 10, 1995
Minor league free agents are expected to help make up baseball's
replacement teams, and 39% say they will definitely or probably sign to
replace major league players, who have been on strike since Aug . 12.
Of 125 minor league free agents surveyed by USA Today, 25 said
they would definitely play and another 24 said they would probably play.
There are 416 minor league free agents, and the survey's findings
project teams ·could sign 163 players-or enough to fill about 6 f of the
28 major league rosters.
General managers say they can field replacement teams from within
their systems, without allowing top prospects to be used.
After minor league free agents, GMs will turn to minor leaguers with
less experience, recently retired players, college players and major lea
guers willing to cross the picket line.
Houston pitcher Greg Swindell says he might cross, but other union
players say no way.
"It was clear across the board that nobody was going to cross," said
New York Yankees catcher Mike Stanley after a meeting with 100 players
Sunday. "If you are wise about your finances, you should be pretty well
qualified to get through the year."
Source: USA Today, January 10, 1995
126 UNIT II QUIZ
<(
@ Vl c 0 ·.;::; ru
."=! ::0 :::J
Cl...
:::J 0 E >-"' \/)
..<!! ru 0 @ ..., ..c 01
-~ 0. 0 u

z. Answer ,the following questions:
a. What was the population surveyed?
b. How many people were in the sample?
c. How do you think the players sampled were selected?
d. What condusion was drawn from the survey?
TEACHER RESOURCES ~Z7
<(
~ c 0 ·.;:::;
-~ ::c :::i
c... .._ :::i 0 E it' VI QJ
Iii Cl @ +' .>:: C>
-~ 0 u

UNIT Ill QUIZ
Experiments
NAME
1. Emil is conducting an experiment to determine reaction time. He places a spoon in the middle of a table that separates two people, a man and a woman. The right hand of each person is placed flat on the table at the right of the spoon. Emil shuffles a deck of playing cards and turns up one card at a time. When the card turned over is a face card-king, queen, or jack-both persons attempt to grab the spoon. Emil records the results and the experiment is repeated 11 times or until one person has six spoons. The winner is the person who first collects six spoons.
Emil plans to conduct this experiment with the parents of ten of his best friends and report on the reaction times based on the results for males and females. Suggest ways that Emil could improve the design of this experiment.
z. Gail is experimenting with a method of predicting a person's height by measuring the person's wrist. To test the idea, Gail gathered the following data.
Males (Wrist, Height) in Inches Females (Wrist, Height) in Inches
(7 .125, 73) (5.875, 63)
(6.5, 70) (6.125, 64)
(7 .24, 71) (6.5, 63.5)
(7.0, 67) (6.0, 63)
(7.5, 74) (6.0, 66)
a. Use these 10 data points to make some generalizations about the relationship between the measurements of a person's height and wrist. Plot these points on a scatter plot and describe the relationship between the two variables.
b. Write a letter to Gail giving your opinion of this experiment and advice on how to conduct and report on the results.
1:&8 UNIT Ill QUIZ
<(
® Vl c 0 ·.;:::;
.~ :c
:::J a_
:::J 0 E ~ VI
..<!!
"' 0 @ ....., ..c en ·~ Q_ 0 u

QUIZZES: SOLUTION KEV
Unit I: Censuses
I. a. Plans will vary.
b. Problems that might arise include: Some students may be absent. Some students may be suspended or expelled. There may not be time to conduct the census. It may be difficult to collate the data. Some students may not be truthful. Some students may choose to not answer.
z. a. If Marcus calls every store and his population is stores in the yellow pages, then this is a census. He would have to keep a record to show that he called each store only one time.
b. Any result would be valid only for that store during that time period. However, it most likely will not be a census. Not everyone will answer the question. At times, groups of people might exit the store at the same time. It would be difficult to get to all people. The results really depend on the question Maria is asking and the population in whose response she is interested.
c. This is not a census. There is no way of knowing if all the squirrels have been counted.
Unit II: Surveys
I. a. This is a biased approach. Obviously, the questioner supports the Red Sox. This would make the respondent feel the need to answer that he or she feels the Red Sox would make the playoffs.
b. This statement also entails bias. Students are intimidated by the police. Since it is against the law for eighth graders to smoke, few would answer honestly.
c. There is no bias in this question or in the approach.
z. a. The population was the number of free agents, 416.
b. 125 were sampled.
c. There were a variety of ways free agents could have been sampled. They were probably called, but there is no information in the article about the process.
d. The survey concluded that there would only be enough players to staff about 6f teams using free agents.
Unit Ill: Experiments
I. There are many ways Emil could change the design of his experiment. They may or may not be improvements. • First he must determine exactly what he wants
to know. His question could be, "Who has the faster reaction time, men or women?"
• Emil would have to be sure the people he is testing have the same dominant hand.
• Age could be a factor, so he could control for age.
• Instead of dealing cards, Emil could ring a bell and have the subjects reach for the spoon when they hear the bell.
z. a. The "least squares" line that fits through these data is approximately: height= 26.2 + (6.3)(wrist measurement). This line can be used to predict the height of a person based upon the size of a person's wrist.
b. There will be great variety in the letters written. Look for some mathematical substance when grading them. You must use a holistic grading scale. Some points to consider are:
• All of the males in the study were quite tall. Could this make a difference?
• Are 12 data points enough to develop a pattern for prediction?
TEACHER RESOURCES IZ9
<(
@ Vl c 0 ·.;:::; ro
·" _o ::i "~
::i 0 E >, Q) VI Q)
"iii 0 @ +-' ..c Ol -~ 0.. 0 u

ACTIVITY SHEET 1
Unit I Activity: Taking Tour Own Census
NAM E
CENSUS QUESTIONS
Pass out this list of questions to every student in your class (or grade or school, if you wish to have a larger population). Assure the people you ask to fill out the questionnaire that their answers will be completely confidential and that only summary data will be reported. Be sure to tell them "thank you" for taking the time to fill out the questionnaire.
1. How old are you?
__ Younger than 12
12
13
14
15
2. What is your gender?
Male
16
17
18
19
Older than 19
Female
3. Do you plan to get married?
Yes No
4. Do you plan to have children? (If "no," skip to question 6.)
Yes No
5. How many children would you like to have?
1 5
2
3
4
6
7 or more
6. After high school, which of the following do you plan to do?
__ Attend a two-year college
__ Attend a four-year college
Go to a trade or vocational school
__ Join the Armed Forces
130 ACTIVITY SHEET 1
_ Get a full-time job
None of these
7. Of the following occupations, which one would you most like to pursue after school?
Doctor Hairdresser
Teacher Mechanic
_ Social Worker __ Carpenter
__ Lawyer Truck Driver
__ Computer Law Programmer Enforcement
Stockbroker Farmer
__ Firefighter None of these
8. Of the following occupations, which one would you least like to pursue after school?
Doctor Hairdresser
Teacher Mechanic
Social Worker __ Carpenter
__ Lawyer Truck Driver
Computer Law Programmer Enforcement
Stockbroker Farmer
_ Firefighter None of these
Source: "That's Easy for You to Say!" Department of Commerce, Bureau of the Census, August 1988
<i'. ® V1 c 0 ·.;::;
"' .>! ::0 :>
CL
:> 0 E >OJ Vl
..'!!
"' 0 @ ..., .<:: 01 ·~ a. 0 u

ACTIVITY SHEET 2
Lesson s: Selecting a Sample/Lesson 6: Studying Randomization
NAME
TABLE OF RANDOM NUMBERS
59718 77768 50032 53440 41359 33021 01938 86092 87426 80010 91977 35682 34043 26290 40447 12411 32837 12151 21227 81491 88224 92826 92683 66928 95518 70106 92397 62132 97206 26324 01288 56565 78378 72344 12566 58325 40257 93212 49208 51320 19483 45024 12857 46267 94007 98674 54199 29738 24084 91964
33652 12588 55326 05702 43815 61284 13606 65461 70415 91440 32207 57357 18841 61415 57755 46846 41422 35285 37870 55929 99945 87321 41676 70537 39314 45154 93823 14053 81888 11464 29773 64388 95180 80750 12815 77661 89578 42194 99329 21247 92329 55414 05162 94197 19267 68846 27895 12005 80292 49745
75834 71767 45378 40316 61259 13140 66115 61564 76757 62599 22755 89933 41019 18996 13005 31853 72795 22193 59897 62049 09056 73260 95209 33157 15608 37565 93590 85486 80932 76059 66250 96883 74585 74550 89984 28356 77938 69704 19034 19744 37052 83115 38995 52825 93308 75276 21274 48777 75400 62004
81653 74197 85789 50614 52742 48213 94759 80701 08234 44686 41417 37426 42282 34323 83341 38345 83018 25015 68282 94820 27862 25188 15227 90981 06296 86815 04322 44750 01554 91302 85083 13672 29208 17587 12217 24032 52318 83860 81936 29114 05649 48381 63320 11822 11590 75112 54027 56579 81397 14691
91654 28637 01627 24482 33119 29924 69390 85040 66927 63521 43540 82299 18928 35588 55113 78385 61536 49596 05202 40993 33276 99974 62800 97999 56683 61505 85617 32656 16834 88980 18139 96834 07488 32049 53532 12159 75508 10924 25298 96474 07403 42795 55422 49346 44612 61632 81241 04660 95163 16285
05374 34289 66087 74636 64247 73598 42730 79472 79834 72702 63121 17926 84377 16927 91950 26475 10086 61879 03475 64750 66148 59081 34743 69023 50306 63739 14717 32374 19119 96284 92153 23320 34180 78025 42391 35908 73996 49173 47360 92856 06629 93991 80847 49133 45105 34818 10122 31369 33312 94856
74784 07080 13104 64110 98440 56468 88959 67988 58764 70414 59043 74797 24791 65130 97918 99820 32673 44512 36847 14028 58572 79127 74870 47218 03752 92434 71791 28040 60536 37429 75069 76687 43795 50161 20794 95015 42376 33178 10265 03394 72258 09820 54814 84454 32761 59316 14974 80017 37524 25760
16186 64983 27652 53966 75826 16790 13767 52267 65505 56954 54047 17961 92967 27968 12463 85270 13763 96297 43279 93087 42301 36874 19357 14982 22806 69213 79929 48973 21969 28172 87940 43389 26009 52702 03148 70789 88539 19084 59200 88168 91551 24267 81423 17461 09300 11928 98793 97748 95430 11644
03166 69589 65596 56997 70092 63418 92825 91586 76847 51167 64280 45356 96248 79274 15733 72317 44107 80124 99627 44523 28464 37825 88800 20180 28989 75914 46882 28736 60408 63180 36861 76806 80789 30886 71013 56044 52405 81063 04283 41256 43125 34876 18177 22382 37920 77067 93319 29881 37050 32533
ACTIVITY SHEET 2 I3I
<i'.
~ c 0
·.;:o ru
.!:! ::0 :::J
0...
:::J 0 E >, QJ Vl
_9'! ru 0 @ +-' -'= 01 -~ Q_
0 u
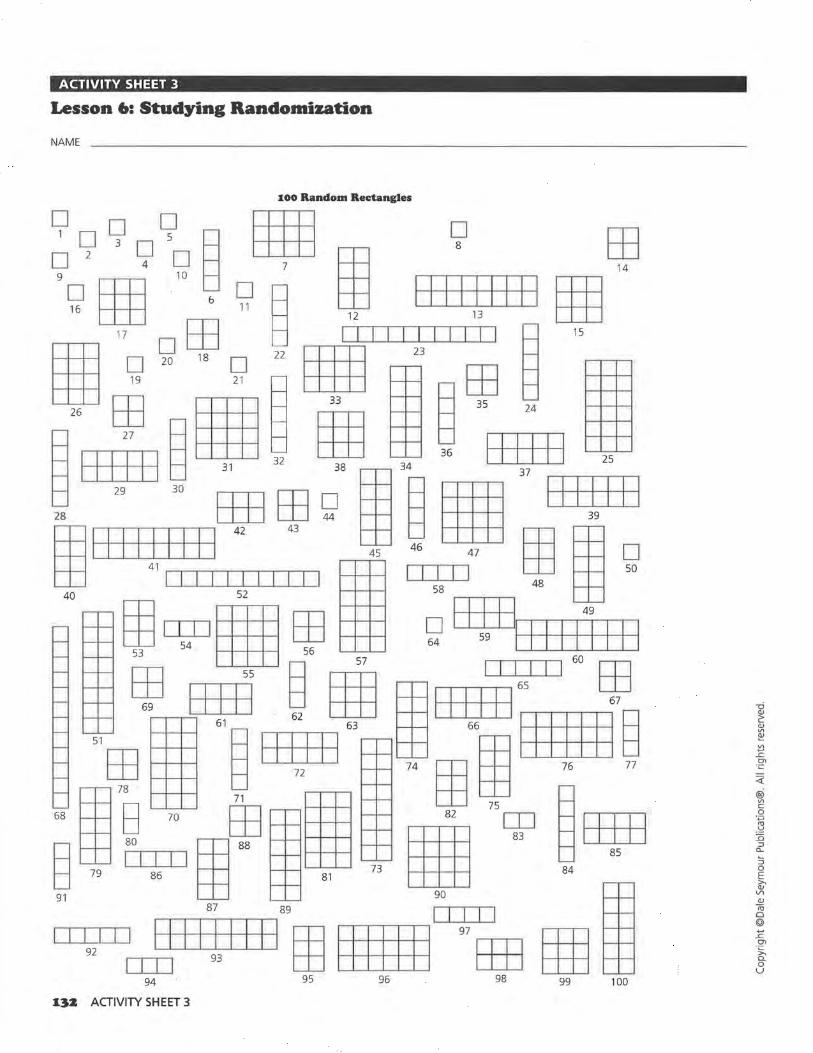
ACTIVITY SHEET 3
Lesson 6: Studying Randomization
NAME - ---------- - - -
i:oo Random Rectangles
9 99 09 El §±§ 9 EB 9
D ~ .~ ~ SJ 1
; 1 1 11 11 11 1 f++1 14
16 tljj 12 13 tljj
26 24 EB 33 35
29 30
[IIJ EB D I I I I I I I 28 [IIJ 44 39
40
E§ I 154
1 I EHE EB c ~ I I 1 1
4
111 I 53 ~ 56
51
EB 1 1 U 11 74 E§; " ,, 68 ~
7
~ 70 $ ~ 82
75 cp s~ § tij I I I I I EB ttij EErn ~ 85
,, ,, 86 EB 81 73 ~ 84
87 89 I I I l I I I 1921 I I [ 1 1 I I I I 1 1 ~ ~ 97 EEE f++1
I I I I 93 t±J t±J±ttj tljj 94 95 96 98 99 100
I3Z ACTIVITY SHEET 3
<(
® Vl c::: 0
·.;:::; m
.'=! :0 :>
0..
~ 0 E >Cl.I VI
Cl.I
"' 0 @ ..... ..c::: CJ)
-~ 0.. 0 u

ACTIVITY SHEET 4
Unit II Activity: Conducting Your Own Survey
NAME
A STATISTICAL SAMPLE SURVEY PLAN
Survey Title: ____________________ _________________ _
The objective(s) of our survey is (are); ___________________________ _
Based on our objective(s), we will ask the following question(s): ------------------
The target population will be: - ------------------------------
The number of people in our sample will be: -------------------------
To minimize sampling bias, we will select our sample this way: -------------------
We will field test our sample survey on this date: - -----------------------
We will survey this many people: ------------------------------
When we evaluated our field-test results, we identified the following problems: ------------
We then redesigned our survey in the following way:
Teachersignatureforapproval: _____________________________ ~
Date: _______________________________________ _
ACTIVITY SHEET 4 I33
<! @i "' c 0
·.;:::; rn
·'=' ::0 :J
0...
:J 0 E ~
Vl
~ ro 0 @ +-' ..c 0\ ·~ Q. 0 u

ACTIVITY SHEET 5
Lesson 1z: Measurement Variability and Bias
NAME
LENGTH BIAS EXPERIMENT
1. Cut out all the rectangles on these two pages. 2. Glue pieces a and b with back sides together. This is the "slide." 3. Now put pieces c and d together, back sides together, by stapling
them at the dotted lines on the front of piece c. There are ten places to staple. This is the "jacket."
• ~ ta ~
"' .c w ... c :I - 0..
"' I-z 0 a: LI..
u
134 ACTIVITY SHEET 5
~ 0
..0 re
"C Q)
E · ·;:: 0.. +-' c Q)
E Ol Q) Vl
Q)
. ~ Q) .£ +-' Vl re Ol
§~ - re Vl +-' re Q) Vl .£
· - +-' Q) "'C :2 Q)
'"in a:; 1! 0. ..., E cO ou Q) Q)
.~ ~ -_£
Q) ::::i £0 ~ >. S · +J .£ c +-' ::::i
5 'E >-re _u
'.j:; Q)
c .£ ::::i +-'
~ tii ·- > Vi 0 Q) c £::;
+-'
'5 0 Oc =o ~o
<! ® V\ c 0 ·.;::; f1J
.!=!
..Cl :J "-:; 0 E >, Q) VI Q)
cu 0 @ +-' L
°' -~ 0.. 0 u

ACTIVITY SHEET 5 (CONT.)
Lesson •2: Measurement Variability and Bias
NAME
4. Insert the slide, front side up, into the jacket so it slides left and right.
5. From the right side of the jacket, pull the slide out until the line on the slide appears to be the same length as the line on the jacket. Turn the whole thing over and read the ruler on the slide to find out what length you guessed.
w c -~ ~ u <( m
ai ... QI .c .:!:::::
:::s
"' QI ... QI .c ... "'C
"' vi QI ~ ci:: ......
c re o E ~ QJ Cl. Ill
"'C re OJ ...... .r:. Vl ...... • -- --- ---- .. -.. ... .. ----
..c
__ N
_ o
- co
= I.I)
= (Y)
- N
= E E E
u
ACTIVITY SHEET 5 135
<(
~ c:: 0
:~ ::0 :i
a,_
:; 0 E a;-
Vl
<II n; 0 © ... .r:: .2'
~ 0 u

ACTIVITY SHEET 6
Project Requirements
NAME
SELECT A TOPIC
Here are some ideas:
1. Make up an "event" on which to test people. For example, how long can you hold your breath? How far can you jump? How fast can you recite the alphabet?
2. Ask about some "like" or preference. Be sure you have two or three groups so you can make comparisons.
3. Do some product testing. How many kernels of popcorn are left in different brands of microwave popcorn? How many raisins are in different brands of raisin bran cereal?
SET UP YOUR SURVEY, CENSUS, OR EXPERIMENT
If you are doing a survey, make sure that every person gets an equal opportunity of being chosen (randomness). Make sure your questions are not biased. If you are doing an experiment, make sure you use standard testing procedures. Make sure you have some type of control group. Also do the following:
• Select a target population (survey or census) or a treatment (experiment).
• Decide how to gather your data. • Field test your questionnaire or experimental procedure. • Collect data. • Organize the data. Prepare graphs. . • Analyze the data. Write a statistical summary if needed.
PREPARE YOUR WRITTEN PROJECT
You need to write a report on your project. Here is one way to organize the report:
Page 1: Include the name of the study and the names of the participants. It should include some type of artwork that is representative of your study.
Page 2: Write the question you worked on; that is, what were you trying to find out?
Page 3: Tell how you selected the sample you surveyed or how you set up your experiment.
Pages 4, 5, and 6: You should have at least three graphs that help to answer your question. Each axis must be labeled. Each graph must be named. There must be a written explanation for each graph specifying what that graph is telling the reader. You will get bonus points if you include extra graphs.
I36 ACTIVITY SHEET 6
<(
@i VI c 0
·.;:::;
"' ·'=' ::c ::::>
c...
~ 0 E >Cl.I Vl
Cl.I ro 0 @ ..,, ..r::
°' -~ 0 u

ACTIVITY SHEET 6 (CONT.)
Project Requirements
NAME
Pages 7 and up: Include all statistics you have, including mean, median, range, maximum, minimum, if they are appropriate. Include all raw data.
Final Page: Write a conclusion.
1. List any findings or conclusions you made from the study. 2. Tell what you would have done differently if you were doing the
study over again. 3. Tell what else you could have done with this study.
ACTIVITY SHEET 6 %37
<(
@i Vl c
.. g .~ ::0 :l a_
:; 0 E >. Q) Vl Q)
<ii 0 @ +-' _c Cl ·~ 0. 0 u

ACTIVITY SHEET 7
Project Requirements Checklist
NAME
I. Preliminary Presentation Due Date. _ __ _
On a 4-by-6-inch file card, print the following information:
1. Your name and your partners' name(s) if you are a group. 2. What question are you investigating? 3. What is your population? 4; How will you gather your data? 5. Will you be using a survey? 6. How will you get a random sample?
U. Personal Progress Report Due Date ___ _
In a large envelope, organize the following items:
1. Your data in its original form. 2. A copy of any questionnaires or surveys you developed. 3. Graphs that helped you explore your data. 4. Computer printouts that helped you analyze your data. 5. A brief progress report typed or written in ink. 6. A list of any references that you used.
DI. F"irst Draft Due Date ___ _
1. Cover sheet with project title, your name, and the date. 2. A table of the data you used and the method that you used to gather
the data. 3. Graphs that reveal information about your data. 4. Analysis of the data. 5. Additional questions that your data generated. 6. Summary statement that answers your original question.
IV. F"mal Draft Due Date. ___ _
1. Report should by typed on 8.5-by-11-inch white paper. Please do not select a type that is hard to read.
2. All graphs and tables should be mounted carefully on standard paper and photocopied.
3. Your final cover sheet may be illustrated. 4. Provide clear and concise statement of your conclusions.
V. Evaluation
1. Organization and following directions 2. Clarity of tables and graphs 3. Quality of written report 4. Quality of oral presentation 5. Additional points for creativity
___ 25 ___ 25 ___ 25 ___ 25 ___ 10
Prepared by Gretchen Davis, Santa Monica High School, Santa Monica, California
I38 ACTIVITY SHEET 7
<(
@ Vl c 0
·.;:::; rn .~ ::0 :J
CL ~
:J 0 E if;' VI
ClJ Iii 0 @ +-' ..c 01
-~ 0 u

ACTIVITY SHEET 8
Writing a Statistical Summary
NAME
A statistical summary is a blend of words and numbers that tells the reader the following:
1. Where did the data come from and how were they collated? 2. What do the data represent? 3. Is there anything unusual in the numbers themselves? 4. What is the range? 5. What is the center? Describe it. 6. Describe the spread. 7. Are there any outliers? 8. What are the points of interest: where do they cluster and what do
they represent, where am I in relation to the data set?
Here is a possible format:
The data we studied came from ---------------
They were collected by ________________ _..
The greatest value ________ is at --------· The
least value is at --------· The average ________ 1s
________ .Half of the ________ are greater than
________ .The ________ in the middle are from
_ _______ to _______ ~
The outliers are ----------------------This might be because ------------------
Of particular interest is _ _________________ _
because
Source: From Home Runs to Housing Costs, ed. Gail Burrill, Menlo Park, CA: Dale Seymour Publ ications, 1994, p. 1 O
ACTIVITY SHEET 8 I39
<(
~ c 0
·.;:::;
"' .!:' :0 :::l
CL
:::l 0 E it' Vl <l! ro 0 @ ._, .r: Ol ·~ Cl. 0 u

ACTIVITY SHEET 9
Portfolio Assessment
NAME
Use this sheet after you have completed the module. As you complete your portfolio, be sure to include work that shows your ability to:
• design a survey or experiment to collect information about a clearly stated question or problem
• conduct a survey or experiment, collecting accurate information related to your question or problem
• organize, display, and analyze the information collected through your survey or experiment
• report clearly and effectively about your findings and to support those findings using data, mathematics, and reasoning
• reflect on the quality of your work in this module and on your understandings and skills
I40 ACTIVITY SHEET 9
~ @i Vl c 0 ·.;::;
"' .Id ..c :::J a_
::; 0 E >, Q) Vl Q)
<ii 0 @ ...., ..c Ol ·~ a. 0 u

ACTIVITY SHEET 10
Journal Writing
NAME
DATE
1. My favorite lesson or activity in this unit was: -------------------- ----
Because: _ _____________________________________ _
2. The mathematical idea I feel most comfortable with in this unit is: ----------------
The mathematical idea that I need to work most on is: ---------------------
3. The statistics idea that I learned the most about in this section is: ------------- ----
I need answers to these statistical questions: -------------------------
ACTIVITY SHEET 10 I4I
<{
@ Vl c 0 ·.;::;
-~ ::0 :::J
(l_
::; 0 E >. QI VI QI
ro 0 @ +-' .r: en -~ 0. 0 u

The 1990 Census Questionnaire
This booklet shows the content of the two main questionnaires being used in the 1990 U.S. Census. See the explanatory notes on page 2.
CENSUS '90
OFFICIAL 1990 U.S. CENSUS FORM 0
Thank you for taking the time to complete and return this census
questionnaire. It's important to you, your community, and the
Nation.
The Jaw requires answers but guaranlees privacy.
By law (Title 13, U.S. Code, you're required to answer the census
questions to the best of your knowledge. However, the same law
guarantees that your census form remains confidential. For 72
years-or until the year 2062-only Census Bur~, m~s can
see your form. No one else-no other g~1 \) !y,\Jolice
department, no court system or~r~ % enniued to see
.i this confidcnli~\'\t ion un\::9 1stances.
,. ((\\ffi•u\J0~help. ~ \\ \~)-~, on the next page the names of all the people who
\ \) D live in your home. Please answer all questions with a black lead
(D\ \ ~ pencil. You'll find detailed instructions for answering the census in
~l ~ ~ ~ \\ I \)\> 1 the enclosed guide. If you need additional help, call the toll-free
~~~···· 0 rn' \') I telephone number to the left. near your address.
I"' w ~ ~ 1..... ~ Please answer and return your form promptly .
..1:1 l! g 6 ~ Complete your form and return it by April 1, 1990 in the ~~~o ~ ~ lR ~ 'f cs.. postage-paid envelope provided. Avoid the inconvenience of
:z; <li .!3 ..... "
"' Q) ::I
"C "' ~ ·a ~~o u d .... u~ lS d ::I >-....-< o.g 0 .0 •
~ "' .-;::~ ...... 0 Q) ;::::q~:a >-. g. tQ .0 c:i..
"' "' ~.-;::< ..... ::I
"' "' ~:a~ ~ d
Q) 5: so u • •
I4Z THE 1990 CENSUS QUESTIONNAIRE
o having a census taker visit your home. ·~ u
<;::: ';:l
iii '.9 Again, thank you fro answering the 1990 Census.
Remember: Return the completed form by April l, 1990.
Para personas de habla hispana (For Spanish-speaking persons)
Si listed desea un cuestionario de! censo
en i;;spafiol, Harne sin cargo alguno al
siguiente numero: 1-800-XXXXXX
(o sea 1-800-XXX-XXXX)
U.S. Department of Commerce BUREAU OF THE CENSUS
FonnD-61
OMB No. 0607-0628 Approval Expires 07/31/91
<i: @i Vl c 0 . .,, .~ ::0
::::J CL
::::J 0 E it' V\ Q)
"' 0 @ +-' .r:: .Ql >-a. 0 u

The I990 Census Questionnaire
Page 1
The 1990 census must count every person at his or her "Usual residence." This means the place where the person lives and sleeps most of the time.
la. List on the numbered lines below the name of each person liviiig here on Sunday, April 1, including all persons staying here who have no other home. If EVERYONE at this address is staying here temporarily and usually lives somewhere else, follow the instructions given in question lb below.
Include
• Everyone who usually lives here, such as family members, housemates and roommates, foster children, roomers, boarders, and live-in employees
• Persons who are temporarily away on a business trip, on vacation, or in a general hospital
• College students who stay here while attending college
• Persons in the Armed Forces who live here
• Newborn babies still in the hospital
• Children in boarding schools below the college level
• Person who stay here most of the week while working even if they have a home somewhere else.
• Persons with no other home who are staying here on April 1
Do NOT include
• Persons who usually live somewhere else
• Persons who are away in an institution such as a prison, mental hospital, or a nursing home
• College students who live somewhere else while attending college
• Persons in the Armed Forces who live somewhere else
• Persons who stay somewhere else most of the week while working
Print last name, first name, and middle initial for each person. BEgin on line 1 with the household member (or one of the household members) in whose name this house or apartment is owned, being bought, or rented. If there is no such person, start on line 1 with any adult household member.
LAST FIRST INITIAL LAST FIRST INITIAL
1 7
2 8
3 9
4 10
5 11
6 12
lb. If EVERYONE is staying here only temporarily and usually lives somewhere else, list the name of each person on the numbered lines above, fill this circle and print their usual address below. O DO NOT PRINT THE ADDRESS LISTED ON THE FRONT COVER.
House number Street or road/Rural route and box number Apartment number
THE 1990 CENSUS QUESTIONNAIRE I43
<(
@i "' c 0
·.;::; ru
,',,! _o :::J "~
:::J 0 E it'
Vl
~
"' 0 @ ...., _c 01 -~ Q. 0 u

The 1990 Census Questionnaire
I QUESTIONS ASKED OF ALL PERSONS I Pn~e2 PER:1uN l
PLEASE ALSO ANSWER HOUSING QUESTIONS
PER;mNZ
Pleuc ftll one column + for each~ ll&ted In Que-tlon la on pqe 1.
2. How Ill tht11 penon related loPBRSON 17
Fii ONE circle for .e'aeh imaon.
If Other relotlveof pem>n ln col~mn 1, mt circle and j)yi!lt exact relatt<>nahlp, such as moth9r·ln·!llW;.grandJ>8rent, son·in·law, niece, c:ous1n, and so on.
3. 8eic fill Ol'IE clrd~ for each pmon.
4. Race Fill ONE circle 101 the race that the pereon oon$1der8 hlm1141H/hetNH to·be,
11 lndlan (Amer.}. pl1nt the name or the enrolle<I or prlnclP«l tribe.
If Other Asian or Pacific lsla,nder (API), print one group, for <Ill.ample: Hmong, Fijian, Laottan, Thal, Tongan, Paklltanl, Cambodian, and so oo, -------t-lf Oth:er race, print race . -------
5, Ageandyurofblrth
a. Plint each persQn'.$ oae at last ·blrlhday. fill In the matching circle below each box.
b, Prlnt each person's yeec of birth 1>nd flll the matching circle below each boK,
6. Marital a ta tut
Fiii ONE circle tor each pemn.
7. It thl• person of Spanteh/Hleponlc origin?
Flll ONEclrole for each pe~n.
U Yea, other Spllftleh/Hllpanlc, pmtonegroup, __________ ,_
FOR CENSUS US~
I44 THE 1990 CENSUS QUESTIONNAIRE
:;TAHT in thl& column With the household member [ot one of the members) In whose name the home Is owned, being bought, or rented,
1f thet.i ls no such person, start In this column with ;ru •adult household member.
• 0 Male 0 Fe1nale
o White o Black or Negro O Indian (Ame.i .J (Print 1he name of the
,!'!!!'21!!'~..:'!El'.!.l)_C!P~U!!~J; .. -----, I : ~---- ------ - -----~----- ~- ~ v UHtmo
0 Aleut Asian or Paclf1c !slonder (API)
0 Chll'le"' o Fiiipino •
0 Japanese 0 Asian Indian o Samoan o Hawaiian
a. Age
I i I I L __ ·_L_ .. J __ ~J 000000 101010
2 0 2 0 3 0 3 0 4040 :; v !> 0 bObO
7 0 7 0 8 0 6 0 9 0 90
0 Nowma1t1ed 0 Wtdowsd 0 Divorced
b. Year of birth
1 i I ' j I I I I
~- --- ----I..---L---~ t•BOOOOO
9 0 1 0 1 0 2 0 2 0 3030
• 4 0 4 0 5 0 .; 0 6 0 6 0
0 0
7 0 7 0 8 0 8 0 9 0 9 0
Separate<! N~er married
0 No (not Spanlsh/Hlepanlcl 0 Ye$, Mexican, Mextcen·Am., Chicano 0 Yes, l'uerto mean • 0 Vil$, C<1ban 0 Y1111, other Spenish/Hl91>anlc
(Print one group, for example: ArgenUn~, Colombian, Dom\nlun, Nlcllraguan,
r~~~'?!~.!2~.!'1ar<1.! ~'ld_~2~·l"" - -i t_ _ _____ _ _______ J
v
0
Mkld\aklllltl
If a RELAllVE of Pereon l:
0 Huibond/wlfe 0 Brother/sister 0 Naiural-born 0 Father/mo1her
or adopted 0 Grandchild son/daughter 0 ~.t..h..!l.".!8_laj~~.:J.,
0 Stepson I I : ------~!~~~g~l!~------~~~~~~~~~=~~
If NOT RELATED to Per$on l: 0 Roomer, boarder, 0 Unmarried
or tester cnlld partner u Mouaemare, • u vtller
roommate nonrelaHve
0 Male 0 Female
0 White 0 BlackorN"i!'Q O Indian (Amer.) (Pdnt the name of the
:'°~~l~~~!.~'l'!.C.!Jl2Lf!!~)f- -------,
~--- - --- - --- - - - - -----------~ u "'klmo O Aleut Aelon or Paclfle Islander (API)
0 Chinese 0 Japanese O Flilplno • 0 Asian Indian 0 Hawaiian o ::iamoan O Korean 0 Guamanian o Vietnamese 0 Other API 7
r------- --- -----------· ·--, I I I I
0 oiher"raciiPltiilrace>:.i ___________ J
a Age I I I
·I l I - --'-- - .,, __ ... ..J
000000 1 0 l 0 l 0
2020 3 0 3 0 4 0 4 0 5 0 5 0 606 0 70/ Q 8 0 8 0 9 0 9 0
0 No111mo1rlsd 0 WldC>W8d 0 Divorced
r
\>. Year of birth
/i i ' I I I I I
.--;L8-~..!~-~J~-~J 901010
2020 3030
• 0 0
4040 5050 bUbU
7070 8080 9 0 9 0
Sirparated Never marl1ed
0 No [not Spanlah/Hlapanicl 0 Yei, MeKlcan, Mextcan·Am., J;.:hlcano 0 Ye$, P11erto Rican 0 Ye1, Cuban 0 Y.is, other·Spanleh/Hlepanlc
(Pltn1 one group, for~ample : AfgenHnean , Colombian, Domlnlclln, Nlalt<igu•1o, ~~~j~r~J!'~~~~!~~-o!'J-J ____ ,
I ' t I L--- ---~- - ---- ---- -------J
0
0
:::J 0 E ill' l/)
QI (ij 0 © ._, .s= CJ)
-~ 0 u

The %990 Census Questionnaire
ONPAGE3 -------_.~ PERSON3
IlaRELATNEofPerson 1:
0 0
Husband/wife 0 Brot';."r/slster Naturol-born 0 !'other/mother or adopted 0 Grandchtld son/daughter 0 g!.h~!.!~!~H.~~=!'
O Stepson/ ·I I -----·--· !·~~<!.~:'.!!~'!"._ _____ __!;;===.:!
If NOT RELATED to Person l:
0 Roomer, boorde?, or foster child
0 ~~::i~~~~· Ill O Mole
o White
0 Unmamed pnrlne'I'
0 Other nonrelattve
0 Female
PLEASE Al.SU ANSW£Jt HOUSING QUESTIONS UN PACil:.' 3 PERSON 4 PERSON 5
If a RELATIVE of PotSon 1:
0 Husbood/wile () Naturol·born
0 Brolhar/sl1to1 0 Folher/mothez O Grandchild
0 ~~!.'!~1~!!~·--'1 I l
l. ..... -..... ;;: J
or adopted son/da0ghler
0 Stepson/ tt~pd•u$)er
If NOT RELATED to •-• 1:
0 Roomer, boarder, 0 or !osier child
Unmarried p;irtner
0 Male
0 Olher n<>nrelatl\le
o Female
IfaRELATlVEolPmon 1,
0 Husband/wife 0 Brother/sl&ter o Na1ural-born o Fothet/mother
or adopted 0 Grandchild son/daughtei 0 9!1·~~!•!•t1Y!.J,
0 Stepson/ I I -----~~•ush!_o~ _____ .!.;..;..=·:::.:.;..:.-;! H NOT RELATED to Person 1:
0 Roomer.boarder, O Unma"1ed or foster child pattner
O ~~~~~~· • O ~~~relative o Male O Female
PEHSON6
U •RELATIVE of Per•on l:
0 Husbond/wlfe 0 Brolh"1/ol.ter 0 Naturol·born 0 Fa1her/mother
or adopted 0 Grondchtld son/doughier 0 pi
1
__ h.!!t.!!!~~y~_,
1 0 Slepson/
- - -- -~~P.~".ll~~"!: ___ - .. l·: "'~·=: _,._-::_ I! NOT RELATE;D lo Person 1:
0 Roomer,bo.eirder, O Unmurrled odoster child partner
o tt:,~~~i~ • o o~~":re1at1ve o Male 0 Femo!e
; I 0 Black or Negro : 0 lndlon (Amor.) (P:rlnt "'"nn ' .fXPL.AN;t..TO.RY. N'OTES' '
unro~•d or p1lnclpal lrtbc .) ' - • >ilntlhtnome of the
lpol lrl":!J f _____ 1 !-· ··--·---·------- Tpis .,b.eoJd.et.sl;lows tf:\e'·.c6ntentpft he two 1990. c·ensu.s, questle1:ma!~e!s t;>elng , _
o i!SkiriiO' __________ .. ___ ~eJl,vered by maJI~ The centent at.these forms was determined-after rewlew ·of:the . ------··--J 0 Aleut Asion OJ Paclftc bland •• 1 HS0 cenSUJM}xlierierlce: e'xtim~ive cansultation 'with ·A'lany·governmemt~and . : e1fldil•nd111 (APO
private'Users of census data, and a se~ies ·of experfm'ehtal eensuses anid·survev.s·in: ° Chi,..,.. • 0 J•> wh!Gh·varieus alternatives were tested. _ - - . , · 0 Jopan .... 0 Filipino 0 All . 0 A•lon Indian 0 H•w•11• 0 0 5•• • Two prfncipaj twes ofoata~coll'e~tlon' f<$rtns -" ~ar 1 OO~perceh:t:qu~stlo~1nal~e (~r ; o somoao
o Korean OO OtlGu. ·. '~short for.rt\~.') and, 8 s·ample.questiontlalre (er "leng·form'.1') - ar~ ·beirug Ote_d Jn o Guomani.n O Vl•lnomOff . h , E H b .. . Id' . , . f h ,.. t" . i · () OtherAPl7 ·--------- --------- ,t ~-ce.nsua .• . ac . o(Jseuo .rece1ve.s:ooe_q .t e ~~e.ques 1onna res. . . . ------··--· ·-]
•01--... -------~··--1·:) ·• 0h~rHO"fm ..;..: Thi~ q. µe~i'onnair.e .contalns 7·populatiQri questions andJ7 h~usin"' · : ·,, --- ~ · - ------o th•11•~ {Ptlnt race "! . · . , • · · , . .., . "" ' . r&<A1)'-"
1---:-------,-,-,,.,.--,.,..i, '.'q~e~tlo11s,, snown en P8Q9S 1- 3 of this· booklet; <:>n axierage ... abo11t.5 Im ev.~ry 6 . '.' r..,....--,,--,.---1
•· j9' : i ! i../v~, o1~ ·b:auseh,old~ Wl!l · r_ec~lve ~h~dlh.?rt fer~. ~o~ the average househ~lcl, .thiEs for.m will , : • ~vfarof ~nh : ,
! ___ L__~-- ' •. _J___ tjlke a,nest1mat~a 1.4 m1~utes.to c~mp_lete. , :· , l__J __ _ J. __ J 000000 101010
2 0 2 0 3 0 3 0 4 0 4 0
1 • so LQng fo1m - .Tnls questfonnaire has-all.of.tlie shart~form ques.tlons P.lius) :i.c:ius.ln'Q ~ s o o o o o 9 o . ·ques,tl.oriS:H8 thr,o.ugh H~~. _shovyr;i on p~g~s 4. an.d 6,/~nd populati9n .q1u~s.tiQQ~ ~ ' 9 o i o 1 o
Go 5 o 6 0 6 0 7 0 7 0 8 0 8 () 9 0 9 0
• Jhrnogli ·33,.shown 011 'p.e1ges:6-and·7.t Ttie . 11.0A.ulati0n ;q~1estior:isar~·Terpe~t~c;I fot 2 0 2 0
_. ·each ·rtrember of the house.hold btitth~se ·pag'fJS'.werenat. r.ep'r.oduced im this.· _. · ., . ! ~ ! g . t>oQklet .. Aslatistic.aJ sj.imple of.aAAroxlmate.ly l ,in.every..6h6useholds;wilt.recerve · • 5 0 5 0 · .therlei:ig .. form. for ttie; average household, tlills term witrtake 11n estimeted 4-3 .• · 6 o 6 o
rl'linutesio~complete. · · . . : . ; . . .. : 1 o 1 o - .. 8080
An ios.:truotipn guide .accompanies eacn questionnaire to help toe respondents = 9 o 9 o
0 Now nior~ed 0 Widowed
c~mptete '.t~e:'.f or~ •. aiid a _pr.eaddressed envelope is providec;I for returniing the . ~ ~: que.~tonl}a.ir.a'. ... · ; ' · , . .. 0 Seµoroted
0 Nevot morri•d
,F.01 :actdii i(mal info~matio~ a~.outt~e ., ~90 ·u .$. ·¢ensus, please ...;,tite tltl~ Dir~ctor; , B~r.e~u Ofthe C1'i:i~u~, yv.~shmgwn, DG 292·33-. · , ' · · · · . .. Hl•l'l'•~cl
0 DJvor<:ed
.:uclcan·An1., Chicano 0 No (not Sponlsh/Hleponlcl 0 Voe, Mexlc•n, Mllll<M·l\m O Yes, Puorto Rican • 0 Yes, Cuban
'---- ....... --..,_.....,.~--·"""'"""'.,.,,......,•----~--,-~ _ _,,_.,,...,,,,,.,..,.,,."""'.....,•--~~~,,-.....,,.-....,.,.,..,.,,.....,.""""
O Yes, Cubon 0 Yes, Cub•n 0 Ye., Cuban 0 Yu, olher Sponl,h/Hlspanlc
0
0
ll'linl onagroup, !01 oxomplo: Argcmflnean, Colomb! ·~. Domllll<M. Nfca:oguon,
[~~~~·~~~:~~=~~].~:~~]
0 Ye., other Sponish/Hl•ponlc 0 Yes, other Sponlsh/Hl.-ponlc 0 Veo, other Sponlsh/Hlsponlc
0
0
[Prlnlono fiCOup, lor .. Mtplo: Al!lenllnean, 1f'dn1e>n~grot1p 1 loro•omp!o:A'9J'nllnto11, 11'<1111 on• omup,101 Hl>mJ~ :Ar9"ntl11ton Colomblan, Domt1lleon, N!«•og••n. ~ ..... Domlnk:on, N~6!<1911•1< , ColornliW1, DonUn1con. Nk•1ogu•n, ~mdonn. Sponli>rd, ~~~-°.:':!:]· ·--, ~~l41d, ·~~!'!!J-, --, ~~'!12'-!'l·-~~·~~,_·~~!0-"1'.:!.-,._1 i. .... -- .. ·--~--------- .. --J l.. __ .. __________ I !.._ __ . _____ .. ___ ____ _____ _
0
0
0
0
THE 1990 CENSUS QUESTIONNAIRE .145
<(
@ Vl c 0
·.;::; ro
·'=' ::0 :J "-:J 0 E >. <lJ
V\
_.<!! ro 0 @ .., ..c Ol ·~ Q. 0 u

The I990 Census Questionnaire
I QUESTIONS ASKED OF ALL HOUSEHOLDS I .----=pE=R=s=o=N~7 -----. NOW PLEASE ANSWER QUESTIONS H1A-H26 FOR YOUR HOUSEHOW
.LMl.name
rrrHninne M'<l'cllelnltial
If a RELATIVE of Person 1:
0 Husband/wife 0 Brother/Sisler 0 Natural-born 0 E'olh•r/mo1her
or odopled 0 Grandchild
son/ daughter 0 ~l_h~!_ !.•l•_!i~~1 0 Stepson I 1 1
-~ ..... -.. ~~?~~~UiJ~~~-----l::::~::-;:·:.:::.:::~ If NOT RELATED lo Person 1:
0 Roomer, boarder, 0 Unmarrled or fo.;l<lf child paflnor
D Housemate, o Other roommate II nonrelallve
0 Male 0 female
O White O Black or Negro 0 lndi•11 (Amor.) (l'tlnl lho0narno0of 1he
Hla. Did you leave anyone out of your llst of persons for Quefltion la on page 1 because you were not sure lf the person should be llsted ~ for example, $0meone temporarily "'way on a business trip qr vacation, a newborn bab11 sttll In lhe h()Splhll, or a person who st"'Y8 here once in"' while and has n<> other home?
0 Yes, please ptint the name(s) 0 No
antl reawnls). "7
b. Dlb·you include anyone In your list of persons for Question la on page 1 even though you were 1101 sure
• that the pereon should be listed - for example, a visitor who Is staying here temporarily or a person who uoually lives somewhere elte?
0 Yeo, pleose print the nome(s) 0 No and rt1aoon(s). "7
r ~'.:'.'2~ _ '?! .!'!.1~~~~! .'!I~ ~ J- .. ____ , H2 .. Wh lch best describes this building? Include all 1 1 ap~tttnenmt fh1l51etc. 1 even If vacant. L _______ _____ ___________ J 0 A mobile homeortrailer •
o Esl<lmo Al 0 A one-lamily houoo de!a.ched from any other house
O eut Asian or Pacific Islander (API) 0 A one.family house attached to one or more houses
o Chin••• o Japanese 0 A building with 2 oparlmen l$
o Filipino • o Asian Indian 0 A building with 3 or 4 apartments o Hawaiian 0 Samoan 0 A building with 5 to 9 apartments o Korean o Guomanlan 0 A building with 10 lo 19 apartmenls o Vletnames.i o Other API
7 0 A building wilh 20 to 49 apartmanls
,---------------- . ,, 0 Abuildlngwith50ormoreaparlmenl.s
If this ls a O!llM'AMIL Y HOUSE -H5a. le thi5 houi;e on ten <>r more acres?
O Yes 0 No
b. Is there a buslne118 (such asa store or barber shop) or a medictl offlte on this property?
• () Yes o No
Ansuier only J[ you or someonu in th1$ l>ousehoJd OWNS OR IS BUYING tl>ls house or aparl.meril -
H6. What Is the value of thi& property: that ls, how much - do you thin~ this houire and lot or <.:<>ndominium unll
would •ell for if it were for sale?
CJ L.,..1han $10,000 O $10,000 to $14, 999 0 $15,000to $19,999 O $20,000to $24,999 o $25,000to $29,999 0 $30,000to $34,999 U $35.000to $39,999 o $40,000to$44,999 0 $45,000to $49,999 0 $50,000 to $54,999 0 $5$,000 to $59,999 0 $60, 000 to $64, 999 o $65,000 to $69,999
O $70,000 to $74.999 0 $75,000 lo $79,999 0 $80,000 to $89,999 O $90,000 to $99,999 0 $100,000 lo $124, 999 0 $125,000 to $149, 999 0 $150,000 to $174,999 O $175,000 to $199.999 u $200,000 to $249,999 0 $250,000 to $299,999 <) $300,000 to $399, 999 0 $400,000 to $499,999 0 $500,000 or more
Arlswer 011/y ff you PAY RENT for this house or ap•rtmenl -H7a. Whatisthe monthlyrent?
l ' O Olher
o olh••••;;;( .. Plir.i·;.;~·~·)·:1--- --- ---J •------------------------1 H3. How many rooms do you have In this hou11e ornpariment?
o l.<lss lhan $80 0 $80to$99 0 $100 to $124
0 $.~75 to $399 o $400 to $424 0 $425 to $449 o $450 to $474 0 $475 to $499 o $500 to $524 0 $525 lo $549
i--._- A.,.g-c-----.,...,b-."'"y""c-or-o"""f"'b_lt..,.lh----i Do NOT ~ountbnthrooms, porehes, bnloonics, foyers, halls, o $125 to tn49 o $150toU74 () $175to$199
i · i i i j i i 1 i or half-rooms. I I I I I I I I
L~~ M!...~ ·-~!~. ~~·~ -· ~· - · -~--· -- _: -·~ "J~ . .,.~ .. ) 0 1 room • 0 4rooms 0 5rooms O 6 rooms
O 7rooms 0 8rooms 0 9ormort1
000000 101010
2 0 2 () 3 Q 3 0 4 0 4 0 5 0 5 0 6060 7 0 7 0 8 0 8 0 9 0 9 (J
0 Nowmarrted 0 Widowed
0 Divorced
i •sooooo 9 0 1 0 1 ()
2 0 2 0 3 0 3 0
• 4 () 4 () 5 0 5 0 6 0 6 0 1 0 7 () 8 () 8 () 9090
0 Separated 0 Never marr~ed
0 No !not Spanieh/Hi•ponic) 0 Yes, Mexican, Mexican-Am., Chicano 0 Yeo, Puerto Rican • 0 Yes, Cub~n 0 Vos, other Spanish/Hispanic
0
0
(Pl1nt one group, for exomple:Argenllnean Colombian, Dominican, Nicaraguan, ~~~~~~~~.!?~ll_kl~_'.'~<!_~_0~1., __ ~ : . J L---~-~~----------------
0 2rooms 0 3rooms
o $200 to $224 • 0 $22& to $249 () $250 to $274 room~
H4. I~ this hquse or apartment - o S275 to $299
0 Owned by you OT someone In this household with a mortgage or loan? •
O $300 lo $324 o $325 to $349 0 $350 to $374
O $550 to $599 0 $600 10 $649 () $650 to $699 o $700 to $749 0 $750 to $999 O $1,000 or more o Owned by you or someone In this household free
and clear lwlthoul a mortgage)? 0 Rented for casl1 t~nt?
b. Does the mo0nlhl11 rent Include any meals?
0 Occuph!d without payment of cash rent? 0 v ... o No
FOR CENSUS USE A. Total ~ Type of unit
petsons G.DO ~ Monlh i vacant
0 L<l&SthM l O 6 up to 12
ID • Occupied Vacant
i I ! O Flrsl lorm o Regular 0 1 VP to 2 0 12 np lo 24 L ___ L __ J 0 Conl'n () Usual home O ZuptoG O 24 ormorc [J_LLli J_J __ LL.!" _ _!
0 0 t 1
'.l . '{-
5 (;
? 8 ')
t--------•_lse_w_he_r_e-i E . C<:>mplete oft~( 0 (-)0000,10")~)<)
TllltXJ:ll.Xl Cl. Vacancy statw; o LR O TC o QA JIC l
O For r•nt 0 For saos/ O For sale only rec/ occ 0 Rented or 0 For mlBrant
sold, not worke1s occupied 0 Other vacant
C2. lo this unit boarded up?
0 Yes o No
0 P/f 0 RE O I/T O
~- -~~-~ ... ~~--'.: _:~.. . 0 PO 0 P3 o P6 '.°> 0 Pl () P4 0 IA JIC 2 G
O P2 0 PS 0 SM 0 ?
F. Cov.
0 l b () I ~ () 7 () Hl
5 5 5 5 5 5 5 5 5 5 G G G G G G G G G G ? ? ? ? ? ? ? ? ? ? 8 8 o 8 8 8 8 B o 8 q q q q q q ') ') ') g
I46 THE 1990 CENSUS QUESTIONNAIRE
<{
@ Vl c 0 ·.;::;
"' .~ .0 ::l
(l...
::l 0 E >, Q) V)
~
"' 0 @ ..., _c Ol ·~ 0. 0 u

The •990 Census Questionnaire
QUESTIONS ASKED OF A SAMPLE OF HOUSEHOLDS l'age4 PLEASE ALSO ANSWER THESl:! --·
H8. When.did the1person•lioled·ln·column l on ' Ht4. Which FtJEUs.u .. d·MOST:for heatin1rthl• M20. What are tbe yearly-oosw.of.utllilles and page 2 move Into lhi• hou•e·or apartmmt? house or apartment? fuels for this house or apartment?
0 1989 or 1990 0 Gaai Crom undt1t9fou1u l pipe! If you have1llve<l here.Jess than 1 Y""'·
0 1985 to 1988 St!l'\'lug Um m!lghbo~hood esllma.te 1he yenrly crist.
0 1980°10 1984 0 Go.<: bold•d . ••Ilk. OT LP 0 ) 970•10 19'19· 0 £1.ctrldly a. lilectrlcity 0 1%0.tol969 0 Fu.ol oll, ltoro~•nc, ~i () l \l.S9 or eadler • 0 Coalmcoko
0 Wt>0d r------------1 I I
0 Sol•r 011\U!l\1 I I 1$ .001
~ l'lo.w iJ\.a.'!1"bedroom11do yot.t hn.ve; 01hal 13,~hnw 0 01harfuol ~------~-~~---!
0 No loolllS<!d Yearly cost - E>ollim; 1mrnyl&'~,ili'oom""1ou ld}foU.lltd ;lt1hlo hous~r • npanmonl were.on lllorm•rkel.foronlo-o.I'• _ l? OR
() No~droom IU5. Elo·you get waledrom -0 1 bedroom·
() rnctuded in rcpt or in condomln!urn fee
0 2bedrooms 0 A publ!c: system such as a dly water 0 No charge or eleolrielty nol u1ed
0 3 bedrooms department, or prlvate company?
4bedmoms 0 An lndlvtduol dtilled well?
() 0 An lndivld•al dug well?
0 !,) or. more1bedrooms 0 Some othtJr soutc-e such '1s a spring~ b. Gas
• crieeh, river, cistern, etc.?
• ~ llo.you,haveti:OMP.IE!lE plumbfrig!l&cllllles ~ Is lhis building connected to a public eewer?
ln,thi• houae·oria)iarlment: th;;t:lo, ~)'11ot.nnd 1--------1 cold•ptpeil:wateo, i)',a:Oush toilet, and:3)>a: 0 Yfls, c:::onne:ctQ:d to public; 11ewar
~--------&QJ bathtub•or'showeti 0 No, e<::onne<.:ted to septic tank or cesspool Yo.t1 1 I~ co•l - Oollor• 0 No, use othor means
() Yes, have alhhree facilities 0 No ~ About wh•n was this building fl•sl built? OR
0 1989or1990 0 Included In rent oi- In rondominlum fee:
• 0 1985 lo 1988 0 No chlllrge or gas not wed
MU. Do you hnve·€0MPLEJ1E'kitl:hen facUIHe$; 0 1980to 1984 - lhal·ls, l),a«jlnkwllh;plped•waie[, 2),a range 0 1970 lo 1979 or cOQkstove, and'S).a,refrlgerato1.? 0 1960 lo 1969 c. Wator
0 1950 lo 1959
0 Yoo 0 1940to 1949 0 1939 or earlier
0 No r------------1 0 Donjt know I I
I I lL ________ ~l!.l2l
• ~\11,_; I• (his l\n1'•e·or apartment part of a Yearly cost ~ Dollars
Mt2; Bo you have,a·te!ephone In lhlo houee or condQmJntun-~? OR
I apartment? 0 Yeo Cl N"
0 Included In rent orln condomlnlum foe
I 0 No chDrge 0 Yes ·-0 No
If you I/vs In an aparlm•nt bulk/Ing, shlp,lo -/'120.
H19a. Js.thl• house on less·than 1 acre? d. on, coal, kerosenet wood, etc.
M13., How•manv:aulomoblles, vans, and·trucks of. 0 Yes - Skip to Hl!O
one-iOn•Cll!PacUy·or1lese•are,kepl at·bome•for i 0 No • use•~y members.ol•your~llomiehold? • r------------1 , I I
b. Jn 1989, what were the nctuol soles of all ngrlcultural I I iL ________ ~o-~1
0 None • products from this property? Yearly cost - Dollars 0 l 0 2 0 None 0 3 0 $1 to $999 OR
0 4 0 $1,000 lo $2,499 0 5 () $2,500 lo $4, 999 0 Included In ren1 or in condominium fee
! 0 6 0 $5,000 lo $9,999 0 No charge or lh..,. luels not useH 0 7or more 0 $10,000 or mo"'
l ~he sample questionnaire contains housing questions I 8 to H26 shown here on pages 4 a~nd 5.
THE 1990 CENSUS QUESTIONNAIRE I47
<(
@ Vl c 0
·.;:; ro
.'::! ]5 :::J
c..
~ 0 E ~ VI
.!!! ro 0 @ ..,, ..c Ol ·~ 0.. 0 u

The 1990 Census Questionnaire
QUESTIONS ASKED OF A SAMPLE OF HOUSEHOLDS I QUESTIONS FOR YOUR HOUSEHOW
INSTRUCTION:
Answer quesHo;,; H21 TO H26, ii this lo a one-lnf9Ily house, a condominium, ot o mob/hi homo that someona In this hou.,;hold OWNS OR IS BUYING; oth~rwlse, go lo page 6.
H2.l. What were lhe real etlate ialtes on THIS pmperty IB&t year?
r------------·-·1 I I
l!o ........ --------'-~Q] Yearly amount - Dollaro
OR
o None
• H22. What was lhe annual payment for tire, ha.ard,
ond Oitod l118urance on THIS property?
r--------, I I I I 1$ .001 l.:! ... -------------'
Yearly amount - Dollars
OR
0 None
•
I48 THE 1990 CENSUS QUESTIONNAIRE
H23a. Do you have a mortgoge, deed of trust, contract to plM'cha ... , or olmllar debt on THIS properly?
O Yes, mortgage, deed of !Just,( 01 slmllor debt Go to H23b
0 Yes, contract to putchase
0 No - S/1/p lo H24o
• b. How much Is your tEgulnr monthly mortgage
payment on 11llS property? Include payment only on first mortgage or conlraot lo purchase.
r--------------, I I I I
~------------~~~ Monthly amount - Dollors
OR
O No regular payment required - Skip lo H24a
c. Does your regular monlhly tnOJtgage paYJat!ll( . Include payment& for real ••late "'""" on nus property?
• 0 Yes, taxes Included In poym•nl O No, 1mr.•• pold seporately or loxes not required
d.1>""5 your regular monthly mortgage -ment Include payanents lor fire, hadrd, or flood Insurance on nits property?
o Vest Insurance Included In payment 0 No, lnsurnnce paid aeparately or no tnsuronce
•
H24a. Do you haw. 11 second or Junior mortgage orr a home equity loan on 1HlS propetty?
0 Vcs 0 No - Skip lO H25
• b. How much Is your regular monthly
payment on all second or junior mortgagH llnd all home equity loans?
r--·-----------, I I
Is .oo: I ___ ... ------- - ___ !j
Monthly omount - Dollars
OR
0 No •"'>Ul•r poyment required
• Amwet ONLY I( lhls ls a CONDOMINIUM -
H25. What Is the monthl11 condominium fee?
•
r--------------1 I I
'~------------ "Q.Q] Monl\iy omounl - Dollots
Answer ONLY II this ls a MOBILE HOME -
H26. What waa t'• total aottfor penonal propef41 lalloo, •It• rent, reglllb'l!.tlon fees, and license 'eea on this mobile home and Ila site laat iear? Exclodo rool ostotetnx••·
r-------------1 ~-~--------.:Q_~
Yeorlr amount - Dollora
Page&
::J 0 E ~ VI QI
ro 0 @ ..., ..c O'I ·~ o._ 0 u

The 1990 Census Questionnaire
QUESTIONS ASKED OF A SAMPLE OF HOUSEHOLDS ?~6
PERSON 1
t;i-l'l-;,;;· --·-··-~-··- -Arrt n~~~N · · ~ ..... ··-- --·-·Midi1e-1n;;.r
8. In what U.S. State·or foreign counb'y was this
~'!~~~~, ···----------.. -··---··---1 l ~
(Name-01srate-0r iorei{in cou~trY: or·p·uer.·o-R-tcO~ouam~ ed.} 9. Is this person a .emZEN of the United Stain?
u V•s. born In the United Slotes - Skip loll 0 Ve<, born in. l'llorlo Rico, Guom, the
U.S. Virgin !;lands, or Northern Marl•nas o Yes, bom illbi'oad of American pl!ir-entor paN!nts O Yes, U.S. dt1l!en by nalurall2allon 0 No, not o <11\zen ol the United States
• 10. When did this person come to the United States
to stay?
0 1987 lo 1990 • 0 1985 or 1986 0 1982to 1984 0 1980 or 1981 0 1975 to 1979
0 1970 lo 1974 0 1965 to 1969 O 1960 to 1964 0 1%0tol%9 0 Delore 1950
11. At any time since Febl'\lary 1, 1990, has thl& plll'&On attended regular school or college? Jnclude only t'lurs.ery school, kinderg&rlen 1 elementar~ school, and schooling whtch leods to a high school diplomo or a college degrt!e.
O No, hos not •"ended since Feb<uary 1 0 Yeo, public school, public college o V••. private school, private college •
12. How much $Chool has this peroon COMPlEfEO'l Fill ONE cln:le for the highest levol COMPLETED or dogr .. RECEIVED. If cunenlly enrolled, morl< tho level of previous 111ade ottended or highest degree received.
0 No school completed O Nur""Y 5Chool O Klndcrgflrten • () lstJ 2n<l, 3rdt or 4th grade O 5th, 61h, 71h, or 8th grade o 9th grade O 10th grade o lllh grade O 12th gr•de, NO DIPLOMA 0 HIGH SCHOOL GRADUATE · high school
DIPLOMA or lhe equivalent (For example: GF.0) O Some colloge but no degree O Associate d<lgree In college • Ocoupa~onal program O Associate degree in college - Academic program o Bachelor's degree (Por example: BA, AB, BSI
14a. Did thl• peroon u,,., In thlo house or apartment Ii years aao(onAprll 1, 1985)? .
0 Born after Aprll l, 1985 - Go lo quosnons for
0 Yes - Skip U> 15'> the next person
' O No b. Where did this petson live 6 yeare ago
(on Aprtl l, 1985)? (l) Name of U.S. State or foreign country? r--------------~-------------- --, I I I l L----------------------·"---·····••Y•-·--J llf outside U.S., print answer above ond skip to 15a.)
(2) Name of county in the U.S. -;z r---------------------f--------····-~ I I
L -----------------------------J (3) Name of city or town In the U.S. -;z r·····-----------··--··---····-·'··-- - ----1 I I I I (__ -~·-~•~•n~~-- -- ---- - --- -------..J
(4) Did this person live lnslde the city or town llmll$?
0 Ves 0 No, lived outside !he cl\y/lown limits
15a. Does thl• pereon speak a language other than Englloh al home?
O No-Sklpto 16
c. How well does this pet50n l)>e.ak En~llsh?
o Very weU o·we11
O Notwell o Not•! •ll
16. When wao this person born?
0 Born befol'l Aprll 1, 1975- Goto l7o 0 BomAp~ll, 1975orloter- Gotoquesllons
for the next ptUSOn
17a. Hao thlo person "'1<!T been on active-duty mllltery service In the Armed forces olthe United States or ever boon In the United Stales mllllary Reserves or the National Guard? lf !<!rvlce was In ReS<lrve• or Nollonal Guard only, "'•Instruction guide.
O Yes, now on active duty o Ves, on a.cHve duty ln pastt but not now O Yes, service in Reserves or National
Guard only - Skip to 18 0 No- Skip to 18
b. Wao active-duty mllltary eervlce during -
PLEAS/i ANSWl:."R "l"Hl:!Sb" QU'l!~T/UNS Jl.8. Does this person have a ph1111lcal, menial, or other
he1>llh condition thttt hM ID&led fm 6 or more month• end which -
a. Umlt• the kind or amount of work this person can do at a Job?
0 Yes 0 No
b. Prevent& thlo penon lrom worldng at a Job?
• 0 Yes 0 No
19. , Beceuoe of a he.allh condition that has lasted for 6 or more months, does lhlo person have any dlfftculty-
a. Going out&tde the home alone, for el(Omple, to shop or vlolt a doctor's office?
0 v .. 0 No
b. Taking care of his or her own poroonal needs, such as bathing, dre6Slng, or ueffing around Inside the home? •
O Yes Cl No
lf lbto PfJl"SOn Is a femo!e -20. How many babies h .. ohe ewr had, not counting
etlllblrths? Do not count her s\epchlldren or children she hoe adoJ)t.ld. None 1 2 3 4 5 6 7 8 9 10 11 12 or more
0 000000000 () 0 0
2la. Did this per!Mln work at any lime LAST WEEK?
•
0 Yes - Fiii this clrde If lhls petson worked full time or part time. (Cou~t part·flme work such ae dellvetlng papers, or helping without pay in a family bu6iness or farm. Also count acttve duly In tho Armed Forooe.)
O No - Fiil lhlo clr<le II this pe!80n did nol work, or did only own housework, school work, or volunteer work. - $kip to 25
b, How many hour5 did thlB peroon work U\ST WEEK (at aU Jobs)? Subtroct ony time off; odd overllma or ••tra hours work•d. 1-----------1 !iours
I I '---·~~--···~···••ft•"'
i2. At what location did this person work U\STWEEK? If thlsper$0n worked ait rnc:rre tha.n one location, print where he or she worked most last week.
I a.Address(Numb...andstreet)7 , ... -... - .. -... - --------· ·----------.. -, l • I I
L,,... ____ ···-· ··· ··• · ·· ··--~- --------------1 (II 1heeKacl addre.ss!Snol l<nown, give a desctlpllon ol the l()(affon such as the building m:uneor lhe nearest sh'eet or lntersccllon .)
Piii a circle for eoch period In which this perscm served . O Master's degree (foreKample: MA, MS, MEng, MEd, MSW. MBA) • b. Nome of city, 1own, or po..t.ollice7
O Profe~lona.1 school degree (For eXllmple; MD1
DDS, DVM, LLB, JD) • o Docioral<I d"9f'!"
(For example: PhD, EdD)
ta. What 1s this person's one .. ~ or 21hnlc orlgtn:Z? · (~e lnotructlon guld• for funh r iufona.tiOn.) 1-·-----------..- ... .... -...... ··- -------··-.... ·-,
I I I I
L-- - --:·---~ ·· ··-·-----··...i~~---- J (Fo1 ... mplo: Gnmon, llalian, Al<o. ·Aln<it., CrooU.n, Cope V0<d•on, Domlnl<All, Ecuad.,..n, 1-!olt!on, C.Jun, Fron<)i C011odi0n, JMWcon, Ko!..,n, IA~nt>O. M;.ican, Nigoolon, Irish, Poish, Sk>uok, Toi.ion.,., Th.I, Ulooll1lnn, oto.)
o September 1980 orlalGr r-----------.. ··-·--··--.. --... . ............ ---·,: D Moy 1975toAuguS11980 ' ·-- ---·-.. -- .. - ...... -~~ Cl Viotnomera (Augusl l%4-Aprtl l975> c. ls the work location lnolde thellmlts of o F•h<uruv 1955-Julv 1964 0 Korean conflict (June 1950-Januory 1955) that city or town?
() World War II {September 19'W-July 1947) I O Yeo O Nolh~u~~~itown lunlls O World War l (Aprll 1917-November 1918) O Any other ttme d. Co\&nl)I 7
c. lntotol, howmanyyearsofactlvo-dbtym!Utory L .... =~~::: : ~--~~::~~=~~==:=:J service ...... thla person~~~!. _ __ ---, e. r~!~~-7 ........ w .. www'"''l1 "r~'!'-~'.K.'~. 7 ........ w .. . l.
! ! Yeors •. ·-------='-;.;:-=::.--=-::.-::.-::.-:;;-:;;-:;;~;;...... ___ ,,__L_.~· -:::==-~-.:.~:::.~.·-.;-:.~-:..:} .. L. M•-·· · -·---~---:
THE 1990 CENSUS QUESTIONNAIRE I49
<i' ® Vl c 0 ·.;:::; ro
.!,! ::0 :J "-~ 0 E >(!) Vl (!)
ro 0 @ +"' ..c g >:, 0.. 0 u

The I990 Census Questionnaire
QUESTIONS ASKED OF A SAMPLE OF HOUSEHOLDS FOR PERSON 1 ON PAGE 2
23a. How did thlo peraon usUfllly get to "'ork IAST WEEK? If lhlo~ usually used more thanono mll1hod of tJanspor1atlon during the blp, ~II the clJG!e of lh• one um for moot of th• dli!lan<:e.
0 Ca11 truck, or unn 0 Motorcycle () Bus or trolley bus 0 Bley de 0 Streetcor or Wiiey cor 0 Walked 0 Subway Of elevated 0 Workedath~ 0 Railroad Skip lo28
0 Fertybool • () Oth$1'method 0 Toxlcab
II "rN, ltuck, or van" 1' mllri<•d In 23o, go to·29b. OthflWIU, '1tl 1021/o.
b. How many Pl!<>PIA, lnctudtno t •~ pet11<]l', utuaUy rode to work tn the car, truck, & van LAST WEJ!K? •
0 Drove alone 0 2people o 3peoplo 0 4peopl•
O 5people 0 6 people O 7 to 9 people o 10 or more people
24a. Wh~t time did this person usuall11 lea\lt1 home to go to work LAST WEEK? r------··--1 0 a.m.
L__ _____ J 0 p.m.
b. How ma1111 minutes did It uaually take this pereon to get from home to work LAST WEEK?
f-~~··------1 II L __________ J Minutes- Sklpto28
25. Was lhla peTSOll TEMPORARILY a"'8nl or on lajloff from a job or bll81nee& LAST WEEK?
0 Yeo, on layoff 0 Ye~. on vacation, temporary lll~eS9,
lobor dispute, etc. O No
26a. Has thla peraon been lQolclng for wor1' during the laat4weeks?
I o Yes t 0 No-Sklpto27
b. Could this per.on have taken a Job LAST WEEK If one had been offered? O No, a~eody haaa Job • 0 No, temporortly Ill
Page 7
28. lndustiy or EmploVeJ 32. INCOME IN 1989 -
a. For whom did this pereon work? FA! tho "VB$" elide below for eoch Income source ta<:etved du~ 1989. Otherwise, ftllthe "No" ctrde. If "Yes," entm th& !Otahmoont reoeived during 1989. For Income ~ved jOlnlly, see Instruction guide.
If now on II.dive duty In lhe Armoo Forces, flll lhls clrckl 0 and print the btonch ot the Armed Forces.
~~~~~~~~~~~~~~~~~~-~~~~~~~] (N~mo of compony, buotn.is•, ot orhuornployur)
If exad amount 15 not known, please give be$1 estlmole. II net Income w., o loos, W11b! "loss" al>ooie the dollar omount.
b, Whot klnd ofbutl- or lndwl:ly was th1B77_
~'!_~!!_~ ~~'!. ~c_!l~i!_Y-•~ !~l!_O_!l_~1!_11_!!_!_~~~~~ - ;
a. Wagee, salary, comml8sloll$, bonu-, or tips from aU Jobs - Report amount before d~ductlon• for taxes, bonds, d~~J .!>! 2L~!J!!m!._-
I I
)F~,-~inl>k.~ hosl>iiac;;-.;;;&P;;e~ ;;;;b"1l;h1;;Q, --- -- _: • mall order house, outo englno manufacturing, •tto~ bolmy)
·c. Is this mainly - Piii ONE cfl'cle 0 Monufadurtng 0 Other (agrlcullurt, () Wholesaki trade co11$1ruetton, service,
0 Retail trade government, etc.)
O Yes-: i o N<> ~-- - --- --------c<!.O.i
AnnuoJ 3mounl - Oollai•
b . Self.employment Income from o"'n nonfarm bu&I-, Including proptletonhlp and partnenhlp - Report NET Income after bus!ness expenses. r-------------··--1 O Yes- j 1 o No J _____ .. __ ~)!.~
29. Occupation Annunl amount - UOl/41!>
'" ~'!.'!.t.!<!'!<!~f_~~·!<-~~~t.!i!"_l!."_~1!~~_!'~!=7 __ 1
c. Farm H 1..imploymt.nt tncomv - Report NET 1
1 lncomu afler operating expenses. Include eamlngs
L _________ ··--_____________________ _: ., • tenant farmer or !~~P.l'!!: _______ _ (For example: reglttered nurM, pe1Wnnel monoger, o Yes - : I supervtsoroiordordep<1rtmenl, gasoline engine o No ~----.- ---------~~ •SS<1mbln ukc lurtl Annuo1 tun uni - Dollart
b. What wue thlll person'• m011t lmPQrtantacllvltleo d. fnt<!tWlt, dlvidentlt, net rentnl Income or royalty d ti ? lnrome, or Income from estates and trult8 -f!,_u__t!!_ 7 __ ______________________ l Report8WJI smallamountscrodijodtoanoccounl.
L ____ ::.c:.T.----------------- ,,.--___J o Yes - f'.--------------0-01
!For""""'"'"' patlont Cll!e, dlroctlng hlllngp0ud~. 0 No ~- ----------- --..;_J oupe!Wlng order cleiks, a>sembllng engjnes, • Annual amount - DcllArs kine calces) e. Social St!curl1y w Rollrood Ret!Jemcnt
30. Waethl&per80n-AKONEc\l'de o Yes- l--------------1 0 No · f!---..---------~Ql
• 0 Employee of• PRIVATE FOR PROm company or
busln.,. or of an lndlvtdual, for wag<!O, solsry, or cmnmlS41ons.
o Employ« of o PRIVATE NOT·FOR·PROFIT, la>t·•~•mpt, or chMtable orgonlzetlon
o local GOVERNMENT employee (city, county, et<>.) 0 Sklte GOVERNMENT emplo!I«' 0 Fedorol GOVeRNMl!NT employee 0 SELF·EMPl.OYED In own NOT INCORPORATED
bu~ness, professional pr.clice, or form 0 SElF·EMPLOVED In <>Ml INCORPORATED •
bu~ness, prole691oul PJocilce, or ferm 0 Worl<lng wrrHOlJ1' PAV Ill famil~ business or la!m
Annuo13n1ounl - Dollais I. ·upp ementa irll\I ru.iome I , lo
Families llllth Det:Nnc.lanl Chlldfen (N'OC), or other publla:: asehltance or public welfare JNllllnlml~~ ___ _____ _ _ ___ .. _ 1
0 v •• - ' \ 0 No ~----- ---------.!~~.
Annuol 11mount- OollMs g .. Retirement, ourvlvor, or disability penal011$-
Do NOT lncl~de ~~l_~.!!IJ.ll'.·----- ___ ~ o Yes_. : o No ~----r _______ .;.o
Annuo omount - Doll.vi
0 No, other reasons (In ochool, etc.) o Y«$, could haveW<ena]ob 31a~ uatyear(1989), did thlspe...,nwor1', even fora
f------------------~ few clal/S, ata P.tlldJob or Ina bualnae or farm?
h. Any olha sources of Income rccdvcd reg11larly wch as Vete1>an1' (VA) payments, unemPIOlllll•mt oeompenaatlon, child eupport,
'1:1. When did thla peroon lael worlc, - for a kw o Yes days? O No - Skip to32
() 1990 \ o 1989 Go 0 1988
10
() 1985 lo 1987 ;8
0 1980to 1984 } O 1979 or eNller :::'~2 O Neverwoil<ed
29.so·. CURRENT OR MOST RECENT JOB ACTIVJlY. 0.S<rlbe clearly th\a perton'a ch\d job oct!vlty or bus!ness lost week. 11 th\a person had more thon one job, cklaalbe tho one at which this person worked the mMt ho11111. H lhl& ))efSOn had no job or business lost week, give lnfonmotlon for his/her last job or 11Usln .. s 51nce 1985.
b. How many weebdld. this person work In 1989? Count paid vacafllin, paid sick leave, and mtlimy ~rvkt.
• r ----------1 1 r Weeks L-- --·-·------J
c. During the wew WORKED In 1989, how inany hOW'S did this pertOn 11&ually work each week?
,-----------, : I Hours L-------h·-··-J
or alimony - Do NOT lndude lump·suni 11oymonts such as money from on tnhe~l•nce or the $Ole
of a home. ,_ ...... - - ---··-----· 0 Vos___._ I J 0 No L$_----------~~
Annwil omounl - DoUon
33. What wao Ihle person's total Income In 1989? • Add entries In queotlons 32a through 32h; subtract
any loOSOi. II total amount wos a lo .. , wtlte "Los•" obov• amount.
0 None OR : -~------·-----: 1$ .001 L Annuar amooot =-oonat:
Please turn to the next page and answer questions for Person 2 on page 2. llthls Iii the last person listed Jn ~est/on la on p11ge J, go to the l>ack ottne turm.
ISO THE 1990 CENSUS QUESTIONNAIRE
:J 0 E IV'
V)
..<!!
"' 0 @ +" ..<:: Cl'l -~ a_ 0 u

The I990 Census Questionnaire
Page 8
Please make sure you have ... 1. FILLED this form completely.
2. ANSWERED Question la on page 1.
3. ANSWERED Questions 2 through 7 for each person you listed in Question 1 a.
4. ANSWERED Questions Hla through H26 on pages 3, 4, and 5.
5. ANSWERED the questions on pages 6 through 19 for each person you listed in Question 1 a.
Also ... 6. PRINT here the name of a household member who filled the
form, the date the form was completed, and the telephone
number at which a person in this household can be called. ~-------------------------------------------------------~----------------, I I I
: Name : Date : ~---------------T----------T----------------------------~ - - -------------- t I I I I I
• Telephone ', Area code ,' Number • 0 Day • I _____.. I I
: number : : O Night : I I I I I
L---------------J----------J----------------------------L----------------J Then ... 7. FOLD the form the way it was sent to you.
8. MAIL it back by April 1, or as close to that date as possible, in the envelope provided; no stamp is needed. When you insert your completed questionnaire, please make sure that the address of the U.S. Census office can be seen through the window on the front of the envelope.
NOTE - If you have listed more than 7 persons in Question la, please make sure that you have filled the farm for the first 7 people. Then mail back this form. A census taker will call to obtain the information on the other people.
Thank you very much.
THE 1990 CENSUS QUESTIONNAIRE ISI
<(
® V1 c 0 ·.;:::; re
.>< ::0 :J
CL
~ 0 E >, (!) VI
_!!! re 0 @

NOTES
ISZ NOTES


9 78157 2 323988
ISBN 1-57232-398-1