Prepared for Los Angeles County Flood Control District Flood ...
112 | Triennial Scientific Report
High-end climate change scenarios for flood protection of the NetherlandsCaroline Katsman, Andreas Sterl, Jules Beersma and Wilco Hazeleger
IntroductionSealevelrise,especiallycombinedwithpossiblechangesinstormsurgesandincreasedriverdischargeresultingfromclimatechange,posesamajorthreatforalow-lyingdeltaliketheNetherlands.Futurefloodprotectionstrategiesneedtotakethesepossiblechangesintoaccount.Therefore,high-impact,low-probabilityclimatechangescenariosfortheNetherlandsweredeveloped1)attherequestofthesecondDeltaCommittee2).Inthisstudy,localsealevelrise,changesinstormsurgeheightandpeakdischargesoftheriverRhinewereconsidered.SuchdetailedinformationgoesbeyondtheKNMI’06climatechangescenarios3)thatspantherangeofmostprobableoutcomes.Thenewly-developedhigh-endscenariosarediscussedone-by-onebelow.ThecomplexfloodriskimpliedbythecombinationofthesescenariosisillustratedbyconsideringthesituationnearRotterdaminthefinalsection.
Sea level rise along the Dutch coastThehigh-endscenarioforlocalsealevelriseisconstructedusingthemethodologydevelopedfortheKNMI’06scenarios4).First,separatehigh-endcontributionsfortheprocessesthatdominatetheglobalmeanchangeswereestimated:thermalexpansionoftheocean,andmasschangesofsmallcontinentalglaciersandicecaps,theAntarcticIceSheet(AIS)andtheGreenlandIceSheet(GIS).Next,localeffectsareconsidered.WeassumethatallcontributionsexceptthatofAISdepend(partly)ontheriseinglobalmeantemperature,asforKNMI’064).Aglobalmeanriseof2to6˚Cin2100wasassumed,akintotherangeprojectedforthemostsevereemissionscenario(A1FI)oftheIntergovernmentalPanelonClimateChange(IPCC)5).
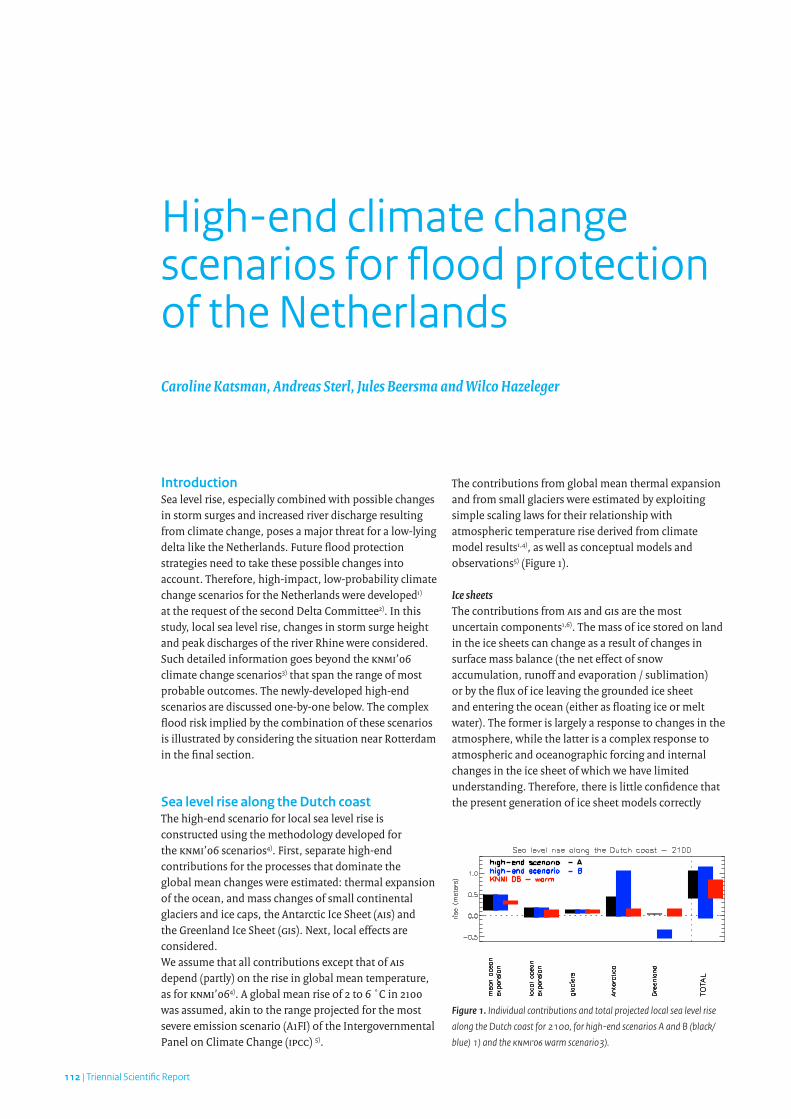
Thecontributionsfromglobalmeanthermalexpansionandfromsmallglacierswereestimatedbyexploitingsimplescalinglawsfortheirrelationshipwithatmospherictemperaturerisederivedfromclimatemodelresults1,4),aswellasconceptualmodelsandobservations5)(Figure1).
Ice sheets ThecontributionsfromAISandGISarethemostuncertaincomponents1,6).Themassoficestoredonlandintheicesheetscanchangeasaresultofchangesinsurfacemassbalance(theneteffectofsnowaccumulation,runoffandevaporation/sublimation)orbythefluxoficeleavingthegroundedicesheetandenteringtheocean(eitherasfloatingiceormeltwater).Theformerislargelyaresponsetochangesintheatmosphere,whilethelatterisacomplexresponsetoatmosphericandoceanographicforcingandinternalchangesintheicesheetofwhichwehavelimitedunderstanding.Therefore,thereislittleconfidencethatthepresentgenerationoficesheetmodelscorrectly
Figure 1. Individual contributions and total projected local sea level rise
along the Dutch coast for 2100, for high-end scenarios A and B (black/
blue) 1) and the KNMI’06 warm scenario3).
Triennial Scientific Report | 113
simulateschangesinicefluxinresponsetochangingclimateconditions.WethereforerelyonrecentobservationsandexpertjudgementtoassessthepossiblecontributionsofGISandAIS1).
Themostvulnerablepartsoficesheetsaretheso-calledmarineicesheets(icesheetsthatrestonbedrockthatisbelowsealevelandslopesdownwardsfromthecon-tinentalmargininland).Positivefeedbacksinamarineicesheetsystemcanleadtoarunawaycollapseoftheicesheet,whichwouldstoponlywheretheretreatencoun-teredarisingbedslope.Thetimescaleoverwhichsuchacollapsemightoccurisnotwellunderstood,butforlargesectionsofanicesheetitwouldprobablybelongerthanacentury.ThelargestmarineicesheetthatexiststodaycoversthemajorityofWestAntarctica.Thestrongestinlandbedslope,andhencethestrongesttendencytoinstability,existsinthatportionoftheWest-AntarcticIceSheetwhichdrainsintotheAmundsenSea(Pacificsector,near100-110W).InGreenland,onlyJacobshavnIsbrae(onthewestcoast)containsasimilarprominentinlandslope,sothatitcouldpotentiallydisplayasustainedretreat6).TheestimatedcontributionsofAISandGISinthehigh-endscenarioforsealevelrise(Figure1)combinethemodel-basedassessmentofsurfacemassbalancechanges5)withacontributionduetofasticedynamics,estimatedfromobservationsfocusingonthevulnerablemarinepartsoftheicesheets1,6).
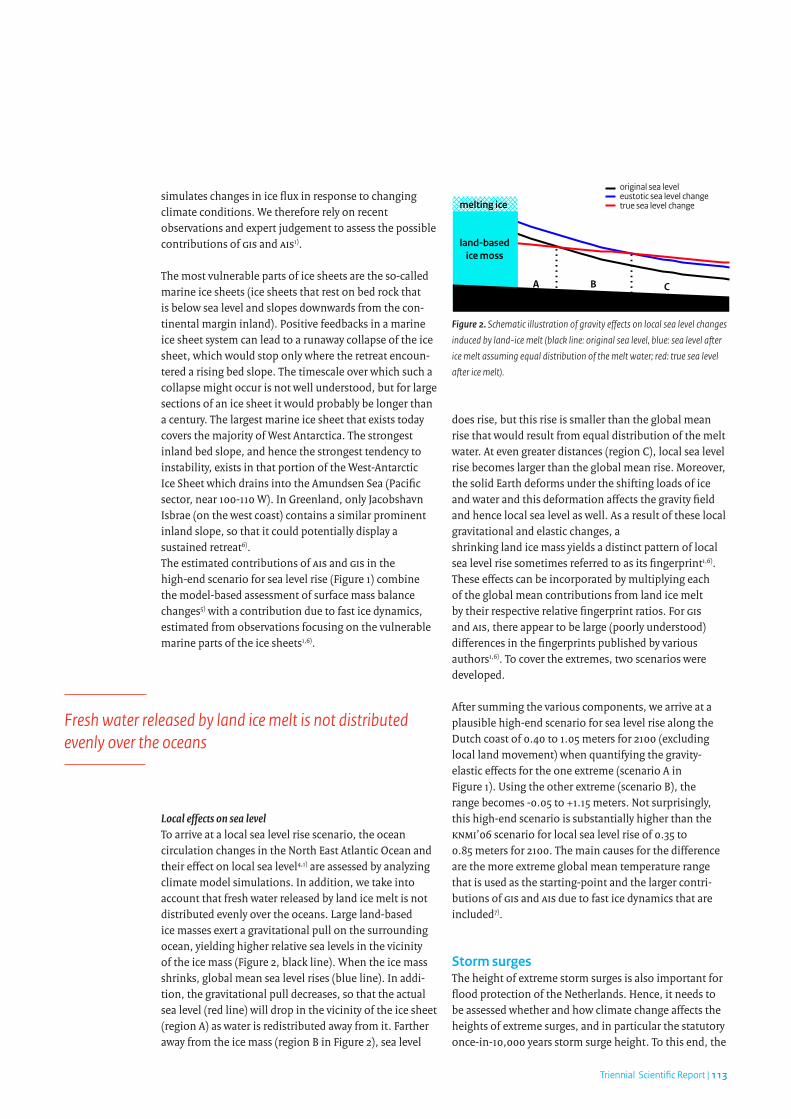
Local effects on sea levelToarriveatalocalsealevelrisescenario,theoceancirculationchangesintheNorthEastAtlanticOceanandtheireffectonlocalsealevel4,1)areassessedbyanalyzingclimatemodelsimulations.Inaddition,wetakeintoaccountthatfreshwaterreleasedbylandicemeltisnotdistributedevenlyovertheoceans.Largeland-basedicemassesexertagravitationalpullonthesurroundingocean,yieldinghigherrelativesealevelsinthevicinityoftheicemass(Figure2,blackline).Whentheicemassshrinks,globalmeansealevelrises(blueline).Inaddi-tion,thegravitationalpulldecreases,sothattheactualsealevel(redline)willdropinthevicinityoftheicesheet(regionA)aswaterisredistributedawayfromit.Fartherawayfromtheicemass(regionBinFigure2),sealevel
doesrise,butthisriseissmallerthantheglobalmeanrisethatwouldresultfromequaldistributionofthemeltwater.Atevengreaterdistances(regionC),localsealevelrisebecomeslargerthantheglobalmeanrise.Moreover,thesolidEarthdeformsundertheshiftingloadsoficeandwaterandthisdeformationaffectsthegravityfieldandhencelocalsealevelaswell.Asaresultoftheselocalgravitationalandelasticchanges,ashrinkinglandicemassyieldsadistinctpatternoflocalsealevelrisesometimesreferredtoasitsfingerprint1,6).Theseeffectscanbeincorporatedbymultiplyingeachoftheglobalmeancontributionsfromlandicemeltbytheirrespectiverelativefingerprintratios.ForGISandAIS,thereappeartobelarge(poorlyunderstood)differencesinthefingerprintspublishedbyvariousauthors1,6).Tocovertheextremes,twoscenariosweredeveloped.
Aftersummingthevariouscomponents,wearriveataplausiblehigh-endscenarioforsealevelrisealongtheDutchcoastof0.40to1.05metersfor2100(excludinglocallandmovement)whenquantifyingthegravity-elasticeffectsfortheoneextreme(scenarioAinFigure1).Usingtheotherextreme(scenarioB),therangebecomes-0.05to+1.15meters.Notsurprisingly,thishigh-endscenarioissubstantiallyhigherthantheKNMI’06scenarioforlocalsealevelriseof0.35to0.85metersfor2100.Themaincausesforthedifferencearethemoreextremeglobalmeantemperaturerangethatisusedasthestarting-pointandthelargercontri-butionsofGISandAISduetofasticedynamicsthatareincluded7).
Storm surgesTheheightofextremestormsurgesisalsoimportantforfloodprotectionoftheNetherlands.Hence,itneedstobeassessedwhetherandhowclimatechangeaffectstheheightsofextremesurges,andinparticularthestatutoryonce-in-10,000yearsstormsurgeheight.Tothisend,the
Fresh water released by land ice melt is not distributed evenly over the oceans
melting ice
A B C
original sea leveleustotic sea level changetrue sea level change
land-basedice moss
Figure 2. Schematic illustration of gravity effects on local sea level changes
induced by land-ice melt (black line: original sea level, blue: sea level after
ice melt assuming equal distribution of the melt water; red: true sea level
after ice melt).
114 | Triennial Scientific Report
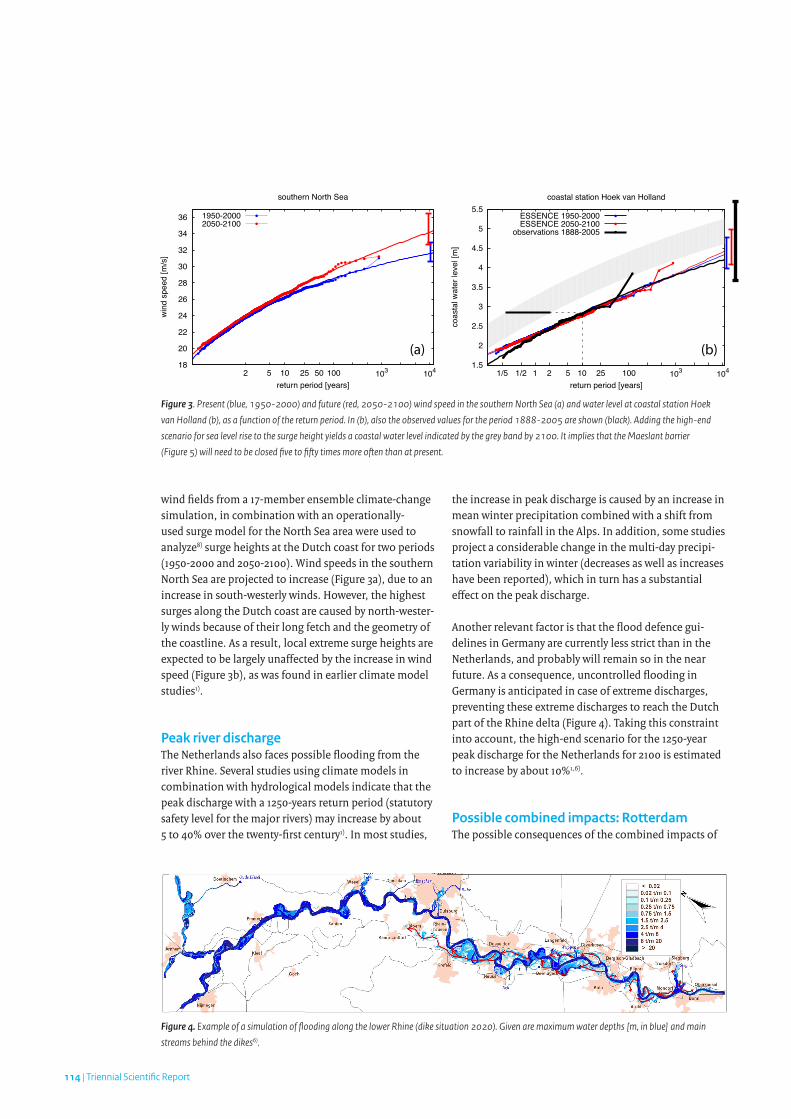
windfieldsfroma17-memberensembleclimate-changesimulation,incombinationwithanoperationally-usedsurgemodelfortheNorthSeaareawereusedtoanalyze8)surgeheightsattheDutchcoastfortwoperiods(1950-2000and2050-2100).WindspeedsinthesouthernNorthSeaareprojectedtoincrease(Figure3a),duetoanincreaseinsouth-westerlywinds.However,thehighestsurgesalongtheDutchcoastarecausedbynorth-wester-lywindsbecauseoftheirlongfetchandthegeometryofthecoastline.Asaresult,localextremesurgeheightsareexpectedtobelargelyunaffectedbytheincreaseinwindspeed(Figure3b),aswasfoundinearlierclimatemodelstudies1).
Peak river dischargeTheNetherlandsalsofacespossiblefloodingfromtheriverRhine.Severalstudiesusingclimatemodelsincombinationwithhydrologicalmodelsindicatethatthepeakdischargewitha1250-yearsreturnperiod(statutorysafetylevelforthemajorrivers)mayincreasebyabout5to40%overthetwenty-firstcentury1).Inmoststudies,
theincreaseinpeakdischargeiscausedbyanincreaseinmeanwinterprecipitationcombinedwithashiftfromsnowfalltorainfallintheAlps.Inaddition,somestudiesprojectaconsiderablechangeinthemulti-dayprecipi-tationvariabilityinwinter(decreasesaswellasincreaseshavebeenreported),whichinturnhasasubstantialeffectonthepeakdischarge.
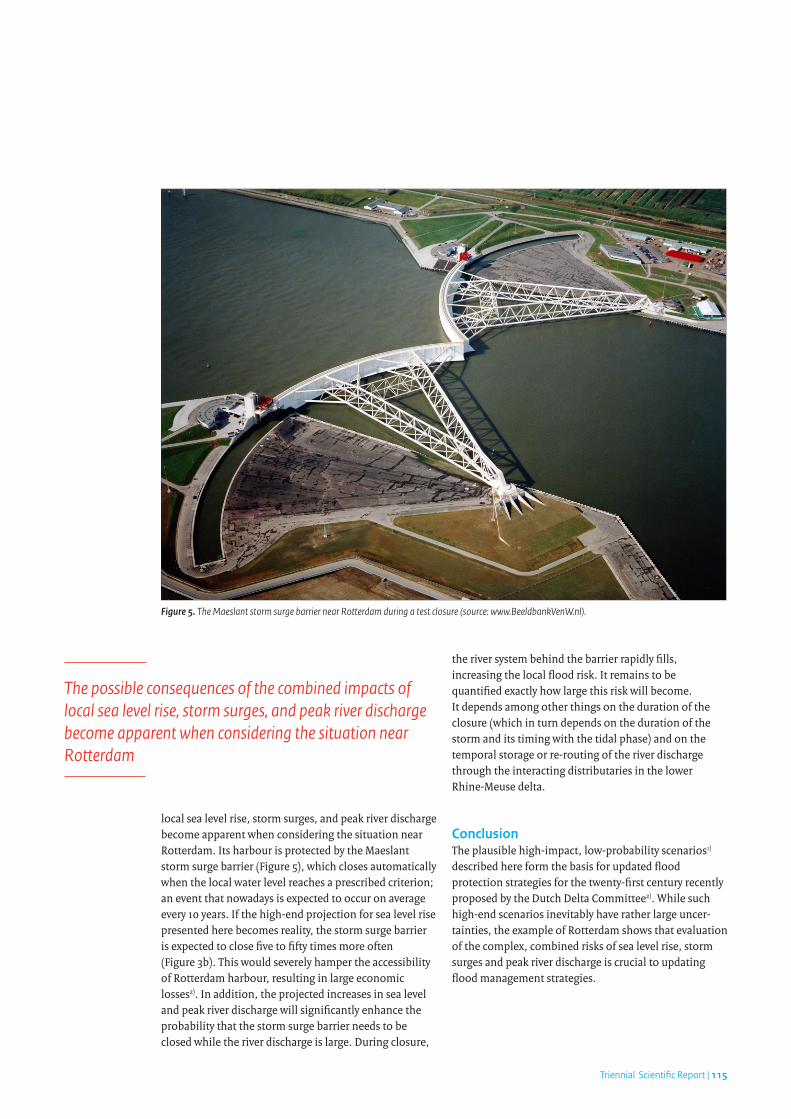
Anotherrelevantfactoristhattheflooddefencegui-delinesinGermanyarecurrentlylessstrictthanintheNetherlands,andprobablywillremainsointhenearfuture.Asaconsequence,uncontrolledfloodinginGermanyisanticipatedincaseofextremedischarges,preventingtheseextremedischargestoreachtheDutchpartoftheRhinedelta(Figure4).Takingthisconstraintintoaccount,thehigh-endscenarioforthe1250-yearpeakdischargefortheNetherlandsfor2100isestimatedtoincreasebyabout10%1,6).
Possible combined impacts: RotterdamThepossibleconsequencesofthecombinedimpactsof
18
20
22
24
26
28
30
32
34
36
2 5 10 25 50 100 103 104
win
d sp
eed
[m/s
]
return period [years]
southern North Sea
(a)
1950-20002050-2100
1.5
2
2.5
3
3.5
4
4.5
5
5.5
1/5 1/2 1 2 5 10 25 100 103 104
coas
tal w
ater
leve
l [m
]
return period [years]
coastal station Hoek van Holland
(b)
ESSENCE 1950-2000ESSENCE 2050-2100
observations 1888-2005
Figure 3. Present (blue, 1950-2000) and future (red, 2050-2100) wind speed in the southern North Sea (a) and water level at coastal station Hoek
van Holland (b), as a function of the return period. In (b), also the observed values for the period 1888-2005 are shown (black). Adding the high-end
scenario for sea level rise to the surge height yields a coastal water level indicated by the grey band by 2100. It implies that the Maeslant barrier
(Figure 5) will need to be closed five to fifty times more often than at present.
Figure 4. Example of a simulation of flooding along the lower Rhine (dike situation 2020). Given are maximum water depths [m, in blue] and main
streams behind the dikes6).
Triennial Scientific Report | 115
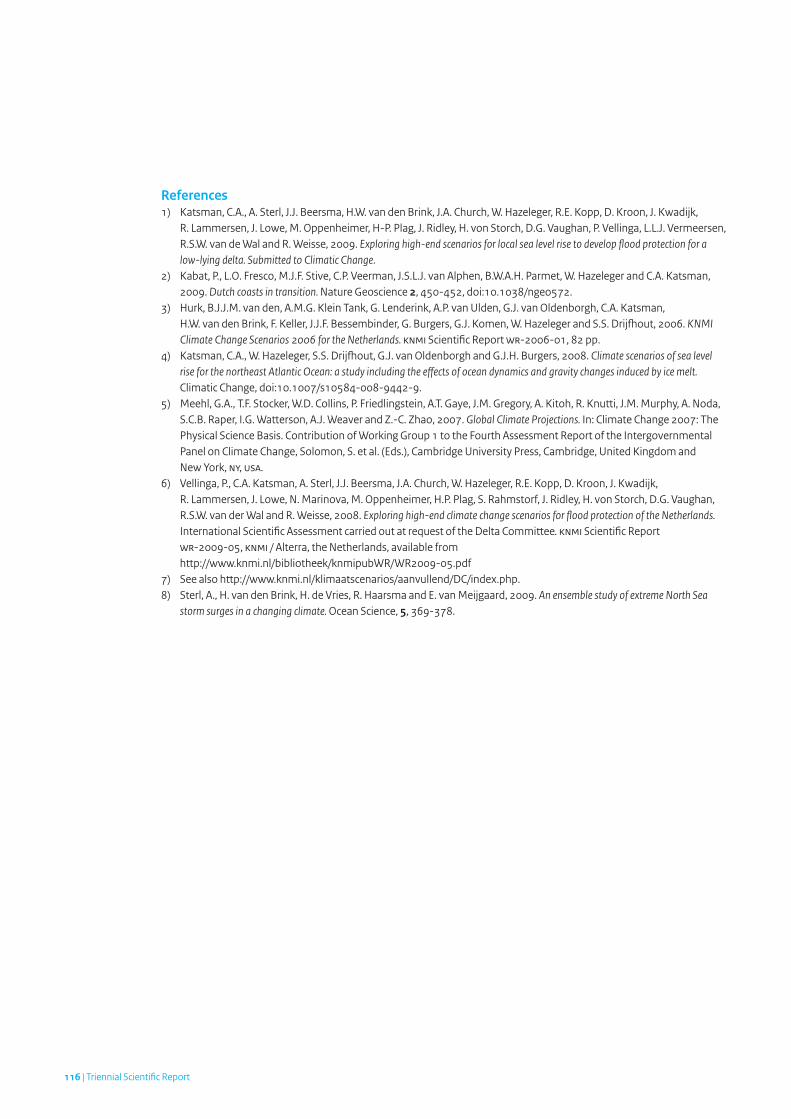
localsealevelrise,stormsurges,andpeakriverdischargebecomeapparentwhenconsideringthesituationnearRotterdam.ItsharbourisprotectedbytheMaeslantstormsurgebarrier(Figure5),whichclosesautomaticallywhenthelocalwaterlevelreachesaprescribedcriterion;aneventthatnowadaysisexpectedtooccuronaverageevery10years.Ifthehigh-endprojectionforsealevelrisepresentedherebecomesreality,thestormsurgebarrierisexpectedtoclosefivetofiftytimesmoreoften(Figure3b).ThiswouldseverelyhampertheaccessibilityofRotterdamharbour,resultinginlargeeconomiclosses2).Inaddition,theprojectedincreasesinsealevelandpeakriverdischargewillsignificantlyenhancetheprobabilitythatthestormsurgebarrierneedstobeclosedwhiletheriverdischargeislarge.Duringclosure,
theriversystembehindthebarrierrapidlyfills,increasingthelocalfloodrisk.Itremainstobequantifiedexactlyhowlargethisriskwillbecome.Itdependsamongotherthingsonthedurationoftheclosure(whichinturndependsonthedurationofthestormanditstimingwiththetidalphase)andonthetemporalstorageorre-routingoftheriverdischargethroughtheinteractingdistributariesinthelowerRhine-Meusedelta.
ConclusionTheplausiblehigh-impact,low-probabilityscenarios1)describedhereformthebasisforupdatedfloodprotectionstrategiesforthetwenty-firstcenturyrecentlyproposedbytheDutchDeltaCommittee2).Whilesuchhigh-endscenariosinevitablyhaveratherlargeuncer-tainties,theexampleofRotterdamshowsthatevaluationofthecomplex,combinedrisksofsealevelrise,stormsurgesandpeakriverdischargeiscrucialtoupdatingfloodmanagementstrategies.
The possible consequences of the combined impacts of local sea level rise, storm surges, and peak river discharge become apparent when considering the situation near Rotterdam
Figure 5. The Maeslant storm surge barrier near Rotterdam during a test closure (source: www.BeeldbankVenW.nl).
116 | Triennial Scientific Report
References1) Katsman, C.A., A. Sterl, J.J. Beersma, H.W. van den Brink, J.A. Church, W. Hazeleger, R.E. Kopp, D. Kroon, J. Kwadijk, R. Lammersen, J. Lowe, M. Oppenheimer, H-P. Plag, J. Ridley, H. von Storch, D.G. Vaughan, P. Vellinga, L.L.J. Vermeersen, R.S.W. van de Wal and R. Weisse, 2009. Exploring high-end scenarios for local sea level rise to develop flood protection for a low-lying delta. Submitted to Climatic Change.2) Kabat, P., L.O. Fresco, M.J.F. Stive, C.P. Veerman, J.S.L.J. van Alphen, B.W.A.H. Parmet, W. Hazeleger and C.A. Katsman, 2009. Dutch coasts in transition. Nature Geoscience 2, 450-452, doi:10.1038/ngeo572.3) Hurk, B.J.J.M. van den, A.M.G. Klein Tank, G. Lenderink, A.P. van Ulden, G.J. van Oldenborgh, C.A. Katsman, H.W. van den Brink, F. Keller, J.J.F. Bessembinder, G. Burgers, G.J. Komen, W. Hazeleger and S.S. Drijfhout, 2006. KNMI Climate Change Scenarios 2006 for the Netherlands. KNMI Scientific Report WR-2006-01, 82 pp.4) Katsman, C.A., W. Hazeleger, S.S. Drijfhout, G.J. van Oldenborgh and G.J.H. Burgers, 2008. Climate scenarios of sea level rise for the northeast Atlantic Ocean: a study including the effects of ocean dynamics and gravity changes induced by ice melt. Climatic Change, doi:10.1007/s10584-008-9442-9.5) Meehl, G.A., T.F. Stocker, W.D. Collins, P. Friedlingstein, A.T. Gaye, J.M. Gregory, A. Kitoh, R. Knutti, J.M. Murphy, A. Noda, S.C.B. Raper, I.G. Watterson, A.J. Weaver and Z.-C. Zhao, 2007. Global Climate Projections. In: Climate Change 2007: The Physical Science Basis. Contribution of Working Group 1 to the Fourth Assessment Report of the Intergovernmental Panel on Climate Change, Solomon, S. et al. (Eds.), Cambridge University Press, Cambridge, United Kingdom and New York, NY, USA.6) Vellinga, P., C.A. Katsman, A. Sterl, J.J. Beersma, J.A. Church, W. Hazeleger, R.E. Kopp, D. Kroon, J. Kwadijk, R. Lammersen, J. Lowe, N. Marinova, M. Oppenheimer, H.P. Plag, S. Rahmstorf, J. Ridley, H. von Storch, D.G. Vaughan, R.S.W. van der Wal and R. Weisse, 2008. Exploring high-end climate change scenarios for flood protection of the Netherlands. International Scientific Assessment carried out at request of the Delta Committee. KNMI Scientific Report WR-2009-05, KNMI / Alterra, the Netherlands, available from http://www.knmi.nl/bibliotheek/knmipubWR/WR2009-05.pdf7) See also http://www.knmi.nl/klimaatscenarios/aanvullend/DC/index.php.8) Sterl, A., H. van den Brink, H. de Vries, R. Haarsma and E. van Meijgaard, 2009. An ensemble study of extreme North Sea storm surges in a changing climate. Ocean Science, 5, 369-378.

Triennial Scientific Report | 117
Appendices

118 | Triennial Scientific Report
Copyright © 2022 FDOKUMEN