Tomorrow's Energy Scenarios 2017 - EirGrid
39
Tomorrow’s Energy Scenarios 2017 Planning our Energy Future
-
Upload
khangminh22 -
Category
Documents
-
view
1 -
download
0
Transcript of Tomorrow's Energy Scenarios 2017 - EirGrid
EirGrid – Tomorrow’s Energy Scenarios Report • Planning our Energy Future • Page 1
Tomorrow’s Energy Scenarios 2017
Planning our Energy Future

EirGrid – Tomorrow’s Energy Scenarios Report • Planning our Energy Future • Page 2 EirGrid – Tomorrow’s Energy Scenarios Report • Planning our Energy Future • Page 3
ForewordEirGrid, as transmission system operator for Ireland, is pleased to present the first version of Tomorrow’s Energy Scenarios.
This document brings together a wide range of factors which can influence the evolution of the electricity sector into a set of four discrete scenarios.
The electricity industry is in a period of rapid change. In the last decade, we have seen the wide-scale integration of renewables into our grid, the emergence and rapid growth of the demand side management sector and the development of ever more sophisticated electricity markets. Further change is coming to the electricity industry. This will be driven by increasing consumer engagement and the emergence of potential industry changing technologies. Preparing for, and responding to, this change is the big challenge for the electricity industry.
To prepare for and manage this change, we are introducing scenario planning into how we plan the electricity transmission grid of tomorrow. At the very heart of this approach is engagement with our stakeholders. We received a strong response to our nine week consultation on our draft scenarios earlier this year from both the industry and our public stakeholders. We believe the feedback we received has improved the final document in a number of ways – both in adding new substantial analysis elements and in providing clarity in a number of areas.
Our scenarios show that electricity demand will likely increase significantly in the future, largely due to new data centres connecting, but also due to the electrification of the heating and transport sectors over time. Similarly, the electricity generation portfolio will continue to decarbonise, with increasing levels of renewables connecting to the system. The possible ranges for these changes are explored across our four scenarios.
The path forward for the energy sector in Ireland has a lot of uncertainty – scenario planning helps us navigate this time of change. However I believe that by taking a proactive and collaborative approach in the coming years we can continue to deliver secure, sustainable power to our customers.
Fintan Slye
Chief Executive, EirGrid Group
July 2017
DisclaimerEirGrid has followed accepted industry practice in the collection and analysis of data available. While all reasonable care has been taken in the preparation of this data, EirGrid is not responsible for any loss that may be attributed to the use of this information. Prior to taking business decisions, interested parties are advised to seek separate and independent opinion in relation to the matters covered by this document and should not rely solely upon data and information contained herein. Information in this document does not amount to a recommendation in respect of any possible investment. This document does not purport to contain all the information that a prospective investor or participant in the Single Electricity Market may need.
For queries relating to this document please contact: [email protected]
COPYIGHT NOTICEAll rights reserved. This entire publication is subject to the laws of copyright. This publication may not be reproduced or transmitted in any form or by any means, electronic or manual, including photocopying without the prior written permission of the Transmission System Operator.
©EirGrid Plc. 2017
The Oval, 160 Shelbourne Road, Ballsbridge, Dublin 4, D04 FW28, Ireland.

EirGrid – Tomorrow’s Energy Scenarios Report • Planning our Energy Future • Page 4 EirGrid – Tomorrow’s Energy Scenarios Report • Planning our Energy Future • Page 5
Table of contentsForeword ....................................................................................................................................3
Document structure ....................................................................................................................7
Glossary of terms .......................................................................................................................8
Executive summary ...................................................................................................................10
1. Introduction to scenario planning .........................................................................................18
1.1. Introduction ........................................................................................................................... 18
1.2. What is scenario planning? ..................................................................................................... 18
1.3. Our scenarios at a glance ........................................................................................................ 19
1.4. The key influences on grid usage ............................................................................................ 19
1.5. Our engagement ..................................................................................................................... 20
1.6. Tomorrow’s Energy Scenarios 2017 Consultation feedback ..................................................... 21
1.7. How Tomorrow’s Energy Scenarios fit into our grid development process................................. 22
1.8. Tomorrow’s Energy Scenarios – next steps .............................................................................. 23
1.9. Continuing the conversation ................................................................................................... 23
2. Tomorrow’s Energy Scenarios ................................................................................................24
2.1. Tomorrow’s Energy Scenarios expansion ................................................................................. 26
3. Electricity demand ................................................................................................................27
3.1. Electricity demand components .............................................................................................. 27
3.2. Electricity demand growth ...................................................................................................... 28
3.3. Data centres ........................................................................................................................... 30
3.4. Electrification of transport ...................................................................................................... 31
3.5. Electrification of heat .............................................................................................................. 33
3.6. Demand side management ..................................................................................................... 35
3.7. Electricity demand breakdowns .............................................................................................. 37
4. Electricity supply ..................................................................................................................42
4.1. Fossil fuels ............................................................................................................................. 42
4.2. Coal ........................................................................................................................................ 44
4.3. Peat ........................................................................................................................................ 45
4.4. Gas ........................................................................................................................................ 45
4.5. Other fossil fuels .................................................................................................................... 47
4.6. Renewable generation ............................................................................................................ 48
4.7. Onshore wind ......................................................................................................................... 49
4.8. Offshore wind ......................................................................................................................... 51
4.9. Solar PV.................................................................................................................................. 52
4.10. Other renewable generation ................................................................................................... 55
4.11. Electricity demand breakdowns .............................................................................................. 55

EirGrid – Tomorrow’s Energy Scenarios Report • Planning our Energy Future • Page 6 EirGrid – Tomorrow’s Energy Scenarios Report • Planning our Energy Future • Page 7
Document structureThis document contains a glossary of terms section, an executive summary, six main chapters and two appendices. The structure of the document is as follows:
The glossary of terms explains some technical terms used in the document.
The executive summary gives an overview of the main highlights of the document and presents summaries of the main scenario components.
Chapter 1 introduces the concept of scenario planning. It discusses the main influences on the future usage of the grid and it outlines how the scenarios will be used in the grid development process.
Chapter 2 describes the stories behind the four scenarios, summarises some key highlights in each scenario, and shows how the scenarios develop over time.
Chapter 3 describes the components which make up electricity demand and how these factors change in each scenario.
Chapter 4 describes the components which make up electricity supply and how these factors change in each scenario.
Chapter 5 describes assumptions about the future of electricity interconnection and storage in each scenario.
Chapter 6 outlines Ireland’s future energy and emissions targets and provides an overview of how each scenario performs against these targets.
Two appendices are included at the end of this document. They provide further detail on the demand and supply data presented in this document.
5. Electricity storage and interconnection .................................................................................58
5.1. Electricity storage ................................................................................................................... 58
5.2. Interconnection ...................................................................................................................... 60
6. Ireland’s energy and emissions targets .................................................................................62
6.1. Methods of decarbonisation ................................................................................................... 62
6.2. Tomorrow’s Energy Scenarios emissions and renewable energy generation ............................. 63
6.3. 2020 targets ........................................................................................................................... 64
6.4. 2030 targets ........................................................................................................................... 64
6.5. 2050 targets ........................................................................................................................... 66
Appendix 1 – Demand tables ....................................................................................................67
Appendix 2 – Generation tables ................................................................................................68

EirGrid – Tomorrow’s Energy Scenarios Report • Planning our Energy Future • Page 8 EirGrid – Tomorrow’s Energy Scenarios Report • Planning our Energy Future • Page 9
Non-Emissions Trading Scheme (non-ETS)The non-ETS sectors cover those which are outside the EU Emissions Trading Scheme. This includes the agriculture, transport, residential, commercial, waste and non-energy intensive industry.
Single Electricity MarketThe Single Electricity Market (SEM) is the wholesale electricity market operating in Ireland and Northern Ireland.
Smart MeterNew generation electricity meters which have the ability to broadcast secure usage information to customers and energy suppliers, potentially facilitating energy efficiency savings and more accurate bills.
SONISystem Operator for Northern Ireland (SONI) Ltd is owned by EirGrid plc. SONI ensures the safe, secure and economic operation of the high-voltage electricity system in Northern Ireland and in cooperation with EirGrid is also responsible for running the all-island wholesale market for electricity.
Summer ValleyThis is the minimum electricity system demand. It occurs in the period March to September, inclusive in Ireland.
Summer PeakThis is the maximum electricity system demand in the period March to September, inclusive in Ireland.
Terawatt hour (TWh)1,000,000,000,000 watt hours, a unit of energy.
Tonne of Carbon Dioxide (tCO2)A fixed unit of measurement commonly used when discussing carbon dioxide emissions.
Total Electricity Requirement (TER)TER is the total amount of electricity required by a country. It includes all electricity exported by generating units, as well as that consumed on-site by self-consuming electricity producers, e.g. CHP.
Transmission LossesA small proportion of energy is lost mainly as heat whilst transporting electricity on the transmission system. These are known as transmission losses. As the amount of energy transmitted increases, losses also increase.
Transmission PeakThe peak demand that is transported on the transmission system. The transmission peak includes an estimate of transmission losses.
Transmission SystemThe transmission system is a meshed network of high-voltage lines and cables (400 kV, 275 kV, 220 kV and 110 kV) for the transmission of bulk electricity supply around Ireland and Northern Ireland.
Winter PeakThis is the maximum annual electricity system demand. It occurs in the period October to February, inclusive in Ireland.
Glossary of termsCapacity FactorThe ratio of a generators actual power output over a period of time, to its potential output if it were possible for it to operate at full capacity continuously over the same period of time.
Combined Cycle Gas Turbine (CCGT)A collection of gas turbines and steam units; waste heat from the gas turbine(s) is passed through a heat recovery boiler to generate steam for the steam turbine(s).
Combined Heat and Power (CHP)A plant designed to produce both heat and electrical power from a single heat source.
Demand The amount of electrical power that is consumed by a customer and is measured in Megawatts (MW). In a general sense, the amount of power that must be transported from connected generation stations to meet all customers’ electricity requirements.
Demand Side Management (DSM)The modification of normal demand patterns usually through the use of financial incentives.
EirGridEirGrid plc is the state-owned company established to take on the role and responsibilities of Transmission System Operator in Ireland as well as market operator of the wholesale trading system.
Electric Vehicle (EV)A vehicle driven by an electric motor. It can either be driven solely off a battery, as part of a hybrid system or have a generator that can recharge the battery but does not drive the wheels. We only consider EVs that can be plugged in to charge.
Embedded generationRefers to generation that is connected to the distribution system or at a customer’s site.
Emissions Trading Scheme (ETS)A European Union trading scheme that allows participants to buy and sell carbon emissions allowances.
European Network of Transmission System Operators – Electricity (ENTSO-E) An association of European electricity transmission system operators. ENTSO-E was established and given legal mandates by the EU’s Third Legislative Package for the Internal Energy Market in 2009, which aims at further liberalising electricity markets in the EU.
European Union (EU)A political and economic union of 28 member states that are located in Europe.
Generation DispatchThe configuration of outputs from the connected generation units.
Gigawatt (GW)1,000,000,000 watts, a measure of power.
Gigawatt hour (GWh)1,000,000,000 watt hours, a unit of energy.
Greenhouse Gases (GHG) A gas in the atmosphere that absorbs and emits radiation within the thermal infrared range.
Gross Domestic Product (GDP) An aggregate measure of production equal to the sum of the gross values added of all resident, institutional units engaged in production (plus any taxes, and minus any subsidies, on products not included in the value of their outputs).
Gross National Product (GNP) The total value of goods produced and services provided by a country during one year, equal to the gross domestic product plus the net income from foreign investments.
Heat Pump A device that provides heat energy from a source of heat to a destination called a ‘heat sink’.
InterconnectorThe tie line, facilities and equipment that connect the transmission system of one independently supplied transmission system to that of another.
Load factorThe average power output divided by the peak power output over a period of time.
Megawatt (MW)1,000,000 watts, a measure of power.
Megawatt hour (MWh)1,000,000 watts hours, a unit of energy
Peak demandThe maximum electricity demand in any one fiscal year. Peak demand typically occurs at around 5:30pm on a week day between November and February. Different definitions of peak demand are used for different purposes.
Megavolt Ampere (MVA)1,000,000 volt-amperes, a unit of apparent power.

EirGrid – Tomorrow’s Energy Scenarios Report • Planning our Energy Future • Page 10 EirGrid – Tomorrow’s Energy Scenarios Report • Planning our Energy Future • Page 11
Tomorrow’s Energy Scenarios Executive summaryIntroducing scenario planningAt EirGrid, one of our roles is to plan the development of the electricity transmission grid to meet the future needs of society. The key to this process is considering the range of possible ways that energy usage may change in the future. We call this scenario planning.
We are introducing scenario planning into our grid development process as we believe it will encourage a flexible and robust approach to grid development which will enhance our decision making process. It will allow us to manage uncertainties and be prepared for the changes of the future. It also allows us to better engage with our stakeholders by gathering their input at the earliest possible opportunity in our grid development process.
We have investigated key influences on the future usage of the grid in order to develop our scenarios. This included an assessment of:
• Energy and climate change policies;
• Economic developments;
• Technology evolution and adaption; and
• Other national and international policies.
Using these influences, we developed four scenarios using our own experience and significant input received from government departments and agencies, energy research groups, industry representatives and bodies, and the public. Each scenario depicts a different possible future for the generation and consumption of electricity out to 2040.
We first published draft scenarios in February 2017 as part of a nine week consultation on our energy future. We had a great response to the consultation, receiving many highly detailed submissions. We have used this information to improve our scenarios and provide more information within this document.
In autumn 2017, we will be publishing ‘Tomorrow’s Energy Scenarios 2017 Locational Information Paper’ to provide more information on our locational assumptions for future electricity demand and supply.
Following that, we will analyse how the existing transmission grid performs under each of the four scenarios over a range of timeframes. The analysis will show if the existing transmission grid can support each scenario or if potential issues or risks to the safe and secure operation of the grid arise and need to be solved. The results of this analysis will be published in ‘Tomorrow’s Energy Scenarios 2017 Transmission System Needs Assessment’ report in winter 2017/18.
The scenarios will be reviewed every two years to take into account changes in the industry and energy environment.
Consumer ActionA strong economy leads to high levels of consumer spending ability. The public want to reduce greenhouse gas emissions. Electricity consumers enthusiastically limit their energy use and generate their own energy. This results in a large number of community led energy projects and a rapid adoption of electric vehicles and heat pumps in the home.
There are almost 560,000 electric
vehicles on the road by 2030
17% of residential houses are heated through heat
pumps by 2030
Household batteries and Solar PV help to increase
self-consumption of electricity
Steady EvolutionRenewable electricity generation maintains a steady pace of growth. This is due to steady improvements in the economy, and in the technologies which generate electricity. New household technologies help to make electricity consumers more energy aware. This increases energy efficiency in homes and businesses. Over time, electricity consumers gradually begin to make greater use of electric vehicles and heat pumps. This means that, over time, electricity powers a larger proportion of transportation and heating.
Onshore wind generation increases to approximately
5,200 MW by 2030
New 700 MW interconnector to Europe
is in place by 2025
Ireland’s 2030 emissions targets are met
Slow ChangeThe economy experiences very slow growth. Investment in new renewable generation is only in established, low risk technologies. Due to poor economic growth, new technologies that could increase the use of renewable generation at household and large scale levels are not adopted. Overall there is little change in the way electricity is generated when compared to today. Domestic consumers and commercial users are also avoiding risk and uncertainty. The only source of demand growth is the connection of new data centres but the level of investment slows down significantly after 2025.
Fossil fuel generation capacity remains over 5,000 MW by 2030
The total demand for electricity increases by 22% by 2030
compared to today
Ireland’s 2030 emissions targets are missed
Low Carbon LivingThe economy enjoys high economic growth. This encourages the creation and rollout of new technologies for low carbon electricity generation. There is strong public demand to reduce greenhouse gas emissions. In addition to high carbon prices and incentives for renewables, this creates a high level of renewable generation on the grid. This clean energy then combines with improvements to broadband and transport to drive growth in large data centres.
Coal generation is repowered to Gas and Peat generation is
repowered to Biomass by 2025
The total demand for electricity increases by 53% by 2030
compared to today
Data Centre connections reach 1950 MVA in 2030 - most of
these are based in Dublin

EirGrid – Tomorrow’s Energy Scenarios Report • Planning our Energy Future • Page 12 EirGrid – Tomorrow’s Energy Scenarios Report • Planning our Energy Future • Page 13
Slow Change is the only scenario with over 5,000 MW of installed fossil fuel capacity in 2030. This compares to today’s installed capacity of over 6,300 MW.
All of our scenarios assume that coal generation has ceased in Ireland by 2030 and in Low Carbon Living by 2025. There are a number of possibilities for the future repowering of Moneypoint, Ireland’s only coal generation plant, with gas, biomass, carbon capture and storage and other technologies being considered. Our scenarios have considered a number of possibilities for Moneypoint power station retrofitting to gas. This includes varying the installed capacity of the gas generation and the timing of when Moneypoint is repowered.
Peat generation has ceased in most scenarios by 2025, except in Slow Change in which it ceases by 2030. In some scenarios it is replaced by biomass.
In all scenarios, many of Ireland’s older gas generation units on the power system will retire by 2025 due to EU Emissions Directives. This includes units at Aghada, North Wall and Marina. Our scenarios assume new gas generators will be on the system between 2017 and 2040.
It is likely that some form of carbon abatement technology will be required for gas generation in the long term in order to meet emissions targets.
Electricity supply – renewable generationOur scenarios consider a variety of renewable energy sources on the power system. In our high renewables scenarios, Low Carbon Living and Consumer Action, the differences lie in where the renewables connect to the power system. Low Carbon Living sees much more renewables connecting at large scale to the transmission and distribution systems. Consumer Action sees renewables connecting more at distribution system and household levels, with local community projects becoming popular.
The variation in renewable generation capacity in our scenarios grows dramatically over time. This represents the many uncertainties surrounding the build out of renewable generation in the future.
Installed renewable generation capacities vary between 5,600 MW in Slow Change and 12,100 MW in Low Carbon Living by 2030.
The installed capacity of onshore wind generation continues to grow across all scenarios as the levelised cost of wind energy decreases over time. The largest challenge for the connection of further wind is the social acceptance of this technology. The largest installed capacity of onshore wind generation is in Low Carbon Living. This reaches a capacity of 5,500 MW by 2030.
Ireland has enormous potential for offshore energy developments. Offshore wind is more costly to develop than onshore wind in Ireland. Although prices are dropping in Europe, it is still likely that subsidies will be required for its significant development off the coast of Ireland. It is also very likely Ireland will require some additional offshore wind generation to meet future decarbonisation targets as we have reflected in our scenarios.
In our Low Carbon Living scenario, we have assumed 3,000 MW of offshore wind generation capacity is developed, some of which is connected with a new electricity interconnector to Great Britain in 2030.
Solar photovoltaic (PV) generation has become a more economically viable form of electricity generation in recent years. It is likely that we will see large scale solar PV connecting to the system at an increasing rate from the mid-2020s without the need for a subsidy due to decreasing capital costs. Solar generation is most likely to locate in the southern and eastern parts of the country as they have the highest sun exposure. Our scenarios consider a range of installed solar PV capacities between 200 MW and 2,500 MW in 2030 due to the uncertainty of how the technology will develop.
Electricity demandElectricity demand in Ireland has begun to grow once more following a sharp decline due to the economic downturn in 2008. Electricity demand growth has many contributing factors. Population growth, economic growth, and of course the effects of weather are examples. However, there have been increasing breaks in these trends in the past decade which may be evidence that energy efficiency measures are working.
Our scenarios consider a large number of variables such as the electrification of heating and transport, the rollout of smart meters, and the increase in demand side management in the residential and commercial sectors. However, future demand growth is mainly being driven by large industrial customers connecting onto the system such as data centres.
Data centres account for over 75% of new demand growth in most of our scenarios.
The largest data centre demand growth is in our Low Carbon Living scenario. In this scenario, data centres are attracted by Ireland’s improved infrastructure, as a result of strong economic growth, and high levels of low carbon generation.
The largest adoption of electric vehicles and heat pumps occurs in our Consumer Action scenario. This is a result of consumers trying to lower their carbon footprint.
Our scenarios see the total electricity demand increasing by between 22% and 53% by 2030 compared to today.
Over time, the increasing number of smart devices in the home, combined with the rollout of smart meters, will lead to an increased level of ‘peak shifting’. Peak shifting is the movement of electricity demand away from the traditional demand peak in the evening, to a different time of the day – usually at night. This plays an increasing role in levelling off the total electricity demand peak seen in the scenarios over time.
Our scenarios see the total electricity demand peak increasing by between 10% and 22% by 2030 compared to today.
Our scenarios predict a relatively slow uptake of pure electric vehicles until 2025-2030. It is likely that hybrid vehicles will act as a transition between fossil fuel vehicles and electric vehicles. From 2025 onwards, improvements in battery technology and decreasing capital costs of electric vehicles are expected to significantly increase the level of electric vehicle uptake.
Our Consumer Action scenario contains approximately 560,000 electric vehicles on the road in 2030.
Our scenarios looked at a number of technologies for the electrification of heating in the future. Storage heaters, district heating, and community owned combined heat and power plants have all been discussed.
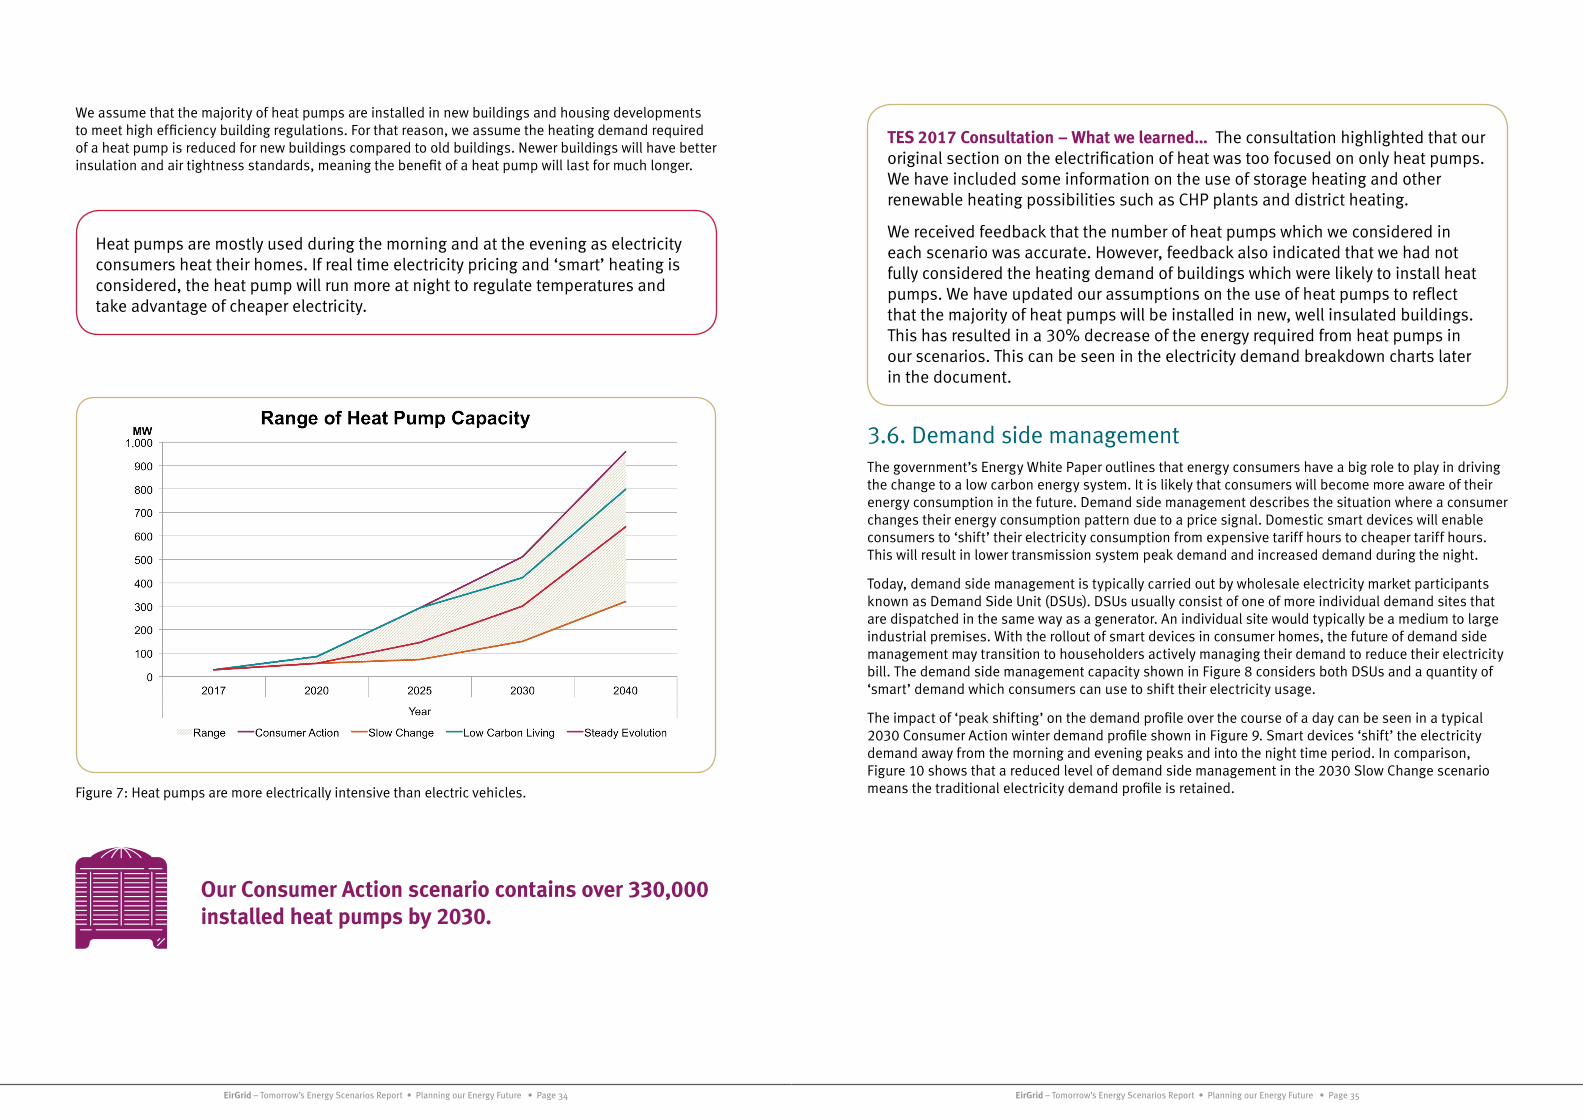
We consider heat pumps to be the primary method by which heating electrifies in the future. Heat pumps are used for space heating and cooling, as well as water heating. We assume that the majority of heat pumps are installed in new buildings and housing developments in order to meet high efficiency building regulations. Heat pumps are more electrically intensive than electric vehicles.
Our Consumer Action scenario contains over 330,000 installed heat pumps by 2030.
Electricity supply – fossil fuel generationThe trend towards decarbonisation and reducing carbon output in the future will lead to a reduction in the operating hours of large fossil fuel generators. Our scenarios examine possibilities for the future of coal, peat, gas and other fossil fuels.
The range of total fossil fuel generation capacity remains relatively narrow throughout the four scenarios. However, the generation portfolios themselves change dramatically as some generation fuel types cease production, while other new generation is commissioned.

EirGrid – Tomorrow’s Energy Scenarios Report • Planning our Energy Future • Page 14 EirGrid – Tomorrow’s Energy Scenarios Report • Planning our Energy Future • Page 15
All of our scenarios show a decrease in carbon emissions out to 2030. Slow Change has the highest carbon production as it has the lowest level of low carbon electricity supply. Consumer Action also has a relatively higher carbon production level compared to Steady Evolution and Low Carbon Living. This is a result of a large increase in electricity demand as the heating and transport sectors electrify, but is also due to lower investment in large scale renewable solutions in comparison to Low Carbon Living.
By 2030, Low Carbon Living produces just 27% of today’s annual carbon dioxide production from the power generation sector. This on the way to meeting 2050 emissions targets but further improvements will be required for the long term.
The output of our scenarios can be used as guidance to the possible futures seen if such electricity generation and supply portfolios were to develop. All of these scenarios would require change in order to become a reality. In particular, significant changes to the generation, demand, interconnection and storage portfolios would be needed in order to achieve the high renewable generation and low carbon output seen in Low Carbon Living.
By 2030 renewable electricity generation may vary between 47% and 75% of total electricity demand depending on the scenario.
Rooftop solar PV on households and businesses remains relatively expensive. It is unlikely we will see large capacities materialise until post-2025 unless the government incentivises it.
In 2030, distributed solar PV reduces the system demand by over 500 MW between 11:00 a.m. and 5:00 p.m. in the 2030 Consumer Action scenario during the summer.
All of our scenarios show biomass generation increasing in capacity over the next 25 years. This includes some new generators, combined with an uptake in community led combined heat and power schemes. There is also a conversion of Ireland’s peat generation stations to biomass in some scenarios.
Ireland has a considerable potential for ocean generation. However, wave and tidal generation technology remains in its infancy and is very expensive to develop. We have also assumed no further large scale hydro generation developments in Ireland.
It is likely that ocean energy will have a larger role to play in Ireland’s decarbonisation later in this century.
Electricity storage and interconnectionElectricity storage at large scale levels has traditionally been pumped hydro energy storage, such as Ireland’s Turlough Hill generating station. Battery energy storage has become more economically viable due to decreasing capital costs. Due to its relatively small footprint compared to other storage methods, it currently has the greatest potential for electricity storage in the future.
Large scale grid connected battery energy storage will likely connect along with renewables such as solar and wind to help reduce curtailment levels. Household battery energy storage will likely connect with domestic solar PV to provide additional self-consumption for consumers. Due to high capital costs, our scenarios see small levels of battery storage until 2025-2030 at which point there is an increase.
Total energy storage capacity reaches 2,350 MW in our Low Carbon Living scenario by 2030; this includes new battery energy storage and new pumped hydro storage.
Transmission grids are often interconnected so that energy can flow from one country to another. Ireland is currently interconnected to Great Britain through the East-West Interconnector which has a capacity of 500 MW. Our scenarios have considered further interconnection to both France and Great Britain. The connection dates of the interconnectors vary depending on the scenario.
Our Steady Evolution scenario has an interconnection capacity of 18.9% of the total electricity production capacity by 2030 – this is above the EU’s aspirational 2030 target of 15%.
Ireland’s energy and emissions targetsDecarbonisation of the energy system is a trend which will continue into the future. There are many ways to achieve this. Carbon price schemes, renewable generation feed-in-prices and subsidy schemes, energy efficiency measures and increased customer awareness are all methods of decarbonising. Our scenarios refer to these methods throughout the document.
While this document is not intended to be a decarbonisation roadmap, each scenario can show what level of carbon dioxide would be outputted from the power generation sector if that scenario were to occur. They can also show what level of renewable generation meets electricity demand in the future.
Over 40% of the total electricity generation, as a percentage of demand, comes from renewable generation in Steady Evolution and Low Carbon Living in 2020. This meets our 2020 renewable electricity target.

EirGrid – Tomorrow’s Energy Scenarios Report • Planning our Energy Future • Page 16 EirGrid – Tomorrow’s Energy Scenarios Report • Planning our Energy Future • Page 17
Key statistics in 2030The following table summarises the installed generation capacities and key demand components in our 2030 scenarios1.
Fuel TypeSteady
EvolutionLow Carbon
LivingSlow
ChangeConsumer
Action
Coal 0 0 0 0
Gas 4,660 4,210 4,660 4,660
Peat 0 0 0 0
Distillate Oil 220 100 320 100
Heavy Fuel Oil 0 0 0 0
Waste (assume 50% renewable)
100 100 80 100
Fossil Fuel Generation Total 4,930 4,360 5,020 4,810
Wind (Onshore) 5,140 5,500 4,640 5,380
Wind (Offshore) 700 3,000 250 1,000
Wind Generation Total 5,840 8,500 4,890 6,380
Hydro 240 240 240 240
Biomass/Landfill Gas(including Biomass CHP)
390 750 270 430
Solar PV 500 2,500 200 1,500
Ocean (Wave/Tidal) 50 100 20 70
Renewable Generation Total 7,070 12,140 5,660 8,670
Pumped Storage 290 650 290 290
Small Scale Battery Storage 200 500 50 800
Large Scale Battery Storage 250 1,200 50 400
Demand Side Management 500 750 400 1,000
DC Interconnection 1,200 1,950 500 1,200
Conventional Combined Heat and Power 160 180 150 190
Total Capacity 14,600 21,730 12,120 17,360
Demand Component InformationSteady
EvolutionLow Carbon
LivingSlow
ChangeConsumer
Action
Total Data Centre Capacity (MVA) 1,100 1,950 850 1,675
Total number of Electric Vehicles 247,000 426,000 90,000 560,000
Total % of Vehicles which are Electric 11% 19% 4% 25%
Total number of Heat Pumps 199,000 279,000 100,000 339,000
Total % of Households with Heat Pumps 10% 14% 5% 17%
Total Demand (TWh) 36.3 43.8 35.1 42.6
1Generation and data centre capacities are rounded to the nearest 10 MW / MVA. Electric vehicles and heat pump numbers are rounded to the nearest 1,000.

EirGrid – Tomorrow’s Energy Scenarios Report • Planning our Energy Future • Page 18 EirGrid – Tomorrow’s Energy Scenarios Report • Planning our Energy Future • Page 19
1. Introduction to scenario planning1.1. IntroductionAt EirGrid, one of our roles is to plan the development of the electricity transmission grid to meet the future needs of society. To do this we must first consider how electricity will be generated and used years from now. This is the first step in our grid development process which helps us plan for our energy future.
The key to this process is considering the range of possible ways that energy usage may change in the future. We call this scenario planning. Scenario planning allows us to efficiently develop the grid while taking account of the uncertainties associated with the future demand for electricity and the future technologies used to generate electricity.
We have developed four scenarios. Each scenario predicts a different possible future for the generation and consumption of electricity out to 2040. We developed these scenarios using our own experience and significant input received from government departments and agencies, energy research groups, industry representatives and bodies, and the public.
We first published draft scenarios in February 2017 as part of a nine week consultation on our energy future. We have used feedback and contributions from this consultation to help us improve the scenarios that are published in this document.
This chapter discusses why we are introducing scenario planning, the factors which influenced our scenario development process, and how the scenarios will feed into the future planning and operation of the transmission grid.
1.2. What is scenario planning?One of the most fundamental parts of planning the development of an electricity grid is forecasting how electricity generation and consumption will change over time. It can also be the most difficult part of the process. There are a lot of different factors that effect changes in electricity generation and consumption. These factors include economic performance, population growth, government policies, technology developments and changes in consumer behaviour and attitudes.
As a result, planning for our energy future can be a complex task. Scenario planning is a method of planning for an uncertain future. We have developed four scenarios which cover a range of years from 2020 to 2040. Each scenario considers a different possible future for the generation and consumption of electricity.
The first step in implementing scenario planning is to identify the different factors that influence the future of electricity generation and consumption. We then consider the possible ways in which these key factors may develop into the future. We also consider how these factors may be linked. For example, a strong economy may be linked with higher consumption of electricity and more investment in new technologies. Ultimately we develop a set of scenarios with each one telling a unique story.
Once we have finalised the scenarios, we check if the grid of today is strong enough to handle the changes predicted in each scenario. If it is not, we assess the extent of any issue. We also look at the cause of the issue and the likelihood of it occurring. If we need to fix an issue, we then look at a range of solutions. Taking the scenario planning approach, we can develop an efficient, strong and flexible grid for the future.
We are introducing scenario planning into our grid development process as we believe it will encourage a flexible and robust approach to grid development which will enhance our decision making process. It will allow us to manage uncertainties and be prepared for the changes of the future.
Introducing scenario planning also allows us to better engage with our stakeholders. We want our stakeholders to help us develop the assumptions we use to plan our energy future. This allows stakeholder input at the earliest possible opportunity in our grid development process.
We believe that this approach will allow us to better explain what is driving the need for individual grid development projects. We also hope it will demonstrate how the electricity grid enables the achievement of national and international policy objectives.
The scenarios will be reviewed every two years to take into account changes in the industry and energy environment, and to include any other new information available to us. This two-year cycle of ‘review and renew’ will be ongoing.
Our scenarios will initially focus on Ireland only as we introduce this new process. We will investigate the development of scenarios in Northern Ireland at a later point. This will be part of a wider review of how the grid in Northern Ireland is planned and developed.
1.3. Our scenarios at a glanceWe have developed four scenarios and each one has its own a name. The scenarios are summarised below. The scenarios are described in more detail in Chapter 2.
Steady Evolution
Renewable electricity generation maintains a steady pace of growth. This is due to steady improvements in the economy and in the technologies which generate electricity. New consumer technologies help to increase energy efficiency in homes and businesses.
Low Carbon Living
The economy enjoys high economic growth. This encourages the creation and rollout of new technologies for low carbon electricity generation. A strong public demand to reduce greenhouse gas emissions, in addition to high carbon prices and incentives for renewables, creates a high level of renewable generation on the grid.
Slow Change
There is little change in the way electricity is generated due to slow economic growth and a slow response to renewable policies. The adoption of new technologies at residential, commercial and electricity generation levels has been slow due to a risk adverse approach.
Consumer Action
A strong economy leads to high levels of consumer spending ability. The public want to reduce greenhouse gas emissions. Electricity consumers enthusiastically limit their energy use and generate their own energy. This results in a large number of community led energy projects and a rapid adoption of electric vehicles and heat pumps in the home.
1.4. The key influences on grid usageThe first step in developing scenarios is to identify factors that will influence the future usage of the grid. We investigate factors that influence the location, size, quantity, type and pattern of electricity generation and consumption. We consider the profile of electricity usage by domestic, commercial, agricultural and industrial users. We also consider factors that influence investments in interconnection between the Ireland and Northern Ireland power grids and those of Great Britain and the rest of Europe.
We looked to the past to identify which factors historically influenced changes in the usage of the grid. We have also talked with a wide a range of stakeholders and the public to get their views on what factors may influence the future usage of the grid. The outcome of this process is a list of factors which we believe will have a large impact on the usage of the grid in the future. The most significant of these are outlined below.

EirGrid – Tomorrow’s Energy Scenarios Report • Planning our Energy Future • Page 20 EirGrid – Tomorrow’s Energy Scenarios Report • Planning our Energy Future • Page 21
1.4.1. Energy and climate change policiesEnergy and climate change policies have historically played a key role in changes in energy usage. We expect that they will continue to play a key role in the future development of Ireland’s energy usage. National policies relating to high carbon emitting power stations can impact on the location and size of power stations connected to the grid. Policies that assign a cost to producing carbon dioxide will lead to price increases for burning fossil fuels over time. Changes in policy may lead to replacing fossil fuel generation with renewable generation or low carbon technologies. Policies can also incentivise the use of electric vehicles or electrification of the heating sector. These elements are explored further in Chapter 6 which provides details on Ireland’s future energy and emissions targets to 2050. It also breaks down how each scenario performs against these targets.
1.4.2. Economic developmentsEconomic trends, both nationally and internationally, can impact on the usage of the grid. Historically there have been strong links between trends in economic growth and usage of electricity across all sectors. Economic growth is also closely linked with investments in new technologies at both the generation and consumer levels. It can also be linked with new industrial customers locating in Ireland. Industrial customers are among the largest users of electricity on the grid.
1.4.3. Technology evolution and adaptionNew developments in generation and consumer technology can impact on the usage of the grid in many ways. Generation technology breakthroughs can change the way electricity is supplied to the grid. Changes in the technologies used by consumers can increase energy efficiency. It can also change how much electricity is used by householders and businesses. Technology changes can also change the time of day and night when electricity is used by consumers.
1.4.4. Other national and international influencesThere are a number of other influences which impact the future use of the electricity grid. These include environmental and planning policies, job creation and industrial development policies. EU policies and regulations can impact future interconnection. It is important for us to keep up-to-date on these influences to ensure we can reflect any changes in our assumptions for planning the transmission grid.
1.5. Our engagementOur stakeholders are central to the development of Tomorrow’s Energy Scenarios. The government’s Energy White Paper highlighted that electricity consumers are increasingly driving the transformation of the energy sector. We want our stakeholders to help us shape our scenarios by providing us with feedback on how our industry might develop in the future. We would also like to better understand how the grid can be developed to support future government policy. These principles are outlined in our ‘Have Your Say’ publication .
When we initially examined the key influences on the future usage of the grid, we identified a number of national stakeholders with expertise in these areas. This group consisted of government departments, government agencies and energy research groups. This stakeholder group provides expertise in the future of government policy in the areas of energy, jobs, transport, environment and agriculture. The group also has knowledge of future developments of the energy industry and in new generation, consumer and transmission technologies. Through engagements with these stakeholders we obtained data, information and feedback on the future development of the energy industry.
We have also engaged with transmission system operators in other countries who use scenario planning. We are bringing together the best methods from around the world to ensure our scenario planning is as efficient and accurate as possible.
Through conversations with these stakeholders we developed our draft Tomorrow’s Energy Scenarios 2017 which were published for consultation in February 2017. We received a large amount of feedback on our draft scenarios through our consultation. We have used this feedback to help us improve our scenarios. More details on the outcomes of our consultation are included in Section 1.6.
1.6. Tomorrow’s Energy Scenarios 2017 Consultation feedbackIn February 2017 we published the Tomorrow’s Energy Scenarios 2017 Consultation. This consultation outlined four draft scenarios for Ireland’s energy future. We sought feedback on the draft scenarios from the energy industry and the public. We had a great response to the consultation, receiving many highly detailed submissions. The submissions provided us with guidance and information to help improve the final scenarios.
In general, there was a lot of positive feedback on introducing a scenario planning approach into our grid development process. The benefits of this approach were clearly recognised by both the public and the energy industry. Our four scenario stories were also considered to cover a broad enough range of futures to robustly plan the future grid.
We received a large amount of new information on the future of electricity demand and supply in Ireland. We have used this information to improve our scenarios and provide more information within this document.
We also received suggestions on more information which the public and energy industry would like to see in this document. Some of the key updates incorporated into this document include:
• Expanded information on how the scenarios fit into our grid development process – this can be found in Section 1.7.
• Clear information on the next steps for Tomorrow’s Energy Scenarios, including information on the locational assumptions for our scenarios, can be found in Section 1.8.
• Further information on Ireland’s future energy and emissions targets, and how each scenario performs against these targets, is given in Chapter 6.
• An expanded version of our electricity demand and supply information for each year and each scenario has been provided in two appendices.
Additionally, a number of changes and information notes have been incorporated throughout the document in response to feedback. A summary of the feedback which we received is included at the end of each section in Chapters 3-5.
2 EirGrid Group – Have Your Say – 2017

EirGrid – Tomorrow’s Energy Scenarios Report • Planning our Energy Future • Page 22 EirGrid – Tomorrow’s Energy Scenarios Report • Planning our Energy Future • Page 23
1.7. How Tomorrow’s Energy Scenarios fit into our grid development processIn early 2017, we published our ‘Have Your Say’ document. This document outlines the six step process of how we develop projects and how our stakeholders and the public can interact with us throughout this process. The six steps are summarised in Figure 1. The six step process brings together key strategic statements from our ‘Ireland’s Grid Development Strategy – Your Grid, Your Tomorrow’ publication. These are:
• Inclusive consultation with local communities and stakeholders will be central to our approach;
• We will consider all practical technology options; and
• We will optimise the existing grid to minimise the need for new infrastructure.
As part of Step 1, we analyse how the existing transmission grid performs under each of the four scenarios over a range of timeframes. The analysis will show if the existing transmission grid can support each scenario, or if potential issues or risks to the safe and secure operation of the grid arise.
These issues or risks are further assessed to identify their causes. This informs us about any potential ‘need’ to develop the future electricity grid in order to solve the issue or risk. The analysis may identify many ‘needs’ in the same area. These may be grouped together as one regional ‘need’.
The results of this analysis and the resulting ‘needs’ will be published in a report titled ‘Transmission System Needs Assessment’. Further information on this report can be found in Section 1.8.
After identifying system ‘needs’, further analysis will be carried out to examine possible solutions in line with our six step process shown in Figure 1.
While Tomorrow’s Energy Scenarios will mainly influence Step 1, they are utilised throughout the six step process to constantly assess and re-assess the ‘needs’ of the future electricity system. They will be used to test the solution options for any issue found. They will also be used to continually assess the need for a project as the project moves from one step to another. This will increase the robustness of our grid development process.
In addition to becoming part of the grid development process, Tomorrow’s Energy Scenarios will also be used in future system operational studies. The scenarios will be used to examine the operational capability in the future. This will provide us with guidance on future operational policies and methods which need to be developed in order to safely operate the system in the future.
Figure 1: Our six step process for developing the grid.
Step 1How do we identify the future needs of the electricity grid?
Step 4Where exactly should we build?
Step 2What technologies can meet these needs?
Step 5The planning process
Step 3What’s the best option and what area may be affected?
Step 6Construction, energisation and benefit sharing
1.8. Tomorrow’s Energy Scenarios – Next stepsThe publication of Tomorrow’s Energy Scenarios 2017 is the first step towards ‘Planning our Energy Future’.
As part of our consultation process we received a number of queries in relation to our locational assumptions for future electricity demand and supply. As a response to feedback, we will be publishing ‘Tomorrow’s Energy Scenarios 2017 Locational Information Paper’ in autumn 2017.
This will set out our assumptions on the future locations for generation and demand which we have included in Tomorrow’s Energy Scenarios 2017. Feedback which we receive on this paper will be incorporated into future revisions of our scenarios. We will be providing more information on the publication, and how to provide us with feedback on the information paper, later this year.
After finalising our assumptions for future demand and generation locations, we will be carrying out an assessment of the existing transmission grid using the scenarios. This process will use the method outlined in Section 1.7. The results of this analysis will be published in ‘Tomorrow’s Energy Scenarios 2017 Transmission System Needs Assessment’ report in winter 2017/18.
1.9. Continuing the conversationTomorrow’s Energy Scenarios 2017 is the beginning of our interactions with stakeholders and the public on planning our energy future. We plan to continue gathering insights from the energy industry and public over the coming months and years to help us improve our scenarios for our 2019 version of this document.
Please visit our website for further information on our scenarios. Alternatively, please email us your views on Tomorrow’s Energy Scenarios to [email protected] and one of our team will be in touch.
We look forward to receiving your feedback and using it to improve Tomorrow’s Energy Scenarios in the future.

EirGrid – Tomorrow’s Energy Scenarios Report • Planning our Energy Future • Page 24 EirGrid – Tomorrow’s Energy Scenarios Report • Planning our Energy Future • Page 25
2. Tomorrow’s Energy Scenarios
Steady Evolution
Onshore wind generation increases to approximately
5,200 MW by 2030
New 700 MW interconnector to Europe is
in place by 2025
Ireland’s 2030 emissions targets are met
Steady EvolutionRenewable electricity generation maintains a steady pace of growth. This is due to steady improvements in the economy, and in the technologies which generate electricity. New household technologies help to make electricity consumers more energy aware. This increases energy efficiency in homes and businesses. Over time, electricity consumers gradually begin to make greater use of electric vehicles and heat pumps. This means that, over time, electricity powers a larger proportion of transportation and heating.
Coal generation is repowered to Gas and Peat generation is repowered to
Biomass by 2025
The total demand for electricity increases by 53% by 2030 compared
to today
Data Centre connections reach 1950 MVA in 2030 - most of these
are based in Dublin
Low Carbon LivingThe economy enjoys high economic growth. This encourages the creation and rollout of new technologies for low carbon electricity generation. There is strong public demand to reduce greenhouse gas emissions. In addition to high carbon prices and incentives for renewables, this creates a high level of renewable generation on the grid. This clean energy then combines with improvements to broadband and transport to drive growth in large data centres.
Fossil fuel generation capacity remains over 5,000 MW by 2030
The total demand for electricity increases by 22% by 2030 compared to today
Ireland’s 2030 emissions targets are missed
Slow ChangeThe economy experiences very slow growth. Investment in new renewable generation is only in established, low risk technologies. Due to poor economic growth, new technologies that could increase the use of renewable generation at household and large scale levels are not adopted. Overall there is little change in the way electricity is generated when compared to today. Domestic consumers and commercial users are also avoiding risk and uncertainty. The only source of demand growth is the connection of new data centres but the level of investment slows down significantly after 2025.
There are almost 560,000 electric vehicles on the
road by 2030
17% of residential houses are heated through heat
pumps by 2030
Household batteries and Solar PV help to increase self-
consumption of electricity
Consumer ActionA strong economy leads to high levels of consumer spending ability. The public want to reduce greenhouse gas emissions. Electricity consumers enthusiastically limit their energy use and generate their own energy. This results in a large number of community led energy projects and a rapid adoption of electric vehicles and heat pumps in the home.
EirGrid – Tomorrow’s Energy Scenarios Report • Planning our Energy Future • Page 26 EirGrid – Tomorrow’s Energy Scenarios Report • Planning our Energy Future • Page 27
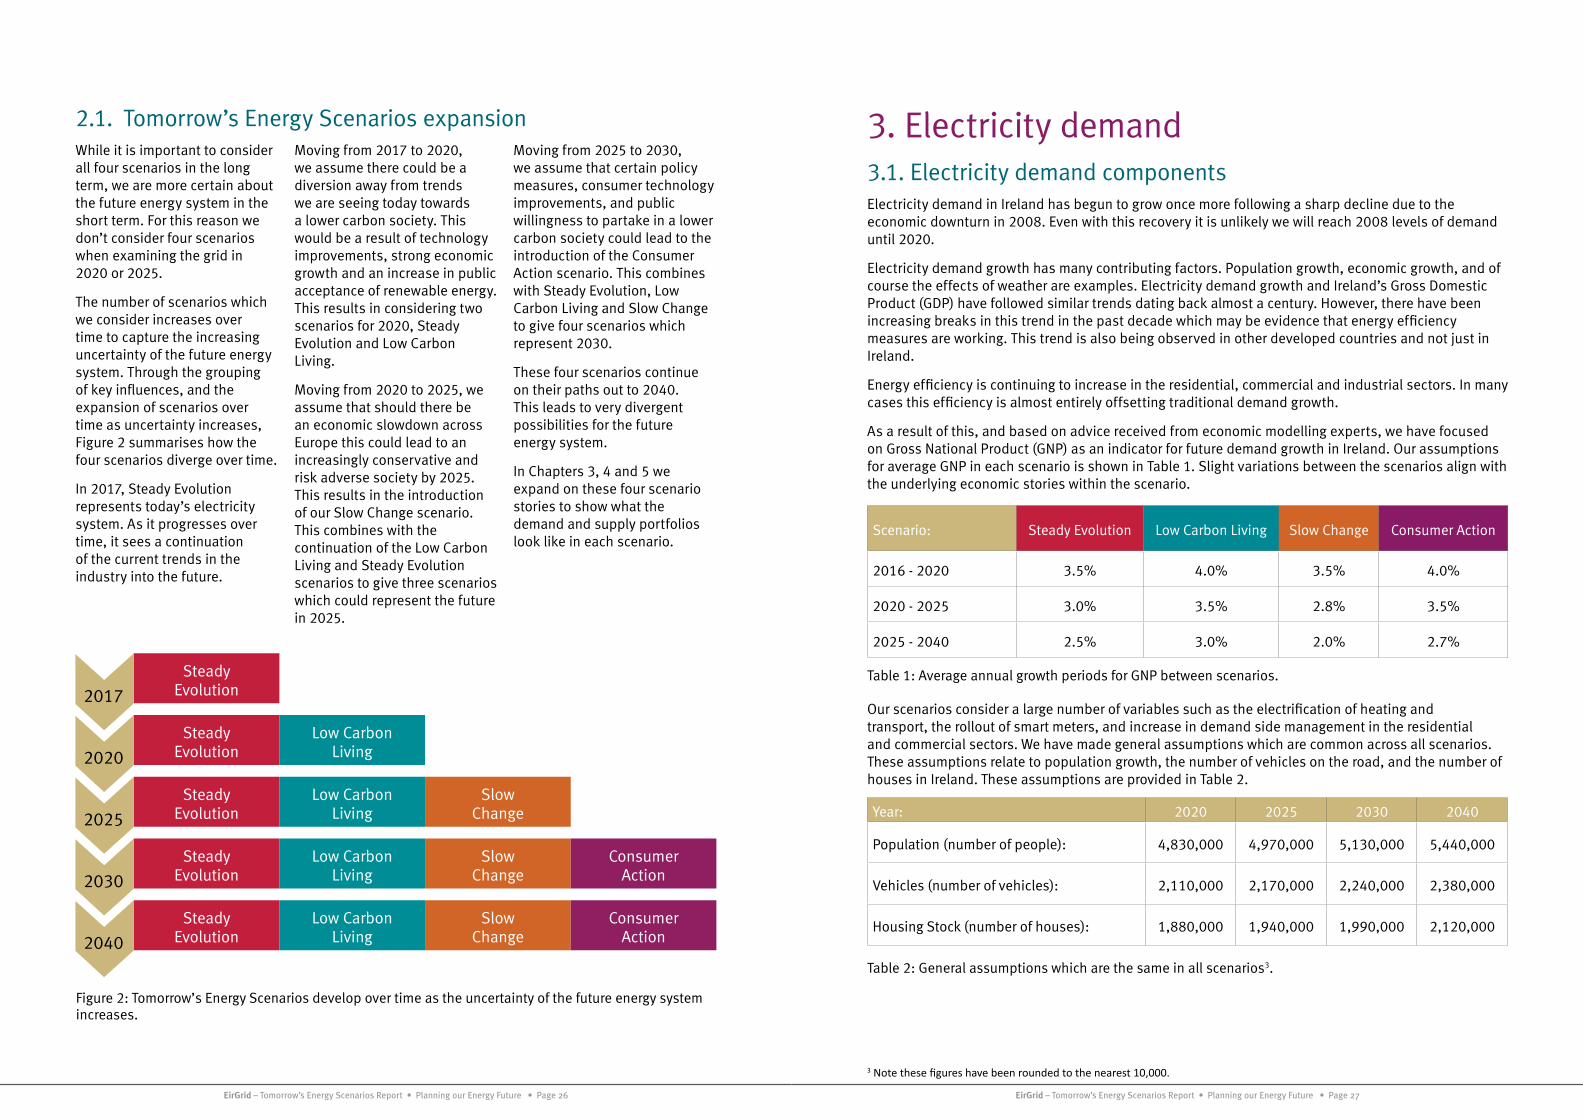
2.1. Tomorrow’s Energy Scenarios expansion While it is important to consider all four scenarios in the long term, we are more certain about the future energy system in the short term. For this reason we don’t consider four scenarios when examining the grid in 2020 or 2025.
The number of scenarios which we consider increases over time to capture the increasing uncertainty of the future energy system. Through the grouping of key influences, and the expansion of scenarios over time as uncertainty increases, Figure 2 summarises how the four scenarios diverge over time.
In 2017, Steady Evolution represents today’s electricity system. As it progresses over time, it sees a continuation of the current trends in the industry into the future.
Moving from 2017 to 2020, we assume there could be a diversion away from trends we are seeing today towards a lower carbon society. This would be a result of technology improvements, strong economic growth and an increase in public acceptance of renewable energy. This results in considering two scenarios for 2020, Steady Evolution and Low Carbon Living.
Moving from 2020 to 2025, we assume that should there be an economic slowdown across Europe this could lead to an increasingly conservative and risk adverse society by 2025. This results in the introduction of our Slow Change scenario. This combines with the continuation of the Low Carbon Living and Steady Evolution scenarios to give three scenarios which could represent the future in 2025.
Moving from 2025 to 2030, we assume that certain policy measures, consumer technology improvements, and public willingness to partake in a lower carbon society could lead to the introduction of the Consumer Action scenario. This combines with Steady Evolution, Low Carbon Living and Slow Change to give four scenarios which represent 2030.
These four scenarios continue on their paths out to 2040. This leads to very divergent possibilities for the future energy system.
In Chapters 3, 4 and 5 we expand on these four scenario stories to show what the demand and supply portfolios look like in each scenario.
Steady Evolution
Low Carbon Living
Slow Change
Consumer Action
Steady Evolution
Low Carbon Living
Slow Change
Consumer Action
Steady Evolution
Low Carbon Living
Slow Change
Steady Evolution
Low Carbon Living
Steady Evolution
2040
2030
2025
2020
2017
Figure 2: Tomorrow’s Energy Scenarios develop over time as the uncertainty of the future energy system increases.
3. Electricity demand 3.1. Electricity demand componentsElectricity demand in Ireland has begun to grow once more following a sharp decline due to the economic downturn in 2008. Even with this recovery it is unlikely we will reach 2008 levels of demand until 2020.
Electricity demand growth has many contributing factors. Population growth, economic growth, and of course the effects of weather are examples. Electricity demand growth and Ireland’s Gross Domestic Product (GDP) have followed similar trends dating back almost a century. However, there have been increasing breaks in this trend in the past decade which may be evidence that energy efficiency measures are working. This trend is also being observed in other developed countries and not just in Ireland.
Energy efficiency is continuing to increase in the residential, commercial and industrial sectors. In many cases this efficiency is almost entirely offsetting traditional demand growth.
As a result of this, and based on advice received from economic modelling experts, we have focused on Gross National Product (GNP) as an indicator for future demand growth in Ireland. Our assumptions for average GNP in each scenario is shown in Table 1. Slight variations between the scenarios align with the underlying economic stories within the scenario.
Scenario: Steady Evolution Low Carbon Living Slow Change Consumer Action
2016 - 2020 3.5% 4.0% 3.5% 4.0%
2020 - 2025 3.0% 3.5% 2.8% 3.5%
2025 - 2040 2.5% 3.0% 2.0% 2.7%
Table 1: Average annual growth periods for GNP between scenarios.
Our scenarios consider a large number of variables such as the electrification of heating and transport, the rollout of smart meters, and increase in demand side management in the residential and commercial sectors. We have made general assumptions which are common across all scenarios. These assumptions relate to population growth, the number of vehicles on the road, and the number of houses in Ireland. These assumptions are provided in Table 2.
Year: 2020 2025 2030 2040
Population (number of people): 4,830,000 4,970,000 5,130,000 5,440,000
Vehicles (number of vehicles): 2,110,000 2,170,000 2,240,000 2,380,000
Housing Stock (number of houses): 1,880,000 1,940,000 1,990,000 2,120,000
Table 2: General assumptions which are the same in all scenarios3.
3 Note these figures have been rounded to the nearest 10,000.

EirGrid – Tomorrow’s Energy Scenarios Report • Planning our Energy Future • Page 28 EirGrid – Tomorrow’s Energy Scenarios Report • Planning our Energy Future • Page 29
TES 2017 Consultation – What we learned… The feedback we received indicated that we had considered the key inputs to electricity demand for the future. However, many of the respondents said they would have liked more information on our assumptions. We have added in more details on the general assumptions which we made in each scenario and more information on all of our demand components throughout Chapter 3.
3.2. Electricity demand growth In our scenarios, future demand growth is mainly being driven by large industrial customers connecting onto the grid such as data centres. The electrification of the heat and transport sectors is also a new contributing factor. Further details of these demand components are given in the following sections.
The largest data centre demand growth is in our Low Carbon Living scenario. In this scenario, data centres are attracted by Ireland’s improved infrastructure, as a result of strong economic growth, and high levels of low carbon generation.
The largest adoption of electric vehicles and heat pumps occurs in our Consumer Action scenario. This is a result of consumers trying to lower their carbon footprint.
Over time, the increasing number of smart devices in the home, combined with the rollout of smart meters, will lead to an increased level of ‘peak shifting’. Peak shifting is the movement of electricity demand away from the traditional demand peak in the evening, to a different time of the day – usually at night. This movement is expected to occur in response to price signals to use electricity at less expensive times. It is expected that these price signals will play an increasing role in reducing the Total Electricity Requirement (TER) peak seen in the scenarios over time. TER is the total amount of electricity required by Ireland in a year. The TER peak is the maximum electricity demand of the year. This usually occurs during the winter.
Homes and businesses which have installed generation, such as solar PV panels, can meet some of their own electricity demand. This is called ‘self-consumption’. Increases in self-consumption may mean the electricity demand “seen” by the transmission system is much lower than today despite the overall increase in Total Electricity Requirement. Further details of this are provided in Chapter 4 on Electricity Supply.
Our scenarios see the Total Electricity Requirement increasing by between 22 % and 53 % to 2030.
Figure 3: The range of Total Electricity Requirement between scenarios varies greatly over time.
Figure 4: The range of Total Electricity Requirement Peak between scenarios also varies over time. Our scenarios see the Total Electricity Requirement peak increasing by between 10 % and 22 % to 2030. This is a gradual increase, highlighting that overall demand will increase primarily at times outside of traditional peak time.

EirGrid – Tomorrow’s Energy Scenarios Report • Planning our Energy Future • Page 30 EirGrid – Tomorrow’s Energy Scenarios Report • Planning our Energy Future • Page 31
3.3. Data centresData centres are large buildings which house computer servers used to store data from smartphones, tablets and computers. They require an uninterrupted supply of electricity to run the servers and cooling systems which ensure the servers do not overheat.
Data centres account for over 75% of new demand growth in most of our scenarios. Today, data centres account for less than 2% of Ireland’s total electricity demand. We predict this to increase to as much as 36% by 2030 in some scenarios. One feature of data centres is that they tend to have a flat, predictable demand profile. This means they use the same amount of electricity throughout the day and night.
Data centres pose a major challenge to the future planning and operation of the power system. They have a relatively short cost recovery period compared to the very long cost recovery period for transmission system assets. Breakthroughs in server technology may mean electricity demand from data centres could significantly decrease in the future. We have factored some of these possible energy efficiencies into our scenarios and we are keeping a close eye on further developments.
Figure 5: Our scenarios take account of a number of possible futures for data centres connecting on to the power system. The majority of which are based in the Dublin region.
TES 2017 Consultation – What we learned… The consultation suggested that the assumptions for data centres connecting to the power system are credible in our scenarios. However, it also highlighted that there are a number of international and corporate factors which may increase or decrease the levels forecasted. We will monitor developments in these areas closely and continue our conversations with data centre developers and government departments on the topic.
3.4. Electrification of transportIreland is currently on a path to miss its 2020 target for 10% renewable energy in the transport sector. Replacing fossil fuels with biofuels is one method of introducing more renewable energy into the sector.
Another method to potentially reduce emissions in the transport sector is to electrify vehicles. If the electricity used to power the vehicles comes from renewable sources, this will reduce overall emissions. Using today’s electricity mix to power an electric vehicle would result in a reduction in greenhouse gas emissions of up to 50% compared to using a fossil fuel based car. The government set a target of 50,000 electric vehicles by 2020. However, there are currently less than 3,000 electric vehicles in Ireland.
There is sufficient electric vehicle infrastructure to support much more than the government’s target. This includes smart charging capabilities at many public charge points. To take full advantage of smart charging, smart meters and improvements in car technology need to be in place.
Ireland tends to be a ‘follower’ of the UK in the car market. This is because the UK is the only other western European country that uses right hand side drive vehicles. The UK market is also 15 times larger than the Irish market. So it is likely that the electric vehicle market needs to pick up in the UK before it starts to pick up in Ireland.
Some European countries are employing incentives for citizens to move to electric vehicles. This has included allowing access to bus lanes for electric vehicles, or free on-street parking in paid parking areas. Furthermore, many European cities and countries are now pursuing a ban on the purchase of pure petrol and diesel vehicles by 2025-2040. We will continue to monitor developments in this area over the coming years.
Based on the information we received from stakeholders, we are predicting a relatively slow uptake of pure electric vehicles until 2025-2030. It is likely that hybrid vehicles will act as a transition between fossil fuel vehicles and electric vehicles. From 2025 onwards, improvements to battery technology and decreasing capital costs of electric vehicles are expected to significantly increase the level of electric vehicle uptake.
On average, charging electric vehicles requires a relatively low level of electricity. The average input from a household charger is approximately 0.9 kW, and for fast chargers is approximately 1.2 kW. Over time, it is likely that smart charging of electric vehicles becomes standard. This will charge electric vehicles primarily at night during times of cheap electricity supply. This is reflected in our scenarios.
The charging profile of electric vehicles complements the typical electricity demand profile and will help fill out the electricity demand at night.
Our Consumer Action scenario forecasts approximately 560,000 electric vehicles on the road in 2030.

EirGrid – Tomorrow’s Energy Scenarios Report • Planning our Energy Future • Page 32 EirGrid – Tomorrow’s Energy Scenarios Report • Planning our Energy Future • Page 33
What about other forms of transport electrifying? It will be difficult, but perhaps ultimately necessary, to electrify the national rail network beyond the light rail transport in urban areas. Similarly, Heavy Goods Vehicles and buses are likely to transition to compressed natural gas and biogas to decarbonise rather than electrifying. We will continue to monitor these forms of transport in the future.
We are also keeping an eye on ‘Shore Side Electricity’ which involves large ships ‘plugging in’ to the grid when docked – this could be the equivalent of a village or small town all turning on their kettles at once – it could be a big challenge for us! The maximum potential energy required for Shore Side Electricity in Dublin could be up to 300GWh per year. This is the equivalent annual electricity demand of over 50,000 households.
Figure 6: The range of electric vehicle capacity included in Tomorrow’s Energy Scenarios.
TES 2017 Consultation – What we learned… The consultation highlighted that we underestimated the potential for electric vehicles in 2030 and 2040. We have doubled the level of electric vehicles in our Consumer Action scenario in 2030. This is a result of continued decrease in electric vehicle costs, improvements in battery technology, and strong policy measures being implemented by both European countries and car manufacturers. We also learned that we had overestimated the level of electric vehicles we had forecasted for 2020. Depending on the level of additional measures taken, we now see between 8,000 and 20,000 electric vehicles on the road in 2020.
The potential for ‘upcycling’ electric vehicle batteries was also considered. This is the practice of recycling batteries at the end of a vehicle’s life to be used as a domestic battery charger. Evidence suggests electric vehicle batteries may retain approximately 70% of their initial capacity at the end of the vehicle life. We have taken account of this in our assumptions for battery energy storage later in this document.
3.5. Electrification of heatIreland is currently on a path to miss its 2020 target for 12% renewable energy in the heating sector. Replacing fossil fuels with biomass is one method of introducing more renewable energy into the sector. Steps are also being taken to introduce biogas into the gas network to further decarbonise the existing gas heating supply.
Another method to potentially reduce emissions in the heating sector is to electrify heating. If the electricity used to generate heat comes from renewable sources, this will reduce overall emissions. Reducing overall heating demand through energy efficiency will also help to meet targets.
Storage heaters can be used to store heat which is typically generated by electricity at night. The stored heat is then released throughout the day. Heat networks, or district heating, which uses the emitted heat from power generation, may also be a possibility in large cities and towns. Community owned combined heat and power (CHP) plants may become more widespread in Ireland in the future. We have considered this situation likely in Consumer Action, where consumers are invested in generating their own energy and lowering their carbon footprint.
Another technology which can be used to electrify heating supply and lower emissions is a heat pump. Heat pumps are used for space heating and cooling, as well as water heating. There are a number of different types of heat pumps which can use water, air or the ground as a source of heat. There are also hybrid heat pumps which are installed along with a gas boiler. We have considered heat pumps to be the primary method by which heating electrifies in the future.
For every unit of electricity used to operate a heat pump, there is typically 3-4 units of heat generated. The average input power of a heat pump is about 1.5 kW which is just over that of a typical kettle. On cold days, this can increase significantly as the heat pump works harder to regulate household temperature.
Heat pumps can be retrofitted into existing dwellings but in some cases this may take substantial work. Air-source heat pumps can reduce annual heating bills by approximately 40% when retrofitted compared to new oil boilers4. However, the capital costs of an air-source heat pump can be over three and a half times more expensive.
4 Sustainable Energy Authority of Ireland – ‘Replacing oil boilers with air-source heat pumps: household economics and system-wide impacts’.
EirGrid – Tomorrow’s Energy Scenarios Report • Planning our Energy Future • Page 34 EirGrid – Tomorrow’s Energy Scenarios Report • Planning our Energy Future • Page 35
We assume that the majority of heat pumps are installed in new buildings and housing developments to meet high efficiency building regulations. For that reason, we assume the heating demand required of a heat pump is reduced for new buildings compared to old buildings. Newer buildings will have better insulation and air tightness standards, meaning the benefit of a heat pump will last for much longer.
Heat pumps are mostly used during the morning and at the evening as electricity consumers heat their homes. If real time electricity pricing and ‘smart’ heating is considered, the heat pump will run more at night to regulate temperatures and take advantage of cheaper electricity.
Figure 7: Heat pumps are more electrically intensive than electric vehicles.
TES 2017 Consultation – What we learned… The consultation highlighted that our original section on the electrification of heat was too focused on only heat pumps. We have included some information on the use of storage heating and other renewable heating possibilities such as CHP plants and district heating.
We received feedback that the number of heat pumps which we considered in each scenario was accurate. However, feedback also indicated that we had not fully considered the heating demand of buildings which were likely to install heat pumps. We have updated our assumptions on the use of heat pumps to reflect that the majority of heat pumps will be installed in new, well insulated buildings. This has resulted in a 30% decrease of the energy required from heat pumps in our scenarios. This can be seen in the electricity demand breakdown charts later in the document.
3.6. Demand side managementThe government’s Energy White Paper outlines that energy consumers have a big role to play in driving the change to a low carbon energy system. It is likely that consumers will become more aware of their energy consumption in the future. Demand side management describes the situation where a consumer changes their energy consumption pattern due to a price signal. Domestic smart devices will enable consumers to ‘shift’ their electricity consumption from expensive tariff hours to cheaper tariff hours. This will result in lower transmission system peak demand and increased demand during the night.
Today, demand side management is typically carried out by wholesale electricity market participants known as Demand Side Unit (DSUs). DSUs usually consist of one of more individual demand sites that are dispatched in the same way as a generator. An individual site would typically be a medium to large industrial premises. With the rollout of smart devices in consumer homes, the future of demand side management may transition to householders actively managing their demand to reduce their electricity bill. The demand side management capacity shown in Figure 8 considers both DSUs and a quantity of ‘smart’ demand which consumers can use to shift their electricity usage.
The impact of ‘peak shifting’ on the demand profile over the course of a day can be seen in a typical 2030 Consumer Action winter demand profile shown in Figure 9. Smart devices ‘shift’ the electricity demand away from the morning and evening peaks and into the night time period. In comparison, Figure 10 shows that a reduced level of demand side management in the 2030 Slow Change scenario means the traditional electricity demand profile is retained.
Our Consumer Action scenario contains over 330,000 installed heat pumps by 2030.

EirGrid – Tomorrow’s Energy Scenarios Report • Planning our Energy Future • Page 36 EirGrid – Tomorrow’s Energy Scenarios Report • Planning our Energy Future • Page 37
Figure 8: Demand side management will play an important role in the future operation of the power system. Almost a quarter of all demand is controllable in our Consumer Action scenario by 2040.
Figure 9: The impact of demand side management moving residential and commercial demand away from the peak towards the night is clear on a typical 2030 winter day in Consumer Action.
2030 Consumer Action - Peak Shifting Winter Daily Profile
Figure 10: The impact of demand side management is less for a typical 2030 winter day in Slow Change. A lack of smart devices in the home means the traditional demand profile remains.
TES 2017 Consultation – What we learned… On balance, respondents to the consultation felt that the level of demand side flexibility shown in the scenarios was reasonable. We received requests for further information on the impact which demand side management would have on the peak demand. Examples of this have been provided for Consumer Action and Slow Change.
3.7. Electricity demand breakdownsA summary of the breakdown of electricity demand by sector is shown for each scenario in the charts below. The majority of increases in demand are a result of data centres and electrification of heat and transport.
The demand components also have a big impact on the shape of the demand profile over the course of a day. As an example of this, the differences between typical winter and summer demand profiles are shown for the Consumer Action and Slow Change scenarios in the following figures. There is a clear change in the demand profile when substantial levels of heat pumps, electric vehicles and demand side management are added to the profile in Consumer Action. This leads to a levelling off in electricity demand compared to a traditional demand curve shown in Slow Change.
2030 Slow Change - Peak Shifting Winter Daily Profile
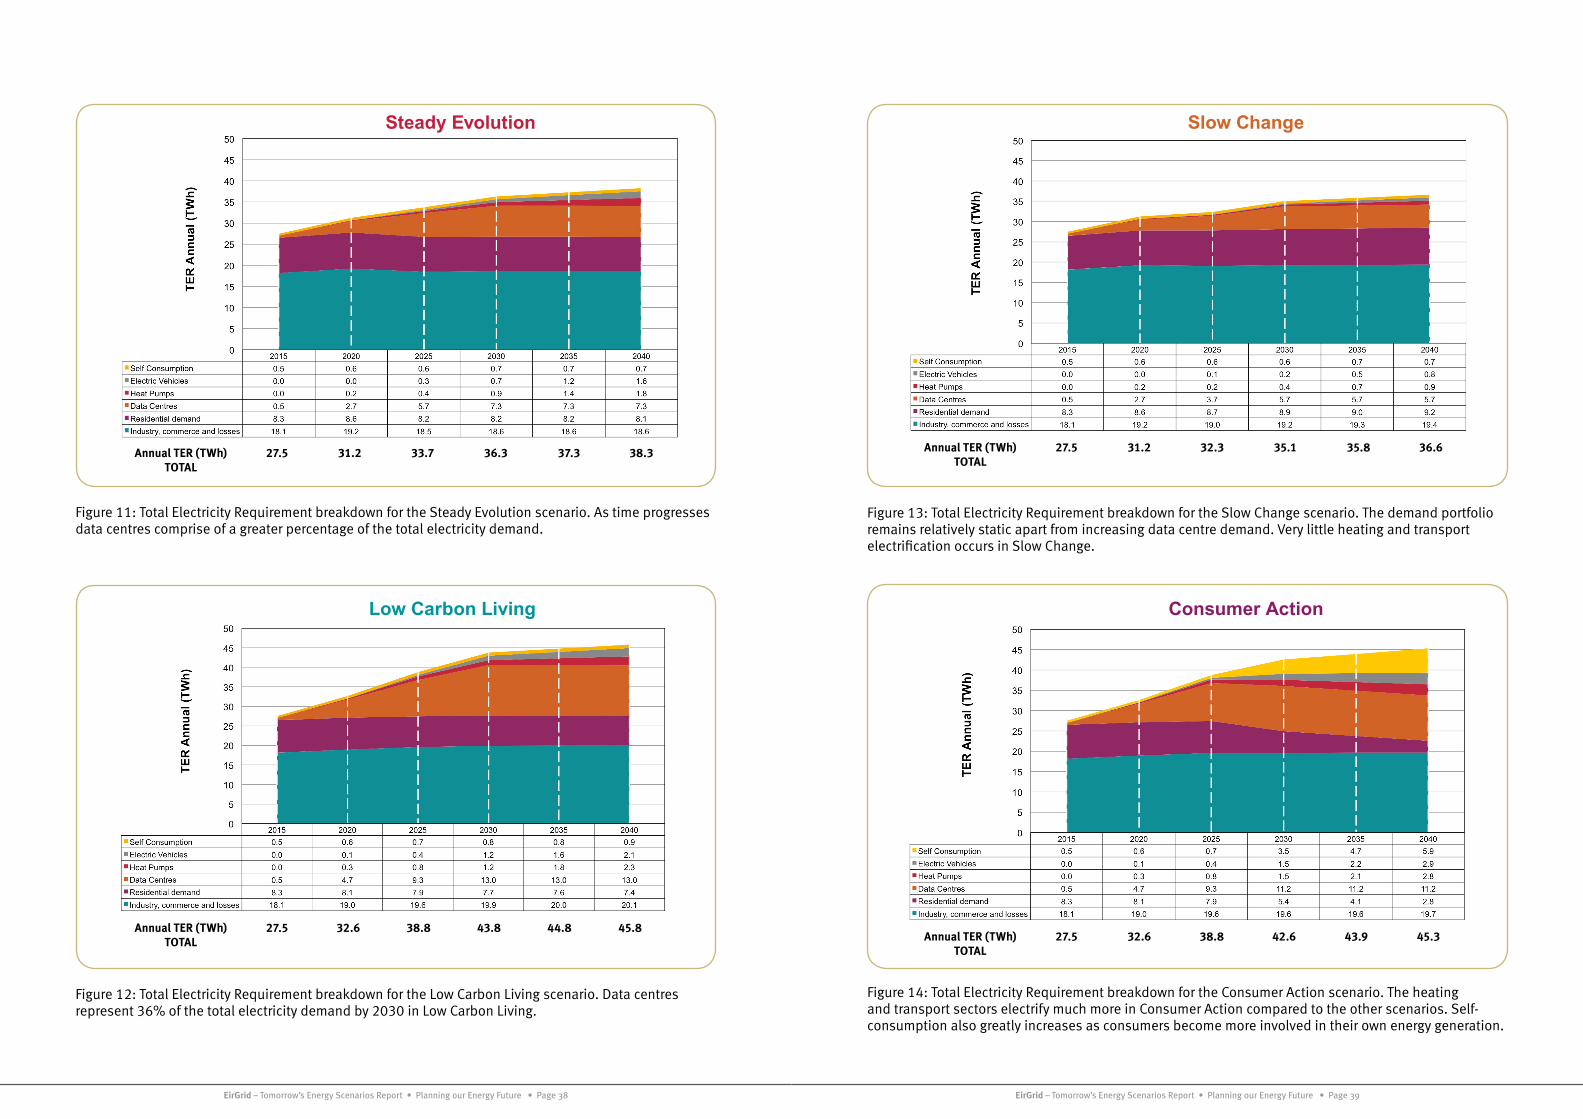
EirGrid – Tomorrow’s Energy Scenarios Report • Planning our Energy Future • Page 38 EirGrid – Tomorrow’s Energy Scenarios Report • Planning our Energy Future • Page 39
Figure 11: Total Electricity Requirement breakdown for the Steady Evolution scenario. As time progresses data centres comprise of a greater percentage of the total electricity demand.
Figure 12: Total Electricity Requirement breakdown for the Low Carbon Living scenario. Data centres represent 36% of the total electricity demand by 2030 in Low Carbon Living.
Steady Evolution
Low Carbon Living
Figure 13: Total Electricity Requirement breakdown for the Slow Change scenario. The demand portfolio remains relatively static apart from increasing data centre demand. Very little heating and transport electrification occurs in Slow Change.
Figure 14: Total Electricity Requirement breakdown for the Consumer Action scenario. The heating and transport sectors electrify much more in Consumer Action compared to the other scenarios. Self-consumption also greatly increases as consumers become more involved in their own energy generation.
Slow Change
Consumer Action
Annual TER (TWh)TOTAL
27.5 31.2 32.3 35.1 35.8 36.6
Annual TER (TWh)TOTAL
27.5 32.6 38.8 43.8 44.8 45.8Annual TER (TWh)
TOTAL27.5 32.6 38.8 42.6 43.9 45.3
Annual TER (TWh)TOTAL
27.5 31.2 33.7 36.3 37.3 38.3

EirGrid – Tomorrow’s Energy Scenarios Report • Planning our Energy Future • Page 40 EirGrid – Tomorrow’s Energy Scenarios Report • Planning our Energy Future • Page 41
Figure 15: Daily demand profile of a typical 2030 winter day in the Consumer Action scenario. Heat pumps and electric vehicles help to increase electricity demand at night and ‘peak shifting’ helps smooth out peaks. The difference between the peak and night valley is not as great as in other scenarios.
Figure 16: Daily demand profile of a typical 2030 winter day in the Slow Change scenario. There remains a large difference between electricity demand peaks and valleys as the demand profile remains relatively unchanged when compared to today.
2030 Consumer Action - Winter Daily Demand
2030 Slow Change - Winter Daily Demand
Figure 17: Daily demand profile of a typical 2030 summer day in the Consumer Action scenario. Data centre demand remains static throughout the day as they tend not to vary their demand profile throughout the day.
Figure 18: Daily demand profile of a typical 2030 summer day in the Slow Change scenario. Heat pumps and electric vehicles make little change to a similar demand profile to today.
2030 Consumer Action - Summer Daily Demand
2030 Slow Change - Summer Daily Demand
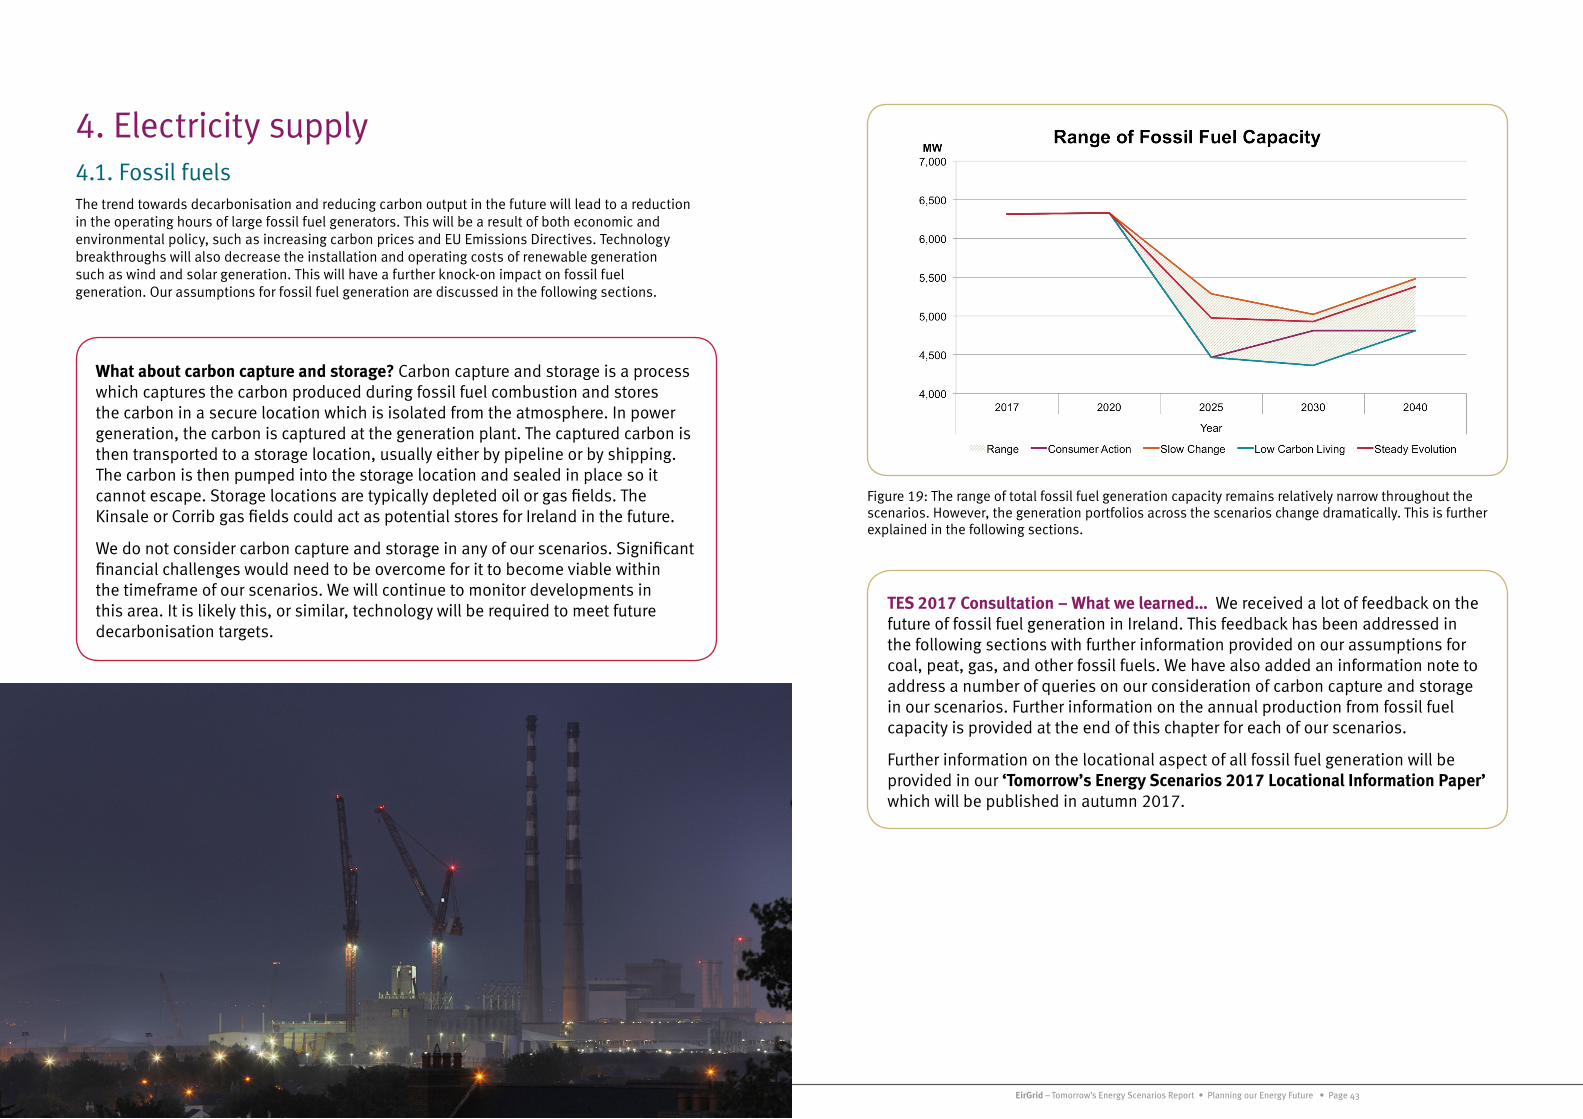
EirGrid – Tomorrow’s Energy Scenarios Report • Planning our Energy Future • Page 42 EirGrid – Tomorrow’s Energy Scenarios Report • Planning our Energy Future • Page 43
4. Electricity supply4.1. Fossil fuelsThe trend towards decarbonisation and reducing carbon output in the future will lead to a reduction in the operating hours of large fossil fuel generators. This will be a result of both economic and environmental policy, such as increasing carbon prices and EU Emissions Directives. Technology breakthroughs will also decrease the installation and operating costs of renewable generation such as wind and solar generation. This will have a further knock-on impact on fossil fuel generation. Our assumptions for fossil fuel generation are discussed in the following sections.
What about carbon capture and storage? Carbon capture and storage is a process which captures the carbon produced during fossil fuel combustion and stores the carbon in a secure location which is isolated from the atmosphere. In power generation, the carbon is captured at the generation plant. The captured carbon is then transported to a storage location, usually either by pipeline or by shipping. The carbon is then pumped into the storage location and sealed in place so it cannot escape. Storage locations are typically depleted oil or gas fields. The Kinsale or Corrib gas fields could act as potential stores for Ireland in the future.
We do not consider carbon capture and storage in any of our scenarios. Significant financial challenges would need to be overcome for it to become viable within the timeframe of our scenarios. We will continue to monitor developments in this area. It is likely this, or similar, technology will be required to meet future decarbonisation targets.
Figure 19: The range of total fossil fuel generation capacity remains relatively narrow throughout the scenarios. However, the generation portfolios across the scenarios change dramatically. This is further explained in the following sections.
TES 2017 Consultation – What we learned… We received a lot of feedback on the future of fossil fuel generation in Ireland. This feedback has been addressed in the following sections with further information provided on our assumptions for coal, peat, gas, and other fossil fuels. We have also added an information note to address a number of queries on our consideration of carbon capture and storage in our scenarios. Further information on the annual production from fossil fuel capacity is provided at the end of this chapter for each of our scenarios.
Further information on the locational aspect of all fossil fuel generation will be provided in our ‘Tomorrow’s Energy Scenarios 2017 Locational Information Paper’ which will be published in autumn 2017.

EirGrid – Tomorrow’s Energy Scenarios Report • Planning our Energy Future • Page 44 EirGrid – Tomorrow’s Energy Scenarios Report • Planning our Energy Future • Page 45
4.2. Coal Coal fired generation is one of the largest contributors to carbon dioxide emissions on the power system today5. It has a higher carbon dioxide output compared to gas per MWh of energy generated. Coal is currently a cheaper fossil fuel than gas. While the price of both fuels vary independently, the cost of coal is likely to surpass gas in the future as the cost of outputting carbon increases.
Ireland’s only coal-fired generating plant, Moneypoint, has sufficient emissions abatement technology installed to run unhindered under current EU Emissions Directives. Future emissions directives may require further works to keep Moneypoint running as a coal-fired plant.
All of our scenarios assume that coal generation has ceased in Ireland by 2030 and in Low Carbon Living by 2025.
There are a number of possibilities for the future repowering of Moneypoint with gas, biomass, carbon capture and storage and other technologies being considered. For the purposes of our scenarios, we assume that gas is the fuel type chosen for the repowering of Moneypoint in the future. Gas Networks Ireland has included a strategy to extend the gas network in order to achieve this in their 2016 Network Development Plan6.
Our scenarios have considered a number of possibilities for Moneypoint power station retrofitting to gas. This includes varying the installed capacity of the gas generation and the timing of when Moneypoint is repowered.
The government has committed to making key decisions about the future of Moneypoint by 2020.
Carbon dioxide emissions from coal-fired power generation in Ireland fell over the period between 2005 and 2015. This was a result of EU Emission Directives, such as the introduction of a carbon price and stricter emissions limits. The variation in usage of coal generators over this period is also a contributing factor.
TES 2017 Consultation – What we learned… We received feedback from a number of respondents, including the generator owner, that the continuation of coal-fired power generation at Moneypoint was unlikely even in a worst case scenario by 2030. In response to feedback, we have removed all coal generation from our scenarios in 2030, including Slow Change. We will continue to monitor developments in this area in the future and continue our conversations with the government and generator owners.
5 Sustainable Energy Authority of Ireland – Energy-Related Emissions in Ireland – 2016 Report
6 Gas Networks Ireland – Network Development Plan 2016
4.3. PeatPeat has the highest carbon dioxide intensity of any fossil fuel. It has a higher carbon dioxide output compared to coal and gas per MWh of energy generated7. Some peat generation is currently supported by the Public Service Obligation levy but this will end in 2019.
The cost competitiveness of running peat generation, relative to other fossil fuels will likely diminish after this as the price of carbon rises over time. A reduction in the carbon dioxide intensity of electricity generated from peat stations can be achieved by ‘co-firing’ biomass with peat. ‘Co-firing’ involves using two different fuels at the same time to output power. The Edenderry power station has been co-firing biomass with peat since 2008. It has seen a reduction in carbon dioxide output per MWh of energy generated over this period of approximately 40%.
Peat generation has ceased in all our scenarios by 2025 except Slow Change in which it ceases by 2030. In some scenarios it is replaced by biomass.
Carbon dioxide emissions from peat-fired power generation in Ireland rose by 10.4% between 2005 and 2015.
TES 2017 Consultation – What we learned… The consultation feedback we received on our assumptions for peat generation supported our assumptions as reasonable. Additional information was provided to us on the benefits of ‘co-firing’ biomass with peat generation to reduce carbon dioxide output. This feedback has been reflected in our document.
4.4. GasGas is widely considered to be the ‘cleanest’ fossil fuel with the lowest levels of carbon dioxide emitted per MWh of energy generated.
In all scenarios, many of Ireland’s older gas generation units on the power system will retire by 2025 due to EU Emissions Directives. This includes units at Aghada, North Wall and Marina.
Our scenarios assume new gas generators will be on the system between 2017 and 2040. These include new combined cycle gas turbine units in Moneypoint and in Dublin.
In some scenarios, Ireland’s distillate oil units retire over time but in other scenarios they convert to gas to reduce their emissions output.
In order to meet our long term emissions targets, with a primarily gas-fired conventional generation portfolio, it is likely some form of advanced carbon abatement technology will be required. Some possibilities include carbon capture and storage or large scale biogas use. This will be further discussed in Chapter 6 on Ireland’s energy and emissions targets.
7 Sustainable Energy Authority of Ireland – Energy-Related Emissions in Ireland – 2016 Report
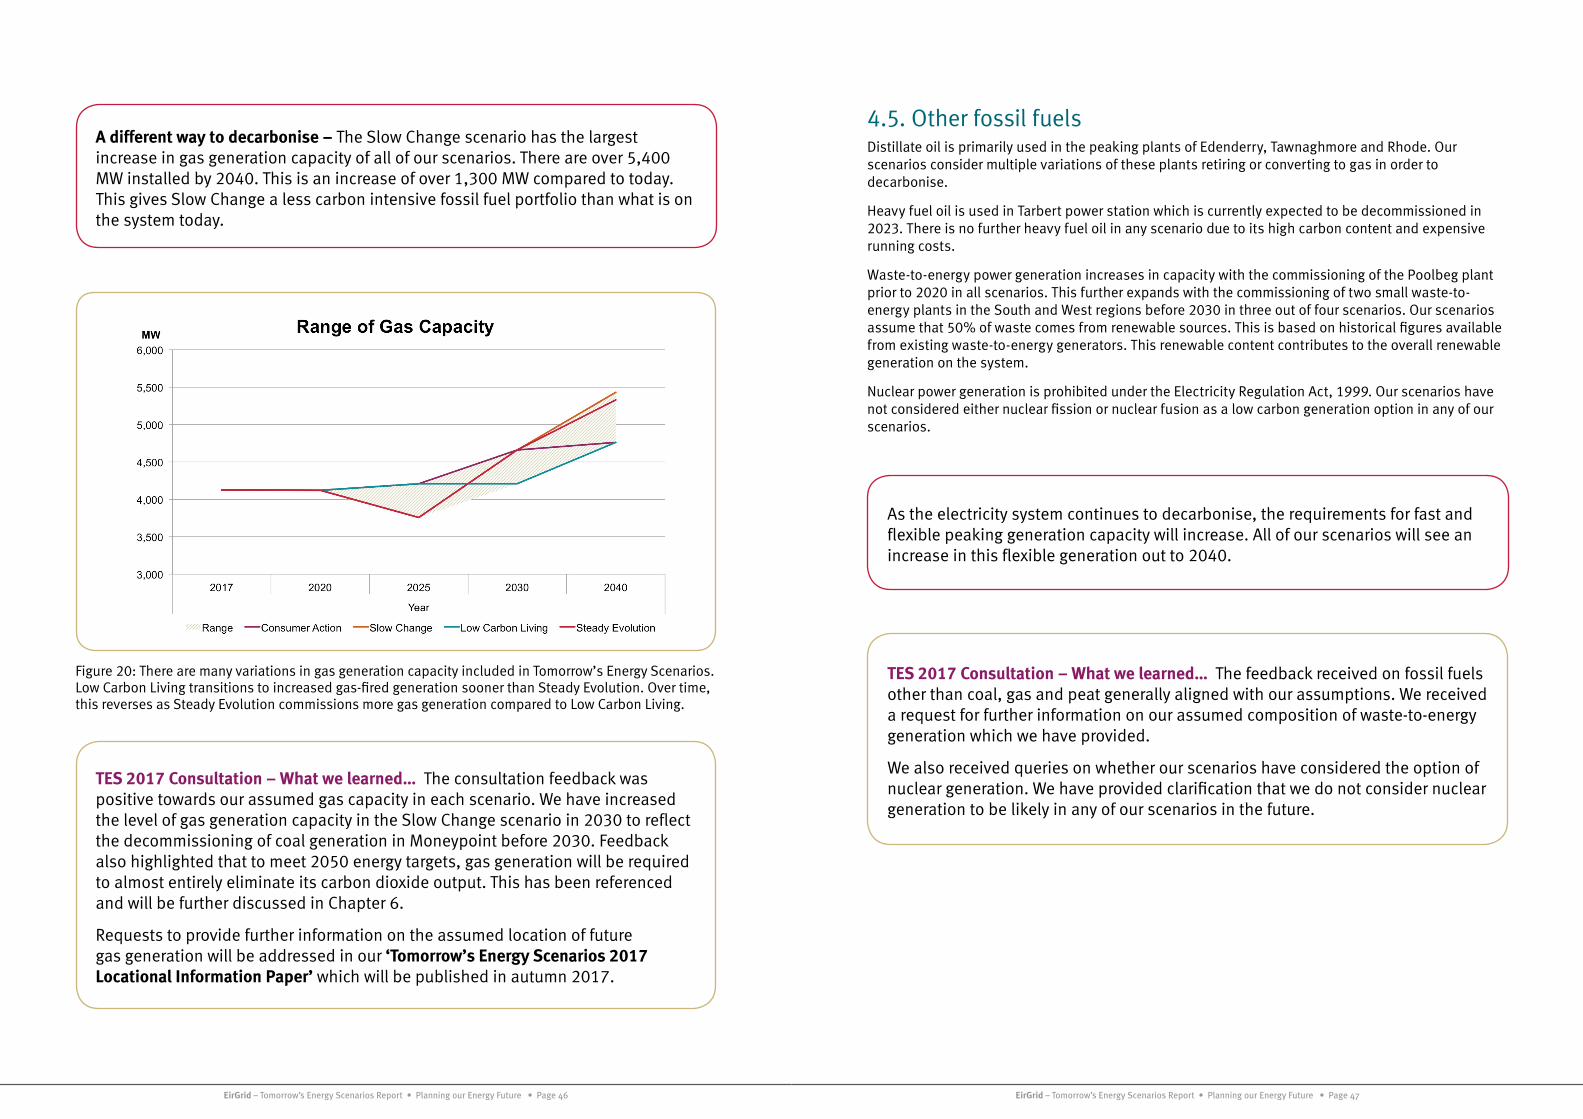
EirGrid – Tomorrow’s Energy Scenarios Report • Planning our Energy Future • Page 46 EirGrid – Tomorrow’s Energy Scenarios Report • Planning our Energy Future • Page 47
A different way to decarbonise – The Slow Change scenario has the largest increase in gas generation capacity of all of our scenarios. There are over 5,400 MW installed by 2040. This is an increase of over 1,300 MW compared to today. This gives Slow Change a less carbon intensive fossil fuel portfolio than what is on the system today.
Figure 20: There are many variations in gas generation capacity included in Tomorrow’s Energy Scenarios. Low Carbon Living transitions to increased gas-fired generation sooner than Steady Evolution. Over time, this reverses as Steady Evolution commissions more gas generation compared to Low Carbon Living.
TES 2017 Consultation – What we learned… The consultation feedback was positive towards our assumed gas capacity in each scenario. We have increased the level of gas generation capacity in the Slow Change scenario in 2030 to reflect the decommissioning of coal generation in Moneypoint before 2030. Feedback also highlighted that to meet 2050 energy targets, gas generation will be required to almost entirely eliminate its carbon dioxide output. This has been referenced and will be further discussed in Chapter 6.
Requests to provide further information on the assumed location of future gas generation will be addressed in our ‘Tomorrow’s Energy Scenarios 2017 Locational Information Paper’ which will be published in autumn 2017.
4.5. Other fossil fuelsDistillate oil is primarily used in the peaking plants of Edenderry, Tawnaghmore and Rhode. Our scenarios consider multiple variations of these plants retiring or converting to gas in order to decarbonise.
Heavy fuel oil is used in Tarbert power station which is currently expected to be decommissioned in 2023. There is no further heavy fuel oil in any scenario due to its high carbon content and expensive running costs.
Waste-to-energy power generation increases in capacity with the commissioning of the Poolbeg plant prior to 2020 in all scenarios. This further expands with the commissioning of two small waste-to-energy plants in the South and West regions before 2030 in three out of four scenarios. Our scenarios assume that 50% of waste comes from renewable sources. This is based on historical figures available from existing waste-to-energy generators. This renewable content contributes to the overall renewable generation on the system.
Nuclear power generation is prohibited under the Electricity Regulation Act, 1999. Our scenarios have not considered either nuclear fission or nuclear fusion as a low carbon generation option in any of our scenarios.
As the electricity system continues to decarbonise, the requirements for fast and flexible peaking generation capacity will increase. All of our scenarios will see an increase in this flexible generation out to 2040.
TES 2017 Consultation – What we learned… The feedback received on fossil fuels other than coal, gas and peat generally aligned with our assumptions. We received a request for further information on our assumed composition of waste-to-energy generation which we have provided.
We also received queries on whether our scenarios have considered the option of nuclear generation. We have provided clarification that we do not consider nuclear generation to be likely in any of our scenarios in the future.
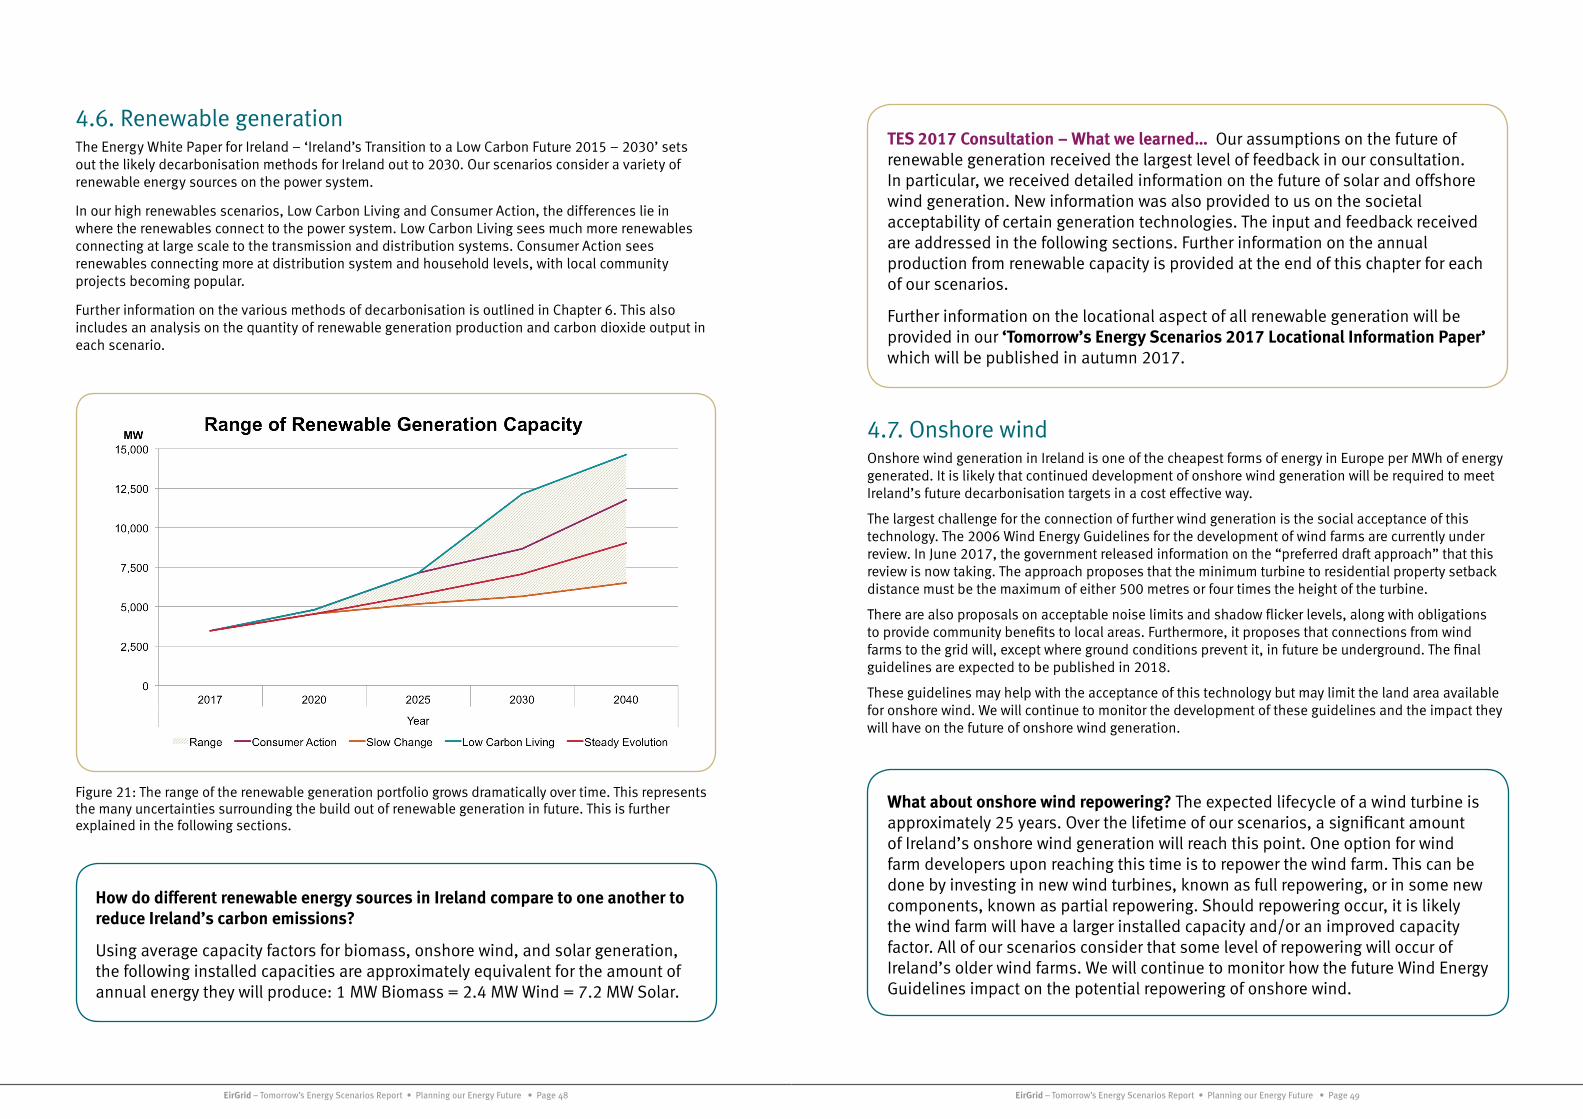
EirGrid – Tomorrow’s Energy Scenarios Report • Planning our Energy Future • Page 48 EirGrid – Tomorrow’s Energy Scenarios Report • Planning our Energy Future • Page 49
4.6. Renewable generationThe Energy White Paper for Ireland – ‘Ireland’s Transition to a Low Carbon Future 2015 – 2030’ sets out the likely decarbonisation methods for Ireland out to 2030. Our scenarios consider a variety of renewable energy sources on the power system.
In our high renewables scenarios, Low Carbon Living and Consumer Action, the differences lie in where the renewables connect to the power system. Low Carbon Living sees much more renewables connecting at large scale to the transmission and distribution systems. Consumer Action sees renewables connecting more at distribution system and household levels, with local community projects becoming popular.
Further information on the various methods of decarbonisation is outlined in Chapter 6. This also includes an analysis on the quantity of renewable generation production and carbon dioxide output in each scenario.
Figure 21: The range of the renewable generation portfolio grows dramatically over time. This represents the many uncertainties surrounding the build out of renewable generation in future. This is further explained in the following sections.
How do different renewable energy sources in Ireland compare to one another to reduce Ireland’s carbon emissions?
Using average capacity factors for biomass, onshore wind, and solar generation, the following installed capacities are approximately equivalent for the amount of annual energy they will produce: 1 MW Biomass = 2.4 MW Wind = 7.2 MW Solar.
TES 2017 Consultation – What we learned… Our assumptions on the future of renewable generation received the largest level of feedback in our consultation. In particular, we received detailed information on the future of solar and offshore wind generation. New information was also provided to us on the societal acceptability of certain generation technologies. The input and feedback received are addressed in the following sections. Further information on the annual production from renewable capacity is provided at the end of this chapter for each of our scenarios.
Further information on the locational aspect of all renewable generation will be provided in our ‘Tomorrow’s Energy Scenarios 2017 Locational Information Paper’ which will be published in autumn 2017.
4.7. Onshore wind Onshore wind generation in Ireland is one of the cheapest forms of energy in Europe per MWh of energy generated. It is likely that continued development of onshore wind generation will be required to meet Ireland’s future decarbonisation targets in a cost effective way.
The largest challenge for the connection of further wind generation is the social acceptance of this technology. The 2006 Wind Energy Guidelines for the development of wind farms are currently under review. In June 2017, the government released information on the “preferred draft approach” that this review is now taking. The approach proposes that the minimum turbine to residential property setback distance must be the maximum of either 500 metres or four times the height of the turbine.
There are also proposals on acceptable noise limits and shadow flicker levels, along with obligations to provide community benefits to local areas. Furthermore, it proposes that connections from wind farms to the grid will, except where ground conditions prevent it, in future be underground. The final guidelines are expected to be published in 2018.
These guidelines may help with the acceptance of this technology but may limit the land area available for onshore wind. We will continue to monitor the development of these guidelines and the impact they will have on the future of onshore wind generation.
What about onshore wind repowering? The expected lifecycle of a wind turbine is approximately 25 years. Over the lifetime of our scenarios, a significant amount of Ireland’s onshore wind generation will reach this point. One option for wind farm developers upon reaching this time is to repower the wind farm. This can be done by investing in new wind turbines, known as full repowering, or in some new components, known as partial repowering. Should repowering occur, it is likely the wind farm will have a larger installed capacity and/or an improved capacity factor. All of our scenarios consider that some level of repowering will occur of Ireland’s older wind farms. We will continue to monitor how the future Wind Energy Guidelines impact on the potential repowering of onshore wind.
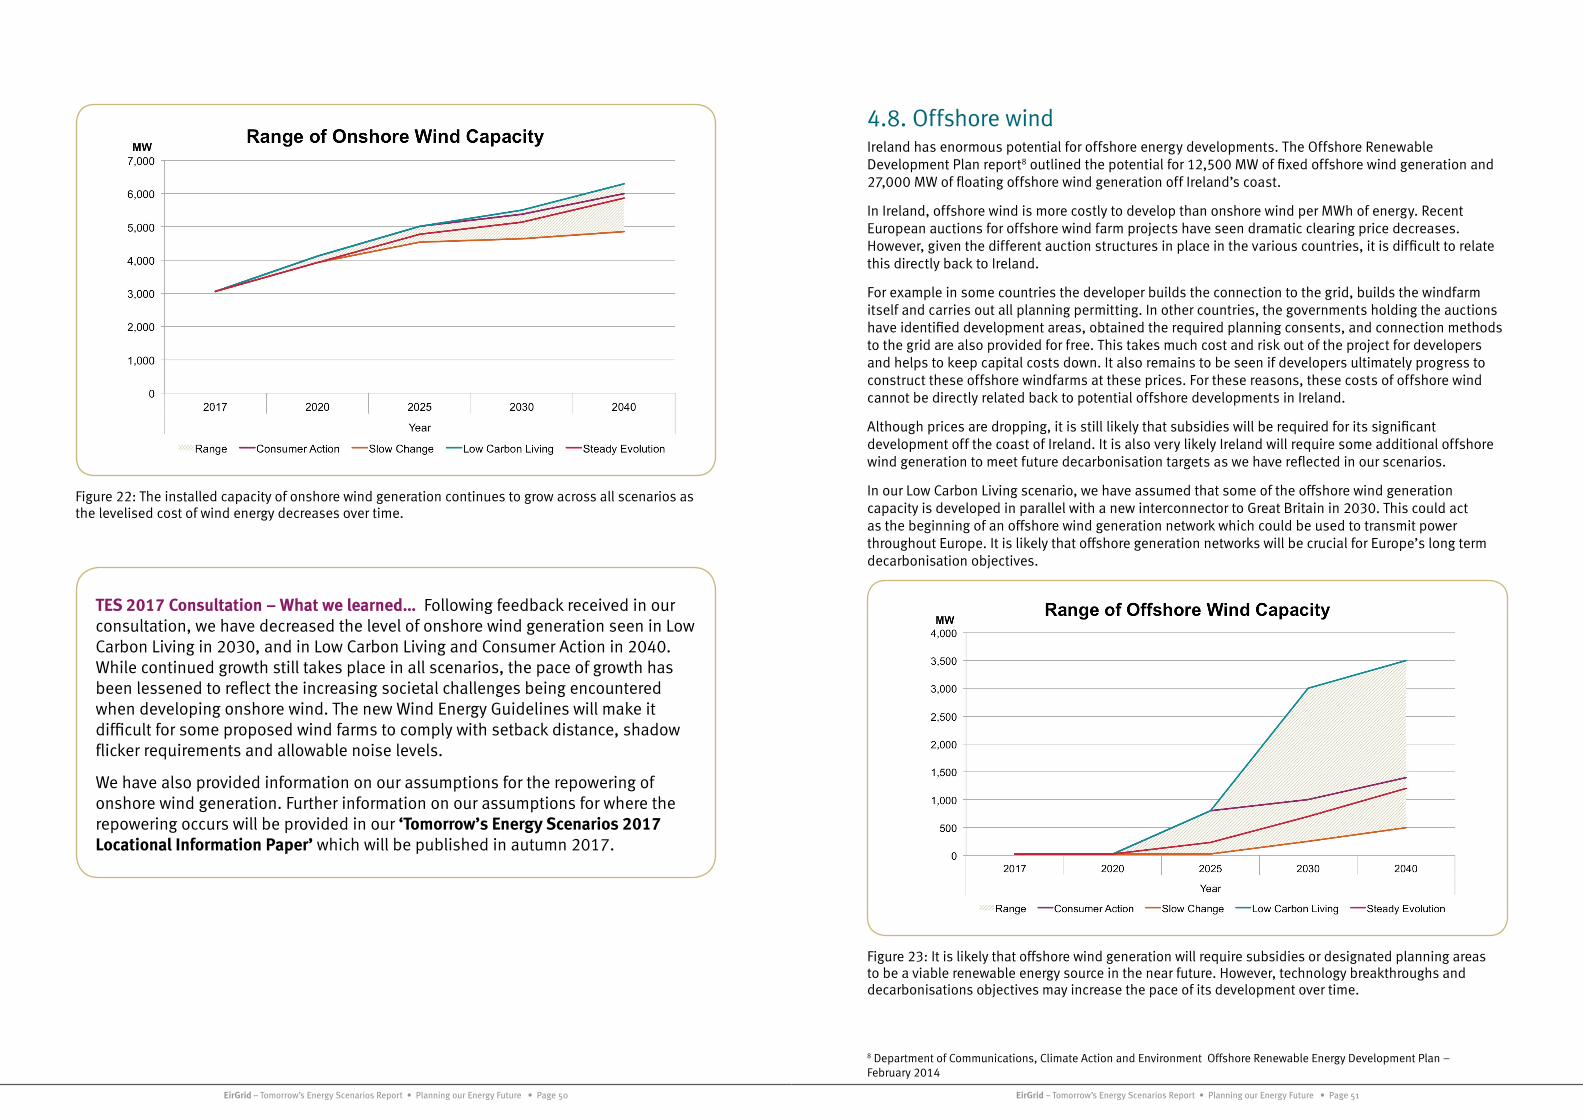
EirGrid – Tomorrow’s Energy Scenarios Report • Planning our Energy Future • Page 50 EirGrid – Tomorrow’s Energy Scenarios Report • Planning our Energy Future • Page 51
Figure 22: The installed capacity of onshore wind generation continues to grow across all scenarios as the levelised cost of wind energy decreases over time.
TES 2017 Consultation – What we learned… Following feedback received in our consultation, we have decreased the level of onshore wind generation seen in Low Carbon Living in 2030, and in Low Carbon Living and Consumer Action in 2040. While continued growth still takes place in all scenarios, the pace of growth has been lessened to reflect the increasing societal challenges being encountered when developing onshore wind. The new Wind Energy Guidelines will make it difficult for some proposed wind farms to comply with setback distance, shadow flicker requirements and allowable noise levels.
We have also provided information on our assumptions for the repowering of onshore wind generation. Further information on our assumptions for where the repowering occurs will be provided in our ‘Tomorrow’s Energy Scenarios 2017 Locational Information Paper’ which will be published in autumn 2017.
4.8. Offshore wind Ireland has enormous potential for offshore energy developments. The Offshore Renewable Development Plan report8 outlined the potential for 12,500 MW of fixed offshore wind generation and 27,000 MW of floating offshore wind generation off Ireland’s coast.
In Ireland, offshore wind is more costly to develop than onshore wind per MWh of energy. Recent European auctions for offshore wind farm projects have seen dramatic clearing price decreases. However, given the different auction structures in place in the various countries, it is difficult to relate this directly back to Ireland.
For example in some countries the developer builds the connection to the grid, builds the windfarm itself and carries out all planning permitting. In other countries, the governments holding the auctions have identified development areas, obtained the required planning consents, and connection methods to the grid are also provided for free. This takes much cost and risk out of the project for developers and helps to keep capital costs down. It also remains to be seen if developers ultimately progress to construct these offshore windfarms at these prices. For these reasons, these costs of offshore wind cannot be directly related back to potential offshore developments in Ireland.
Although prices are dropping, it is still likely that subsidies will be required for its significant development off the coast of Ireland. It is also very likely Ireland will require some additional offshore wind generation to meet future decarbonisation targets as we have reflected in our scenarios.
In our Low Carbon Living scenario, we have assumed that some of the offshore wind generation capacity is developed in parallel with a new interconnector to Great Britain in 2030. This could act as the beginning of an offshore wind generation network which could be used to transmit power throughout Europe. It is likely that offshore generation networks will be crucial for Europe’s long term decarbonisation objectives.
Figure 23: It is likely that offshore wind generation will require subsidies or designated planning areas to be a viable renewable energy source in the near future. However, technology breakthroughs and decarbonisations objectives may increase the pace of its development over time.
8 Department of Communications, Climate Action and Environment Offshore Renewable Energy Development Plan – February 2014

EirGrid – Tomorrow’s Energy Scenarios Report • Planning our Energy Future • Page 52 EirGrid – Tomorrow’s Energy Scenarios Report • Planning our Energy Future • Page 53
TES 2017 Consultation – What we learned… Responses to our consultation indicated that offshore wind generation will be a crucial aspect of Ireland’s long term decarbonisation goals. Responses also provided evidence for offshore generation being the most socially acceptable renewable technology in Ireland. This information, coupled with recent auction clearing prices in Europe and indications that the government is keen to pursue offshore generation, has led us to increase our levels of offshore wind generation across all scenarios.
We also received queries on whether we had considered an offshore grid network in future. Our Low Carbon Living scenario, which has the largest capacity of offshore wind generation, includes a parallel development of further interconnection to Great Britain to begin an offshore network in 2030.
4.9. Solar PVSolar photovoltaic (PV) generation has become a more economically viable form of electricity generation in recent years. The cost of a solar PV panel is less than 1 % of what it was 40 years ago. Despite this, the capital costs of solar PV generation are still high compared to other generation. It is likely that the majority of solar PV projects in Ireland would not be viable today without some form of support in place.
Ireland has a similar potential solar resource to that of many parts of Great Britain and Germany. Both of these countries have seen dramatic increases in the levels of solar generation connecting onto their systems in the past decade. However, in both situations, guaranteed feed-in-prices were made available for the generation of solar energy.
The Department of Communications, Climate Action, and Environment has given indications that solar subsidies, or guaranteed feed-in-prices, will be granted for a small capacity of utility scale solar farms. This will likely limit the levels of solar PV connecting to the system in the near future.
However, it is likely that decreasing capital costs, due to technology breakthroughs, will see large scale solar PV connecting to the system at an increasing rate from the mid-2020s without the need for a subsidy. For this reason, solar only sees marginal growth in our Steady Evolution scenario out to 2025. Our Low Carbon Living scenario sees a faster pace of growth, with the most economically viable solar sites developing faster due to the better economy.
Solar generation is most likely to locate in the southern and eastern parts of the country as they have the most sun exposure. This would give an average capacity factor of 11%. Other areas of Ireland tend to have less sun exposure, giving average capacity factors of 8-10%.
Due to Ireland’s position in the Northern Hemisphere, solar PV only reaches high output for a few hours a day during the summer months. For the rest of the year, it has a relatively low generation output compared to other renewable technologies.
Rooftop solar PV on households and businesses remains relatively expensive. It is unlikely we will see large capacities materialise until post-2025 unless the government incentivises it. It is likely that utility scale solar would need to develop first in order to develop rooftop solar PV in the absence of an incentive scheme. This would build up a skilled workforce and decrease the capital costs of rooftop solar PV. Our Consumer Action scenario has the highest level of rooftop solar PV capacity in 2030, as consumers take control of their own electricity supply.
Widespread rooftop solar PV can have a large impact on the electricity demand which is ‘served’ by the transmission system. Power generated from rooftop solar PV can be consumed by the home or building, stored in a household battery for later use, or exported into the distribution grid. This can have an impact on the usage of the transmission grid. Figure 25 shows that distributed solar PV reduced the system demand by over 500 MW between 11:00 a.m. and 5:00 p.m. in the 2030 Consumer Action scenario during the summer.
Figure 24: Distributed solar generation can have a big impact on the demand which is “seen” by the Transmission System. It is important to model this impact in transmission system analysis.
The solar PV generation capacity is 3,500 MW in the Low Carbon Living scenario in 2030.

EirGrid – Tomorrow’s Energy Scenarios Report • Planning our Energy Future • Page 54 EirGrid – Tomorrow’s Energy Scenarios Report • Planning our Energy Future • Page 55
Figure 25: Distributed solar generation can have a big impact on the demand which is “seen” by the Transmission System. It is important to model this impact in system studies.
TES 2017 Consultation – What we learned… We received a large amount of feedback on our assumptions for solar PV generation. In general, the feedback felt that we underestimated the levels of solar PV potential which could be seen on the power system over the next 25 years. We received new information relating to decreasing levelised costs of solar PV generation between now and 2030. We also received information on the perceived social acceptance for solar PV generation in comparison to other forms of renewable generation. As a result of this feedback, we have increased our projections for the capacity of solar PV generation in both our Low Carbon Living and our Consumer Action scenarios.
Many respondents also highlighted the similarities of solar potential between Ireland, Great Britain and Germany. However, it is important to highlight that these markets were heavily driven by government incentives. We will monitor plans for any future government incentives for solar PV in Ireland very closely.
4.10. Other renewable generationAll of our scenarios show biomass generation increasing in capacity over the next 25 years. This includes some new generators, combined with an uptake in community led combined heat and power schemes. There is also a conversion of Ireland’s peat generation stations to biomass in some scenarios.
The majority of the biomass fuel which Ireland requires may need to be imported. There is not sufficient biomass growth in Ireland to maintain the required quantity to fuel large capacities. This imported biomass will be travelling from countries all over the world and will be delivered to Ireland’s shipping ports.
As outlined in Section 4.2, we have considered that Moneypoint repowers to gas in our scenarios. Biomass is being considered as a potential fuel source for Moneypoint in the future. This would require a biomass fuel source far in excess of Ireland’s biomass resource potential. Based on projected levelised costs, it would also require a substantial government subsidy to be viable at such a scale.
We are not forecasting any further large scale hydro generation developments in Ireland. We do think the current hydro generation stations will remain active throughout all our scenarios.
Ireland has a considerable potential for ocean generation. However, wave and tidal generation technology remains in its infancy and is very expensive to develop. We do consider some developments in our scenarios with our largest capacity nearing 300 MW by 2040 in Low Carbon Living. We assume the learnings taken from pilot projects improve the technology costs, and it begins to become commercially viable beyond 2030. It is likely ocean energy will have a larger role to play in Ireland’s decarbonisation later in this century. It may also benefit from possible connections to future offshore grid networks.
TES 2017 Consultation – What we learned… We received a number of queries in relation to the consideration of repowering Moneypoint as a biomass generator. This is being considered as an option for the repowering of Moneypoint. However, for the purposes of our scenarios we have chosen gas as the repowering fuel source for Moneypoint. Some of the issues relating to the potential repowering of Moneypoint as a biomass unit are discussed.
Some respondents suggested the inclusion of more ocean generation in a Low Carbon Living scenario. However, based on our information, these projects will likely remain as research pilots until the 2030s in a best case scenario. We will continue to monitor developments in the area of ocean energy research and development.
4.11. Electricity supply breakdownsA summary of the electricity supply breakdown by fuel type is shown for each scenario in the following charts. The increase in electricity demand is evident as more electricity is generated over time. The growth in renewable generation is also clear as more wind and solar generation meets the electricity demand. This can be clearly seen in Low Carbon Living in particular.

EirGrid – Tomorrow’s Energy Scenarios Report • Planning our Energy Future • Page 56 EirGrid – Tomorrow’s Energy Scenarios Report • Planning our Energy Future • Page 57
Figure 26: The annual electricity production by fuel type in 2020 is shown for each scenario. Fossil fuel generation continues to make up the majority of electricity production in 2020 with Low Carbon Living generating slightly more from renewable sources than Steady Evolution.
Figure 27: The annual electricity production by fuel type in 2025 is shown for each scenario. The Low Carbon Living scenario does not have any peat or coal in its generation portfolio in 2025. Gas generation and renewable generation increases compared to the other scenarios. Peat generation only occurs in Slow Change.
Figure 28: The annual electricity production by fuel type in 2030 is shown for each scenario. Coal and peat generation ceases in all scenarios by 2030. Gas generation increases in most scenarios, as does wind and biomass generation. Solar power makes up a relatively small amount of the total electricity generation due to its low capacity factor.
Figure 29: The annual electricity production by fuel type in 2040 is shown for each scenario. Solar generation and wind generation continue to increase their share of electricity production. Gas generation remains relatively static compared to 2030.

EirGrid – Tomorrow’s Energy Scenarios Report • Planning our Energy Future • Page 58 EirGrid – Tomorrow’s Energy Scenarios Report • Planning our Energy Future • Page 59
5. Electricity storage and interconnection5.1. Electricity storageElectricity storage at large scale levels has traditionally used pumped hydro energy storage (PHES), such as Ireland’s Turlough Hill generating station. More recently, compressed air energy storage (CAES) has also seen growth across some European countries and in North America.
Battery energy storage (BES) has become more economically viable due to decreasing capital costs. Due to its relatively small footprint compared to other storage methods, it has the greatest potential for electricity storage in the future.
Large scale grid connected battery energy storage will likely connect along with renewables such as solar and wind to help reduce curtailment levels. Household battery energy storage will likely connect with domestic solar PV to provide additional self-consumption for consumers. As outlined in Section 3.4, there may also be significant potential for ‘upcycling’ electric vehicle batteries in the future.
Electricity storage can be used for a variety of system needs including energy arbitrage, provision of system services, or even network deferral.
We have considered two categories of battery storage. We consider large scale battery storage to be battery banks installed in total capacities of 10 MW or greater. These units may be standalone units or else installed with transmission or distribution connected wind or solar PV farms. We consider small scale battery storage to be either domestic household batteries or battery banks with total capacities of less than 10 MW installed with small wind or solar PV farms on the distribution system. Details on the capacity breakdown of these categories can be found in Appendix 2.
What about power-to-gas electricity storage? Power-to-gas is a concept of converting excess power, generally from renewable generation, to gas which can then become a store of energy. The concept uses excess electricity generation to power electrolysis which splits water in oxygen and hydrogen. The hydrogen can then be added to the existing gas grid or combined with carbon dioxide to form methane. It can act as a long term store of “electricity” as the methane can then be re-used in gas-fired power generation. Other uses for it include heat and transport energy. Trials for this technology are taking place in Germany and the United State of America. It is currently seen as more efficient for the heating sector than conversion back to electricity. It has not been considered as a storage technology in our scenarios as it is in its infancy. We will continue to monitor developments in this area.
Figure 30: Our scenarios consider a wide range of pumped hydro and battery energy storage possibilities – from very little progress in Slow Change, to widespread household batteries in Consumer Action.
Batteries are not the only form of storage we are considering in Tomorrow’s Energy Scenarios. A 360 MW pumped hydro energy storage station connects to the power system in our Steady Evolution and Low Carbon Living scenarios.
TES 2017 Consultation – What we learned… The consultation feedback was conclusive that we had underestimated the potential for battery storage in our scenarios. In particular, it was seen that battery storage is highly likely to be a future enabler of more variable renewable generation on the grid. The continued decreasing capital cost of battery energy storage was highlighted. Large scale battery energy storage pilot projects in other countries were also brought to our attention. The rollout of domestic battery storage coupled with rooftop solar PV and electric vehicles was seen as a very likely scenario. As a result of this feedback, we have increased the level of battery energy storage across all scenarios in 2030 and 2040.
Following a request, we have also added in an information note on our considerations of power-to-gas as a possible future electricity storage mechanism.
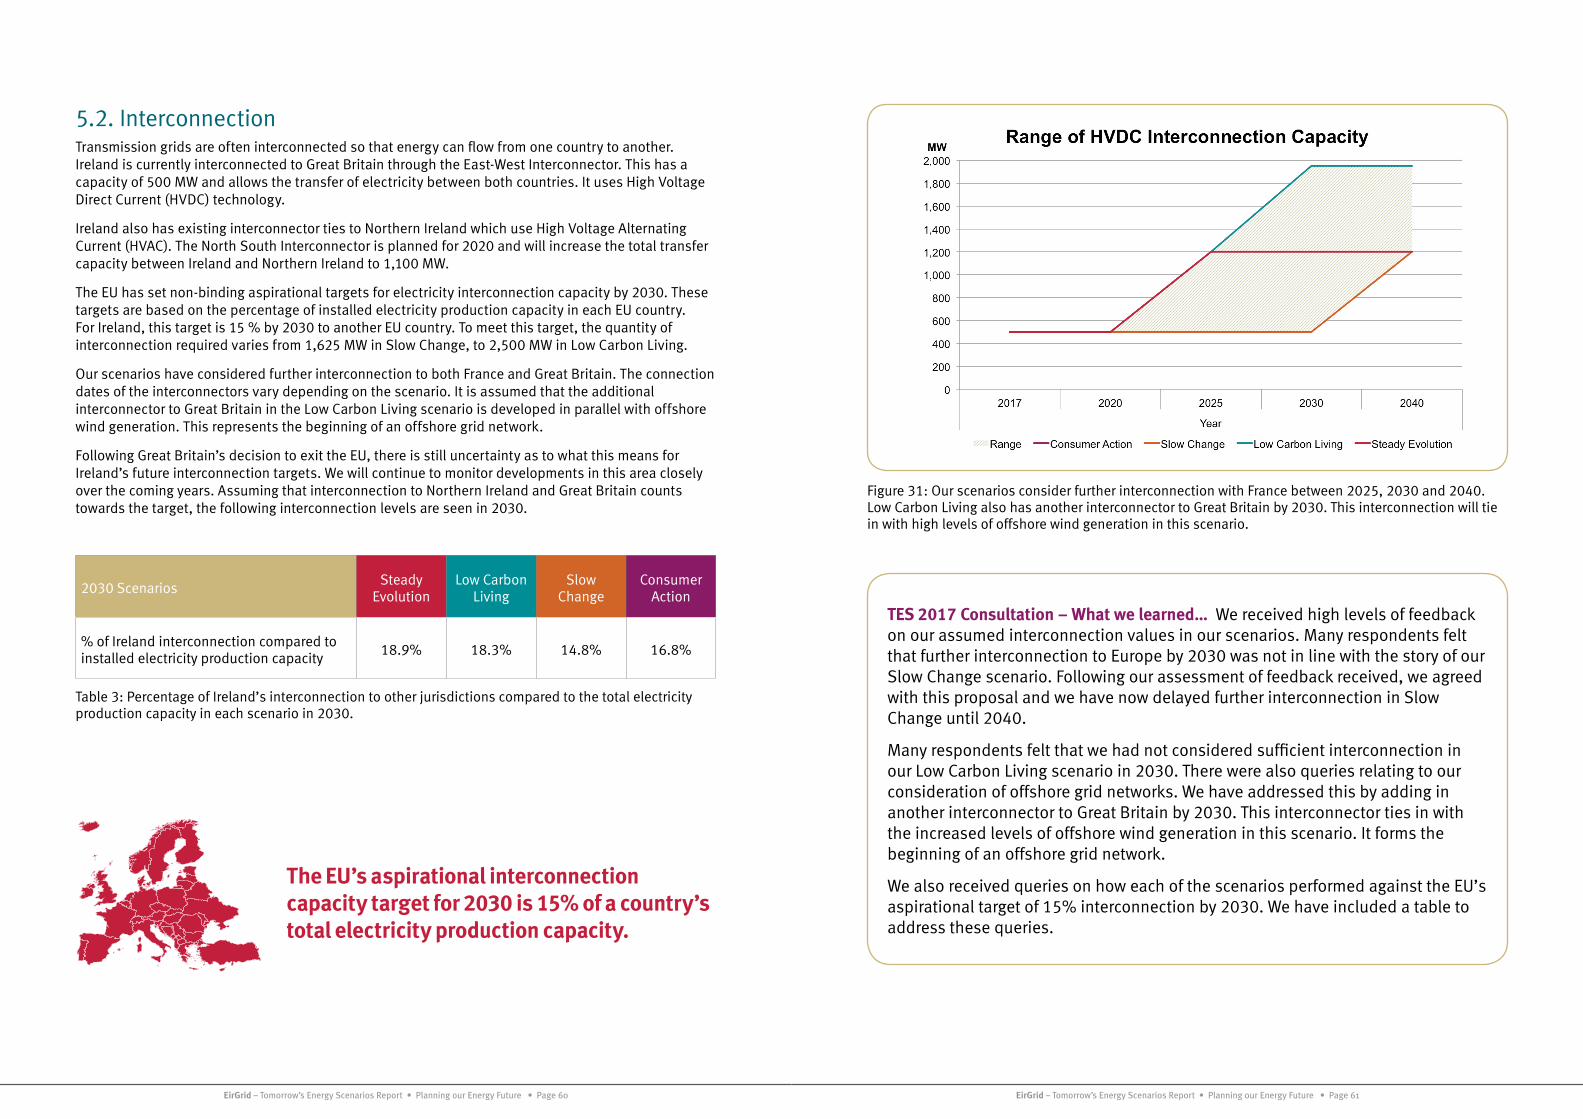
EirGrid – Tomorrow’s Energy Scenarios Report • Planning our Energy Future • Page 60 EirGrid – Tomorrow’s Energy Scenarios Report • Planning our Energy Future • Page 61
5.2. InterconnectionTransmission grids are often interconnected so that energy can flow from one country to another. Ireland is currently interconnected to Great Britain through the East-West Interconnector. This has a capacity of 500 MW and allows the transfer of electricity between both countries. It uses High Voltage Direct Current (HVDC) technology.
Ireland also has existing interconnector ties to Northern Ireland which use High Voltage Alternating Current (HVAC). The North South Interconnector is planned for 2020 and will increase the total transfer capacity between Ireland and Northern Ireland to 1,100 MW.
The EU has set non-binding aspirational targets for electricity interconnection capacity by 2030. These targets are based on the percentage of installed electricity production capacity in each EU country. For Ireland, this target is 15 % by 2030 to another EU country. To meet this target, the quantity of interconnection required varies from 1,625 MW in Slow Change, to 2,500 MW in Low Carbon Living.
Our scenarios have considered further interconnection to both France and Great Britain. The connection dates of the interconnectors vary depending on the scenario. It is assumed that the additional interconnector to Great Britain in the Low Carbon Living scenario is developed in parallel with offshore wind generation. This represents the beginning of an offshore grid network.
Following Great Britain’s decision to exit the EU, there is still uncertainty as to what this means for Ireland’s future interconnection targets. We will continue to monitor developments in this area closely over the coming years. Assuming that interconnection to Northern Ireland and Great Britain counts towards the target, the following interconnection levels are seen in 2030.
2030 ScenariosSteady
EvolutionLow Carbon
LivingSlow
ChangeConsumer
Action
% of Ireland interconnection compared to installed electricity production capacity
18.9% 18.3% 14.8% 16.8%
Table 3: Percentage of Ireland’s interconnection to other jurisdictions compared to the total electricity production capacity in each scenario in 2030.
Figure 31: Our scenarios consider further interconnection with France between 2025, 2030 and 2040. Low Carbon Living also has another interconnector to Great Britain by 2030. This interconnection will tie in with high levels of offshore wind generation in this scenario.
TES 2017 Consultation – What we learned… We received high levels of feedback on our assumed interconnection values in our scenarios. Many respondents felt that further interconnection to Europe by 2030 was not in line with the story of our Slow Change scenario. Following our assessment of feedback received, we agreed with this proposal and we have now delayed further interconnection in Slow Change until 2040.
Many respondents felt that we had not considered sufficient interconnection in our Low Carbon Living scenario in 2030. There were also queries relating to our consideration of offshore grid networks. We have addressed this by adding in another interconnector to Great Britain by 2030. This interconnector ties in with the increased levels of offshore wind generation in this scenario. It forms the beginning of an offshore grid network.
We also received queries on how each of the scenarios performed against the EU’s aspirational target of 15% interconnection by 2030. We have included a table to address these queries.
The EU’s aspirational interconnection capacity target for 2030 is 15% of a country’s total electricity production capacity.

EirGrid – Tomorrow’s Energy Scenarios Report • Planning our Energy Future • Page 62 EirGrid – Tomorrow’s Energy Scenarios Report • Planning our Energy Future • Page 63
6. Ireland’s energy and emissions targets
6.1. Methods of decarbonisation Ireland met over 25 % of its electricity consumption requirements from renewable energy sources for the first time in 20159. This is a milestone on the continued path towards decarbonising Ireland’s energy system.
In 2015, the government released the latest Energy White Paper for Ireland – ‘Ireland’s Transition to a Low Carbon Future 2015 – 2030’10. The Energy White Paper provides a guide on the likely decarbonisation initiatives that the government will introduce over the coming years.
Decarbonisation is a trend which will continue into the future. There are many ways to decarbonise the energy system, some of which are outlined below.
6.1.1. Emissions Trading SchemeThe Emissions Trading Scheme is an EU trading scheme that allows participants to buy and sell carbon emissions allowances. In the Emissions Trading Scheme (ETS) sector, an annual ‘cap’ on the allowed level of carbon emissions has been imposed on industries participating in the ETS within the EU. The ETS sector includes power generation, large industrial plants and aviation.
Carbon allowances up to the ‘cap’ are sold to carbon producers in the ETS sector. The allowances are tradeable between carbon producers in this sector. This trading sets a price for each allowance which is generally in euro per tonne of carbon dioxide. A carbon producer must yield enough allowances to cover all of its emissions each year. If a producer reduces its emissions, it is free to sell excess carbon allowances to the market.
The ‘cap’ on the amount of carbon allowances available reduces each year. As a result, the cost of producing carbon is very likely to rise over time. By 2050, it will likely be highly expensive to produce carbon for industries covered under the ETS sector. This means that the cost of producing electricity from carbon emitting generation increases over time and in turn makes low carbon generation more competitive.
The non-Emissions Trading Scheme (non-ETS) sector is not included in this carbon cap. The non-ETS sector includes agriculture, heating and transport.
6.1.2. Alternative decarbonisation methodsAn alternative way of increasing the competitiveness of low carbon generation is to subsidise low carbon energy sources. Historically, this has been achieved by the introduction of guaranteed feed-in-prices for renewables, and this approach may continue. Other examples of subsidy mechanisms include auctions for long term contracts such as those discussed for offshore wind generation in Section 4.8.
It is very likely that the cost of low carbon generation technologies will continue to fall and investors will further develop these technologies with less reliance on guaranteed feed-in-prices or subsidies. There may be a technology breakthrough resulting in widespread use of a new low carbon technology.
Increasing energy efficiency and reducing overall energy demand may also lead to a reduction in emissions. Increased consumer awareness will play a big role in achieving this.
The above methods are referred to throughout the descriptions of our scenarios. For the purposes of planning and operating the future power system, it is important that we consider all possible outcomes for a decarbonised energy system.
9 Sustainable Energy Authority of Ireland – Renewable Electricity in Ireland 201510 Department of Communications, Climate Action and Environment – Ireland’s Transition to a Low Carbon Energy Future 2015 – 2030
6.2. Tomorrow’s Energy Scenarios emissions and renewable energy generationThe primary purpose of Tomorrow’s Energy Scenarios is to inform future decisions on the planning and operation of the transmission grid. While this document is not intended to be a decarbonisation roadmap, each scenario can show what level of carbon would be outputted from the power generation sector if that scenario occurs. Electrification of the heating and transport sectors will be an important step in decarbonising Ireland’s energy future. The transmission system needs to be able to accommodate this change.
The output of our scenarios can be used as guidance to the possible future seen if such electricity generation and supply portfolios were to develop. All of these scenarios would require change in order to become a reality. In particular, significant changes to the generation, demand, interconnection and storage portfolios would be needed in order to achieve the high renewable generation and low carbon output seen in Low Carbon Living.
The carbon dioxide produced from conventional generation in each scenario is shown in Figure 32. The renewable generation levels seen in each scenario is shown in Figure 33.
Ireland has to comply with a number of energy and emissions targets for 2020, 2030 and 2050. A brief discussion on how compliant our scenarios are to these targets is provided in the following sections.
Figure 32: The range of carbon dioxide generated is shown for each scenario. The Slow Change scenario is unlikely to meet our approximated “strict allowable” 2030 carbon dioxide emission target. Further details are provided in Section 6.4.

EirGrid – Tomorrow’s Energy Scenarios Report • Planning our Energy Future • Page 64 EirGrid – Tomorrow’s Energy Scenarios Report • Planning our Energy Future • Page 65
Figure 33: The range of renewable generation as a percentage of demand in each scenario shows that Low Carbon Living meets 75% of demand with renewable generation by 2030. However, Slow Change sees a very minor increase in renewable generation output as renewable policies are slow to adopt.
6.3. 2020 targetsThe EU has set a target that 16% of Ireland’s energy consumption must come from renewable sources by 2020. In order to achieve this, the government split the renewable energy target into three sectors – 40% from electricity, 12% from heat, and 10% from transport. Based on the progress made to date, it is likely that Ireland will meet its electricity target by 2020 or very shortly afterwards.
Our scenarios agree with this assessment, as shown in Figure 33. Just over 40% of the total electricity generation, as a percentage of demand, comes from renewable generation in Steady Evolution and Low Carbon Living in 2020. While Low Carbon Living has a high level of installed renewable generation, it also has a higher demand than Steady Evolution due to an increased level of data centres. This means that Steady Evolution has a slightly higher renewable electricity generation percentage in 2020.
6.4. 2030 targetsThe EU has set a target of reducing greenhouse gas emissions by 40% in 2030 compared to 1990 levels. In order to meet this, an EU-wide target has been set to reduce carbon in the ETS sector by 43% compared to 2005 levels. EU member states have not been given individual targets for the ETS sector. It is planned that the reduction in the annual EU-wide ‘cap’ on carbon emissions will achieve this.
In addition to this, individual targets for each EU member state have been proposed in the non-ETS sector. This will reduce carbon emissions in the non-ETS sector by 30% compared to 2005 levels. A target of reducing non-ETS sector carbon emissions by 30% by 2030 has been proposed for Ireland. While this is the EU average, it is below that of many of our neighbouring countries.
Ireland has been allowed some flexibility in meeting our 2030 non-ETS sector targets. For this reason, there are some uncertainties as to what the final target will be. One of the proposed flexibility options for the government includes yielding ETS sector carbon allowances up to an equivalent of 4% of the non-ETS sector. This would reduce the non-ETS sector target to 26% by 2030.
While not directly related, the government’s decision on this proposed flexibility option will also have implications for the level of low carbon generation in the power generation sector.
It is possible that the EU will set an ETS sector carbon reduction target for each member state for 2030. To assist reader’s interpretation of how our scenarios perform in terms of carbon emissions in 2030, relative to the EU wide target, we have approximated a possible 2030 carbon emission target for power generation in Ireland. We have assumed that a target is set for Ireland to achieve a 43% reduction in carbon dioxide compared to 2005 levels. When applied to the power generation sector in Ireland this means the “allowable” carbon output in the power generation sector is 8.7 million tonnes of carbon dioxide in 2030.
A further approximation could be made for an even stricter target. If the government pursues the flexibility option of yielding carbon allowances which are the equivalent of 4% of the non-ETS sector, the power generation carbon emission target could be updated to reflect this assumption. This would mean the “strict allowable” carbon output in the power generation sector decreases to 6.8 million tonnes of carbon dioxide in 2030.
These two levels have been used as comparison figures for the total carbon emissions produced in Tomorrow’s Energy Scenarios portfolios. However, we must point out that these are purely approximations based on very simplified assumptions. Carbon producing generators in Ireland are free to purchase more carbon allowances from the market to cover their emissions beyond the 8.7 and 6.8 million tonnes levels assumed.
2030 ScenariosSteady
EvolutionLow Carbon
LivingSlow
ChangeConsumer
Action
Carbon dioxide production (Mt) 5.4 3.2 6.9 5.7
Renewable generation (% of electricity demand)
57% 75% 47% 55%
Table 4: Carbon dioxide emissions and renewable generation outputs for 2030 Tomorrow’s Energy Scenarios.
All of our scenarios show total carbon dioxide production below the 8.7 million tonnes level. Slow Change has the highest carbon production as it has the lowest level of low carbon electricity supply. It is the only scenario not to meet the “strict allowable” 6.8 million tonne carbon output limit in 2030. Consumer Action also has a relatively higher carbon production level compared to Steady Evolution and Low Carbon Living. This is a result of a large increase in electricity demand as the heating and transport sectors electrify, but is also due to lower investment in large scale renewable solutions in comparison to Low Carbon Living.
There are a number of important variables relating to the level of renewable electricity generation which will be on the power system in 2030. Depending on the fossil fuel generation portfolio, the total system energy demand and the government’s decision as to how to apply emissions targets, we may see up to 75% of electricity coming from renewable generation by 2030. The range of possibilities is reflected in our scenarios with Slow Change having a renewable generation output of only 47% in 2030.

EirGrid – Tomorrow’s Energy Scenarios Report • Planning our Energy Future • Page 66 EirGrid – Tomorrow’s Energy Scenarios Report • Planning our Energy Future • Page 67
6.5. 2050 targetsThe EU’s ultimate ambition is to reduce greenhouse gas emissions by 80-95 % by 2050, compared to 1990 levels. The targets for 2020 and 2030 are milestones along that path. It is likely further energy and emissions targets will be set in the future.
The ETS sector will continue to reduce the ‘cap’ of allowable carbon emissions each year. This means it will be excessively expensive to produce carbon in this sector by 2050.
In order to comply with the ambitious target of the EU, it is likely that total carbon production in the power generation sector will need to be approximately 1 million tonnes of carbon dioxide by 2050. Advancements in both renewable and low carbon technologies will be crucial in achieving this target. It is very likely that the rollout of carbon capture and storage, large scale renewable biogas, or a new low carbon technology will be required.
Our 2040 scenarios demonstrate that one, or more, of these technologies will likely be required between 2030 and 2040 in order to decrease carbon output and maintain our path towards full decarbonisation. While carbon reductions are made in some scenarios, the continued electrification of heat and transport will increase electricity demand and make conventional plant still a requirement.
Appendix 1 – Demand tablesThe following tables summarise the key demand components in our scenarios11.
Demand Component InformationSteady
EvolutionLow Carbon
Living
Total Data Centre Capacity (MVA) 400 700
Total number of Electric Vehicles 8,000 20,000
Total % of Vehicles which are Electric 0% 1%
Total number of Heat Pumps 38,000 56,000
Total % of Households with Heat Pumps 2% 3%
Total Demand (TWh) 31.2 32.6
Table 5: Summary of demand components in the 2020 scenarios.
Demand Component InformationSteady
EvolutionLow Carbon
LivingSlow
Change
Total Data Centre Capacity (MVA) 850 1,400 550
Total number of Electric Vehicles 109,000 163,000 43,000
Total % of Vehicles which are Electric 5% 8% 2%
Total number of Heat Pumps 97,000 194,000 48,000
Total % of Households with Heat Pumps 5% 10% 3%
Total Demand (TWh) 33.7 38.8 32.3
Table 6: Summary of demand components in the 2025 scenarios.
Demand Component InformationSteady
EvolutionLow Carbon
LivingSlow
ChangeConsumer
Action
Total Data Centre Capacity (MVA) 1,100 1,950 850 1,675
Total number of Electric Vehicles 247,000 426,000 90,000 560,000
Total % of Vehicles which are Electric 11% 19% 4% 25%
Total number of Heat Pumps 199,000 279,000 100,000 339,000
Total % of Households with Heat Pumps 10% 14% 5% 17%
Total Demand (TWh) 36.3 43.8 35.1 42.6
Table 7: Summary of demand components in the 2030 scenarios.
Demand Component InformationSteady
EvolutionLow Carbon
LivingSlow
ChangeConsumer
Action
Total Data Centre Capacity (MVA) 1,100 1,950 850 1,675
Total number of Electric Vehicles 606,000 785,000 309,000 1,070,000
Total % of Vehicles which are Electric 26% 33% 13% 45%
Total number of Heat Pumps 423,000 529,000 212,000 635,000
Total % of Households with Heat Pumps 20% 25% 10% 30%
Total Demand (TWh) 38.3 45.8 36.6 45.3
Table 8: Summary of demand components in the 2040 scenarios.

EirGrid – Tomorrow’s Energy Scenarios Report • Planning our Energy Future • Page 68 EirGrid – Tomorrow’s Energy Scenarios Report • Planning our Energy Future • Page 69
Appendix 2 – Generation tablesThe following tables summarise the installed generation capacities in our scenarios12.
Fuel TypeSteady
EvolutionLow Carbon
Living
Coal 860 860
Gas 4,120 4,120
Peat 310 310
Distillate Oil 410 410
Heavy Fuel Oil 590 590
Waste (assume 50% renewable)
80 80
Fossil Fuel Generation Total 6,330 6,330
Wind (Onshore) 3,930 4,120
Wind (Offshore) 30 30
Wind Generation Total 3,960 4,150
Hydro 240 240
Biomass/Landfill Gas(including Biomass CHP)
240 240
Solar PV 70 150
Ocean (Wave/Tidal) 0 0
Renewable Generation Total 4,550 4,820
Pumped Storage 290 290
Small Scale Battery Storage 0 0
Large Scale Battery Storage 0 0
Demand Side Management 300 350
DC Interconnection 500 500
Conventional Combined Heat & Power 150 150
Total Capacity 12,120 12,440
Table 9: Summary of the generation portfolios in the 2020 scenarios. All figures are given in MW.
11 Data centre capacities are rounded to the nearest 10 MVA in each table. Electric vehicles and heat pump numbers are rounded to the nearest 1,000 in each table.
12 Generation capacities are rounded to the nearest 10 MW in each table.
Fuel TypeSteady
EvolutionLow Carbon
LivingSlow
Change
Coal 860 0 860
Gas 3,760 4,210 3,760
Peat 0 0 310
Distillate Oil 320 210 320
Heavy Fuel Oil 0 0 0
Waste (assume 50% renewable)
80 100 80
Fossil Fuel Generation Total 4,980 4,470 5,290
Wind (Onshore) 4,780 5,010 4,540
Wind (Offshore) 240 800 30
Wind Generation Total 5,020 5,810 4,570
Hydro 240 240 240
Biomass/Landfill Gas(including Biomass CHP)
320 320 240
Solar PV 150 700 90
Ocean (Wave/Tidal) 0 20 0
Renewable Generation Total 5,770 7,140 5,180
Pumped Storage 290 290 290
Small Scale Battery Storage 10 50 0
Large Scale Battery Storage 10 80 0
Demand Side Management 350 500 330
DC Interconnection 1,200 1,200 500
Conventional Combined Heat & Power 160 170 150
Total Capacity 12,770 13,900 11,740
Table 10: Summary of the generation portfolios in the 2025 scenarios. All figures are given in MW.

EirGrid – Tomorrow’s Energy Scenarios Report • Planning our Energy Future • Page 70 EirGrid – Tomorrow’s Energy Scenarios Report • Planning our Energy Future • Page 71
Fuel TypeSteady
EvolutionLow Carbon
LivingSlow
ChangeConsumer
Action
Coal 0 0 0 0
Gas 4,660 4,210 4,660 4,660
Peat 0 0 0 0
Distillate Oil 220 100 320 100
Heavy Fuel Oil 0 0 0 0
Waste (assume 50% renewable)
100 100 80 100
Fossil Fuel Generation Total 4,930 4,360 5,020 4,810
Wind (Onshore) 5,140 5,500 4,640 5,380
Wind (Offshore) 700 3,000 250 1,000
Wind Generation Total 5,840 8,500 4,890 6,380
Hydro 240 240 240 240
Biomass/Landfill Gas(including Biomass CHP)
390 750 270 430
Solar PV 500 2,500 200 1,500
Ocean (Wave/Tidal) 50 100 20 70
Renewable Generation Total 7,070 12,140 5,660 8,670
Pumped Storage 290 650 290 290
Small Scale Battery Storage 200 500 50 800
Large Scale Battery Storage 250 1,200 50 400
Demand Side Management 500 750 400 1,000
DC Interconnection 1,200 1,950 500 1,200
Conventional Combined Heat & Power 160 180 150 190
Total Capacity 14,600 21,730 12,120 17,360
Table 11: Summary of the generation portfolios in the 2030 scenarios. All figures are given in MW.
Fuel TypeSteady
EvolutionLow Carbon
LivingSlow
ChangeConsumer
Action
Coal 0 0 0 0
Gas 5,330 4,760 5,430 4,760
Peat 0 0 0 0
Distillate Oil 0 0 0 0
Heavy Fuel Oil 0 0 0 0
Waste (assume 50% renewable)
100 100 100 100
Fossil Fuel Generation Total 5,380 4,810 5,480 4,810
Wind (Onshore) 5,860 6,300 4,860 6,000
Wind (Offshore) 1,200 3,500 500 1,400
Wind Generation Total 7,060 9,800 5,360 7,400
Hydro 240 240 240 240
Biomass/Landfill Gas(including Biomass CHP)
520 800 410 650
Solar PV 1,000 3,500 400 3,250
Ocean (Wave/Tidal) 150 250 40 180
Renewable Generation Total 9,020 14,640 6,500 11,770
Pumped Storage 650 650 290 290
Small Scale Battery Storage 400 800 150 1,200
Large Scale Battery Storage 500 1,750 150 550
Demand Side Management 750 1,250 500 1,500
DC Interconnection 1,200 1,950 1,200 1,200
Conventional Combined Heat & Power 180 220 150 260
Total Capacity 18,080 26,070 14,420 21,580
Table 12: Summary of the generation portfolios in the 2040 scenarios. All figures are given in MW.

EirGrid – Tomorrow’s Energy Scenarios Report • Planning our Energy Future • Page 72 EirGrid – Tomorrow’s Energy Scenarios Report • Planning our Energy Future • Page 73
Notes:

EirGrid – Tomorrow’s Energy Scenarios Report • Planning our Energy Future • Page 74 EirGrid – Tomorrow’s Energy Scenarios Report • Planning our Energy Future • Page 75
Notes:

EirGrid – Tomorrow’s Energy Scenarios Report • Planning our Energy Future • Page 76EirGrid – Tomorrow’s Energy Scenarios • Planning our Energy Future • Page 30
The Oval, 160 Shelbourne Road, Ballsbridge, Dublin D04 FW28 • Telephone: 01 677 1700 • www.eirgrid.com
7241 EirGrid - Generic Community & Proximity (FA).indd 8 12/09/2016 17:59
Printed on recycled paper