Exploring ecological significance of tree crown plasticity through three-dimensional modelling
13
Annals of Botany Authors: Vincent and Harja Listed below are queries relating to your manuscript. Please answer the queries and return with the corrected proof. Please note that all graphs and simple line figures have been redrawn by a professional illustrator to give them a consistent style, and labels on images may also have been re-typed to improve their quality. It is therefore important that you check them all carefully against the originals. Section Paragraph Queries Fig. 1 I presume that ‘(m)’ is OK for dbh? Figure Figure 4,5,6,7 and 8 is cited before Figure 2 and 3 please check. Plasticity × density 1 Plots, in contrast to what.... OK? Fig. 7 Please add units for stand biomass to the axis legend. Figure 9 Smoothing algorithm, OK? Table 4 ‘(>0.01 cm dbh)’ – is this OK, not 0.01 m? This is a very thin stem! Literature cited Ballare CL. 1994. please confirm Editor details and give chapter page range. Brisson J. 2001. please check full journal titles throughout. Brisson J. 2001. please complete journal details.
-
Upload
independent -
Category
Documents
-
view
2 -
download
0
Transcript of Exploring ecological significance of tree crown plasticity through three-dimensional modelling

Annals of Botany
Authors: Vincent and Harja
Listed below are queries relating to your manuscript. Please answer the queries and return with the corrected proof. Please note that all graphs and simple line figures have been redrawn by a professional illustrator to give them a consistent style, and labels on images may also have been re-typed to improve their quality. It is therefore important that you check them all carefully against the originals.
Section Paragraph Queries
Fig. 1 I presume that ‘(m)’ is OK for dbh? Figure Figure 4,5,6,7 and 8 is cited before Figure 2 and 3 please check. Plasticity × density
1 Plots, in contrast to what.... OK?
Fig. 7 Please add units for stand biomass to the axis legend. Figure 9 Smoothing algorithm, OK? Table 4 ‘(>0.01 cm dbh)’ – is this OK, not 0.01 m? This is a very thin stem! Literature cited Ballare CL. 1994. please confirm Editor details and give chapter page range. Brisson J. 2001. please check full journal titles throughout. Brisson J. 2001. please complete journal details.

Exploring Ecological Significance of Tree Crown Plasticitythrough Three-dimensional Modelling
G. VINCENT1,* and D. HARJA2
1Institut de Recherche pour le Developpement (IRD), Unite Mixte de Recherche AMAP, Campus Agronomique –BP 701 (CIRAD), 97387 Kourou cedex, French Guyana and 2World Agroforestry Centre, SEA Regional Office, Jl.
CIFOR, Sindang Barang, Bogor, PO Box 161, Bogor 16001, Indonesia
Received: 31 January 2007 Returned for revision: 20 March 2007 Accepted: 19 June 2007
† Background and Aims Morphogenetic plasticity may be as important as physiological plasticity in determiningplant adaptability to changing environmental conditions. This study examines the importance of crown plasticityof trees in stands.† Methods A three-dimensional forest simulator is used to explore the impact of crown shape plasticity on treegrowth. Crown deformation is mediated through the local response to light and overall allometric constraints govern-ing tree dimensions. By altering shape response parameters of Hevea brasiliensis the impact of increased ordecreased plasticity is explored in a variety of competitive environments defined by various combinations of treedensity and relative frequency of different strategies. The possible interactions between plasticity and growth rateand plasticity and below-ground competition are also explored.† Key Results Crown plasticity confers competitive superiority in all cases studied. Interactions with other processesmay downplay or enhance this competitive advantage.† Conclusions Simulation results strongly suggest that crown plasticity does have a significant impact on tree per-formance in nature and that commonly observed crown shape deformation response of trees is of adaptive value.
Key words: Crown plasticity, 3D simulation, individual-based model, competition.
INTRODUCTION
Morphogenetic plasticity may be as important as physiologicalplasticity in determining plant adaptability to changingenvironmental conditions. For instance, it has been shownthat change in leaf life span of tropical species when seedlingacclimate to light environment affects plant carbon budget,to an extent similar to the better known photosyntheticcapacity adjustment (Vincent, 2006). Furthermore, becauseplants are sessile organisms facing spatial and temporal het-erogeneity in resource distribution, their capacity to respondto such heterogeneity is likely to be of particular adaptivevalue (Brisson and Reynolds, 1997; Hodge, 2006). Indeeda number of experimental studies have shown that treecrowns respond to anisotropic light and space availabilityand that they do so in a species-specific way (Brisson,2001; Muth and Bazzaz, 2002, 2003).
Tree photomorphogenetic response, which typically occursat a variety of organizational levels (leaf, twig, crown, wholetree), is expected to affect tree performance by modifyingdifferent processes at different time scales (Givnish, 1988;Bloor and Grubb, 2004). This study focuses on crowndeformation.
Photomorphogenetic responses of plants are complex andmay imply a number of mechanisms such as:
(1) Phytochrome-mediated shade avoidance response gov-erning etiolation (Smith, 1982, 1995). Such a shadeavoidance mechanism has been reported to be more
pronounced in light-demanding species than inshade-tolerant species (Gilbert et al., 2001).
(2) Blue light response governing phototropism (bendingbeing triggered by a differential growth on the shaded/unshaded side of the stem (Loehle, 1986; Ballare,1994, 1999). Such whole tree phototropism seems tobe mostly associated with riverine species supposedlybecause of the adaptive value of such a strategy whenrisk of being overtopped is low (Loehle, 1986).
(3) Local ‘passive’ proliferation in response to locallyabundant light (Russell et al., 1989; Stoll andSchmid, 1998). The intensity of this kind of localresponse is constrained by the level of physiologicalintegration of the elementary growth units, with ‘guer-rilla’ growth forms being more plastic in shape than‘phalanx’ growth form (Franco, 1986).
What specific advantage is crown photomorphogeneticplasticity likely to confer? Let us first express the relativegrowth rate (RGR; unit biomass increase per unit time perunit biomass) of the individual tree as the product of lightuse efficiency (LUE) and light capture efficiency (LCE).LUE is expressed in units of biomass increase per unit oflight intercepted, i.e. kg MJ21, and LCE is expressed asunit of light intercepted per unit of biomass per unit oftime, i.e. MJfs year21 kg21. LCE can further convenientlybe broken down into the product of two terms: ‘leafdisplay efficiency’ (LDE) and leaf area ratio (LAR),where LDE is expressed in units of light intercepted perunit leaf area, i.e. MJ yr21 m22, and LAR is the leaf area* For correspondence. E-mail [email protected]
# The Author 2007. Published by Oxford University Press on behalf of the Annals of Botany Company. All rights reserved.
For Permissions, please email: [email protected]
Annals of Botany 1–12, 2007
doi:10.1093/aob/mcm189, available online at www.aob.oxfordjournals.org
5
10
15
20
25
30
35
40
45
50
55
60
65
70
75
80
85
90
95
100
105
110
115
120

per unit (above-ground) biomass, m2 kg21. Hence,
RGR ¼ LUE� LCE ¼ LUE� LDE� LAR: ð1Þ
Crown deformation in response to uneven light distri-bution or strong lateral shading may affect both LUEand LCE.
LCE will be affected as a result of a change in both theLDE and the LAR. LDE is expected to increase if crowndevelops preferably towards high-luminance sectors:deploying leaves in areas of abundant incoming light willincrease the average light capture per unit leaf area. Thismay be the main positive feedback of crown deformation.Conversely, allowing crown to stretch either vertically orlaterally will tend to decrease the LAR by increasing themean distance from root to leaf (longer xylem network,larger cost of supporting tissue) and therefore will tend toaffect LCE negatively.
Light use efficiency may also be affected by change incrown shape in a number of ways. For example, LUEmay be negatively affected by the change in the length ofthe xylem network from roots to leaves, which will affecthydraulic conductance and in turn affect photosynthesis(Schafer et al., 2000; Hubbard et al., 2001; Midgley, 2003;Delzon et al., 2004).
The net effect of crown deformation on LCE and on thetree RGR is complex and time-dependent. The mere shapeof the return function (net carbon gain in response to defor-mation towards light) is unknown. It may be hypothesizedthat the immediate feedback effect of preferential growthtowards high light is predominantly positive via theincrease in LDE. But as crown deformation progressesand irregularity or eccentricity of crown or slenderness oftree increases, LCE may in fine decrease as a result of theincrease in LDE being completely offset by the decreasein LAR (notwithstanding the possible concomitant decreasein LUE due to hydraulic constraints). The optimum degreeof deformation in response to a particular light field willprobably depend strongly on parameters related to the archi-tectural and physiological characteristics of the targetspecies. However, the distribution of incoming lightchanges over time as the tree and its neighbouring compe-titors grow and/or canopy gaps are created in the vicinity ofthe tree (Lieffers et al., 1999). Benefits of crown defor-mation in terms of improved carbon budget at the wholetree level will depend on the payback time of the additionalstructures developed to increase light capture. The struc-tural cost associated with the preferential display of leavesin a high-light microsite is more likely to be amortized ifgrowth is rapid and turnover rates are high. Both character-istics would indeed contribute to minimize the risk of beingshaded out before the structural costs of investment intonew leaves and twigs have been paid back.
The discussion above makes two important points clear,namely that: (1) both costs and benefits associated with aparticular degree of morphogenetic plasticity will dependlargely on tree architectural and eco-physiological charac-teristics; and (2) the net benefit of tree morphogenetic
plasticity is strictly contingent on the competitive environ-ment in which the tree grows.
The latter point means that we have resorted to computersimulation experiments to evaluate the likely benefitsbrought about by crown plasticity. We use a forest standgrowth model that simulates individual tree deformationin response to the local neighbourhood to explore the pre-dicted effect of crown plasticity on growth performancein a variety of competitive environments.
More specifically, the model is used to test the followinghypotheses:
(H1) Ecological significance of morphological plasticity inresponse to light in a forest stand. In a mixed speciesstand, a change in plasticity of one of the componentspecies will affect (1) performance of individual treesof that species, (2) species population-level perform-ance and (3) whole-community performance (commu-nity resource capture rate and resource use depletionrate).
(H2) Performance of a particular degree of morphologicalplasticity (a particular morphogenetic strategy) iscontext-dependent, and notably frequency-dependent;indeed, increased height growth or lateral gap filling isexpected to generate a larger pay-off if that strategy israre among the competing individuals.
(H3) Fast-growing species benefit more from morphologi-cal plasticity than slow growing species, i.e. there isa positive interaction between growth rate and crownshape plasticity.
(H4) Competition occurs simultaneously for multipleresources and notably below-ground as well asabove-ground resources. Numerous observationaland experimental studies (reviewed in Tilman,1987) have shown that species performance inmixture is modified by a change in the ratio of limit-ing resources As a consequence it is hypothesizedthat the competitive advantage of above-ground plas-ticity will be affected by the degree of below-groundcompetition.
MATERIALS AND METHODS
The simulation model
A detailed description of the SExI simulator (SpatiallyExplicit Individual-based) and an executable version ofthe model is downloadable from the Web (http://www.worldagroforestry.org/sea/Products/AFModels/SExI). Onlyan outline of the algorithms most relevant to the presentstudy is given here. The model focuses on tree–tree compe-tition processes and notably on competition for light andspace. The model was initially developed for Indonesianagroforests and simulates tree growth on an annual time step.
The STReTCH (Shape Transformation Response ofTrees in Crowded Habitats) module is dedicated to simulat-ing crown deformation in response to crowding. The crownof a tree is represented as a growing deformable solid. Thisexpanding polyhedron is defined by a set of vectors (later
Vincent and Harja — Exploring Tree Crown Plasticity through 3D ModellingPage 2 of 12
125
130
135
140
145
150
155
160
165
170
175
180
185
190
195
200
205
210
215
220
225
230
235
240
referred to as ‘virtual branches’) all stemming from thecrown base. The growth rate of these virtual branches(VBs) is a function of local light conditions (local response)and their relative position. The way in which VBs areaffected by local light conditions or constrained by theirrelative position within the crown is species-dependent.
Deformations considered in the model include verticalstretching of tree (also referred to as ‘etiolation’), a globalresponse which is triggered by lateral shading, as well asa local response by which individual VB growth rates aremodified according to local light availability. Global displa-cement of the crown through bending of the main stem(whole tree phototropism response) is not considered inthe model. Our own observations suggest that such aresponse is mostly important during the early stages ofdevelopment of the young individuals.
The height–diameter relationship is modified accordingto the observed vertical light gradient while imposingmass conservation [assuming that total stem biomassscales isometrically with the product of stem cross-sectionalarea at breast height (derived from diameter at breast height,dbh) and tree height]. The degree of ‘stretching’ increaseswith intensity of the vertical light gradient and is controlledby two species-specific parameters, namely Flexi and Sensi.The Flexi parameter stands for flexibility and is a measureof maximum departure from a reference H–dbh relation-ship established for open grown trees, i.e. maximum etiola-tion. Measured values of Flexi typically range between .0and 1 (G. Vincent, unpubl. data). Practically, H–dbh allo-metric relationships are adjusted per light environment(typically open grown vs high-density stands) and the ratiobetween the first derivatives (dH/dbh) of those relationshipsare used to estimate Flexi (formally defined as 1 minus thisratio). The Sensi parameter stands for sensitivity and cap-tures species-specific signal detection sensitivity. Thehigher Sensi the lower the vertical light gradient neededto trigger a given percentage change in the ratio of heightgrowth rate to diameter growth rate. The parameter valuesrange between 0 and 2. A value of 1 means that the altera-tion of the dH/ddbh ratio is simply proportional to the lightvertical gradient. In practice this parameter is fairly difficultto calibrate and it is usually adjusted by expert judgement.Shade-tolerant species will typically have lower sensitivitythan light-demanding species. Lateral deformation may be aconsequence of anisotropic light or spatial constraints.Anisotropic light will result in preferential growth of VBsin sectors of higher illuminance as well as selective shed-ding of ‘branches’ if light drops below a certain threshold(Sprugel, 2002). This reallocation of growth betweenVBs, which leads to crown lateral deformation, is also afunction of both Sensi and Flexi parameters. Crown enve-lope surface is further constrained by imposing a species-specific relationship between stem section and crownsurface. Indeed, this relationship has been observed to bevery stable and notably independent of light environment(G. Vincent, unpubl. data). Lowermost branches are shedto adjust crown envelope surface to the species maximumvalue given current stem diameter value.
Tree diameter increment in the model is computed as theproduct of tree potential growth and growth reducers as is
classically implemented in forest and crop models (Reedet al., 2001). Two growth modifiers are used to captureabove-ground tree–tree interactions. The first is based oncrown position (CP), an index of how much light an indi-vidual tree receives. The second is based on CF (CF) anindex of its photosynthetic potential (Vincent et al.,2002). CP is computed in a similar way as in the simplelight interception model (Vincent and Harja, 2002). Lightextinction through successive canopy layers is computedusing species-specific light porosity of crown envelope.A species-specific function relates CP to the growth reductionfactor. A modification of the original SLIM moduledescribed in Vincent and Harja (2002) was implementedin the light interception module used here. To compute thetotal light interception at crown level, the incoming lightfrom any solid angle is weighted by the corresponding rela-tive crown surface intersected (http://www.worldagroforestry.org/sea/Products/AFModels/SExI). As a consequence, crowndeformation into high-light microsites increases wholecrown light capture.
The increase in light interception associated with verticalstretching due to vertical light gradient accrues from thecrown shape modification (contribution of the uppercrown to the global light budget is larger in more slendercrowns) and also from crown rise, which occurs throughshedding of the lowest branches.
Crown form is an index defined as the ratio of crownenvelope surface to reference crown surface of a tree withsame dbh value. Crown form degradation may result fromspatial constraints (crown collision) or branch shedding fol-lowing suboptimal light availability. Vertical stretching of acrown will not reduce crown surface and hence not affectCF negatively. Rather, crown rise will follow from verticalstretching as a result of imposing a maximum crown surfacefor a given stem section (see above). Hence, plasticity (bothvertical and lateral) confers an additional indirect advan-tage to trees: it allows CF to recover quickly followingcrown degradation.
We can reformulate the way the model implementscrown plastic response in the terms of the formal decompo-sition of RGR introduced in the previous section (eqn 1).By altering crown shape in response to light gradients, themodel simulates the associated change in LDE. Thechange in LAR (approximated by the ratio of crownsurface to total biomass) associated with increased slender-ness is also explicitly modelled. The model, however, doesnot consider any possible change in LUE and we come backto this point in the discussion section.
An additional growth reducer is associated with below-ground competition. Below-ground competition in themodel is based on a crowding index, which is itself com-puted on the basis of overlap of influential zones. The influ-ential zone is set to be proportional to tree stem diameter.For a given crowding index the corresponding growthreducer will depend on the site fertility index (http://www.worldagroforestry.org/sea/Products/AFModels/SExI).When exploring the possible interaction between below-ground and above-ground competition, the intensity ofbelow-ground competition was reduced by increasing thefertility index.
Vincent and Harja — Exploring Tree Crown Plasticity through 3D Modelling Page 3 of 12
245
250
255
260
265
270
275
280
285
290
295
300
305
310
315
320
325
330
335
340
345
350
355
360
Below-ground competition is essentially two-sided andwill tend to reduce the competitive superiority of tallertrees, which results from their better access to light.Despite being two-sided, below-ground competition is notsymmetric. Let us consider two trees with overlappinginfluential zones. The growth reduction associated withthis overlapping zone is a strictly increasing function ofthe area of the overlapping zone relative to the tree influen-tial zone (http://www.worldagroforestry.org/sea/Products/AFModels/SExI). Hence, the tree with the larger influentialzone will be less affected than the tree with the smaller one.Consequently, as vertically stretched trees will have theirinfluential root zone reduced because of a retarded diameterincrement associated with their accelerated height growth,they are expected to be less competitive in mixture ifbelow-ground competition is taken into account.
This reasoning, however, is only valid ‘on average’.Clearly, when trees are randomly located, in some cases asmaller influential zone may mean lesser below-groundinteraction with neighbours and subsequently an enhancedgrowth rate. This kind of effect is highly dependent onthe local spatial pattern and may be particularly importantin the early stages of stand development, before mosttrees start to interact with many others.
The model was calibrated for Hevea brasiliensis (Willd.)Muell.Arg as the autoecology and growth dynamics ofrubber, a non-pioneer light-demanding species, have beenwell studied. To illustrate the capacity of the model wepresent the results of the growth function calibrationapplied to a rubber density trial (Boerhendy, 1990).
After having shown that the model used is capable ofsimulating growth under contrasted situations we thenmove on to a more theoretical standpoint. Using the pre-viously obtained parameterisation for the rubber tree,virtual tree communities are simulated by ‘planting’ togetherpopulations of trees which vary for one or more parameter,
and we observe how the modified growth strategiesperform against each other. In most simulations presentedmortality and regeneration modules were disabled, whichadmittedly resulted in simulating theoretical stand structureunlikely to be observed in reality. The point in disabling thedemographic processes when studying growth is precisely tomaintain stand density and stand composition constant whenassessing the specific growth performance of a particularstrategy. However, when exploring how below- and above-ground competition interact in affecting a particular plas-ticity level, we resorted to long-term simulations- whichincluded demographic processes (and hence self-thinning).In the model mortality is directly affected by growth redu-cers themselves, reflecting the competitive pressure (i.e.mortality is density-dependent). Annual recruitment rate isproportional to relative abundance of trees of a particularstrategy among adult trees. Adulthood was defined by athreshold dbh of 15 cm. Hence, relative abundance atwhich a particular strategy is maintained in the longterm is a direct measure of its ecological performance.Arguably, in many cases, the use of long-term simulationsfocusing on relative frequency of a particular strategy as ameasure of its performance is equivalent to performinggrowth simulations without demographic processes whilefocusing on growth performance. The latter option, however,is more convenient when density or relative frequencyneed to be controlled as they constitute the main effectsbeing studied.
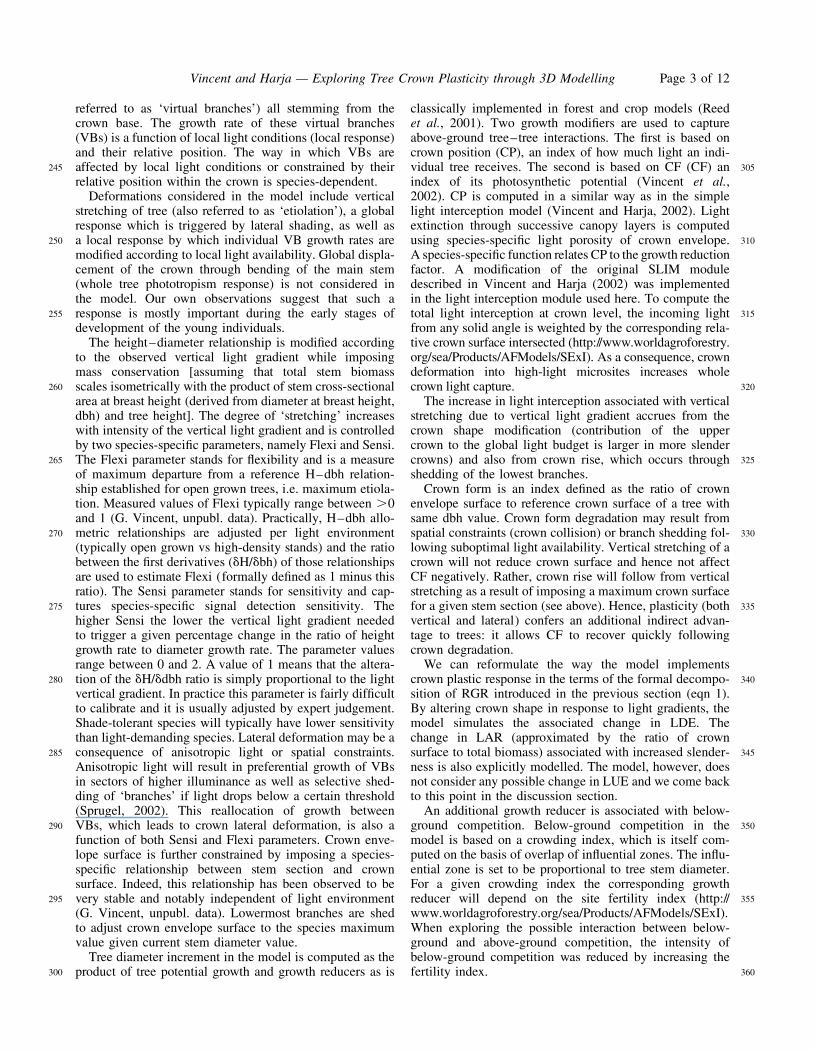
To illustrate the crown model deformation and its impli-cation on individual tree growth performance, we first usefixed light maps (fixed vertical gradient, fixed radialanisotropy) imposed upon isolated trees. Figure 1 showsthe output of the calibration procedure applied to adensity trial conducted in Sumatra by the IndonesianRubber Research Institute (Boerhendy, 1990). The overalldynamics and notably the faster decrease in dbh increment
FI G. 1. Predicted Q1(lines) and observed (symbols) dbh of rubber GT1 clone in a 10-year rubber density trial (continuous line and triangles: 6 � 6-mplanting pattern; dotted line and squares: 4 � 4-m planting pattern; broken line and diamonds: 3 � 3-m planting pattern).
Vincent and Harja — Exploring Tree Crown Plasticity through 3D ModellingPage 4 of 12
365
370
375
380
385
390
395
400
405
410
415
420
425
430
435
440
445
450
455
460
465
470
475
480
in dense stands is well reproduced by the model. For all theexperiments we use the default parameterization of Heveabrasiliensis.
Preliminary test-runs on isolated trees growing in fixedlight environment
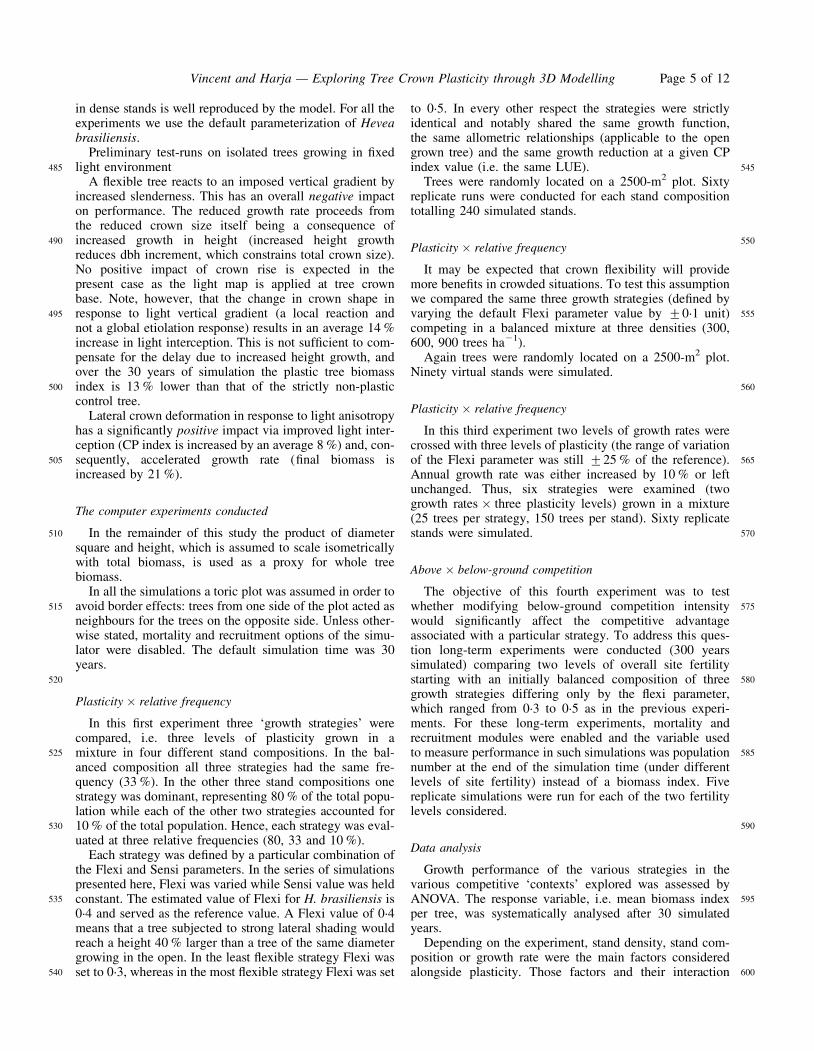
A flexible tree reacts to an imposed vertical gradient byincreased slenderness. This has an overall negative impacton performance. The reduced growth rate proceeds fromthe reduced crown size itself being a consequence ofincreased growth in height (increased height growthreduces dbh increment, which constrains total crown size).No positive impact of crown rise is expected in thepresent case as the light map is applied at tree crownbase. Note, however, that the change in crown shape inresponse to light vertical gradient (a local reaction andnot a global etiolation response) results in an average 14 %increase in light interception. This is not sufficient to com-pensate for the delay due to increased height growth, andover the 30 years of simulation the plastic tree biomassindex is 13 % lower than that of the strictly non-plasticcontrol tree.
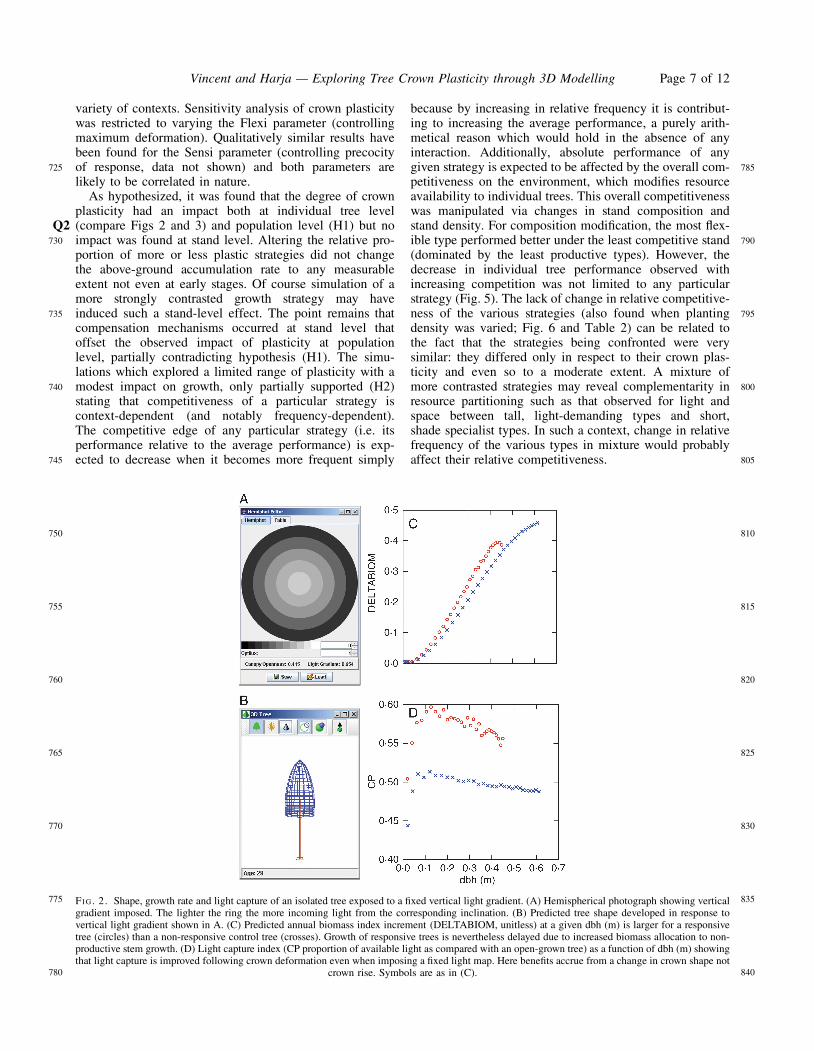
Lateral crown deformation in response to light anisotropyhas a significantly positive impact via improved light inter-ception (CP index is increased by an average 8 %) and, con-sequently, accelerated growth rate (final biomass isincreased by 21 %).
The computer experiments conducted
In the remainder of this study the product of diametersquare and height, which is assumed to scale isometricallywith total biomass, is used as a proxy for whole treebiomass.
In all the simulations a toric plot was assumed in order toavoid border effects: trees from one side of the plot acted asneighbours for the trees on the opposite side. Unless other-wise stated, mortality and recruitment options of the simu-lator were disabled. The default simulation time was 30years.
Plasticity � relative frequency
In this first experiment three ‘growth strategies’ werecompared, i.e. three levels of plasticity grown in amixture in four different stand compositions. In the bal-anced composition all three strategies had the same fre-quency (33 %). In the other three stand compositions onestrategy was dominant, representing 80 % of the total popu-lation while each of the other two strategies accounted for10 % of the total population. Hence, each strategy was eval-uated at three relative frequencies (80, 33 and 10 %).
Each strategy was defined by a particular combination ofthe Flexi and Sensi parameters. In the series of simulationspresented here, Flexi was varied while Sensi value was heldconstant. The estimated value of Flexi for H. brasiliensis is0.4 and served as the reference value. A Flexi value of 0.4means that a tree subjected to strong lateral shading wouldreach a height 40 % larger than a tree of the same diametergrowing in the open. In the least flexible strategy Flexi wasset to 0.3, whereas in the most flexible strategy Flexi was set
to 0.5. In every other respect the strategies were strictlyidentical and notably shared the same growth function,the same allometric relationships (applicable to the opengrown tree) and the same growth reduction at a given CPindex value (i.e. the same LUE).
Trees were randomly located on a 2500-m2 plot. Sixtyreplicate runs were conducted for each stand compositiontotalling 240 simulated stands.
Plasticity � relative frequency
It may be expected that crown flexibility will providemore benefits in crowded situations. To test this assumptionwe compared the same three growth strategies (defined byvarying the default Flexi parameter value by +0.1 unit)competing in a balanced mixture at three densities (300,600, 900 trees ha21).
Again trees were randomly located on a 2500-m2 plot.Ninety virtual stands were simulated.
Plasticity � relative frequency
In this third experiment two levels of growth rates werecrossed with three levels of plasticity (the range of variationof the Flexi parameter was still +25 % of the reference).Annual growth rate was either increased by 10 % or leftunchanged. Thus, six strategies were examined (twogrowth rates � three plasticity levels) grown in a mixture(25 trees per strategy, 150 trees per stand). Sixty replicatestands were simulated.
Above � below-ground competition
The objective of this fourth experiment was to testwhether modifying below-ground competition intensitywould significantly affect the competitive advantageassociated with a particular strategy. To address this ques-tion long-term experiments were conducted (300 yearssimulated) comparing two levels of overall site fertilitystarting with an initially balanced composition of threegrowth strategies differing only by the flexi parameter,which ranged from 0.3 to 0.5 as in the previous experi-ments. For these long-term experiments, mortality andrecruitment modules were enabled and the variable usedto measure performance in such simulations was populationnumber at the end of the simulation time (under differentlevels of site fertility) instead of a biomass index. Fivereplicate simulations were run for each of the two fertilitylevels considered.
Data analysis
Growth performance of the various strategies in thevarious competitive ‘contexts’ explored was assessed byANOVA. The response variable, i.e. mean biomass indexper tree, was systematically analysed after 30 simulatedyears.
Depending on the experiment, stand density, stand com-position or growth rate were the main factors consideredalongside plasticity. Those factors and their interaction
Vincent and Harja — Exploring Tree Crown Plasticity through 3D Modelling Page 5 of 12
485
490
495
500
505
510
515
520
525
530
535
540
545
550
555
560
565
570
575
580
585
590
595
600

were treated as fixed effects. The random seed used, whichserved as a simulation identifier, was included as a randomeffect. This was done because a significant amount of thevariance in mean tree performance appeared to beaccounted for by this grouping factor (Fox et al., 2001).This strong nested stochastic structure reflected the factthat the random spatial distribution of trees significantlyaffected the growth outcome due to the relatively smallsize of the elementary plot simulated. To implement thelinear mixed-effect models outlined above the lmer func-tion from the lme4 package of the R statistical software(R Development Core Team, 2007) was used.
Stand-level performance was assessed in terms of totalaccumulated biomass. Data were analysed by classicalone-way ANOVA.
Sub-population characteristics in the experiment explor-ing the interaction between fertility level and plasticitywere analysed with ANOVA at year 300. Populationdynamics evolution was analysed graphically.
RESULTS
Plasticity � relative frequency
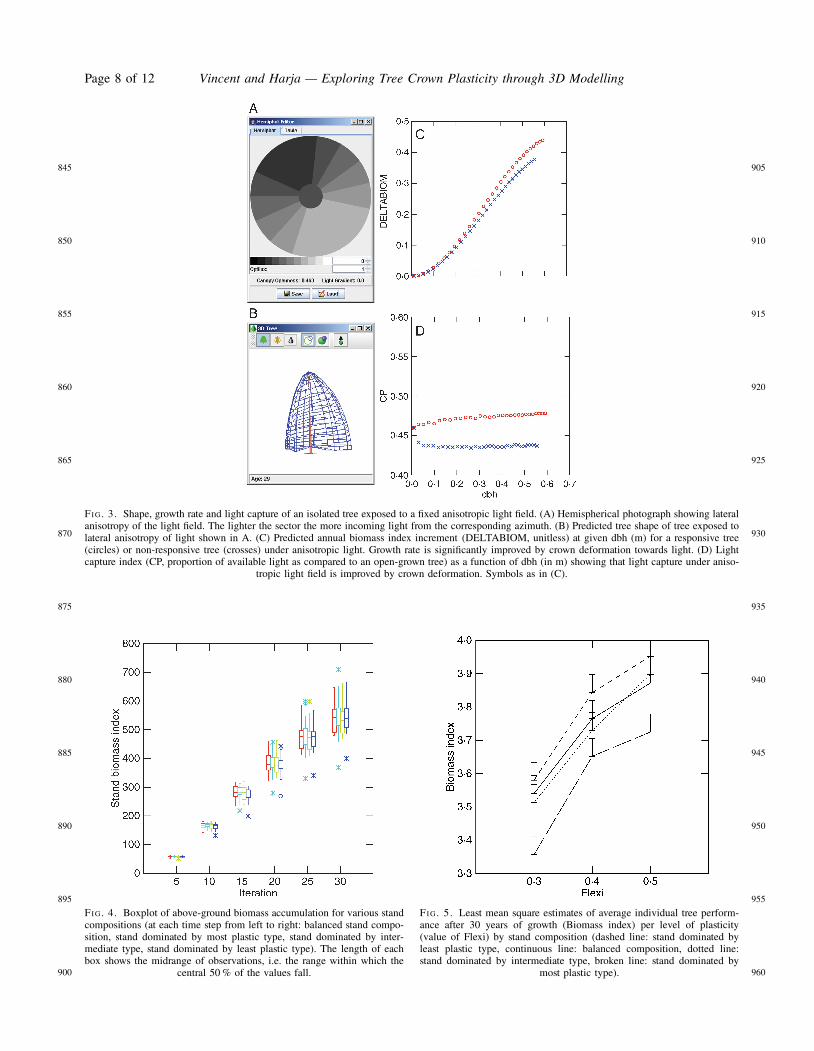
A 25 % increase (or decrease) in the Flexi parameter valueconferred a moderate (þ3 % or 27 %, respectively) albeithighly significant change in accumulated above-groundbiomass per tree in mixed stands (Table 1, Fig. 4). Treeaverage performance wasQ2 improved by increased crownplasticity in all stand compositions. The effect of standcomposition on tree average performance was moderatebut statistically significant (Table 1). A plot of least meansquares (Fig. 5) showed that all strategies were affectedby stand composition in a similar way. For example, allstrategies tended to perform better in the stands dominatedby the least flexible strategy than in the stands dominated bythe most flexible one. In marked contrast, stand compositiondid not affect stand productivity, as evidenced by the vir-tually indistinguishable evolution of total biomass withtime for the various compositions (Fig. 5).
Stand composition did not affect the relative competi-tiveness of the strategies in the mixture. Stand composition
seemed to determine a global level of competitiveness ofthe stand that affected all strategies indiscriminately.
Plasticity � density
Both stand density and degree of plasticity had a signifi-cant effect on individual tree growth performance (Table 2).The plasticity effect was an order of magnitude less than thedensity effect, as Q3can be seen from a plot of least meansquares (Fig. 6). Increased flexibility conferred a competi-tive advantage to the light-demanding species whateverthe overall density. Stand density and crown plasticity didnot show any significant interaction (Table 2, Fig. 6).Crown plasticity did not appear to be more advantageousin denser plots, in contrast to what might have beenexpected. It may be that lateral flexibility played a signifi-cant role under less dense conditions, while the verticalflexibility conferred the competitive advantage in denserstands.
Overall growth was strongly affected by density asexpected. In the absence of self-thinning (disabled forthose simulations) standing biomass of the densest standsremained ahead of the others after 30 years of growth(Fig. 7).
Plasticity � growth rate
Both Flexi and growth rate effects were highly significant(Table 3). The change in performance associated withvarying Flexi by +25 % was approx. +4 % after30 years whereas the increase in performance due to anincreased growth rate of 10 % was approx. 20 %.
A statistically significant interaction between plasticityand growth rate was detected. This interaction resultedfrom a lower beneficial effect of plasticity in fast growingtrees, contrary to our prediction (Fig. 8).
Below-ground � above-ground competition
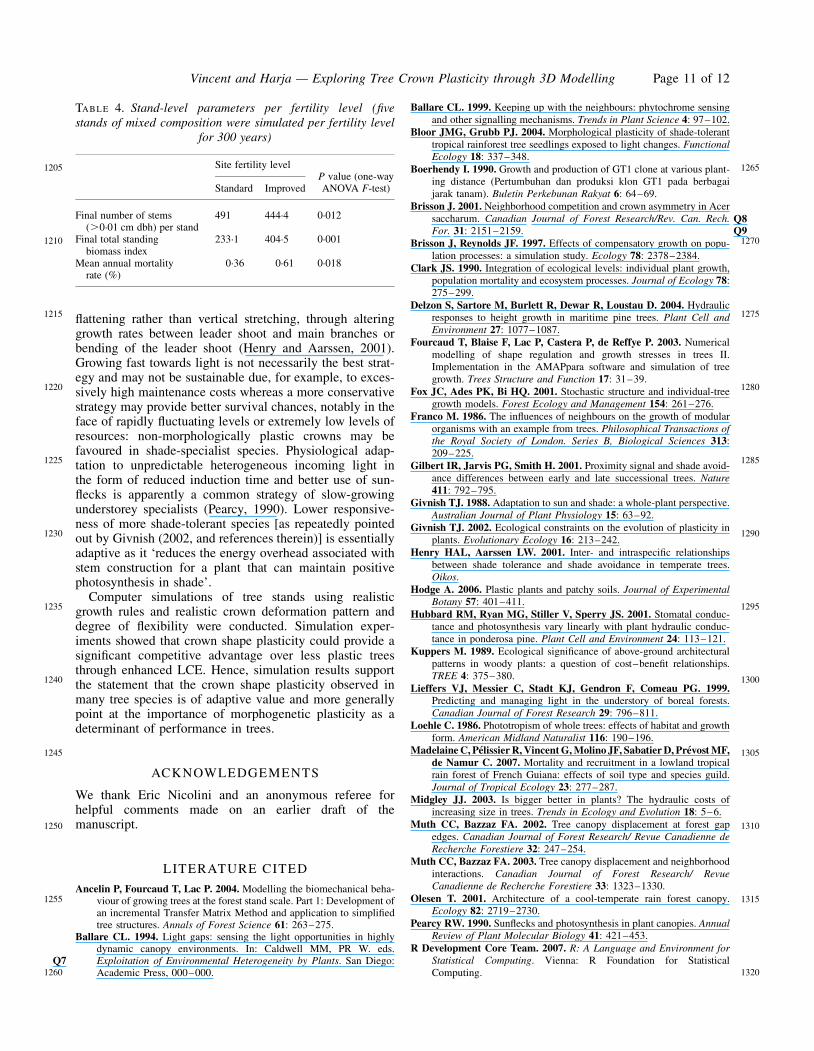
Increased fertility reduced below-ground competitionand, consequently, increased competitive advantage ofmore plastic types (Fig. 9). Increased fertility also translatedinto higher total biomass, lower number of stems and higherturnover rates (Table 4). Absolute values of mortality ratesshould not be considered as realistic: they are at least twicelower than those reported in Indonesian agroforest(G. Vincent, unpubl. res.) or tree mortality rates in tropicalforests (see, for example, Madelaine et al., 2007). This isnot surprising as no calibration of the mortality functionwas attempted prior to simulation. The changes in structureand dynamics, however, do mirror those predicted formonospecific stands from an analytical growth model incor-porating explicit below-ground and above-ground compe-tition (Clark, 1990).
DISCUSSION AND CONCLUSIONS
The computer simulation experiments presented hereexplored the impact of enhanced or reduced plasticity ofcrown development on tree growth performance in a
TABLE 1. Effect of overall stand composition (eitherbalanced or dominated by one of the three plasticity levels)and plasticity (+25 % of Flexi reference value) on theperformance of trees growing in mixture (r2 ¼ 0.15, without
random effect), based on 240 simulated stands of 30 years
Source d.f.Sum ofsquares
Meansquare F-ratio P
Flexi (plasticity level) 2 16.7123 8.3561 64.47 0.000Stand composition 3 1.4038 0.4679 3.61 0.013Composition � Flexi 6 0.2075 0.0346 0.27 0.95Residual 707* 0.12962
* One degree of freedom lost by using simulation identifier as randomeffect.
Vincent and Harja — Exploring Tree Crown Plasticity through 3D ModellingPage 6 of 12
605
610
615
620
625
630
635
640
645
650
655
660
665
670
675
680
685
690
695
700
705
710
715
720
variety of contexts. Sensitivity analysis of crown plasticitywas restricted to varying the Flexi parameter (controllingmaximum deformation). Qualitatively similar results havebeen found for the Sensi parameter (controlling precocityof response, data not shown) and both parameters arelikely to be correlated in nature.
As hypothesized, it was found that the degree of crownplasticity had an impact both at individual tree level(compare Figs 2 and 3)Q2 and population level (H1) but noimpact was found at stand level. Altering the relative pro-portion of more or less plastic strategies did not changethe above-ground accumulation rate to any measurableextent not even at early stages. Of course simulation of amore strongly contrasted growth strategy may haveinduced such a stand-level effect. The point remains thatcompensation mechanisms occurred at stand level thatoffset the observed impact of plasticity at populationlevel, partially contradicting hypothesis (H1). The simu-lations which explored a limited range of plasticity with amodest impact on growth, only partially supported (H2)stating that competitiveness of a particular strategy iscontext-dependent (and notably frequency-dependent).The competitive edge of any particular strategy (i.e. itsperformance relative to the average performance) is exp-ected to decrease when it becomes more frequent simply
because by increasing in relative frequency it is contribut-ing to increasing the average performance, a purely arith-metical reason which would hold in the absence of anyinteraction. Additionally, absolute performance of anygiven strategy is expected to be affected by the overall com-petitiveness on the environment, which modifies resourceavailability to individual trees. This overall competitivenesswas manipulated via changes in stand composition andstand density. For composition modification, the most flex-ible type performed better under the least competitive stand(dominated by the least productive types). However, thedecrease in individual tree performance observed withincreasing competition was not limited to any particularstrategy (Fig. 5). The lack of change in relative competitive-ness of the various strategies (also found when plantingdensity was varied; Fig. 6 and Table 2) can be related tothe fact that the strategies being confronted were verysimilar: they differed only in respect to their crown plas-ticity and even so to a moderate extent. A mixture ofmore contrasted strategies may reveal complementarity inresource partitioning such as that observed for light andspace between tall, light-demanding types and short,shade specialist types. In such a context, change in relativefrequency of the various types in mixture would probablyaffect their relative competitiveness.
FI G. 2. Shape, growth rate and light capture of an isolated tree exposed to a fixed vertical light gradient. (A) Hemispherical photograph showing verticalgradient imposed. The lighter the ring the more incoming light from the corresponding inclination. (B) Predicted tree shape developed in response tovertical light gradient shown in A. (C) Predicted annual biomass index increment (DELTABIOM, unitless) at a given dbh (m) is larger for a responsivetree (circles) than a non-responsive control tree (crosses). Growth of responsive trees is nevertheless delayed due to increased biomass allocation to non-productive stem growth. (D) Light capture index (CP proportion of available light as compared with an open-grown tree) as a function of dbh (m) showingthat light capture is improved following crown deformation even when imposing a fixed light map. Here benefits accrue from a change in crown shape not
crown rise. Symbols are as in (C).
Vincent and Harja — Exploring Tree Crown Plasticity through 3D Modelling Page 7 of 12
725
730
735
740
745
750
755
760
765
770
775
780
785
790
795
800
805
810
815
820
825
830
835
840
FI G. 3. Shape, growth rate and light capture of an isolated tree exposed to a fixed anisotropic light field. (A) Hemispherical photograph showing lateralanisotropy of the light field. The lighter the sector the more incoming light from the corresponding azimuth. (B) Predicted tree shape of tree exposed tolateral anisotropy of light shown in A. (C) Predicted annual biomass index increment (DELTABIOM, unitless) at given dbh (m) for a responsive tree(circles) or non-responsive tree (crosses) under anisotropic light. Growth rate is significantly improved by crown deformation towards light. (D) Lightcapture index (CP, proportion of available light as compared to an open-grown tree) as a function of dbh (in m) showing that light capture under aniso-
tropic light field is improved by crown deformation. Symbols as in (C).
FI G. 4. Boxplot of above-ground biomass accumulation for various standcompositions (at each time step from left to right: balanced stand compo-sition, stand dominated by most plastic type, stand dominated by inter-mediate type, stand dominated by least plastic type). The length of eachbox shows the midrange of observations, i.e. the range within which the
central 50 % of the values fall.
FI G. 5. Least mean square estimates of average individual tree perform-ance after 30 years of growth (Biomass index) per level of plasticity(value of Flexi) by stand composition (dashed line: stand dominated byleast plastic type, continuous line: balanced composition, dotted line:stand dominated by intermediate type, broken line: stand dominated by
most plastic type).
Vincent and Harja — Exploring Tree Crown Plasticity through 3D ModellingPage 8 of 12
845
850
855
860
865
870
875
880
885
890
895
900
905
910
915
920
925
930
935
940
945
950
955
960

Negative interaction between growth rate and crown plas-ticity was found with the present range of plasticity andgrowth rate explored (Fig. 8) contradicting (H3), whichconjectured positive interaction. Instead, fast growingtypes gained little additional competitive advantage frombeing more plastic. More simulations are needed to seehow systematic this response may be. But with hindsightthe observed pattern certainly makes sense and this resultalso calls for a re-examination of hypothesis (H3). It maybe that high morphological responsiveness to heterogeneityin light distribution is more directly beneficial to plants withhigh organ turnover rate (and fast return on investment)rather than plants with high growth rate per se.
Increased plasticity conferred a significant absoluteadvantage in all cases examined even though the below-ground competition tended to mitigate this advantage(Fig. 9). As hypothesized in (H4), changing the below-ground competition intensity affected the relative
competitiveness of the different types. Lower competitionfor below-ground resources increased the competitiveedge of more plastic trees and was accompanied bychanges in structure and dynamics consistent with theoreti-cal expectations (Table 4).
Despite the fact that no specific cost of plasticity hasbeen included in the model, some negative feedbackloops did tend to reduce the advantage of crown flexi-bility. The main two such negative loops were reducedcrown expansion rates (smaller crowns and subsequentlower growth potential as a result of vertical stretching;as previously discussed) and reduced below-groundcompetitiveness.
As mentioned in the Introduction, some specific costs areundoubtedly associated with crown deformation in nature.Those could, in principle, be included in the model eitherin the form of reduced growth efficiency (notably relatedto the expected reduced LUE) or in terms of increased mor-tality (notably as a result of increased susceptibility to windthrow of higher, more asymmetric trees) (Young and
FI G. 6. Least mean square estimates of average individual tree perform-ance after 30 years of growth (Biomass index) per level of plasticity(value of Flexi) grouped by stand density (continuous line: 300 treesha21; broken line: 600 trees ha21; dotted line: 900 trees ha21). Error
bars show + s.e.m.
FI G. 7.
Q4
Boxplot of above-ground biomass accumulation for various standdensities (at each time step from left to right: 300, 600 and 900 trees ha21).The length of each box shows the midrange of observations, i.e. the range
within which the central 50 % of the values fall.
TABLE 3. Effect of growth rate (either unchanged orincreased by 10 %) and crown plasticity (+25 % of Flexireference value) on the performance of trees growing inmixture (r2 ¼ 0.43, without random effect), based on60 simulated stands of 30 years; random seed of simulation
used as random effect.
Source d.f.Sum ofsquares
Meansquare F-ratio P
Flexi (plasticity level) 2 5.192 2.596 59.87 0.000Growth rate 1 48.517 48.517 1119.01 0.000Growth rate � Flexi 2 0.633 0.316 7.29 0.000Residual 260* 0.029197
* One degree of freedom lost by using simulation identifier as randomeffect.
TABLE 2. Effect of stand density (300, 600 or 900 treesha21) and crown plasticity (+25 % of Flexi reference value)on the performance of trees growing in mixture (r2 ¼ 0.90,without random effect), based on 90 simulated stands of
30 years; random seed used as random effect
Source d.f.Sum ofsquares
Meansquare F-ratio P
Flexi (plasticity level) 2 4.9502 2.4751 84.77 0.000Stand density 2 26.4333 13.2167 452.67 0.000Density � Flexi 4 0.0851 0.0213 0.73 0.57Residual 260* 0.029197
* One degree of freedom lost by using simulation identifier as randomeffect.
Vincent and Harja — Exploring Tree Crown Plasticity through 3D Modelling Page 9 of 12
965
970
975
980
985
990
995
1000
1005
1010
1015
1020
1025
1030
1035
1040
1045
1050
1055
1060
1065
1070
1075
1080

Perkocha, 1994). A function of susceptibility to wind throwdepending on crown asymmetry, crown mass and treeheight could be considered (e.g. Olesen, 2001). However,tree morphological responses to mechanical stress associ-ated with crown deformation (such as trunk tapering, but-tresses, asymmetric stem thickening, root growth or stembending; Fourcaud et al., 2003; Ancelin et al., 2004) mayall affect this susceptibility as well as the overall netgrowth efficiency of deformation. So calibration of thistype of susceptibility function is certainly a delicate task.
Neglecting the negative feedback that may occur in termsof LUE (see Introduction) may have contributed to overes-timating the benefits of crown plasticity at individual treelevel and hence affected the in silico experimental resultspresented. However, the negative effects associated withcrown deformation are likely to be of significant amplitude
only when deformation is large (in terms of either verticalstretching or lateral crown asymmetry), which was not thecase in the simulations conducted. So it is reasonable toassume that neglecting such negative feedback probablyhad only a minor impact on the output of the numericalexperiment presented.
Simulation scenarios were not completely realistic evenwhere they incorporated demographic processes, notablyin that they considered mixtures of a reduced set ofspecies of similar ecology immune to invasion by otherspecies. From an ecological standpoint, a more relevantanalysis of the impact of crown shape plasticity on tree per-formance may, however, be attempted using the same orsimilar model. Simulations should then feature truly multi-species stands (i.e. combination of different successionalstatus and adult size) and systematically incorporate thedemographic processes.
Clearly not all tree species in nature show the samedegree of crown plasticity. For example, Gilbert et al.(2001) have shown that early-successional species tend tobe more etiolated when shaded or exposed to low R : FRthan late-successional shade-tolerant species. Muth andBazzaz (2002) also noted that the magnitude and precisionof canopy displacement at forest edges are generally greaterfor earlier successional trees and hardwoods than for latersuccessional trees and conifers, suggesting that (1) globalplasticity may be higher in early-successional species and(2) conifers are globally less plastic. The latter point maybe related to their fairly rigid morphogenetic development(and notably the maintenance of a dominant main stemfor most conifer species almost until death of the tree).The present study examined how the growth performanceof a fast-growing, light-demanding species was affectedby changes in crown plasticity and found that high plasticityappeared to confer an absolute advantage. Of course suchconclusions are conditional on the assumptions made inthe model and on the growth characteristics of the speciesthat was simulated (Kuppers, 1989). In shade-tolerantspecies, for example, crown deformation under a subopti-mal light regime may actually entail crown horizontal
FI G. 9. Evolution of tree number per sub-population type (dotted line: most plastic; dashed line: intermediate; continuous line: least plastic crown) over300 years. Average of five simulations per level of fertility: (A) increased fertility, (B) standard fertility. Initial Q5composition of 50 � 50-m stand is
balanced. Smoothing algorithm: Distance-Weighted Least Squares (Systat v. 11.0).
FI G. 8. Least mean square estimates of average individual tree perform-ance after 30 years of growth (Biomass index) per level of plasticity(value of Flexi) by growth rate (default: dashed line; enhanced: continuous
line). Vertical bars represent s.e.m.
Vincent and Harja — Exploring Tree Crown Plasticity through 3D ModellingPage 10 of 12
1085
1090
1095
1100
1105
1110
1115
1120
1125
1130
1135
1140
1145
1150
1155
1160
1165
1170
1175
1180
1185
1190
1195
1200
flattening rather than vertical stretching, through alteringgrowth rates between leader shoot and main branches orbending of the leader shoot (Henry and Aarssen, 2001).Growing fast towards light is not necessarily the best strat-egy and may not be sustainable due, for example, to exces-sively high maintenance costs whereas a more conservativestrategy may provide better survival chances, notably in theface of rapidly fluctuating levels or extremely low levels ofresources: non-morphologically plastic crowns may befavoured in shade-specialist species. Physiological adap-tation to unpredictable heterogeneous incoming light inthe form of reduced induction time and better use of sun-flecks is apparently a common strategy of slow-growingunderstorey specialists (Pearcy, 1990). Lower responsive-ness of more shade-tolerant species [as repeatedly pointedout by Givnish (2002, and references therein)] is essentiallyadaptive as it ‘reduces the energy overhead associated withstem construction for a plant that can maintain positivephotosynthesis in shade’.
Computer simulations of tree stands using realisticgrowth rules and realistic crown deformation pattern anddegree of flexibility were conducted. Simulation exper-iments showed that crown shape plasticity could provide asignificant competitive advantage over less plastic treesthrough enhanced LCE. Hence, simulation results supportthe statement that the crown shape plasticity observed inmany tree species is of adaptive value and more generallypoint at the importance of morphogenetic plasticity as adeterminant of performance in trees.
ACKNOWLEDGEMENTS
We thank Eric Nicolini and an anonymous referee forhelpful comments made on an earlier draft of themanuscript.
LITERATURE CITED
Ancelin P, Fourcaud T, Lac P. 2004. Modelling the biomechanical beha-viour of growing trees at the forest stand scale. Part 1: Development ofan incremental Transfer Matrix Method and application to simplifiedtree structures. Annals of Forest Science 61: 263–275.
Ballare CL. 1994. Light gaps: sensing the light opportunities in highlydynamic canopy environments. In: Caldwell MM, PR W. eds.ExploitationQ7 of Environmental Heterogeneity by Plants. San Diego:Academic Press, 000–000.
Ballare CL. 1999. Keeping up with the neighbours: phytochrome sensingand other signalling mechanisms. Trends in Plant Science 4: 97–102.
Bloor JMG, Grubb PJ. 2004. Morphological plasticity of shade-toleranttropical rainforest tree seedlings exposed to light changes. FunctionalEcology 18: 337–348.
Boerhendy I. 1990. Growth and production of GT1 clone at various plant-ing distance (Pertumbuhan dan produksi klon GT1 pada berbagaijarak tanam). Buletin Perkebunan Rakyat 6: 64–69.
Brisson J. 2001. Neighborhood competition and crown asymmetry in Acersaccharum. Canadian Q8Journal of Forest Research/Rev. Can. Rech.For. Q931: 2151–2159.
Brisson J, Reynolds JF. 1997. Effects of compensatory growth on popu-lation processes: a simulation study. Ecology 78: 2378–2384.
Clark JS. 1990. Integration of ecological levels: individual plant growth,population mortality and ecosystem processes. Journal of Ecology 78:275–299.
Delzon S, Sartore M, Burlett R, Dewar R, Loustau D. 2004. Hydraulicresponses to height growth in maritime pine trees. Plant Cell andEnvironment 27: 1077–1087.
Fourcaud T, Blaise F, Lac P, Castera P, de Reffye P. 2003. Numericalmodelling of shape regulation and growth stresses in trees II.Implementation in the AMAPpara software and simulation of treegrowth. Trees Structure and Function 17: 31–39.
Fox JC, Ades PK, Bi HQ. 2001. Stochastic structure and individual-treegrowth models. Forest Ecology and Management 154: 261–276.
Franco M. 1986. The influences of neighbours on the growth of modularorganisms with an example from trees. Philosophical Transactions ofthe Royal Society of London. Series B, Biological Sciences 313:209–225.
Gilbert IR, Jarvis PG, Smith H. 2001. Proximity signal and shade avoid-ance differences between early and late successional trees. Nature411: 792–795.
Givnish TJ. 1988. Adaptation to sun and shade: a whole-plant perspective.Australian Journal of Plant Physiology 15: 63–92.
Givnish TJ. 2002. Ecological constraints on the evolution of plasticity inplants. Evolutionary Ecology 16: 213–242.
Henry HAL, Aarssen LW. 2001. Inter- and intraspecific relationshipsbetween shade tolerance and shade avoidance in temperate trees.Oikos.
Hodge A. 2006. Plastic plants and patchy soils. Journal of ExperimentalBotany 57: 401–411.
Hubbard RM, Ryan MG, Stiller V, Sperry JS. 2001. Stomatal conduc-tance and photosynthesis vary linearly with plant hydraulic conduc-tance in ponderosa pine. Plant Cell and Environment 24: 113–121.
Kuppers M. 1989. Ecological significance of above-ground architecturalpatterns in woody plants: a question of cost–benefit relationships.TREE 4: 375–380.
Lieffers VJ, Messier C, Stadt KJ, Gendron F, Comeau PG. 1999.Predicting and managing light in the understory of boreal forests.Canadian Journal of Forest Research 29: 796–811.
Loehle C. 1986. Phototropism of whole trees: effects of habitat and growthform. American Midland Naturalist 116: 190–196.
Madelaine C, Pelissier R, Vincent G, Molino JF, Sabatier D, Prevost MF,de Namur C. 2007. Mortality and recruitment in a lowland tropicalrain forest of French Guiana: effects of soil type and species guild.Journal of Tropical Ecology 23: 277–287.
Midgley JJ. 2003. Is bigger better in plants? The hydraulic costs ofincreasing size in trees. Trends in Ecology and Evolution 18: 5–6.
Muth CC, Bazzaz FA. 2002. Tree canopy displacement at forest gapedges. Canadian Journal of Forest Research/ Revue Canadienne deRecherche Forestiere 32: 247–254.
Muth CC, Bazzaz FA. 2003. Tree canopy displacement and neighborhoodinteractions. Canadian Journal of Forest Research/ RevueCanadienne de Recherche Forestiere 33: 1323–1330.
Olesen T. 2001. Architecture of a cool-temperate rain forest canopy.Ecology 82: 2719–2730.
Pearcy RW. 1990. Sunflecks and photosynthesis in plant canopies. AnnualReview of Plant Molecular Biology 41: 421–453.
R Development Core Team. 2007. R: A Language and Environment forStatistical Computing. Vienna: R Foundation for StatisticalComputing.
TABLE 4. Stand-level parameters per fertility level (fivestands of mixed composition were simulated per fertility level
for 300 years)
Site fertility levelP value (one-wayANOVA F-test)Standard Improved
Final number of stems(.0.01 cm dbh) per stand
491 444.4 0.012
Final total standingbiomass index
233.1 404.5 0.001
Mean annual mortalityrate (%)
0.36 0.61 0.018
Vincent and Harja — Exploring Tree Crown Plasticity through 3D Modelling Page 11 of 12
1205
1210
1215
1220
1225
1230
1235
1240
1245
1250
1255
1260
1265
1270
1275
1280
1285
1290
1295
1300
1305
1310
1315
1320
Reed D, Tome M, Araujo MC, Jones E. 2001. A re-examination ofpotential * modifier dimensional growth models. In: Forest biometry,modelling and information systems. Greenwich: IUFRO, 1–11.
Russell G, Marshall B, Jarvis PG. 1989. Plant canopies: their growth,form and function. New York: Cambridge University Press.
Schafer KVR, Oren R, Tenhunen JD. 2000. The effect of tree height oncrown level stomatal conductance. Plant, Cell and Environment 23:365–375.
Smith H. 1982. Light quality, photoperception, and plant strategy. AnnualReview of Plant Physiology 33: 481–518.
Smith H. 1995. Physiological and ecological function within the phyto-chrome family. Annual Review of Plant Physiology 46: 289–315.
Sprugel DG. 2002. When branch autonomy fails: Milton’s Lawof resource availability and allocation. Tree Physiology 22:1119–1124.
Stoll P, Schmid B. 1998. Plant foraging and dynamic competition betweenbranches of Pinus sylvestris in contrasting light environments.The Journal of Ecology 86: 934–945.
Tilman D. 1987. On the meaning of competition and the mechanisms ofcompetitive superiority. Functional Ecology 1: 304–315.
Vincent G. 2006. Leaf life span plasticity in tropical seedlings grownunder contrasting light regimes Annals of Botany 97: 245–255.
Vincent G, Harja D. 2002. SLIM software: a simple light interceptionmodel for multi-species, multi-strata forests. Bois et Forets desTropiques 2: 97–100.
Vincent G, De Foresta H, Mulia R. 2002. Predictors of tree growth in aDipterocarp based agroforest: a critical assessment. Forest Ecologyand Management 161: 39–52.
Young TP, Perkocha V. 1994. Treefalls, crown asymmetry, and but-tresses. The Journal of Ecology 82: 319–324.
Vincent and Harja — Exploring Tree Crown Plasticity through 3D ModellingPage 12 of 12
1325
1330
1335
1340
1345
1350
1355
1360
1365
1370
1375
1380
1385
1390
1395
1400
1405
1410
1415
1420
1425
1430
1435
1440