Experimental Testing of Concrete Beams Reinforced with Carbon FRP Bars
18
http://jcm.sagepub.com Journal of Composite Materials DOI: 10.1177/0021998307078727 2007; 41; 2657 Journal of Composite Materials Muhammad Masood Rafi, Ali Nadjai and Faris Ali Experimental Testing of Concrete Beams Reinforced with Carbon FRP Bars http://jcm.sagepub.com/cgi/content/abstract/41/22/2657 The online version of this article can be found at: Published by: http://www.sagepublications.com On behalf of: American Society for Composites can be found at: Journal of Composite Materials Additional services and information for http://jcm.sagepub.com/cgi/alerts Email Alerts: http://jcm.sagepub.com/subscriptions Subscriptions: http://www.sagepub.com/journalsReprints.nav Reprints: http://www.sagepub.com/journalsPermissions.nav Permissions: © 2007 SAGE Publications. All rights reserved. Not for commercial use or unauthorized distribution. by Asad-ur-Rehman Khan on March 13, 2008 http://jcm.sagepub.com Downloaded from
Transcript of Experimental Testing of Concrete Beams Reinforced with Carbon FRP Bars
http://jcm.sagepub.com
Journal of Composite Materials
DOI: 10.1177/0021998307078727 2007; 41; 2657 Journal of Composite Materials
Muhammad Masood Rafi, Ali Nadjai and Faris Ali Experimental Testing of Concrete Beams Reinforced with Carbon FRP Bars
http://jcm.sagepub.com/cgi/content/abstract/41/22/2657 The online version of this article can be found at:
Published by:
http://www.sagepublications.com
On behalf of: American Society for Composites
can be found at:Journal of Composite Materials Additional services and information for
http://jcm.sagepub.com/cgi/alerts Email Alerts:
http://jcm.sagepub.com/subscriptions Subscriptions:
http://www.sagepub.com/journalsReprints.navReprints:
http://www.sagepub.com/journalsPermissions.navPermissions:
© 2007 SAGE Publications. All rights reserved. Not for commercial use or unauthorized distribution. by Asad-ur-Rehman Khan on March 13, 2008 http://jcm.sagepub.comDownloaded from
Experimental Testing of Concrete BeamsReinforced with Carbon FRP Bars
MUHAMMAD MASOOD RAFI,* ALI NADJAI AND FARIS ALI
FireSERT, University of Ulster at Jordanstown, Shore Road
Newtownabbey BT37 0QB, UK
ABSTRACT: Most of the research on the fiber reinforced polymer (FRP) barreinforced structures employed glass FRP (GFRP) bars. The results of tests, whichwere conducted on the carbon FRP (CFRP) bar reinforced concrete beams,are reported in this article. The beams reinforced with conventional steel rods weretested as control specimens. Nearly equal crack spacing and number of cracks werenoted in both types of beams, at all stages of loading. The bond characteristics of theCFRP bars were found to be satisfactory. The ACI code equation over-estimated thestiffness of the CFRP reinforced beams and as a result theoretical deflection,predicted by the ACI code method, was found to be less than the recorded deflection.
KEY WORDS: fiber reinforced polymer, beam, cracking, strain, failure, bond,deflection.
INTRODUCTION
THE USE OF steel as a reinforcing material in reinforced concrete (RC) structures hasa long tradition in the construction industry. The success of steel over all other
materials was made possible by its superior qualities of strength and compatibility withconcrete. However, the problems with corrosion have given rise to costly-to-rectifysolutions and made the maintenance of these structures expensive and time consuming.Several methods of avoiding corrosion of steel were tried in the past including the use ofadmixtures in concrete in order to reduce its permeability, the use of galvanized or epoxy-coated steel bars, electro-static spray fusion-bonded (powder resin) coatings, polymer-impregnated concrete, etc. None of these proved adequate enough to reduce the level ofanxiety and unease among infrastructure owners and professionals. Recent efforts in theconstruction industry have been focused on the introduction of new competitive non-metallic fiber reinforced polymer (FRP) materials in order to deal with the unreliabledurability problems of steel RC structures.
FRP bars made up of aramid, carbon or glass fibers are available for commercialapplications. Most of the research on the FRP bars remained focused on glass FRP
*Author to whom correspondence should be addressed. E-mail: [email protected] 2–4 appear in color online: http://jcm.sagepub.com
Journal of COMPOSITE MATERIALS, Vol. 41, No. 22/2007 2657
0021-9983/07/22 2657–17 $10.00/0 DOI: 10.1177/0021998307078727� SAGE Publications 2007
Los Angeles, London, New Delhi and Singapore
© 2007 SAGE Publications. All rights reserved. Not for commercial use or unauthorized distribution. by Asad-ur-Rehman Khan on March 13, 2008 http://jcm.sagepub.comDownloaded from
(GFRP) rods. This was due to the lower cost of GFRP bars [1–3] compared to the othertypes of FRP bars. This paper presents the results of tests carried out on the concretebeams reinforced with carbon FRP (CFRP) tension bars.
Duplicate steel and CFRP reinforced beams were tested in bending at the Universityof Ulster. The presented article is part of an on-going research into studying the behavior ofthe CFRP RC beams at normal and elevated temperature conditions. The steel reinforcedbeams were tested as control specimens. The study focused on the flexural behavior ofthese beams in terms of stress–strain, deflection behavior, modes of failure, load-carryingcapacity and cracking pattern. These aspects of the behavior of beams are discussedhereafter.
EXPERIMENTAL PROGRAMME
Test Specimens
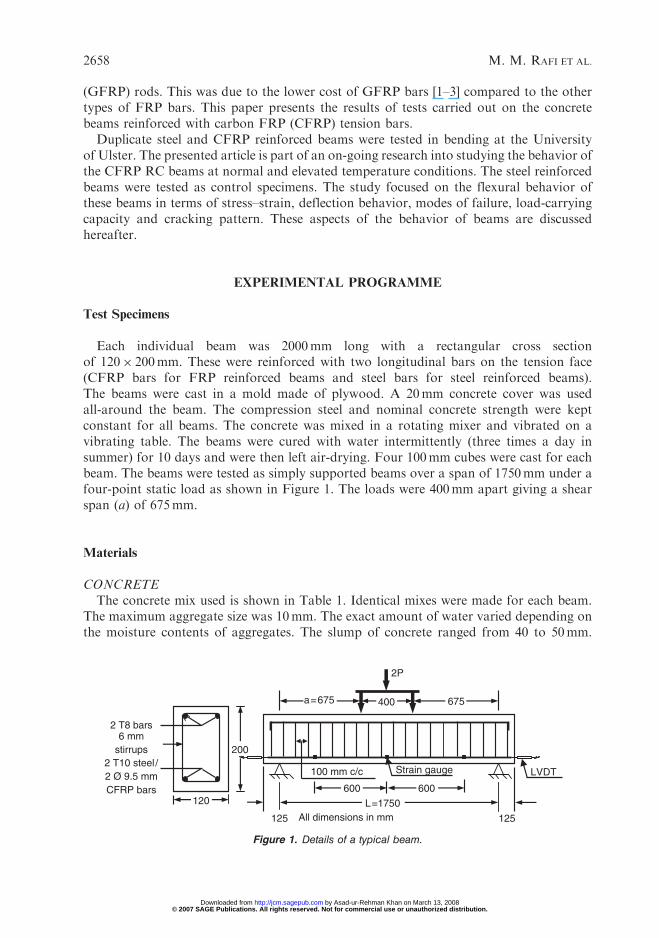
Each individual beam was 2000mm long with a rectangular cross sectionof 120� 200mm. These were reinforced with two longitudinal bars on the tension face(CFRP bars for FRP reinforced beams and steel bars for steel reinforced beams).The beams were cast in a mold made of plywood. A 20mm concrete cover was usedall-around the beam. The compression steel and nominal concrete strength were keptconstant for all beams. The concrete was mixed in a rotating mixer and vibrated on avibrating table. The beams were cured with water intermittently (three times a day insummer) for 10 days and were then left air-drying. Four 100mm cubes were cast for eachbeam. The beams were tested as simply supported beams over a span of 1750mm under afour-point static load as shown in Figure 1. The loads were 400mm apart giving a shearspan (a) of 675mm.
Materials
CONCRETEThe concrete mix used is shown in Table 1. Identical mixes were made for each beam.
The maximum aggregate size was 10mm. The exact amount of water varied depending onthe moisture contents of aggregates. The slump of concrete ranged from 40 to 50mm.
6 mm stirrups
400
L=1750
200
120
2 T8 bars
a=675 675
100 mm c/c2 T10 steel /2 Ø 9.5 mmCFRP bars
2P
600 600
Strain gauge LVDT
All dimensions in mm125 125
Figure 1. Details of a typical beam.
2658 M. M. RAFI ET AL.
© 2007 SAGE Publications. All rights reserved. Not for commercial use or unauthorized distribution. by Asad-ur-Rehman Khan on March 13, 2008 http://jcm.sagepub.comDownloaded from
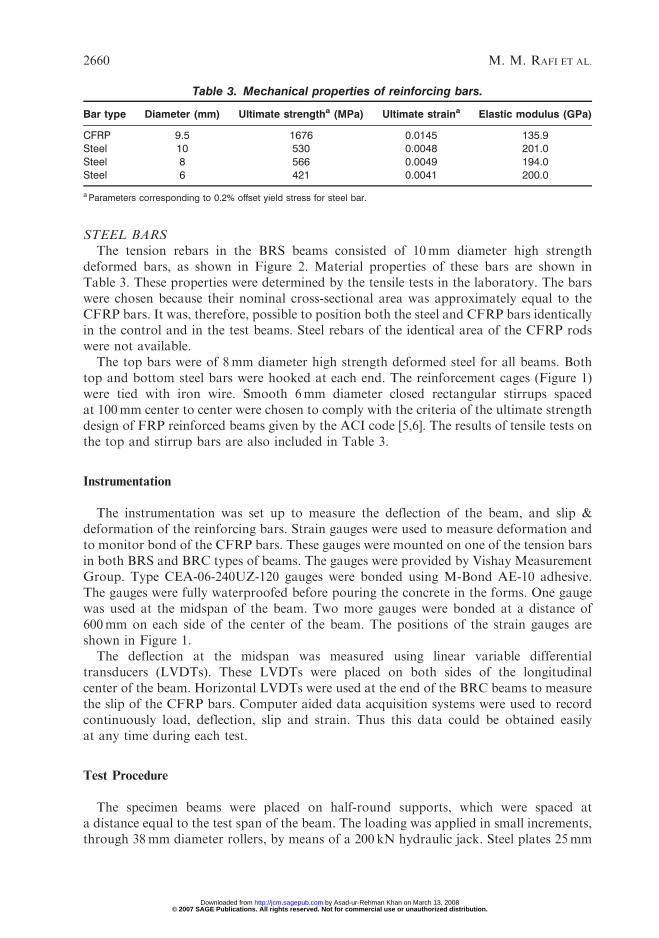
Cube strength after 28 days was 49MPa, this being the average strength of the four cubes,one from each beam. This is equivalent to 43MPa cylindrical strength [4]. The strength ofthe concrete has been rounded off to two significant figures.
Table 2 shows the cube and equivalent cylindrical strength [4] of the concrete on the dayof testing (rounded off to two figures). These strengths were obtained from the averagestrength of three cubes for each beam. Each beam tested was defined by letters comparingits reinforcing material and temperature conditions. The notation used to identify thebeams are as follows: the first letter (B) stands for beam; the second letter indicates thetesting temperature as R for room temperature; and the third letter represents the type oftension reinforcing bar material such as S for steel and C for CFRP bars. This notationhave been consistently followed throughout the rest of the text.
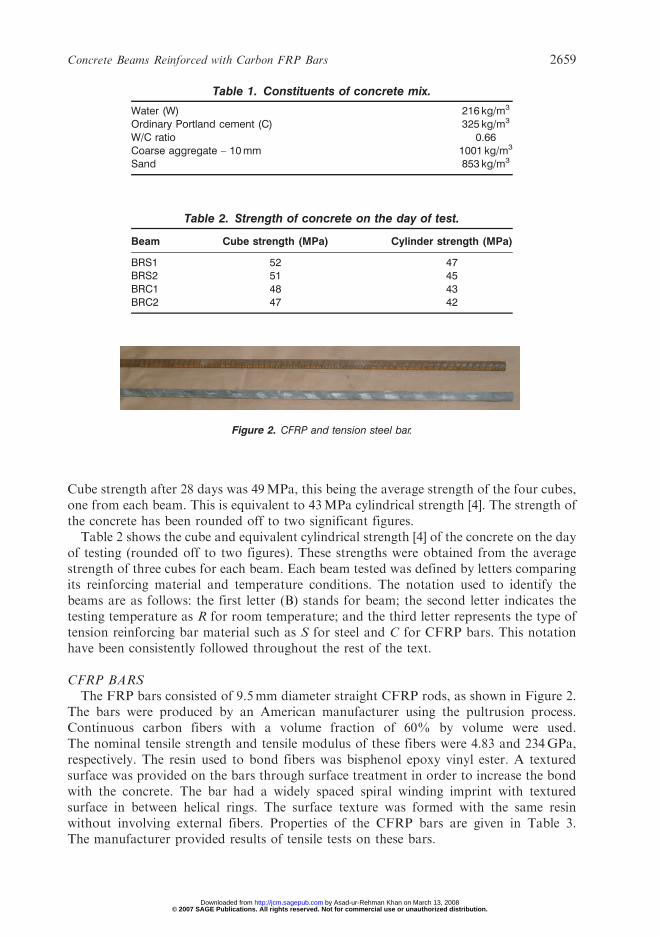
CFRP BARSThe FRP bars consisted of 9.5mm diameter straight CFRP rods, as shown in Figure 2.
The bars were produced by an American manufacturer using the pultrusion process.Continuous carbon fibers with a volume fraction of 60% by volume were used.The nominal tensile strength and tensile modulus of these fibers were 4.83 and 234GPa,respectively. The resin used to bond fibers was bisphenol epoxy vinyl ester. A texturedsurface was provided on the bars through surface treatment in order to increase the bondwith the concrete. The bar had a widely spaced spiral winding imprint with texturedsurface in between helical rings. The surface texture was formed with the same resinwithout involving external fibers. Properties of the CFRP bars are given in Table 3.The manufacturer provided results of tensile tests on these bars.
Table 1. Constituents of concrete mix.
Water (W) 216 kg/m3
Ordinary Portland cement (C) 325 kg/m3
W/C ratio 0.66Coarse aggregate – 10mm 1001 kg/m3
Sand 853 kg/m3
Table 2. Strength of concrete on the day of test.
Beam Cube strength (MPa) Cylinder strength (MPa)
BRS1 52 47BRS2 51 45BRC1 48 43BRC2 47 42
Figure 2. CFRP and tension steel bar.
Concrete Beams Reinforced with Carbon FRP Bars 2659
© 2007 SAGE Publications. All rights reserved. Not for commercial use or unauthorized distribution. by Asad-ur-Rehman Khan on March 13, 2008 http://jcm.sagepub.comDownloaded from
STEEL BARSThe tension rebars in the BRS beams consisted of 10mm diameter high strength
deformed bars, as shown in Figure 2. Material properties of these bars are shown inTable 3. These properties were determined by the tensile tests in the laboratory. The barswere chosen because their nominal cross-sectional area was approximately equal to theCFRP bars. It was, therefore, possible to position both the steel and CFRP bars identicallyin the control and in the test beams. Steel rebars of the identical area of the CFRP rodswere not available.
The top bars were of 8mm diameter high strength deformed steel for all beams. Bothtop and bottom steel bars were hooked at each end. The reinforcement cages (Figure 1)were tied with iron wire. Smooth 6mm diameter closed rectangular stirrups spacedat 100mm center to center were chosen to comply with the criteria of the ultimate strengthdesign of FRP reinforced beams given by the ACI code [5,6]. The results of tensile tests onthe top and stirrup bars are also included in Table 3.
Instrumentation
The instrumentation was set up to measure the deflection of the beam, and slip &deformation of the reinforcing bars. Strain gauges were used to measure deformation andto monitor bond of the CFRP bars. These gauges were mounted on one of the tension barsin both BRS and BRC types of beams. The gauges were provided by Vishay MeasurementGroup. Type CEA-06-240UZ-120 gauges were bonded using M-Bond AE-10 adhesive.The gauges were fully waterproofed before pouring the concrete in the forms. One gaugewas used at the midspan of the beam. Two more gauges were bonded at a distance of600mm on each side of the center of the beam. The positions of the strain gauges areshown in Figure 1.
The deflection at the midspan was measured using linear variable differentialtransducers (LVDTs). These LVDTs were placed on both sides of the longitudinalcenter of the beam. Horizontal LVDTs were used at the end of the BRC beams to measurethe slip of the CFRP bars. Computer aided data acquisition systems were used to recordcontinuously load, deflection, slip and strain. Thus this data could be obtained easilyat any time during each test.
Test Procedure
The specimen beams were placed on half-round supports, which were spaced ata distance equal to the test span of the beam. The loading was applied in small increments,through 38mm diameter rollers, by means of a 200 kN hydraulic jack. Steel plates 25mm
Table 3. Mechanical properties of reinforcing bars.
Bar type Diameter (mm) Ultimate strengtha (MPa) Ultimate straina Elastic modulus (GPa)
CFRP 9.5 1676 0.0145 135.9Steel 10 530 0.0048 201.0Steel 8 566 0.0049 194.0Steel 6 421 0.0041 200.0
a Parameters corresponding to 0.2% offset yield stress for steel bar.
2660 M. M. RAFI ET AL.
© 2007 SAGE Publications. All rights reserved. Not for commercial use or unauthorized distribution. by Asad-ur-Rehman Khan on March 13, 2008 http://jcm.sagepub.comDownloaded from
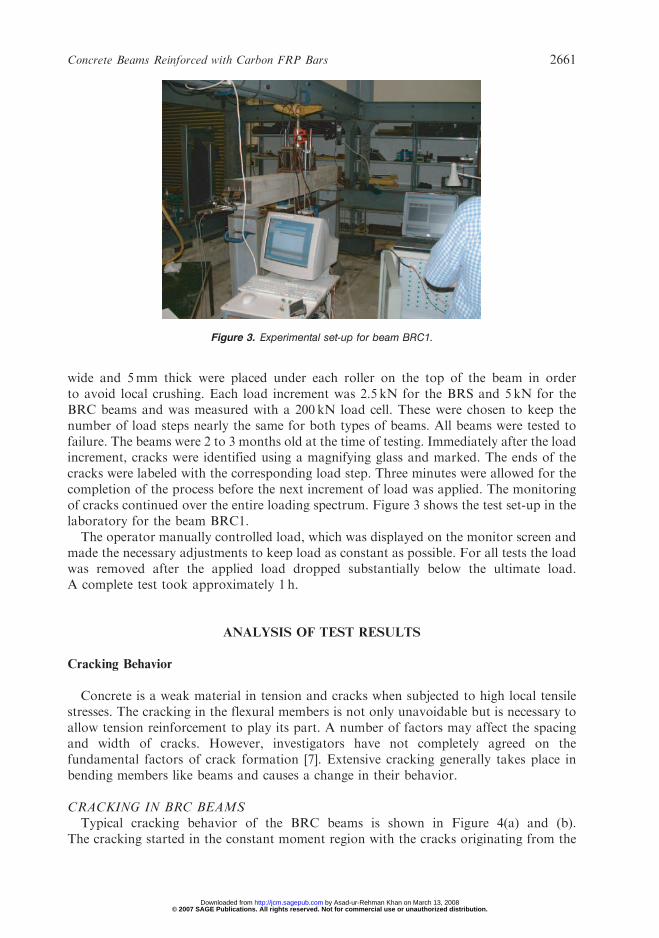
wide and 5mm thick were placed under each roller on the top of the beam in orderto avoid local crushing. Each load increment was 2.5 kN for the BRS and 5 kN for theBRC beams and was measured with a 200 kN load cell. These were chosen to keep thenumber of load steps nearly the same for both types of beams. All beams were tested tofailure. The beams were 2 to 3 months old at the time of testing. Immediately after the loadincrement, cracks were identified using a magnifying glass and marked. The ends of thecracks were labeled with the corresponding load step. Three minutes were allowed for thecompletion of the process before the next increment of load was applied. The monitoringof cracks continued over the entire loading spectrum. Figure 3 shows the test set-up in thelaboratory for the beam BRC1.
The operator manually controlled load, which was displayed on the monitor screen andmade the necessary adjustments to keep load as constant as possible. For all tests the loadwas removed after the applied load dropped substantially below the ultimate load.A complete test took approximately 1 h.
ANALYSIS OF TEST RESULTS
Cracking Behavior
Concrete is a weak material in tension and cracks when subjected to high local tensilestresses. The cracking in the flexural members is not only unavoidable but is necessary toallow tension reinforcement to play its part. A number of factors may affect the spacingand width of cracks. However, investigators have not completely agreed on thefundamental factors of crack formation [7]. Extensive cracking generally takes place inbending members like beams and causes a change in their behavior.
CRACKING IN BRC BEAMSTypical cracking behavior of the BRC beams is shown in Figure 4(a) and (b).
The cracking started in the constant moment region with the cracks originating from the
Figure 3. Experimental set-up for beam BRC1.
Concrete Beams Reinforced with Carbon FRP Bars 2661
© 2007 SAGE Publications. All rights reserved. Not for commercial use or unauthorized distribution. by Asad-ur-Rehman Khan on March 13, 2008 http://jcm.sagepub.comDownloaded from
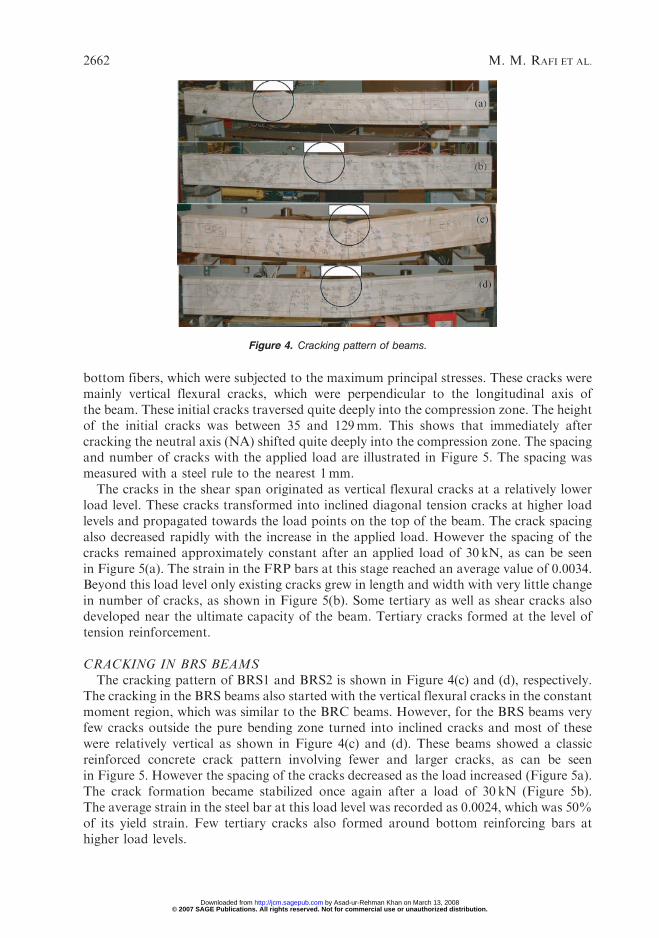
bottom fibers, which were subjected to the maximum principal stresses. These cracks weremainly vertical flexural cracks, which were perpendicular to the longitudinal axis ofthe beam. These initial cracks traversed quite deeply into the compression zone. The heightof the initial cracks was between 35 and 129mm. This shows that immediately aftercracking the neutral axis (NA) shifted quite deeply into the compression zone. The spacingand number of cracks with the applied load are illustrated in Figure 5. The spacing wasmeasured with a steel rule to the nearest 1mm.
The cracks in the shear span originated as vertical flexural cracks at a relatively lowerload level. These cracks transformed into inclined diagonal tension cracks at higher loadlevels and propagated towards the load points on the top of the beam. The crack spacingalso decreased rapidly with the increase in the applied load. However the spacing of thecracks remained approximately constant after an applied load of 30 kN, as can be seenin Figure 5(a). The strain in the FRP bars at this stage reached an average value of 0.0034.Beyond this load level only existing cracks grew in length and width with very little changein number of cracks, as shown in Figure 5(b). Some tertiary as well as shear cracks alsodeveloped near the ultimate capacity of the beam. Tertiary cracks formed at the level oftension reinforcement.
CRACKING IN BRS BEAMSThe cracking pattern of BRS1 and BRS2 is shown in Figure 4(c) and (d), respectively.
The cracking in the BRS beams also started with the vertical flexural cracks in the constantmoment region, which was similar to the BRC beams. However, for the BRS beams veryfew cracks outside the pure bending zone turned into inclined cracks and most of thesewere relatively vertical as shown in Figure 4(c) and (d). These beams showed a classicreinforced concrete crack pattern involving fewer and larger cracks, as can be seenin Figure 5. However the spacing of the cracks decreased as the load increased (Figure 5a).The crack formation became stabilized once again after a load of 30 kN (Figure 5b).The average strain in the steel bar at this load level was recorded as 0.0024, which was 50%of its yield strain. Few tertiary cracks also formed around bottom reinforcing bars athigher load levels.
Figure 4. Cracking pattern of beams.
2662 M. M. RAFI ET AL.
© 2007 SAGE Publications. All rights reserved. Not for commercial use or unauthorized distribution. by Asad-ur-Rehman Khan on March 13, 2008 http://jcm.sagepub.comDownloaded from
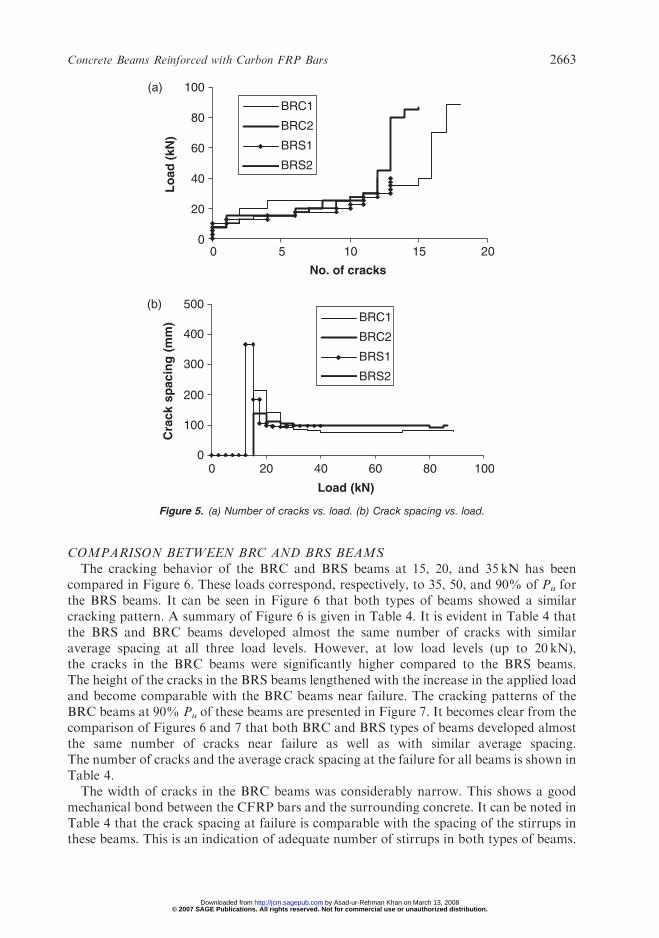
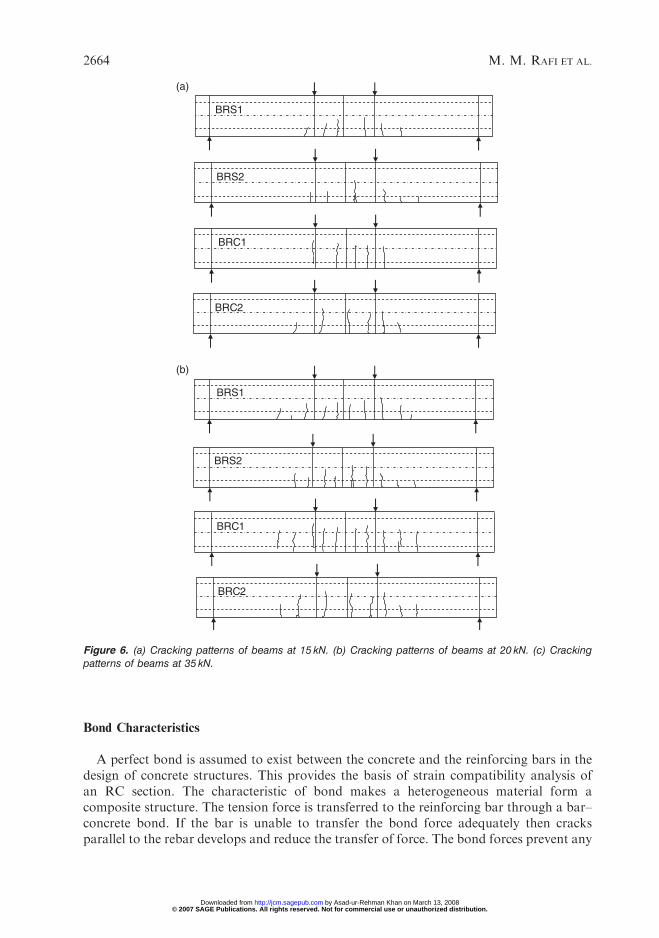
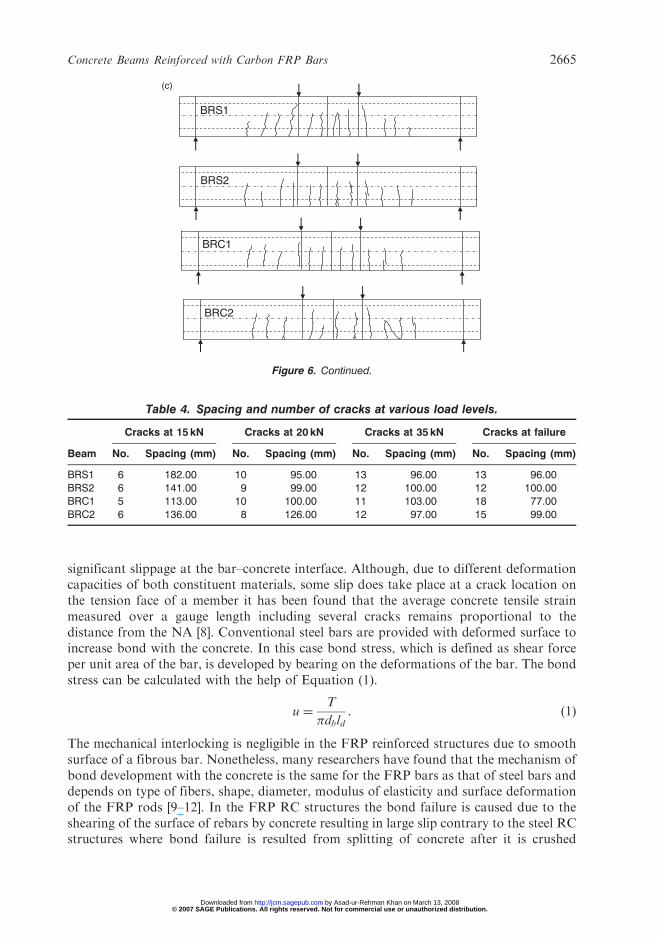
COMPARISON BETWEEN BRC AND BRS BEAMSThe cracking behavior of the BRC and BRS beams at 15, 20, and 35 kN has been
compared in Figure 6. These loads correspond, respectively, to 35, 50, and 90% of Pu forthe BRS beams. It can be seen in Figure 6 that both types of beams showed a similarcracking pattern. A summary of Figure 6 is given in Table 4. It is evident in Table 4 thatthe BRS and BRC beams developed almost the same number of cracks with similaraverage spacing at all three load levels. However, at low load levels (up to 20 kN),the cracks in the BRC beams were significantly higher compared to the BRS beams.The height of the cracks in the BRS beams lengthened with the increase in the applied loadand become comparable with the BRC beams near failure. The cracking patterns of theBRC beams at 90% Pu of these beams are presented in Figure 7. It becomes clear from thecomparison of Figures 6 and 7 that both BRC and BRS types of beams developed almostthe same number of cracks near failure as well as with similar average spacing.The number of cracks and the average crack spacing at the failure for all beams is shown inTable 4.
The width of cracks in the BRC beams was considerably narrow. This shows a goodmechanical bond between the CFRP bars and the surrounding concrete. It can be noted inTable 4 that the crack spacing at failure is comparable with the spacing of the stirrups inthese beams. This is an indication of adequate number of stirrups in both types of beams.
0
20
40
60
80
100(a)
0 5 10 15 20
No. of cracks
Lo
ad (
kN)
BRC1
BRC2
BRS1
BRS2
0
100
200
300
400
500(b)
0 20 40 60 80 100
Load (kN)
Cra
ck s
pac
ing
(m
m) BRC1
BRC2
BRS1
BRS2
Figure 5. (a) Number of cracks vs. load. (b) Crack spacing vs. load.
Concrete Beams Reinforced with Carbon FRP Bars 2663
© 2007 SAGE Publications. All rights reserved. Not for commercial use or unauthorized distribution. by Asad-ur-Rehman Khan on March 13, 2008 http://jcm.sagepub.comDownloaded from
Bond Characteristics
A perfect bond is assumed to exist between the concrete and the reinforcing bars in thedesign of concrete structures. This provides the basis of strain compatibility analysis ofan RC section. The characteristic of bond makes a heterogeneous material form acomposite structure. The tension force is transferred to the reinforcing bar through a bar–concrete bond. If the bar is unable to transfer the bond force adequately then cracksparallel to the rebar develops and reduce the transfer of force. The bond forces prevent any
BRS1
(a)
(b)
BRC1
BRC2
BRS2
BRS2
BRS1
BRC1
BRC2
Figure 6. (a) Cracking patterns of beams at 15 kN. (b) Cracking patterns of beams at 20 kN. (c) Crackingpatterns of beams at 35 kN.
2664 M. M. RAFI ET AL.
© 2007 SAGE Publications. All rights reserved. Not for commercial use or unauthorized distribution. by Asad-ur-Rehman Khan on March 13, 2008 http://jcm.sagepub.comDownloaded from
significant slippage at the bar–concrete interface. Although, due to different deformationcapacities of both constituent materials, some slip does take place at a crack location onthe tension face of a member it has been found that the average concrete tensile strainmeasured over a gauge length including several cracks remains proportional to thedistance from the NA [8]. Conventional steel bars are provided with deformed surface toincrease bond with the concrete. In this case bond stress, which is defined as shear forceper unit area of the bar, is developed by bearing on the deformations of the bar. The bondstress can be calculated with the help of Equation (1).
u ¼T
�dbld: ð1Þ
The mechanical interlocking is negligible in the FRP reinforced structures due to smoothsurface of a fibrous bar. Nonetheless, many researchers have found that the mechanism ofbond development with the concrete is the same for the FRP bars as that of steel bars anddepends on type of fibers, shape, diameter, modulus of elasticity and surface deformationof the FRP rods [9–12]. In the FRP RC structures the bond failure is caused due to theshearing of the surface of rebars by concrete resulting in large slip contrary to the steel RCstructures where bond failure is resulted from splitting of concrete after it is crushed
(c)
BRS2
BRS1
BRC1
BRC2
Figure 6. Continued.
Table 4. Spacing and number of cracks at various load levels.
Cracks at 15 kN Cracks at 20 kN Cracks at 35 kN Cracks at failure
Beam No. Spacing (mm) No. Spacing (mm) No. Spacing (mm) No. Spacing (mm)
BRS1 6 182.00 10 95.00 13 96.00 13 96.00BRS2 6 141.00 9 99.00 12 100.00 12 100.00BRC1 5 113.00 10 100.00 11 103.00 18 77.00BRC2 6 136.00 8 126.00 12 97.00 15 99.00
Concrete Beams Reinforced with Carbon FRP Bars 2665
© 2007 SAGE Publications. All rights reserved. Not for commercial use or unauthorized distribution. by Asad-ur-Rehman Khan on March 13, 2008 http://jcm.sagepub.comDownloaded from
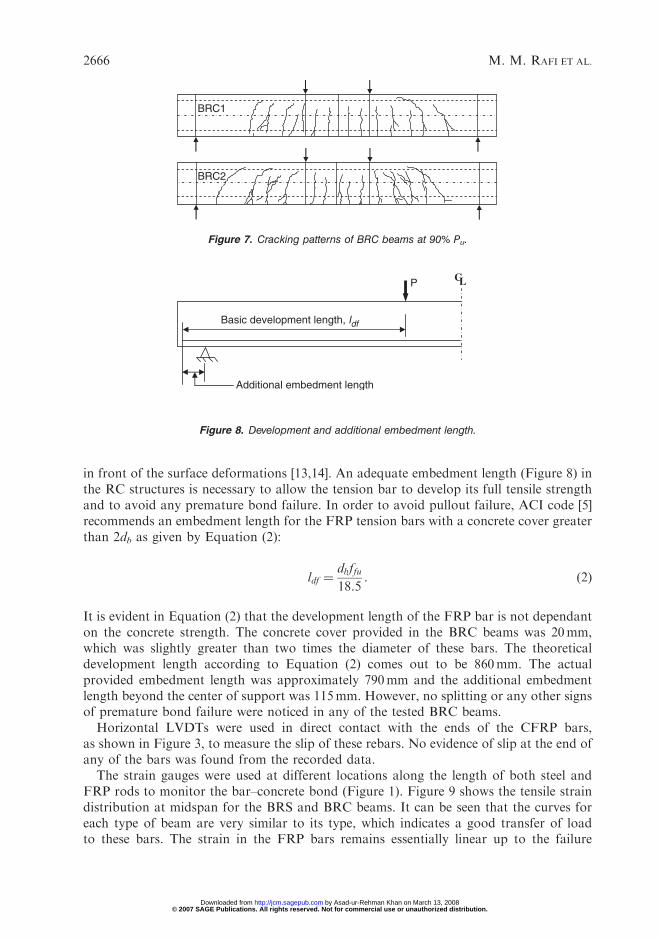
in front of the surface deformations [13,14]. An adequate embedment length (Figure 8) inthe RC structures is necessary to allow the tension bar to develop its full tensile strengthand to avoid any premature bond failure. In order to avoid pullout failure, ACI code [5]recommends an embedment length for the FRP tension bars with a concrete cover greaterthan 2db as given by Equation (2):
ldf ¼dbffu18:5
: ð2Þ
It is evident in Equation (2) that the development length of the FRP bar is not dependanton the concrete strength. The concrete cover provided in the BRC beams was 20mm,which was slightly greater than two times the diameter of these bars. The theoreticaldevelopment length according to Equation (2) comes out to be 860mm. The actualprovided embedment length was approximately 790mm and the additional embedmentlength beyond the center of support was 115mm. However, no splitting or any other signsof premature bond failure were noticed in any of the tested BRC beams.
Horizontal LVDTs were used in direct contact with the ends of the CFRP bars,as shown in Figure 3, to measure the slip of these rebars. No evidence of slip at the end ofany of the bars was found from the recorded data.
The strain gauges were used at different locations along the length of both steel andFRP rods to monitor the bar–concrete bond (Figure 1). Figure 9 shows the tensile straindistribution at midspan for the BRS and BRC beams. It can be seen that the curves foreach type of beam are very similar to its type, which indicates a good transfer of loadto these bars. The strain in the FRP bars remains essentially linear up to the failure
C LP
Basic development length, ldf
Additional embedment length
Figure 8. Development and additional embedment length.
BRC1
BRC2
Figure 7. Cracking patterns of BRC beams at 90% Pu.
2666 M. M. RAFI ET AL.
© 2007 SAGE Publications. All rights reserved. Not for commercial use or unauthorized distribution. by Asad-ur-Rehman Khan on March 13, 2008 http://jcm.sagepub.comDownloaded from
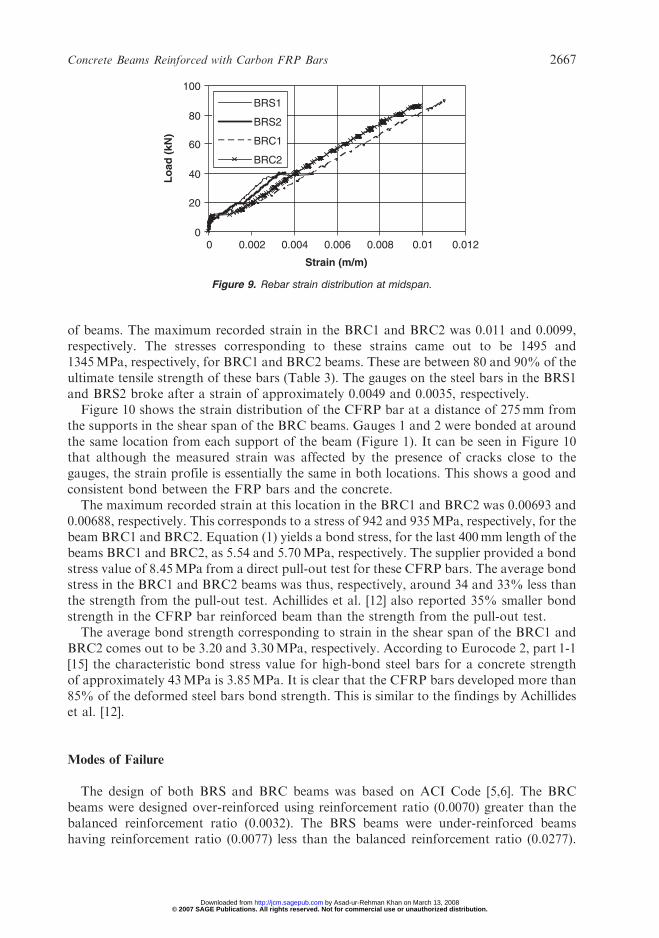
of beams. The maximum recorded strain in the BRC1 and BRC2 was 0.011 and 0.0099,respectively. The stresses corresponding to these strains came out to be 1495 and1345MPa, respectively, for BRC1 and BRC2 beams. These are between 80 and 90% of theultimate tensile strength of these bars (Table 3). The gauges on the steel bars in the BRS1and BRS2 broke after a strain of approximately 0.0049 and 0.0035, respectively.
Figure 10 shows the strain distribution of the CFRP bar at a distance of 275mm fromthe supports in the shear span of the BRC beams. Gauges 1 and 2 were bonded at aroundthe same location from each support of the beam (Figure 1). It can be seen in Figure 10that although the measured strain was affected by the presence of cracks close to thegauges, the strain profile is essentially the same in both locations. This shows a good andconsistent bond between the FRP bars and the concrete.
The maximum recorded strain at this location in the BRC1 and BRC2 was 0.00693 and0.00688, respectively. This corresponds to a stress of 942 and 935MPa, respectively, for thebeam BRC1 and BRC2. Equation (1) yields a bond stress, for the last 400mm length of thebeams BRC1 and BRC2, as 5.54 and 5.70MPa, respectively. The supplier provided a bondstress value of 8.45MPa from a direct pull-out test for these CFRP bars. The average bondstress in the BRC1 and BRC2 beams was thus, respectively, around 34 and 33% less thanthe strength from the pull-out test. Achillides et al. [12] also reported 35% smaller bondstrength in the CFRP bar reinforced beam than the strength from the pull-out test.
The average bond strength corresponding to strain in the shear span of the BRC1 andBRC2 comes out to be 3.20 and 3.30MPa, respectively. According to Eurocode 2, part 1-1[15] the characteristic bond stress value for high-bond steel bars for a concrete strengthof approximately 43MPa is 3.85MPa. It is clear that the CFRP bars developed more than85% of the deformed steel bars bond strength. This is similar to the findings by Achillideset al. [12].
Modes of Failure
The design of both BRS and BRC beams was based on ACI Code [5,6]. The BRCbeams were designed over-reinforced using reinforcement ratio (0.0070) greater than thebalanced reinforcement ratio (0.0032). The BRS beams were under-reinforced beamshaving reinforcement ratio (0.0077) less than the balanced reinforcement ratio (0.0277).
0
20
40
60
80
100
0 0.002 0.004 0.006 0.008 0.01 0.012
Strain (m/m)
Lo
ad (
kN)
BRS1
BRS2
BRC1
BRC2
Figure 9. Rebar strain distribution at midspan.
Concrete Beams Reinforced with Carbon FRP Bars 2667
© 2007 SAGE Publications. All rights reserved. Not for commercial use or unauthorized distribution. by Asad-ur-Rehman Khan on March 13, 2008 http://jcm.sagepub.comDownloaded from
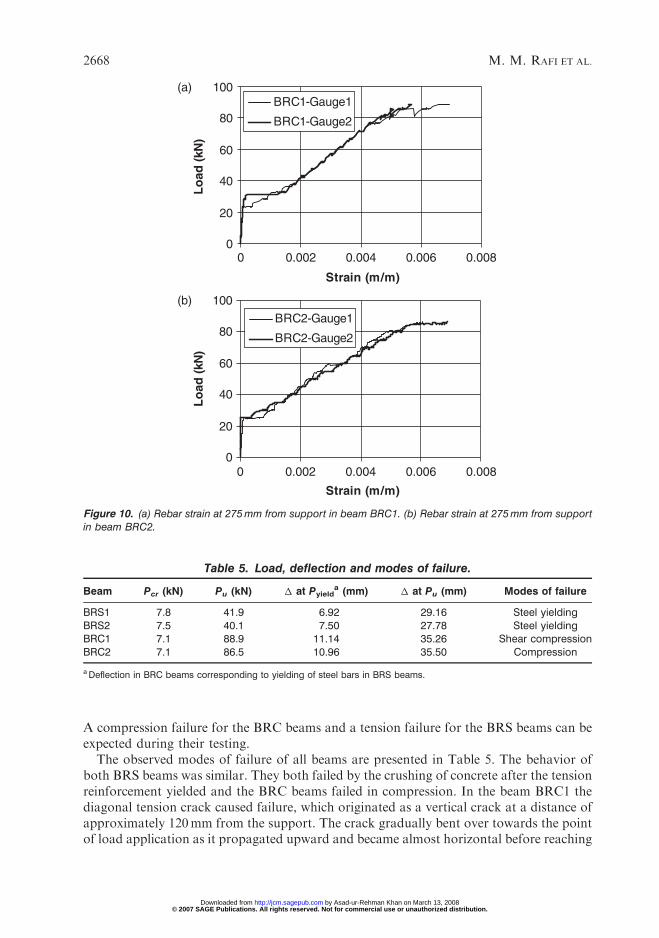
A compression failure for the BRC beams and a tension failure for the BRS beams can beexpected during their testing.
The observed modes of failure of all beams are presented in Table 5. The behavior ofboth BRS beams was similar. They both failed by the crushing of concrete after the tensionreinforcement yielded and the BRC beams failed in compression. In the beam BRC1 thediagonal tension crack caused failure, which originated as a vertical crack at a distance ofapproximately 120mm from the support. The crack gradually bent over towards the pointof load application as it propagated upward and became almost horizontal before reaching
0
20
40
60
80
100(a)
(b)
0 0.002 0.004 0.006 0.008
Strain (m/m)
Lo
ad (k
N)
BRC1-Gauge1
BRC1-Gauge2
0
20
40
60
80
100
0 0.002 0.004 0.006 0.008
Strain (m/m)
Lo
ad (
kN)
BRC2-Gauge1
BRC2-Gauge2
Figure 10. (a) Rebar strain at 275mm from support in beam BRC1. (b) Rebar strain at 275mm from supportin beam BRC2.
Table 5. Load, deflection and modes of failure.
Beam Pcr (kN) Pu (kN) � at Pyielda (mm) � at Pu (mm) Modes of failure
BRS1 7.8 41.9 6.92 29.16 Steel yieldingBRS2 7.5 40.1 7.50 27.78 Steel yieldingBRC1 7.1 88.9 11.14 35.26 Shear compressionBRC2 7.1 86.5 10.96 35.50 Compression
aDeflection in BRC beams corresponding to yielding of steel bars in BRS beams.
2668 M. M. RAFI ET AL.
© 2007 SAGE Publications. All rights reserved. Not for commercial use or unauthorized distribution. by Asad-ur-Rehman Khan on March 13, 2008 http://jcm.sagepub.comDownloaded from
the load point. However the beam kept taking load as this diagonal tension crackpropagated and opened up. Finally the concrete above this crack crushed adjacent to theload point in the shear span as shown in Figure 4(a). The BRC2 beam failed by thecrushing of concrete between the point loads (Figure 4b).
Table 5 shows cracking loads (Pcr) of the beams where it can be seen that the crackingloads for all four beams are very close to each other, as can be expected. The ultimate loadcarried by the beam is also shown in Table 5 where it can be noted that the BRC beamscarried more than twice the load on the BRS beams. This was due to strength of a CFRPbar, which was much higher than the yield strength of a steel bar (Table 2). The failuremodes of the BRS beams are also shown in Figure 4.
Deflection Behavior
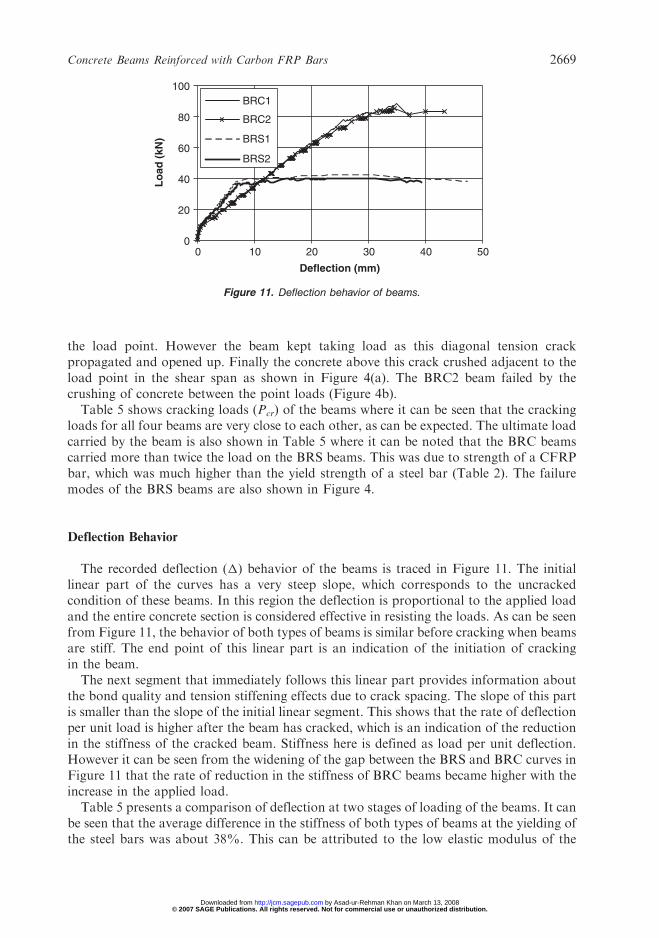
The recorded deflection (�) behavior of the beams is traced in Figure 11. The initiallinear part of the curves has a very steep slope, which corresponds to the uncrackedcondition of these beams. In this region the deflection is proportional to the applied loadand the entire concrete section is considered effective in resisting the loads. As can be seenfrom Figure 11, the behavior of both types of beams is similar before cracking when beamsare stiff. The end point of this linear part is an indication of the initiation of crackingin the beam.
The next segment that immediately follows this linear part provides information aboutthe bond quality and tension stiffening effects due to crack spacing. The slope of this partis smaller than the slope of the initial linear segment. This shows that the rate of deflectionper unit load is higher after the beam has cracked, which is an indication of the reductionin the stiffness of the cracked beam. Stiffness here is defined as load per unit deflection.However it can be seen from the widening of the gap between the BRS and BRC curves inFigure 11 that the rate of reduction in the stiffness of BRC beams became higher with theincrease in the applied load.
Table 5 presents a comparison of deflection at two stages of loading of the beams. It canbe seen that the average difference in the stiffness of both types of beams at the yielding ofthe steel bars was about 38%. This can be attributed to the low elastic modulus of the
0
20
40
60
80
100
0 10 20 30 40 50
Deflection (mm)
Lo
ad (
kN)
BRC1
BRC2
BRS1
BRS2
Figure 11. Deflection behavior of beams.
Concrete Beams Reinforced with Carbon FRP Bars 2669
© 2007 SAGE Publications. All rights reserved. Not for commercial use or unauthorized distribution. by Asad-ur-Rehman Khan on March 13, 2008 http://jcm.sagepub.comDownloaded from
CFRP bars, which is 32% less than a steel bar. The reduced stiffness of the FRPreinforced beams after cracking has also been reported by various other researchers[16–22].
The last part of the curve is an indication of possible failure mechanism of the structure.As shown in Figure 11, both BRS beams showed a very ductile behavior and both beamsfailed at nearly the same load after undergoing considerable deformation with very smallincrease in the load once steel yielded. The ultimate load of the BRS beams was around53% lower than the BRC beams while deflection of the BRC beams at ultimate state was25% greater than the BRS beams on average, as can be seen in Table 5.
The service load of the beam can be assumed as the ultimate load divided by 1.6, whichis the factor for the live load suggested by ACI code [6]. In order to calculate the servicedeflection of a flexural member, ACI code presents the concept of effective momentof inertia (Ie). The method of calculating Ie for the steel reinforced beams given byACI code [5] is based on the expression proposed by Branson [23]. This is given byEquation (3).
Ie ¼ IgMcr
M
� �3
þ 1�Mcr
M
� �3" #
Icr � Ig ð3Þ
where Mcr can be calculated with the help of Equation (4) as:
Mcr ¼frIgyb
: ð4Þ
The values of Mcr for the beams are shown in Table 6.For the FRP RC members, ACI code [6] recommends a modified form of Equation (3)
and Ie can be calculated as:
Ie ¼ �IgMcr
M
� �3
þ 1�Mcr
M
� �3" #
Icr � Ig ð5aÞ
� ¼ � 1þEf
Es
� �ð5bÞ
where � is bond-dependant coefficient and is taken as 0.5
Table 6. Experimental and theoretical deflection.
Deflection (mm)
Beam Mcr (kN-m) Experimental Theoretical
BRS1 3.38 3.80 3.55BRS2 3.31 3.88 3.39BRC1 3.24 16.26 13.13BRC2 3.20 15.56 12.77
2670 M. M. RAFI ET AL.
© 2007 SAGE Publications. All rights reserved. Not for commercial use or unauthorized distribution. by Asad-ur-Rehman Khan on March 13, 2008 http://jcm.sagepub.comDownloaded from
For a beam subjected to a four-point load (Figure 1), the deflection can be calculated bythe elastic deflection formula given in Equation (6).
� ¼PL3
6EcIe�
3a
4L�
a
L
� �3� �: ð6Þ
Table 6 presents both the experimental and theoretical service deflection according toEquations (3) and (5) for the BRS and BRC beams. Ec in Equation (6) was calculatedusing ACI code [5] formula given by Equation (7).
Ec ¼ 4730ffiffiffiffifc
p: ð7Þ
It can be seen in Table 6 that Equation (3) predicted the deflection reasonably well for theBRS beams. However, Equation (5) underestimated the service deflection of the BRCbeams by about 18%.
CONCLUSIONS
The results of four-point bending tests, which were conducted on beams reinforced withthe CFRP and steel bars are presented in this paper. The main findings of the investigationon the behavior of these beams are as follows:
1. The BRC and BRS beams developed nearly equal numbers of cracks with an equalaverage crack spacing at all stages of loading, up to the failure. The cracks in both typesof beams stabilized after an applied load of 30 kN. The crack spacing at failure in bothtypes of beams was similar to the spacing of the stirrups.
2. The CFRP bars showed good and consistent bond with the concrete and no signs ofany premature bond failure were found. No evidence of any slip of the CFRP bars wasnoticed during the test. The maximum tensile stresses on the CFRP bars were 80–90%of their ultimate strength. The CFRP bars developed a bond strength, which was morethan 85% of that of a deformed steel bar.
3. The BRS beams failed by the steel yielding and the BRC beams failed by the concretecrushing. These were the intended modes of failure in their design.
4. The cracking load for both types of beams was nearly the same despite two differingreinforcing material types.
5. The BRC beams deflected more than the BRS beams after cracking. However, afteryielding of steel the rate of deflection in the BRS beams was more than the BRC beams.The ACI code equation under-estimated theoretical deflection of the BRC beams.
NOMENCLATURE
db ¼ diameter of barEc ¼modulus of elasticity of concreteEf ¼modulus of elasticity of FRP barEs ¼modulus of elasticity of steel bar
Concrete Beams Reinforced with Carbon FRP Bars 2671
© 2007 SAGE Publications. All rights reserved. Not for commercial use or unauthorized distribution. by Asad-ur-Rehman Khan on March 13, 2008 http://jcm.sagepub.comDownloaded from
fc ¼ concrete compressive strengthffu ¼ultimate tensile strength of FRP bar, MPafr ¼modulus of rupture, MPaIg ¼ gross moment of inertia about centroidal axis of concrete section
without reinforcementIcr ¼ crack moment of inertia of a sectionld ¼ embedment lengthldf ¼development length, mmM ¼ applied moment
Mcr ¼ cracking momentPu ¼ultimate loadT ¼ tension forceu ¼bond stressyb ¼distance from centroidal axis of concrete section to the extreme
tension fibers, neglecting reinforcement
ACKNOWLEDGMENTS
The authors wish to acknowledge the support provided for this research by the Schoolof Built Environment, University of Ulster; Dr Alan Leacock, Lecturer, School ofElectrical and Mechanical Engineering for tensile testing of steel bars and all thelaboratory technical staff members.
REFERENCES
1. Mota, C., Alminar, S. and Svecova, D. (2006). Critical Review of Deflection Formulas forFRP-RC Members, Journal of Composites for Construction, 10(3): 183–194.
2. Al-Sunna, R.A.S. (2006). Deflection Behaviour of FRP Reinforced Concrete Flexural Members,PhD Thesis, University of Sheffield, http://www.rss.gov.jo/publication.html.
3. Abdalla, H.A. (2002). Evaluation of Deflection in Concrete Members Reinforced with FibreReinforced Polymer (FRP) Bars, Composite Structure, 56: 63–71.
4. Neville, M.A. (1981). Properties of Concrete: Testing of Hardened Concrete, Longman Scientific& Technical, England.
5. American Concrete Institute (2003). Guide for the Design and Construction of ConcreteReinforced with FRP Bars, ACI 440.1R-03. Detroit, Michigan.
6. American Concrete Institute (2002). Building Code Requirements for Structural Concrete,ACI 318R-02. Detroit, Michigan.
7. Broms, B. and Raab, A. (1961). The Fundamental Concept of the Cracking Phenomenon inReinforced Concrete Beams, Final Progress Report – Phase I. Cornell University.
8. Park, R. and Pauly, T. (1975). Reinforced Concrete Structures: Basic Assumption of Theory forFlexural Strength, John Wiley & Sons, Inc., USA.
9. Al-Zahrani, M.M., Nanni, A., Al-Dulaijan, S.U. and Bakis, C.E. (1996). Bond of FRPto Concrete for Rods with Axisymmetric Deformations, In: Proceedings of the SecondInternational Conference on Advanced Composite Materials in Bridges and Structures (ACMBS-II), Montreal, Canada, pp. 853–860.
10. Uppuluri, V.S., Bakis, C.E., Nanni, A. and Boothby, T.E. (1996). Analysis of theBond Mechanism in FRP Reinforcement Rods: The Effect of Rod Design and Properties,
2672 M. M. RAFI ET AL.
© 2007 SAGE Publications. All rights reserved. Not for commercial use or unauthorized distribution. by Asad-ur-Rehman Khan on March 13, 2008 http://jcm.sagepub.comDownloaded from
In: Proceedings of the Second International Conference on Advanced Composite Materials inBridges and Structures (ACMBS-II), Montreal, Canada, pp. 893–900.
11. Wang, Z., Goto, Y. and Joh, O. (1997). Bond Characteristic of FRP Rods and Effect on LongTerm Deflection of Concrete Beams, In: Proceeding of the Third International Symposiumon Non-Metallic (FRP) Reinforcement for Concrete Structures, Sapporo, Japan, Volume 2,pp. 389–396.
12. Achillides, Z., Pilakoutas, K. and Waldron, P. (1997). Bond Behaviour of FRP Barsto Concrete, In: Proceeding of the Third International Symposium on Non-Metallic (FRP)Reinforcement for Concrete Structures, Sapporo, Japan, Volume 2, pp. 341–348.
13. Daniali, S. (1990). Bond Strength of Fiber Reinforced Plastic Bars in Concrete, In: Proceeding ofthe 1st Material Engineering Congress, ASCE, Denver, Colorado, pp. 1182–1191.
14. Benmokrane, B., Tighiouart, B. and Chaallal, O. (1996). Bond Strength and Load Distributionof Composite GFRP Reinforcing Bars in Concrete, ACI Material Journal, 93(3): 246–253.
15. Eurocode 2 (1992). Design of Concrete Structures, Part1-1: General Rules and Rules forBuildings, Brussels.
16. Benmokrane, B., Chaallal, O. and Masmoudi, R. (1996). Flexural Response of Concrete BeamsReinforced with FRP Reinforcing Bars, ACI Structural Journal, 93(1): 46–55.
17. Nanni, A. (1993). Flexural Behaviour and Design of RC Members Using FRP Reinforcement,ASCE Journal of Structural Engineering, 119(11): 3345–3359.
18. Faza, S.S. and GangaRao, H.V.S. (1992). Pre- and Post-cracking Deflection Behaviour ofConcrete Beams Reinforced with Fibre-reinforced Plastic Rebars, In: Proceedings of 1stInternational Conference on Advanced Composite Materials in Bridges and Structures(ACMBS 1), CSCE. Sherbrooke, Quebec, pp. 151–160.
19. Saadatmanesh, H. and Ehsani, M.R. (1991). Fiber Composite Bar for Reinforced ConcreteConstruction, Journal of Composite Material, 25: 188–203.
20. Nawy, E.G. and Neuwerth, G.E. (1977). Fiberglass Reinforced Concrete Slabs and Beams,Journal of Structural Division, 103(ST2): 421–440.
21. Theriault, M. and Benmokrane, B. (1998). Effects of FRP Reinforcement Ratio and ConcreteStrength on Flexural Behavior of Concrete Beams, Journal of Composite Construction, 2(1):7–16.
22. Toutanji, H. and Deng, Y. (2003). Deflection and Crack-width Prediction of Concrete BeamsReinforced with Glass FRP Rods, Construction and Building Material, 17: 69–74.
23. Branson, D.E. (1977). Deformation of Concrete Structures, McGraw-Hill Book Co., NewYork.
Concrete Beams Reinforced with Carbon FRP Bars 2673
© 2007 SAGE Publications. All rights reserved. Not for commercial use or unauthorized distribution. by Asad-ur-Rehman Khan on March 13, 2008 http://jcm.sagepub.comDownloaded from