Behavior of full-scale RC T-beams strengthened in shear with externally bonded FRP sheets
14
Behavior of full-scale RC T-beams strengthened in shear with externally bonded FRP sheets Abdeldjelil Belarbi a,⇑ , Sang-Wook Bae b , Antonio Brancaccio c a Department of Civil and Environmental Engineering, University of Houston, Houston, TX 77204-4003, United States b Department of Civil and Environmental Engineering, Texas Tech University, Lubbock, TX 79424, United States c Department of Civil, Architectural, and Environmental Engineering, Missouri University of Science and Technology, Rolla, MO 65409, United States article info Article history: Available online 5 February 2011 Keywords: Fiber-reinforced polymers Reinforced concrete beam Shear strengthening abstract Recently many research studies have investigated the shear behavior of reinforced concrete (RC) beams strengthened with fiber-reinforced polymer (FRP) composites. However, most were conducted on small- scale specimens. Thus, analytical models and design equations developed from those studies may not predict the actual behavior of large-scale RC beams strengthened with FRPs. In this study, an experimen- tal study was performed on this topic using full-scale RC T-beams in order to understand the behavior of full-scale bridge beams strengthened in shear with FRP. The main parameters investigated in this study were the transverse steel reinforcement ratio and the effect of mechanical anchorage systems. Ó 2010 Elsevier Ltd. All rights reserved. 1. Introduction A significant portion of the infrastructure in the United States is in urgent need of strengthening and rehabilitation [1]. Structural deficiencies in reinforced concrete (RC) members can be either flexural or shear; however, shear deficiencies are inherently more dangerous because shear failures can occur suddenly and with no possibility for redistribution of internal forces. Public funds for infrastructure rebuilding are extremely limited. Therefore, engi- neers have been looking for innovative solutions that reduce the costs associated with traditional methods. Fiber-reinforced poly- mer (FRP) materials offer one such solution. The use of these materials has several advantages over tradi- tional rehabilitation techniques. They are relatively easy to apply. They are flexible and can thus be molded to fit any geometry. They exhibit a high strength-to-weight ratio and are corrosion resistant. Externally bonded FRP composites are among the materials rapidly gaining popularity as a means to rehabilitate and retrofit existing concrete structures. Over the last two decades, a number of research studies exam- ined the behavior of RC beams strengthened in shear with exter- nally bonded FRP sheets. A database of experimental works first presented by Triantafillou and Antonopoulos [2] was updated later by Bousselham and Chaallal [3] to include studies carried out up to 2002. They presented the results of 160 tests. This study expanded this database to include all test results up to 2009. Specifically, 375 experimental results from 50 existing experimental studies avail- able in literature have been reviewed and organized to form a data- base. Table 1 summarizes the test parameters used in existing experimental studies. The analysis of the experimental database showed that about 97% of the previous studies used scaled beams with a depth of less than 20 in. (508 mm). In addition, as Table 1 indicates, most of the previous experimental studies have focused on rectangular beams, although most RC bridge girders have a T- shaped section. The shape of the cross section is related also to the strengthening scheme. For example, a common way to strengthen rectangular beams is by fully wrapping the member. In the case of T-beams, however, this solution is impractical due to the presence of the flange. More focus should be placed, there- fore, on T-beams with U-wrap and side-bonding configurations as well as the use of mechanical anchorage systems to address the issue of debonding. In addition, few tests have been conducted on members with a span comparable to that of real bridge girders, and only one study has investigated the influence of scale effect on the shear behavior of members strengthened with FRPs. The effects of pre-existing cracks were not widely investigated while the pri- mary use of FRP is to strengthen damaged structures. Analytical models [4–12] and design equations, either in the form of code/specifications or guidelines [13–15] have been devel- oped and are currently available around the world. These design equations, however, do not consider all the parameters affecting the shear behavior of RC beams strengthened with FRPs; therefore, their results are sometimes controversial [2]. This could be due to the fact that previous experimental studies used small-scale speci- mens, and thus, analytical models and design equations developed from those studies may not predict the actual behavior of full-scale 0950-0618/$ - see front matter Ó 2010 Elsevier Ltd. All rights reserved. doi:10.1016/j.conbuildmat.2010.11.102 ⇑ Corresponding author. Tel.: +1 713 743 1609; fax: +1 713 743 0305. E-mail addresses: [email protected] (A. Belarbi), [email protected] (S.-W. Bae). Construction and Building Materials 32 (2012) 27–40 Contents lists available at ScienceDirect Construction and Building Materials journal homepage: www.elsevier.com/locate/conbuildmat
Transcript of Behavior of full-scale RC T-beams strengthened in shear with externally bonded FRP sheets

Construction and Building Materials 32 (2012) 27–40
Contents lists available at ScienceDirect
Construction and Building Materials
journal homepage: www.elsevier .com/locate /conbui ldmat
Behavior of full-scale RC T-beams strengthened in shear with externally bondedFRP sheets
Abdeldjelil Belarbi a,⇑, Sang-Wook Bae b, Antonio Brancaccio c
a Department of Civil and Environmental Engineering, University of Houston, Houston, TX 77204-4003, United Statesb Department of Civil and Environmental Engineering, Texas Tech University, Lubbock, TX 79424, United Statesc Department of Civil, Architectural, and Environmental Engineering, Missouri University of Science and Technology, Rolla, MO 65409, United States
a r t i c l e i n f o a b s t r a c t
Article history:Available online 5 February 2011
Keywords:Fiber-reinforced polymersReinforced concrete beamShear strengthening
0950-0618/$ - see front matter � 2010 Elsevier Ltd. Adoi:10.1016/j.conbuildmat.2010.11.102
⇑ Corresponding author. Tel.: +1 713 743 1609; faxE-mail addresses: [email protected] (A. Belarbi), s
Bae).
Recently many research studies have investigated the shear behavior of reinforced concrete (RC) beamsstrengthened with fiber-reinforced polymer (FRP) composites. However, most were conducted on small-scale specimens. Thus, analytical models and design equations developed from those studies may notpredict the actual behavior of large-scale RC beams strengthened with FRPs. In this study, an experimen-tal study was performed on this topic using full-scale RC T-beams in order to understand the behavior offull-scale bridge beams strengthened in shear with FRP. The main parameters investigated in this studywere the transverse steel reinforcement ratio and the effect of mechanical anchorage systems.
� 2010 Elsevier Ltd. All rights reserved.
1. Introduction
A significant portion of the infrastructure in the United States isin urgent need of strengthening and rehabilitation [1]. Structuraldeficiencies in reinforced concrete (RC) members can be eitherflexural or shear; however, shear deficiencies are inherently moredangerous because shear failures can occur suddenly and with nopossibility for redistribution of internal forces. Public funds forinfrastructure rebuilding are extremely limited. Therefore, engi-neers have been looking for innovative solutions that reduce thecosts associated with traditional methods. Fiber-reinforced poly-mer (FRP) materials offer one such solution.
The use of these materials has several advantages over tradi-tional rehabilitation techniques. They are relatively easy to apply.They are flexible and can thus be molded to fit any geometry. Theyexhibit a high strength-to-weight ratio and are corrosion resistant.Externally bonded FRP composites are among the materials rapidlygaining popularity as a means to rehabilitate and retrofit existingconcrete structures.
Over the last two decades, a number of research studies exam-ined the behavior of RC beams strengthened in shear with exter-nally bonded FRP sheets. A database of experimental works firstpresented by Triantafillou and Antonopoulos [2] was updated laterby Bousselham and Chaallal [3] to include studies carried out up to2002. They presented the results of 160 tests. This study expandedthis database to include all test results up to 2009. Specifically, 375
ll rights reserved.
: +1 713 743 [email protected] (S.-W.
experimental results from 50 existing experimental studies avail-able in literature have been reviewed and organized to form a data-base. Table 1 summarizes the test parameters used in existingexperimental studies. The analysis of the experimental databaseshowed that about 97% of the previous studies used scaled beamswith a depth of less than 20 in. (508 mm). In addition, as Table 1indicates, most of the previous experimental studies have focusedon rectangular beams, although most RC bridge girders have a T-shaped section. The shape of the cross section is related also tothe strengthening scheme. For example, a common way tostrengthen rectangular beams is by fully wrapping the member.In the case of T-beams, however, this solution is impractical dueto the presence of the flange. More focus should be placed, there-fore, on T-beams with U-wrap and side-bonding configurationsas well as the use of mechanical anchorage systems to addressthe issue of debonding. In addition, few tests have been conductedon members with a span comparable to that of real bridge girders,and only one study has investigated the influence of scale effect onthe shear behavior of members strengthened with FRPs. The effectsof pre-existing cracks were not widely investigated while the pri-mary use of FRP is to strengthen damaged structures.
Analytical models [4–12] and design equations, either in theform of code/specifications or guidelines [13–15] have been devel-oped and are currently available around the world. These designequations, however, do not consider all the parameters affectingthe shear behavior of RC beams strengthened with FRPs; therefore,their results are sometimes controversial [2]. This could be due tothe fact that previous experimental studies used small-scale speci-mens, and thus, analytical models and design equations developedfrom those studies may not predict the actual behavior of full-scale

Table 1Test parameters of the experimental studies in the available literature.
Author Year
Num
ber
of T
ests
Properties and Parameters
Geometry Type of Beam
Concrete Type of
Strengthening Schemeand Steel FRPR
ecta
ngul
ar S
ectio
n
T-S
ectio
nB
eam
Spa
nnin
g L
< 7
ft
Bea
m S
pann
ing
7 ft
<L
<13
ft
Bea
m S
pann
ing
L>
13 f
tR
egul
ar B
eam
s (a
/d>
2.5)
Dee
p B
eam
s
Scal
e E
ffec
t
Prec
rack
ing
Con
cret
e St
reng
th
Lon
gitu
dina
l R
einf
orce
men
tT
rans
vers
e R
einf
orce
men
t
Car
bon
Ara
mid
Gla
ss
Tw
o-Si
de B
ondi
ng
U-W
rap
Com
plet
e W
rap
Con
tinuo
us
Stri
psA
ngle
to L
ong.
A
xis=
90 º
Ang
le to
Lon
g.
Axi
s≠ 9
0º
Berset 1992 2
Uji 1992 4
Al-Sulaimani et
al.1994 4
Ohuchi et al. 1994 13
Chajes et al. 1995 5
Sato et al. 1996 3
Araki et al. 1997 8
Funakawa et al.
1997 3
Kamiharako et al.
1997 1
Miyauchi et al.
1997 4
Sato et al. 1997 2Taerwe et
al. 1997 3
Taljsten 1997 3
Umezu et al. 1997 15Chaallal et
al. 1998 2
Mitsui et al. 1998 6
Triantafillou 1998 9Khalifa et
al. 1999 6
Kachlakev and Barnes
1999 3
Khalifa et al. 2000 4
Deniaud and Cheng
2001 5
Li et al. 2001a 5
Li et al. 2001b 9
Park et al. 2001 2Chaallal et
al. 2002 10
Khalifa and Nanni
2002 4
Li et al. 2002 9
Micelli et al. 2002 10
Pellegrino and Modena
2002 9
Beber 2003 28Diagana et
al. 2003 8
Hsu et al. 2003 3
28 A. Belarbi et al. / Construction and Building Materials 32 (2012) 27–40

Table 1 (continued)
Author Year
Num
ber
of T
ests
Properties and Parameters
Geometry Type of Beam
Concrete Type of
Strengthening Schemeand Steel FRP
Rec
tang
ular
Sec
tion
T-S
ectio
nB
eam
Spa
nnin
g L
< 7
ft
Bea
m S
pann
ing
7 ft
<L
<13
ft
Bea
m S
pann
ing
L>
13 f
tR
egul
ar B
eam
s (a
/d>
2.5)
Dee
p B
eam
s
Scal
e E
ffec
t
Prec
rack
ing
Con
cret
e St
reng
thL
ongi
tudi
nal
Rei
nfor
cem
ent
Tra
nsve
rse
Rei
nfor
cem
ent
Car
bon
Ara
mid
Gla
ss
Tw
o-Si
de B
ondi
ng
U-W
rap
Com
plet
e W
rap
Con
tinuo
us
Stri
psA
ngle
to L
ong.
Taljsten 2003 6
Adhikary et al.
2004 8
Xue Song et al.
2004 12
Cao et al. 2005 10
Carolin and Taljsten
2005a 18
Miyajima et al.
2005 4
Monti and Liotta
2005 16
Sim et al. 2005 9
Zhang and Hsu
2005 10
Barros and Dias
2006 5
Bousselham and Chaallal
2006a 20
Pellegrino and Modena
2006 8
Lees and Kesse
2007 8
Leung et al. 2007 12
Alrousan et al.
2009 4
Arteaga et al. 2009 15
Gamino et al. 2009 7
Rizzo and De Lorenzis
2009 1
Axi
s=90
ºA
ngle
to L
ong.
A
xis≠
90º
Note: (1) Shaded cells denote considered parameters. (2) Control specimens without FRP strengthening are not included in the table.
A. Belarbi et al. / Construction and Building Materials 32 (2012) 27–40 29
RC beams strengthened with FRPs. This study was conductedmainly to validate and expand on the findings of previous experi-mental and analytical studies and to enrich the experimental data-base with results from experiments on full-scale bridge RC T-beams.
2. Experimental program
The RC beams used in this study were designed to mimic the geometry of beamsused in a bridge located in Troy, New York. This bridge is a 42 ft. (12.8 m) long,120 ft. (36.6 m) wide reinforced concrete structure, consisting of 26 simply-sup-ported T-beams spaced at 4.5 ft. (1.37 m) on center, with an integral concrete deck.A typical beam section of the Troy Bridge had a total depth of 37.5 in. (953 mm),including a 7 in. (178 mm) flange and an 18 in. (457 mm) wide web. Completeinformation on this bridge can be found in Refs. [16,17]. The purposes of this designwere two fold. (i) The bridge was built in 1932 and since then has suffered from se-vere corrosion damage and been strengthened in flexure and shear with FRP sheets.The long-term behavior of the strengthening system will be monitored by New YorkDepartment of Transportation. While this study could focus on the short-termbehavior, it has chosen to wait for the long-term results. (ii) The RC T-beams ofthe Troy Bridge was a typical case to which FRPs could be applied in terms of its size
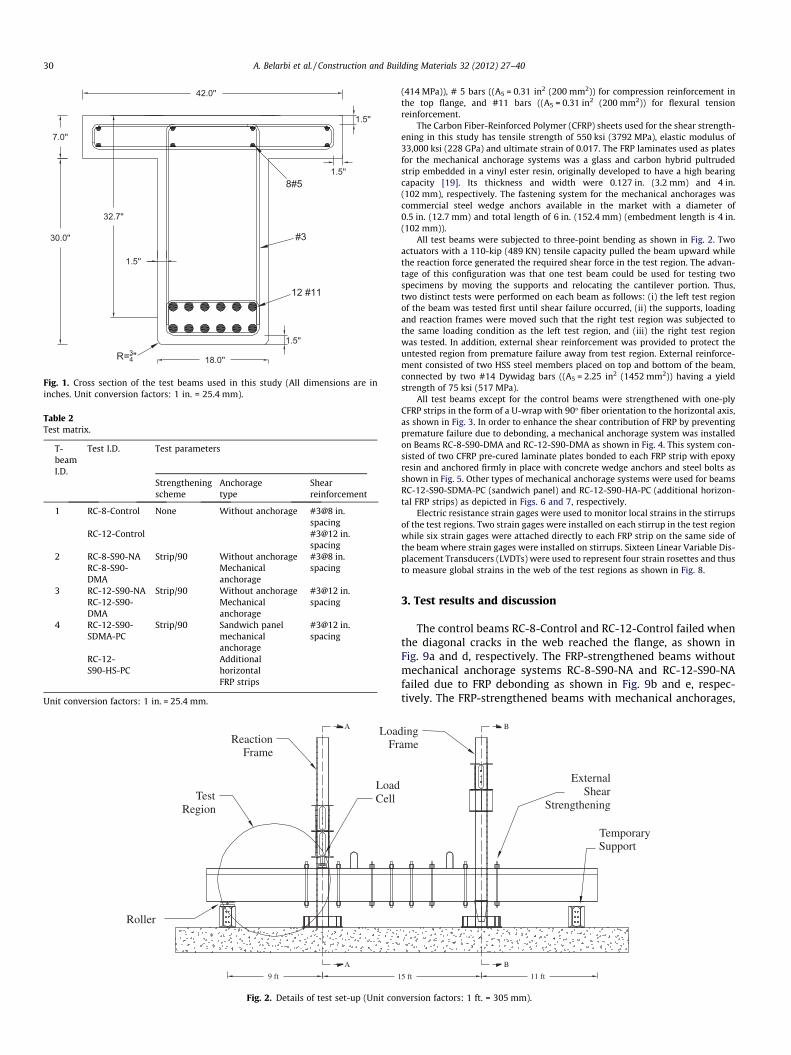
and age. To mimic this cross sectional layout as closely as possible and induce shearfailure, the test beams should have been designed with the dimensions and rein-forcement scheme shown in Fig. 1.
Table 2 summarizes the test matrix used in this study. The denomination of thespecimens indicates the stirrup spacing in inches (8 or 12), the strengthening con-figuration (S90 = strip at 90�), the presence of mechanical anchorage (NA = noanchorage, DMA = discontinuous mechanical anchorage, SDMA = sandwich panelmechanical anchorage, HS = Additional horizontal strips) and the presence of exist-ing cracks (PC). Two different stirrup spacings were chosen to simulate moderateand low amounts of transverse reinforcement. The design using moderate trans-verse reinforcement, with 8 in. (203 mm) stirrup spacing, met the minimumrequirement for transverse reinforcement specified in AASHTO LRFD bridge designspecifications [18]. This design also corresponds to the stirrup spacing of the TroyBridge. The design using low transverse reinforcement, with 12 in. (305 mm) stir-rup spacing, did not meet the AASHTO LRFD requirement and thus simulated a re-duced amount of steel due to corrosion.
The concrete used in this study was a ready-mix concrete with an expected28 day target strength of 4000 psi (27.6 MPa). The actual strength was measuredat the time of testing. Transverse steel reinforcement (stirrups) consisted of #3Grade 40 reinforcing bars A5 = 0.11 in2 (71 mm2) and fy = 40 ksi (276 MPa) whileall longitudinal reinforcement was Grade 60 reinforcing bars (fy = 60 ksi
Reaction Frame
LoadFr
Test Region
Roller
LoadCell
A
A
9 ft 1
Fig. 2. Details of test set-up (Unit con
R=34"
42.0''
30.0''
18.0''
1.5''
1.5''
32.7''
1.5''
7.0''
1.5''
12 #11
#3
8#5
Fig. 1. Cross section of the test beams used in this study (All dimensions are ininches. Unit conversion factors: 1 in. = 25.4 mm).
Table 2Test matrix.
T-beamI.D.
Test I.D. Test parameters
Strengtheningscheme
Anchoragetype
Shearreinforcement
1 RC-8-Control None Without anchorage #3@8 in.spacing
RC-12-Control #3@12 in.spacing
2 RC-8-S90-NA Strip/90 Without anchorage #3@8 in.spacingRC-8-S90-
DMAMechanicalanchorage
3 RC-12-S90-NA Strip/90 Without anchorage #3@12 in.spacingRC-12-S90-
DMAMechanicalanchorage
4 RC-12-S90-SDMA-PC
Strip/90 Sandwich panelmechanicalanchorage
#3@12 in.spacing
RC-12-S90-HS-PC
AdditionalhorizontalFRP strips
Unit conversion factors: 1 in. = 25.4 mm.
30 A. Belarbi et al. / Construction and Building Materials 32 (2012) 27–40
(414 MPa)), # 5 bars ((A5 = 0.31 in2 (200 mm2)) for compression reinforcement inthe top flange, and #11 bars ((A5 = 0.31 in2 (200 mm2)) for flexural tensionreinforcement.
The Carbon Fiber-Reinforced Polymer (CFRP) sheets used for the shear strength-ening in this study has tensile strength of 550 ksi (3792 MPa), elastic modulus of33,000 ksi (228 GPa) and ultimate strain of 0.017. The FRP laminates used as platesfor the mechanical anchorage systems was a glass and carbon hybrid pultrudedstrip embedded in a vinyl ester resin, originally developed to have a high bearingcapacity [19]. Its thickness and width were 0.127 in. (3.2 mm) and 4 in.(102 mm), respectively. The fastening system for the mechanical anchorages wascommercial steel wedge anchors available in the market with a diameter of0.5 in. (12.7 mm) and total length of 6 in. (152.4 mm) (embedment length is 4 in.(102 mm)).
All test beams were subjected to three-point bending as shown in Fig. 2. Twoactuators with a 110-kip (489 KN) tensile capacity pulled the beam upward whilethe reaction force generated the required shear force in the test region. The advan-tage of this configuration was that one test beam could be used for testing twospecimens by moving the supports and relocating the cantilever portion. Thus,two distinct tests were performed on each beam as follows: (i) the left test regionof the beam was tested first until shear failure occurred, (ii) the supports, loadingand reaction frames were moved such that the right test region was subjected tothe same loading condition as the left test region, and (iii) the right test regionwas tested. In addition, external shear reinforcement was provided to protect theuntested region from premature failure away from test region. External reinforce-ment consisted of two HSS steel members placed on top and bottom of the beam,connected by two #14 Dywidag bars ((A5 = 2.25 in2 (1452 mm2)) having a yieldstrength of 75 ksi (517 MPa).
All test beams except for the control beams were strengthened with one-plyCFRP strips in the form of a U-wrap with 90� fiber orientation to the horizontal axis,as shown in Fig. 3. In order to enhance the shear contribution of FRP by preventingpremature failure due to debonding, a mechanical anchorage system was installedon Beams RC-8-S90-DMA and RC-12-S90-DMA as shown in Fig. 4. This system con-sisted of two CFRP pre-cured laminate plates bonded to each FRP strip with epoxyresin and anchored firmly in place with concrete wedge anchors and steel bolts asshown in Fig. 5. Other types of mechanical anchorage systems were used for beamsRC-12-S90-SDMA-PC (sandwich panel) and RC-12-S90-HA-PC (additional horizon-tal FRP strips) as depicted in Figs. 6 and 7, respectively.
Electric resistance strain gages were used to monitor local strains in the stirrupsof the test regions. Two strain gages were installed on each stirrup in the test regionwhile six strain gages were attached directly to each FRP strip on the same side ofthe beam where strain gages were installed on stirrups. Sixteen Linear Variable Dis-placement Transducers (LVDTs) were used to represent four strain rosettes and thusto measure global strains in the web of the test regions as shown in Fig. 8.
3. Test results and discussion
The control beams RC-8-Control and RC-12-Control failed whenthe diagonal cracks in the web reached the flange, as shown inFig. 9a and d, respectively. The FRP-strengthened beams withoutmechanical anchorage systems RC-8-S90-NA and RC-12-S90-NAfailed due to FRP debonding as shown in Fig. 9b and e, respec-tively. The FRP-strengthened beams with mechanical anchorages,
ing ame
External Shear
Strengthening
Temporary Support
B
B
5 ft 11 ft
version factors: 1 ft. = 305 mm).

(typ.)
(typ.)
#3#1 #2
(typ.)
#4 #5 #6
Load
15.0''
10.0''5.0'' 17.0''
Fig. 3. Configuration of externally bonded CFRP sheet strengthening (Unit conversion factors: 1 in. = 25.4 mm).
14in.4in.
Anchor Bolt 0.5 in.
Applied Load
5.25in.
Fig. 4. Configuration of externally bonded CFRP sheet strengthening with mechan-ical anchorage system (Unit conversion factors: 1 in. = 25.4 mm).
Fig. 6. Details of sandwich panel mechanical anchorage system.
Applied Load
7 in.
Length of HorizontalStrip 108 in.
Fig. 7. Configuration of externally bonded CFRP sheet strengthening with addi-tional horizontal FRP strips (Unit conversion factors: 1 in. = 25.4 mm).
A. Belarbi et al. / Construction and Building Materials 32 (2012) 27–40 31
RC-8-S90-DMA and RC-12-S90-DMA, failed primarily due to FRPdebonding; however, the debonding of FRP was delayed due tothe mechanical anchorage as shown in Fig. 9c and f. The additionalhorizontal FRP strips, used for RC-12-S90-HS-PC, could also delayFRP debonding but were not as effective as mechanical anchoragesystems as shown in Fig. 9g. The sandwich panel mechanicalanchorage system, used for RC-12-S90-SDMA-PC, performed betterthan the ordinary mechanical anchorage systems, which com-pletely prevented the debonding of FRP sheets almost until the fail-ure; however, it was found that a weak plane along the anchorbolts was formed, and the failure occurred along that weak planeas shown in Fig. 9h.
The measured shear strengths of all test beams were summa-rized in Table 3 while the relationships between shear force anddeflection at the loading point are presented in Fig. 10a and b for
6.0''
4.0''
2 CFRP plates, 18 in. thick each
Anchor rod 12 in. diameter
Fig. 5. Details of mechanical anchorage system (Unit conversion factors: 1 in. = 25.4 mm).

15.0'' 6.0''
6.0''
18.0''
18.0''
9'
21.0''
Load
Rosette 1 Rosette 2 Rosette 3 Rosette 4
Fig. 8. LVDT rosettes in the test region (Unit conversion factors: 1 in. = 25.4 mm and 1 ft. = 305 mm).
(a)) RC-88-CConttroll
(e)) RC-112-S900-NNA
(c)) RC-88-S90--DMMAA
(g) RRC-112-S900-HHS-PPC
(bb) RRC-8-SS900-NAA
(dd) RRC-12--Coontrrol
(ff) RRC-112-S900-DDMAA
(hh) RRC-12--S90-SSDMMAA-PCC
Fig. 9. Failure modes.
32 A. Belarbi et al. / Construction and Building Materials 32 (2012) 27–40

Table 3Nominal shear strength and shear gain calculations based on normalized concrete strength.
RC-8-Control
RC-12-Control
RC-8-S90-NA
RC-8-S90-DMA
RC-12-S90-NA
RC-12-S90-DMA
RC-12-S90-SDMA-PC
RC-12-S90-HA-PC
Concrete strength f 0c (psi) 2800 2880 3000 3450 4190 4420 2780 2650Measured shear strength Vtest (kips) 153 123.8 191.3 212.0 172.0 205.0 214 187.5Shear contribution of concrete Vc
(kips)72.3 65 86.6 117.6 91.5 112.0 117.8 87.9
Shear contribution of stirrups Vs
(kips)80.7 58.8 63.8 55.8 41.0 38.3 37.2 38.3
Shear contribution of FRP Vf (kips) – – 41.0 38.6 39.5 54.7 59 61.3Normalized shear strength Vtest,norm
(kips)153 123.8 188.5 200.3 156.4 183.4 216.1 191.2
Actual shear gain (kips) – – 35.5 47.3 32.6 59.6 92.3 67.4Shear gain (%) – – 23.2 30.9 26.3 48.1 74.6 54.5
Note: Due to slight differences in concrete strength, the shear strength of each test beam had to be normalized. Unit conversion factors: 1 psi = 0.006895 MPa.1 kips = 4.44822 kN.
(a) RC-8-Series
(b) RC-12-Series
0
50
100
150
200
250
Deflection at the Loading Point (in.)
Shea
r For
ce (k
ips)
RC-8-Control(153 kips)
RC-8-S90-NA(191 kips)
RC-8-S90-DMA(212 kips)
0
50
100
150
200
250
0 0.5 1 1.5 2 2.5 3 3.5 4
0 0.5 1 1.5 2 2.5 3 3.5 4Deflection at the Loading Point (in.)
Shea
r For
ce (k
ips)
RC-12-Control(125 kips)
RC-12-S90-NA(172 kips)
RC-12-S90-DMA(205 kips)
RC-12-SDMA-PC(214 kips)
RC-12-S90-HS-PC(187 kips)
Fig. 10. Shear force vs. deflection at the loading points (Unit Conversion Factors: 1 in. = 25.4 mm, 1 kip = 4.44822 kN).
A. Belarbi et al. / Construction and Building Materials 32 (2012) 27–40 33
RC-8 series and RC-12 series, respectively. As indicated by Fig. 10,the use of externally bonded FRP increased the shear capacity of
the test beams, and the use of mechanical anchorage systems pro-vided additional shear strength. However, the actual shear gain

(f) RC-12-S90-DMA
S9S8S7S5S4S3 S6 S1S3S4S5 S2
#4 #2#5#6 #3
S3 S5S4S2
#4 #5 #6#3
S3S4S5S6S7 S5S4S3
#4 #5 #6#3
S3S4S5
#4#5#6 #3
(e) RC-12-S90-NA(d) RC-12-S90-Control
(c) RC-8-S90-DMA
(b) RC-8-S90-NA(a) RC-8-Control
Fig. 11. Free-body-diagrams used for shear component analysis.
Average strain Average strain
Average strain
Critical crack
Fig. 12. An example of strain gage locations.
34 A. Belarbi et al. / Construction and Building Materials 32 (2012) 27–40
due to FRP strengthening cannot be determined until the shearcontribution of concrete of all test beams are normalized becauseof the differences of concrete strength. The normalization processrequired the analysis of shear contribution of each shearcomponent.
3.1. Contribution of each shear component
The experimentally determined total shear resistance, Vtest, canbe determined as the sum of the contributions from concrete, stir-rups, and FRP sheets.
Vtest ¼ Vc þ Vs þ Vf ð1Þ
where Vc is the contribution of concrete, Vs the contribution of stir-rups, and Vf is the contribution of FRP. The analysis of shear contri-bution from each component is based on free-body-diagrams of apart of the specimens separated along the critical crack that causesthe failure of the specimens as shown in Fig. 11. The contribution ofstirrups, Vs, crack was calculated using the following equation:
Vs ¼X
Avifvi ð2Þ
where Avi is the area of the cross section of the ith stirrups crossingthe critical crack in the free-body-diagram and fvi is the stress in ithstirrups in the free-body-diagram determined using the measuredstrains. The total shear force carried by the FRP was computed usingthe following equation:
Vf ¼X
Afiffi ¼X
AfiEf efi;ave ð3Þ
where Afi is the area of ith FRP strip in the free-body-diagram, ffi thestress in ith strip in the free-body-diagram, Ef the modulus ofelasticity of the FRP strips, and efi,ave is the average strain of FRP

(c) RC-8-S90-DMA
0
20
40
60
80
100
120
140
160
180
Shear Force (Kips)
Shea
r Com
pone
nt (K
ips)
Vs = 80.7 kips
Vc=72.3 kips
Vn=153 kips
0
50
100
150
200
250
Shear Force (Kips)
Shea
r Com
pone
nt (K
ips)
Vf = 41.0 kips
Vc= 86.6 kips
Vn=191.4 kips
Vs = 63.8 kips
0
50
100
150
200
250
0 50 100 150 200 250 0 50 100 150 200 250
0 50 100 150 200 250Shear Force (Kips)
Shea
r Com
pone
nt (K
ips)
Vf = 38.6 kips
Vc=117.6 kips
Vn=212 kips
Vs = 55.8 kips
deb. strip n.3
deb. strip n.4deb. strip n.5
(b) RC-8-S90-NA(a) RC-8-Control
Fig. 13. Shear component diagrams – RC-8 series (Unit conversion factors: 1 kip = 4.44822 kN).
A. Belarbi et al. / Construction and Building Materials 32 (2012) 27–40 35
measured using three strain gages installed near the critical cracksas depicted in Fig. 12.
The shear contribution of concrete, Vc, is calculated by subtract-ing the contributions of the stirrups and FRP from the total shearresistance measured during the tests as
Vc ¼ Vtest � Vs � Vf ð4Þ
Based on the calculations described above, the shear componentdiagrams were drawn for all test specimens as shown in Figs. 13and 14, in which the horizontal axis represents the shear force ap-plied to the test specimens, and the vertical axis represents theshear contribution of each component.
For all beams except for those with pre-existing cracks, Figs. 13and 14 show that the contributions of stirrups and FRP sheets areminimal before shear cracking. At cracking load, the shear contri-bution of stirrups, Vs, in the control specimen exhibits a steepjump, implying that the stirrups started taking shear force. Mean-while, the stirrups in the FRP-strengthened specimens showed arelatively gradual increase in shear contribution, and the contribu-tion of FRP significantly increased after the stirrups yielded. For thebeams with pre-existing cracks, the FRP and stirrups became activefrom the very early stage of the entire loading history.
3.2. Interaction between shear components
Fig. 15 compares the contribution of stirrups, Vs, in the beamswithout pre-existing cracks. This comparison demonstrates thatthe use of FRP reduced the contribution of stirrups, Vs, for both theRC-8 series and RC-12 series. Furthermore, the reduction rate
increased as the effectiveness of FRP increased due to the use ofmechanical anchorage systems. This could be due to the fact thatthe number of stirrups crossed by that crack may vary from speci-men to specimen as depicted in Figure 11, and thus the total shearcontribution of the stirrups when the inclination of the critical crackchanges as a result of the use of FRP. This analysis demonstrates aclear influence of FRP on the behavior of transverse steel reinforce-ment, confirming the findings of previous research studies [20,21].
Fig. 16 shows the shear contribution of concrete, Vc, as definedin Eq. (4). The increase in Vc is linear until the formation of the firstshear crack for both control and FRP-strengthened beams. At theformation of the first crack, the concrete contribution (Vc) eitherdrops or remains constant as the FRP and stirrups are engaged.Once the FRP and stirrups are fully engaged, Vc, starts increasingagain.
3.3. Actual shear gain
The actual shear strength gain of the test girders due to FRPstrengthening can be defined as the difference between the shearstrength of FRP-strengthened beam and that of the correspondingcontrol beam. However, the shear strength of all test girders cannotbe compared in this manner because of the differences in concretestrength. Thus, the experimentally determined shear strengths werenormalized as
Vn;normalized ¼Vc;expffiffiffiffiffiffiffiffiffiffiffi
f 0c;spec
f 0c;control
r þ Vs þ Vf ð5Þ

(e) RC-12-S90-HS-PC
0
20
40
60
80
100
120
140
Shear Force (Kips)
Shea
r Com
pone
nt (K
ips)
Vs = 58.8
Vc=65 kips
Vn=123.8 kips
0
20
40
60
80
100
120
140
160
180
200
Shear Force (Kips)
Shea
r Com
pone
nt (K
ips)
Vf = 39.5 kips
Vc=91.5 kips
Vs =41 kips
Vn=172 kips
Debonding Strip n.3
0
50
100
150
200
250
Shear Force (Kips)
Shea
r Com
pone
nt (K
ips)
Vf = 54.7 kips
Vc=112 kips
Vs = 38.3 kips
Vn=205 kips
0
50
100
150
200
250
Shear Force (Kips)
Shea
r Com
pone
nt (K
ips)
Vf = 59 kips
Vc=117.8 kips
Vs = 37.2 kips
Vn=214 kips
0
20
40
60
80
100
120
140
160
180
200
0 50 100 150 200 250 0 50 100 150 200 250
0 50 100 150 200 250 0 50 100 150 200 250
0 50 100 150 200 250Shear Force (Kips)
Shea
r Com
pone
nt (K
ips)
Vf = 61.3 kips
Vc= 87.9 kips
Vs = 38.3 kips
Vn=187.5 kips
(b) RC-12-S90-NA(a) RC-12-Control
(d) RC-12-S90-SDMA-PC(c) RC-12-S90-DMA
Fig. 14. Shear component diagrams – RC-12 series (Unit conversion factors: 1 kip = 4.44822 kN).
36 A. Belarbi et al. / Construction and Building Materials 32 (2012) 27–40
where Vc,exp is the contribution of the concrete derived from theshear component analysis, f 0c;spec is the concrete strength of testbeams strengthened with FRP, and f 0c;control is the concrete compres-sive strength of the control beam. The normalized shear strength ofall test beams is presented in Table 3. The actual shear gain wasthen calculated using the normalized shear strength presented inTable 3.
Table 3 shows that FRP strengthening increased the shearcapacity, and its effectiveness depends on the variables considered.Specifically, the strengthened specimens of RC-12 series exhibited
greater increase in shear strength than those of RC-8 series. This re-sult confirms the findings of previous studies [3,20,21] that theeffectiveness of FRP decreases as the number of stirrups is in-creased. This interaction between the number of stirrups and FRPstrengthening should be considered in the design of FRP shearstrengthened specimens. Table 3 further shows that the use ofmechanical anchorage increases the effectiveness of FRP shearstrengthening [6], and the sandwich panel system performed best.The actual shear strength gain calculated will be used to determinethe effective strain of FRP instead of the contribution of FRP (Vf).

0
10
20
30
40
50
60
70
Shear Force (Kips)
Shea
r Con
trib
utio
n of
Stir
rups
, Vs
(kip
s)
RC-12-CONTROL
RC-12-S90-NA
RC-12-S90-DMA
0
10
20
30
40
50
60
70
80
90
0 50 100 150 200 250 0 50 100 150 200 250Shear Force (Kips)
Shea
r Con
trib
utio
n of
Stir
rups
, Vs
(kip
s)
RC-8-CONTROL
RC-8-S90-NA
RC-8-S90-DMA
(b) RC-8 series(a) RC-12 series
Fig. 15. Shear contribution of stirrups.
(a) RC-8 series
0
20
40
60
80
100
120
140
Shear Force (kips)
Shea
r Con
trib
utio
n of
con
cret
e, V
c (k
ips)
RC-8-S90-NA
RC-8-CONTROL
RC-8-S90-DMA
0
20
40
60
80
100
120
0 50 100 150 200 250 0 50 100 150 200 250Shear Force (kips)
Shea
r Con
trib
utio
n of
Con
cret
e, V
c (k
ips)
RC-12-CONTROL
RC-12-S90-NA
RC-12-S90-DMA
(b) RC-12 series
Fig. 16. Shear contribution of concrete (Unit conversion factors: 1 kip = 4.44822 kN).
0.0000
0.0005
0.0010
0.0015
0.0020
0.0025
0.0030
0.0035
0.0040
Distance from the Reaction Point (in.)
Stra
in (i
n./in
.)
V=69 kipsV=86 kipsV=102 kipsV=114 kipsV=135 kipsV=148 kipsV=160 kips
0.000
0.002
0.004
0.006
0.008
0.010
0.012
0.014
0.016
0 20 40 60 80 100 0 20 40 60 80 100
Distance from the Reaction Point (in.)
Stra
in (i
n./in
.)
V=69 kips
V=94 kips
V=111 kips
V=136 kips
V=160 kips
V=182 kips
V=198 kips
V=204 kips
(b) RC-8-S90-DMA(a) RC-8-S90-NA
Fig. 17. Vertical strain distribution over shear span measured by LVDTs (RC-8 series) (Unit conversion factors: 1 in. = 25.4 mm).
A. Belarbi et al. / Construction and Building Materials 32 (2012) 27–40 37
3.4. Effective FRP strain
Vertical FRP strains (i.e., strains in the fiber direction) in the testregion were measured using LVDTs (see Fig. 8). The results fromRC-8 series beams, plotted at multiple load levels in Fig. 17, indi-cate that vertical strains are not uniform over the shear span. Since
FRP sheets were bonded to the concrete, the vertical strains of FRP,aligned with fiber direction, also appeared to be non-uniform priorto debonding of FRP, as shown in Fig. 18. In fact, the FRP strain dis-tribution becomes more complex after debonding, showing irregu-lar and more complex distribution over the shear span; however,Fig. 18 only shows the distribution of FRP strains at loading steps

(a) RC-8-S90-NA
-0.0005
0.0005
0.0015
0.0025
0.0035
0.0045
1 2 3 4 5 6 7
FRP strip
FRP
stra
in (i
n./in
.)
V=100 kips
V=120 kips
V=140 kips
V=160 kips
V=170 kips
0
0.001
0.002
0.003
0.004
0.005
0.006
1 2 3 4 5 6FRP strip
FRP
stra
in (i
n./in
.)
V=86 kips
V=120 kips
V=140 kips
V=160 kips
V=180 kips
(b) RC-8-S90-DMA
Fig. 18. Vertical FRP strain distribution over shear span measured by strain gages (RC-8 series).
0.000
0.005
0.010
0.015
0.020
0.025
0.030
0.035
0.040
0.045
0.000 0.050 0.100 0.150 0.200 0.250 0.300 0.350
Efr f/f'c1/2
e fe
FRP debonding
FRP fracture
RC-8-S90-NA
RC-8-S90-DMA
RC-12-S90-NA
RC-12-S90-DMA
RC-12-S90-SDMA-PC
RC-12-S90-HS-PC
0.004
0.006
0.004
0.007
0.011
0.008
Test Beams Effective Strain
Fig. 19. FRP effective strain vs. FRP rigidity.
0.000.200.400.600.801.001.201.401.601.802.002.202.402.60
Trianta
fillou
Malek an
d Saa
datm
anes
h
Khalifa
et. al
. 199
8
Khalifa
and Nan
ni 20
00
Hutchin
son et.
al.
Chaall
al et.
al.
Chen an
d Teng
Pelleg
rino a
ndMod
ena
Zhang
and H
su
Cao et
. al.
Trianta
fillou an
d Anto
nopo
ulos
Monti a
nd Li
otta
Carolin
and T
aljste
n
Analytical Models
V(pr
edic
tion)
/V(e
xper
imen
tal)
Fig. 20. Error range of predicted to experimental values for all the test specimens.
38 A. Belarbi et al. / Construction and Building Materials 32 (2012) 27–40

A. Belarbi et al. / Construction and Building Materials 32 (2012) 27–40 39
prior to the initial debonding of FRP. Regardless of this complexity,some researchers [4,5,10,22] have attempted to model the non-uniform FRP strain distribution in order to predict the strain levelof FRP and the shear forces carried by each FRP sheet in the shearspan. However, based on the non-uniform strain distribution, theperformance of their analytical models did not appear more accu-rate than other analytical models using simple equations based oneffective strain (stress) concepts [23].
Because of the complexity of the FRP strain distribution, mostcurrent available analytical models express the contribution ofFRP to the shear capacity as a function of the effective strain ofFRP, efe [6–8,11–14,24]. The effective strain is typically expressedas a fraction of the ultimate strain and represents the averagestrain experienced by the FRP strips at ultimate shear capacity ofthe strengthened member.
The effective strain, efe, of all beams tested in this study was cal-culated using Eq. (6) shown below and assuming Vf as the actualshear gain experienced by the FRP-strengthened beams:
Vf ¼Af f fedf
sfðsin bþ cos bÞ ¼ Af Ef efedf
sfðsin bþ cos bÞ ð6Þ
where Af = 2nftfwf is the area of transverse FRP reinforcement cover-ing two sides of the beam, nf is number of FRP plies, tf is the FRPreinforcement thickness, wf is the width of the strip, sf is the spacingbetween the strips (defined as the distance from the centerline ofone strip to the center line of an adjacent strip), and b is the anglebetween the orientation of the fibers and the horizontal axis of thebeam.
Effective strains were calculated not only for the test beams inthis study but also for the specimens included in the experimentaldatabase. Fig. 19 plots the results against the rigidity of FRP overthe square root of compressive strength of concrete ðEf tf =
ffiffiffif
p 0cÞ
since the effective strains of FRPs are believed to be affected bythe tensile properties of concrete as well as the rigidity of FRPwhen they are used for bond critical applications. In addition, sincethe effective strain of FRP is largely dependent on the failure mode,the effective strains drawn from the database were grouped in thisfigure by the failure mode of the test specimen, i.e., either as deb-onding or rupture of the FRP strips. According to Fig. 19, the effec-tive strain decreases as the rigidity of FRP increases. The effectivestrains of the full-scale beams tested in this study are similar tothose drawn from the database with respect to FRP rigidity, indi-cating that the effectiveness of FRP shear strengthening on full-scale RC beams with the range of E1t1=
ffiffiffiffife
pvalues used in this study
can be regarded as much as that verified through small-scaleexperimental results.
3.5. Comparison of test results with predictions by existing analyticalmodel
Existing analytical models were evaluated for their accuracy inpredicting FRP shear contribution for the beams tested in thisstudy. Fig. 20 shows the accuracy of each model by plotting the ra-tio of the shear contribution of FRP predicted by the models to theexperimentally determined shear contribution of FRP, Vf, of eachbeam that was calculated based on the actual shear gain, as pre-sented in Table 3. According to the observation in Fig. 20, the mod-els based on the effective strain predicted the shear contribution ofFRP within a relatively small range of error. Meanwhile, the modelsthat considered the non-uniform distribution of FRP showed lessaccuracy; however, this result does not necessarily mean that theirattempt to consider the non-uniform strain distribution is wrong.Instead, it implies that there are other parameters to be consideredin the development of an improved analytical model, one of whichwill be the interaction between shear contribution of stirrups and
FRP, presented in this study. Overall, it can be said that the currentanalytical models based on the effective strain concept be applica-ble to the prediction of shear contribution of FRP in full-scale RC T-beams within a reasonable error range for design purpose.
4. Conclusions
(1) The beams strengthened with FRP tested in this studyshowed an increase in shear strength from about 23% to26% as compared to the corresponding control beam whenmechanical anchorages were not used.
(2) The use of a mechanical anchorage system provided addi-tional shear strength. The FRP-strengthened beams withmechanical anchorage showed 7–48% higher shear strengththan the beams without mechanical anchorage, dependingon the types of mechanical anchorages used.
(3) FRP shear strengthening was more efficient for beams with12 in. (305 mm) stirrup spacing than for those with 8 in.(203 mm) stirrup spacing, implying there is an interactionbetween the shear contribution of FRP and stirrups. Thisinteraction also was verified through shear component anal-ysis in this study.
(4) The effective strains calculated for the beams tested in thisstudy were compared to the effective strains calculated inthe same way from data in the existing experimental data-base. The comparison showed that the effective strains ofthe full-scale beams tested in this study were similar inmagnitude to those calculated from existing data withrespect to FRP axial rigidity.
(5) Based on this similarity and the fact that the existing datareflects tests on small-scale beams, FRP shear strengtheningon full-scale RC beams is as effective as that observed onsmall-scale RC beams.
(6) The strain distribution on the FRP over the test region wasfound to be non-linear, however for design purposes, aneffective strain can be used to calculate the shear carriedby the FRP sheets.
Acknowledgements
The financial support from the National Cooperative HighwayResearch Program (NCHRP) and the National University Transpor-tation Center (NUTC) at the Missouri University of Science andTechnology is gratefully acknowledged.
References
[1] ASCE, 2009 report card for America’s infrastructure. Virginia: American Societyof Civil Engineers; 2009.
[2] Triantafillou TC, Antonopoulos CP. Design of concrete flexural membersstrengthened in shear with FRP. J Compos Constr 2000;4(4):198–205.
[3] Bousselham A, Chaallal O. Shear strengthening reinforced concrete beams withfiber-reinforced polymer: assessment of influencing parameters and requiredresearch. ACI Struct J 2004;101(2):219–27.
[4] Chen JF, Teng JG. Shear capacity of fiber-reinforced polymer strengthenedreinforced concrete beams: fiber reinforced polymer rupture. J Struct Engr2003;129(5):615–25.
[5] Chen JF, Teng JG. Shear capacity of FRP-strengthened RC beams: FRPdebonding. Constr Build Mater 2003;17(1):27–41.
[6] Hutchinson RL, Rizkalla SH. Shear strengthening of AASHTO bridge girdersusing carbon fiber reinforced polymer sheets. ACI Special Publications (SP-188)1999;188:945–58.
[7] Khalifa A, Gold W, Nanni A, Abdel Aziz MI. Contribution of externally bondedFRP to shear capacity of RC flexural members. J Compos Constr1998;2(4):195–202.
[8] Khalifa A, Nanni A. Improving shear capacity of existing RC T-section beamsusing CFRP composites. J Cem Concr Compos 2000;22(2):165–74.
[9] Malek AM, Saadatmanesh H. Ultimate shear capacity of reinforced concretebeams strengthened with web-bonded fiber-reinforced plastic plates. ACIStruct J 1998;95(4):391–9.

40 A. Belarbi et al. / Construction and Building Materials 32 (2012) 27–40
[10] Monti G, Liotta MA. Tests and design equations for FRP-strengthening in shear.Constr Build Mater 2007;21(24):799–809.
[11] Triantafillou TC. Shear strengthening of reinforced concrete beams usingepoxy-bonded FRP composites. ACI Struct J 1998;95(2):107–15.
[12] Zhang Z, Hsu CT. Shear strengthening of reinforced concrete beams usingcarbon-fiber-reinforced polymer laminates. J Compos Constr 2005;9(2):158–69.
[13] ACI Committee 440. Guide for the design and construction of externallybonded FRP systems for strengthening concrete structures (ACI 440.2R-08).Michigan: American Concrete Institute; 2008.
[14] CSA-S806-02. Design and construction of building components with fibre-reinforced polymer. Ontario: Canadian Standards Association; 2002.
[15] JSCE. Recommendations for upgrading of concrete structures with use ofcontinuous fiber sheets. Tokyo: Japan Society of Civil Engineers; 2001.
[16] Hag-Elsafi O, Kunin J, Alampalli S, Conway T. Strengthening of route 378 bridgeover Wynantskill Creek in New York using FRP laminates. New York StateDepartment of Transportation, Special Report 135; 2001.
[17] Hag-Elsafi O, Kunin J, Alampalli S. In-service evaluation of a concrete bridgeFRP strengthening system. New York State Department of Transportation,Special Report 139; 2001.
[18] AASHTO. AASHTO LRFD bridge design specifications. 4th ed. Washington, DC:American Association of State Highway and Transportation Officials; 2008.
[19] Rizzo A, Galati N, Nanni A. Strengthening of off-system bridges withmechanically fastened pre-cured FRP laminates. ACI Special Publication (SP-230) 2005;230:1157–76.
[20] Bousselham A, Chaallal O. Behavior of reinforced concrete T-beamsstrengthened in shear with carbon fiber-reinforced polymer-an experimentalstudy. ACI Struct J 2006;103(3):339–47.
[21] Pellegrino C, Modena C. Fiber reinforced polymer shear strengthening ofreinforced concrete beams with transverse steel reinforcement. J ComposConstr 2002;6(2):104–11.
[22] Cao SY, Chen JF, Teng JG, Hao Z, Chen J. Debonding in RC beams strengthenedwith complete FRP wraps. J Compos Constr 2005;9(5):417–28.
[23] Belarbi A, Bae S, Tumialan R. Toward design guidelines for shear strengtheningof concrete structures using externally bonded FRP systems. In: Proceedings ofadvanced composites in construction (ACIC07), April, Bath, UK; 2007.
[24] fib-TG9.3. Design and use of externally bonded fiber polymer reinforcement(FRP EBR) for reinforced concrete structures – technical report bulletin 14.Lausanne: The International Federation for Structural Concrete; 2001.