Tensile behavior of epoxy based FRP composites under extreme service conditions
Upload
khangminh22Category
view
1download
0
The University of MaineDigitalCommons@UMaine
Electronic Theses and Dissertations Fogler Library
2002
Behavior and Design of FRP-ReinforcedLongitudinal Glulam Deck BridgesMelanie Marie BragdonUniversity of Maine - Main
Follow this and additional works at: http://digitalcommons.library.umaine.edu/etd
Part of the Civil and Environmental Engineering Commons
This Open-Access Thesis is brought to you for free and open access by DigitalCommons@UMaine. It has been accepted for inclusion in ElectronicTheses and Dissertations by an authorized administrator of DigitalCommons@UMaine.
Recommended CitationBragdon, Melanie Marie, "Behavior and Design of FRP-Reinforced Longitudinal Glulam Deck Bridges" (2002). Electronic Theses andDissertations. 133.http://digitalcommons.library.umaine.edu/etd/133

BEHAVIOR AND DESIGN OF FRP-REINFORCED LONGITUDINAL
GLULAM DECK BRIDGES
BY
Melanie Marie Bragdon
B.S. University of Maine, 1995
A THESIS
Submitted in Partial Fulfillment of the
Requirements for the Degree of
Master of Science
(in Civil Engineering)
The Graduate School
The University of Maine
December, 2002
Advisory Committee:
Habib J. Dagher, Professor of Civil Engineering, Advisor
William G. Davids, Assistant Professor of Civil Engineering
Roberto Lopez-Anido, Assistant Professor of Civil Engineering

O 2002 Melanie M. Bragdon All Rights Reserved
BEHAVIOR AND DESIGN OF FRP-REINFORCED LONGITUDINAL
GLULAM DECK BRIDGES
BY
Melanie Marie Bragdon
Thesis Advisor: Dr. Habib J. Dagher
An Abstract of the Thesis Presented in Partial Fulfillment of the Requirements for the
Degree of Master of Science (in Civil Engineering)
December, 2002
In 1977, the Weyerhaeuser Company developed a system for short-span timber
bridges. The girder-free system consisted of longitudinal, vertically-laminated glulam
panels joined by below-deck Transverse Stiffener Beams (TSB). This project addresses
two potential areas of improvement in the construction and design of these bridges: a
reinforced deck panel and an improved method for TSB design.
This project has two objectives: (1) To evaluate the behavior and advantages of
longitudinal glulam deck panels reinforced with Fiber-Reinforced Polymers (FRP) and
(2) To evaluate existing AASHTO empirical TSB design criteria.
The tension-reinforced deck panels can alleviate reliance on high grade wood
laminations and allow longer spans and lighter decks. The new panels have the middle
two-thlrds of the tension side reinforced with longitudinal E-glass FRP. The research

addressed the selection of the FRP material system, the manufacturing process used for
applying the reinforcement to the panels, the structural and economic benefits of FRP-
glulam panels, and the durability of the FRP.
The approach included design, laboratory manufacture, and construction of a
municipal pier in Milbridge, Maine. Wet-impregnated unidirectional E-glass fabrics
were used to reinforce the 1 6 4 . wide, 167-ft. long, 7-span vehicular pier. A cross-
section reinforcement ratio of one percent was used, increasing panel stiffness by six
percent. The pier showed the FRP-glulam deck as cost competitive with a prestressed
concrete deck. The pier was load tested and performed as predicted under full design live
load. The FRP has performed well after two years of harsh marine exposure.
To evaluate AASHTO designs of the TSB, a parametric study was performed
using a finite element model developed for this study. The model was validated against
full-scale laboratory tests conducted at The University of Maine and Iowa State
University. The finite element model incorporated orthotropic plate elements for deck
panels, offset beam elements for TSB, nonlinear models for deck-to-TSB connections,
elements to allow pretensioning of the connections, and elements to model bearing
between the deck and TSB.
The parametric study focused on shear and bending response of the TSB and the
relative movement between adjacent panels. Over 140 analyses were conducted on 43
southern pine bridges designed according to current AASHTO criteria, using 50 load
cases. Results showed that the empirical AASHTO design criteria for the TSB may be
unconse~ative. In the most critical cases under AASHTO HS20 loading, TSB designed
according to AASHTO criteria may experience maximums of either 68% more shear

stress than allowable or 61% more bending stress than allowable. In addition, relative
panel deflection may exceed the 0.1-inch asphalt serviceability criteria by 79%.
Based on the parametric study performed on curb-free bridges, the following
design criteria are recommended to replace the current AASHTO TSB design criteria.
"In lieu of a more accurate analysis, the transverse stiffener beam shall be designed for
the following bending moment and shear values: Shear = 0.45*wheel load and Bending
Moment = (3.5 inches) *wheel load, as the wheel load represents the maximum wheel
load for HS & H vehicles and 1.75*maximum wheel load for alternate military loading."

ACKNOWLEDGEMENTS
The author would like to thank Dr. Habib Dagher for his guidance and assistance
throughout this research process. She would also like to thank Dr. Bill Davids and Dr.
Roberto Lopez-Anido for their comments and advice. Those who have contributed to the
work and ideas that have culminated in this thesis are far too numerous to list here,
however, the author freely acknowledges her indebtedness to the technical assistance of
professionals at the Maine Department of Transportation, the untiring labor of
undergraduates that worked on the project, the unfailing assistance of the laboratory
technicians, lab managers, and administrative assistants, the invaluable encouragement
and advice of fellow graduate students, the support of family, and the grace of God.
The research was funded by the Maine Department of Transportation and the
Federal Highway Administration through the Innovative Bridge Research and
Construction Program.
TABLE OF CONTENTS
... .............................................................................................. ACKNOWLEDGEMENTS 111
.............................................................................................................. LIST OF TABLES x
. . .......................................................................................................... LIST OF FIGURES xi1
Chapter
........................................................................................................ 1 INTRODUCTION 1
.................................................................................................................. General 1
................................... Need for Research in Longtudinal Glulam Deck Bridges 1
....................................................................................... Objective and Workplan 2
Overview of FW-Reinforcing of Glulam ............................................................. 3
................................................. Overview of Longitudinal Glulam Deck Bridges 3
................................................................................ 1.5.1 Description of System ..3
......................................................................................... 1 S.2 Design of System 6
............................................................................................... 1.6 Overview of Thesis 9
.......................................................................................... 2 LITERATURE REVIEW 1 1
......................................................................................................... 2.1 Introduction 11
........................................................................................................ 2.2 FW-Glulam 11
............................................................................. 2.2.1 Mechanical Properties 1
........................................................... 2.2.2 Environmental Durability of FRPs 1 2
............................... 2.2.2.1 Moisture/Aqueous Environmental Degradation 13
................................................................ 2.2.2.2 UV Radiation Degradation 14
iv

2.2.3 Environmental Durability of Phenol Resorcinol Formaldehyde
............................................................................. (PRF) Wet-Lay-up FRP 15
.................................................................... 2.3 Longitudinal Glulam Deck Bridges 16
2.3.1 Experimental Testing of Longitudinal Glularn Deck Bridges ................... 16
............................................................ 2.3.1.1 Weyerhaeuser's Experiments 17
2.3.1.1.1 BridgeTests ............................................................................. 17
...................................................................... 2.3.1.1.2 Connection Tests 17
2.3.1.2 Laboratory Tests Performed at Iowa State University (ISU) ............ 18
..................................................... 2.3.1.2.1 Description of Experiments 20
. . .................................................................................... 2.3.1.2.2 Findings 21
2.3.2 Analysis of Longitudinal Glulam Deck Bridges ........................................ 24
2.4 Summary ............................................................................................................. 27
............................................................................... 2.4.1 FRP-Glulanl Research 27
2.4.2 Longitudinal Glulam Deck Bridges Research ........................................... 28
............................................................................. 3 MILBRIDGE MUNICIPAL PIER 31
......................................................................................................... 3.1 Introduction 31
............................................................................................ 3.2 General Description 31
............................................... 3.3 Milbridge Municipal Pier Superstructure Design 33
3.3.1 Durability Design ....................................................................................... 33
............................................................................... 3.3.1.1 Wood Durability 34
3.3.1 . 1. 1 Preservative .............................................................................. 34
....................... 3.3.1.1.2 Impern~eable Membrane and Wearing Surface 36
3.3.1.2 Hardware and FRP Durablitity ......................................................... 39
v
...................................................................................... 3 .3.2 Structural Design -39
.............................................................................. 3.3.3 Material Specifications 40
................................................................. 3.3.3.1 Glulam Panels and Beams 40
........................................................................... 3.3.3.2 FRP Specifications -40
................................................................ 3.3.3.3 Panel-to-TSB Connections 41
........................................................... 3.3.3.4 Panel-to-Pile Cap Connection 41
................................................................. 3.4 Panel Fabrication and Reinforcement 41
. . ......................................................................................... 3.4.1 FRP Applicat~on 43
............................................................... 3.4.2 Comments on FRP System Used 46
........................................................................................................ 3.5 Construction 47
.................................................................................... 3 S . 1 Substructure of Pier 48
....................................................................... 3.5.2 Superstructure Construction 51
........................................................ 3.5.3 Wearing Surface System Application 53
............................................................................................................ 3.5.4 Cost 54
................................................................................................... 3.5.5 Load Test 57
....................................................................................... 3 S . 6 FRP Performance 65
...................................................... 3.5.7 Wearing Surface System Performance 65
3.6 Conclusions ......................................................................................................... 68
....................................................................................... 4 LABORATORY TESTING 69
4.1 Introduction ......................................................................................................... 69
............................................................................................ 4.2 System Components 69
......................................................................................................... 4.2.1 Panels 70
.......................................................................................... 4.2.2 Stiffener Beams 72
vi
4.2.3 Connection Systems ................................................................................... 73
................................................................................................... 4.3 Instrumentation 75
4.4 Load Cases .......................................................................................................... 75
.......................................................................................................... 4.5 Test Matrix 79
4.6 Results ................................................................................................................. 79
........................................................................................................ 4.7 Conclusions 3 9
FINITE ELEMENT MODEL ..................................................................................... 91
5.1 Introduction ......................................................................................................... 91
5.2 Finite Element Model for Longitudinal Glulam Deck Bridges .......................... 91
Modeling Approach ................................................................................... 92
Deck Panels ................................................................................................ 95
............................................................ Transverse Stiffener Beams (TSB) 96
......................................................................... Panel-to-TSB Connections 97
.............................................. Panel-Transverse-Stiffener-Beam Bearing 103
Boundary Conditions ............................................................................... 104
.................................................................................................... Loading 104
5.3 Convergence Study ........................................................................................... 105
5.4 FEM Validation ................................................................................................ 106
5.4.1 Correlation with Experimental Results from The University of
....................................................................................................... Maine 106
5.4.1.1 Panel Deflection .............................................................................. 106
5.4.1.2 Axial Strain in Threaded Rods ........................................................ 1 0
5.4.2 Correlation of FE Model with Experimental Results from ISU .............. 110
vii
....................................................................................................... 5.5 Conclusions 1 12
......................................................................................... 6 PARAMETRIC STUDY 1 5
....................................................................................................... 6.1 Introduction 115
........................................................................................................... 6.2 Overview 116
6.2.1 Scope ........................................................................................................ 116
................................................................................................. 6.2.2 Rationale 1 6
6.3 Results of Parametric Study .............................................................................. 123
6.3.1 Sensitivity of Transverse Stiffener Beam (TSB) Response and
Relative Panel Displacement (RPD) to Bridge Parameters ..................... 123
....................................... 6.3.1.1 Sensitivity to Panel-to-TSB Connections 123
.............. 6.3.1.2 Sensitivity to Panel Thickness and Modulus of Elasticity 136
....................................... 6.3.1.3 Sensitivity to TSB Modulus of Elasticity 137
.......................................................... 6.3.1.4 Sensitivity to TSB Geometry 137
........................... 6.3.1.5 Sensitivity to Bridge Configuration and Loading 141
................................ 6.3.2 Critical TSB Shear and Bending Stresses and RPD 152
............................................................ 6.3.2.1 MaximumTSB Shear Stress 152
....................................................... 6.3.2.2 Maximum TSB Bending Stress 155
............................................. 6.3.2.3 Maximum Relative Panel Movement 155
....................................................................................................... 6.4 TSB Design 155
................................................................. 6.5 Conclusions and Recommendations 156
................................................... 7 CONCLUSIONS AND RECOMMENDATIONS 160
....................................................................................................... 7.1 Conclusions 160
................................ 7.1.1 Longitudinal FRP-Reinforced Glulam Deck Panels 160
... Vl l l

7.1.2 Finite Element Model for Longitudinal Glulam Deck Bridges ............... 161
7.1.3 Parametric Study of Longitudinal Glulam Deck Bridges ........................ 162
7.2 Recommendations for Future Work .................................................................. 165
................................................................................................................ REFERENCES 167
................................................................................................................. APPENDICES 171
Appendix A Longitudinal Glulam Deck Bridge Design Methodology .................. 172
...................................................... Appendix B Milbridge Pier Load Test Results 181
..................................................................... Appendix C Laboratory Test Results 186
Appendix D Experimental and Finite Element Analysis Correlations ................... 194
.................................................. Appendix E Parametric Study Tables and Charts 203
................................................................................. BIOGRAPHY OF THE AUTHOR -248
LIST OF TABLES
Table 2.1
Table 3.1
Table 3.2
Table 3.3
Table 4.1
Table 4.2
Table 4.3
Table 6.1
Table 6.2
Table 6.3
Table 6.4
Table 6.5
Table 6.6
Table 6.7
Table 6.8
Table 6.9
Parameters that affect longitudinal glulam deck bridge response as
reported in the literature review (Hale 1978; Sanders et a1 . 1985;
Funke 1986; Hajdu 1994; Kurain 2001) ...................................................... 30
Specifications for Milbridge Pier glularn ..................................................... 42
FRP-reinforced glulam deck pier table of costs ........................................... 56
Comparison of cost of prestressed concrete deck to FRP-glulam deck ....... 57
Panel apparent modulus of elasticity ........................................................... 71
Transverse stiffener beams used in experimental tests ................................ 72
Matrix of experiments performed for UMaine's hll-scale bridge test ........ 80
Parametric study (partial factorial) ............................................................ 117
Allowable stress used for parametric study ............................................... 121
........................................... Material properties used for parametric study 121
Maximum TSB shear forces. TSB bending moments. and connection
..... forces for nonlinear and linear connection behavior (Analyses # 1 .4b) 132
Sensitivity of TSB response and RPD to connection type (nonlinear
............................................................................ connection models only) 135
Sensitivity of TSB response and RPD to panel thickness ......................... 138
Sensitivity of TSB response and RPD to panel MOE ............................... 138
Sensitivity of TSB response and RPD to TSB MOE ................................. 138
Analysis results of TSB response and RPD showing sensitivity to
......................................................................................... TSB aspect ratio 142
Table 6.10
Table 6.1 1
Table 6.12
Table 6.13
Table 6.14
Table 6.1 5
Table 6.16
Table 6.17
Table B . 1
Table C.l
Table C.2
Table C.3
Table E.l
Table E.2
Table E.3
Table E.4
Analysis results of TSB response and RPD showing sensitivity to
TSB stiffness ............................................................................................. 143
TSB stresses and RPD for TSB-critical42-inch-wide panel bridges ........ 148
TSB stresses and RPD for TSB-critical48-inch-wide panel bridges ........ 148
TSB stresses and RPD for TSB-critical54-inch-wide panel bridges ........ 151
RPD and TSB stresses for RPD-critical bridges ................................. 154
Critical TSB shear stress utilization ratios ................................................. 157
Critical TSB bending stress utilization ratios ............................................ 157
. . . . . Cntical RPD utilization ratios .................................................................... 157
....................... Deflections measured during the Milbridge Pier Load Test 183
....................... Deflection readings fiom laboratory testing. Load Case #1 187
....................... Deflection readings from laboratory testing. Load Case #2 188
....................... Deflection readings fiom laboratory testing. Load Case #3 189
Geometry of TSB used the parametric study .............................................. 203
......................................................... Load cases used the parametric study 205
................................................................ Analyses run in parametric study 215
.......................................................... Results of parametric study analyses 227
LIST OF FIGURES
Figure 1.1
Figure 1.2
Figure 1.3
Figure 1.4
Figure 1.5
Figure 2.1
Figure 2.2
Figure 2.3
Figure 2.4
Figure 3.1
Figure 3.2
Figure 3.3
Figure 3.4
Figure 3.5
Figure 3.6
Figure 3.7
Figure 3.8
Figure 3.9
Partial FRP-reinforcing of glulam panel ........................................................ 5
Typical longitudinal glulam deck bridge superstructure ............................... 5
Edge-gluing for panels of thickness greater than 12 in ................................. 5
Types of common panel-to-TSB connections (Ritter 1990) .......................... 7
Thru-bolt connection with moisture-induced expansion of the glulam ......... 7
FRP-glulam sandwich panel configuration .................................................. 12
Slip measured in load-slip experiments of connection types ....................... 19
Experimental load-slip curves of connectors (Hale 1978. Funke
1986) ............................................................................................................ 19
Bridge configurations and load cases tested by ISU .................................... 22
Milbridge Municipal Pier after reconstruction ............................................ 32
Section of span of the Milbridge Pier .......................................................... 33
Cracks in pier deck after 6 months of exposure ........................................... 35
Variation in panel thickness shown by water pooling on pier deck ............ 38
Cracks in T-45 from hygrothennal cycling ................................................. 38
....................................................... Seated-beam panel-to-TSB connection 42
E-glass fabric impregnated with resin ......................................................... 44
Placing the a layer of wet-impregnated glass onto glulam panel for
Milbridge Pier .............................................................................................. 44
Reinforced panels are clamped for FRP consolidation and ambient
cure ............................................................................................................... 45
xii
Figure 3.10 Cured FRP reinforcing the bottornltensile side of the panels (panels
are upside-down) ......................................................................................... 45
Figure 3.1 1 Clamping methodology modified for reinforcing the 72-inch wide
panel ............................................................................................................. 46
Figure 3.12 Longitudinal cracks in FRP fiom shrinkage ................................................ 47
Figure 3.13 Location of piles anchored to bedrock and pile cap damage ....................... 49
Figure 3.14 Pile cap damage due to improper anchoring of pile .................................... 49
Figure 3.15 Close-up of pile cap damage at location #1 ................................................. 50
Figure 3.16 Pile cap damage at locations #1 and #2 ....................................................... 50
Figure 3.17 Close-up of pile cap damage at location #3 ................................................. 50
Figure 3.18 Pile cap damage at location #4 .................................................................... 51
Figure 3.19 Panels moved into place by barge crane and aligned to the threaded
rod anchored in the pile cap ......................................................................... 52
Figure 3.20 Some connections were tightened to point of crushing the TSB ................. 52
Figure 3.2 1 Some eccentricity and bending in the connection ....................................... 52
Figure 3.22 Membrane and wearing surface system used on the Pier (not to
............................................................................................................ scale) 55
Figure 3.23 First coat of CIM 1000 application and appearance after curing ................ 55
Figure 3.24 Second coat of CIM 1000 application and appearance after curing ............ 55
Figure 3.25 Deflection gages used during load test ........................................................ 59
Figure 3.26 Illustration of displacement gages during load test ..................................... 59
Figure 3.27 Instrumentation for deflection measurements for load test ......................... 60
Figure 3.28 Truck used for load test ............................................................................... 60
... Xl l l
Figure 3.29 Load Case #1 for Milbridge Pier Load Test ................................................ 60
Figure 3.30 Load Cases #2 and #3 for load test .............................................................. 61
Figure 3.3 1 Load Cases #4 and #5 for load test .............................................................. 61
Figure 3.32 Load Cases #6 and #7 for load test ............................................................. 62
Figure 3.33 Midspan deflections during load test: Load Case 1 ..................................... 62
Figure 3.34 Midspan deflections for Load Cases #2 and 3 compared ............................ 63
Figure 3.35 Midspan deflections for Load Cases #4 and 5 compared ............................ 63
Figure 3.36 Midspan deflections for Load Cases #6 and 7 compared ............................ 64
Figure 3.37 Bowed panels increased pier deck stiffness ................................................. 64
Figure 3.38 FRP on June 26, 2001, showing some spots of discoloration ...................... 66
Figure 3.39 Polyurethane protective layer on a panel of the last span flaking off .......... 66
Figure 3.40 Discoloration of FRP and flaking of polyurethane layer &om
Figure 3.41
Figure 4.1
Figure 4.2
Figure 4.3
Figure 4.4
Figure 4.5
Figure 4.6
Figure 4.7
Figure 4.8
Figure 4.9
Cuprinol ....................................................................................................... 67
Cracks in T-45 wearing surface ................................................................... 67
Bridge deck tested (Load Case 1) ................................................................ 70
Test setup for apparent MOE of panels ....................................................... 71
Connections tested ...................................................................................... 74
Threaded rod with six strain gages wired in three half bridge circuits ........ 74
Method of load application for full-scale deck tests ................................... 76
Load Case #1 ............................................................................................... 77
Load cases used in laboratory testing .......................................................... 77
Picture of Load Case #1 ............................................................................... 78
Picture of Load Case #3 ............................................................................... 78
xiv
Figure 4.1 0 Midspan panel deflections for Load Case #1. TSB#2 ................................. 82
Figure 4.1 1 Midspan panel deflections for Load Case #2. TSB#2 ................................. 82
Figure 4.12 Midspan panel deflections for Load Case #3. TSB#2 ................................. 83
Figure 4.13 Midspan panel deflections for Load Case #I. TSB#3 ................................. 83
Figure 4.14 Midspan panel deflections for Load Case #2. TSB#3 ................................. 84
Figure 4.15 Midspan panel deflections for Load Case #3. TSB#3 ................................. 84
Figure 4.16 Initial and final strain in seated beam connections for all TSB tested
in experimental Load Case #1 ..................................................................... 86
Figure 4.17 Initial and final strain in seated beam connections for all TSB tested
in experimental Load Case #3 ..................................................................... 86
Figure 4.18 Change in strain in seated-beam connections for all TSB tested in
experimental Load Case #1 .......................................................................... 87
Figure 4.19 Change in strain in seated-beam connections for all TSB tested in
experimental Load Case #2 ......................................................................... 88
Figure 4.20 Change in strain in seated-beam connections for all TSB tested in
experimental Load Case #3 ........................................................................ 88
Figure 4.21 Change in strain in loose seated-beam connections for all TSB tested
in experimental Load Case #3 ..................................................................... 89
Figure 5.1 Typical longitudinal glulam deck bridge superstructure ............................. 92
Figure 5.2 Finite element model used for longitudinal glulam deck bridge ................. 93
Figure 5.3 ANSYS schematic of finite element model used for longitudinal
....................................................................................... glulam deck bridge 93
Figure 5.4 ANSYS' elements used to model the bridge superstructure ........................ 95
xv

Figure 5.5
Figure 5.6
Figure 5.7
Figure 5.8
Figure 5.9
Figure 5.10
Figure 5.1 1
Figure 5.12
Figure 5.13
Figure 5.14
Figure 5.15
Figure 5.16
Figure 5.17
Figure 5.18
Sources of slip in load-deflection connector curves .................................... 98
Comparison of shear and bending stress in TSB with and without
prestressed connections .............................................................................. 100
Load-deformation curves of connectors (Hale 1978. Funke 1986) ........... 102
Derivation of panel-TSB bearing element stifiess ................................... 104
Simple load distribution scheme used for finite element model ................ 105
Uniform element surface load scheme used for finite element model ...... 105
Convergence of deflections ...................................................................... 107
FEA-predicted midspan panel deflections vs . UMaine experimental
results (Load Case #1. TSB #2. seated-beam connection) ........................ 108
FEA-predicted midspan panel deflections vs . UMaine experimental
results (Load Case #2. TSB #3. seated-beam connection) ........................ 109
FEA-predicted panel deflections vs . UMaine experimental results
(Load Case #3. TSB #I. seated-beam connection) .................................... 109
FEA predicted seated-beam connection forces vs . UMaine
experimental results (Load Case #1. TSB #2) ........................................... 111
FEA predicted seated-beam connection forces vs . UMaine
experimental results (Load Case #2. TSB #3) ........................................ 111
FEA predicted seated-bean1 connection forces vs . UMaine
experimental results (Load Case #3. TSB #1) ........................................ 112
FEA-predicted rnidspan panel deflections vs . ISU experimental
results (Funke#l) ....................................................................................... 113
xvi
Figure 5.19
Figure 5.20
Figure 6.1
Figure 6.2
Figure 6.3
Figure 6.4
Figure 6.5
Figure 6.6
Figure 6.7
Figure 6.8
Figure 6.9
Figure 6.10
FEA-predicted TSB bending stress vs. ISU experimental results
(Funke#l) ................................................................................................. 113
FEA-predicted midspan panel stress vs. ISU experimental results
(Funke# 1). . . . . . . . . . . . . .. . . . . . . . . . . . . . . . . . . . . . . . . . . . .. . . . . . . . . . . . . . . . . . . . . . . . . . . . . . . . .. . . . . . . . . .. . . . . . . . . . . . . 1 14
TSB configurations and properties used in parametric study (See
Appendix E, Table E. 1 for details.) ........................................................... 1 18
Placement of AASHTO HS20-44 tire footprints on various width
panels when loading panel edges .............................................................. 120
HS20-44 live load truck (Courtesy of AASHTO 1996, Figure
3.7.7A) ....................................................................................................... 123
Bridge configuration and loading for Analyses #1-4 .................... ............. 124
Panel and TSB deflections for Analyses #1-4 showing sensitivity to
connection type . . . . . .. .. . .. . . . . . . . . .. . . . . . . . . . . . . . . . . . . . . . . . . . . . . . . . . . . . . . . . . . . . . . . . . . . . . . . . . . . . . . . 126
Connection and bearing forces between the panels and TSB for
Analyses # 1-4 showing sensitivity to connection type . . . . .. .. . . . ... .. . . . . . .. . . . . . . . 126
TSB shear diagrams for Analyses #1-4 showing sensitivity to panel-
to-TSB connection type ............. ............................................ .................... 128
TSB bending moments diagrams for Analyses #1-4 showing
sensitivity to connection type .................................................................... 128
Load-slip curves for nonlinear (Hale 1978) and linear panel-to-TSB
connection models ..... ....................... ...... ............................................. . 13 1
TSB bending moments diagrams for Analyses #l b-4b showing
sensitivity to connection type (linear connection models) ......................... 13 1
xvii
Figure 6.1 1 Relative panel displacement sensitivity to connection type (nonlinear
.................................................................................... connection models) 133
Figure 6.12 Plan view of Load Cases #l . #19. and #49 ................................................ 136
Figure 6.1 3 TSB bending moments diagrams for Analyses #3 5 and 5 1 -53
showing sensitivity to TSB MOE .............................................................. 139
Figure 6.14 Critical load cases and TSB shear and bending utilization ratios for
42-inch wide panels (See Table 6.11 and Appendix E for analysis
....................................................................................................... details.) 146
Figure 6.15 Critical load cases and TSB shear and bending utilization ratios for
48-inch wide panels (See Table 6.12 and ~ p ~ e n d i x E for analysis
details.) ....................................................................................................... 149
Figure 6.16 Critical load cases and TSB shear and bending utilization ratios for
54-inch wide panels (See Table 6.13 and Appendix E for analysis
...................................................................................................... details.). 151
Figure 6.17 Critical load cases and RPD utilization ratios for bridge
configurations and loading locations (See Table 6.14 and Appendix
E for analysis details.) ................................................................................ 153
. ...................................... Figure B 1 Truck footprint and wheel loads for pier load test 182
Figure B.2 Panel deflections during load test: Load Case 1 ......................................... 184
Figure B.3 Panel deflections during load test: Load Cases 2 & 3 ................................ 184
Figure B.4 Panel deflections during load test: Load Cases 4 & 5 ................................ 185
Figure B.5 Panel deflections during load test: Load Cases 6 & 7 ................................ 185
. Figure C 1 Measured midspan panel deflections, Load Case # 1, TSB# 1 ..................... 190
xviii
Figure C.2 Measured midspan panel deflections. Load Case #1. TSB#2 ..................... 190
Figure C.3 Measured midspan panel deflections. Load Case #1. TSB#3 ..................... 191
Figure C.4 Measured strain in seated-beam connections. Load Case #1 ...................... 192
Figure C.5 Measured strain in seated-beam connections. Load Case #2 ...................... 192
Figure C.6 Measured strain in seated-beam connections. Load Case #3 ...................... 193
Figure D . 1 Deflection correlation. Load Case #l. TSB #2. Thru-Bolt Conn ............... 194
Figure D.2 Deflection correlation. Load Case #l. TSB #3. Thru-Bolt Conn ............... 195
Figure D.3 Deflection correlation. Load Case #l. TSB #3. Seated-Beam Conn .......... 195
Figure D.4 Deflection correlation. Load Case #2. TSB #3. Thru-Bolt Conn ............... 196
Figure D.5 Deflection correlation. Load Case #2b. TSB #2. Thru-Bolt Conn ............. 196
Figure D.6 Deflection correlation. Load Case #2b. TSB #2. Seated-Beam Conn ........ 197
Figure D.7 Deflection correlation. Load Case #3a. TSB #l. Thru-Bolt Conn .............. 197
Figure D.8 Deflection correlation. Load Case #3a. TSB #2. Thru-Bolt Conn .............. 198
Figure D.9 Deflection correlation. Load Case #3a. TSB #2. Seated-Beam Conn ........ 198
Figure D.10 Deflection correlation. Load Case #3a. TSB #3. Thru-Bolt Conn .............. 199
Figure D. l l Deflection correlation. Load Case #3a. TSB #3. Seated-Beam Conn ........ 199
Figure D.12 Axial forces correlation. Load Case #l. TSB #l. Seated-Beam Conn ....... 200
Figure D.13 Axial forces correlation. Load Case #1. TSB #3. Seated-Beam Conn ....... 200
Figure D.14 Axial forces correlation. Load Case #2b. TSB #2. Seated-Beam
Conn ............................................................................................................ 201
Figure D . 15 Axial forces correlation. Load Case #3a. TSB #2. Seated-Beam
Conn ............................................................................................................ 201
xix
Figure D.16 Axial forces correlation. Load Case #3a. TSB #3. Seated-Beam
Conn ............................................................................................................ 202
Figure E.l Key to figures of Load Cases ...................................................................... 204
.......................................................... Figure E.2 Load cases for 42-inch panel bridges 208
................................................................ Figure E.3 Load cases for 48-inch bridges 2 1
.................................................................. Figure E.4 Load cases for 54-inch bridges -214
Chapter 1
INTRODUCTION
1.1 General
This chapter provides an overview of this thesis, starting with the needs and
objectives of the study. Following this, background information is given on reinforced
longitudinal glued-laminated (glulam) deck bridges.
1.2 Need for Research in Longitudinal Glulam Deck Bridges
Longitudinal glulam deck bridges consist of vertically-laminated glulam panels
spanning fi-om support to support and joined below the deck by Transverse Stiffener
Beams (TSB). No girders are necessary for the bridge.
Although longitudinal glulam deck bridges have been designed and built since the
late 1970s, the below-deck TSB design is empirical, and its behavior is not well
understood. Published work on this bridge system has consistently called on further
research into TSB behavior (Sanders et al. 1985; Funke 1986; Ritter 1990; Hajdu 1994).
Additionally, with the large number of short-span bridges that are in need of replacement
(Bhide 2001), economically-feasible options should be fully investigated. Longitudinal
deck bridges are often a viable superstructure replacement solution for short-span bridges
when the abutments are in good condition or for short-span bridges with low-profile
requirements. It has been also shown (Dagher et al. 1998b) that reinforcing glulam
beams with a Fiber-Reinforced Polymer (FRP) can add strength and stiffness to the beam
while keeping the system economically competitive. To build on this work, research is
needed on the benefits of reinforcing glulam panels with FRP.
1.3 Objective and Workplan
This study's objectives are two-fold: (1) to understand the behavior and benefits
of FRP-reinforced, vertically-laminated glulam deck bridges and (2) to develop a design
approach for the TSB.
The workplan under the first objective included (1) developing a methodology of
reinforcing glulam panels with an FRP using a Phenol Resorcinol Formaldehyde (PRF)
matrix, (2) evaluating the environmental durability of these FRP-glulam panels in a
marine environment, and (3) evaluating the benefits of longitudinal FRP-glulam panel
bridges, as compared to conventional materials including economics, durability, and ease
of construction.
The workplan under the second objective included (1) developing a Finite
Element Model (FEM) that accurately predicts the behavior of these bridges, (2)
validating the model through laboratory testing at The University of Maine (UMaine) and
through published test results, (3) determining adequacy of current TSB design
methodology of the American Association of State Highway and Transportation Officials
(AASHTO) (AASHTO 1996) through analysis of "worst-case" scenarios for these
bridges systems, (4) developing improved design criteria for the below-deck TSB, and (5)
making any necessary recommendations for changes to AASHTO design methodology
for TSB. Results are expected to facilitate increased use of both FRP-reinforced and
conventional longitudinal glulam deck bridges.

1.4 Overview of FRP-Reinforcing of Glulam
FRP can be used to reinforce glulam beams in a manner similar to the way that
steel reinforces concrete. FRP can be used to replace high-quality tension laminations
that may be difficult or expensive to source. With sufficient tensile strength, the more
ductile compressive failure of the wood can control failure modes. Without
reinforcement, a horizontally-laminated beam will experience a brittle failure. Although
vertically-laminated panels typically have more ductile behavior, they too can benefit
from FRP-reinforcing.
FRP-reinforcing consists of adhering FRP to the glulam panel in such a way as to
ensure that the wood and the FRP act as a composite section. This is typically done
through an adhesive between a preconsolidated FRP and the glulam or by using the
matrix of the FRP as the adhesive to the wood substrate. The latter method was used for
this study, as described in Chapter 3. When reinforcing panels, the amount of reinforcing
is measured by the ratio of the cross-sectional area of FRP to the cross-sectional area of
wood. The panels in this study have a 1% reinforcement ratio. FRP was applied to the
middle two-thirds of the tension-side (bottom) of the panels (Figure 1.1). A summary of
published benefits of FRP-glulam and environmental durability of FRP-glulam can be
found in Chapter 2.
1.5 Overview of Longitudinal Glulam Deck Bridges
1.5.1 Description of System
Longitudinal glulam deck bridges were initially developed by the Weyerhaeuser
Company in 1977 (Funke 1986). These stringer-less bridges consist of glulam panels that
3
are placed parallel to the direction of traffic. Below the panels, a stiffener beam is placed
transverse to traffic across the entire width of the bridge at longitudinal spacing of eight
to ten feet (Figure 1.2). The TSB are the only means for distribution of load between the
panels; no other means - dowels or other connectors - are provided.
The glulam deck panels are typically 48-inches wide but may vary from 42-54
inches wide. They are economical for bridges with spans of 16-35 feet designed for
AASHTO HS20-44 live loading. The panels are vertically-laminated glulam loaded
parallel to the wide faces of the laminations with panel thickness typically varying £?om
approximately 5 to 14.25 inches. Panels with thickness of 12 inches or more are made of
multiple-piece laminations that either must be edge-glued (Figure 1.3) or allowable
horizontal shear strength is reduced approximately 50 percent (AASHTO 1996, Table
13.5.3B).
The TSB is usually a horizontally-laminated glulam beam, but other materials can
be used, such as FRP, steel, and aluminum. Dimensions of the TSB are typically in the
range of four to seven inches, but no design guidance on dimensions, area, or an aspect
ratio (widthldepth) currently exists. The only current specification for the TSB is a
minimum stiffness factor (Modulus Of Elasticity (MOE or E) multiplied by the beam's
moment of Inertia (I): EI = MOE*I) of 80,000 kip-in2 (AASHTO 1996). This stiffness
factor would make it appear that the optimum TSB would be oriented for strong-axis
bending, with the depth greater than the width (an aspect ratio less than 1.0).
The TSB is connected to the panels through connection hardware. The
connection systems most commonly used are shown in Figure 1.4. Timber through-bolts
and aluminum brackets are the most common connectors used (Funke 1986). However,
4
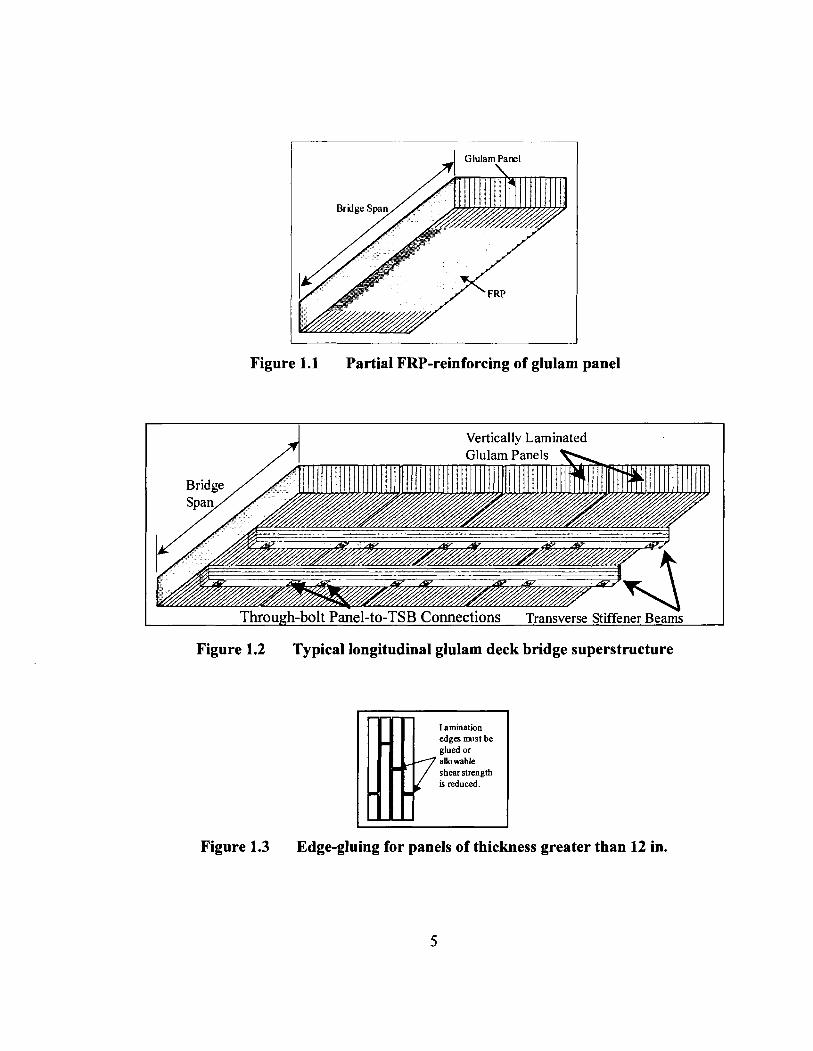
Figure 1.1 Partial FRP-reinforcing of glulam panel
Vertically Laminated
Through-bolt ~ G e l - t o - ~ s ~ Connections Transverse Stiffener ~ e a ~ s
Figure 1.2 Typical longitudinal glulam deck bridge superstructure
Lamination edges must be glued or aUowable shear strength is reduced.
Figure 1.3 Edge-gluing for panels of thickness greater than 12 in.
these connections may induce stresses in the system through restriction of movement
during the inevitable hygrothermal cycling of the glulam components. As the wood's
moisture content changes, shrinkage and expansion in the radial and tangential-to-grain
directions can be comparatively considerable, but dimensional change in the longitudinal-
to-grain direction is essentially negligible. As shown in Figure 1.5, as moisture content
increases, the panels undergo radial and tangential expansion in the bridge's transverse
direction, but the TSB has greater dimensional stability and does not. The connection
hardware, if through-bolts or aluminum brackets are used, can restrict this relative
movement, damaging the connection or the wood around it. Glulam treated with oil-
borne preservatives has more dimensional stability, and this differential expansion is not
as likely to become critical with them; however, in glulam with water-borne preservatives
and bridges that may experience extreme moisture content variability, consideration
should be given to the possibility of differential relative expansion causing additional
stress and bending in the connection. A seated-beam (steel-plate) connection (Figure
1.4b) alleviates this condition by allowing relative movement between the panels and the
TSB.
1.5.2 Design of System
Current design criteria and methods were developed after extensive testing and
modeling had been performed at Iowa State University (ISU), as reported in Chapter 2.
The AASHTO Standard Specification design methodology (AASHTO 1996) for
longitudinal decks is described below and compared with design recommendations by
Ritter (1990) and the American Institute for Timber Construction (AITC) (1994). A

Glulam TSB
(a) Aluminum Bracket C o m c t o e
(b) Seated-Beam or Stee LP late (c) Thru-Bolt
(d) C-clips with Steel I-beam TSB (e) Thru-Bolt with Steel Chamel TSB
Figure 1.4 Types of common panel-to-TSB connections (Ritter 1990)
Connection Immediately After Installation
Connection After Differentia1 Expansion of Wood (Exaggerated)
- - - - -
Figure 1.5 Thru-bolt connection with moisture-induced expansion of the glulam
MathCad (2000) worksheet that follows the AASHTO design requirement was developed
for use in this thesis and is presented in Appendix A as an example of the current design
methodology.
The primary design component of the longitudinal glulam deck bridge
superstructure is the deck panel. As with any bridge, the bridge span, width, number of
lanes, and AASHTO design live load is initially determined. Wood species is typically
predetermined, as well. Ritter recommends using a douglas fir glulam of Combination
Symbol 2 or a Southern Pine glulam of Combination Symbol 47 (SP47) for an
economical design. The SP47 layup material properties are used in the parametric study
reported in Chapter 6. The panel is assumed to act as a simply-supported beam canying
its dead load and a fraction of the live load from a single wheel line of the design vehicle.
The bending wheel load fraction (WLF) is a function of the number of lanes, panel width,
and bridge span (see Appendix A for formula). In current AASHTO, a different WLF,
based on panel width, is used for bearing and shear close to the reactions. As opposed to
AASHTO and due to publication prior to the AASHTO WFL change, fitter's Timber
Bridge Manual does not use a separate WLF for shear and bearing (Ritter 1990). The
panel is assunled to be loaded under wet-use conditions. AASHTO specifications do not
give an allowable live load deflection but recommend W500. Ritter uses W360 as an
allowable based on the ISU studies that showed that, with this allowable, Relative Panel
Displacement (RPD) would not significantly exceed 0.10 inches. (In Funke's
experiments at ISU, maximum measured RPD was 0.26 in. The design (using a WLF of
0.772) predicted a Ll330 deflection (1986)). Keeping RPD below 0.1 inches should
prevent cracking of the asphalt wearing surfaces at longitudinal panel joints (Ritter 1990).
AITC uses an Ll300 allowable for live load deflection.
Once the deck panels have been designed, a stiffener beam is selected. The
stiffener must have a stiffness factor (EI) greater than or equal to 80,000 kip-in2. Ritter
recommends a maximum stihess factor of twice the AASHTO minimum value, but
AASHTO and AITC do not set or recommend a maximum.
The only other requirement with regard to the TSB is maximum spacing.
AASHTO requires a TSB at midspan and maximum TSB spacing of 10 feet. It also
states "stiffener spacing required will depend upon the spacing needed in order to prevent
differential panel movement" (AASHTO 1996, Section 3.25.3.4) but does not give any
guidance on correlations between TSB spacing and differential panel movement. Ritter
concurs with AITC's recommendation of maximum TSB spacing of 8 feet. AITC does
not require a TSB at midspan.
1.6 Overview of Thesis
This thesis is divided into seven chapters and five appendices. Chapter 2 is a
review of literature relevant to this study. Chapter 3 describes the municipal pier built in
Milbridge, Maine, a seven-span, longitudinal FRP-glulam deck bridge built using the
technology developed in this study, and the results of the field load-testing and
monitoring accomplished to evaluate performance of the pier. Chapter 3 also gives in-
depth description of the FRP and the reinforcing methodology used in this study.
Chapter 4 describes the experimental laboratory testing done at UMaine with a full-scale
longitudinal FRP-glulam deck bridge and reports the results. Chapter 5 describes the
finite element model developed in this study for longitudinal deck bridges and its
validation by experimental testing. Chapter 6 reports the results of the parametric study
performed using the finite element model described in Chapter 5 to evaluate stress in the
TSB. Chapter 7 gives the conclusions and recommendations of this study. Appendix A
contains the Mathcad (Mathcad 2000) worksheet for longitudinal glulam deck bridge
design for the Milbridge Pier. Appendix B contains results of the Milbridge Pier load
test. Appendix C contains results of the laboratory tests perfonned at UMaine. Appendix
D presents charts and graphs of the FEM validation by experimental results. Appendix E
contains charts and tables relating to the parametric study accomplished in this thesis and
its results.
Chapter 2
LITERATURE REVIEW
2.1 Introduction
This chapter is a review of literature relevant to this study. The objectives of this
chapter are (1) to provide an overview of FRP-glulam research as it pertains to this study,
(2) to provide detailed summaries of research done on longitudinal glulanl deck bridges
and their components, and (3) to summarize conclusions and recommendations from
previous studies of these bridge systems.
2.2 FRP-Glulam
FRP-reinforced glulam can have significant advantages over unreinforced glulam.
It has been shown that FRP-glulam can be cost-competitive with conventional materials
(Dagher et al. 2001). The mechanical advantages have also been repeatedly shown
through laboratory testing, demonstration projects, and analytical studies (Dagher et al.
1996, Dagher et al. 1998a), but the environmental durability of FRP is still an area of
concern.
2.2.1 Mechanical Properties
FRP-glulam beams and panels have been shown to have gains in both bending
strength and stifhess over conventional glulam. Previous studies at The University of
Maine have demonstrated that GFRP tension reinforcement ratios of 2-3% can increase

the allowable bending strength of glulanl beams by over 100% and stiffness by 10-1 5%
(Dagher et al. 1998b).
Research on FRP-glulam sandwich panels (Figure 2.1) at UMaine has shown that
reinforcement of panels can improve failure modes, bending strength, and stiffness (Xu
2001). The E-glass reinforced panels had more ductile failure modes than unreinforced
panels. FRP reinforcement on top and bottom of a glulam panel with a 2.1%
reinforcement ratio (top and bottom reinforcing included) increased the composite
panel's ultimate load capacity by 47%. The reinforced glulam panels carried a load at
deflection service limit 24% greater than unreinforced panels. Even with these benefits,
the tensile reinforcement is under-utilized with extreme fiber strain in the composite
panel at failure only 30% of the ultimate tensile strain of the FRP (Xu 2001).
Figure 2.1 FRP-glulam sandwich panel configuration
2.2.2 Environmental Durability of FRPs
FRP performance is a function of the matrix (resin) type, fiber type, fiber
orientation and lay-up, fillers, additives, manufacturing processes, microstructure,
architecture, geometry, and many other factors. The number of factors that can affect
performance makes quantitative analysis of the effect of each very difficult. To add to
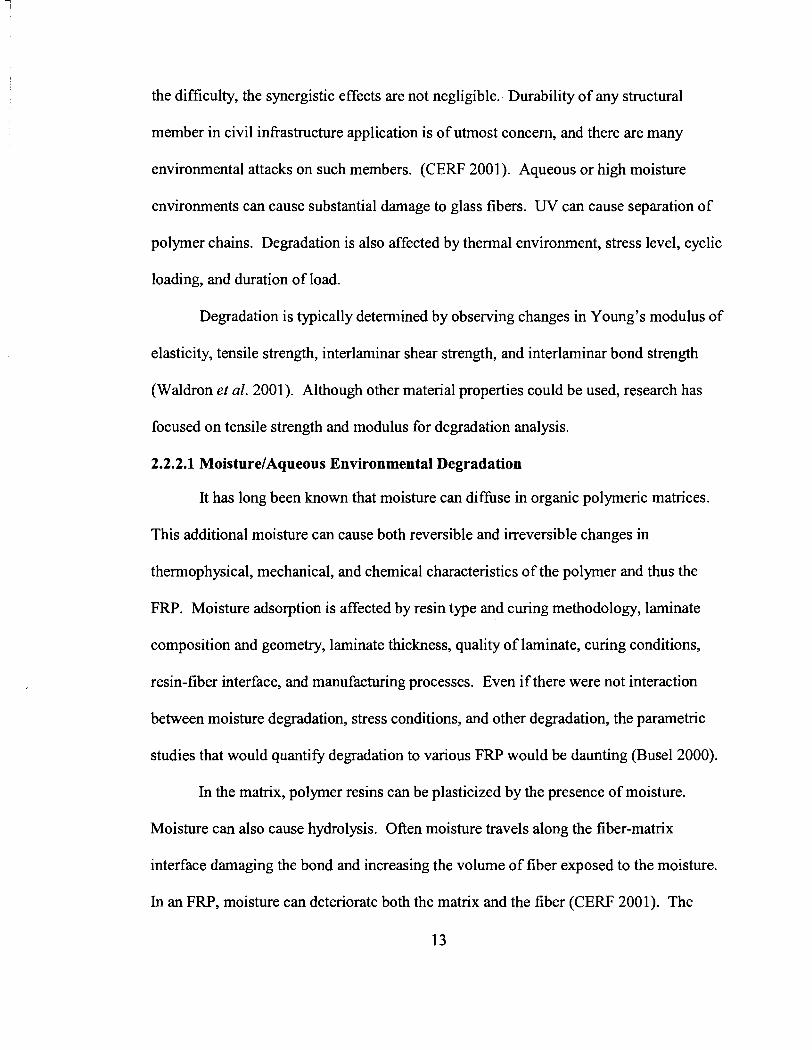
the difficulty, the synergistic effects are not negligible. Durability of any structural
member in civil infrastructure application is of utmost concern, and there are many
environmental attacks on such members. (CERF 2001). Aqueous or high moisture
environments can cause substantial damage to glass fibers. UV can cause separation of
polymer chains. Degradation is also affected by thermal environment, stress level, cyclic
loading, and duration of load.
Degradation is typically determined by observing changes in Young's modulus of
elasticity, tensile strength, interlaminar shear strength, and interlaminar bond strength
(Waldron et al. 2001). Although other material properties could be used, research has
focused on tensile strength and modulus for degradation analysis.
2.2.2.1 Moisture/Aqueous Environmental Degradation
It has long been known that moisture can difhse in organic polymeric matrices.
This additional moisture can cause both reversible and irreversible changes in
thermophysical, mechanical, and chemical characteristics of the polymer and thus the
FRP. Moisture adsorption is affected by resin type and curing methodology, laminate
composition and geometry, laminate thickness, quality of laminate, curing conditions,
resin-fiber interface, and manufacturing processes. Even if there were not interaction
between moisture degradation, stress conditions, and other degradation, the parametric
studies that would quantifL degradation to various FRP would be daunting (Busel 2000).
In the matrix, polymer resins can be plasticized by the presence of moisture.
Moisture can also cause hydrolysis. Often moisture travels along the fiber-matrix
interface damaging the bond and increasing the volunle of fiber exposed to the moisture.
In an FRP, moisture can deteriorate both the matrix and the fiber (CERF 2001). The
13
fibers are even more susceptible than the matrix to moisture-induced degradation. E-
glass is the most susceptible to moisture and alkalinity degradation. Hydrogen ions
replace sodium ions on the glass surface through ion exchange. The glass surface at the
fiber-matrix interface wants to shrink but is restricted. This causes tension on the glass
surface and eventually tensile failure of the surface (Agarwal and Broutman 1990).
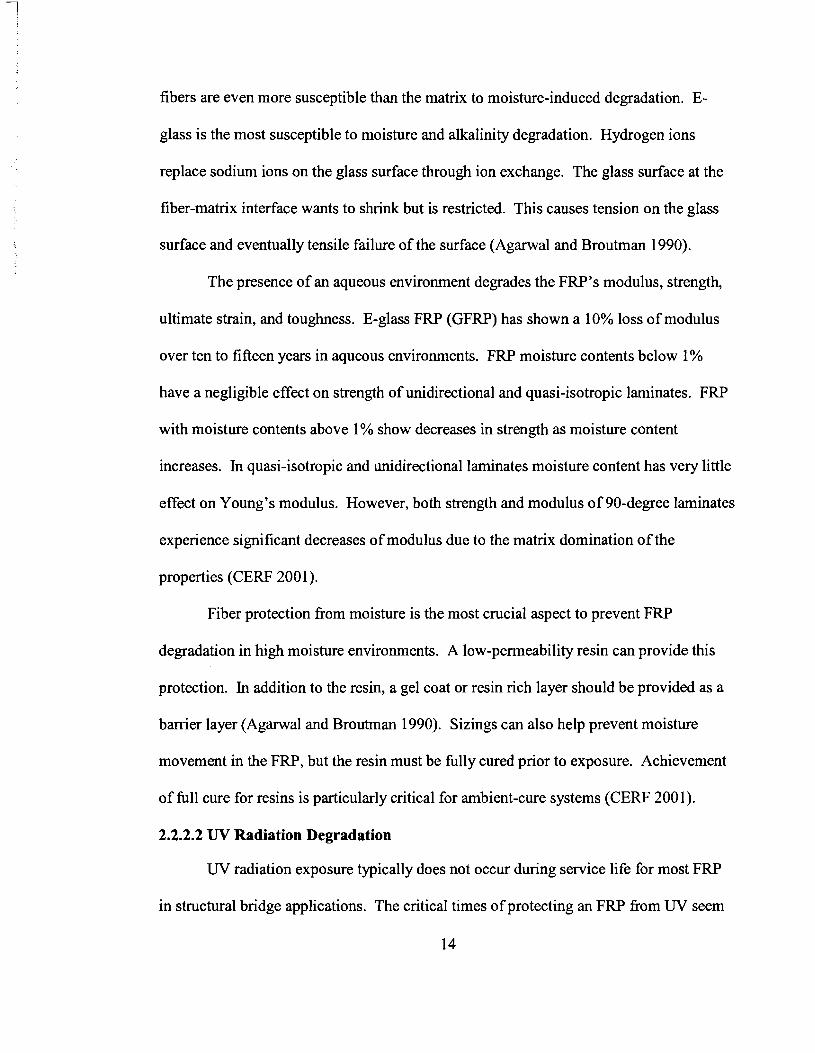
The presence of an aqueous environment degrades the FRP's modulus, strength,
ultimate strain, and toughness. E-glass FRP (GFRP) has shown a 10% loss of modulus
over ten to fifteen years in aqueous environments. FRP moisture contents below 1%
have a negligible effect on strength of unidirectional and quasi-isotropic laminates. FRP
with moisture contents above 1% show decreases in strength as moisture content
increases. In quasi-isotropic and unidirectional laminates moisture content has very little
effect on Young's modulus. However, both strength and modulus of 90-degree laminates
experience significant decreases of modulus due to the matrix domination of the
properties (CERF 2001).
Fiber protection from moisture is the most crucial aspect to prevent FRP
degradation in high moisture environments. A low-permeability resin can provide this
protection. In addition to the resin, a gel coat or resin rich layer should be provided as a
barrier layer (Agarwal and Broutrnan 1990). Sizings can also help prevent moisture
movement in the FRP, but the resin must be fully cured prior to exposure. Achievement
of full cure for resins is particularly critical for ambient-cure systems (CERF 2001).
2.2.2.2 UV Radiation Degradation
W radiation exposure typically does not occur during service life for most FRP
in structural bridge applications. The critical times of protecting an FRP from W seem
14
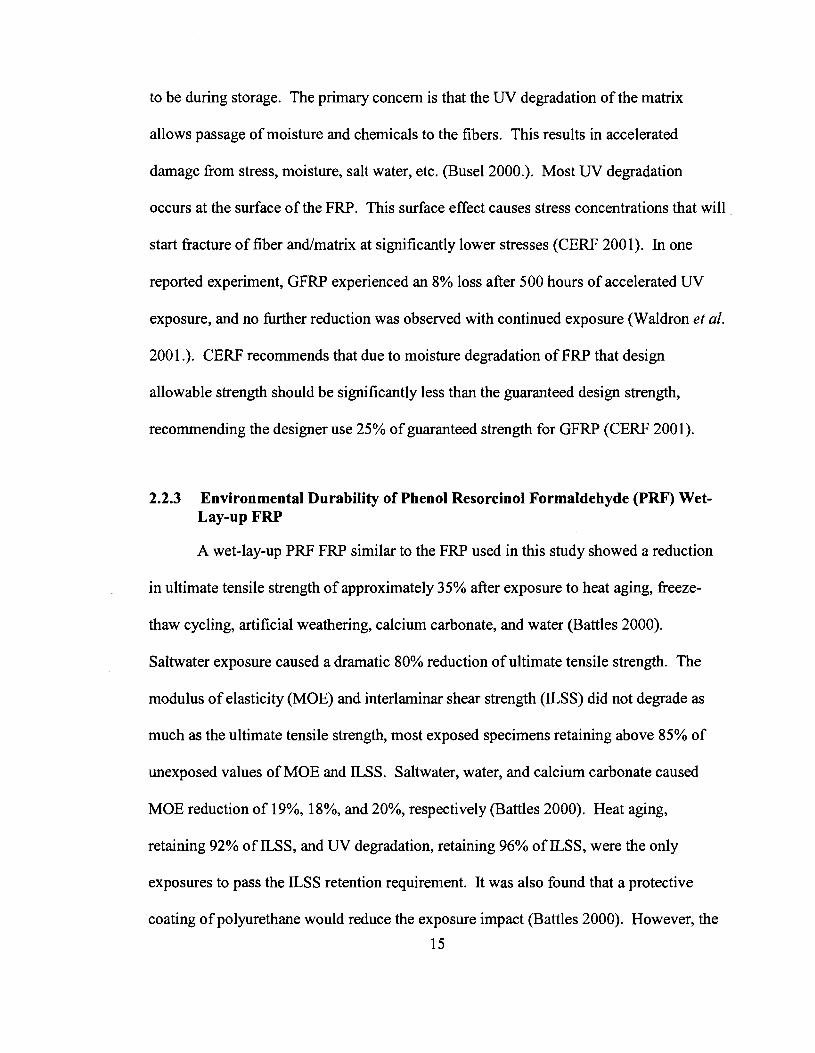
to be during storage. The primary concern is that the UV degradation of the matrix
allows passage of moisture and chemicals to the fibers. This results in accelerated
damage fiom stress, moisture, salt water, etc. (Busel 2000.). Most UV degradation
occurs at the surface of the FRP. This surface effect causes stress concentrations that will
start fracture of fiber andlmatrix at significantly lower stresses (CERF 200 1). In one
reported experiment, GFRP experienced an 8% loss after 500 hours of accelerated UV
exposure, and no M e r reduction was observed with continued exposure (Waldron ef al.
200 1 .). CERF recommends that due to moisture degradation of FRP that design
allowable strength should be significantly less than the guaranteed design strength,
recommending the designer use 25% of guaranteed strength for GFRP (CERF 200 1).
2.2.3 Environmental Durability of Phenol Resorcinol Formaldehyde (PRF) Wet- Lay-up FRP
A wet-lay-up PRF FRP similar to the FRP used in this study showed a reduction
in ultimate tensile strength of approximately 35% after exposure to heat aging, fieeze-
thaw cycling, artificial weathering, calcium carbonate, and water (Battles 2000).
Saltwater exposure caused a dramatic 80% reduction of ultimate tensile strength. The
modulus of elasticity (MOE) and interlaminar shear strength (ILSS) did not degrade as
much as the ultimate tensile strength, most exposed specimens retaining above 85% of
unexposed values of MOE and ILSS. Saltwater, water, and calcium carbonate caused
MOE reduction of 19%, 18%, and 20%, respectively (Battles 2000). Heat aging,
retaining 92% of ILSS, and UV degradation, retaining 96% of ILSS, were the only
exposures to pass the ILSS retention requirement. It was also found that a protective
coating of polyurethane would reduce the exposure impact (Battles 2000). However, the
15
benefit of the protective coating was not explicitly defined through experimental results
in the report.
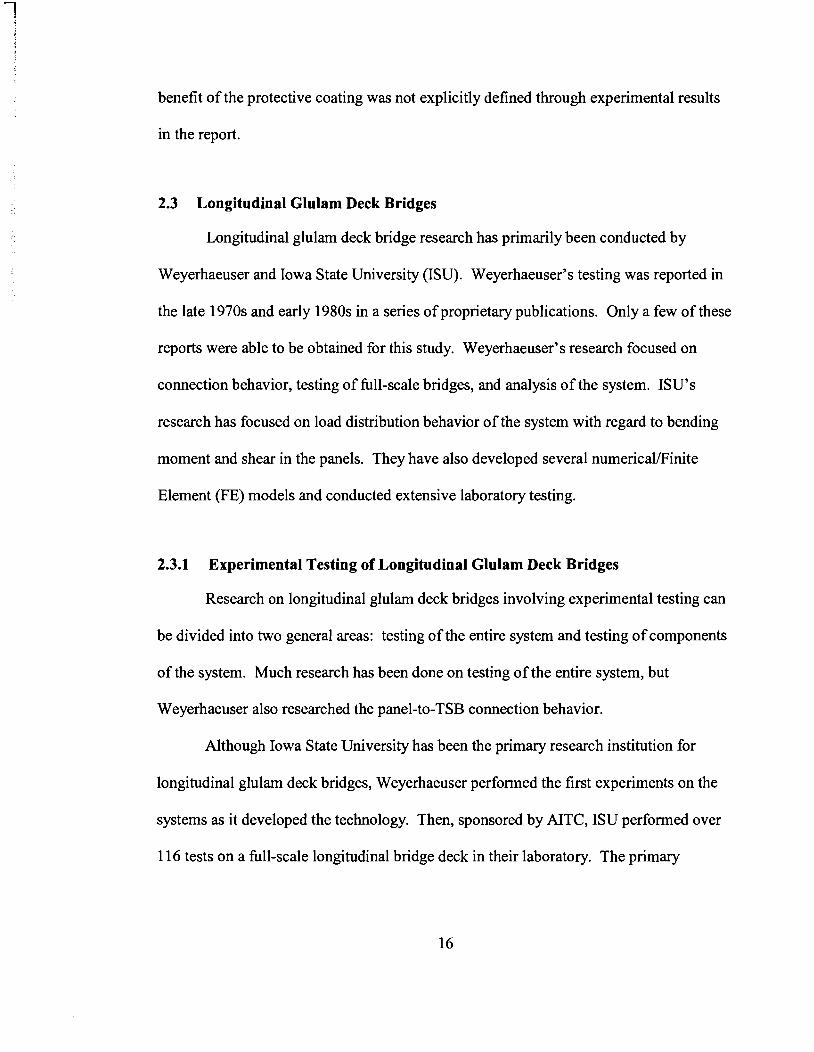
2.3 Longitudinal Glulam Deck Bridges
Longitudinal glulam deck bridge research has primarily been conducted by
Weyerhaeuser and Iowa State University (ISU). Weyerhaeuser's testing was reported in
the late 1970s and early 1980s in a series of proprietary publications. Only a few of these
reports were able to be obtained for this study. Weyerhaeuser's research focused on
connection behavior, testing of full-scale bridges, and analysis of the system. ISU's
research has focused on load distribution behavior of the system with regard to bending
moment and shear in the panels. They have also developed several nurnericaVFinite
Element (FE) models and conducted extensive laboratory testing.
2.3.1 Experimental Testing of Longitudinal Glulam Deck Bridges
Research on longitudinal glulam deck bridges involving experimental testing can
be divided into two general areas: testing of the entire system and testing of components
of the system. Much research has been done on testing of the entire system, but
Weyerhaeuser also researched the panel-to-TSB connection behavior.
Although Iowa State University has been the primary research institution for
longitudinal glulam deck bridges, Weyerhaeuser perfonned the first experiments on the
systems as it developed the technology. Then, sponsored by AITC, ISU perfonned over
11 6 tests on a full-scale longitudinal bridge deck in their laboratory. The primary
purpose of this testing and a parametric study done using FE models was to develop
improved transverse load distribution criteria for the deck panels (Funke 1986).
2.3.1.1 Weyerhaeuser's Experiments
2.3.1.1.1 Bridge Tests
As reported by Funke (1986), Hale tested a 72-foot long, 3-span continuous
longitudinal glulam deck bridge consisting of two panels under static loading. In 1979,
he tested a 24-foot long, single span bridge constructed of four 48-inch wide panels. In
the single span bridge tests, Hale varied stiffener beam size, spacing and material as well
as connection hardware. Hale found that seated-beam, through-bolt, and C-clip
connections limited relative panel displacements better than aluminum bracket
connections, but did not address stiffener beam behavior.
2.3.1.1.2 Connection Tests
Hale performed another series tests to determine the load-slip curves of panel-to-
TSB connectors. He tested the load-deflection behavior of timber bolts of '/2", '/8)', 3/411,
and 7/8" diameters in bearing on douglas fir glulam. The bolts had bearing areas of 1.77,
3.76,5.41,7.37, and 16 in2 respectively. The slip measured was the deflection between
the head of the timber bolt and the surrounding wood, taking only the bearing of the
wood under the bolt head into consideration. He also tested seated-beamlsteel-plate,
aluminum bracket, and C-clip connections. The seated-beam connection used a glulam
stiffener and a )/a' x 4" steel plate with two '/<-diameter timber bolts. The aluminum
bracket connections used a glulam stiffener and two standard aluminum brackets with
two '/*"-diameter timber bolts. The glulam stiffener was constructed of douglas fir and
was either 5.125-inches wide by 9-inches deep or 6.75-inches wide by 9-inches deep.

Hale did not indicate that the stiffener size affected the load-deflection curves of the tests.
The C-clip connection used a steel beam and two ?4" or 5/8"-diameter timber bolts. Hale
did not find a significant difference between the bolt diameters tested with the C-clip
connection. The glulam representing the deck panel was an 8.75-inch thick douglas fir
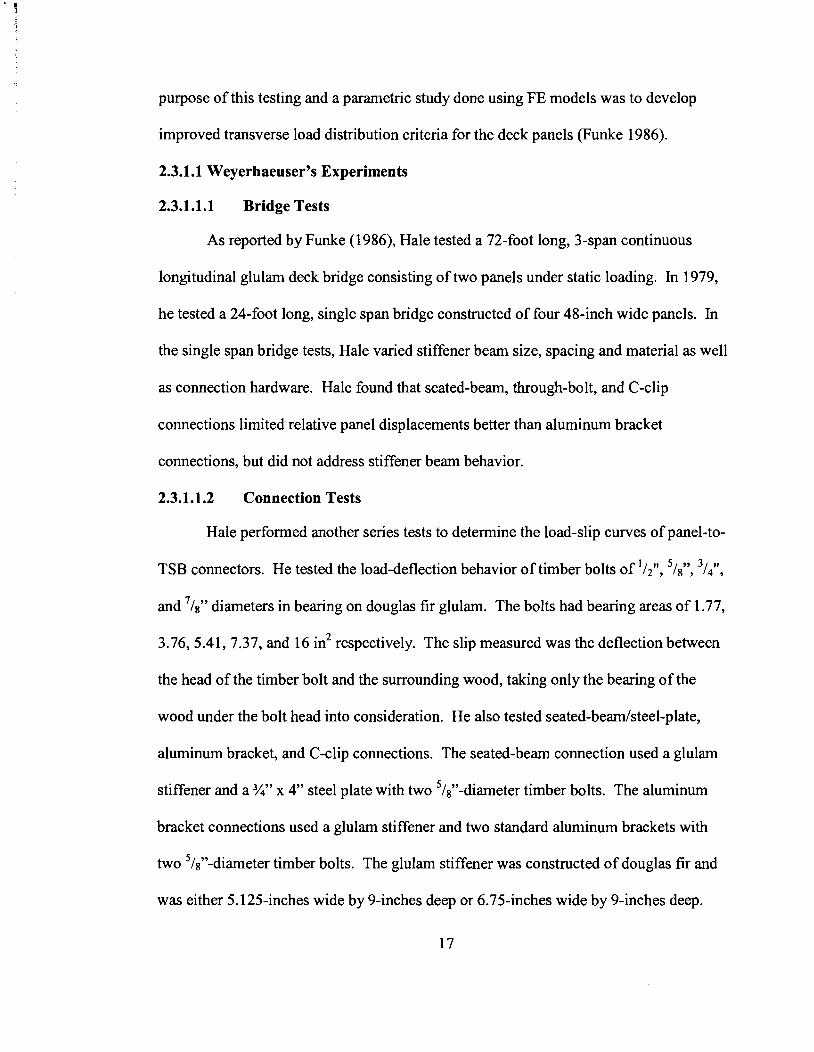
glulam. The connection tests measured the vertical deformation of the entire connection
system. Figure 2.2 shows the components of the measured vertical deformation (Hale
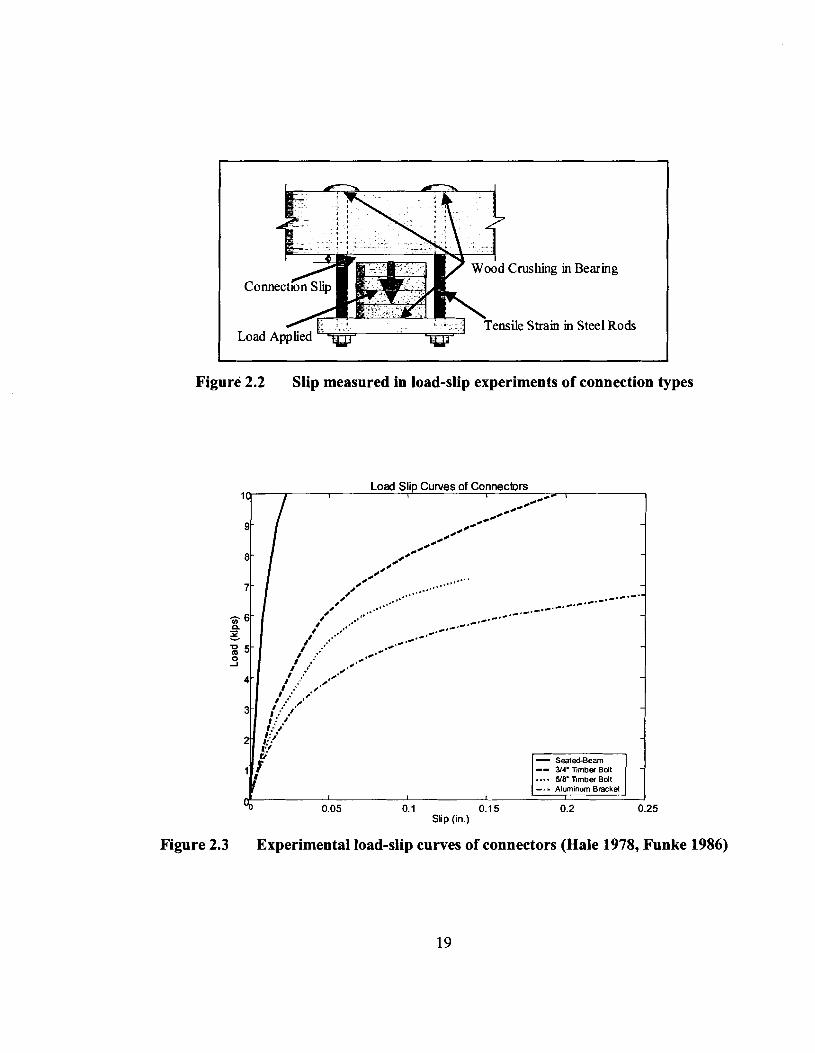
1978). Hale found that the seated-beam provided the stiffest connection and the
aluminum brackets the least stiff. The load-deflection curves determined by Hale are
found in Figure 2.3. Hale also found that aluminum bracket connections tend to split the
stiffeners when overloaded (Hale 1978).
2.3.1.2 Laboratory Tests Performed at Iowa State University (ISU)
ISU performed extensive testing and research, their work is the basis for most of
what is published on longitudinal glulam deck bridges. Their work is presented in more
detail than would typically be found in a literature review because of its influence on the
FE model developed in this study, its use in that model's validation, and its agreement
with the findings of the parametric study reported in this thesis. In the analysis of the
testing, ISU used the then-current publications of wood allowable stresses. In reviewing
the literature here, the older allowable stress values have been kept for consistency,
regardless of current allowable wood stresses.
lshing in
Stram in
Bearing
Steel Rods
Figure 2.2 Slip measured in load-slip experiments of connection types
Figure 2.3 Experimental load-slip curves of connectors (Hale 1978, Funke 1986)
2.3.1.2.1 Description of Experiments
ISU ran 1 16 experiments to establish and validate the design criteria for
longitudinal glulam deck bridges. The testing at ISU used three bridge widths, one to
three stiffeners, two different connection systems, and various load cases. Three tests of
the 1 16 will be discussed in detail because of the failure of the TSB that occurred during
the tests. This failure supports the concern of the TSB being overstressed in some bridge
configurations and loadings. So that they can be easily referenced later in this thesis, the
tests will be designated by the ISU author and his reference system for the test. These
three tests are Funke#6 and Funke#3 1, in both of which the TSB failed by splitting at a
connection before the bridge was loaded to design, and Funke#78, in which the TSB
experienced the highest measured bending strain (Funke 1986).
For all the testing performed by Funke, a 26-foot span test bridge was constructed
fiom four to six panels, creating bridge widths of 16 to 24 feet. The douglas fir panels
were 27-feet long, 48-inches wide, and 10.75-inches thick. The stiffener beams were also
douglas fir and were 4.5-inches deep by 6.75-inches wide by 24-feet long. The two
different connectors used during testing were %-inch diameter timber through-bolts and
aluminum brackets. Consistent with standard procedure, each panel had two connections
per stiffener beam. (Connections for longitudinal glulam deck bridges are typically
spaced at stiffener beam locations six inches from panel edges.) Through-bolts
connections need a slightly oversized hole in the TSB, and the aluminum bracket
connections require a groove (1 in. x 1 in. x 7 in.) cut into each side of the TSB. The
testing used AASHTO HS20-44 loading with one or two trucks on the bridge and with
each truck having the possibility of one or two axles on the bridge. Further details on the
20
load cases tested are given in Chapter 5 to show validation of the finite element model
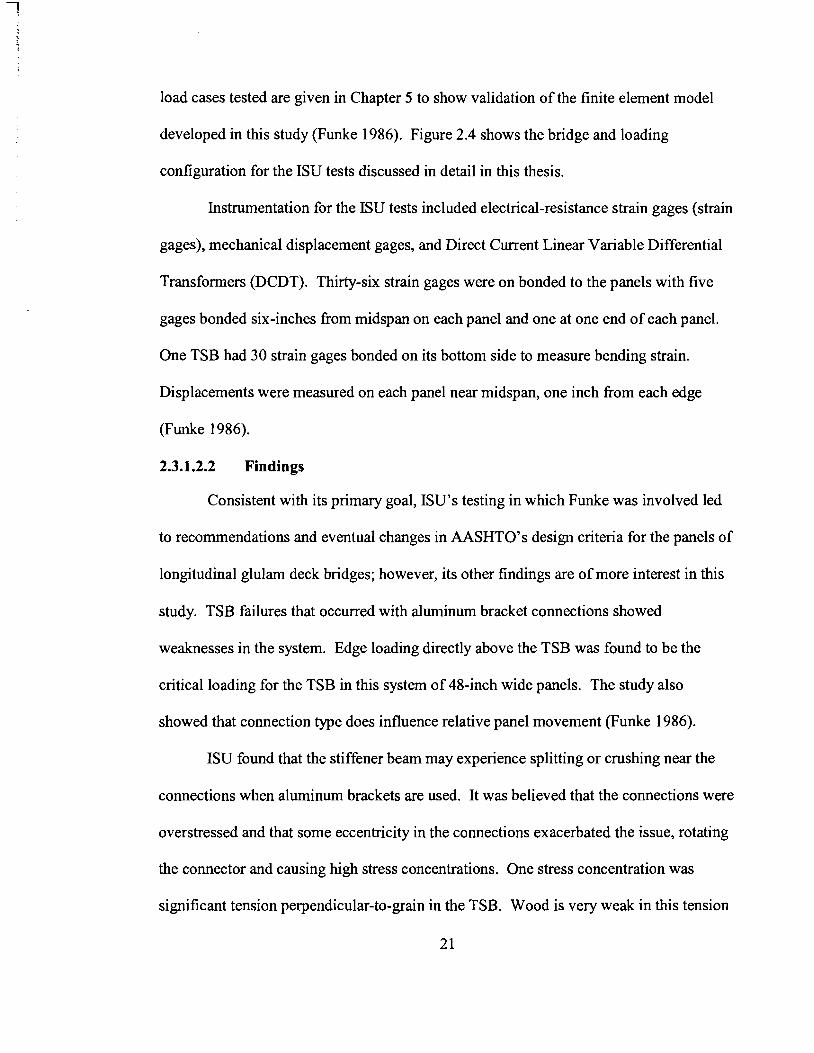
developed in this study (Funke 1986). Figure 2.4 shows the bridge and loading
configuration for the ISU tests discussed in detail in this thesis.
Instrumentation for the ISU tests included electrical-resistance strain gages (strain
gages), mechanical displacement gages, and Direct Current Linear Variable Differential
Transformers (DCDT). Thirty-six strain gages were on bonded to the panels with five
gages bonded six-inches fiom midspan on each panel and one at one end of each panel.
One TSB had 30 strain gages bonded on its bottom side to measure bending strain.
Displacements were measured on each panel near midspan, one inch fiom each edge
(Funke 1986).
2.3.1.2.2 Findings
Consistent with its primary goal, ISU7s testing in which Funke was involved led
to recommendations and eventual changes in AASHTO's design criteria for the panels of
longitudinal glulam deck bridges; however, its other findings are of more interest in this
study. TSB failures that occurred with aluminum bracket connections showed
weaknesses in the system. Edge loading directly above the TSB was found to be the
critical loading for the TSB in this system of 48-inch wide panels. The study also
showed that connection type does influence relative panel movement (Funke 1986).
ISU found that the stiffener beam may experience splitting or crushing near the
connections when aluminum brackets are used. It was believed that the connections were
overstressed and that some eccentricity in the connections exacerbated the issue, rotating
the connector and causing high stress concentrations. One stress concentration was
significant tension perpendicular-to-grain in the TSB. Wood is very weak in this tension
2 1
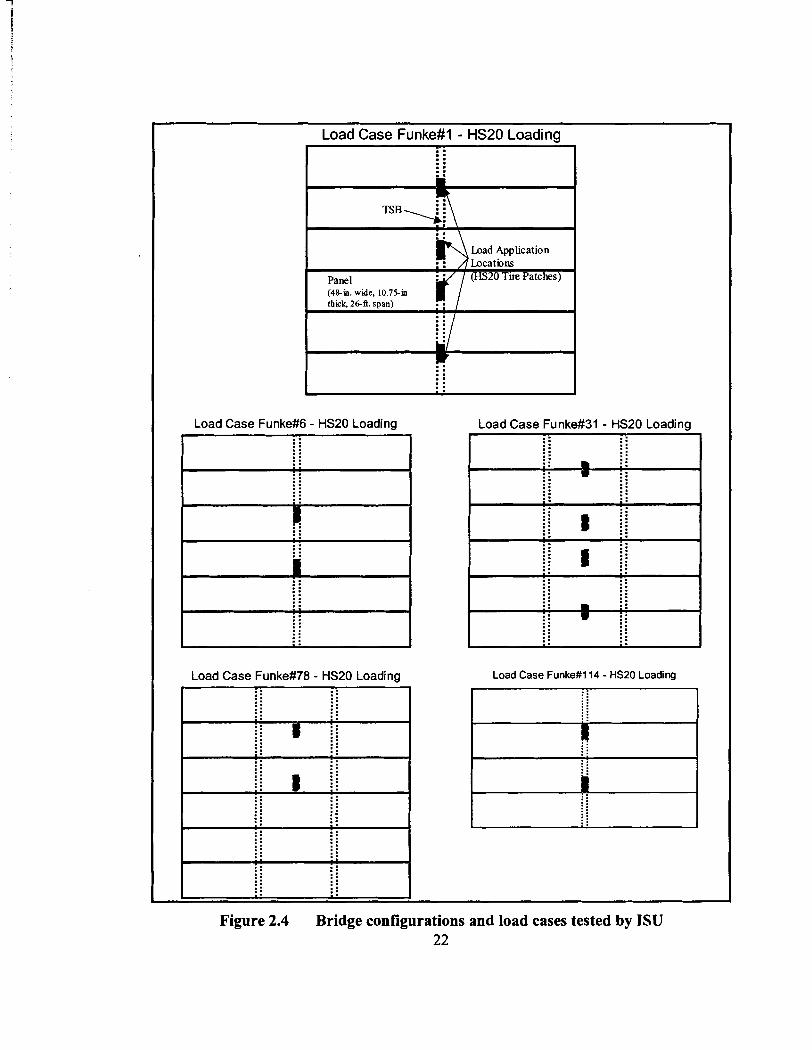
Load Case Funke#l - HS20 Loading
Load Case Funke#6 - HS20 Loading Load Case Funke#31 - HS20 Loading . . . . : : . . . . . . I I . . . .
Load Case Funke#78 - HS20 Loading Load Case Funke#114 - HS20 Loading
Figure 2.4 Bridge configurations and load cases tested by ISU 22
and the wood failed, splitting locally at the connector. Under the bearing edge of the
aluminum connector the wood failed as well, being crushed. The strains measured in the
TSB during one of these tests (Funke#6) where the stiffener failed showed bending
stresses 40% greater than allowable (Wood Handbook 1974).
The first test where TSB splitting failure occurred was Funke#6. Loading in the
test placed a single axle of one truck centrically on a 6-panel bridge (Figure 2.4). This
placed both wheels at panel edges directly above the single stiffener, thus placing the
TSB under its critical loading. The loading had not reached its full AASHTO HS20-44
loading of 16 kips per wheel when the failure occurred. Failure occurred when the
loading was between 12 and 16 kips per wheel. ISU calculated that the failed
connections carried approximately 4.2 kips (+I- 0.6 kips) and 2.2 kips (+I- 0.3 kips) of
tensile force at TSB failure. Allowable bearing forces over the 6.4 in2 of bearing area of
connector on the panel would have been 2.30-4.93 kips (compression perpendicular to
grain at proportional limit for interior north douglas fir was 360 to 770 psi) (Wood
Handbook 1974). Thus the crushing failure may be explained by the published bearing
values. Published maximum tensile strength perpendicular-to-grain for interior north
douglas fir were 340 - 390 psi (Wood Handbook 1974). TSB perpendicular-to-grain
tensile stresses exceeded these maximums, causing splitting failures (Funke 1986).
A similar TSB failure occurred in Funke#3 1 (Figure 2.4 for loading
configuration). There were two transverse stiffeners connected to the panels through
aluminum brackets for this test. Failure occurred in both TSB at the same locations as in
Test #6. Load at failure was 13.5 - 14.0 kips per wheel. Forces in the failed connections
of the instrumented TSB were 2.38 kips and 1.49 kips, comparing well to the allowable

bearing forces. Using a finite element model, forces in the failed connections of the un-
instrumented TSB were calculated to be 30% greater than those in the other TSB (Funke
1986).
With more than a single stiffener used, critical (that which caused maximum TSB
bending stress) loading for the TSB occurred when only a single truck was on the bridge
with a wheel placed on a panel edge. In a test with the through-bolt connections
(Funke#78), high strain was measured a six-panel, two-TSB bridge with a single axle of a
HS20-44 truck loading the bridge. See Figure 2.4 for loading configuration. The same
loading configuration and connectors, but with three TSB, resulted in a maximum
measured strain of only 2.4% less, an insignificant reduction. ISU determined that the
stiffeners may have experienced a maximum bending stress of twice the allowable
(Funke 1986).
ISU found that relative panel movement is highly dependent on connection
typelstiffness. As compared to aluminum bracket connections, through-bolts connections
greatly reduce relative panel movement (Funke 1986). This reduction in relative
movement between adjacent panels is important to limit or eliminate cracking in the
wearing surface applied to the bridge. Relative panel movement should be limited to
0.10 inches for asphalt wearing surfaces (Ritter 1990).
2.3.2 Analysis of Longitudinal Glulam Deck Bridges
It has been shown that longitudinal glulam deck bridges can be modeled using the
finite element method (Sanders et al. 1985; Funke 1986; Hajdu 1994; Kurain 2001).
Evans at Weyerhaeuser (Funke 1986) and Sanders et al., Funke, Hajdu, and Kurain at
24
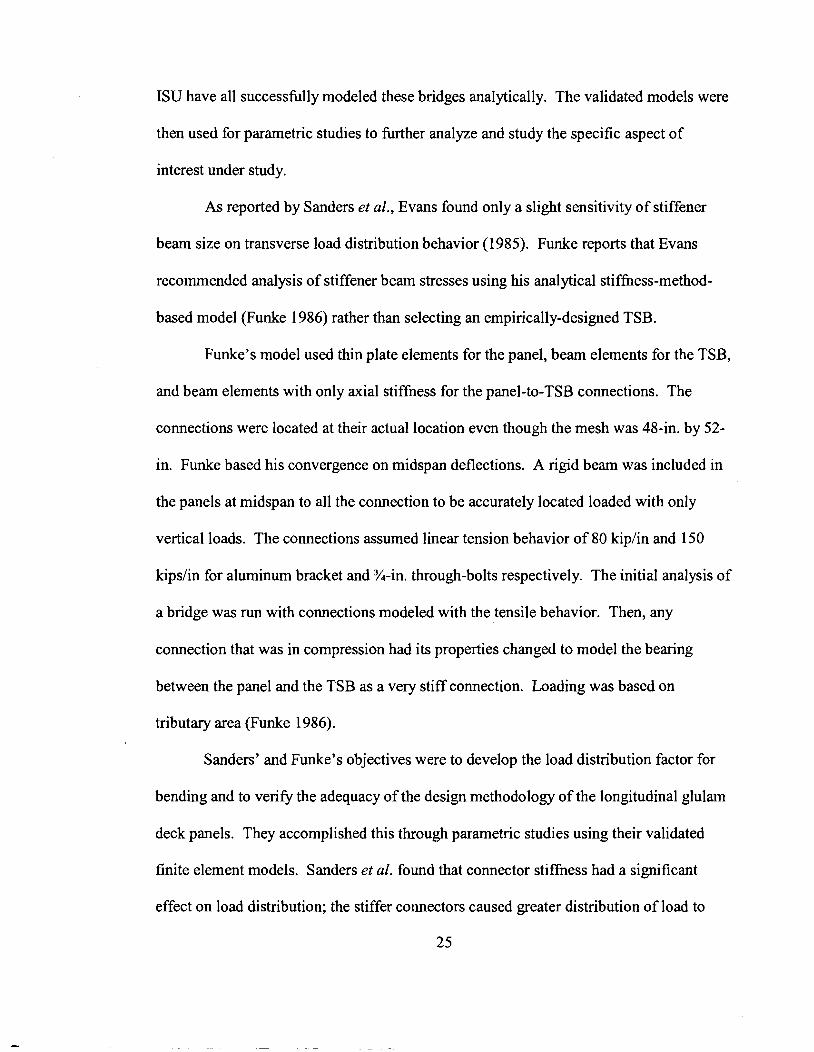
ISU have all successfully modeled these bridges analytically. The validated models were
then used for parametric studies to further analyze and study the specific aspect of
interest under study.
As reported by Sanders et al., Evans found only a slight sensitivity of stiffener
beam size on transverse load distribution behavior (1985). Funke reports that Evans
recommended analysis of stiffener beam stresses using his analytical stiffhess-method-
based model (Funke 1986) rather than selecting an empirically-designed TSB.
Funke's model used thin plate elements for the panel, beam elements for the TSB,
and beam elements with only axial stiffhess for the panel-to-TSB connections. The
connections were located at their actual location even though the mesh was 48411. by 52-
in. Funke based his convergence on midspan deflections. A rigid beam was included in
the panels at midspan to all the connection to be accurately located loaded with only
vertical loads. The connections assumed linear tension behavior of 80 l u p h and 150
kipslin for aluminum bracket and %-in. through-bolts respectively. The initial analysis of
a bridge was run with connections modeled with the tensile behavior. Then, any
connection that was in compression had its properties changed to model the bearing
between the panel and the TSB as a very stiff connection. Loading was based on
tributary area (Funke 1986).
Sanders' and Funke's objectives were to develop the load distribution factor for
bending and to verify the adequacy of the design methodology of the longitudinal glulam
deck panels. They accomplished this through parametric studies using their validated
finite element models. Sanders et al. found that connector stiflhess had a significant
effect on load distribution; the stiffer connectors caused greater distribution of load to
2 5
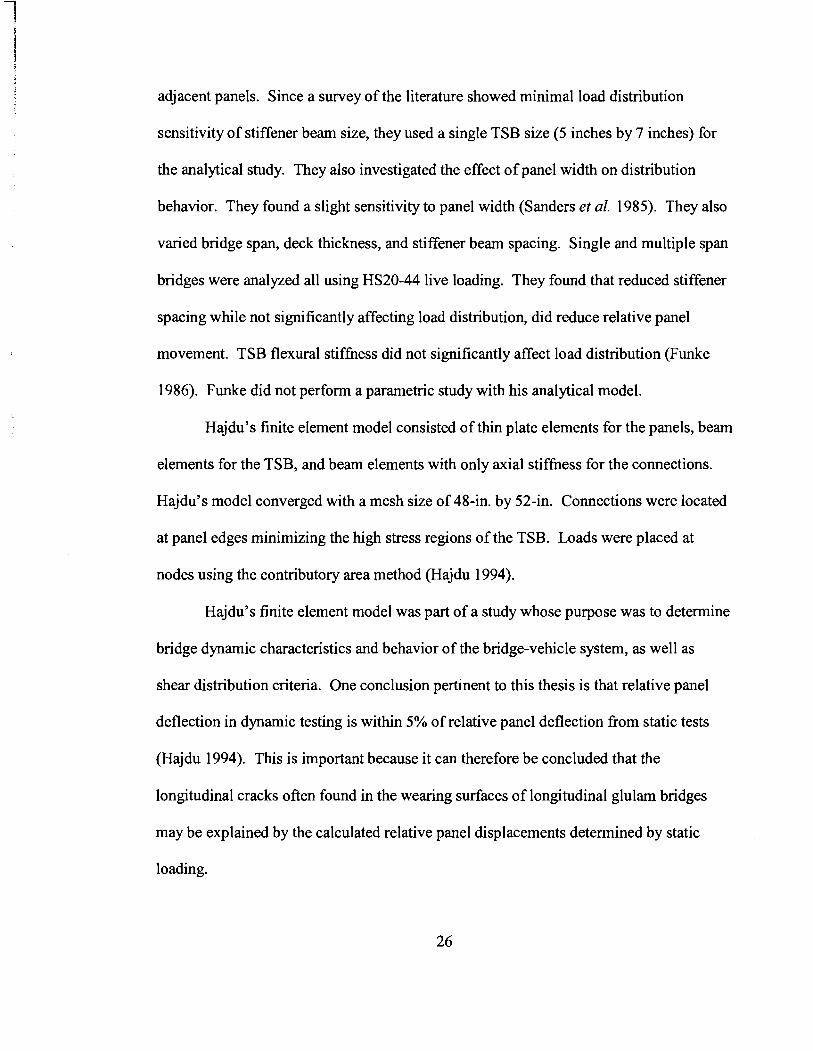
adjacent panels. Since a survey of the literature showed minimal load distribution
sensitivity of stiffener beam size, they used a single TSB size (5 inches by 7 inches) for
the analytical study. They also investigated the effect of panel width on distribution
behavior. They found a slight sensitivity to panel width (Sanders et al. 1985). They also
varied bridge span, deck thickness, and stiffener beam spacing. Single and multiple span
bridges were analyzed all using HS20-44 live loading. They found that reduced stiffener
spacing while not significantly affecting load distribution, did reduce relative panel
movement. TSB flexural stiffness did not significantly affect load distribution (Funke
1986). Funke did not perform a parametric study with his analytical model.
Hajdu's finite element model consisted of thin plate elements for the panels, beam
elements for the TSB, and beam elements with only axial stiffness for the connections.
Hajdu's model converged with a mesh size of &in. by 52-in. Connections were located
at panel edges minimizing the high stress regions of the TSB. Loads were placed at
nodes using the contributory area method (Hajdu 1994).
Hajdu's finite element model was part of a study whose purpose was to determine
bridge dynamic characteristics and behavior of the bridge-vehicle system, as well as
shear distribution criteria. One conclusion pertinent to this thesis is that relative panel
deflection in dynamic testing is within 5% of relative panel deflection fiom static tests
(Hajdu 1994). This is important because it can therefore be concluded that the
longitudinal cracks often found in the wearing surfaces of longitudinal glulam bridges
may be explained by the calculated relative panel displacements determined by static
loading.

Kurain's finite element model included bridge curbs increasing the stiffhess of the
outer panels and increasing observed TSB bending stresses. His model converged with a
finer mesh (12-in. by 18-in.) than the others since he considered TSB bending as well as
midspan deflections for convergence. Although Kurain's model includes the important
aspect of curbs, their effect is magnified because of the rigid connections he used for the
curb-to-panel and panel-to-TSB connections. Both types of connections had very high
axial and flexural stiffness. He used an energy-equivalent loading methodology (Kurain
2001).
Kurain developed a model using ANSYS, creating a pre and postprocessor for the
program to simplifL its use. Kurain included curbs in his finite element model and
connected the panels to the stiffeners with rigid links as connections. Kurain found that
the panel longitudinal modulus of elasticity (MOE) and the curb size significantly
affected bridge response. Kurain recommended that since MOE will vary within a
species and over time, a unspecified range of MOE should be considered in the analysis
rather than using a single value (Kurain 200 1).
2.4 Summary
2.4.1 FRP-Glulam Research
FRP can significantly improve performance of glulam beams and panels, however
the FRP must be durable in order to safely capitalize on those benefits. After the project
reported in this thesis had already begun, it was found that, without some protection, the
PRF wet-layup FRP used in this study may not show sufficient environmental durability
in laboratory testing (Battles 2000, Iqbal2000, Wood 2000). Battles showed that

degradation decreased when a polyurethane coating, such as was used in the study
reported in this thesis, was used to protect the FRP (Battles 2000). The vinyl ester1E-glass
FFW used to reinforce transverse deck panels in Xu's work (2001) is an alternative to the
PRF wet-lay-up FFW used in the study reported in this thesis.
2.4.2 Longitudinal Glulam Deck Bridges Research
Although load distribution has been extensively researched, the panel-to-TSB
connection and TSB behavior is not well understood. However, some insight to their
behavior and interaction with the panels can be gleaned in relevant findings from the
literature review. It was repeatedly found that aluminum bracket connections could split
stiffeners when overstressed (Hale 1978; Funke 1986). If this splitting failure were to
happen in the field it is not likely that it would be immediately noticed. It has been
recommended that aluminum brackets no longer be used for panel-to-TSB connections,
since when aluminum brackets are used, a connection force as low as 1.49 lups may
cause failure in a 4.5 inch by 6.75 inch TSB (Funke 1986). On bridges with 48-inch wide
panels, critical loading for the TSB occurs when a wheel is placed as close to the panel
edge as possible (Funke 1986). The TSB can be overstressed in bending when connected
to the deck with aluminum brackets and critically loaded (Funke 1986). The published
literature did not report any research or concerns of the TSB being overstressed in shear.
Previous research has repeatedly highlighted the need for further research into the
behavior of the TSB. The bending overstress has been reported, but the extent of
possible overstress, the consideration of overstress for TSB shear, and the design
recommendations necessary to prevent the overstress have not been researched. This
thesis is an attempt to address the research need.
A summary of relevant parameters as determined from previous experimental and
analytical studies of longitudinal glulam deck bridges can be found in Table 2.1. Often
the parameter range was not given in the literature; in these situations the Table lists "Not
specified" in the "Range Considered" column. Since most of the previous research has
focused on load distribution among panels, the sensitivity to that parameter is listed. If
the Load Distribution Sensitivity is "Significant," the parameter significantly affects load
distribution. If it is listed as "Not significant," the load distribution does not substantially
change as the parameter varies.
The analytical models of longitudinal glulam deck bridges have not looked in
detail at the TSB. None have modeled the connections nonlinearly, which is more
accurate than the linear approximation. All previous models have used relatively coarse
meshes, and not modeled bearing separately or at locations other than where the
connection elements are located. When the curbs were modeled, they were connected
with rigid links making the deck and curb composite. These issues indicate a need for an
improved finite element model.
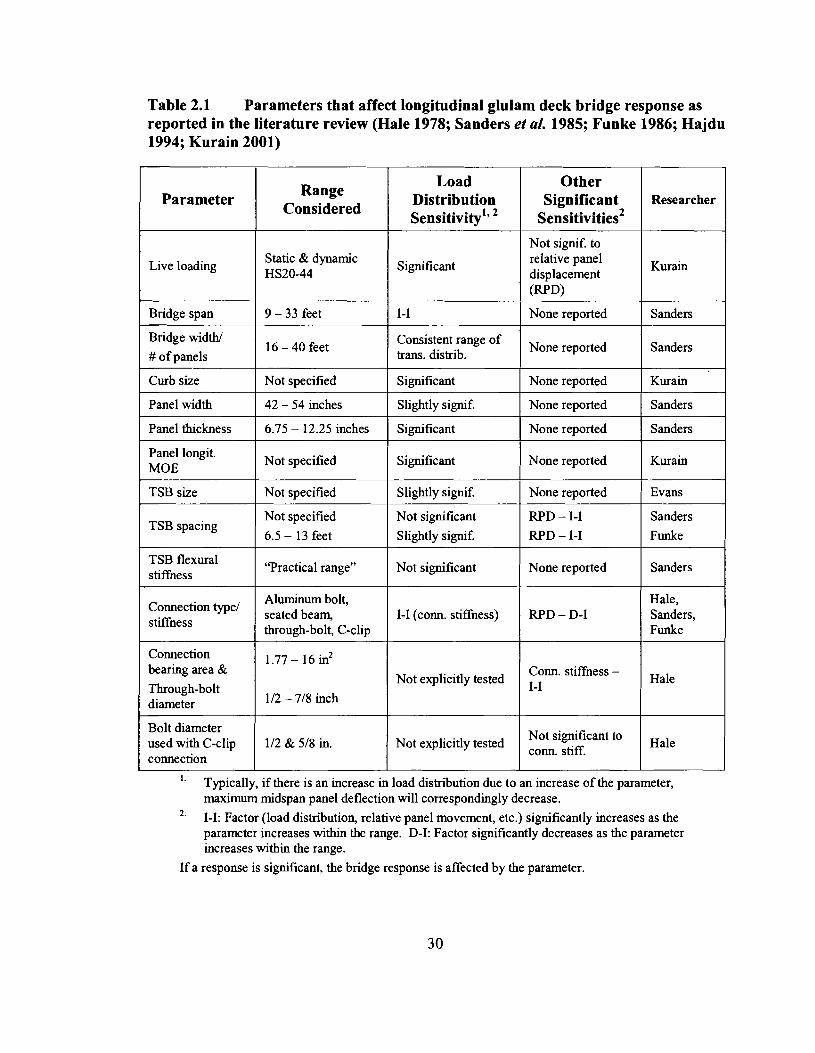
Table 2.1 Parameters that affect longitudinal glulam deck bridge response as reported in the literature review (Hale 1978; Sanders et al. 1985; Funke 1986; Hajdu 1994; Kurain 2001)
Parameter I Range Considered Distribution
~ensitivity'~
Other Significant
sensitivities2 Researcher
Live loading
Bridge span
Not signif. to relative panel displacement (RPD)
None reported
Static & dynamic HS20-44 Significant Kurain
-- -
9 - 33 feet I 1-1 Sanders
Bridge width1
# of panels
Curb size
Panel width
Panel thickness
Panel longit.
16 - 40 feet Consistent range of trans. distrib. Sanders None reported
Not specified I significant None reported Kurain
42 - 54 inches
6.75 - 12.25 inches
Slightly signif.
Significant
None reported
None reported
Sanders
Sanders
Not specified Significant None reported Kurain
TSB size I Not specified
Not specified
6.5 - 13 feet
"Practical range"
Slightly signif.
Not significant Slightly signif.
Not significant
None reported
RPD - 1-1 RPD - 1-1
None reported
Evans
Sanders Funke
Sanders
I TSB spacing I TSB flexural
Aluminum bolt, seated beam, through-bolt, C-clip
Hale, Sanders, Funke
Connection type1 stiffness 1-1 (corn. stifhess) RPD - D-I
Connection bearing area &
Through-bolt diameter
Not explicitly tested Conn. stifhess - 1-1 Hale
Bolt diameter used with C-clip connection
112 & 518 in. Not explicitly tested Not significant to conn. stiff. Hale
'. Typically, if there is an increase in load distribution due to an increase of the parameter, maximum midspan panel deflection will correspondingly decrease.
2. 1-1: Factor (load distribution, relative panel movement, etc.) significantly increases as the parameter increases withtn the range. D-I: Factor significantly decreases as the parameter increases within the range.
If a response is sigmficant, the bridge response is affected by the parameter.

Chapter 3
MILBRIDGE MUNICIPAL PIER
3.1 Introduction
This chapter discusses the Milbridge Municipal Pier that was built as a
demonstration project using the technology developed in this study. The chapter is
divided into the description of the pier, its design, and components, the methodology used
for reinforcing the glulam panels, the construction of the pier, the wearing surface system
used on the pier, the load testing of the pier, the pier performance and durability, the cost
of the pier superstructure, and conclusions and recommendations.
3.2 General Description
The Milbridge Municipal Pier is situated on coastal Maine's Narraguagas River
and serves the community in its commercial fishing and recreational boating and fishing
activities. The L-shaped, 167-fi. long, 16-ft. wide pier has seven spans of approximately
21.5 feet each (Figure 3.1). Designed for AASHTO HS20-44 loading, each simple span
consists of four vertically-laminated glulam panels reinforced using wet-impregnated
FRP technology. The pier is unique in that the FRP-reinforcing is specified only in the
most crucial location. The FRP reinforces the middle two-thirds of the panel on the
tension side. The wearing surface system used on the pier also makes the project unique.

Figure 3.1 Milbridge Municipal Pier after reconstruction
The Milbridge Municipal Pier had long been in need of repairs and prior to
UMaine's involvement, the town had obtained bids for reconstructing the pier with a
prestressed concrete deck. That bid proved too costly, and the town turned to The
University for help. The location was excellent for a demonstration project. Highly
visible, it offered a chance to examine the issues that would be faced during multiple
panel reinforcement, during construction, and during long-term exposure to a marine
environment. The town of Milbridge has maintenance and capital-improvement
responsibility of the pier. Funding for the reconstruction of the pier was fiom the Federal
Highway Administration through Innovative Bridge Research and Construction Program
(IBRC), the MDOT, the Maine Department of Economic and Community Development,
and the Town of Milbridge, Maine.

Each P a d 4' x 105" x 21.5'
Figure 3.2 Section of span of the Milbridge Pier
3.3 Milbridge Municipal Pier Superstructure Design
The Milbridge Pier superstructure was designed as a longitudinal glulam deck
bridge according to AASHTO Standard Specifications (AASHTO 1996). Live loading
was specified to be HS20-44, as required by the MDOT. Woodard & Curran, Inc. of
Bangor, Maine, designed the pier substructure and The University of Maine designed the
superstructure. The MDOT was the Engineer of Record on the project. The MathCad
worksheet developed for the superstructure design, design specifications, and drawings
for the Milbridge Pier are given in Appendix A. The pier was designed with
consideration both for structural strength and for durability.
3.3.1 Durability Design
The harsh marine environment can cause significant deterioration in a very short
time if preventative measures are not taken. The metal components must be corrosion
resistant, and wood components, if not naturally durable, must be treated with

preservative to retard biological deterioration. Chromated Copper Arsenate (CCA)
preservative was used for the panel and TSB laminations prior to lamination. The
literature review and the research that was ongoing at the time of panel fabrication
indicated a need to coat the FFW with a polyurethane coating for environmental
protection. More discussion of each aspect of the durability is provided in this section
and its subsections. The pier will be monitored for a period of five years from
completion with particular emphasis on FFW degradation and the FFW-wood bond
integrity. To further retard biological deterioration of the wood an impermeable
membrane covers the pier deck.
3.3.1.1 Wood Durability
3.3.1.1.1 Preservative
CCA preservative was used for all timber. CCA is a waterborne preservative that
has been used since the 1940's. CCA, coal-tar creosote (creosote), and
pentachlorophenol (penta) are the common preservatives for southern pine timber
bridges. Oil-borne preservatives such as creosote or penta are preferred over
waterbornes. Oil-borne preservatives help seal the wood, reducing the moisture transport
through the wood and thus shrinkage and swelling cracking damage. However, use of
creosote or penta was not possible in this project due to restrictions placed on marine
structures in Maine. The marine environment coupled with the fact that it is not
uncommon to have water splashing on the bottom of the deck, restricted preservative
choice to CCA. However, as can be seen fiom Figure 3.3, the use of a waterborne
preservative resulted in checking from the shrinkage and swelling stresses when the deck
had to go through the winter unprotected.
3 4
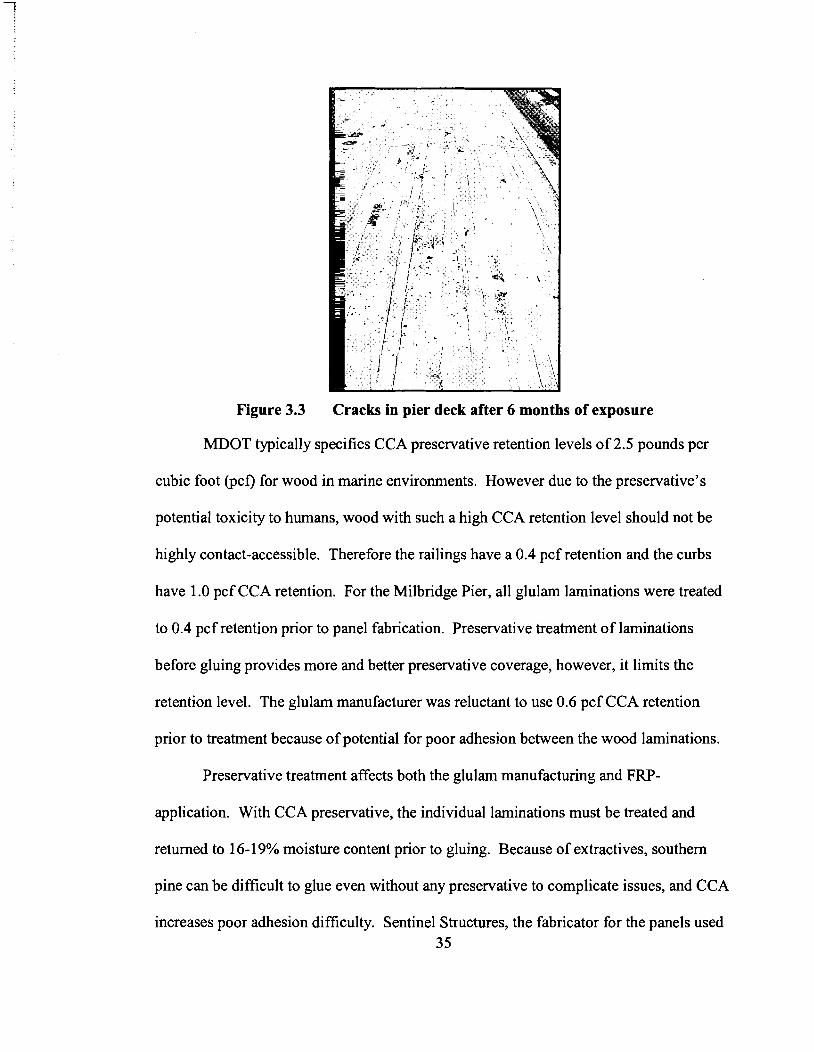
Figure 3.3 Cracks in pier deck after 6 months of exposure
MDOT typically specifies CCA preservative retention levels of 2.5 pounds per
cubic foot (pcf) for wood in marine environments. However due to the preservative's
potential toxicity to humans, wood with such a high CCA retention level should not be
highly contact-accessible. Therefore the railings have a 0.4 pcf retention and the curbs
have 1.0 pcf CCA retention. For the Milbridge Pier, all glulanl laminations were treated
to 0.4 pcf retention prior to panel fabrication. Preservative treatment of laminations
before gluing provides more and better preservative coverage, however, it limits the
retention level. The glulam manufacturer was reluctant to use 0.6 pcf CCA retention
prior to treatment because of potential for poor adhesion between the wood laminations.
Preservative treatment affects both the glularn manufacturing and FRP-
application. With CCA preservative, the individual laminations must be treated and
returned to 16-1 9% moisture content prior to gluing. Because of extractives, southern
pine can be difficult to glue even without any preservative to complicate issues, and CCA
increases poor adhesion difficulty. Sentinel Structures, the fabricator for the panels used 35
in the Milbridge Pier, would not glue laminations with CCA-retention levels higher than
0.4 pcf. The treated wood also increased difficulty of bonding the impermeable
membrane and wearing surface to the pier deck.
3.3.1.1.2 Impermeable Membrane and Wearing Surface
An impermeable membrane was needed to minimize moisture transport in the
wood structural members and a wearing surface was needed to protect the glulam deck
fiom damage and the impermeable membrane from perforation.
Due to the unique possible use and environment of a working pier, the wearing
surface needed for a marine pier has to meet a more stringent set of criteria than the
wearing surface needed for a bridge. The pier criteria include suitability for vehicular
traffic, skid resistance, water impermeability, petroleum-product spill resistance,
flexibility, impact resistance, and adhesion to the substrate. Since the pier is a working
pier the wearing surface needed to be suitable for vehicular traffic and provide skid
resistance for both vehicles and pedestrians. Durability of the superstructure requires
provision of an impermeable membrane on the deck surface. A working pier is often
used for transfer of petroleum products between containers, thus requiring a system that
is durable under the petroleum-product spills. Asphalt and petroleum-based membranes
failed to meet this criteria; and although many polymer membranes do satisfy the
petroleum-spill resistance criteria, the system needed both flexibility and impact
resistance as well. The flexibility was necessary over the panel-to-panel joints where
relative panel displacements could cause cracking of an overly stiff system and thus
allow water passage to the timber deck below. Flexibility is also necessary for the
membrane to remain impermeable through the wood's hygrothermal cycling. Working
36
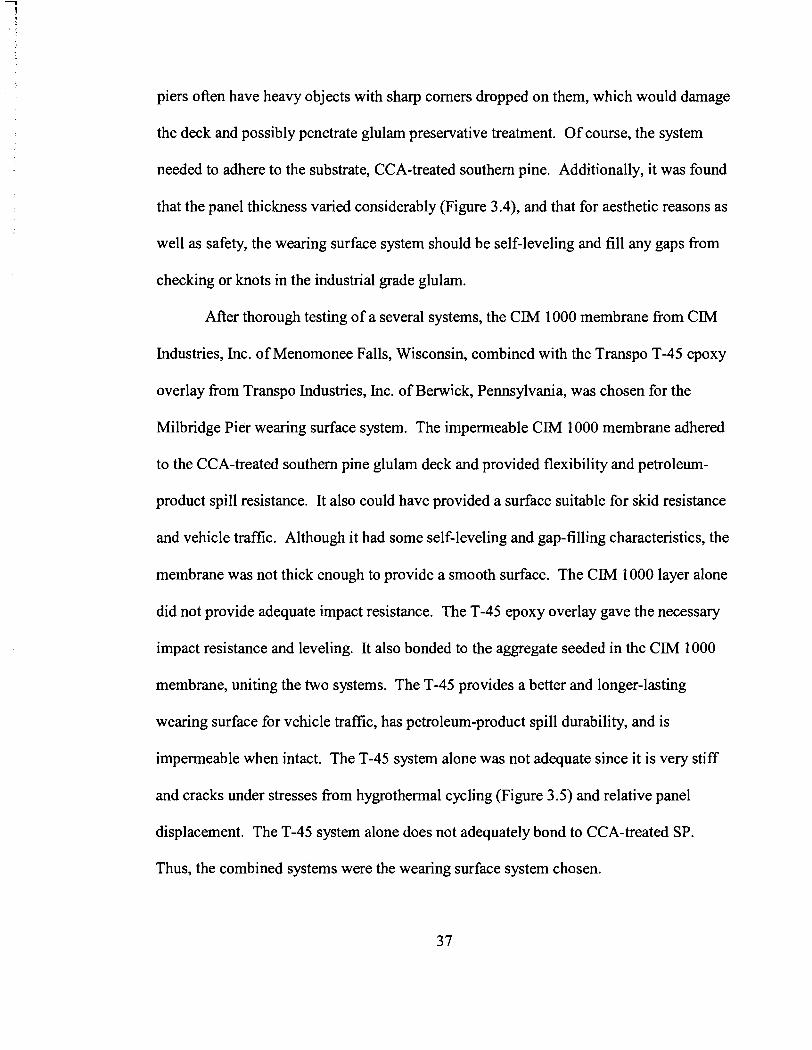
piers often have heavy objects with sharp comers dropped on them, which would damage
the deck and possibly penetrate glulam preservative treatment. Of course, the system
needed to adhere to the substrate, CCA-treated southern pine. Additionally, it was found
that the panel thickness varied considerably (Figure 3.4), and that for aesthetic reasons as
well as safety, the wearing surface system should be self-leveling and fill any gaps fiom
checking or knots in the industrial grade glulam.
After thorough testing of a several systems, the CIM 1000 membrane fiom CIM
Industries, Inc. of Menomonee Falls, Wisconsin, combined with the Transpo T-45 epoxy
overlay from Transpo Industries, Inc. of Berwick, Pennsylvania, was chosen for the
Milbridge Pier wearing surface system. The impermeable CIM 1000 membrane adhered
to the CCA-treated southern pine glulanl deck and provided flexibility and petroleunl-
product spill resistance. It also could have provided a surface suitable for skid resistance
and vehicle traffic. Although it had some self-leveling and gap-filling characteristics, the
membrane was not thick enough to provide a smooth surface. The CIM 1000 layer alone
did not provide adequate impact resistance. The T-45 epoxy overlay gave the necessary
impact resistance and leveling. It also bonded to the aggregate seeded in the CIM 1000
membrane, uniting the two systems. The T-45 provides a better and longer-lasting
wearing surface for vehicle traffic, has petroleum-product spill durability, and is
impermeable when intact. The T-45 system alone was not adequate since it is very stiff
and cracks under stresses from hygrothermal cycling (Figure 3.5) and relative panel
displacement. The T-45 system alone does not adequately bond to CCA-treated SP.
Thus, the combined systems were the wearing surface system chosen.
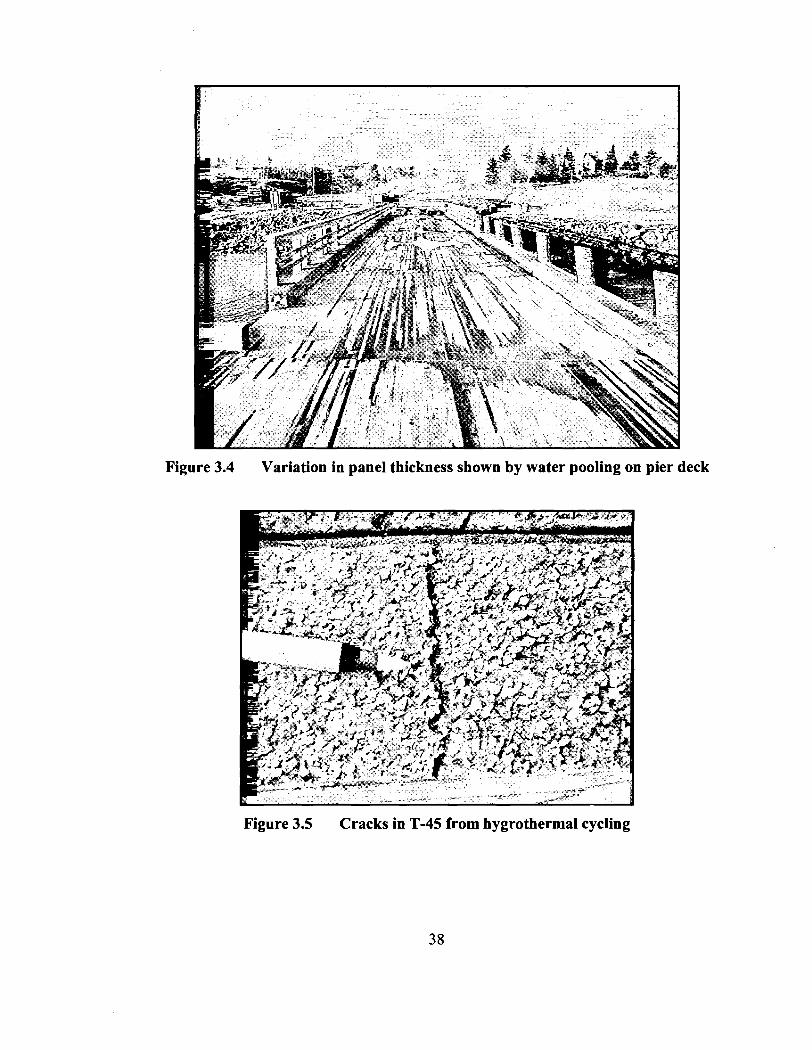
Figure 3.4 Variation in panel thickness shown by water pooling on pier deck
Figure 3.5 Cracks in T-45 from hygrothermal cycling

As part of another UMaine study, Novotoney performed a more extensive testing
of wearing surfaces, increasing the number of materials tested and the battery of tests.
Out of the systems he tested, the CIM 1000/T-45 system was the only one to meet all
criteria (Novotoney 2001).
3.3.1.2 Hardware and FRP Durablitity
The connection hardware was hot-dipped galvanized in accordance with ASTM
A153 (ASTM 2000a) for corrosion resistance. The FRP was coated with a polyurethane
coating for environmental protection as recommended by previous research (Battles
2000).
3.3.2 Structural Design
Due to the experimental nature of the project and the lack of data on long-term
performance of the FRP, the structure was designed without relying on the strength of the
FRP. Since deflection controlled the design, however, it was decided to use the FRP for
deflection design. No allowable limit is specified in the AASHTO design (AASHTO
1996).
The superstructure was designed according to the AASHTO specifications. The
southern pine panels specified were all 10.5-inches thick and varied in length according
to the span. One percent FRP reinforcing for the middle two-thirds of the tension-side of
the panel was specified to meet a W500 deflection service limit. The stiffeners were also
made of southern yellow pine glulam and specified to be 6.75-inches deep by 4.5-inches
wide. The beam's stiffness factor of 196000 kip-in2 was over twice the AASHTO-
required minimum stifhess factor of 80000 kip-in2. Glulam fabrication specifications are
given in Table 3.1.
3.3.3 Material Specifications
3.3.3.1 Glulam Panels and Beams
The laminations for the panels and stiffener beams were specified as southern
yellow pine (Pinus spp.) glulam. The southern yellow pine species group was selected
partly due to the preservative used and partly due to time constraints. Four-foot wide
panels were used since the pier was to be a single lane. The design properties of the
vertically-laminated glulam panels are given in Table 3.1. Simple spans simplified
design, reinforcement, and construction.
3.3.3.2 FRP Specifications
The FRP used is a Phenol Resorcinol Formaldehyde (PRF) adhesive, reinforced
with unidirectional E-glass, fabricated by wet lay-up, consolidated by mechanical
pressure, and cured at ambient temperature. The PRF was a two-part resin
(~esorsabond~ 4242 Resin and ~esorsabond~ 4554 Hardener) manufactured by Georgia-
Pacific Resins, Inc. of Decatur, Georgia, with a 45-minute pot life. PRFs are well known
for their ability to achieve good bonds to wood for glulam with exterior applications. It is
a low-cost resin system for FRP, as well, and had already been structurally tested for
reinforcing beams (Foster 1998). Another benefit of PRF FRP is the familiarity that
glulam manufacturers already have with the resin, allowing easier and faster
implementation of FRP-glulam into the engineered wood industry. The unidirectional E-
glass fabric (VEW260v2003) was 26 ozlyd2 and produced by Brunswick Technologies,
Inc. (now St. Gobain) of Brunswick, Maine, in 47-inch wide rolls. The viscosity of the
PRF required wet impregnating the E-glass fabrics prior to wet layup. The actual FRP
fabrication and glulam reinforcing processes are described later in this chapter.
3.3.3.3 Panel-to-TSB Connections
Seated-beam connections with 518-inch-diameter threaded rods were chosen to
allow for differential movement between the panels and stiffeners due to hygrothermal
cycling. The ASTM B7 threaded rods had 3-inch diameter, %-inch thick washers bearing
on the glulam panels. For the bottom of the rod, connecting them to the 2-inch by 2-inch
by 3116-in thick, 10-inch long steel tube that the stiffener was seated on, standard
galvanized washers and nuts were used (Figure 3.6).
3.3.3.4 Panel-to-Pile Cap Connection
The pile cap and deck panels are connected by 1-inch diameter galvanized A325
threaded rods. A neoprene pad is placed between the panel and the pile cap to prevent
direct contact of the wood and concrete that can allow moisture transport into the wood
and cause deterioration.
3.4 Panel Fabrication and Reinforcement
The panels were fabricated by Sentinel Structures of Peshtico, Wisconsin. They
were then shipped to the AEWC Structures Laboratory for reinforcing.

Table 3.1 Specifications for Milbridge Pier glulam
Glulam Panel Properties
Glue laminated timber shall be manufactured from species and grades of lumber which will produce design values equal to or exceeding the following when loaded parallel to the wide faces of the laminations:
Bending (Fb) = 2000 psi Shear parallel to grain (Fv) = 90 psi Modulus of elasticity (E) = 1,700,000 psi
Compression perpendicular to grain (FCJ = 560 psi
Glulam Spreader Beam Properties
Glue laminated timber shall be manufactured from species and grades of lumber which will produce design values equal to or exceeding the following when loaded perpendicular to the wide faces of the laminations:
Bending (Fb) = 2400 psi Shear Parallel to grain (F,) = 90 psi Modulus of elasticity (E) = 1,700,000 psi
Compression perpendicular to grain (FcI) = 560 psi
Figure 3.6 Seated-beam panel-to-TSB connection 42
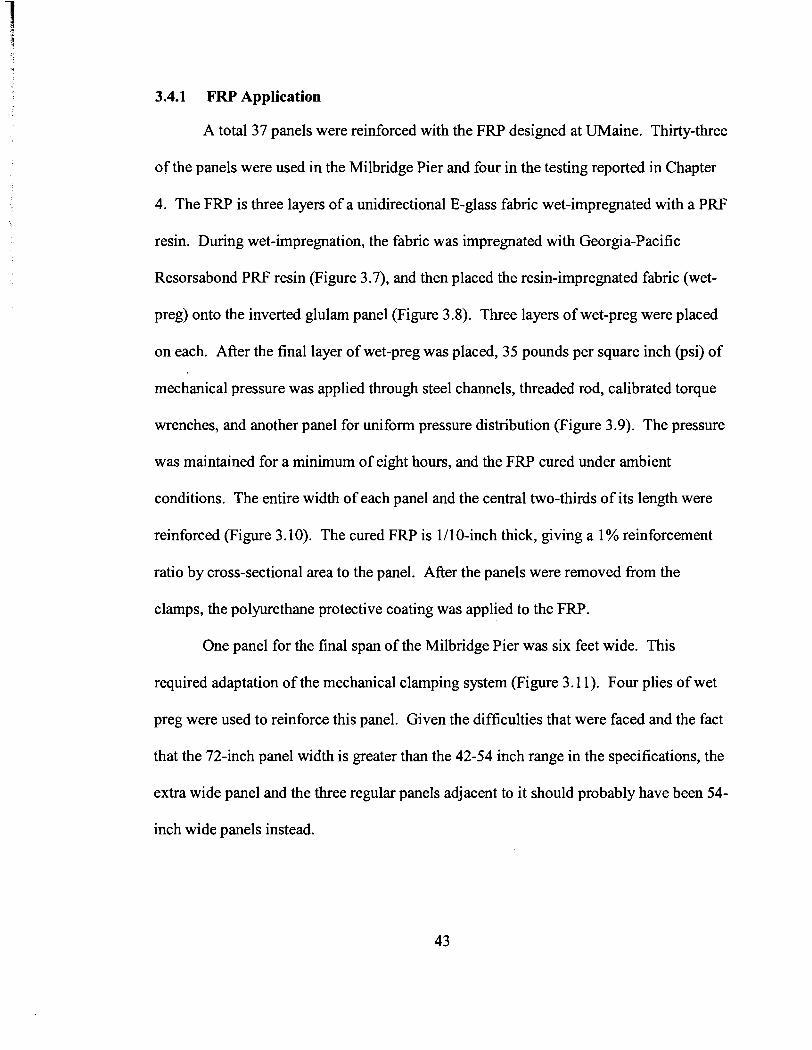
3.4.1 FRP Application
A total 37 panels were reinforced with the FRP designed at UMaine. Thirty-three
of the panels were used in the Milbridge Pier and four in the testing reported in Chapter
4. The FRP is three layers of a unidirectional E-glass fabric wet-impregnated with a PRF
resin. During wet-impregnation, the fabric was impregnated with Georgia-Pacific
Resorsabond PRF resin (Figure 3.7), and then placed the resin-impregnated fabric (wet-
preg) onto the inverted glulam panel (Figure 3.8). Three layers of wet-preg were placed
on each. After the final layer of wet-preg was placed, 35 pounds per square inch (psi) of
mechanical pressure was applied through steel channels, threaded rod, calibrated torque
wrenches, and another panel for uniform pressure distribution (Figure 3.9). The pressure
was maintained for a minimum of eight hours, and the FRP cured under ambient
conditions. The entire width of each panel and the central two-thirds of its length were
reinforced (Figure 3.10). The cured FRP is 1110-inch thick, giving a 1% reinforcement
ratio by cross-sectional area to the panel. After the panels were removed from the
clamps, the polyurethane protective coating was applied to the FRP.
One panel for the final span of the Milbridge Pier was six feet wide. This
required adaptation of the mechanical clamping system (Figure 3.1 1). Four plies of wet
preg were used to reinforce this panel. Given the difficulties that were faced and the fact
that the 72-inch panel width is greater than the 42-54 inch range in the specifications, the
extra wide panel and the three regular panels adjacent to it should probably have been 54-
inch wide panels instead.
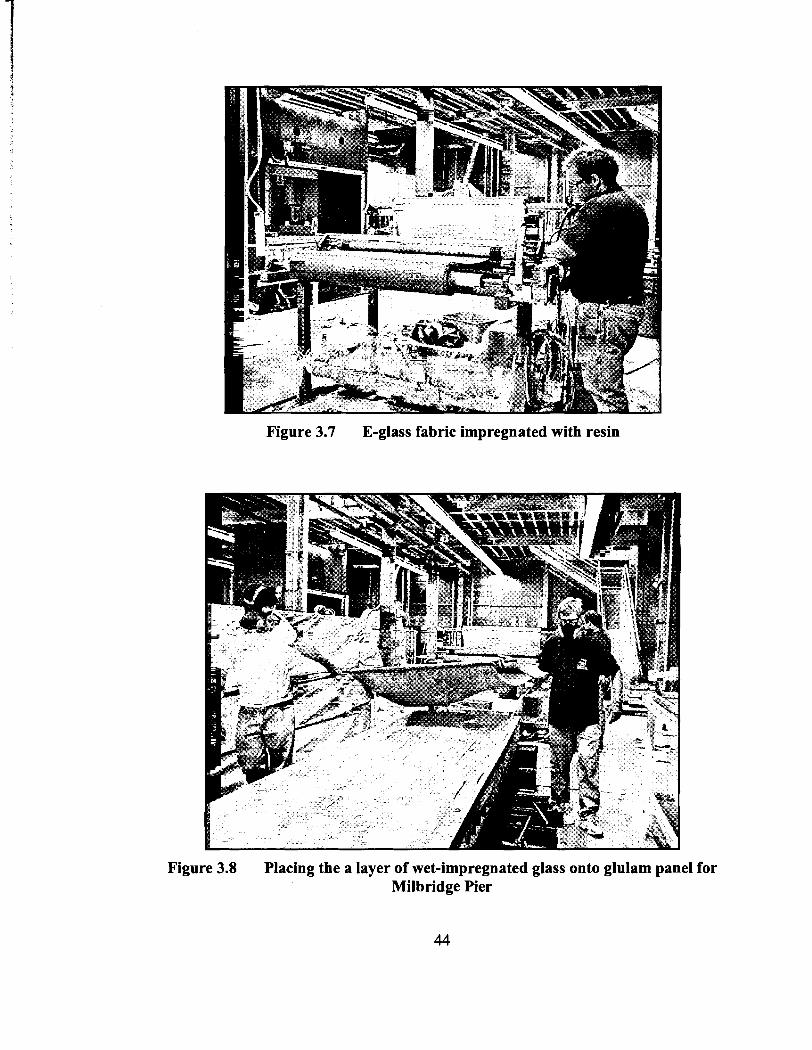
Figure 3.7 E-glass fabric impregnated with resin
Figure 3.8 Placing the a layer of wet-impregnated glass onto glulam panel for Milbridge Pier
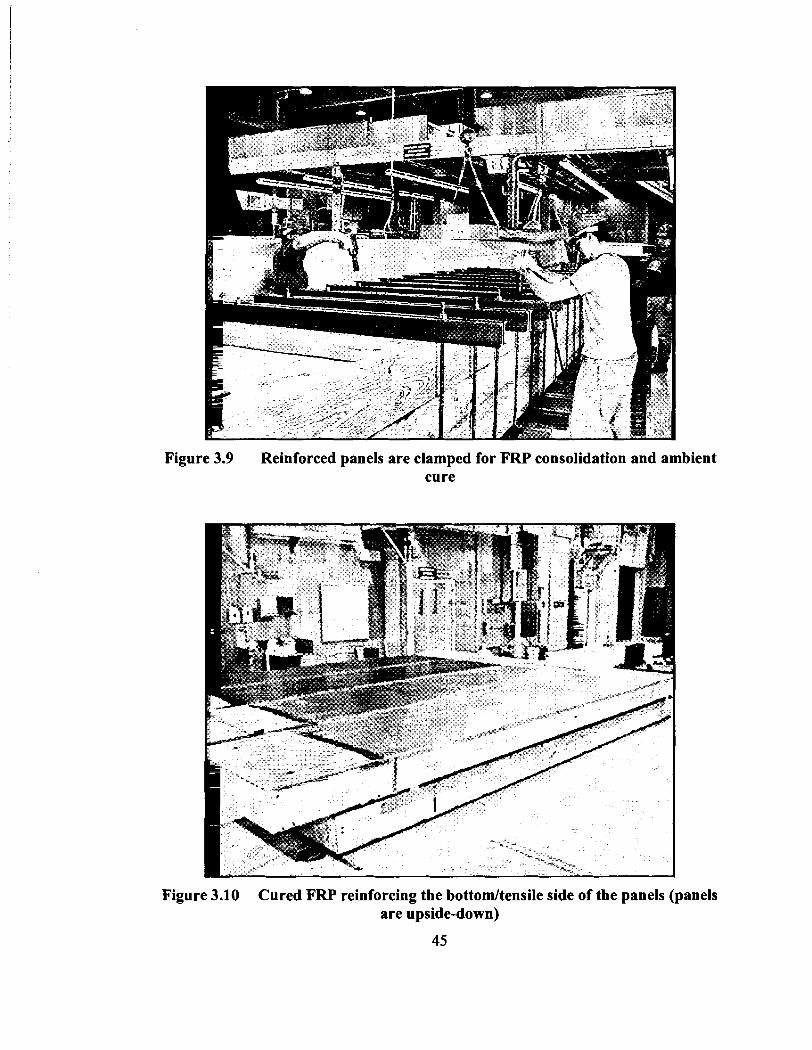
Figure 3.9 Reinforced panels are clamped for FRP consolidation and ambient cure
Figure 3.10 Cured FRP reinforcing the bottom/tensile side of the panels (panels are upside-down)
45

Figure 3.11 Clamping methodology modified for reinforcing the 72-inch wide panel
3.4.2 Comments on FRP System Used
To conclude this section, the advantages and disadvantage of the FRP system
chosen for this study need to be noted. It has already been reported in Chapter 2 that this
FRP performs well with regard to structural strength but performs poorly with regard to
environmental durability if not protected. The FRP on the Milbridge Pier has not shown
deterioration in the two years since construction. PRF is a low-cost resin system, making
PRF-FRP-glulam a cost-competitive option for bridge construction. Additionally, the
PRF resin is already familiar to glulam manufacturers increasing the ease of
implementation of FRP-reinforced glulam into an existing facility. The resin's pot life is
sufficient for a reasonable fabrication. One major disadvantage, which increases the rate
of deterioration due to environmental forces and which weakens the FRP structurally, is
46
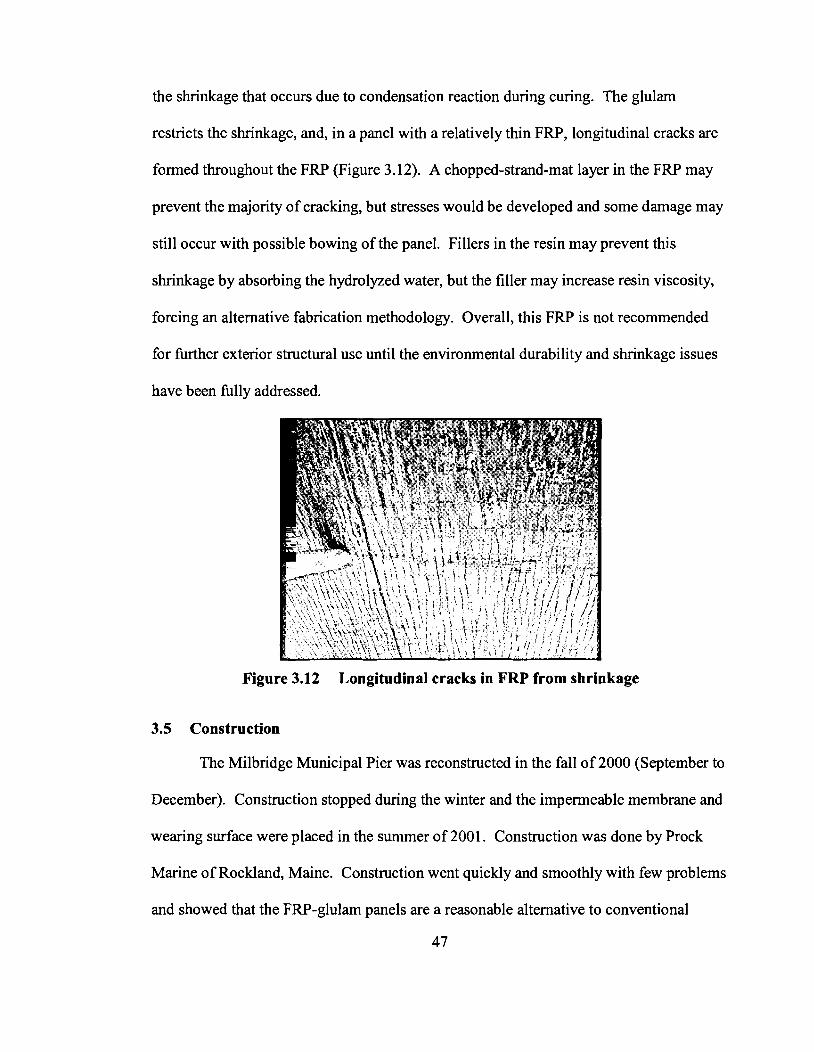
the shrinkage that occurs due to condensation reaction during curing. The glulam
restricts the shrinkage, and, in a panel with a relatively thin FRP, longitudinal cracks are
formed throughout the FRP (Figure 3.12). A chopped-strand-mat layer in the FRP may
prevent the majority of cracking, but stresses would be developed and some damage may
still occur with possible bowing of the panel. Fillers in the resin may prevent this
shrinkage by absorbing the hydrolyzed water, but the filler may increase resin viscosity,
forcing an alternative fabrication methodology. Overall, this FRP is not recommended
for further exterior structural use until the environmental durability and shrinkage issues
have been fully addressed.
Figure 3.12 Longitudinal cracks in FRP from shrinkage
3.5 Construction
The Milbridge Municipal Pier was reconstructed in the fall of 2000 (September to
December). Construction stopped during the winter and the impermeable membrane and
wearing surface were placed in the summer of 2001. Construction was done by Prock
Marine of Rockland, Maine. Construction went quickly and smoothly with few problems
and showed that the FRP-glulam panels are a reasonable alternative to conventional
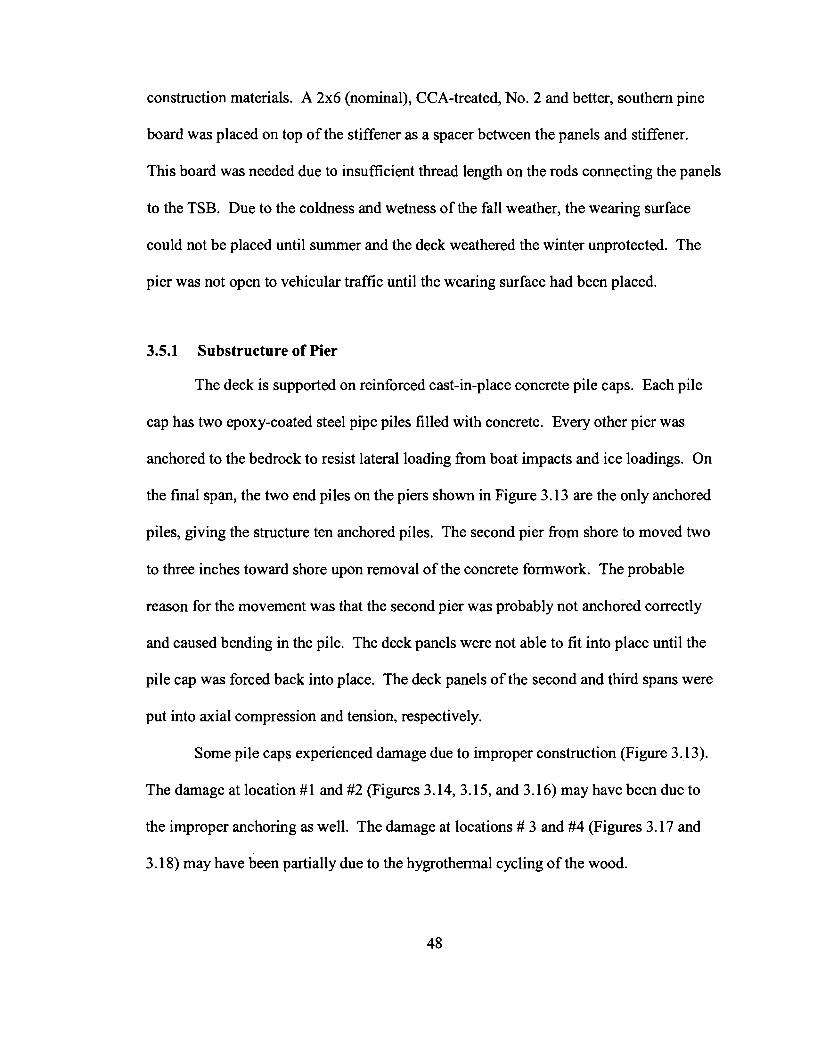
construction materials. A 2x6 (nominal), CCA-treated, No. 2 and better, southern pine
board was placed on top of the stiffener as a spacer between the panels and stiffener.
This board was needed due to insufficient thread length on the rods connecting the panels
to the TSB. Due to the coldness and wetness of the fall weather, the wearing surface
could not be placed until summer and the deck weathered the winter unprotected. The
pier was not open to vehicular traffic until the wearing surface had been placed.
3.5.1 Substructure of Pier
The deck is supported on reinforced cast-in-place concrete pile caps. Each pile
cap has two epoxy-coated steel pipe piles filled with concrete. Every other pier was
anchored to the bedrock to resist lateral loading from boat impacts and ice loadings. On
the final span, the two end piles on the piers shown in Figure 3.13 are the only anchored
piles, giving the structure ten anchored piles. The second pier from shore to moved two
to three inches toward shore upon removal of the concrete fonnwork. The probable
reason for the movement was that the second pier was probably not anchored correctly
and caused bending in the pile. The deck panels were not able to fit into place until the
pile cap was forced back into place. The deck panels of the second and third spans were
put into axial compression and tension, respectively.
Some pile caps experienced damage due to improper construction (Figure 3.13).
The damage at location #1 and #2 (Figures 3.14,3.15, and 3.16) may have been due to
the improper anchoring as well. The damage at locations # 3 and #4 (Figures 3.17 and
3.18) may have been partially due to the hygrothennal cycling of the wood.
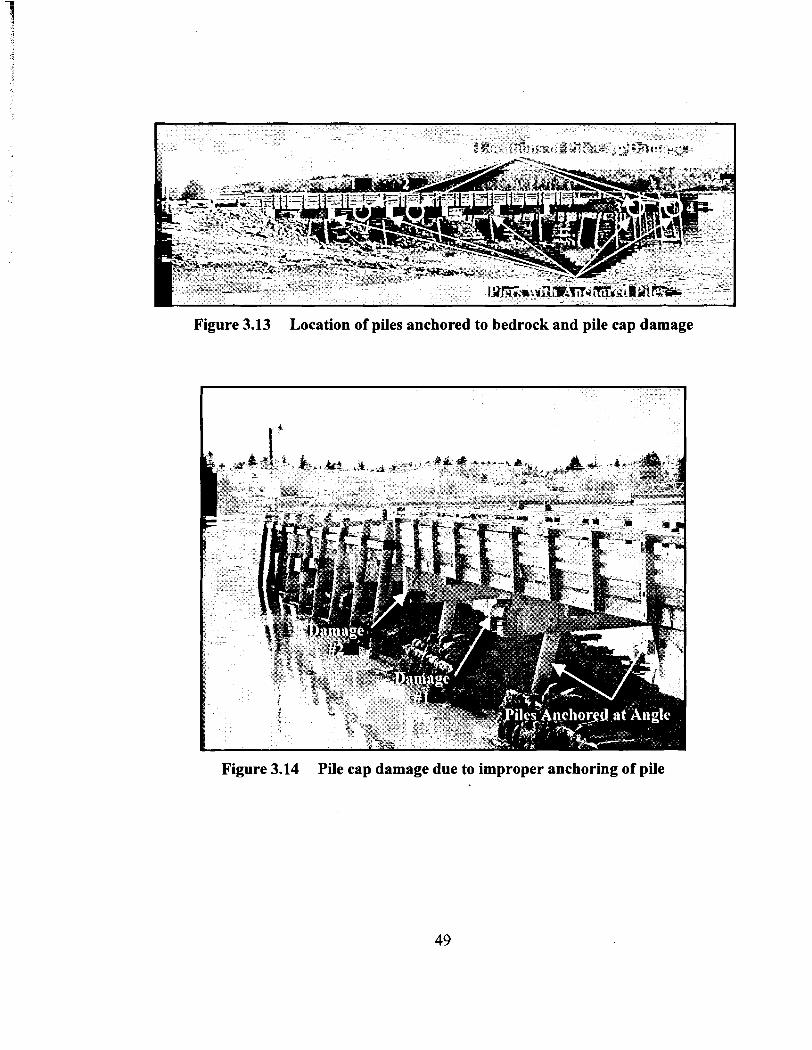
Figure 3.13 Location of piles anchored to bedrock and pile cap damage
Figure 3.14 Pile cap damage due to improper anchoring of pile
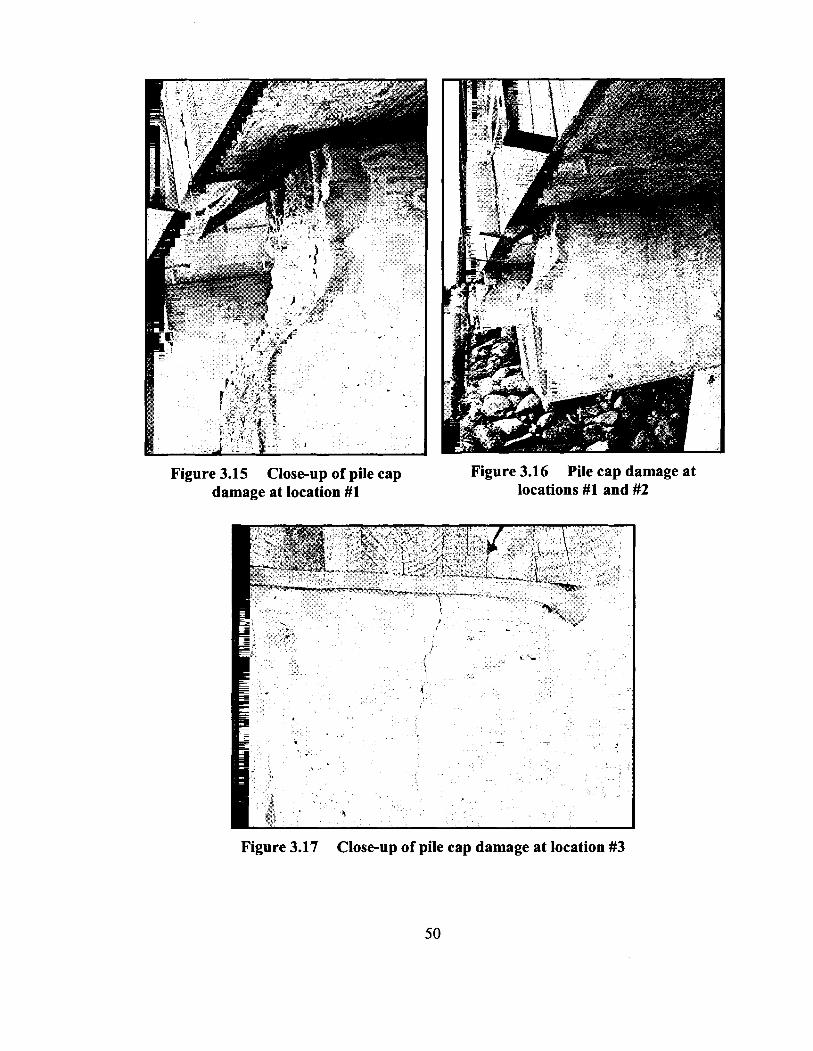
Figure 3.15 Close-up of pile cap damage at location #1
Figure 3.16 Pile cap damage at locations #1 and #2
Figure 3.17 Close-up of pile cap damage at location #3
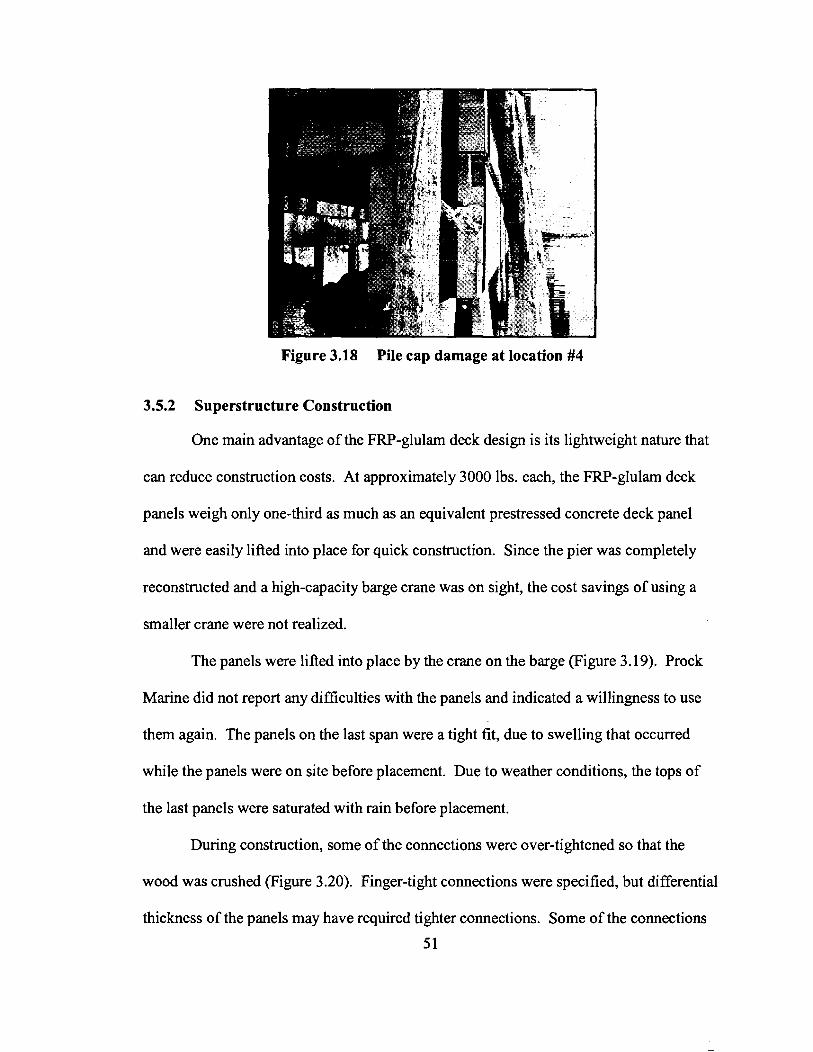
Figure 3.18 Pile cap damage at location #4
3.5.2 Superstructure Construction
One main advantage of the FRP-glulam deck design is its lightweight nature that
can reduce construction costs. At approximately 3000 lbs. each, the FRP-glulam deck
panels weigh only one-third as much as an equivalent prestressed concrete deck panel
and were easily lifted into place for quick construction. Since the pier was completely
reconstructed and a high-capacity barge crane was on sight, the cost savings of using a
smaller crane were not realized.
The panels were lifted into place by the crane on the barge (Figure 3.19). Prock
Marine did not report any difficulties with the panels and indicated a willingness to use
them again. The panels on the last span were a tight fit, due to swelling that occurred
while the panels were on site before placement. Due to weather conditions, the tops of
the last panels were saturated with rain before placement.
During construction, some of the connections were over-tightened so that the
wood was crushed (Figure 3.20). Finger-tight connections were specified, but differential
thickness of the panels may have required tighter connections. Some of the connections
5 1
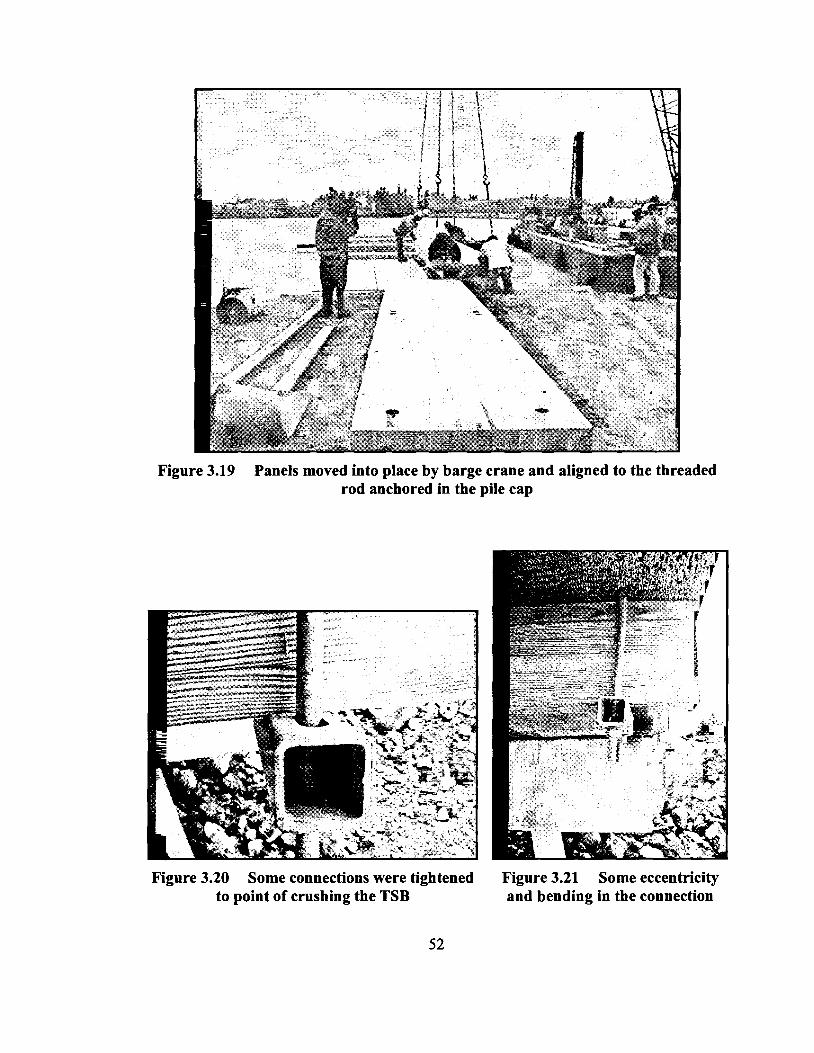
Figure 3.19 Panels moved into place by barge crane and aligned to the threaded rod anchored in the pile cap
Figure 3.20 Some connections were tightened to point of crushing the TSB
Figure 3.21 Some eccentricity and bending in the connection
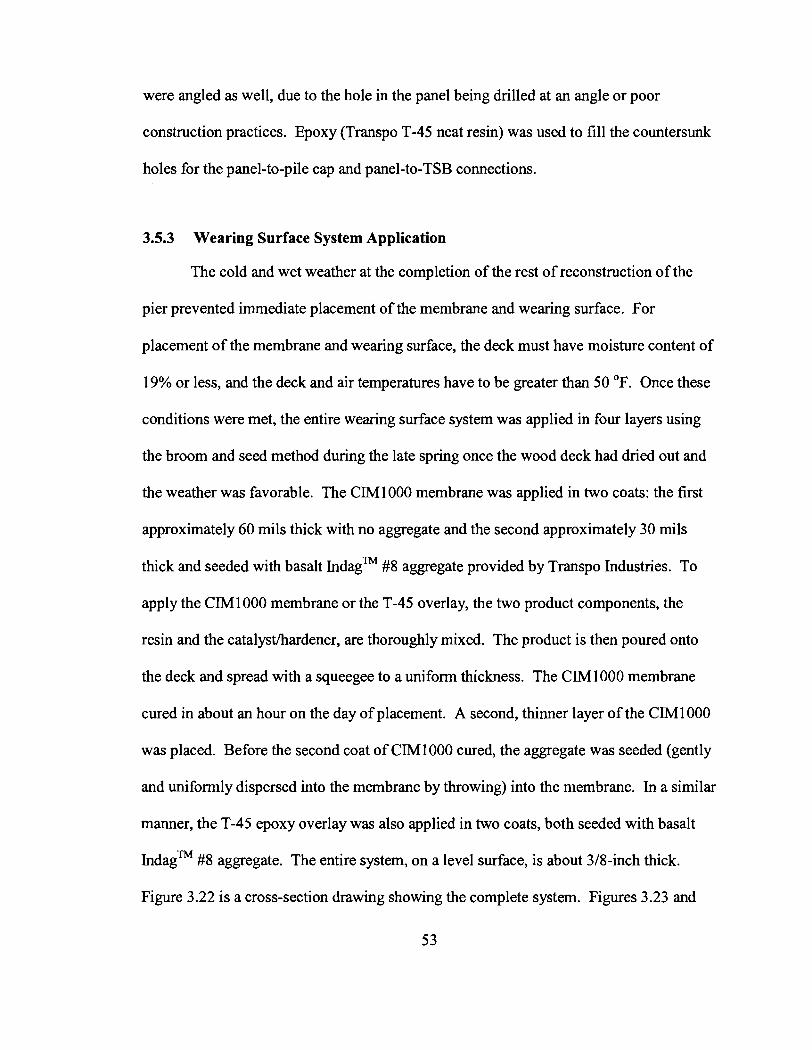
were angled as well, due to the hole in the panel being drilled at an angle or poor
construction practices. Epoxy (Transpo T-45 neat resin) was used to fill the countersunk
holes for the panel-to-pile cap and panel-to-TSB connections.
3.5.3 Wearing Surface System Application
The cold and wet weather at the completion of the rest of reconstruction of the
pier prevented immediate placement of the membrane and wearing surface. For
placement of the membrane and wearing surface, the deck must have moisture content of
19% or less, and the deck and air temperatures have to be greater than 50 OF. Once these
conditions were met, the entire wearing surface system was applied in four layers using
the broom and seed method during the late spring once the wood deck had dried out and
the weather was favorable. The CIM1000 membrane was applied in two coats: the first
approximately 60 mils thick with no aggregate and the second approximately 30 mils
thick and seeded with basalt Indagm #8 aggregate provided by Transpo Industries. To
apply the CIM1000 membrane or the T-45 overlay, the two product components, the
resin and the catalystthardener, are thoroughly mixed. The product is then poured onto
the deck and spread with a squeegee to a uniform thickness. The CIM1000 membrane
cured in about an hour on the day of placement. A second, thinner layer of the CIMl000
was placed. Before the second coat of CIM1000 cured, the aggregate was seeded (gently
and uniformly dispersed into the membrane by throwing) into the membrane. In a similar
manner, the T-45 epoxy overlay was also applied in two coats, both seeded with basalt
IndagTM #8 aggregate. The entire system, on a level surface, is about 318-inch thick.
Figure 3.22 is a cross-section drawing showing the complete system. Figures 3.23 and
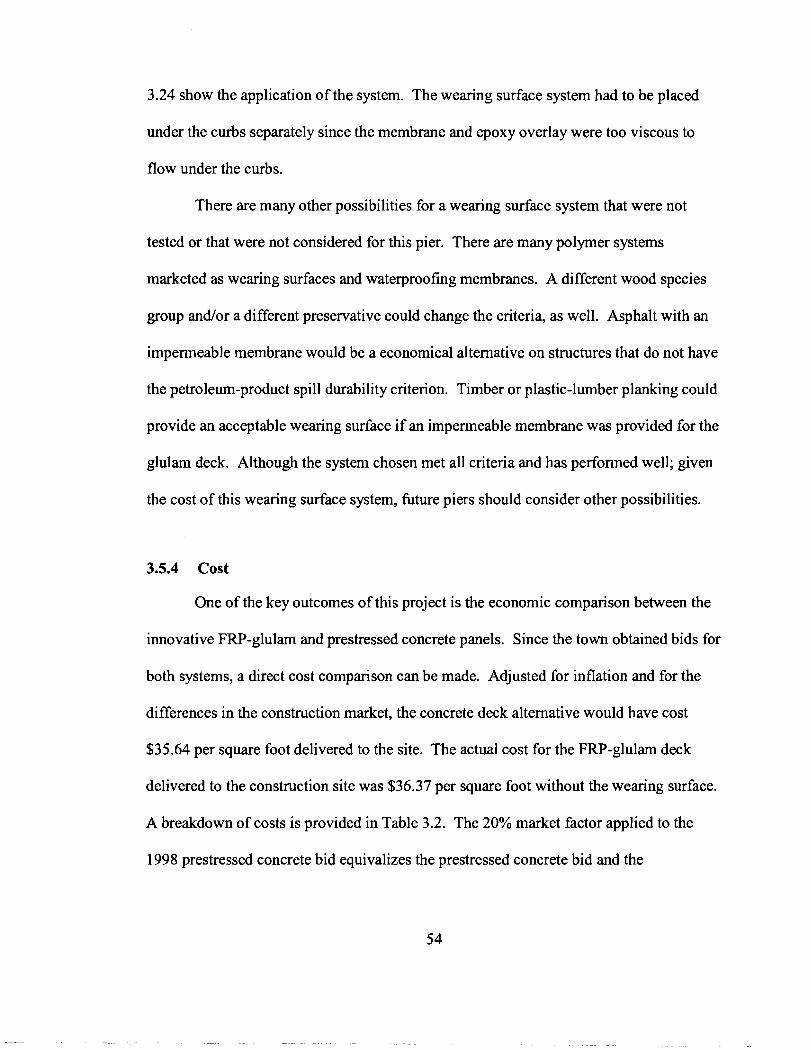
3.24 show the application of the system. The wearing surface system had to be placed
under the curbs separately since the membrane and epoxy overlay were too viscous to
flow under the curbs.
There are many other possibilities for a wearing surface system that were not
tested or that were not considered for this pier. There are many polymer systems
marketed as wearing surfaces and waterproofing membranes. A different wood species
group andor a different preservative could change the criteria, as well. Asphalt with an
impermeable membrane would be a economical alternative on structures that do not have
the petroleum-product spill durability criterion. Timber or plastic-lumber planking could
provide an acceptable wearing surface if an impermeable membrane was provided for the
glulanl deck. Although the system chosen met all criteria and has performed well; given
the cost of this wearing surface system, future piers should consider other possibilities.
3.5.4 Cost
One of the key outcomes of this project is the economic comparison between the
innovative FRP-glulam and prestressed concrete panels. Since the town obtained bids for
both systems, a direct cost comparison can be made. Adjusted for inflation and for the
differences in the construction market, the concrete deck alternative would have cost
$35.64 per square foot delivered to the site. The actual cost for the FRP-glulam deck
delivered to the construction site was $36.37 per square foot without the wearing surface.
A breakdown of costs is provided in Table 3.2. The 20% market factor applied to the
1998 prestressed concrete bid equivalizes the prestressed concrete bid and the
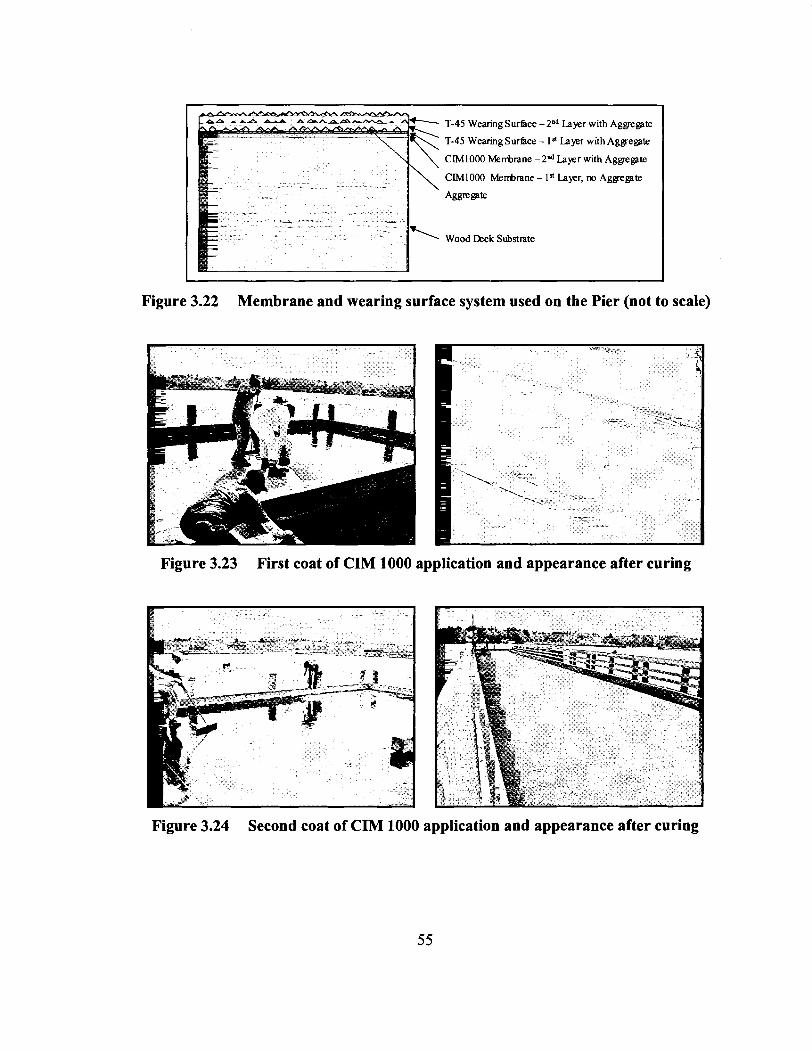
T-45 Wearing Surfice -2'* Layer with Aggregate
T-45 Wearing Surface - I L a p r with Aggregate
CMlOOO Mehrane - 2°d Layer with Aggregate
CIh4lOOO Menbane- I* Layer, m Aggregate
'".txregate
Wood B c k Substrate
Figure 3.22 Membrane and wearing surface system used on the Pier (not to scale)
Figure 3.23 First coat of CIM 1000 application and appearance after curing
Figure 3.24 Second coat of CIM 1000 application and appearance after curing
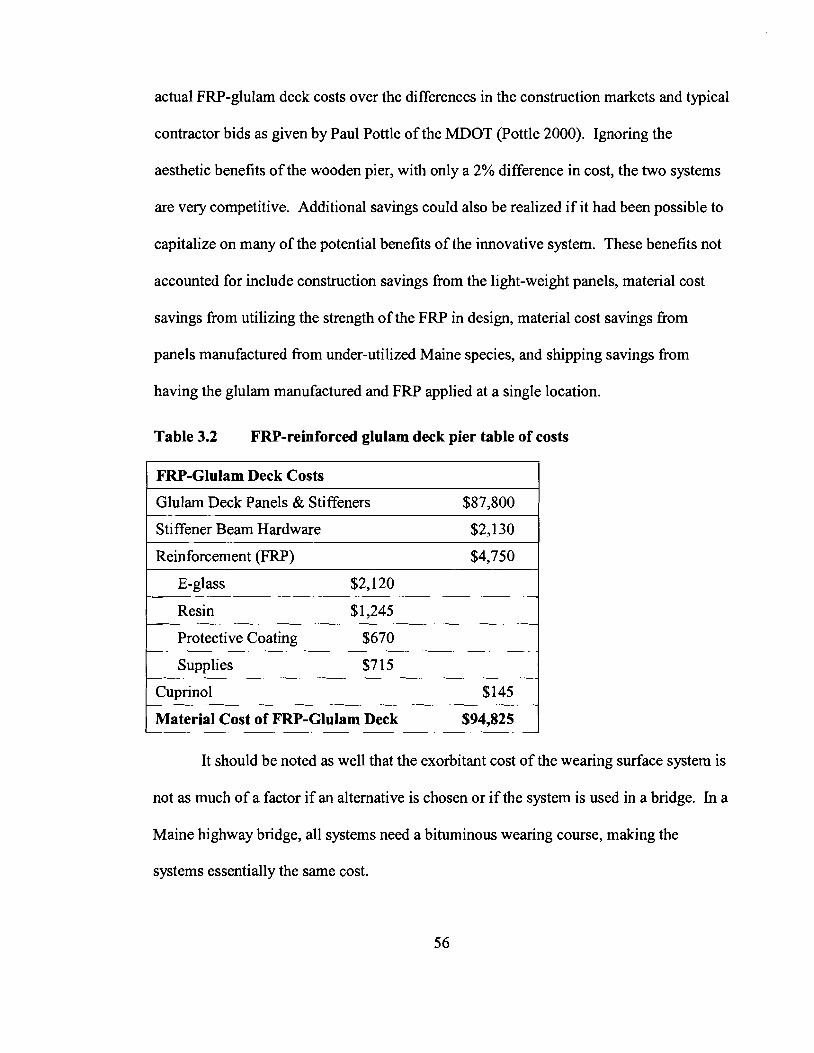
actual FRP-glulam deck costs over the differences in the construction markets and typical
contractor bids as given by Paul Pottle of the MDOT (Pottle 2000). Ignoring the
aesthetic benefits of the wooden pier, with only a 2% difference in cost, the two systems
are very competitive. Additional savings could also be realized if it had been possible to
capitalize on many of the potential benefits of the innovative system. These benefits not
accounted for include construction savings from the light-weight panels, material cost
savings from utilizing the strength of the FRP in design, material cost savings from
panels manufactured from under-utilized Maine species, and shipping savings from
having the glulam manufactured and FRP applied at a single location.
Table 3.2 FRP-reinforced glulam deck pier table of costs
FRP-Glulam Deck Costs
Glulam Deck Panels & Stiffeners $87,800
Stiffener Beam Hardware $2,130
Reinforcement (FRP) $4,750
Resin $1,245
Protective Coating $670
Supplies $7 15
Cuprinol $145
Material Cost of FRP-Glulam Deck $94,825
It should be noted as well that the exorbitant cost of the wearing surface system is
not as much of a factor if an alternative is chosen or if the system is used in a bridge. In a
Maine highway bridge, all systems need a bituminous wearing course, making the
systems essentially the same cost.
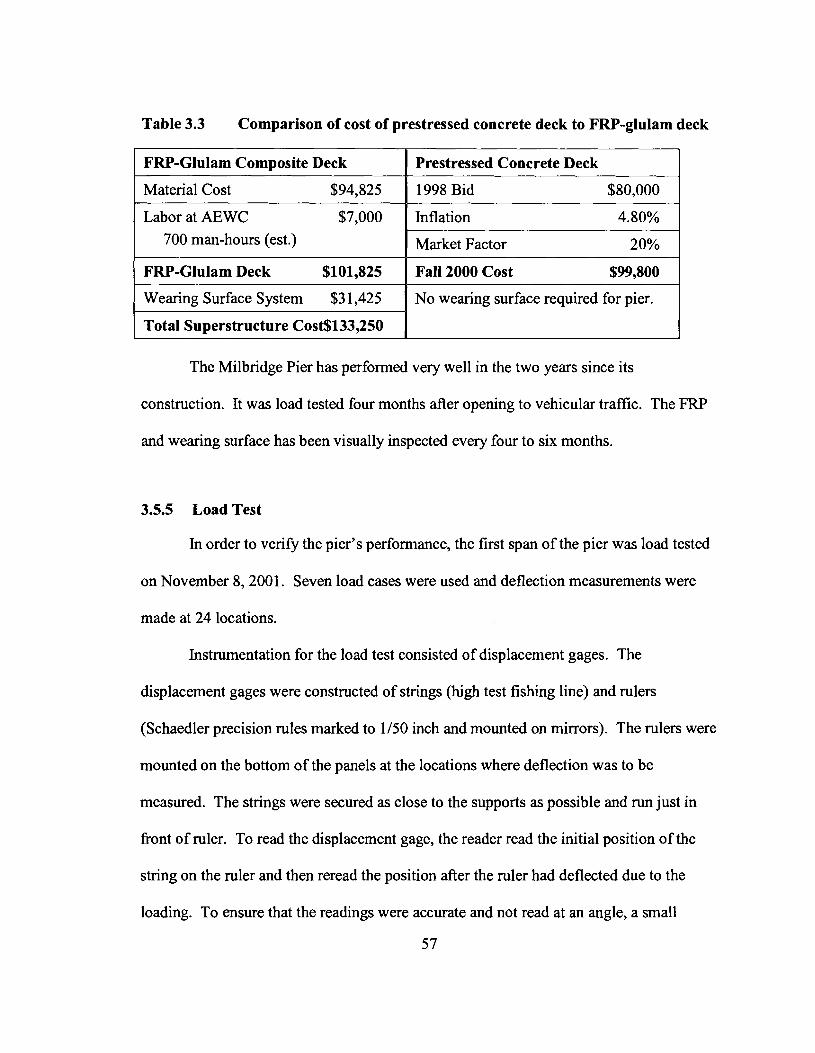
Table 3.3 Comparison of cost of prestressed concrete deck to FRP-glulam deck
FRP-Glulam Composite Deck I Prestressed Concrete Deck - -
Material Cost $94,825 1 1998 Bid $80,000
Labor at AEWC $7,000 700 man-hours (est.)
Total Superstructure Cost$133,250
The Milbridge Pier has performed very well in the two years since its
Inflation 4.80%
Market Factor 20%
FRP-Glulam Deck $101,825
Wearing Surface System $3 1,425
construction. It was load tested four months after opening to vehicular traffic. The FRP
and wearing surface has been visually inspected every four to six months.
Fall 2000 Cost $99,800
No wearing surface required for pier.
3.5.5 Load Test
In order to verifL the pier's performance, the first span of the pier was load tested
on November 8,2001. Seven load cases were used and deflection measurements were
made at 24 locations.
Instrumentation for the load test consisted of displacement gages. The
displacement gages were constructed of strings (high test fishing line) and rulers
(Schaedler precision rules marked to 1/50 inch and mounted on mirrors). The rulers were
mounted on the bottom of the panels at the locations where deflection was to be
measured. The strings were secured as close to the supports as possible and run just in
fiont of ruler. To read the displacement gage, the reader read the initial position of the
string on the ruler and then reread the position after the ruler had deflected due to the
loading. To ensure that the readings were accurate and not read at an angle, a small
5 7

amount of mirror was visible on the side of the ruler. If the gage had been read correctly
(the reader's eye at the same level as the string), the reader would have only been able to
see a single string in the mirror. Figure 3.25 shows a closeup of the displacement gage.
Figure 3.26 shows how the gage works. The system measured displacement fiom the
bottom of the panels rather than the neutral axis since the neutral axis was inaccessible
and automatically adjusted for any support settlement. Displacements were measured at
two locations per panel near midspan, at two locations per panel at quarter span, and at
eight locations along the TSB (Figure 3.29).
The truck used for the test is shown in Figure 3.28. Its footprint with the gravity
load fiom each set of tires is shown in Appendix B. The actual truck tire positions in the
seven load cases are given in Figures 3.29 through 3.32. Load cases # 2 and 3 are
reasonable mirrors of each other, as are Load Cases #4 and 5 and Load Cases #6 and 7.
However, a small difference in tire position can result in a different loading. This can be
seen when comparing Load Case #4 and 5 (Figure 3.3 1). In Load Case #4, each wheel
line loads a single panel, but in Load Case #5, one wheel line of loading is carried by two
panels. This loading change also occurred between Load Cases #6 and 7.
The load test results are presented in the following graphs and Appendix B. The
deck did not behave symmetrically. There are several possible explanations for this.
Some of the panels were bowed, and this would have made them stiffer (Figure 3.37). As
can be seen in the MOE tests of the panels used in the laboratory tests reported in Chapter
4, there can be considerable variation in stifhess anlong the panels. The movement of
the string for the displacement gages fourth fiom the left may have been restricted.
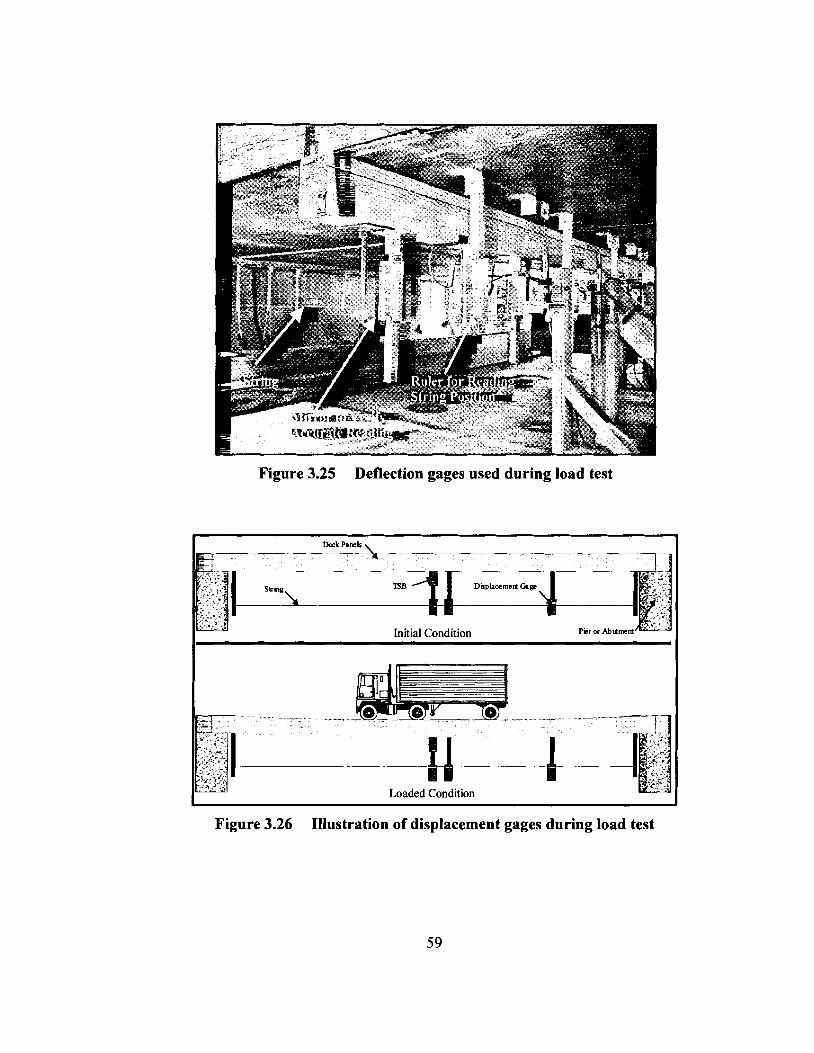
Figure 3.25 Deflection gages used during load test
I Deck Pank \
Dapkcemen Cage
Pier or Abllme
Loaded Condition
Figure 3.26 Illustration of displacement gages during load test
Figure 3.27 Instrumentation for deflection measurements for load test
Figure 3.28 Truck used for load test
Load Care 1 frx Pkr Span #I Plan V*w
Twe Set ll (UYYY
r i a set* 7YY*
Pmel W
Figure 3.29 Load Case #1 for Milbridge Pier Load Test
60
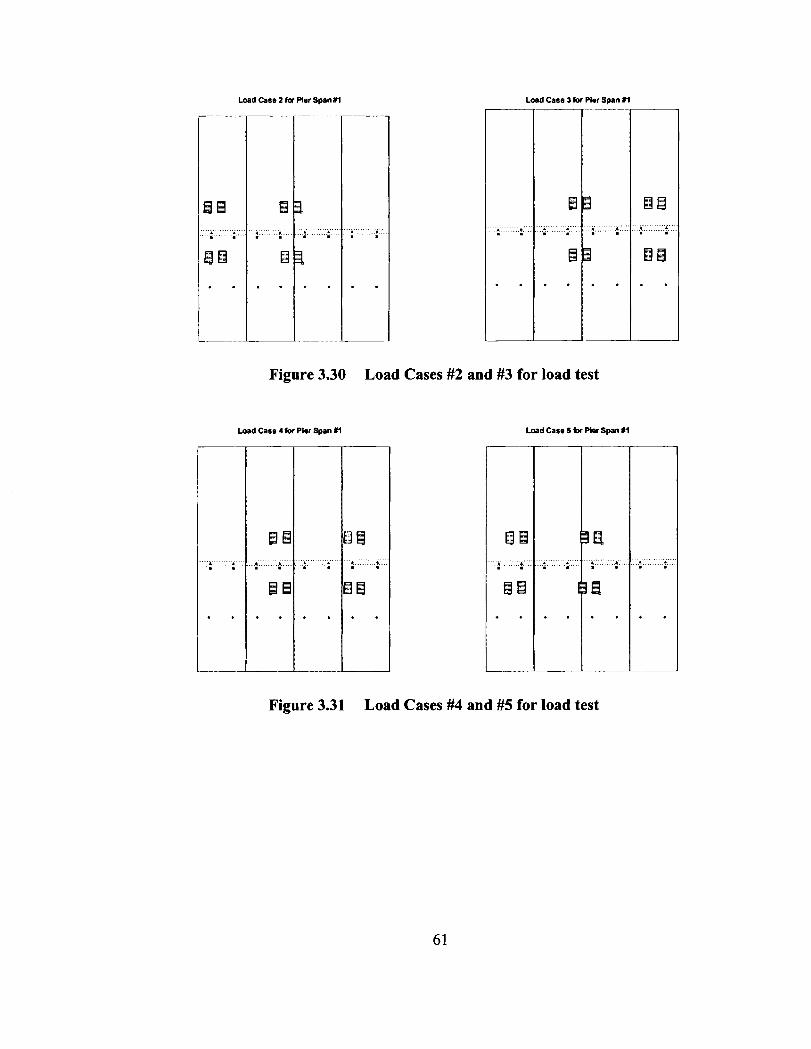
Load Case 2 f a Pler Spanltl Load Case 3 fur Pier Span #I
........... . A ........ t.. . .
. .
Figure 3.30 Load Cases #2 and #3 for load test
Load Case 4for Pier Span ltl Load Case 5 k Pier Spur I 1
Figure 3.31 Load Cases #4 and #5 for load test
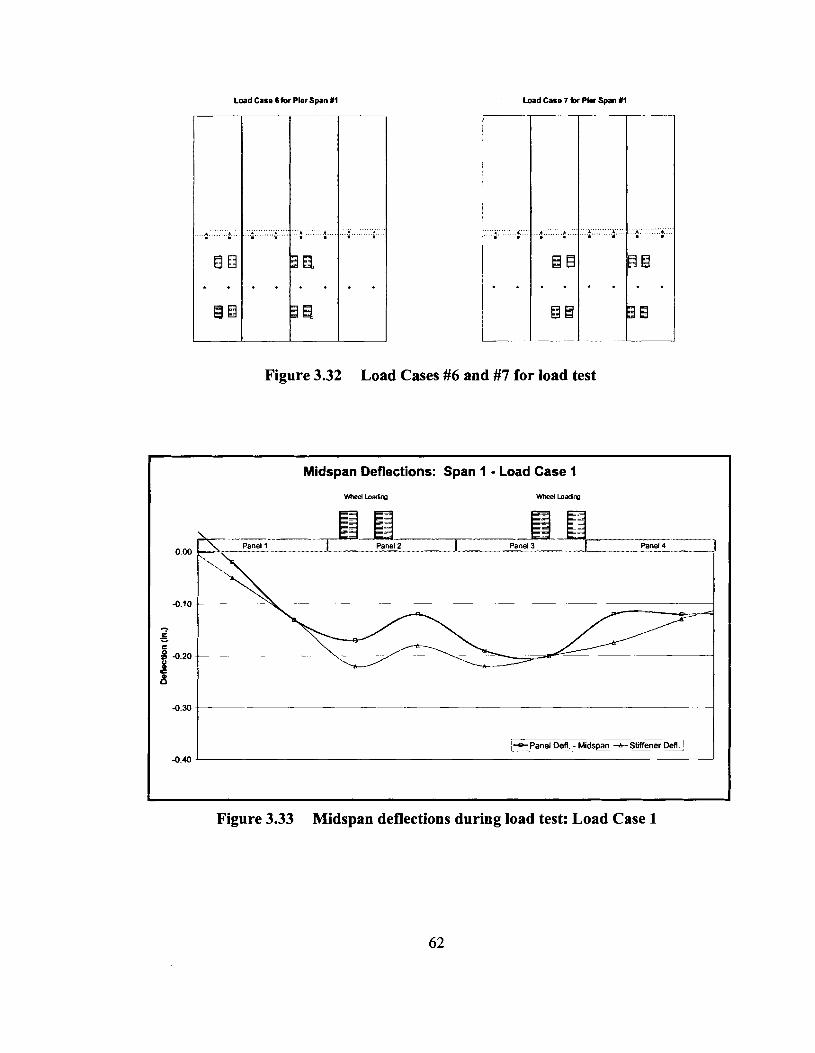
Load Case 6 for Pler Span #I Load Case 7 W Pbr S p a Itl
Figure 3.32 Load Cases #6 and #7 for load test
Midspan Deflections: Span 1 - Load Case 1
med Loa3rg Wheel L o a m
0.00
-0.10
T - - t -0.20
z
-- ~ e ~ d ~ a n *Stiffener Defl. I
-0.40
Figure 3.33 Midspan deflections during load test: Load Case 1
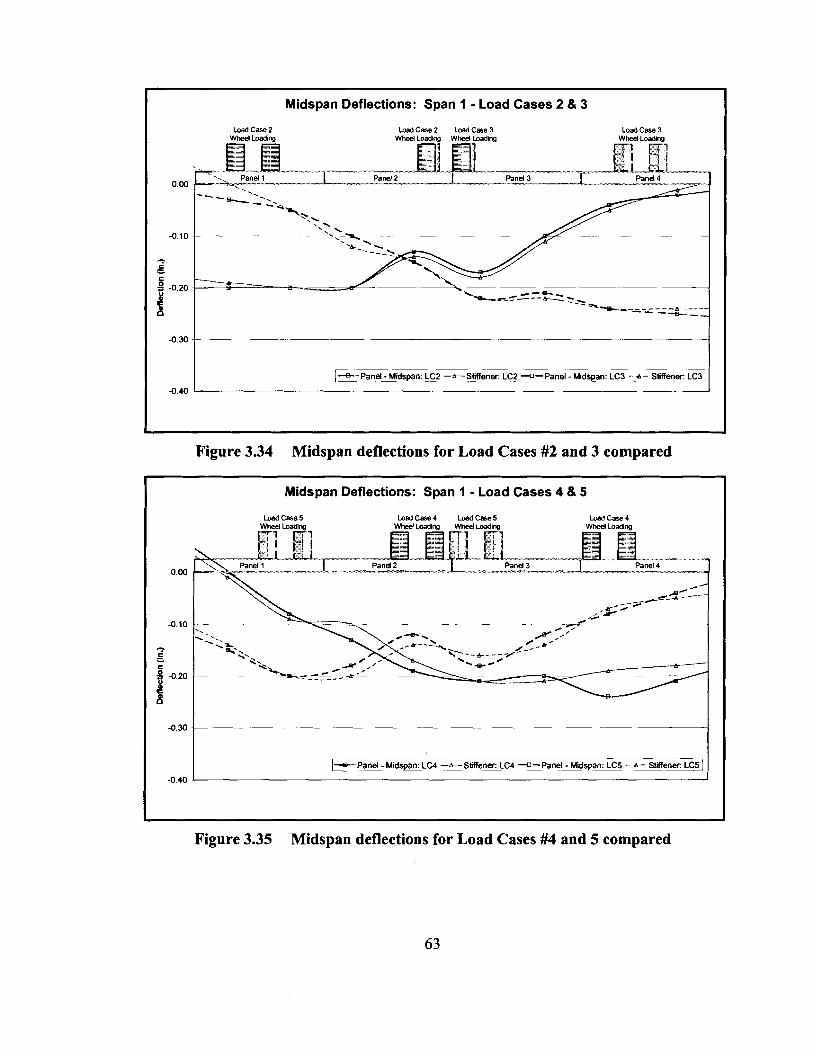
Midspan Deflections: Span 1 - Load Cases 2 8 3
Figure 3.34 Midspan deflections for Load Cases #2 and 3 compared
Midspan Deflections: Span 1 - Load Cases 4 8 5
Load Care 5 Load Case 4 Load Case 5 Load Case4
- -- +-panel - Midspan: LC4 -Stiffener: LC4 -0-Panel - Mdspan: LC5 - * - Stiffener: L C ~
Figure 3.35 Midspan deflections for Load Cases #4 and 5 compared
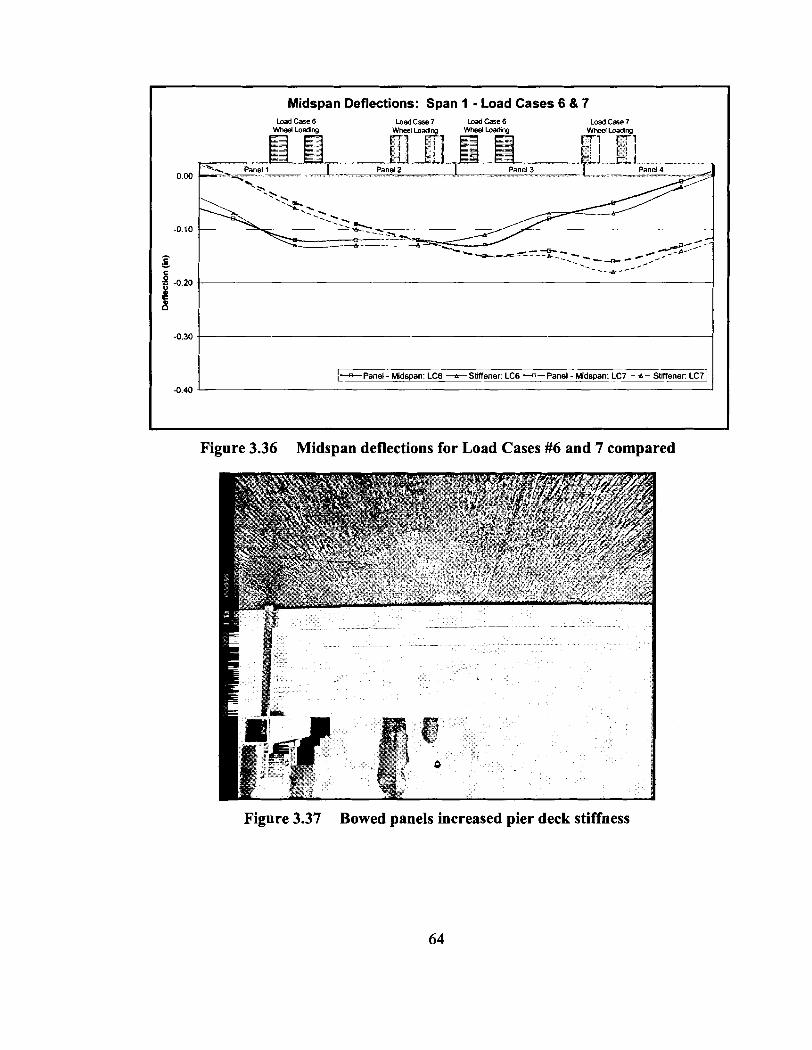
Midspan Deflections: Span 1 - Load Cases 6 & 7
L - p a n e l - Midspan: LC6 -Stiffener: LC6 ----Panel - Midspan: LC7 - 4- Stiffener: LC7 1
Figure 3.36 Midspan deflections for Load Cases #6 and 7 compared
Figure 3.37 Bowed panels increased pier deck stiffness
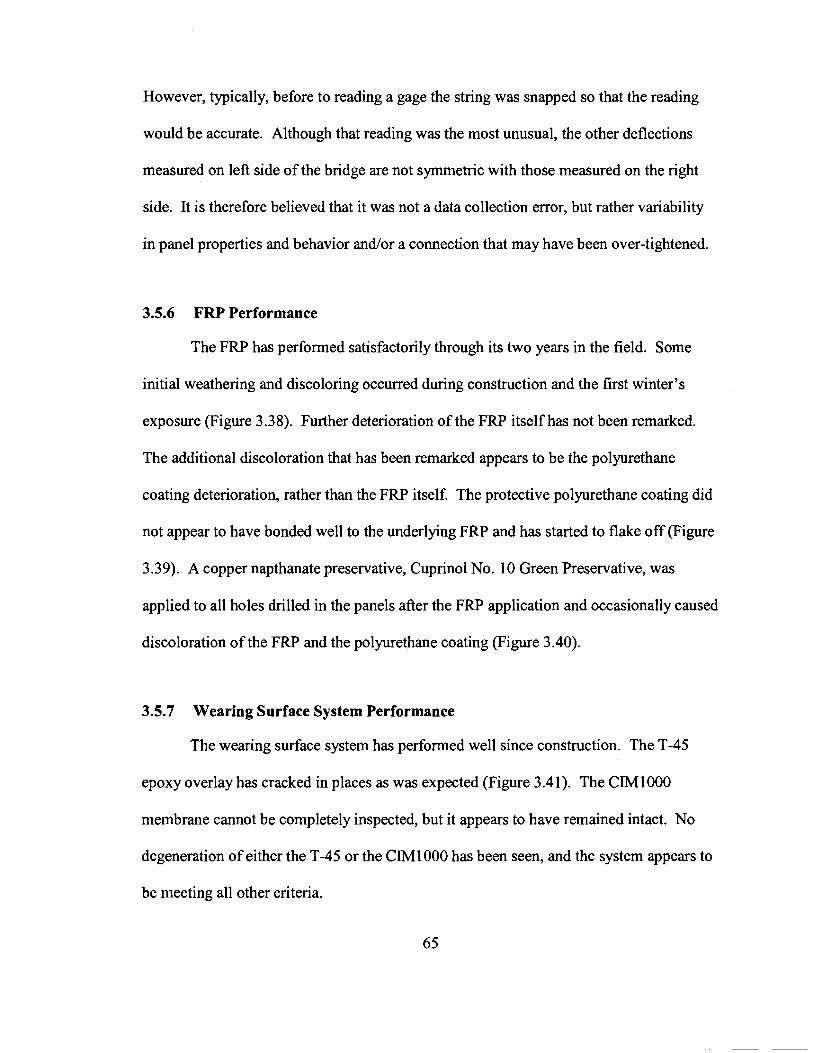
However, typically, before to reading a gage the string was snapped so that the reading
would be accurate. Although that reading was the most unusual, the other deflections
measured on left side of the bridge are not symmetric with those measured on the right
side. It is therefore believed that it was not a data collection error, but rather variability
in panel properties and behavior andlor a connection that may have been over-tightened.
3.5.6 FRP Performance
The FRP has performed satisfactorily through its two years in the field. Some
initial weathering and discoloring occurred during construction and the first winter's
exposure (Figure 3.38). Further deterioration of the FRP itself has not been remarked.
The additional discoloration that has been remarked appears to be the polyurethane
coating deterioration, rather than the FRP itself. The protective polyurethane coating did
not appear to have bonded well to the underlying FRP and has started to flake off (Figure
3.39). A copper napthanate preservative, Cuprinol No. 10 Green Preservative, was
applied to all holes dnlled in the panels after the FRP application and occasionally caused
discoloration of the FRP and the polyurethane coating (Figure 3.40).
3.5.7 Wearing Surface System Performance
The wearing surface system has performed well since construction. The T-45
epoxy overlay has cracked in places as was expected (Figure 3.41). The CIMlOOO
membrane cannot be completely inspected, but it appears to have remained intact. No
degeneration of either the T-45 or the CIM1000 has been seen, and the system appears to
be meeting all other criteria.
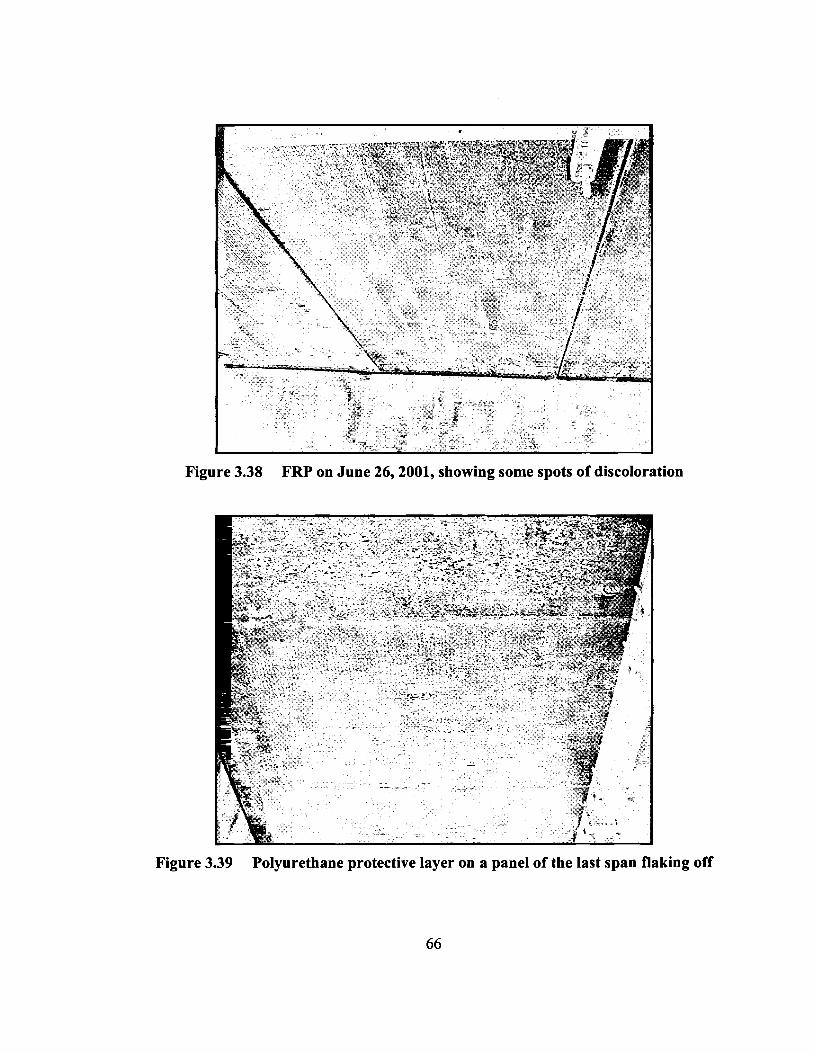
Figure 3.38 FRP on June 26,2001, showing some spots of discoloration
Figure 3.39 Polyurethane protective layer on a panel of the last span flaking off
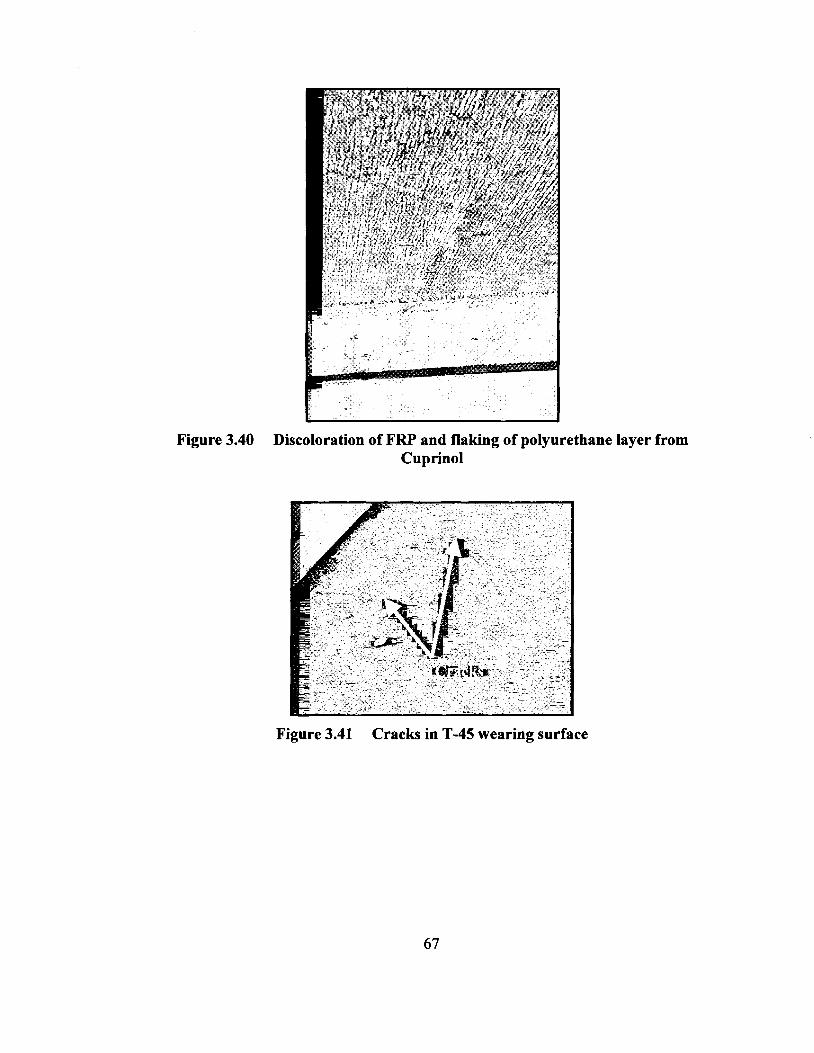
Figure 3.40 Discoloration of FRP and flaking of polyurethane layer from Cuprinol
Figure 3.41 Cracks in T-45 wearing surface

3.6 Conclusions
The study has shown that FRP-reinforced glulam panels can be used in a
longitudinal glulam deck bridge as an economically competitive alternative. Additional
savings could be realized in other reconstruction situations and once large-scale
production has begun, further lowering the cost of the system. The wearing surface
system used is performing very well, but an alternative should be chosen for other
situations due to the high cost. The pier has been load tested and inspected and is
performing adequately.
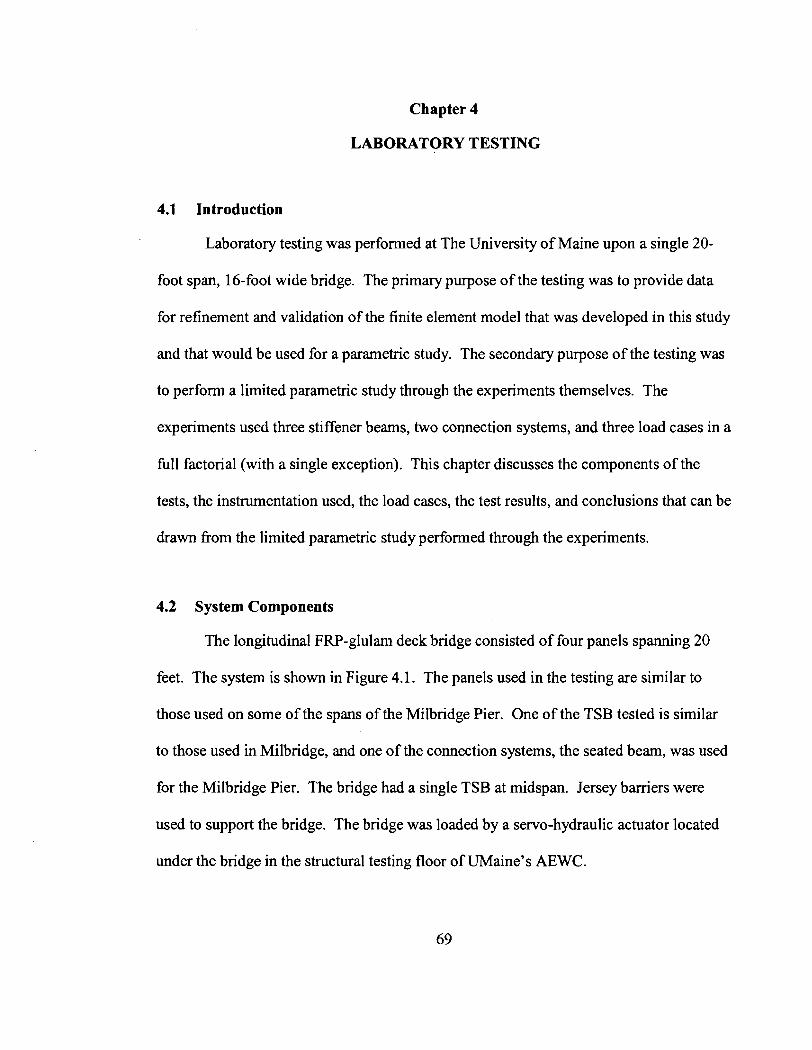
Chapter 4
LABORATORY TESTING
4.1 Introduction
Laboratory testing was performed at The University of Maine upon a single 20-
foot span, 16-foot wide bridge. The primary purpose of the testing was to provide data
for refinement and validation of the finite element model that was developed in this study
and that would be used for a parametric study. The secondary purpose of the testing was
to perfoml a limited parametric study through the experiments themselves. The
experiments used three stiffener beams, two connection systems, and three load cases in a
full factorial (with a single exception). This chapter discusses the components of the
tests, the instrumentation used, the load cases, the test results, and conclusions that can be
drawn ftom the limited parametric study performed through the experiments.
4.2 System Components
The longitudinal FRP-glulam deck bridge consisted of four panels spanning 20
feet. The system is shown in Figure 4.1. The panels used in the testing are similar to
those used on some of the spans of the Milbridge Pier. One of the TSB tested is similar
to those used in Milbridge, and one of the connection systems, the seated beam, was used
for the Milbridge Pier. The bridge had a single TSB at midspan. Jersey barriers were
used to support the bridge. The bridge was loaded by a servo-hydraulic actuator located
under the bridge in the structural testing floor of UMaine's AEWC.
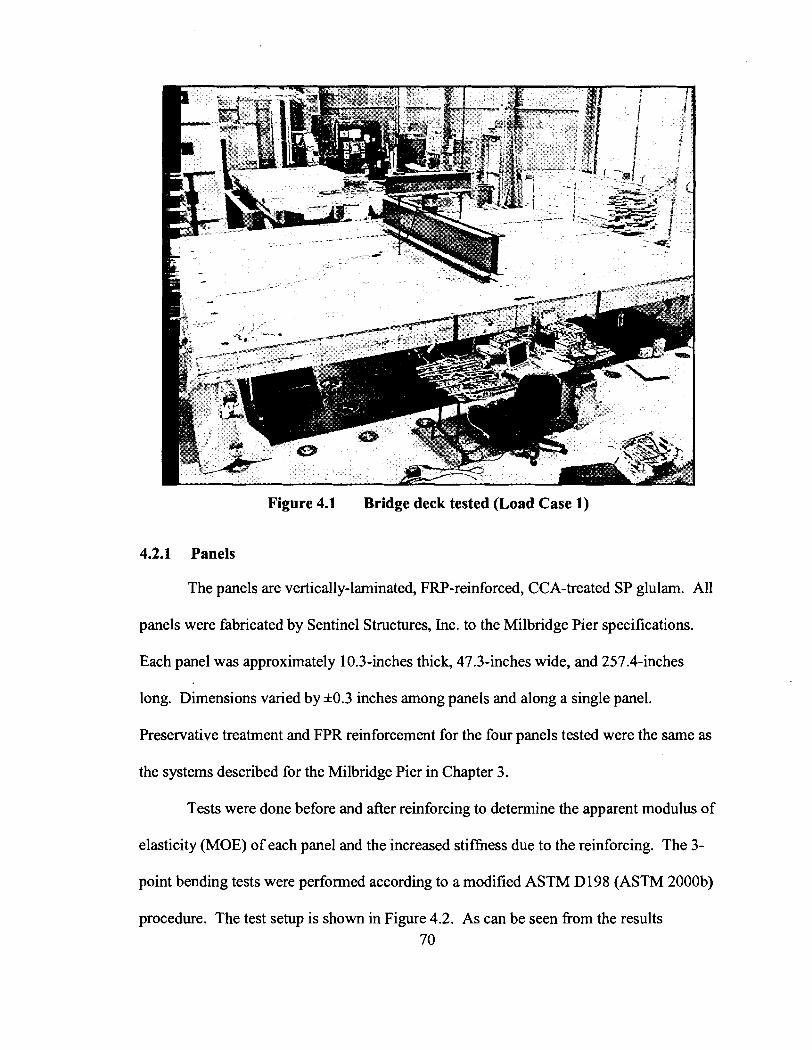
Figure 4.1 Bridge deck tested (Load Case 1)
4.2.1 Panels
The panels are vertically-laminated, FRP-reinforced, CCA-treated SP glulam. All
panels were fabricated by Sentinel Structures, Inc. to the Milbridge Pier specifications.
Each panel was approximately 10.3-inches thick, 47.3-inches wide, and 257.4-inches
long. Dimensions varied by *0.3 inches among panels and along a single panel.
Preservative treatment and FPR reinforcement for the four panels tested were the same as
the systems described for the Milbridge Pier in Chapter 3.
Tests were done before and after reinforcing to determine the apparent modulus of
elasticity (MOE) of each panel and the increased stiffness due to the reinforcing. The 3-
point bending tests were performed according to a modified ASTM Dl98 (ASTM 2000b)
procedure. The test setup is shown in Figure 4.2. As can be seen fiom the results 70
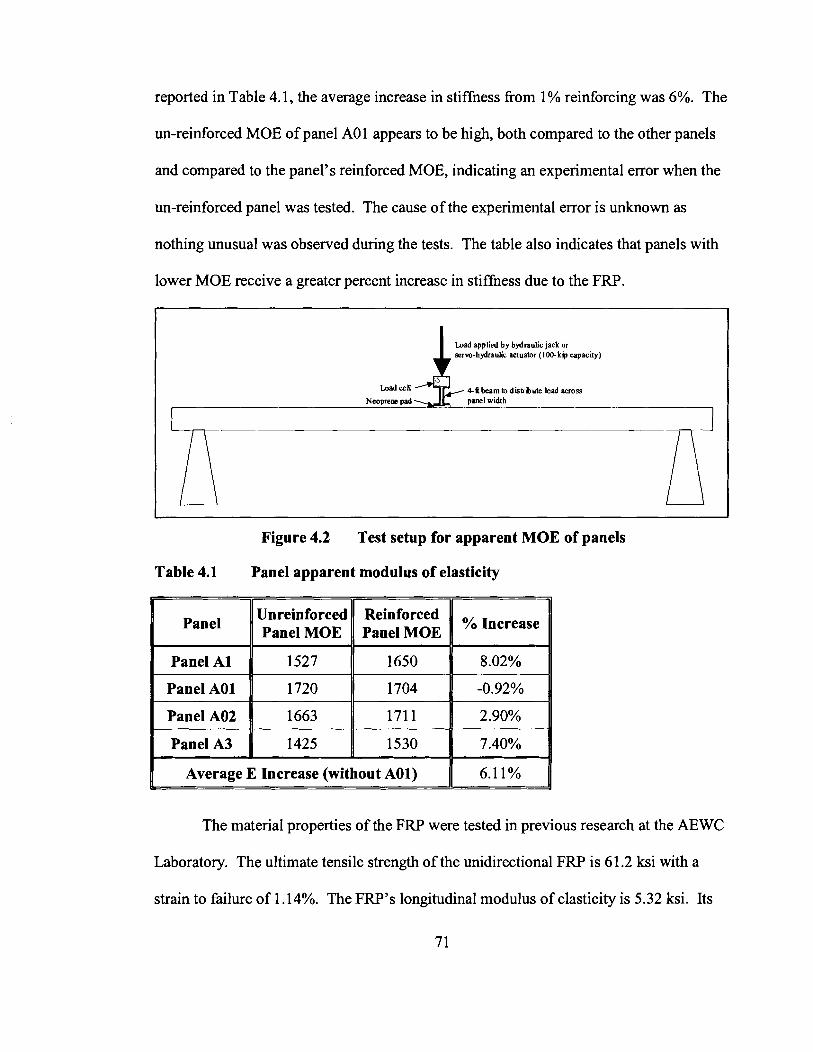
reported in Table 4.1, the average increase in stiffness fi-om 1 % reinforcing was 6%. The
un-reinforced MOE of panel A0 1 appears to be high, both compared to the other panels
and compared to the panel's reinforced MOE, indicating an experimental error when the
un-reinforced panel was tested. The cause of the experimental error is unknown as
nothing unusual was observed during the tests. The table also indicates that panels with
lower MOE receive a greater percent increase in stiffness due to the FRP.
Load applied by bydnuhc jack or servo-hydraulic actuator (IlWkp capacdy)
Load eel1
Neaprea pad
Figure 4.2 Test setup for apparent MOE of panels
Table 4.1 Panel apparent modulus of elasticity
The material properties of the FRP were tested in previous research at the AEWC
Laboratory. The ultimate tensile strength of the unidirectional FRP is 61.2 ksi with a
strain to failure of 1.14%. The FRP's longitudinal modulus of elasticity is 5.32 ksi. Its
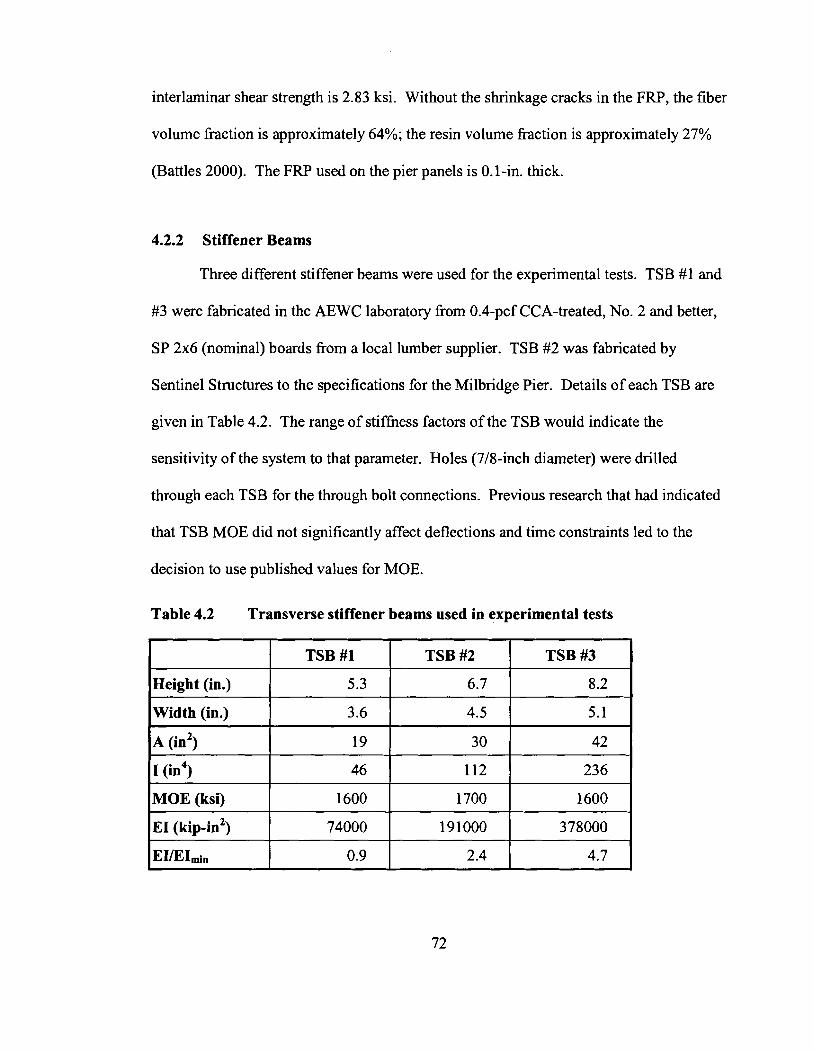
interlaminar shear strength is 2.83 ksi. Without the shrinkage cracks in the FRP, the fiber
volume fraction is approximately 64%; the resin volume fraction is approximately 27%
(Battles 2000). The FRP used on the pier panels is 0.1-in. thick.
4.2.2 Stiffener Beams
Three different stiffener beams were used for the experimental tests. TSB #1 and
#3 were fabricated in the AEWC laboratory from 0.4-pcf CCA-treated, No. 2 and better,
SP 2x6 (nominal) boards from a local lumber supplier. TSB #2 was fabricated by
Sentinel Structures to the specifications for the Milbridge Pier. Details of each TSB are
given in Table 4.2. The range of stiffhess factors of the TSB would indicate the
sensitivity of the system to that parameter. Holes (718-inch diameter) were drilled
through each TSB for the through bolt connections. Previous research that had indicated
that TSB MOE did not significantly affect deflections and time constraints led to the
decision to use published values for MOE.
Table 4.2 Transverse stiffener beams used in experimental tests
Height (in.)
Width (in.) - -
A (in2)
I (in4)
MOE (ksi)
EI (kip-in2)
EIEImin
TSB #3
8.2
5.1
TSB #1
5.3
3.6
19
46
1600
74000
0.9
TSB #2
6.7
4.5
30
112
1700
191000
2.4
42
236
1600
378000
4.7
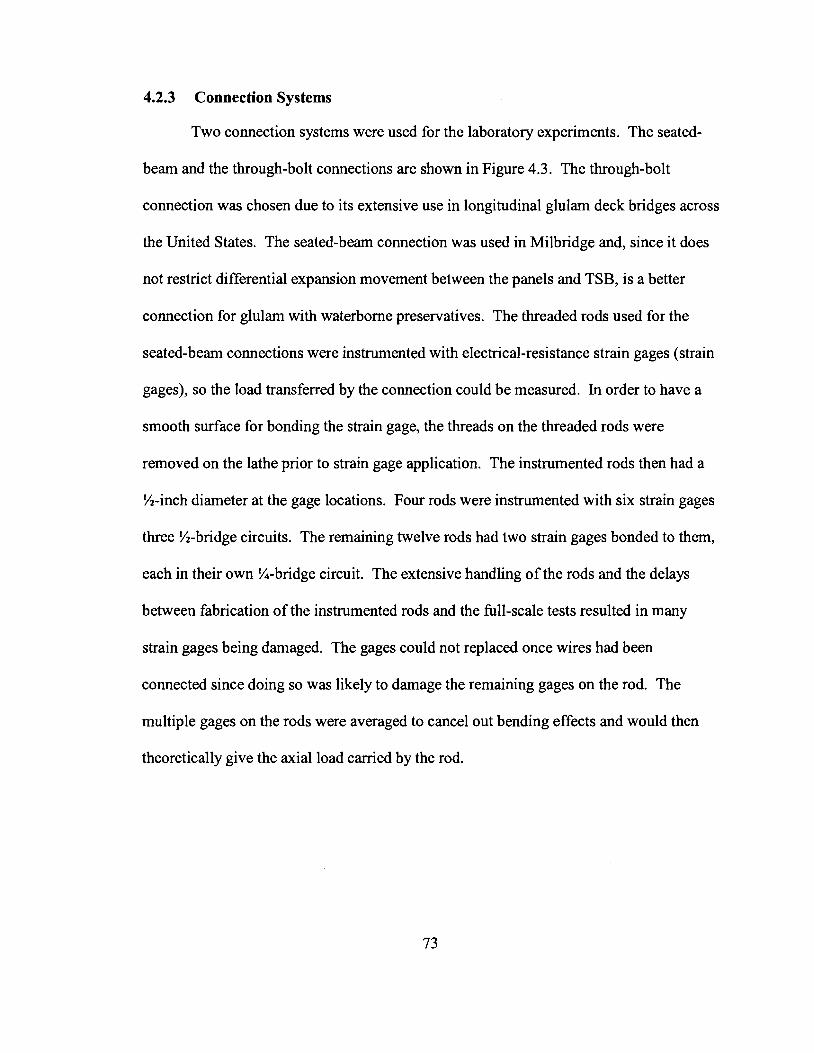
4.2.3 Connection Systems
Two connection systems were used for the laboratory experiments. The seated-
beam and the through-bolt connections are shown in Figure 4.3. The through-bolt
connection was chosen due to its extensive use in longitudinal glulam deck bridges across
the United States. The seated-beam connection was used in Milbridge and, since it does
not restrict differential expansion movement between the panels and TSB, is a better
connection for glulam with waterborne preservatives. The threaded rods used for the
seated-beam connections were instrumented with electrical-resistance strain gages (strain
gages), so the load transferred by the connection could be measured. In order to have a
smooth surface for bonding the strain gage, the threads on the threaded rods were
removed on the lathe prior to strain gage application. The instrumented rods then had a
%-inch diameter at the gage locations. Four rods were instrumented with six strain gages
three %-bridge circuits. The remaining twelve rods had two strain gages bonded to them,
each in their own %-bridge circuit. The extensive handling of the rods and the delays
between fabrication of the instrumented rods and the full-scale tests resulted in many
strain gages being damaged. The gages could not replaced once wires had been
connected since doing so was likely to damage the remaining gages on the rod. The
multiple gages on the rods were averaged to cancel out bending effects and would then
theoretically give the axial load carried by the rod.
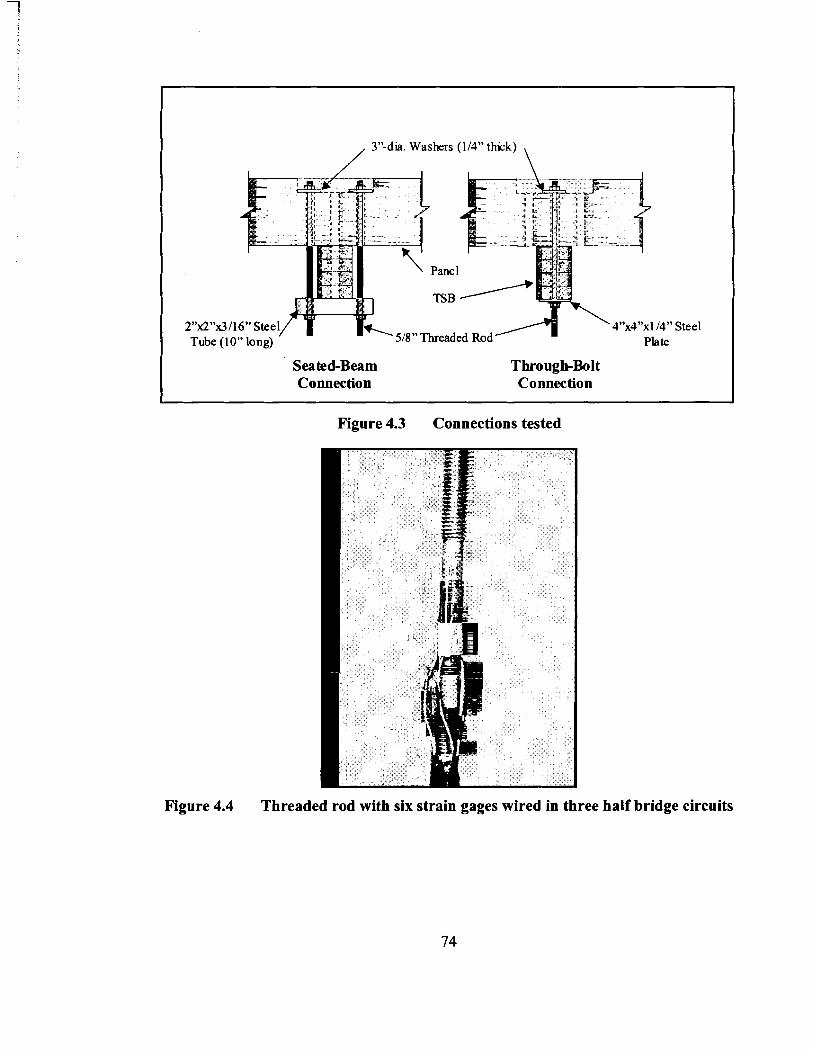
/ 3"-dia. Washers (114" thick)
\
Seated-Beam Connection
Through-Bolt Co~ect ion
Figure 4.3 Connections tested
Figure 4.4 Threaded rod with six strain gages wired in three half bridge circuits
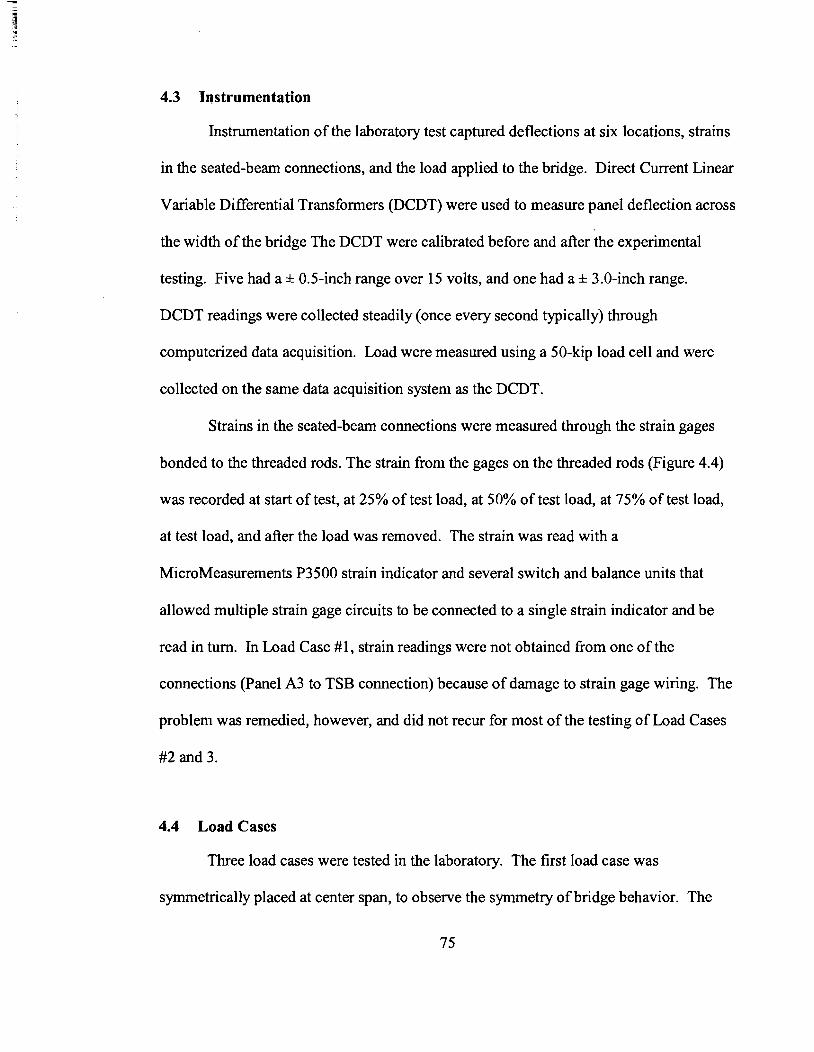
4.3 Instrumentation
Instrumentation of the laboratory test captured deflections at six locations, strains
in the seated-beam connections, and the load applied to the bridge. Direct Current Linear
Variable Differential Transforn~ers (DCDT) were used to measure panel deflection across
the width of the bridge The DCDT were calibrated before and after the experimental
testing. Five had a * 0.5-inch range over 15 volts, and one had a * 3.0-inch range.
DCDT readings were collected steadily (once every second typically) through
computerized data acquisition. Load were measured using a 50-kip load cell and were
collected on the same data acquisition system as the DCDT.
Strains in the seated-beam connections were measured through the strain gages
bonded to the threaded rods. The strain from the gages on the threaded rods (Figure 4.4)
was recorded at start of test, at 25% of test load, at 50% of test load, at 75% of test load,
at test load, and after the load was removed. The strain was read with a
MicroMeasurements P3500 strain indicator and several switch and balance units that
allowed multiple strain gage circuits to be connected to a single strain indicator and be
read in turn. In Load Case #1, strain readings were not obtained fiom one of the
connections (Panel A3 to TSB connection) because of damage to strain gage wiring. The
problem was remedied, however, and did not recur for most of the testing of Load Cases
#2 and 3.
4.4 Load Cases
Three load cases were tested in the laboratory. The first load case was
symmetrically placed at center span, to observe the symmetry of bridge behavior. The
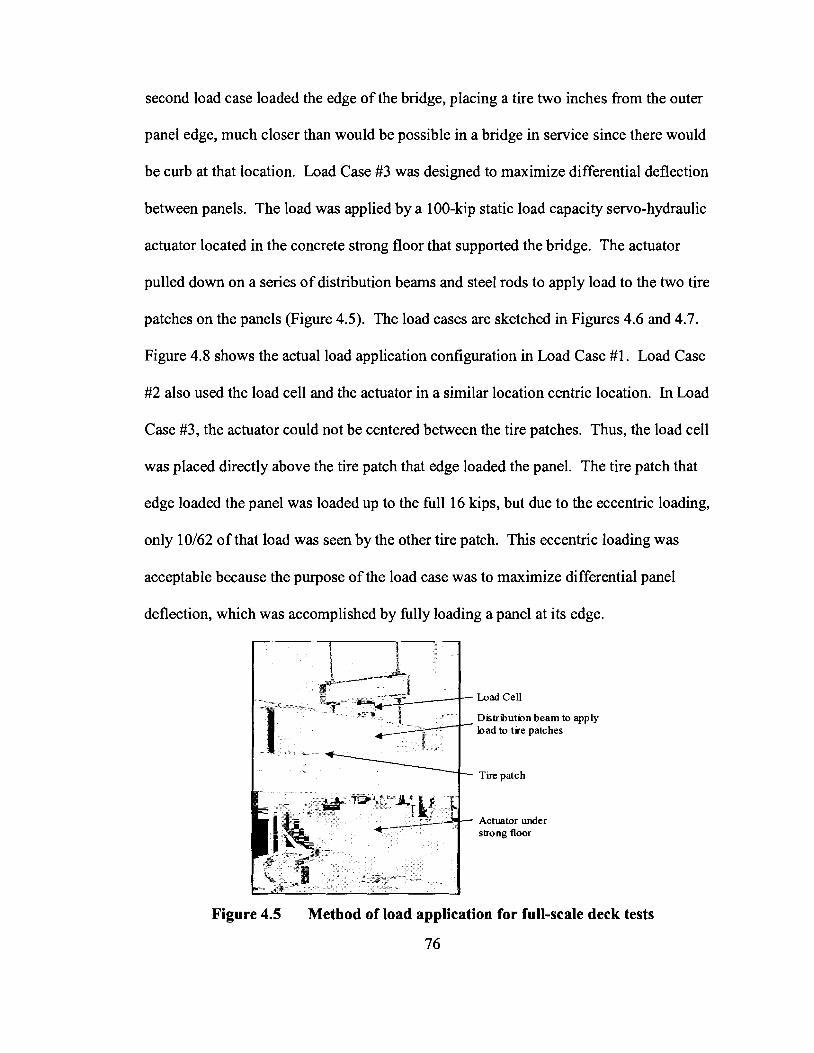
second load case loaded the edge of the bridge, placing a tire two inches from the outer
panel edge, much closer than would be possible in a bridge in service since there would
be curb at that location. Load Case #3 was designed to maximize differential deflection
between panels. The load was applied by a 100-kip static load capacity servo-hydraulic
actuator located in the concrete strong floor that supported the bridge. The actuator
pulled down on a series of distribution beams and steel rods to apply load to the two tire
patches on the panels (Figure 4.5). The load cases are sketched in Figures 4.6 and 4.7.
Figure 4.8 shows the actual load application configuration in Load Case #l . Load Case
#2 also used the load cell and the actuator in a similar location centric location. In Load
Case #3, the actuator could not be centered between the tire patches. Thus, the load cell
was placed directly above the tire patch that edge loaded the panel. The tire patch that
edge loaded the panel was loaded up to the full 16 kips, but due to the eccentric loading,
only 10162 of that load was seen by the other tire patch. This eccentric loading was
acceptable because the purpose of the load case was to maximize differential panel
deflection, which was accomplished by fully loading a panel at its edge.
Load Cell
Dskbution beam to bad to t ie patches
Tire patch
Actuator under skong floor
Figure 4.5 Method of load application for full-scale deck tests
76

Lab Test Load Case #I
Figure 4.6 Load Case #1
Lab Test Load Case #2 Lab Test Load Case #3
Panel A3
. . : i i . . ! j
Panel A02
. . : : : :
Panel A01 i i i i . . : i : : :. : i i : i :
Panel A: . . . . ::
Panel A02 1 ,
Panel A01
Figure 4.7 Load cases used in laboratory testing
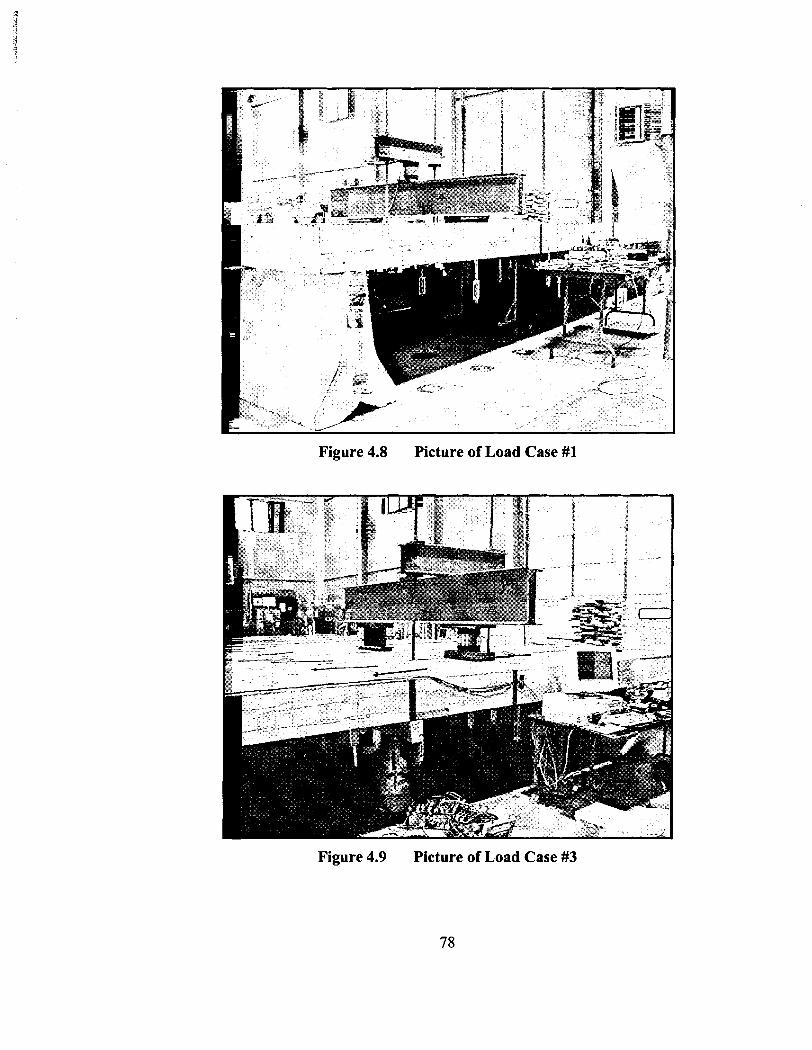
Figure 4.9 Picture of Load Case #3
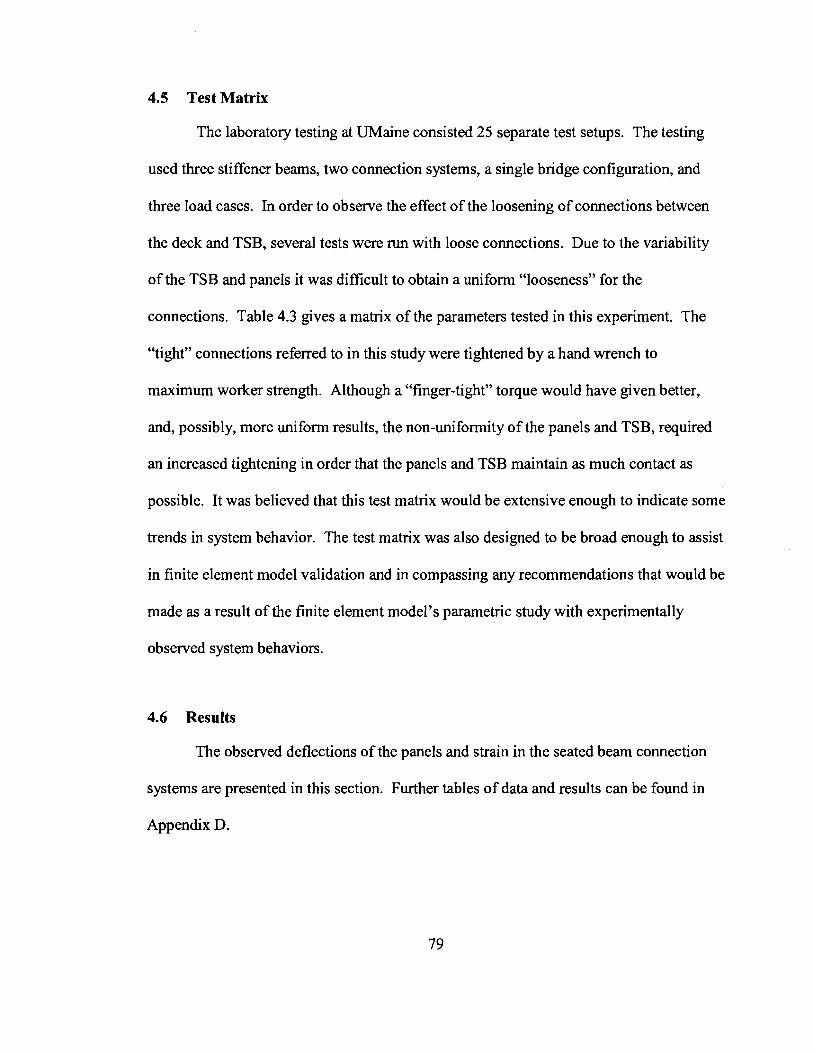
4.5 Test Matrix
The laboratory testing at UMaine consisted 25 separate test setups. The testing
used three stiffener beams, two connection systems, a single bridge configuration, and
three load cases. In order to observe the effect of the loosening of connections between
the deck and TSB, several tests were run with loose connections. Due to the variability
of the TSB and panels it was difficult to obtain a uniform "looseness" for the
connections. Table 4.3 gives a matrix of the parameters tested in this experiment. The
"tight" connections referred to in this study were tightened by a hand wrench to
maximum worker strength. Although a "finger-tight" torque would have given better,
and, possibly, more uniform results, the non-uniformity of the panels and TSB, required
an increased tightening in order that the panels and TSB maintain as much contact as
possible. It was believed that this test matrix would be extensive enough to indicate some
trends in system behavior. The test matrix was also designed to be broad enough to assist
in finite element model validation and in compassing any recommendations that would be
made as a result of the finite element model's parametric study with experimentally
observed system behaviors.
4.6 Results
The observed deflections of the panels and strain in the seated beam connection
systems are presented in this section. Further tables of data and results can be found in
Appendix D.

Table 4.3 Matrix of experiments performed for UMaine's full-scale bridge test
20-foot span, 16-foot width, four 48-in, wide,
10.5in. thick panels
Data Obtained Connection State of -- --
TSB# system connection Panel Threaded
Deflections Rod Strains
1 seated Beam 1 Ti:;; , * -1.. J Throuah Bolt J I *
Seated Beam Tight
-- Through Bolt 1 Tight I J x
#3 Seated Beam
Through Bolt 1 Tight J x
Seated Beam 1 Tight J J
Throuah Bolt I Tiaht I Seated Beam 1 Tight I J I J
Seated Beam i t 4
J J
Tight I J I J , 1 Seated Beam kz JI Through Bolt EE~ x
J I X
Seated Beam Tight _"_ J
#3 Through Bolt hWj Tight 1 ~ o o s e 1 J x

Figure 4.10 shows that when the midspan panel deflections of the through bolt
and seated beam connections for Load Case #1 are compared, the seated beam
connection's higher stiffness causes more of the load to be distributed to adjacent panels.
There is a 14% increase in maximum panel deflections comparing the through-bolt and
seated-beam connections. However, the figure also shows that if the connection is
loosened the stiffness of the connection is no longer as beneficial. Loosening of the
connection will occur in service due to creep, hygrothermal movement of the wood, etc.
Load Case #2 loads two adjacent panels on the edge of the bridge, a situation that
prevents much load distribution. Consequently, the stiffness of the connection system
does not significantly affect the panel deflections (Figure 4.1 1). Again, in Load Case #3,
where the load has been moved away from the TSB, the connection stiffness does not as
significantly affect the panel deflections (Figure 4.12). There is an inconsequential three
percent difference in panel deflections between the tight seated-beam and tight through-
bolt connections of Load Case #3. When the stiffer TSB#3 is used on the test bridge, the
connection system stiffness' effect on panel deflection is decreased (Figures 4.13,4.14,
and 4.15). (TSB #3 has twice the stiffness of TSB#2.) Typically, as the load has greater
opportunity to be transferred to other panels through the TSB and as the TSB's stiffness
increases panel deflections are more uniform. However, results may vary due to the
tightness (prestress) of the connection.
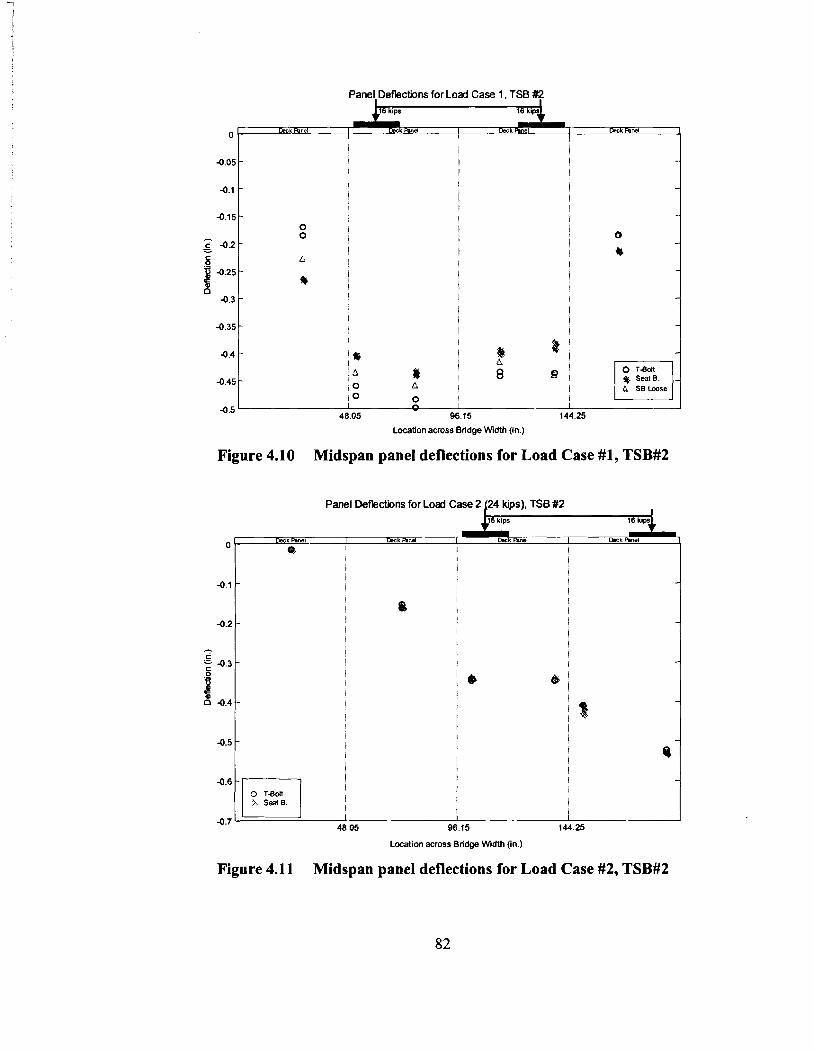
Panel,Deflections for Load Case 1, TSB #?
(f Seat 6. A SBLmse
Location across Bridge Width (in.)
Figure 4.10 Midspan panel deflections for Load Case #1, TSB#2
k nel 07 Panel Deflections for Load
4.6 0 TBdt h Seal 6.
4.7 - 48.05
Location across Bridge Width (in.)
Figure 4.1 1 Midspan panel deflections for Load Case #2, TSB#2
82
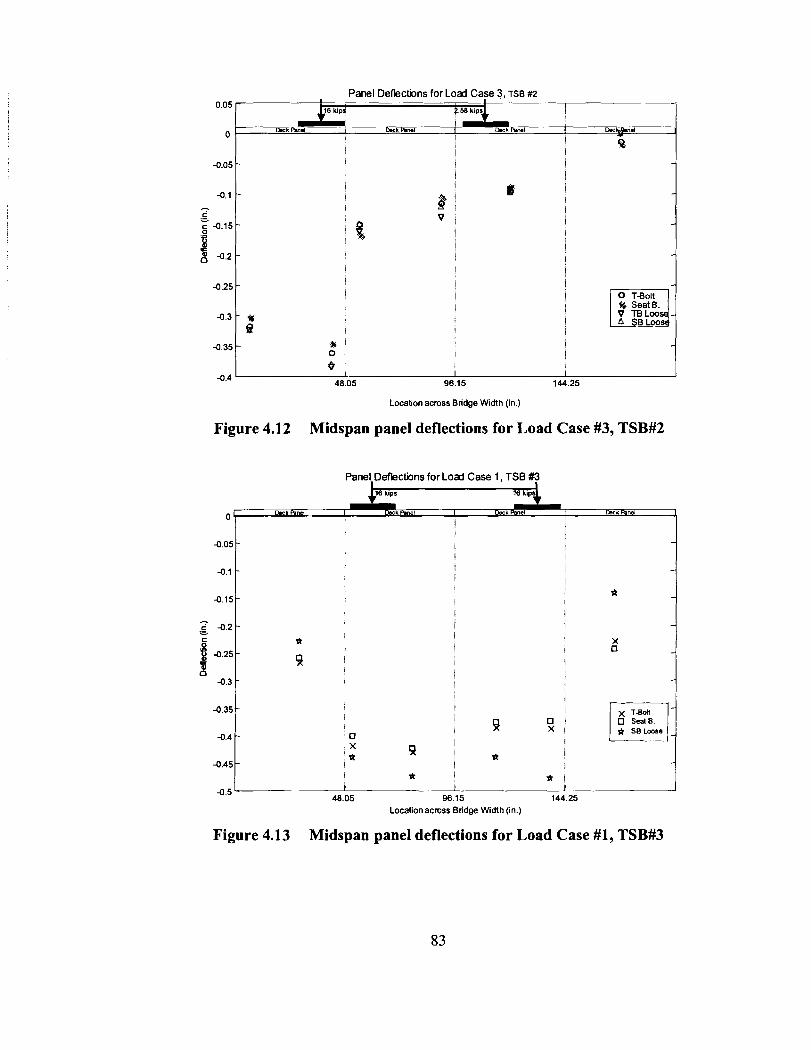
Panel Deflections for Load Case 3, TSB #2
58 kips 7_
Seat B. V TBLooa
L , 5 96.15 144.25
Location across Bridge Width (in.)
Figure 4.12 Midspan panel deflections for Load Case #3, TSB#2
Panel Deflections for Load Case 1, TSB #3
I 5 96.15 14,
Location across Bridge Width (in.)
0 Seat 8. * S8Lmse
Figure 4.13 Midspan panel deflections for Load Case #1, TSB#3
Panel Deflections for Load Case 2 (24 kips), TSB #3
r n k RnSl 1 -- DKk Panel
Location across Bridge Width (in.)
Figure 4.14 Midspan panel deflections for Load Case #2, TSB#3
Deflections for Load Ca* 3, TSB #3
DKk Panel
x TIolt 0 Seat 8. a mLoose * SB Loose L
-0 45 L 48 05 96 15 144 25
Location acmu Bridge Width (in )
Figure 4.15 Midspan panel deflections for Load Case #3, TSB#3
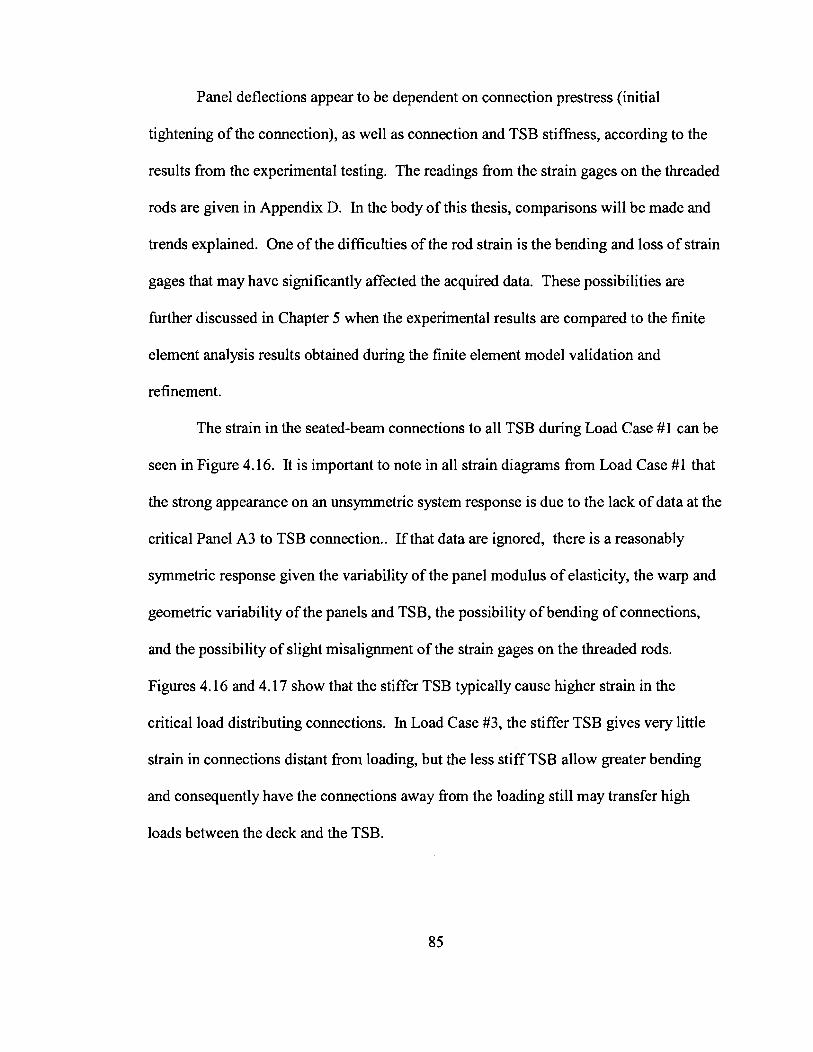
Panel deflections appear to be dependent on connection prestress (initial
tightening of the connection), as well as connection and TSB stiffness, according to the
results from the experimental testing. The readings fiom the strain gages on the threaded
rods are given in Appendix D. In the body of this thesis, comparisons will be made and
trends explained. One of the difficulties of the rod strain is the bending and loss of strain
gages that may have significantly affected the acquired data. These possibilities are
further discussed in Chapter 5 when the experimental results are compared to the finite
element analysis results obtained during the finite element model validation and
refinement.
The strain in the seated-beam connections to all TSB during Load Case #1 can be
seen in Figure 4.16. It is important to note in all strain diagrams fiom Load Case #1 that
the strong appearance on an unsymmetric system response is due to the lack of data at the
critical Panel A3 to TSB connection.. If that data are ignored, there is a reasonably
symmetric response given the variability of the panel modulus of elasticity, the warp and
geometric variability of the panels and TSB, the possibility of bending of connections,
and the possibility of slight misalignment of the strain gages on the threaded rods.
Figures 4.16 and 4.17 show that the stiffer TSB typically cause higher strain in the
critical load distributing connections. In Load Case #3, the stiffer TSB gives very little
strain in connections distant from loading, but the less stiff TSB allow greater bending
and consequently have the connections away fiom the loading still may transfer high
loads between the deck and the TSB.
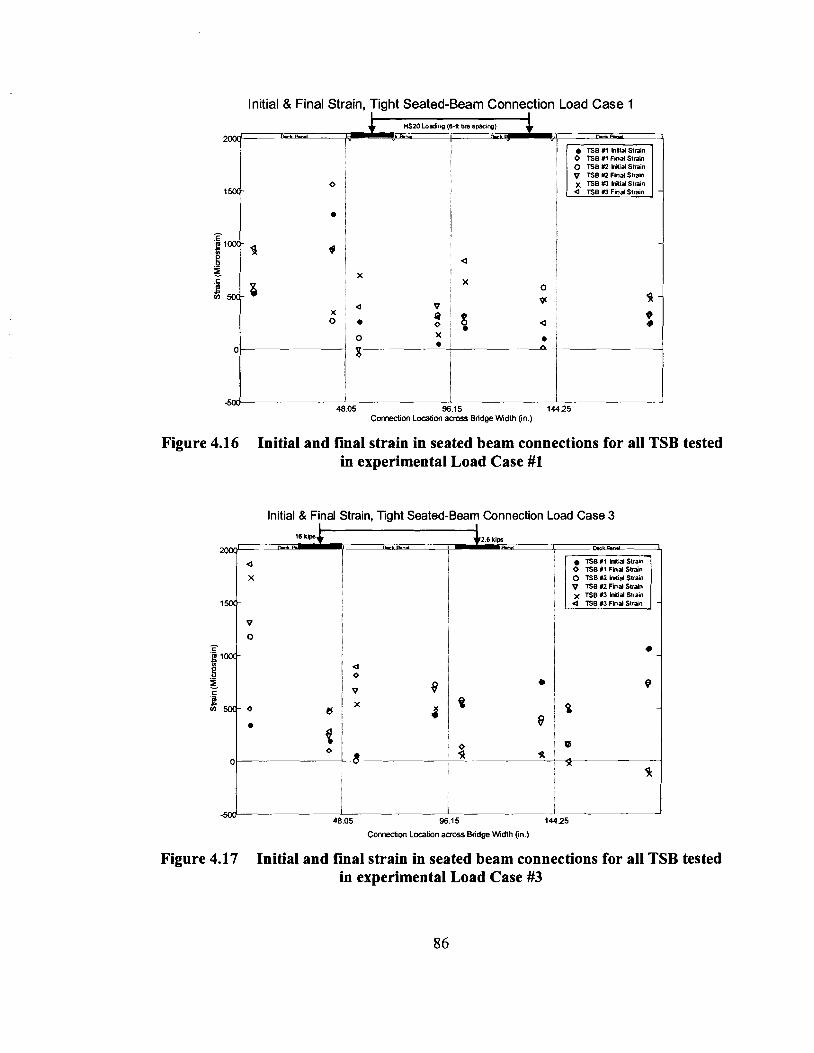
Initial & Final Strain, Tight Seated-Beam Connection Load Case 1
- D I
0 TSB U2 h i d Shain V TSB i2 Find Sbah x TSB Y3 hitid Slnin
i i i
5 96.15 14425 Comection Location acrms Bridge Wdth (In.)
Figure 4.16 Initial and final strain in seated beam connections for all TSB tested in experimental Load Case #1
Initial & Final Strain, Tight Seated-Beam Connection Load Case 3
-*- 8
0 TSB *2 M i d Suam p TSB 12 Final Sudn x TSB 13 M i d Strain
i 1
I !
I I
48.05 96.15 14425
Comec(ion Location acmss Bridge Mdlh (in.)
Figure 4.17 Initial and final strain in seated beam connections for all TSB tested in experimental Load Case #3
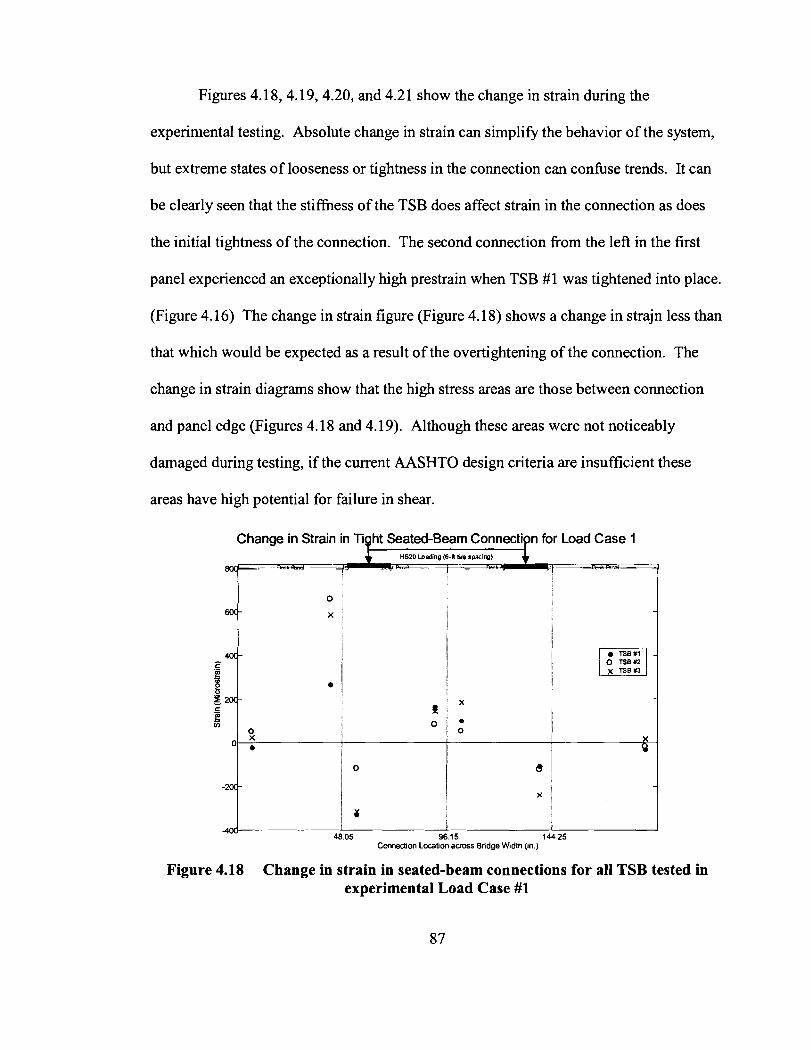
Figures 4.18,4.19,4.20, and 4.21 show the change in strain during the
experimental testing. Absolute change in strain can simplify the behavior of the system,
but extreme states of looseness or tightness in the connection can confuse trends. It can
be clearly seen that the stiffness of the TSB does affect strain in the connection as does
the initial tightness of the connection. The second connection from the left in the first
panel experienced an exceptionally high prestrain when TSB #1 was tightened into place.
(Figure 4.16) The change in strain figure (Figure 4.18) shows a change in strajn less than
that which would be expected as a result of the overtightening of the connection. The
change in strain diagrams show that the high stress areas are those between connection
and panel edge (Figures 4.1 8 and 4.1 9). Although these areas were not noticeably
damaged during testing, if the current AASHTO design criteria are insufficient these
areas have high potential for failure in shear.
Change in Strain
!
I
48.05 9 Comection Locatic
5 14425 ~ a m s B~idge Wdlh (in.)
Figure 4.18 Change in strain in seated-beam connections for all TSB tested in experimental Load Case #1
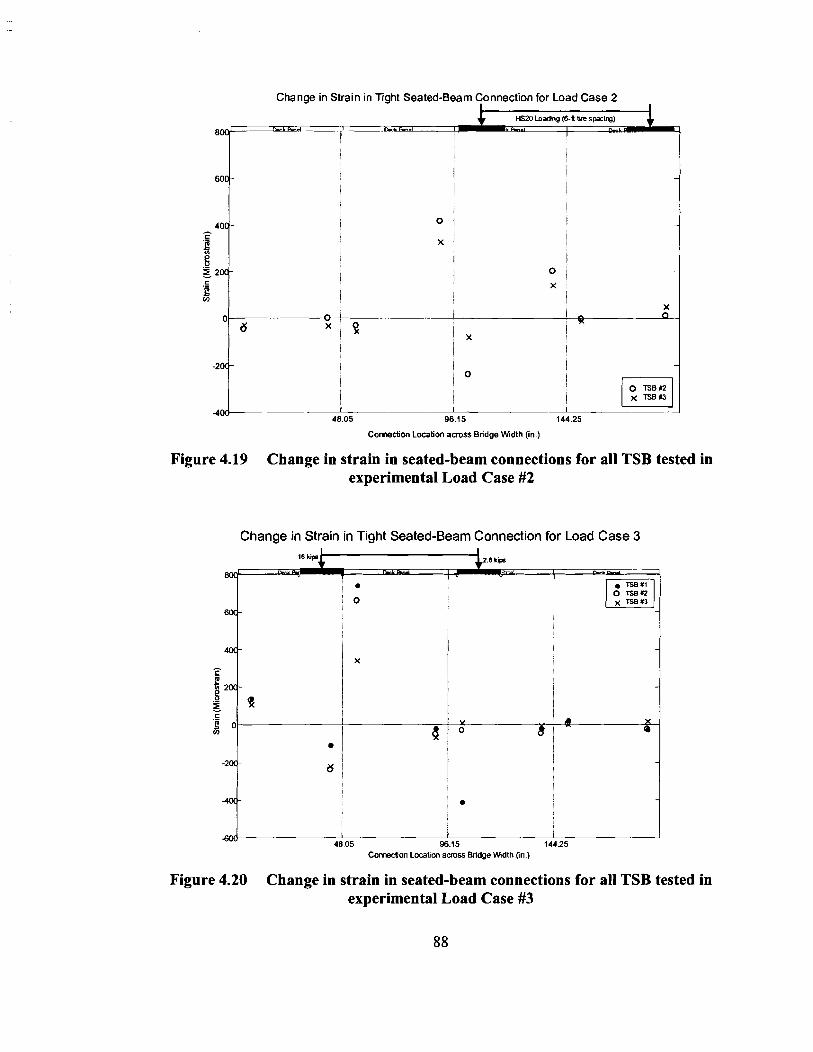
Change in Strain in Tight Seated-Beam Connection for Load Case 2
HS20 Loadng (6-1 tire spacing)
Comection Location across Bridge Width (in.)
Figure 4.19 Change in strain in seated-beam connections for all TSB tested in experimental Load Case #2
Change in Strain in Tight Seated-Beam Connection for Load Case 3
!
I I 5 96.15 14425
Com&on Location across Brid~e W~dlh (In.)
Figure 4.20 Change in strain in seated-beam connections for all TSB tested in experimental Load Case #3
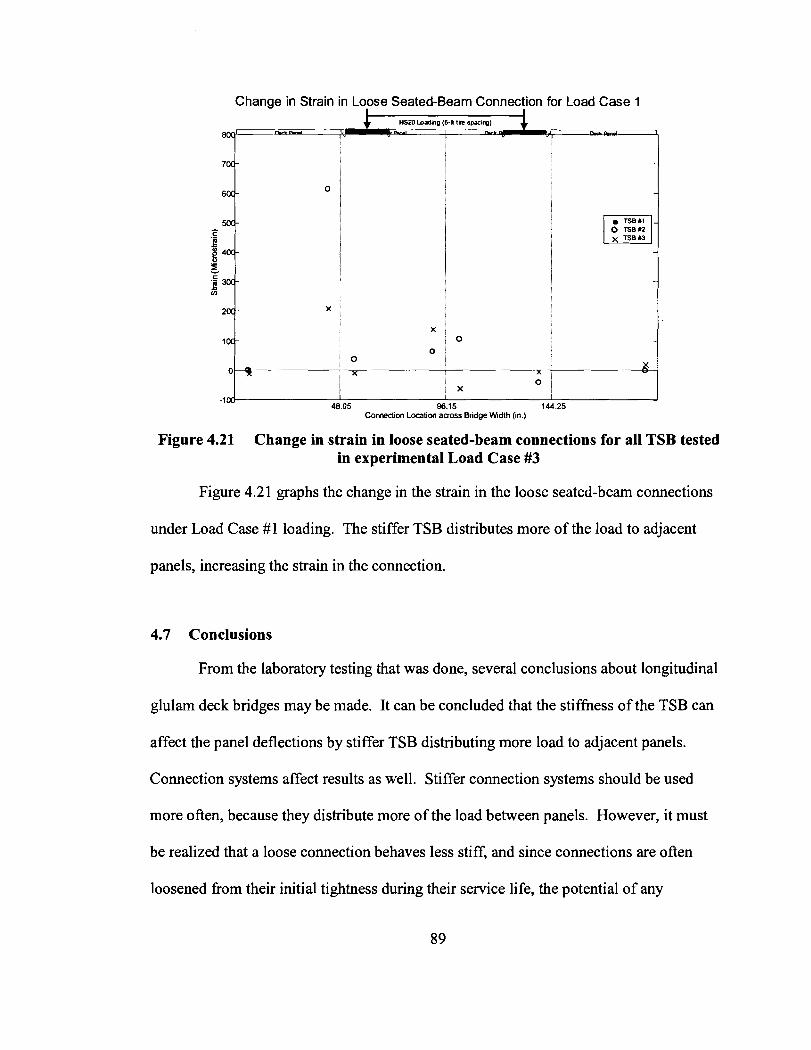
Change in Strain in Loose Seated-Beam Connection for Load Case 1
0 : : 0 I
o E : x x 0 !
; X -1 00 I I I
48.05 96.15 144.25 Comedim Location across Bridge W~dth (in.)
Figure 4.21 Change in strain in loose seated-beam connections for all TSB tested in experimental Load Case #3
Figure 4.21 graphs the change in the strain in the loose seated-beam connections
under Load Case #1 loading. The stiffer TSB distributes more of the load to adjacent
panels, increasing the strain in the connection.
4.7 Conclusions
From the laboratory testing that was done, several conclusions about longitudinal
glulam deck bridges may be made. It can be concluded that the stiffness of the TSB can
affect the panel deflections by stiffer TSB distributing more load to adjacent panels.
Connection systems affect results as well. Stiffer connection systems should be used
more ofien, because they distribute more of the load between panels. However, it must
be realized that a loose connection behaves less stiff, and since connections are ofien
loosened from their initial tightness during their service life, the potential of any
connection system performing with less stiffness should be considered in the engineering
of these bridge systems. The test results appear reasonable considering the material being
tested and the high potential variability in results due to differential initial tightness of the
connection systems, bending of the threaded rod connections, and damage to the strain
gages on the threaded rods.
Chapter 5
FINITE ELEMENT MODEL
5.1 Introduction
This chapter presents the Finite Element (FE) model developed in this study. The
approach selected is first discussed, followed by details of the elements selected to
represent the components of a longitudinal glulam deck bridge and of the boundary
conditions, applied loading, and analysis used in the FE model. The deflection
convergence study is presented, as well. The model is validated though correlation with
experimental results fiom testing at The University of Maine (UMaine) and Iowa State
University (ISU). The chapter concludes with results and recommendations with regard
to the FE model.
5.2 Finite Element Model for Longitudinal Glulam Deck Bridges
This section describes the FE model selected for the study reported in this thesis.
The approach taken and its rationale is first discussed and is followed by details of the
modeling of components and loadings.
The FE model was developed using the ANSYS Finite Element Analysis (FEA)
software, version 5.7 (ANSYS 2000a). The program was used due to its availability,
versatility, good performance in FEA, and common use among practicing engineers.
This program has also been used by others to model longitudinal glulam deck bridges
(Kurain 200 1, Hajdu 1 994).
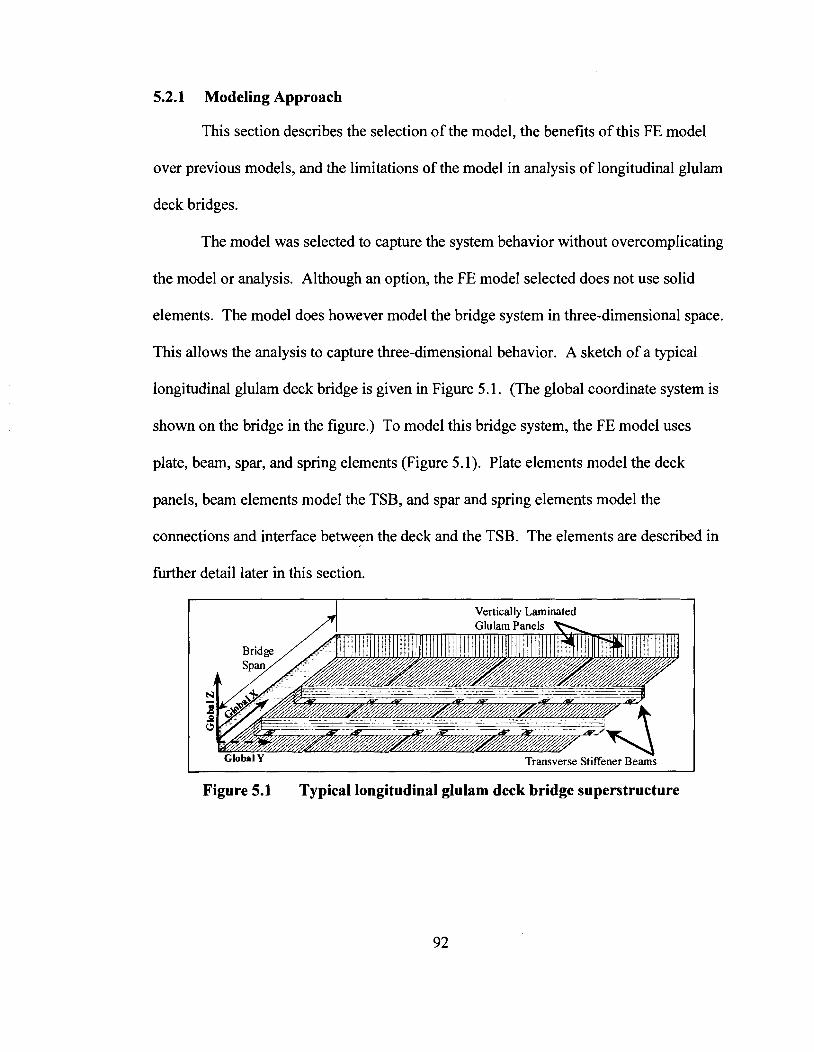
5.2.1 Modeling Approach
This section describes the selection of the model, the benefits of this FE model
over previous models, and the limitations of the model in analysis of longitudinal glulam
deck bridges.
The model was selected to capture the system behavior without overcomplicating
the model or analysis. Although an option, the FE model selected does not use solid
elements. The model does however model the bridge system in three-dimensional space.
This allows the analysis to capture three-dimensional behavior. A sketch of a typical
longitudinal glulam deck bridge is given in Figure 5.1. (The global coordinate system is
shown on the bridge in the figure.) To model this bridge system, the FE model uses
plate, beam, spar, and spring elements (Figure 5.1). Plate elements model the deck
panels, beam elements model the TSB, and spar and spring elements model the
connections and interface between the deck and the TSB. The elements are described in
further detail later in this section.
1 Vertically Laminated
Figure 5.1 Typical longitudinal glulam deck bridge superstructure

Figure 5.2 Finite element model used for longitudinal glulam deck bridge
Figure 5.3 ANSYS schematic of finite element model used for longitudinal glulam deck bridge
Several important features were incorporated in model reported here that have not
been in the in previous models investigated during the literature review. The model
developed for this study models the nonlinear behavior of the connections and models the
panel-TSB bearing interaction. It also places the connections six inches fiom the panel
edge where they are located in the actual bridge. The mesh for the model developed in
this study is much finer than that which has been used before. The smallest mesh used in
ISU's work was 18-in. x 12-in. The model developed at UMaine uses a 6-in. by 6411.
mesh, allowing a better capture of panel and TSB behavior.
The model developed for this thesis had several limitations. Most limitations of
the model used result from approximating a three-dimensional structure into a system of
thin plates, beams, and springs. The limitations are listed below.
1. Since the model uses thin plates, the distribution of Z-stresses through the
thickness of the panels is not accounted for. However, a solid model
would require extensive additional computer resources for what is
anticipated to be marginal gain.
2. Initial warp and twist in panels are not modeled either, since these could
vary considerably in a bridge.
3. Shear stiffness and deformation in panels are not modeled.
4. Since the TSB is modeled using line elements, Z-stress through TSB depth
is not modeled.
5 . An actual bridge would have some fixity at the supports, rather than the
fiee rotation the ideal pin connection models.
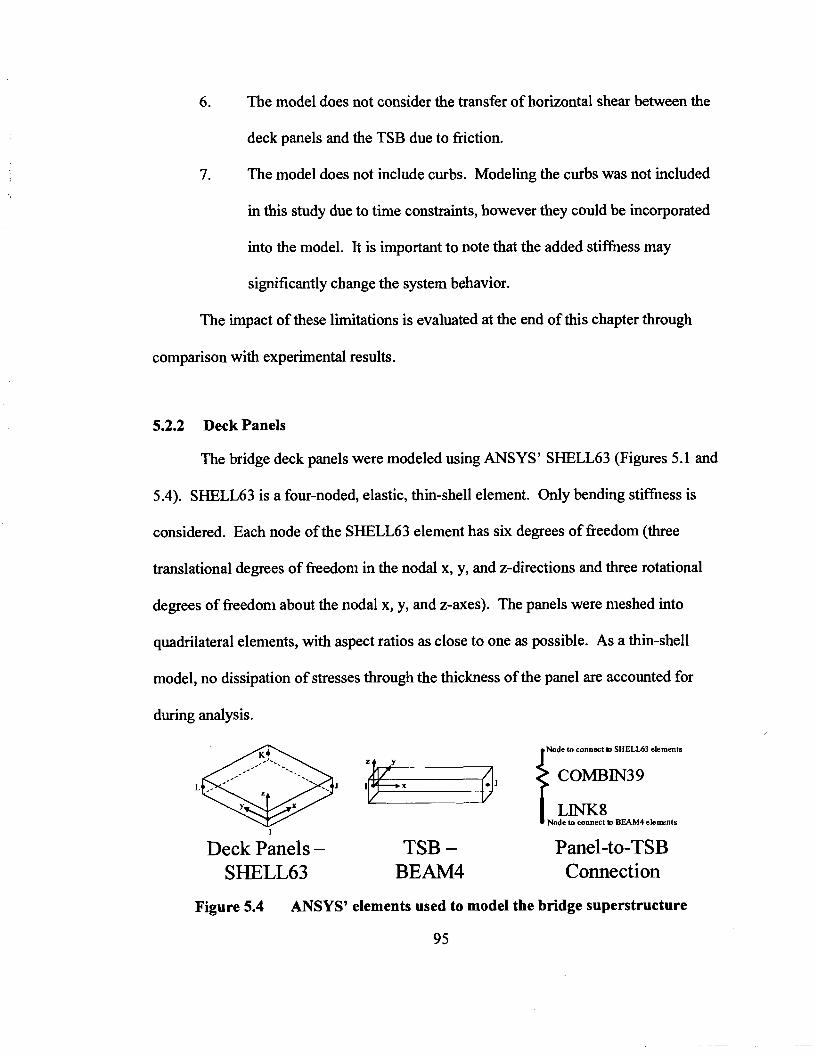
6 . The model does not consider the transfer of horizontal shear between the
deck panels and the TSB due to friction.
7. The model does not include curbs. Modeling the curbs was not included
in this study due to time constraints, however they could be incorporated
into the model. It is important to note that the added stiffness may
significantly change the system behavior.
The impact of these limitations is evaluated at the end of this chapter through
comparison with experimental results.
5.2.2 Deck Panels
The bridge deck panels were modeled using ANSYS' SHELL63 (Figures 5.1 and
5.4). SHELL63 is a four-noded, elastic, thin-shell element. Only bending stiffness is
considered. Each node of the SHELL63 element has six degrees of fieedom (three
translational degrees of fieedom in the nodal x, y, and z-directions and three rotational
degrees of fieedom about the nodal x, y, and z-axes). The panels were meshed into
quadrilateral elements, with aspect ratios as close to one as possible. As a thin-shell
model, no dissipation of stresses through the thickness of the panel are accounted for
during analysis.
Node to connect b SHELL43 elements
t COMBIN39
1 LINK8 Node to connect b BMM4 ekmnts
Deck Panels - TSB - Panel-to-TSB SHELL63 BEAM4 Connection
Figure 5.4 ANSYS' elements used to model the bridge superstructure
Material properties of the shell varied according to the wood species and, in the
case of the UMaine laboratory experiments, the individual panel being represented.
Orthotropic properties were used to approximate the actual behavior of the wood panels.
Properties were obtained fkom a combination of laboratory testing and published values.
The transverse MOE and shear modulus (G) were derived fkom the longitudinal MOE
and typical correlations for the wood species being modeled (FPL 1999). The properties
of loblolly, longleaf, shortleaf, and slash pine were averaged for the Southern Pine (SP)
wood. Along the length of the panel (element x-direction), the material properties were
assumed equivalent to the properties of the wood longitudinal-to-wood-grain. Since the
panels are glulam, it is assumed that the radial and tangential wood grain is
approximately randonlly distributed through the width and thickness of the panel.
Therefore, the material properties in the width and thickness directions (element y and z
directions) are assumed equal and equivalent to the average of radial and tangential
material properties. The actual material properties used in an FE analysis of a bridge are
listed in the section that discusses that analysis. For bridges with FRP-glularn panels, the
panels were modeled as a similar conventional glulam panel but with increased stiffness
provided by the FRP. For the deck panel elements, the global coordinate system and the
local coordinate system were coincident.
5.2.3 Transverse Stiffener Beams (TSB)
The below-deck transverse stiffener beam was modeled using ANSYS' elastic,
prismatic beam element, BEAM4. It is uniaxial with six degrees of fkeedom at each end
node (Figure 5.4). The element has tension, conlpression, bending, and torsion capacity.
96

Shear deflection was not considered. The material properties for the beam element were
obtained the same as described for the panel elements. However, for the beam element
the local and global coordinate systems are not coincidental. The actual material
properties used for a TSB will be given in the section where the analysis is discussed.
5.2.4 Panel-to-TSB Connections
Although not always considered significant, the selection of the model used for
connections is not inconsequential. The connections between the panels and the TSB
were modeled using ANSYS' COMBIN39 and LINK8 elements (Figure 5.4). Used in
series, the two elements arose from the desire to model the nonlinear behavior of the
connection in tension and the possible need to pretension the connection. The connection
must be limited to transmitting only tensile forces, since a compression force would not
be transmitted through the connection, but rather through the bearing between the panel
and the TSB.
The COMBIN39 element is a two-node, nonlinear, uniaxial spring element with
three translational degrees of freedom at each node. A spring was selected since the
connections between the panels and the TSB only transfer vertical loads by carrying axial
loads. The physical connections do not provide significant bending stiffness to transfer
bending moments or torsion to the stiffener beams. In the published literature, it was
believed that the connector forces remained in the linear range, but for increased accuracy
the entire load-deflection curve was used for this model. Since the element selected is
nonlinear, the experimentally-measured behavior of the connections can be considered in
the analysis. The experimentally-measured axial stiffness of the connection, the axial
97
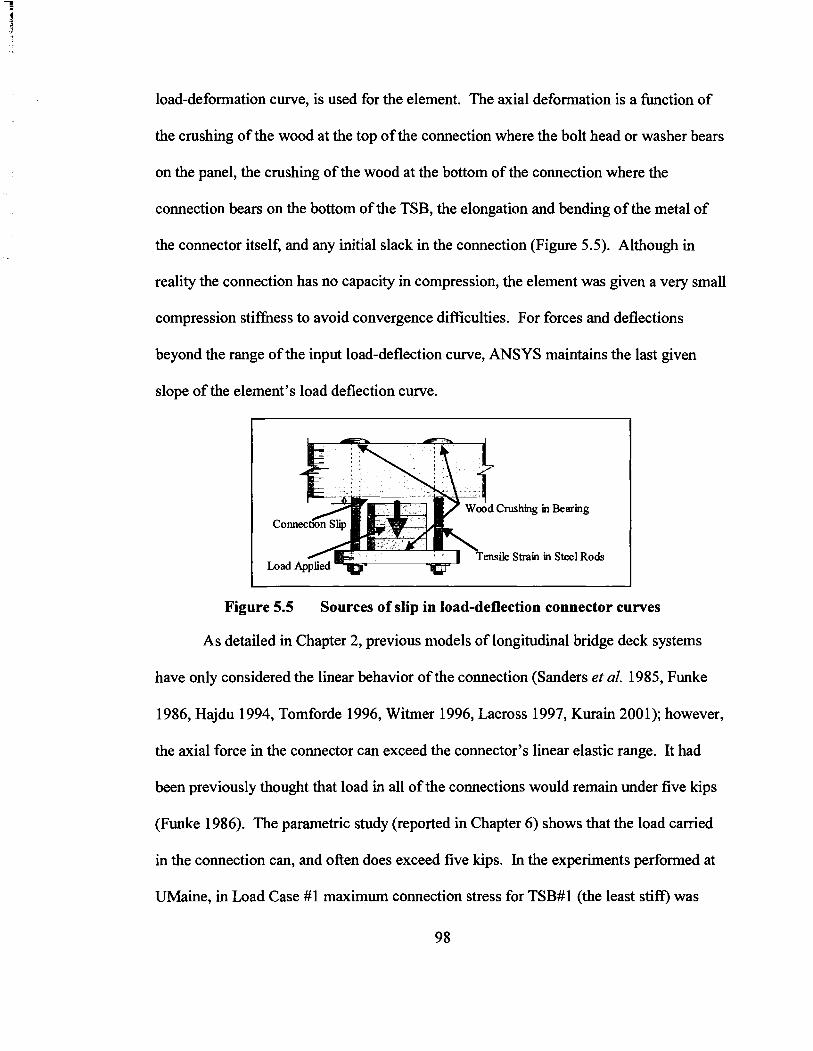
load-deformation curve, is used for the element. The axial deformation is a function of
the crushing of the wood at the top of the connection where the bolt head or washer bears
on the panel, the crushing of the wood at the bottom of the connection where the
connection bears on the bottom of the TSB, the elongation and bending of the metal of
the connector itself, and any initial slack in the connection (Figure 5.5). Although in
reality the connection has no capacity in compression, the element was given,a very small
compression stiffness to avoid convergence difficulties. For forces and deflections
beyond the range of the input load-deflection curve, ANSYS maintains the last given
slope of the element's load deflection curve.
I
~ h i n g
Strain
Bearmg
Steel Rods
Figure 5.5 Sources of slip in load-deflection connector curves
As detailed in Chapter 2, previous models of longitudinal bridge deck systems
have only considered the linear behavior of the connection (Sanders et al. 1985, Funke
1986, Hajdu 1994, Tomforde 1996, Witrner 1996, Lacross 1997, Kurain 2001); however,
the axial force in the connector can exceed the connector's linear elastic range. It had
been previously thought that load in all of the connections would remain under five kips
(Funke 1986). The parametric study (reported in Chapter 6) shows that the load carried
in the connection can, and often does exceed five kips. In the experiments performed at
UMaine, in Load Case #1 maximum connection stress for TSB#l (the least stiff) was
98

almost nine kips, and the maximum connection stress for TSB#2 & TSB#3 was over five
kips. The nine kips seen in the lab was not matched in the parametric study, but this may
be due to the fact that threaded rods used in the lab tests actually had a %-in. diameter at
the locations of the strain gage as well as due to the other factors detailed in Chapter 4.
LINK8 is a three-dimensional, two-noded, uniaxial tension/compression element
with three translational degrees of fieedom at each node that was used in solely to
pretension the connections. Although LINK8 can carry compressive loads, in the model
it is placed in series with COMBIN39 which cannot carry any compressive loads and thus
controls the compressive connection behavior. The LINK8 element has no bending or
torsional capacity. The element may be given an initial strain. In the models of the
experiments performed at UMaine there was a known connector prestress for most
connections. Prior to analysis under the HS20 loading, each connector was given
(through a few iterations) an initial strain that, when the system was analyzed, would
induce the measured connection prestress. LINK8 was kept as extremely stiff so that it
would not contribute to the load-deflection behavior of the connection.
Pretensioning the connectors did not significantly affect the TSB shear and
bending moment (Figure 5.6). Unless the pretension load in the connector was greater
than the load that would be carried under the live load, the live load controlled the
connection. Therefore, although the pretensioning assisted in validating the model, it
does not appear necessary to consider it in other analyses.
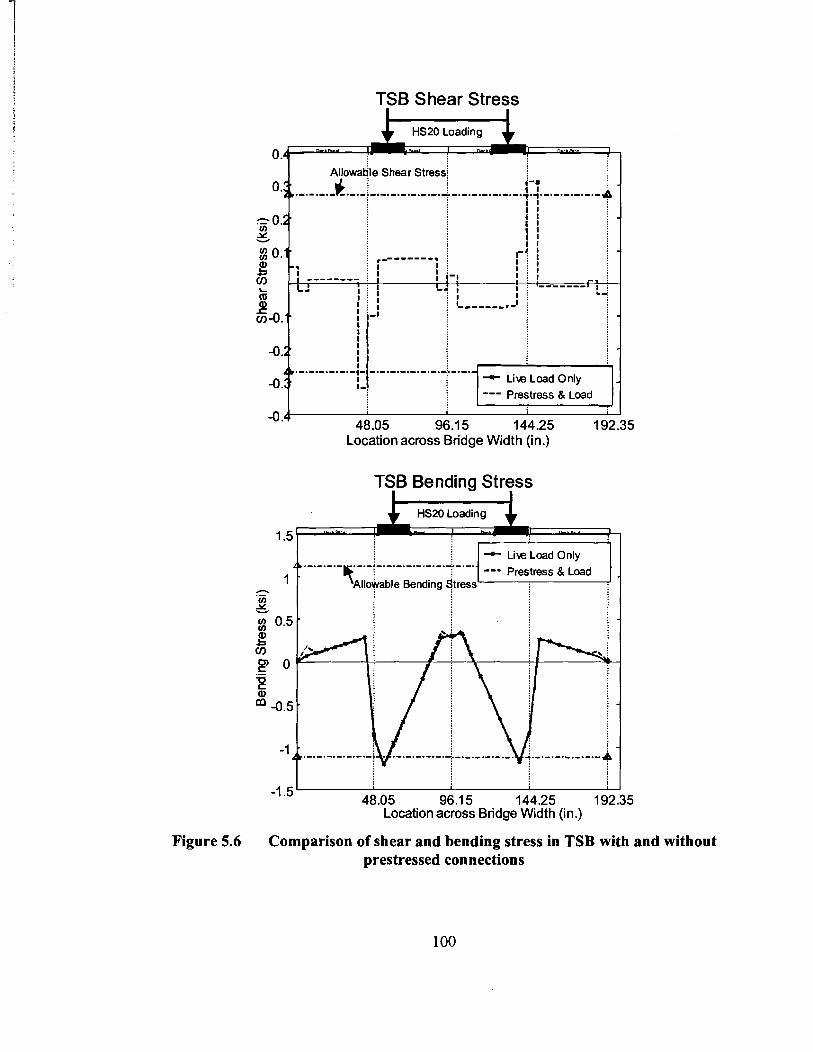
TSB Shear Stress
I ~llowabile Shear stress 0.
3 0. Y V
2 0. P! 5 z a, 6-0.
-0.
-0.
-0.
Location across Btidge Width (in.)
TSB Bending Stress I
.-.-.-.- .-.-*-.-.-.-.-.-.-."-.-.-. --- Prestress & Load %llo~able Bending & e s j .- U) - /I
1.5
-1.d I 1 48.05 96.1 5 144.25 192.35
Location across Bridge Width (in.)
-.**, I 1
i - L i ~ e Load Only 11
Figure 5.6 Comparison of shear and bending stress in TSB with and without prestressed connections
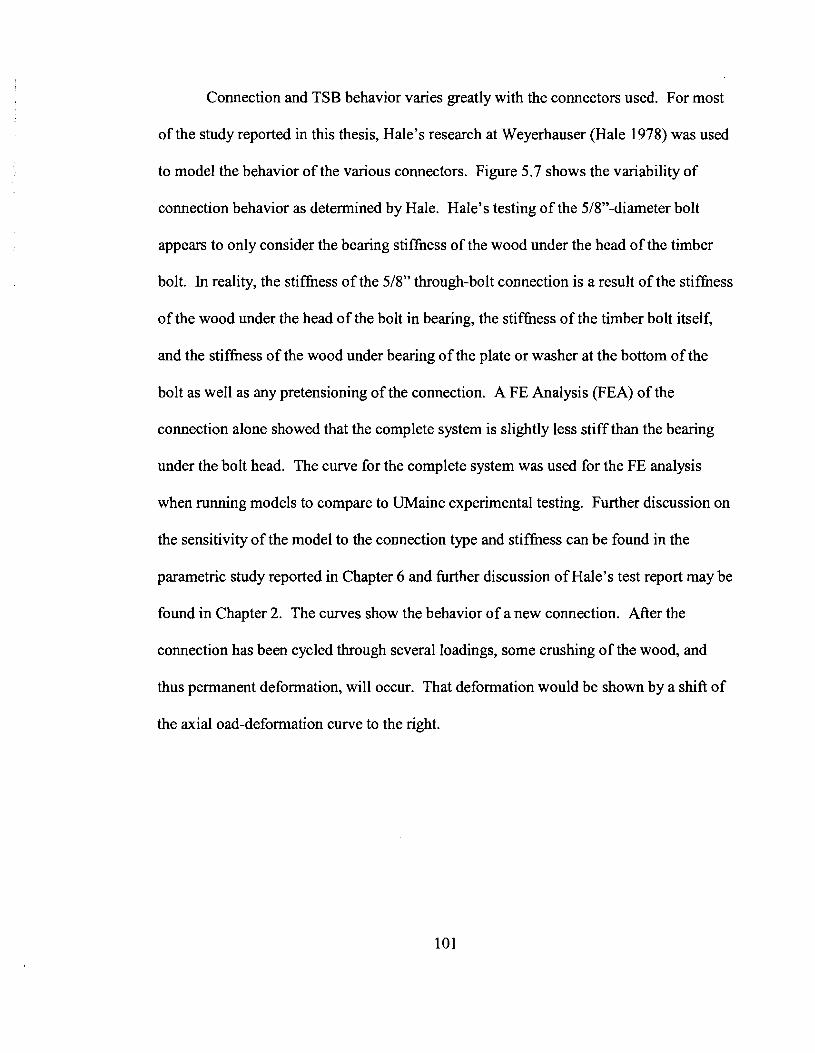
Connection and TSB behavior varies greatly with the connectors used. For most
of the study reported in this thesis, Hale's research at Weyerhauser (Hale 1978) was used
to model the behavior of the various connectors. Figure 5.7 shows the variability of
connection behavior as determined by Hale. Hale's testing of the 518"-diameter bolt
appears to only consider the bearing stiffness of the wood under the head of the timber
bolt. In reality, the stiffness of the 518" through-bolt connection is a result of the stiffness
of the wood under the head of the bolt in bearing, the stifhess of the timber bolt itself,
and the stiffness of the wood under bearing of the plate or washer at the bottom of the
bolt as well as any pretensioning of the connection. A FE Analysis (FEA) of the
connection alone showed that the complete system is slightly less stiff than the bearing
under the bolt head. The curve for the complete system was used for the FE analysis
when running models to compare to UMaine experimental testing. Further discussion on
the sensitivity of the model to the connection type and stifhess can be found in the
parametric study reported in Chapter 6 and hrther discussion of Hale's test report may be
found in Chapter 2. The curves show the behavior of a new connection. After the
connection has been cycled through several loadings, some crushing of the wood, and
thus permanent deformation, will occur. That deformation would be shown by a shift of
the axial oad-deformation curve to the right.
Figure 5.7 Load-deformation curves of connectors (Hale 1978, Funke 1986)
Some connector systems such as the seated-beam connection and aluminum
brackets may be more accurately modeled using two elements on either side of the
transverse stiffener beam. However, this was beyond the scope of thls study, requiring
experimental testing of connection systems to accurately capture the behavior.
The bearing stiffness of the wood controls the stifhess of bolted connections in
these systems since the connection bolts are loaded parallel to their longitudinal axes.
Since the wood bearing stiffness controls, connection stifhess may be increased or
decreased by respectively increasing or decreasing the bearing area under the head of the
bolt. As the connection is cycled through its lifetime loading, the axial load-deformation
curves of Figure 5.7 to shift to the right, and thus transferring less load through the
connection.
5.2.5 Panel-Transverse-Stiffener-Beam Bearing
LINKlO was used to model the bearing between the panel and the stiffener beam.
Only compressive forces can be transmitted through the bearing of the panels on the
stiffener, therefore the bilinear (minimal stiffness when in tension, calculated bearing
stiffless when in compression) spar element was chosen, specifying its compression only
option. To avoid instability, a small stiffness is allowed when the element is in tension.
The element has three translational degrees of fieedom at each node 0. The element
models the compression of the wood that causes vertical forces to be transmitted between
the panel and stiffener beam. The assumed area of the wood that contributes to the force
transfer is shown in Figure 5.8. This assumed cross-section area is multiplied by the
mesh size in the transverse direction giving a volume of wood contributing to bearing
force transfer. The panel and TSB stifhess that results in load transfer can be modeled as
two springs in series. The stiffhess of each is based on their modulus of elasticity
perpendicular to grain, depth of wood assumed compressed (spring length), area of wood
contributing to the compression. LINKlO is a single element that has stifhess equivalent
to that of the two springs. LINK10 has a length equivalent to the distance from the
neutral axis of the panels to the neutral axis of the stiffener beam. Its area is the width of
the stiffener beam times the bearing element spacing. LINKlO's modulus of elasticity is
then adjusted so that its stifhess is equivalent to that of the panel and beam bearing in
series.

Woodassumedto be i~ compresn'cm during trnsLr of vetical load between pnel andTSB
k , = E , * % I L , I km=E,* A, IL,
A = average areaof wmd assumedto be in canpression
E = E,of m a d
Ilk =11$+11k,
Figure 5.8 Derivation of panel-TSB bearing element stiffness
5.2.6 Boundary Conditions
The model is simply supported with global X, Y, and Z-translations fixed at the
panel ends. For TSB stability, the global X and Y-translation and Y and Z-axes rotation
are also fixed at one end of the TSB. Global X and Y-translation and rotation about the
Z-axis are also fixed at the nodes joining the COMBIN39 and LINK8 connection
elements.
5.2.7 Loading
To avoid stress concentrations that may result from modeling the AASHTO HS20
truck tires as point loads, the loading was modeled using two methods. The first used a
simple distribution of the loads to nodes. The second used uniform surface loads on the
elements. The different methods did not significantly affect the system response, except
for transverse bending stress in the panels. The simple load distribution method
distributed the AASHTO tire loading transversely by the tributary area method into point
loads at the nodes (Figure 5.9). With this method, the loading was not distributed
longitudinally. The element unifornl surface loading distributed the AASHTO tire
loading transversely and longitudinally into uniform loads for each element based on the 1 04
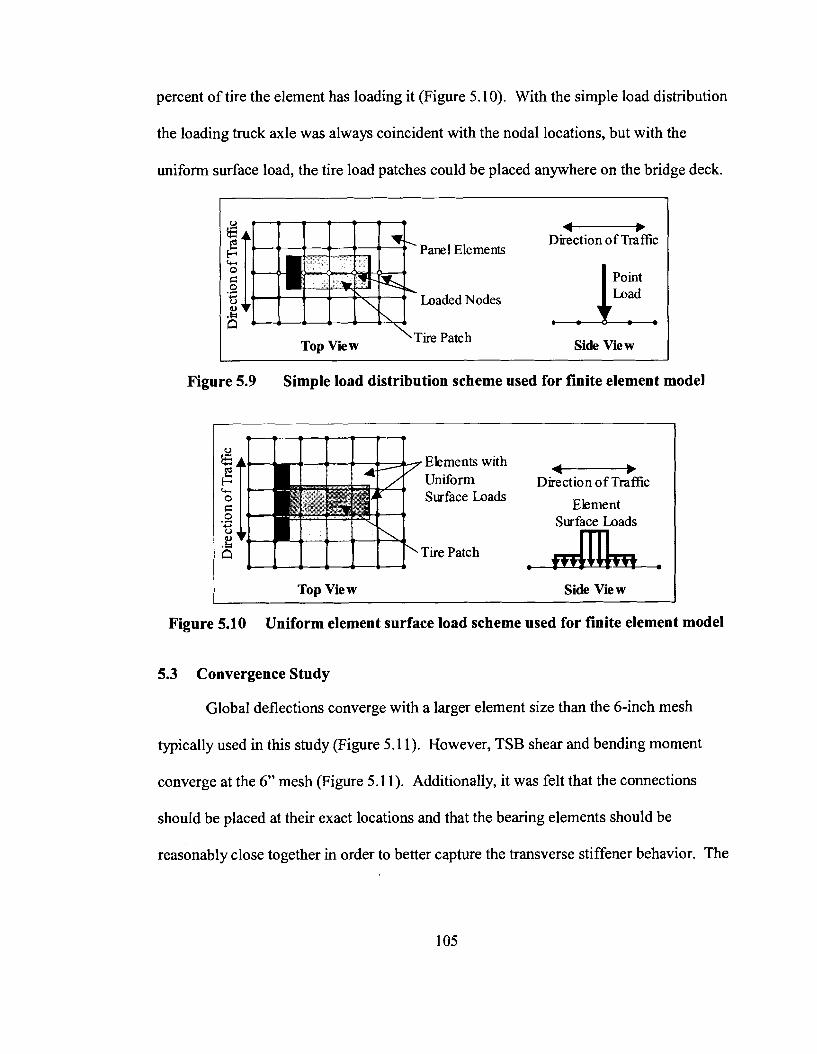
percent of tire the element has loading it (Figure 5.10). With the simple load distribution
the loading truck axle was always coincident with the nodal locations, but with the
uniform surface load, the tire load patches could be placed anywhere on the bridge deck.
f--------+ Direction of Tmfic
Panel Elements
c Point 0
0 Loaded Nodes
n Top View \ Tire Patch Side View
Figure 5.9 Simple load distribution scheme used for finite element m
Elements with Uniform Surface Loads
Tire Patch
- Direction of Traffic
Surface Loads
A I TOP view Side View
Figure 5.10 Uniform element surface load scheme used for finite element model
5.3 Convergence Study
Global deflections converge with a larger element size than the 6-inch mesh
typically used in this study (Figure 5.11). However, TSB shear and bending moment
converge at the 6" mesh (Figure 5.1 1). Additionally, it was felt that the connections
should be placed at their exact locations and that the bearing elements should be
reasonably close together in order to better capture the transverse stiffener behavior. The
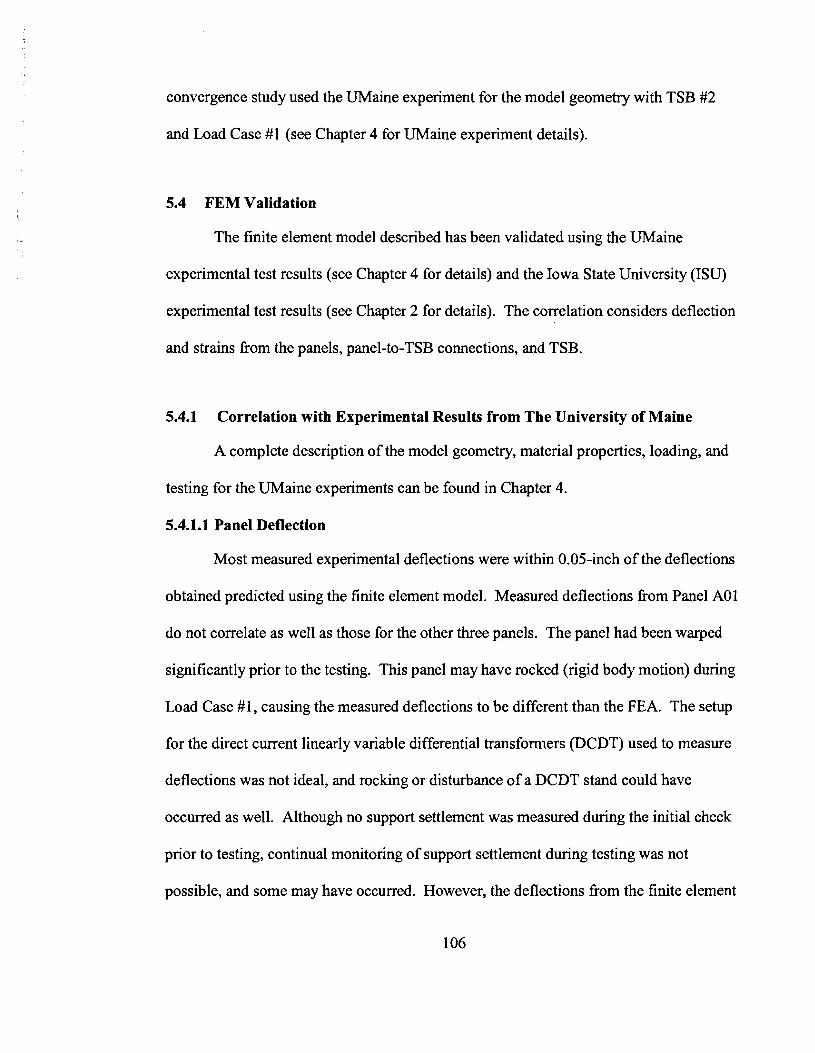
convergence study used the UMaine experiment for the model geometry with TSB #2
and Load Case #1 (see Chapter 4 for UMaine experiment details).
5.4 FEM Validation
The finite element model described has been validated using the UMaine
experimental test results (see Chapter 4 for details) and the Iowa State University (ISU)
experimental test results (see Chapter 2 for details). The correlation considers deflection
and strains fiom the panels, panel-to-TSB connections, and TSB.
5.4.1 Correlation with Experimental Results from The University of Maine
A complete description of the model geometry, material properties, loading, and
testing for the UMaine experiments can be found in Chapter 4.
5.4.1.1 Panel Deflection
Most measured experimental deflections were within 0.05-inch of the deflections
obtained predicted using the finite element model. Measured deflections fiom Panel A01
do not correlate as well as those for the other three panels. The panel had been warped
significantly prior to the testing. This panel may have rocked (rigid body motion) during
Load Case #1, causing the measured deflections to be different than the FEA. The setup
for the direct current linearly variable differential transformers (DCDT) used to measure
deflections was not ideal, and rocking or disturbance of a DCDT stand could have
occurred as well. Although no support settlement was measured during the initial check
prior to testing, continual monitoring of support settlement during testing was not
possible, and some may have occurred. However, the deflections from the finite element
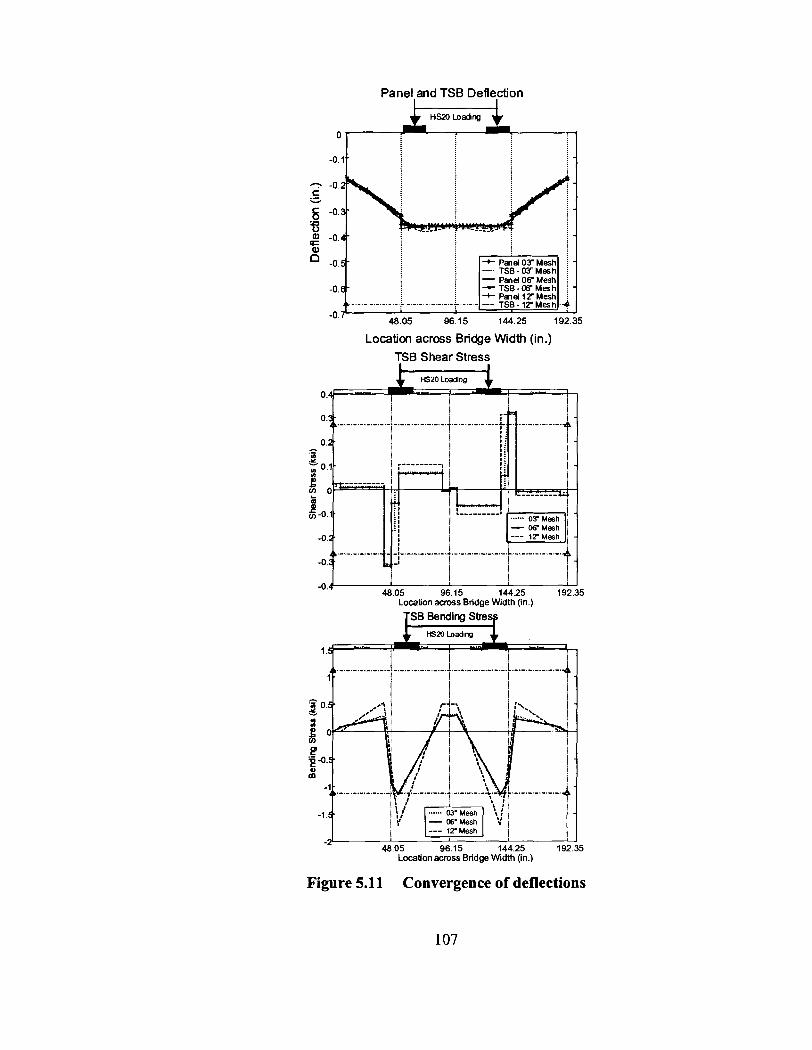
Panel and TSB Deflection
Location across Bridge Width (in.) TSB Shear Stress
Location across Bridge Width (in.)
Figure 5.11 Convergence of deflections
107
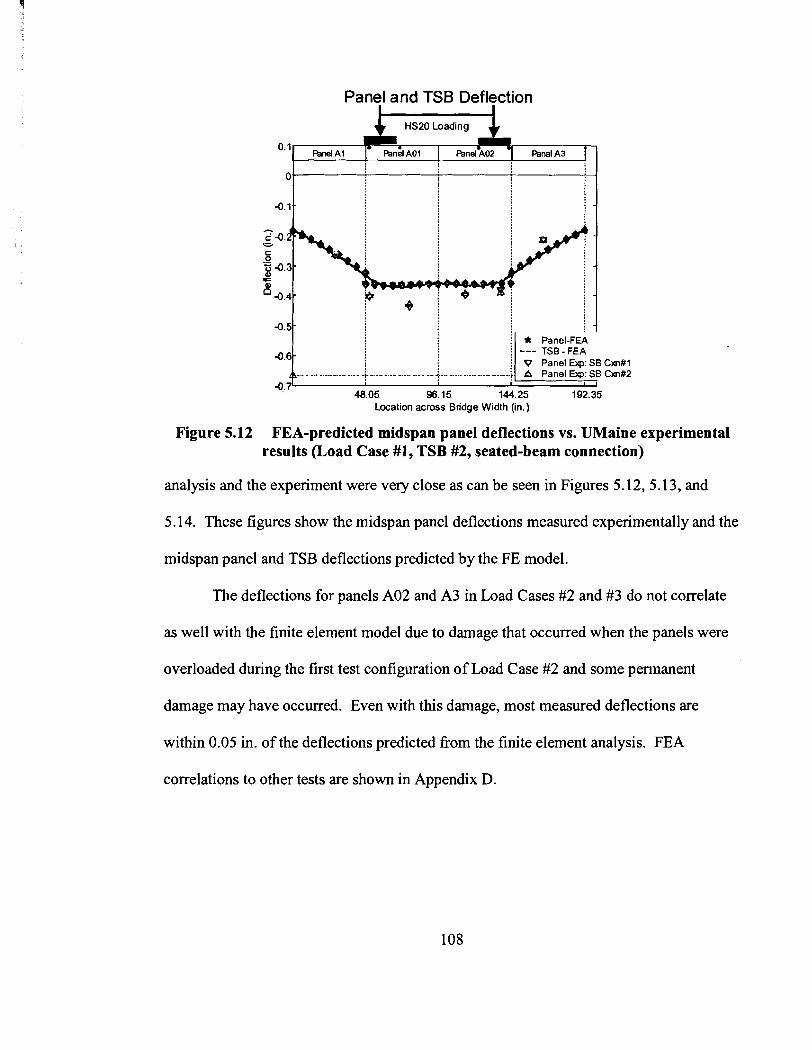
Panel and TSB Deflection
1-1 0'1( WnelAl Panel A01 Wnal A3 1
Location across Bridge Width (in.)
Figure 5.12 FEA-predicted midspan panel deflections vs. UMaine experimental results (Load Case #1, TSB #2, seated-beam connection)
analysis and the experiment were very close as can be seen in Figures 5.12,5.13, and
5.14. These figures show the midspan panel deflections measured experimentally and the
midspan panel and TSB deflections predicted by the FE model.
The deflections for panels A02 and A3 in Load Cases #2 and #3 do not correlate
as well with the finite element model due to damage that occurred when the panels were
overloaded during the first test configuration of Load Case #2 and some permanent
damage may have occurred. Even with this damage, most measured deflections are
within 0.05 in. of the deflections predicted fiom the finite element analysis. FEA
correlations to other tests are shown in Appendix D.

Panel and TSB Deflection
Location across Bridge Width (in.)
Figure 5.13 FEA-predicted midspan panel deflections vs. UMaine experimental results (Load Case #2, TSB #3, seated-beam connection)
Panel Deflection Under Load Points
HS20 Loading
0.1 Rnel A1 Rnel A01 Panel A02
W Panel-FEA Predidons -0.61 v Exp DCDT Data: SB Cm#l j
V. I 48.05 96.15 144.25
J 192.35
Location across Bridge Width (in.)
Figure 5.14 FEA-predicted panel deflections vs. UMaine experimental results (Load Case #3, TSB #1, seated-beam connection)
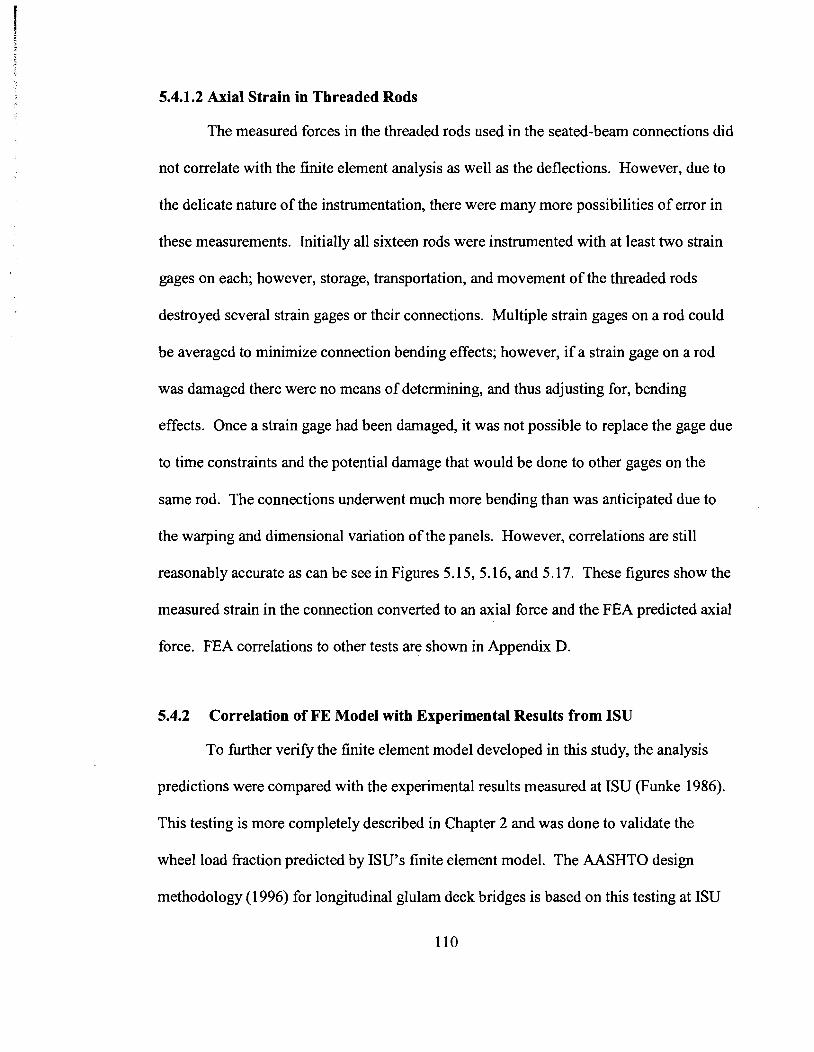
5.4.1.2 Axial Strain in Threaded Rods
The measured forces in the threaded rods used in the seated-beam connections did
not correlate with the finite element analysis as well as the deflections. However, due to
the delicate nature of the instrumentation, there were many more possibilities of error in
these measurements. Initially all sixteen rods were instrumented with at least two strain
gages on each; however, storage, transportation, and movement of the threaded rods
destroyed several strain gages or their connections. Multiple strain gages on a rod could
be averaged to minimize connection bending effects; however, if a strain gage on a rod
was damaged there were no means of determining, and thus adjusting for, bending
effects. Once a strain gage had been damaged, it was not possible to replace the gage due
to time constraints and the potential damage that would be done to other gages on the
same rod. The connections underwent much more bending than was anticipated due to
the warping and dimensional variation of the panels. However, correlations are still
reasonably accurate as can be see in Figures 5.15,5.16, and 5.17. These figures show the
measured strain in the connection converted to an axial force and the FEA predicted axial
force. FEA correlations to other tests are shown in Appendix D.
5.4.2 Correlation of FE Model with Experimental Results from ISU
To further veriQ the finite element model developed in this study, the analysis
predictions were compared with the experimental results measured at ISU (Funke 1986).
This testing is more completely described in Chapter 2 and was done to validate the
wheel load fraction predicted by ISU's finite element model. The AASHTO design
methodology (1996) for longitudinal glulam deck bridges is based on this testing at ISU
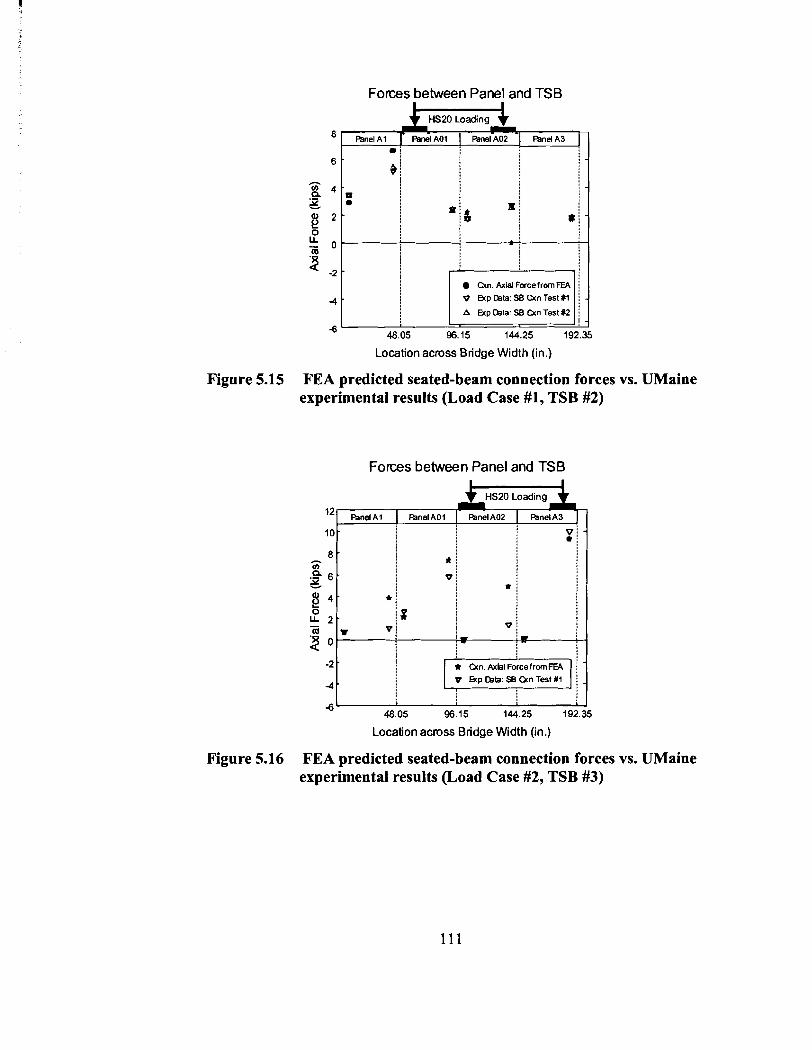
Forces between Panel and TSB
HS20 Loading
Cin. A x i Force from FEA v Exp Data: SB Cin Testtl
A Exp Data: SB Cin Test $2
48.05 96.15 144.25 19:
Location across Bridge Width (in.)
Figure 5.15 FEA predicted seated-beam connection forces vs. UMaine experimental results (Load Case #1, TSB #2)
F o m s between Panel and TSB
HS20 Loading
10
v Exp Data: SB Otn Test#l
Location across Bridge Width (in.)
Figure 5.16 FEA predicted seated-beam connection forces vs. UMaine experimental results (Load Case #2, TSB #3)

Forces between Panel and TSB
H S P O Loading
-6 48.05 96.15 144.25
Location across Bridge Width (in.)
Figure 5.17 FEA predicted seated-beam connection forces vs. UMaine experimental results (Load Case #3, TSB #1)
(Sanders et al. 1985, Funke 1986, Ritter 1990), making this correlation crucial. The
model developed gives results that correlate very well ISU's experimental results. Figure
5.18 compares well the measured midspan panel deflections to those predicted by the FE
analysis. Figure 5.19 compares the measured midspan panel strains with FEA-predicted
strains. Figure 5.20 compares the experimental and FEA-predicted TSB strains. FEA
correlations to other tests are shown in Appendix D.
5.5 Conclusions
The longitudinal glulanl deck bridge was modeled using the ANSYS finite
element program. Orthotropic plate elements were used to model the panels, beam
elements were used to model the TSB, TSB-to-deck-panel connections were modeled
using nonlinear spring elements and link elements with pretensioning capability, and the
bearing between the deck and the TSB was modeled with compression only spar
elements.
112
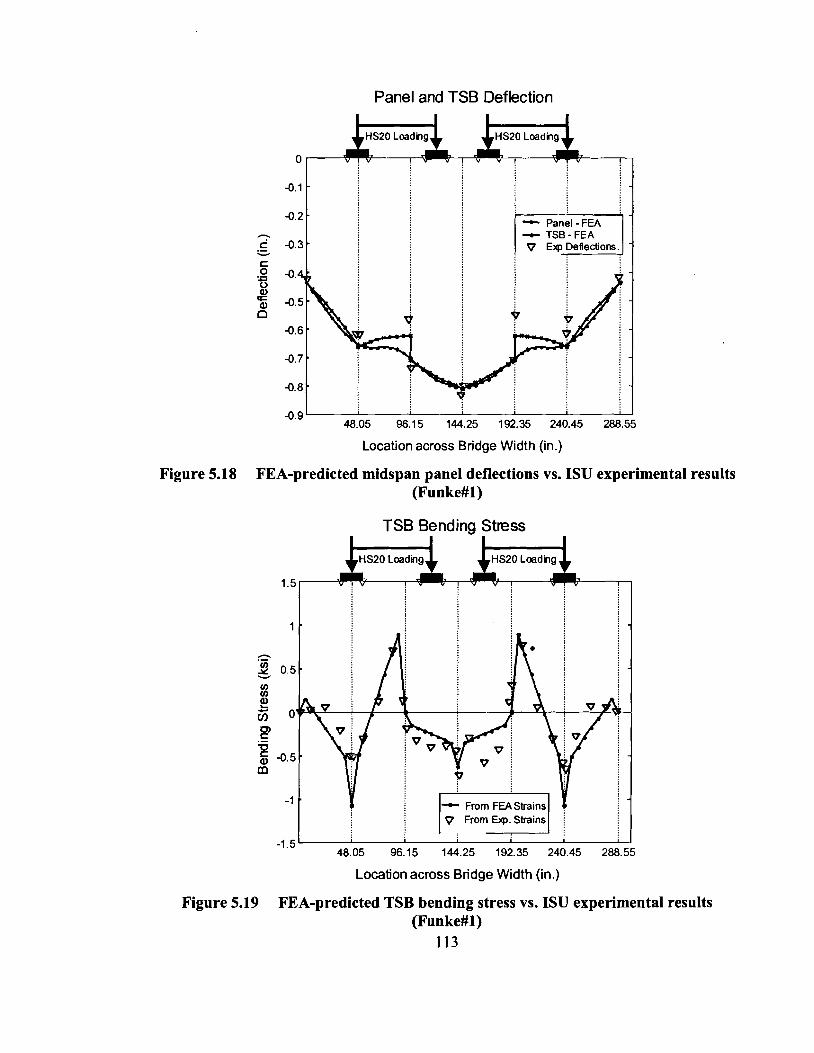
Panel and TSB Deflection
- Panel - FEA -L TSB - FEA
-0.9 I
48.05 96.15 144.25 192.35 240.45 288.55
Location across Bridge Width (in.)
Figure 5.18 FEA-predicted midspan panel deflections vs. ISU experimental results
TSB Bending Stlless
48.05 96.15 144.25 192.35 240.45 288.55
Location across Bridge Width (in.)
Figure 5.19 FEA-predicted TSB bending stress vs. ISU experimental results (Fun ke#l)
113
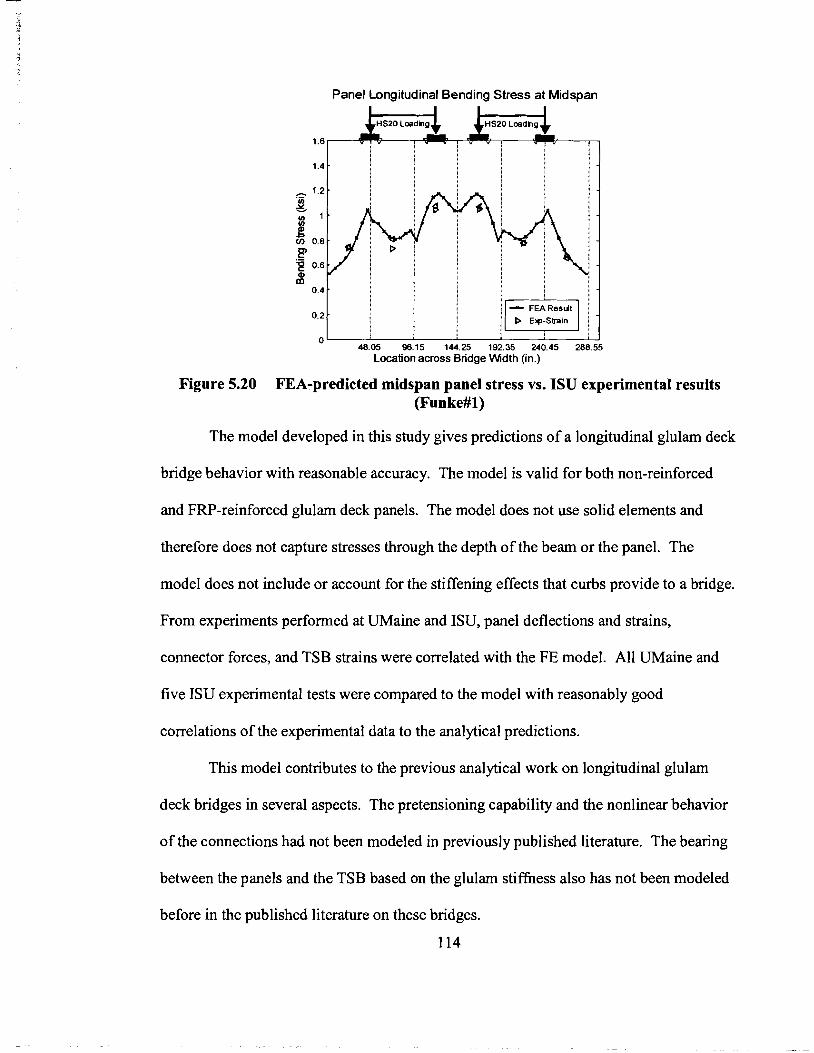
Panel Longitudinal Bending Stress at Midspan
0.2 -
- 48:05 96.'15 144.25 19i.35 24d.45 28 Location across Bridge Width (in.)
Figure 5.20 FEA-predicted midspan panel stress vs. ISU experimental results (Funke#l)
The model developed in this study gives predictions of a longitudinal glulam deck
bridge behavior with reasonable accuracy. The model is valid for both non-reinforced
and FRP-reinforced glulam deck panels. The model does not use solid elements and
therefore does not capture stresses through the depth of the beam or the panel. The
model does not include or account for the stiffening effects that curbs provide to a bridge.
From experiments performed at UMaine and ISU, panel deflections and strains,
connector forces, and TSB strains were correlated with the FE model. All UMaine and
five ISU experimental tests were compared to the model with reasonably good
correlations of the experimental data to the analytical predictions.
This model contributes to the previous analytical work on longitudinal glulam
deck bridges in several aspects. The pretensioning capability and the nonlinear behavior
of the connections had not been modeled in previously published literature. The bearing
between the panels and the TSB based on the glulam stifhess also has not been modeled
before in the published literature on these bridges.
114
Chapter 6
PARAMETRIC STUDY
6.1 Introduction
In order to investigate the behavior of longitudinal glulam deck bridges, in
general, and the behavior of the Transverse Stiffener Beam (TSB), in particular, a
parametric study was performed. The parametric study used the finite element model
described in Chapter 5 of this thesis. The purpose of the parametric study was twofold:
primarily, to determine the adequacy of current empirically-based AASHTO design
criteria for longitudinal glulam deck bridges (AASHTO 1996), and, secondarily, to
investigate any deficiencies found and propose recommendations to change AASHTO
criteria. Preliminary FEA studies performed at UMaine showed potential inadequacy in
the AASHTO 1996 TSB design criteria. These findings focused the parametric study on
TSB behavior. Relative Displacement between Panels (RPD) was also investigated,
since reflective cracking in the asphalt above panel joints running parallel to traffic has
been reported to be a problem with these bridges. Prior to evaluating the adequacy of the
AASHTO design criteria, the sensitivity of the TSB stresses and RPD to various design
parameters was investigated. Once sensitivity and trends were understood, critical bridge
configurations and loading were found. This chapter outlines the parametric study,
presents results, identifies inadequacies in the AASHTO design criteria, and proposes
simple "fixes" to the AASHTO design methodology for longitudinal glulam decks.
6.2 Overview
6.2.1 Scope
The parametric study started with an investigation into the sensitivity of TSB
stresses and Relative Panel Displacement (RPD) to the following thirteen design
parameters described in Table 6.1 : bridge span, TSB spacing, bridge width, panel width,
number of lanes, panel material properties, panel thickness, panel-TSB connections, TSB
MOE, TSB geometry (aspect ratio), TSB size, and loading position. This allowed the
identification of critical loadings and associated design paranleters that maximize TSB
stresses and relative panel displacements. The adequacy of the current AASHTO design
criteria for longitudinal glulam decks was evaluated and changes were proposed. Forty-
three bridges were modeled and over 50 load cases were considered in 149 FEA analyses.
6.2.2 Rationale
In determining the range of parameters considered in this study, the effect of the
parameter on TSB behavior was the principal concern. This section describes the
rationale behind the bridge design parameters selected and the range of values analyzed
for each parameter.
Two critical bridge spans that result in maximum TSB spacing were considered:
a 20-ft. span bridge and a 35-ft. span bridge. AASHTO criteria require TSB spacing of
less than or equal to 10 feet and TSB to be placed at midspan (AASHTO 1996). Thus, a
bridge with a 20-foot span and a single TSB at midspan gives the maximum TSB
spacing. The longer spans have greater transverse load distribution between panels,
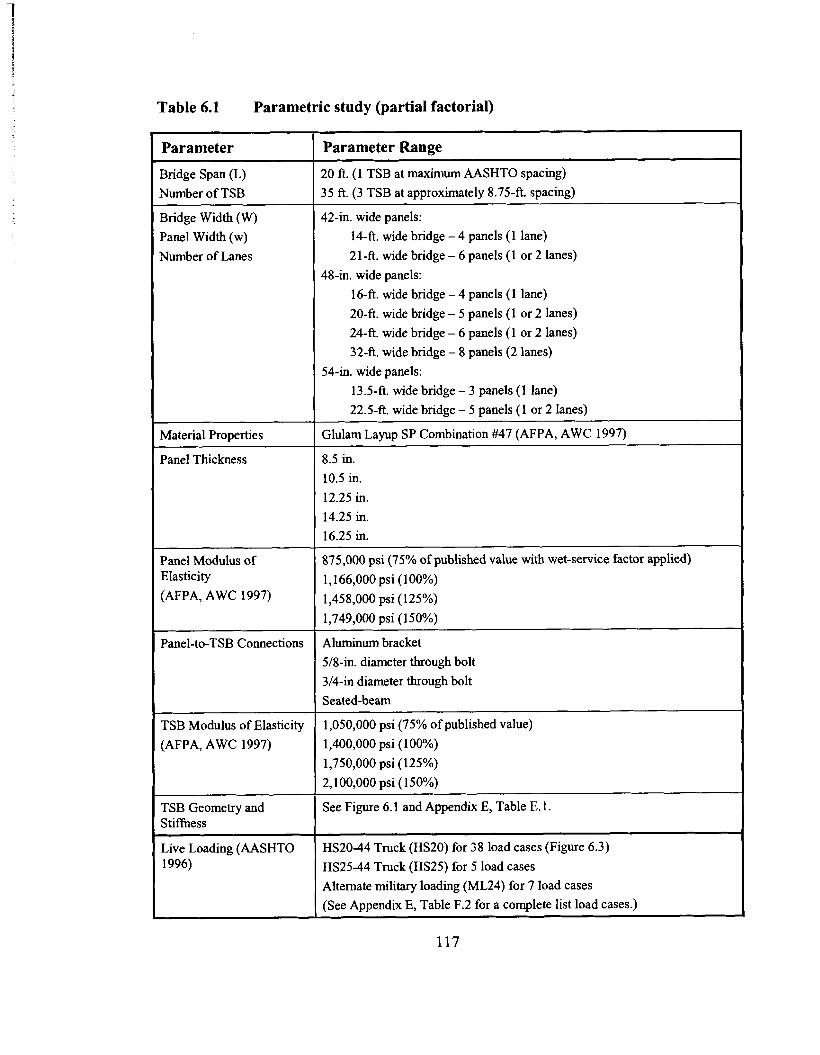
Table 6.1 Parametric study (partial factorial)
Bridge Span (L) Number of TSB
Bridge Width (W)
Panel Width (w)
Number of Lanes
Material Properties
Panel Thickness
Elasticity
(AFPA, AWC 1997)
Panel-to-TSB Connections r-- (AFPA, AWC 1997)
Live Loading (AASHTO 1996)
Parameter Range
20 ft. (1 TSB at maximum AASHTO spacing) 35 ft. (3 TSB at approximately 8.75-ft. spacing)
42-in. wide panels: 14-ft. wide bridge - 4 panels (1 lane)
2 1 -ft. wide bridge - 6 panels (1 or 2 lanes)
48-in. wide panels: 16-ft. wide bridge - 4 panels (1 lane)
20-ft. wide bridge - 5 panels (1 or 2 lanes)
243 . wide bridge - 6 panels (1 or 2 lanes) 32-ft. wide bridge - 8 panels (2 lanes)
54-in. wide panels: 13.5-ft. wide bridge - 3 panels (1 lane)
22.5-ft. wide bridge - 5 panels (1 or 2 lanes)
Glulam L a p p SP Combination #47 (AFPA, AWC 1997)
8.5 in.
10.5 in.
12.25 in. 14.25 in. 16.25 in.
875,000 psi (75% of published value with wet-service factor applied)
1,166,000 psi (100%)
1,458,000 psi (125%)
1,749,000 psi (150%)
Aluminum bracket
518-in. diameter through bolt
3/4-in diameter through bolt
Seated-beam
1,050,000 psi (75% of published value)
1,400,000 psi (1 00%)
1,750,000 psi (125%)
2,100,000 psi (150%)
See Figure 6.1 and Appendix E, Table E. I .
HS20-44 Truck (HS20) for 38 load cases (Figure 6.3)
HS25-44 Truck (HS25) for 5 load cases Alternate military loading (ML24) for 7 load cases
(See Appendix E, Table F.2 for a complete list load cases.)
117
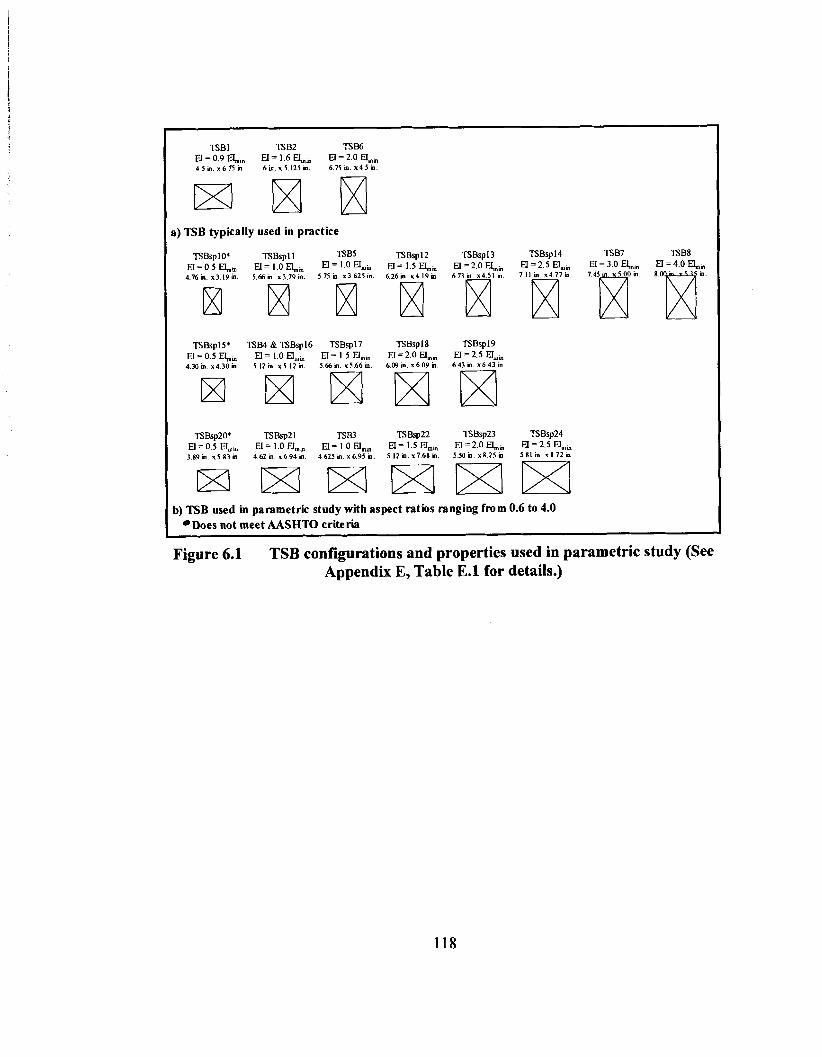
I) 'IS9 typically used in practice
1) TSB used in parametric study with aspect ratios ranging from 0.6 to 4.0 .Does not meet AASHTO criteria
Figure 6.1 TSB configurations and properties used in parametric study (See Appendix E, Table E.l for details.)

making the 35-foot span potentially critical as well. Following AASHTO requirements,
TSB spacing for the 35-foot span bridge is approximately 8.75 feet. Due to the necessity
that the placement of the TSB coincide with nodal locations in the FE model, three TSB
on the 35-ft. bridge: Two were symmetrically placed nine feet from the ends of the
bridge, and the third one was placed at midspan.
The number of panels and panel width depend on bridge width or number of lanes
of traffic. Three panel widths were selected for analysis: 42 inches, 48 inches, and 54
inches. These are, respectively, the minimum, typical, and maximum widths used in
practice. Initially, 42-inch panels were believed to maximize TSB stresses, since they
transfer a greater portion of the live load to the TSB. However, the 48-inch panels can be
critical since the AASHTO truck's wheel spacing can cause edge loading on two panels,
an occurrence not possible with 42-inch or 54-inch panels. On a bridge constructed of
42-in. wide panels or 54-in. wide panels, when one tire of the AASHTO HS20 truck is
placed at the edge of a panel, the other tire is either on a panel joint or close to the center
of the panel (Figure 6.2(a) and (c)). This second tire's placement will result in two panels
loaded by the tire (tire at panel joint) or less of the panel load being transferred to
adjacent panels due to the central placement of the tire on the panel. The six-foot, center-
to-center spacing of the AASHTO truck tires, however, will cause edge loading of two
48-in. wide panels whenever one wheel is placed at a panel edge (Figure 6.2(b)). One
and two lane bridge configurations were analyzed for each panel width (see Table 6.1).
Lane configurations followed AASHTO 3.6 (1996).
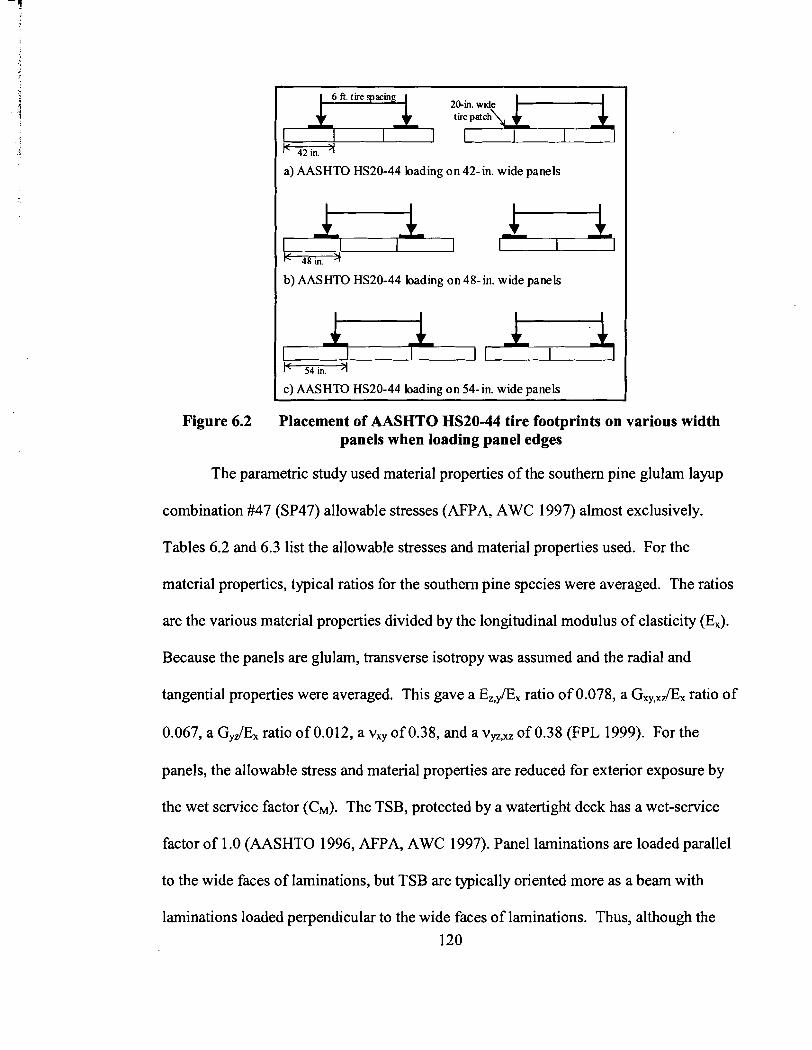
6 ft. tire acin
h 5 3 a) AASHTO HS20-44 bading on 42-in. wide panels
a 48 in.
I b) AASHTO HS20-44 bading on 48-in. wide panels
c) AASHTO HS20-44 bading on 54-in. wide panels
Figure 6.2 Placement of AASHTO HS20-44 tire footprints on various width panels when loading panel edges
The parametric study used material properties of the southern pine glulam layup
combination #47 (SP47) allowable stresses (AFPA, AWC 1997) almost exclusively.
Tables 6.2 and 6.3 list the allowable stresses and material properties used. For the
material properties, typical ratios for the southern pine species were averaged. The ratios
are the various material properties divided by the longitudinal modulus of elasticity (Ex).
Because the panels are glulam, transverse isotropy was assumed and the radial and
tangential properties were averaged. This gave a E,,/EX ratio of 0.078, a Gxy,,/Ex ratio of
0.067, a G,& ratio of 0.012, a vxy of 0.38, and a v,,, of 0.38 (FPL 1999). For the
panels, the allowable stress and material properties are reduced for exterior exposure by
the wet service factor (CM). The TSB, protected by a watertight deck has a wet-service
factor of 1 .O (AASHTO 1996, AFPA, AWC 1997). Panel laminations are loaded parallel
to the wide faces of laminations, but TSB are typically oriented more as a beam with
laminations loaded perpendicular to the wide faces of laminations. Thus, although the
120
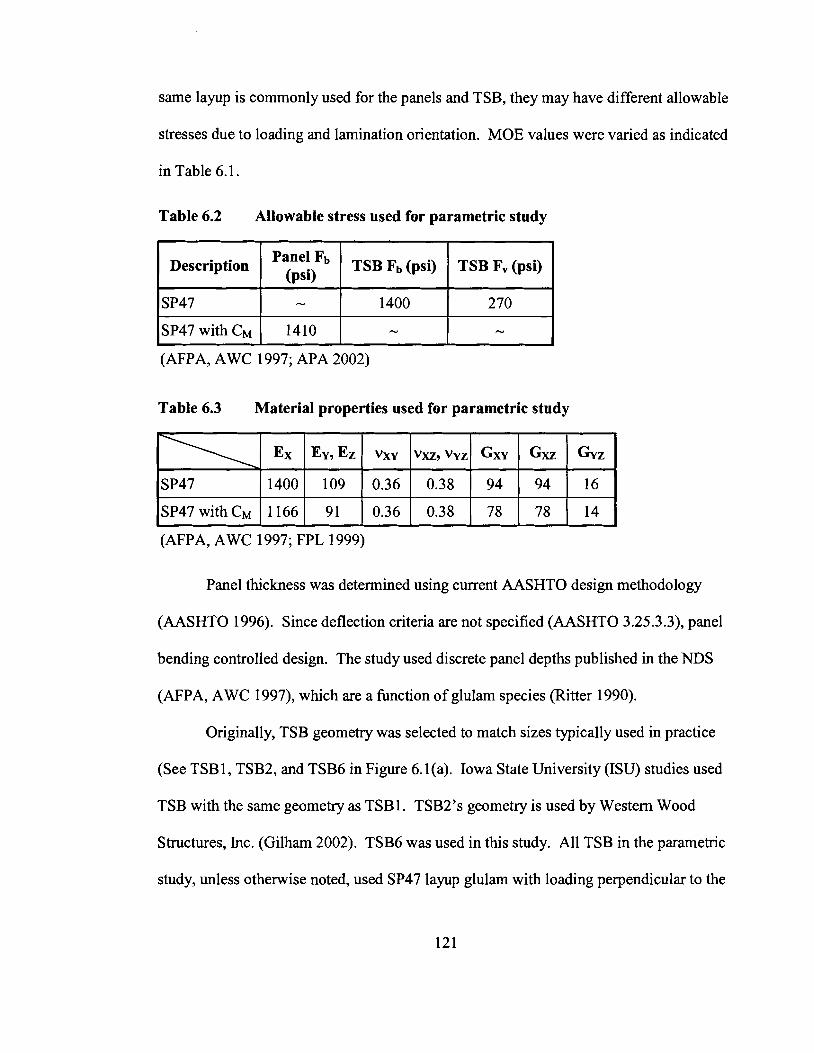
same layup is commonly used for the panels and TSB, they may have different allowable
stresses due to loading and lamination orientation. MOE values were varied as indicated
in Table 6.1.
Table 6.2 Allowable stress used for parametric study
(AFPA, AWC 1997; APA 2002)
Table 6.3 Material properties used for parametric study
Description
SP47
SP47 with CM
-
(AFPA, A WC 1997; FPL 1999)
Panel thickness was determined using current AASHTO design methodology
(AASHTO 1996). Since deflection criteria are not specified (AASHTO 3.25.3.3), panel
bending controlled design. The study used discrete panel depths published in the NDS
(AFPA, AWC 1997), which are a function of glulam species (Ritter 1990).
Originally, TSB geometry was selected to match sizes typically used in practice
(See TSB1, TSB2, and TSB6 in Figure 6.l(a). Iowa State University (ISU) studies used
TSB with the same geometry as TSBI. TSB2's geometry is used by Western Wood
Structures, Inc. (Gilham 2002). TSB6 was used in this study. All TSB in the parametric
study, unless otherwise noted, used SP47 layup glulam with loading perpendicular to the
Panel Fb (psi) -
1410
TSB Fb (psi)
1400
-
TSB FV (psi)
270
-
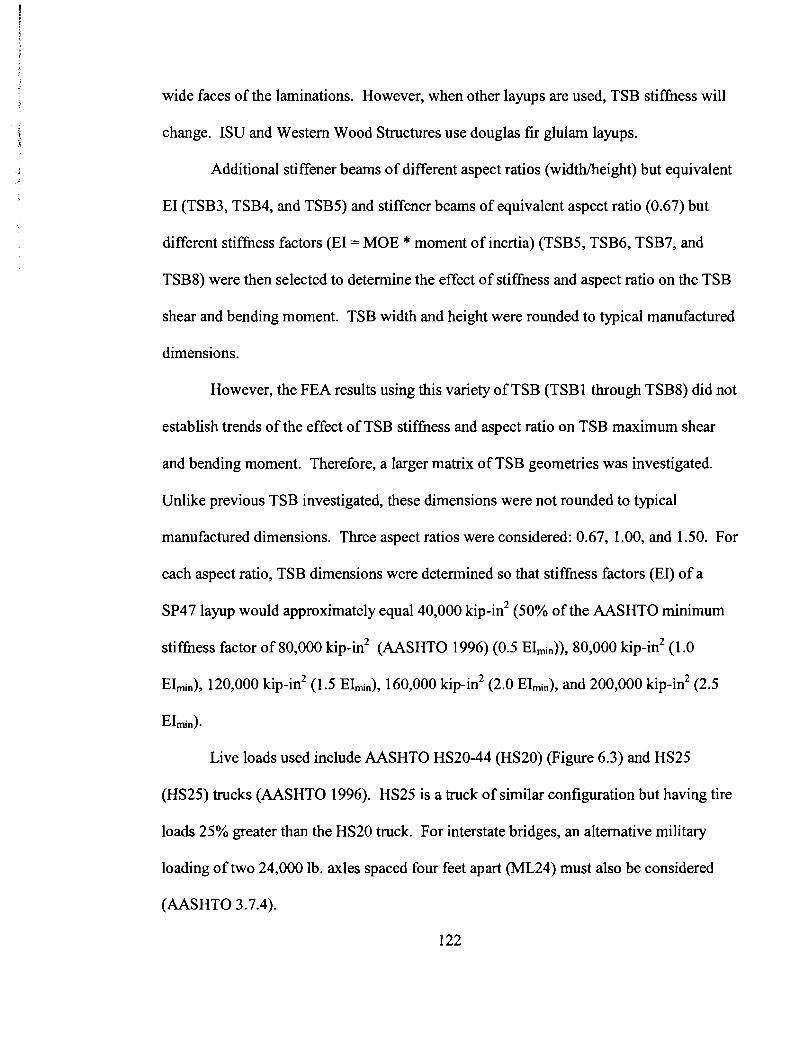
wide faces of the laminations. However, when other layups are used, TSB stifhess will
change. ISU and Western Wood Structures use douglas fir glulam layups.
Additional stiffener beams of different aspect ratios (widthheight) but equivalent
EI (TSB3, TSB4, and TSB5) and stiffener beams of equivalent aspect ratio (0.67) but
different stiffness factors (EI = MOE * moment of inertia) (TSBS, TSB6, TSB7, and
TSB8) were then selected to deternine the effect of stiffness and aspect ratio on the TSB
shear and bending moment. TSB width and height were rounded to typical manufactured
dimensions.
However, the FEA results using this variety of TSB (TSB 1 through TSB8) did not
establish trends of the effect of TSB stifhess and aspect ratio on TSB maximum shear
and bending moment. Therefore, a larger matrix of TSB geometries was investigated.
Unlike previous TSB investigated, these dimensions were not rounded to typical
manufactured dimensions. Three aspect ratios were considered: 0.67, 1.00, and 1 SO. For
each aspect ratio, TSB dimensions were determined so that stiffness factors (EI) of a
SP47 layup would approximately equal 40,000 kip-in2 (50% of the AASHTO minimum
stifhess factor of 80,000 kip-in2 (AASHTO 1996) (0.5 EImin)), 80,000 kip-in2 (1.0
EImin), 120,000 kip-in2 (1.5 EI,,,in), 160,000 kip-in2 (2.0 EImin), and 200,000 kip-in2 (2.5
EImin).
Live loads used include AASHTO HS20-44 (HS20) (Figure 6.3) and HS25
(HS25) trucks (AASHTO 1996). HS25 is a truck of similar configuration but having tire
loads 25% greater than the HS20 truck. For interstate bridges, an alternative military
loading of two 24,000 lb. axles spaced four feet apart (ML24) must also be considered
(AASHTO 3.7.4).
122
Figure 6.3 HS20-44 live load truck (Courtesy of AASHTO 1996, Figure 3.7.7A)
6.3 Results of Parametric Study
The parametric FE study showed that the TSB may be considerably overstressed
under certain conditions, when designed according to current AASHTO criteria
(AASHTO 1996). Only the TSB shear forces, shear stresses, bending moments and
bending stresses, along with relative movement at longitudinal panel joints, are reported
here. Other results obtained from the FE analysis include panel stresses, deflections,
forces in connections, and panel-to-TSB bearing forces. These and other FEA results and
are given in Appendix E. Loading used to maximize FWD typically placed the truck
wheels far from the TSB and thus did not cause it to be critically stressed.
6.3.1 Sensitivity of Transverse Stiffener Beam (TSB) Response and Relative Panel Displacement (RPD) to Bridge Parameters
6.3.1.1 Sensitivity to Panel-to-TSB Connections
The TSB stresses and FWD are sensitive to the panel-to-TSB connection type.
However, due to the nonlinear nature of these connections in tension, trends are
sometimes difficult to explain intuitively. Chapter 5 provides information on the panel-
to-TSB connection models used and Figure 5.7 provides the load-slip curves used to
model the nonlinear behavior of the connection in tension. The slip in the connection is
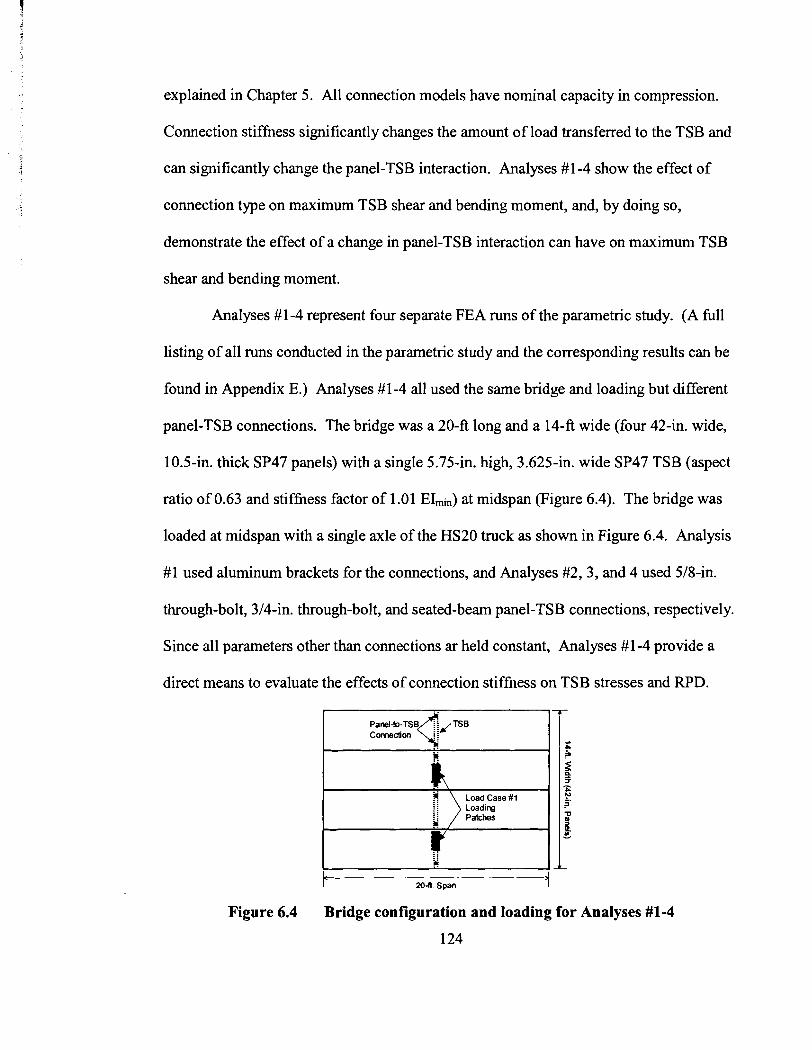
explained in Chapter 5. All connection models have nominal capacity in compression.
Connection stiffness significantly changes the anlount of load transferred to the TSB and
can significantly change the panel-TSB interaction. Analyses #1-4 show the effect of
connection type on maximum TSB shear and bending moment, and, by doing so,
demonstrate the effect of a change in panel-TSB interaction can have on maximum TSB
shear and bending moment.
Analyses #1-4 represent four separate FEA runs of the parametric study. (A full
listing of all runs conducted in the parametric study and the corresponding results can be
found in Appendix E.) Analyses #1-4 all used the same bridge and loading but different
panel-TSB connections. The bridge was a 20-ft long and a 14-ft wide (four 42-in. wide,
10.5-in. thick SP47 panels) with a single 5.75-in. high, 3.625-in. wide SP47 TSB (aspect
ratio of 0.63 and stiffness factor of 1 .Ol EImin) at midspan (Figure 6.4). The bridge was
loaded at midspan with a single axle of the HS20 truck as shown in Figure 6.4. Analysis
#1 used aluminum brackets for the connections, and Analyses #2,3, and 4 used 518-in.
through-bolt, 314-in. through-bolt, and seated-beam panel-TSB connections, respectively.
Since all parameters other than connections ar held constant, Analyses #1-4 provide a
direct means to evaluate the effects of connection stiffness on TSB stresses and RPD.
Figure 6.4 Bridge configuration and loading for Analyses #1-4
124

The results of Analyses #1-4 are presented in the next several figures. Figure 6.5
shows the deflection of the panels at midspan and the deflection of TSB across the width
of the bridge. All four analyses are presented in the figure to show the effect of
connection type on the panel-TSB interaction. The seated beam's stiffness allows
relatively little slip in the connection and, as a result, the TSB bears on the center of the
some panels (second and fourth panels from the left) as well as the edges of others (first
and third panels and the right edge of the fourth panel). With other connection systems,
the bearing of the TSB on the center of a panel does not occur, giving different TSB-deck
interaction. The panels' deflections are more unifornl with the stiffer connections,
showing that the stiffer connection system distributes more of the load to adjacent panels.
Graphs of panel and TSB deflection assist in understanding TSB performance by
showing panel-TSB interaction. (Appendix E contains maximum panel and TSB
deflections for each analysis performed.)
The increased load distribution with the stiffer connection can be seen in plots of
connection and bearing forces between the panels and the TSB. In Figure 6.6, the tensile
(positive) axial force in each panel-to-TSB connection is plotted using discrete points,
and the compressive (negative) force transmitted by panel-TSB bearing is plotted using a
continuous line. Since the bearing connections are six inches apart, the deck-TSB
bearing forces in Figure 6.6 are essentially given in kips16 in. In the model the bearing
elements are discrete springs that carry only compressive loads; they are further described
in Chapter 5. Figure 6.6 shows the differences in forces transferred between the panels
and the TSB fore Analyses #1-4. The lower stiffhess of the aluminum bracket results in a
lower maximum connection load. The maximum load in a seated-beam connection is
125
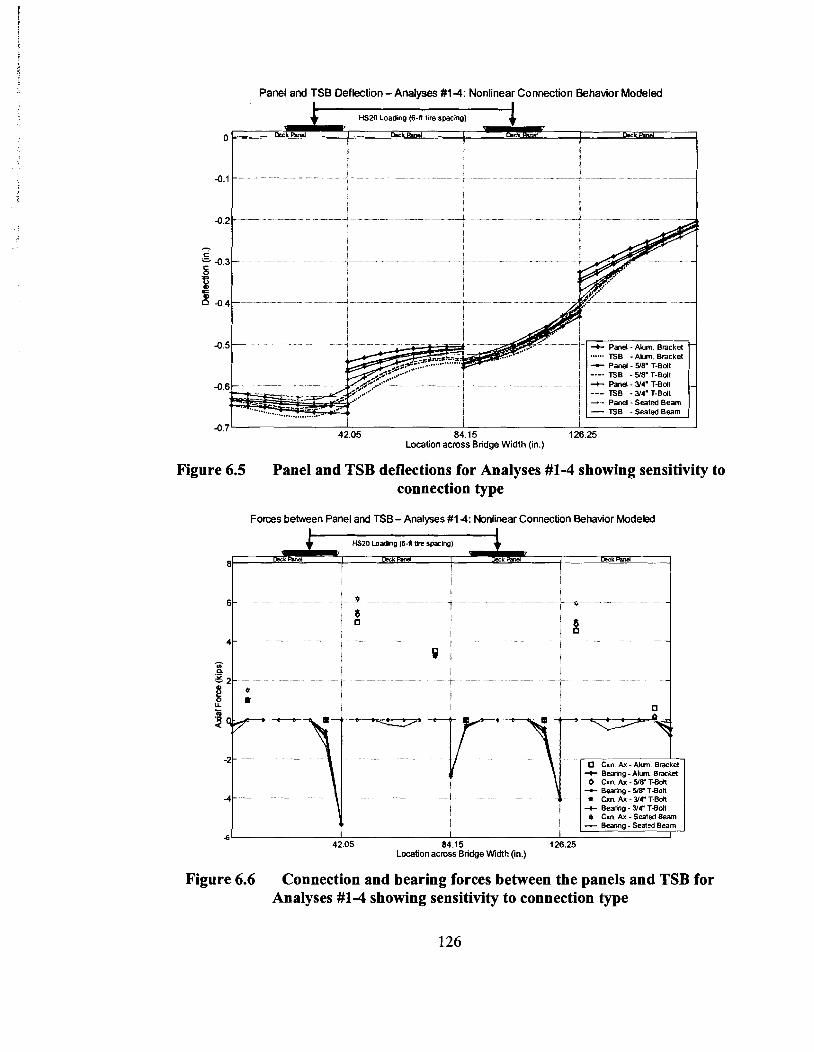
Panel and TSB Deflection - Analyses #14: Nonlinear Connection Behavior Modeled
j ( - TSB -Seated Beam ( 1 15 84.15 126.25
Location across Bridge Width (in.)
Figure 6.5 Panel and TSB deflections for Analyses #1-4 showing sensitivity to connection type
Forces between Panel and TSB - Analyses #14: Nonlinear Connection Behavior Modeled
I I I I 42.05 84.15 126.25
Location across Bridge W~dth (in.)
Figure 6.6 Connection and bearing forces between the panels and TSB for Analyses #1-4 showing sensitivity to connection type
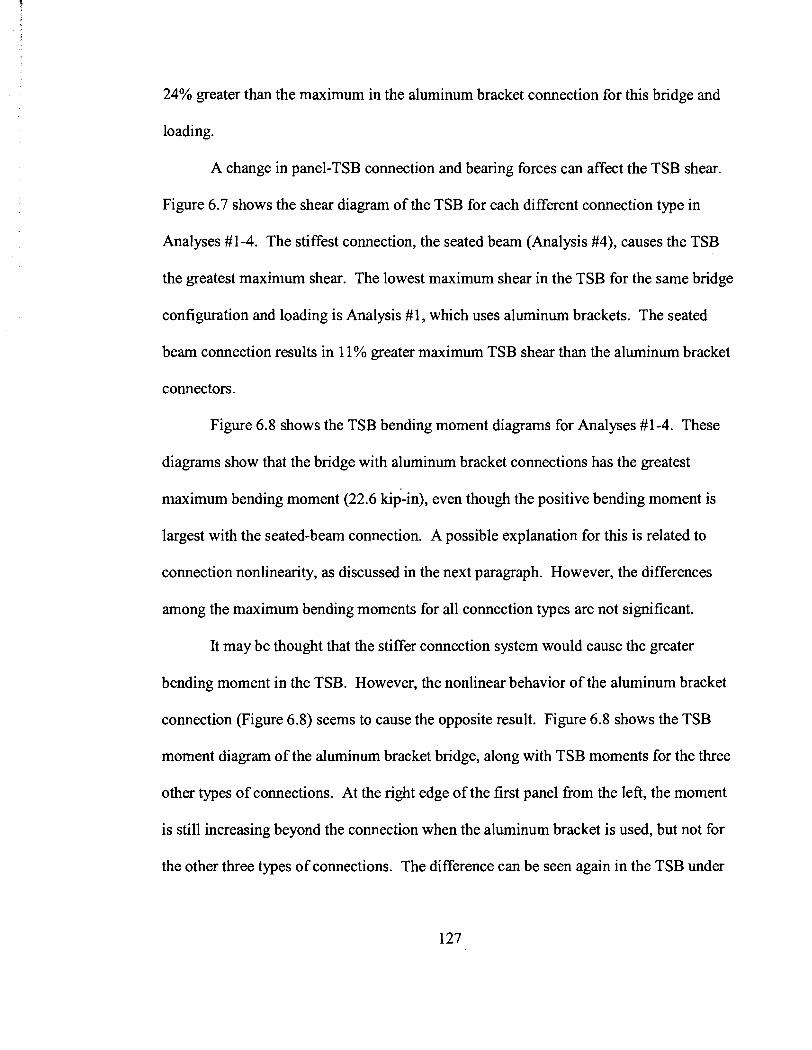
24% greater than the maximum in the aluminum bracket connection for this bridge and
loading.
A change in panel-TSB connection and bearing forces can affect the TSB shear.
Figure 6.7 shows the shear diagram of the TSB for each different connection type in
Analyses #1-4. The stiffest connection, the seated beam (Analysis #4), causes the TSB
the greatest maximum shear. The lowest maximum shear in the TSB for the same bridge
configuration and loading is Analysis #1, which uses aluminum brackets. The seated
beam connection results in 11% greater maximum TSB shear than the aluminum bracket
connectors.
Figure 6.8 shows the TSB bending moment diagrams for Analyses #1-4. These
diagrams show that the bridge with aluminum bracket connections has the greatest
maximum bending moment (22.6 kigin), even though the positive bending moment is
largest with the seated-beam connection. A possible explanation for this is related to
connection nonlinearity, as discussed in the next paragraph. However, the differences
among the maximum bending moments for all connection types are not significant.
It may be thought that the stiffer connection system would cause the greater
bending moment in the TSB. However, the nonlinear behavior of the aluminum bracket
connection (Figure 6.8) seems to cause the opposite result. Figure 6.8 shows the TSB
moment diagram of the aluminum bracket bridge, along with TSB moments for the three
other types of connections. At the right edge of the first panel from the left, the moment
is still increasing beyond the connection when the aluminum bracket is used, but not for
the other three types of connections. The difference can be seen again in the TSB under

TSB Shear Force - Analyses #la: Nonlinear Connection Behavior Modeled I Hs20 Loadino 16-1 tue smcim) I
- 4 1 Max Seated Beam +
Shear = 5 70 kio
Max Alum Bracket . Shear = 5 14 kip
Alum~nun Bracket ...... YC Tmber Bdt
[ - Seated Beam ] I I
42.05 84.15 126.25 Locationacmss Bridge Width (in.)
Figure 6.7 TSB shear diagrams for Analyses #1-4 showing sensitivity to panel-to- TSB connection type
TSB Bending Moment - Analyses #I-4: Nonlinear Connection Behavior Modeled
42.05 84.15 126.25 Location a m s s Blidge Width (in.)
Figure 6.8 TSB bending moments diagrams for Analyses #1-4 showing sensitivity to connection type
128
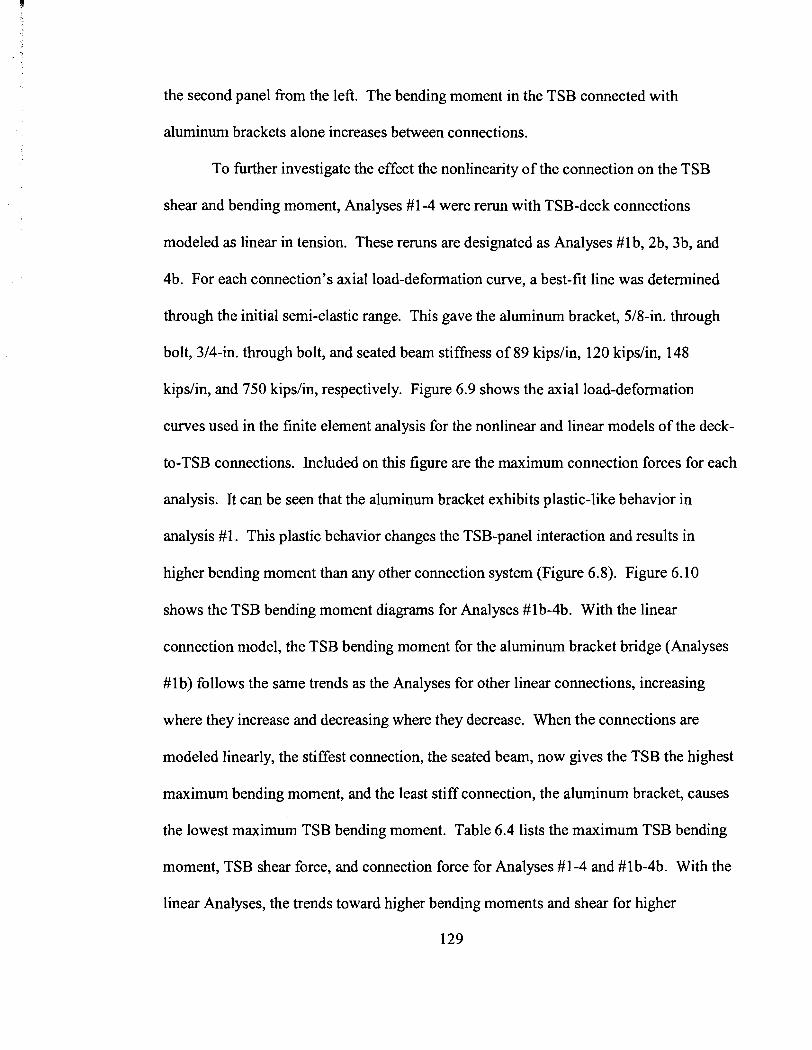
the second panel from the left. The bending moment in the TSB connected with
aluminum brackets alone increases between connections.
To further investigate the effect the nonlinearity of the connection on the TSB
shear and bending moment, Analyses #1-4 were rerun with TSB-deck connections
modeled as linear in tension. These reruns are designated as Analyses #I b, 2b, 3b, and
4b. For each connection's axial load-deformation curve, a best-fit line was determined
through the initial semi-elastic range. This gave the aluminum bracket, 518-in. through
bolt, 314-in. through bolt, and seated beam stiffness of 89 kipslin, 120 kipdin, 148
kipslin, and 750 kipdin, respectively. Figure 6.9 shows the axial load-deformation
curves used in the finite element analysis for the nonlinear and linear models of the deck-
to-TSB connections. Included on this figure are the maximum connection forces for each
analysis. It can be seen that the aluminum bracket exhibits plastic-like behavior in
analysis #l . This plastic behavior changes the TSB-panel interaction and results in
higher bending moment than any other connection system (Figure 6.8). Figure 6.10
shows the TSB bending moment diagrams for Analyses #lb-4b. With the linear
connection model, the TSB bending moment for the aluminum bracket bridge (Analyses
#lb) follows the same trends as the Analyses for other linear connections, increasing
where they increase and decreasing where they decrease. When the connections are
modeled linearly, the stiffest connection, the seated beam, now gives the TSB the highest
maximum bending moment, and the least stiff connection, the aluminum bracket, causes
the lowest maximum TSB bending moment. Table 6.4 lists the maximum TSB bending
moment, TSB shear force, and connection force for Analyses #1-4 and #lb-4b. With the
linear Analyses, the trends toward hlgher bending moments and shear for higher
129
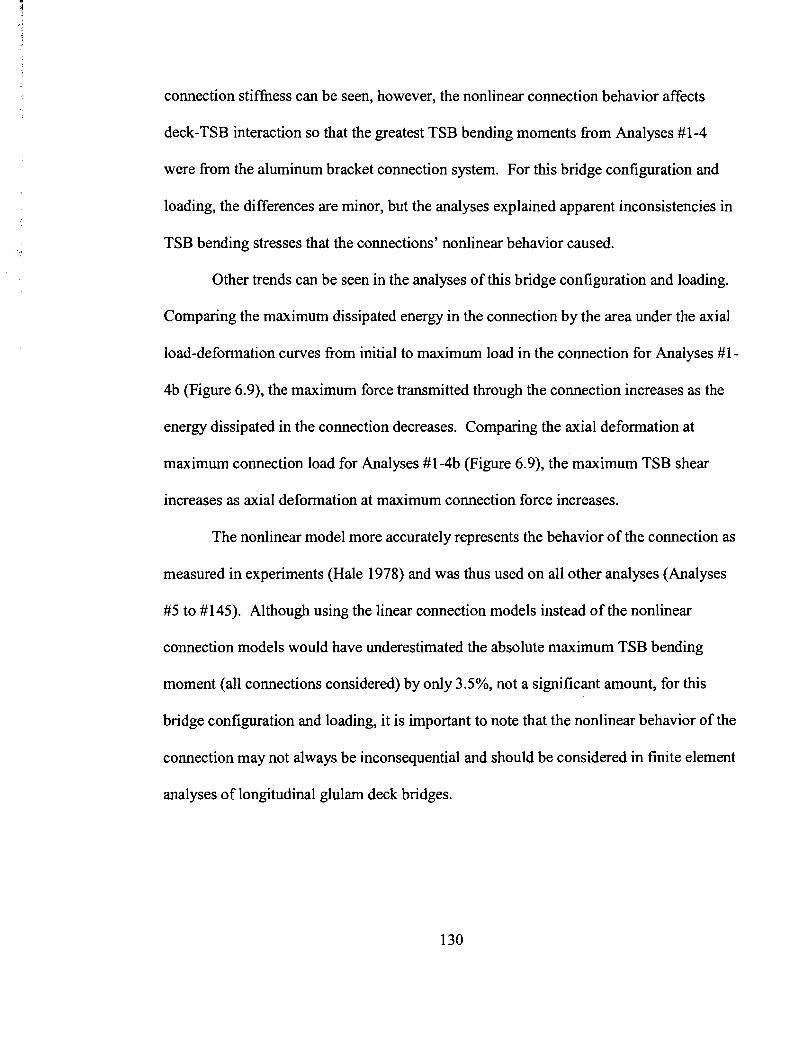
connection stiffness can be seen, however, the nonlinear connection behavior affects
deck-TSB interaction so that the greatest TSB bending moments from Analyses #1-4
were from the aluminum bracket connection system. For this bridge configuration and
loading, the differences are minor, but the analyses explained apparent inconsistencies in
TSB bending stresses that the connections' nonlinear behavior caused.
Other trends can be seen in the analyses of this bridge configuration and loading.
Comparing the maximum dissipated energy in the connection by the area under the axial
load-deformation curves from initial to maximunl load in the connection for Analyses #1-
4b (Figure 6.9), the maximum force transmitted through the connection increases as the
energy dissipated in the connection decreases. Comparing the axial deformation at
maximum connection load for Analyses #1-4b (Figure 6.9), the maximum TSB shear
increases as axial deformation at maximum connection force increases.
The nonlinear model more accurately represents the behavior of the connection as
measured in experiments (Hale 1978) and was thus used on all other analyses (Analyses
#5 to #145). Although using the linear connection models instead of the nonlinear
connection models would have underestimated the absolute maximum TSB bending
moment (all connections considered) by only 3.5%, not a significant amount, for this
bridge configuration and loading, it is important to note that the nonlinear behavior of the
connection may not always be inconsequential and should be considered in finite element
analyses of longitudinal glulam deck bridges.
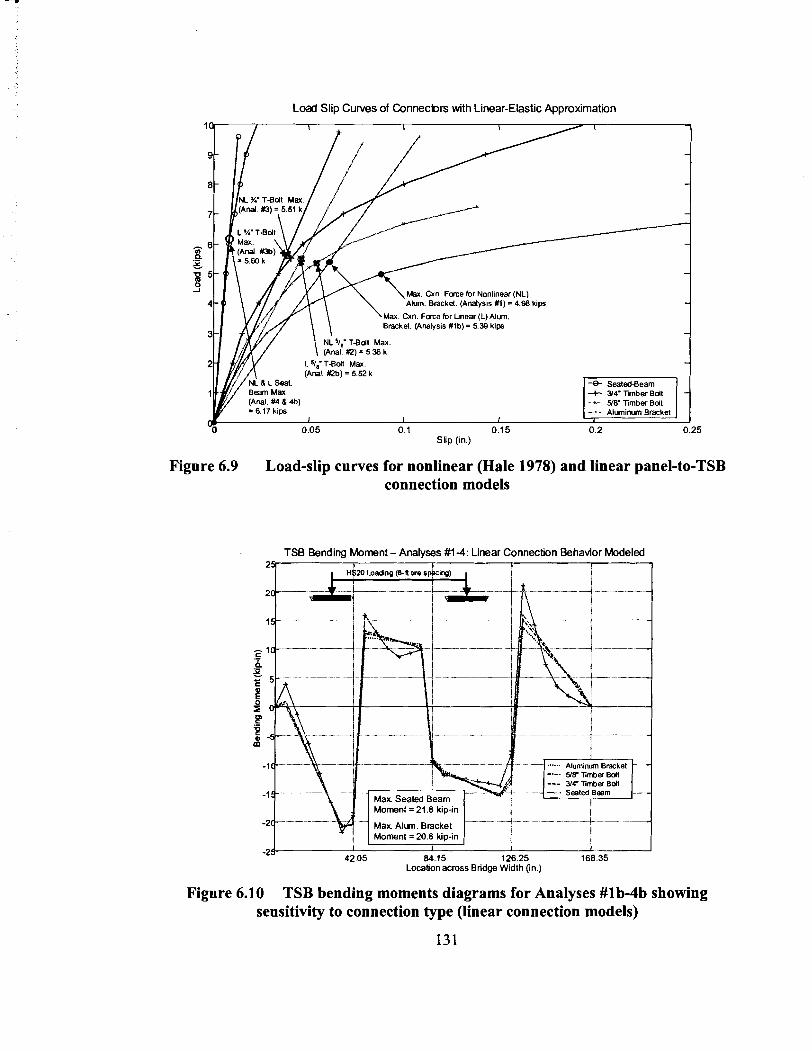
Load Slip Curves of Connecbrs with Linear-Elastic Approximation
Max. Cxn. Force for Nonlinear (NL) Alum. Bracket (Analysis #I) = 4.98 kips
Max. Cxn. Fate for Linear (L) Alum. Bracket. (Analysis #lb) = 5.39 kips
Slip (in.)
Figure 6.9 Load-slip curves for nonlinear (Hale 1978) and linear panel-to-TSB connection models
TSB Bending Moment - Analyses #1-4: Linear Connection Behavior Modeled
'I- -
I Moment = 21.8 kip-in I i .-.. ... - -2 .. -
Max A l m . Bracket Moment = 20.6 kip-in
-24 I
42.05 84.15 126.25 168.35 Location across Bridge Width (in.)
Figure 6.10 TSB bending moments diagrams for Analyses #lb-4b showing sensitivity to connection type (linear connection models)
131
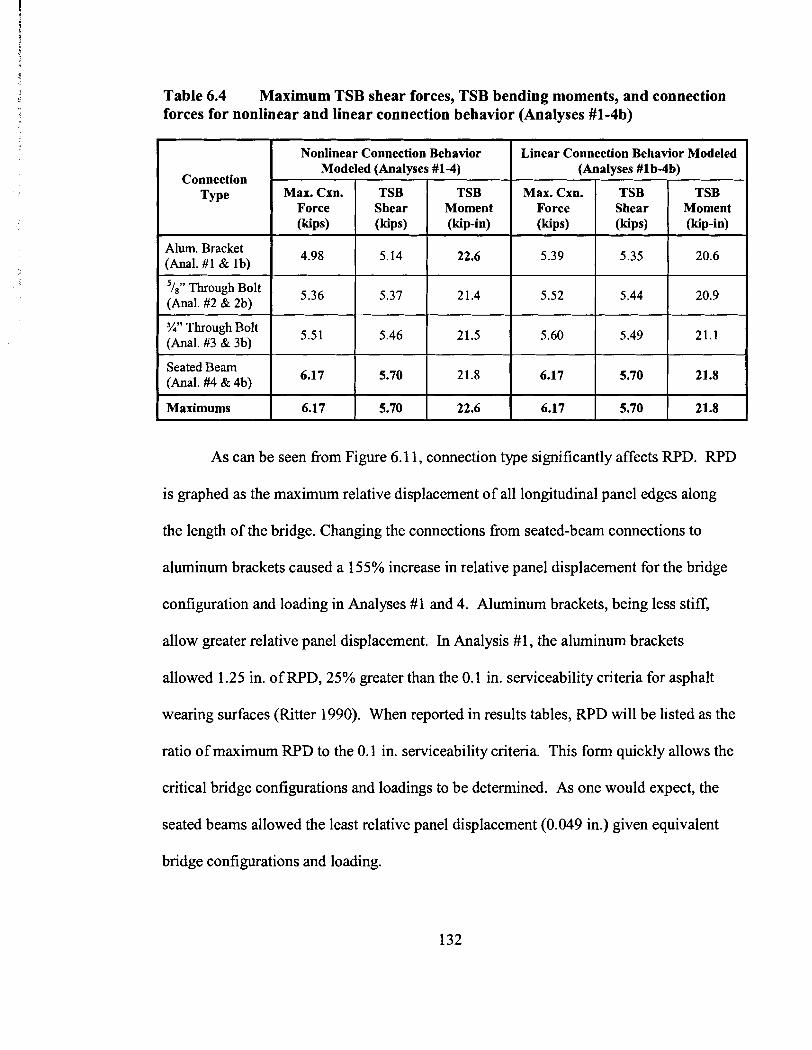
Table 6.4 Maximum TSB shear forces, TSB bending moments, and connection forces for nonlinear and linear connection behavior ( ~ n h s e s #I-4b)
Connection Type
Alum Bracket (Anal. #l & lb)
5 ~ 8 / 8 1 9 T ~ ~ o u ~ I . , B O ~ ~
(Anal. #2 & 2b)
%" Through Bolt (Anal. #3 & 3b)
Seated Beam (Anal. #4 & 4b)
Maximums
Nonlinear Connection Behavior Modeled (Analyses #1-4)
As can be seen fiom Figure 6.11, connection type significantly affects RPD. RPD
is graphed as the maximum relative displacement of all longitudinal panel edges along
the length of the bridge. Changing the connections from seated-beam connections to
aluminum brackets caused a 155% increase in relative panel displacement for the bridge
configuration and loading in Analyses #1 and 4. Aluminum brackets, being less stiff,
allow greater relative panel displacement. In Analysis #1, the aluminum brackets
allowed 1.25 in. of RPD, 25% greater than the 0.1 in. serviceability criteria for asphalt
wearing surfaces (Ritter 1990). When reported in results tables, RPD will be listed as the
ratio of maximum RPD to the 0.1 in. serviceability criteria. This form quickly allows the
critical bridge configurations and loadings to be determined. As one would expect, the
seated beams allowed the least relative panel displacement (0.049 in.) given equivalent
bridge configurations and loading.
Linear Connection Behavior Modeled (Analyses #lb-4b)
Max. Cxn. I Force
(kips)
TSB Shear (kips)
TSB Moment (kip-in)
Max. Cxn. Force (kips)
TSB Shear (kips)
TSB Moment (kip-in)

Figure 6.11 Relative panel displacement sensitivity to connection type (nonlinear connection models)
Relative Panel Deflections -Analyses #14 Nonlinear Connection Behavior Modeled
Table 6.5 compares TSB stresses and RPD for different connection types. All
0 14-
0 1 2 -
analyses in this table and throughout the rest of the thesis model the deck-to-TSB
v v "... Alun~nun B m k d -'-. YB Xmber Bdl
*...- * . . . . . . . . . . . . . . . . . . . , -.. --- 3'4' Xrnber Bdl -- - - - ,,..'
, , I,, _ _ El-' - Seated Bean
connections with tension behavior as nonlinear. For each set of comparable analyses (i.e.
analyses with identical bridge geometries and loadings but different connections), the
analyses are listed in order of connection stiffness. The groups of directly comparable
analyses are separated by double lines. For these analyses, the bridges with aluminum
bracket connections consistently have greater maximum TSB bending moments than the
same loading and bridge configurations with seated beam connections. Comparing
Analyses #76 to #75, the aluminum bracket caused 25% greater TSB bending moment
than the seated beam. The analyses in Table 6.5 also show higher maximum shear for the
stiffer seated-beam connection given a bridge configuration and loading. Comparing
Analyses #73 to #74, the seated-beam connection caused 20% greater maximum TSB
shear than the aluminum bracket connection. The table also includes TSB stress
133

utilization ratios (f/F'). These stress utilization ratios are the TSB stress obtained from
finite element analysis divided by the allowable stress. A stress utilization ratio greater
than one indicates that the TSB is overstressed. For these analyses listed, which consist
of bridges and loading meeting AASHTO design criteria, in a little less than half the TSB
is overstressed in bending and in two thirds the TSB is overstressed in shear. The TSB in
Analysis #72 has 49% more bending stress than allowable, and the TSB in Analysis #7 1
has 68% more shear stress than allowable. (Load cases listed in the table are shown in
Figure 6.12.) Only a few of the results have been pointed out here, but the trends noted
are supported throughout Table 6.5.
Considering RPD utilization, the analyses in Table 6.5 indicate that RPD for
bridges with seated-beam connections are less for bridges with aluminum-bracket
connections. Comparing Analyses # 102 to # 103, the alun~inum-bracket connection has a
25% greater RPD utilization ratio than the seated-beam connection. (In Table 6.5, TSB
stresses are not listed for Analyses #102, 103, and in other similar cases where loading
maximizes RPD but does not critically stress the TSB.) It is also noteworthy that the
movement of panels relative to one another is less sensitive to connection systems as the
loading moves away fiom the connection. This is clearly shown in Table 6.5, by
comparing analyses using Load Case #19 (Figure 6.12) to analyses using Load Case #49.
Analyses of midpan loading resulted in 209% increase in RPD when aluminum brackets
are used over seated beams (Analyses #7 1 and 72). Loading at quarter span causes only a
16% increase in RPD when aluminum brackets replace seated beam connections
(Analyses #96 and 97).
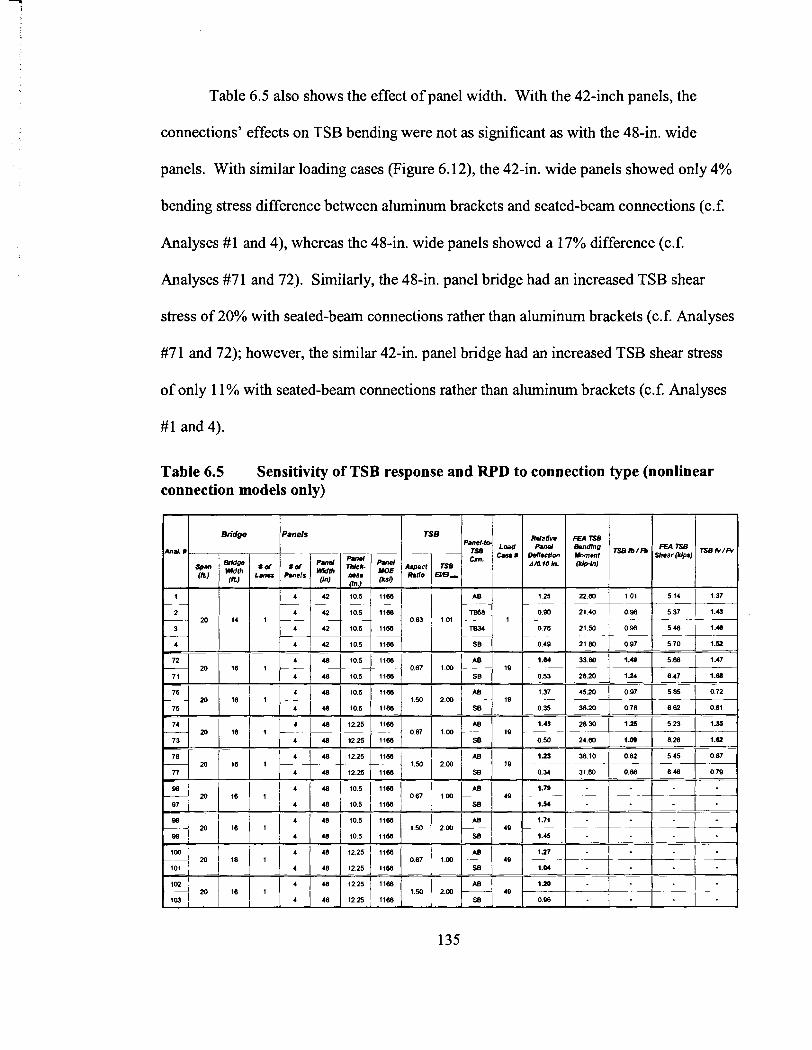
Table 6.5 also shows the effect of panel width. With the 42-inch panels, the
connections' effects on TSB bending were not as significant as with the 48-in. wide
panels. With similar loading cases (Figure 6.12), the 42-in. wide panels showed only 4%
bending stress difference between aluminum brackets and seated-beam connections (c.f.
Analyses #1 and 4)' whereas the 48-in. wide panels showed a 17% difference (c.f.
Analyses #71 and 72). Similarly, the 48-in. panel bridge had an increased TSB shear
stress of 20% with seated-beam connections rather than aluminum brackets (c.f. Analyses
#7 1 and 72); however, the similar 42-in. panel bridge had an increased TSB shear stress
of only 11% with seated-beam connections rather than aluminum brackets (c.f. Analyses
#1 and 4).
Table 6.5 Sensitivity of TSB response and RPD to connection type (nonlinear connection models only)
Anal. 8 --
Span ww 8 d 8 d $: A;;
(n) Ty L- ~ n e l s
1 1 I / 1 4 1 4 2 1 1 0 . 5 ) 1 1 6 8 1
gS 4 48 10.5 I I W I 06, 20 18 1
87 4 48 10.5 1168 - ----

Load Case #I - HS20 Loading Load Case #I 9 - HS20 Loading Load Case M9 - HS20 Loading
I- 20-ft Span
Figure 6.12 Plan view of Load Cases #1, #19, and #49
6.3.1.2 Sensitivity to Panel Thickness and Modulus of Elasticity
As the panel thickness or panel MOE increases, the panels are stiffer and will
transfer less load to the TSB. This will typically result in lower TSB shear and bending
stresses as panel stiffness increases providing that rest of the bridge design parameters
and loading remain constant. Table 6.6 shows that, in the cases analyzed, increasing the
panel thickness will reduce TSB shear stress, TSB bending stress, and RPD if the rest of
the bridge configuration and the loading are held constant. Comparing Analyses #35 and
47, the utilization ratio for TSB bending stress decreases 28%, from 1.36 to 0.98 as the
panel thickness increases 36% fiom 10.5 in. to 14.25 in. Comparing TSB shear stress
utilization ratios for the same analyses, the utilization ratio decreases only 12% (&om
1.64 to 1.44), not a very significant amount, as the panel thickness increases. RPD for
the same analyses shows a 23% utilization reduction (fiom 0.93 to 0.81). Table 6.7
shows a similar trend of stress and deflection reduction as panel MOE increases.
Comparing Analyses #35 and 50, the utilization ratios decrease as follows for a 50%
increase in panel MOE from 1 166 ksi to 1749 ksi: TSB bending stress utilization
decreases a minor lo%, dropping &om 1.36 to 1.23; TSB shear stress utilization
decreases an insignificant 4%, dropping from 1.64 to 1.58; and RPD utilization decreases
a minor 9%, dropping from 0.93 to 0.85.
6.3.1.3 Sensitivity to TSB Modulus of Elasticity
TSB bending moment and RPD are sensitive to TSB MOE; however, TSB shear
does not appear to be sensitive to TSB MOE. Changing the TSB MOE through an
appropriate range of values (1050 ksi - 2100 ksi) shows that the TSB stifhess slightly
affects the amount of load transferred between the panels and TSB through connections
and bearing. There is no significant change in maximum connection force or in
maximum bearing force when the TSB MOE was changed from 150% of the published
SP47 value to 75% of it (Analyses #5 1 and 53) (see also Appendix E). Although the
maximum shear force in the TSB is not significantly affected, bending moment is
significantly affected (Figure 6.13 and Table 6.8). TSB shear stress utilization ratios
increased a mere 2%, rising from 1.63 to 1.67, as TSB MOE increased 100%. For
analyses shown in Figure 6.13, maximum TSB bending moment increased by 25.5% as
TSB MOE increased from 75% to 150% of SP47 MOE. As would be expected, TSB
MOE has a significant effect on relative panel deflection, the TSB with an MOE of 1050
ksi allowing 24% more RPD than a TSB with an MOE of 2100 ksi (Analyses #5 1 and 53)
(Table 6.8).
6.3.1.4 Sensitivity to TSB Geometry
TSB stresses are very sensitive to TSB geometry (aspect ratio and moment of
inertia), although due to the nature of the structural system, it is also complicated. If the
aspect ratio is maintained, increasing the stifiess by increasing moment of inertia can
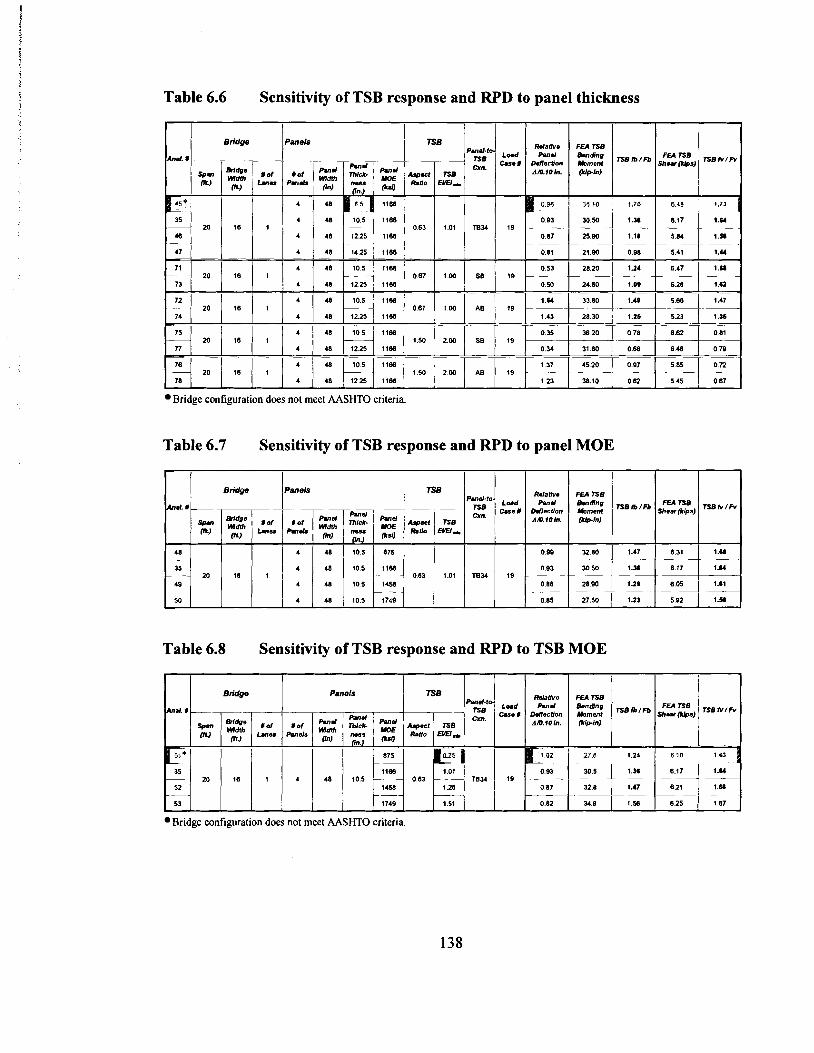
Table 6.6 Sensitivity of TSB response and RPD to panel thickness
I Bridge
Bridge configuration does not meet AASHTO criteria.
Table 6.7 Sensitivity of TSB response and RPD to panel MOE
Bridga
Table 6.8 Sensitivity of TSB response and RPD to TSB MOE
Bridge configuration does not meet AASHTO criteria.
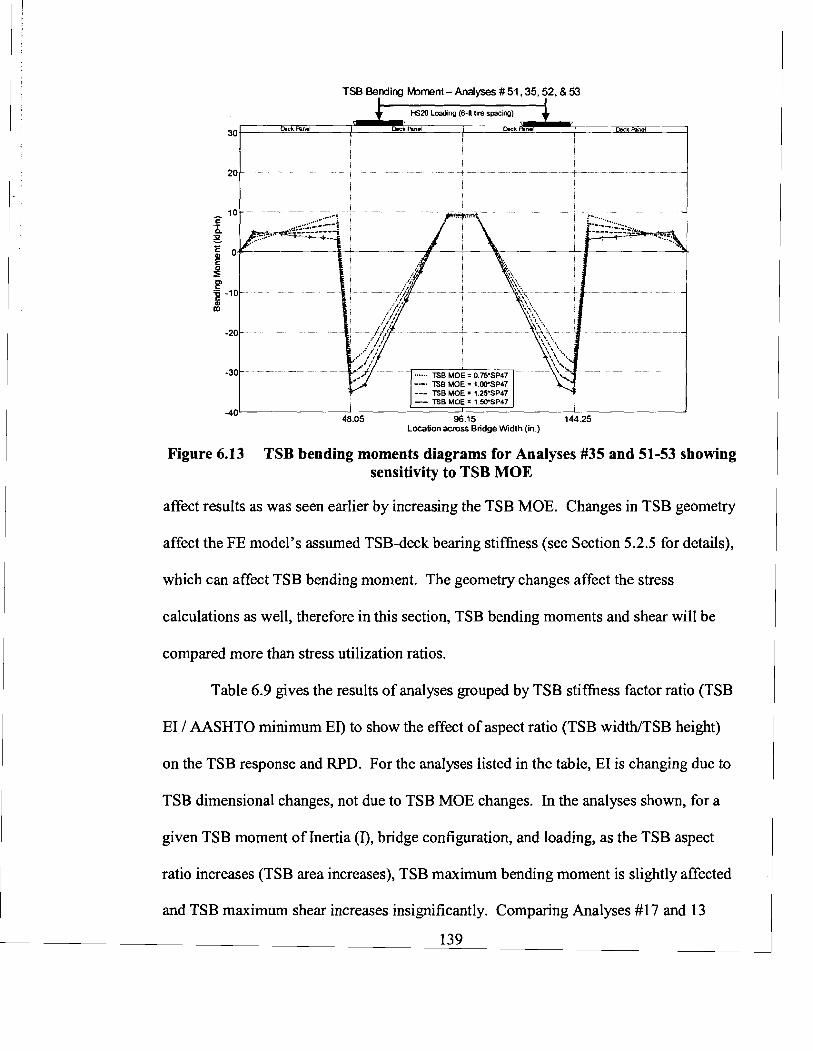
TSB Be-ding brnent - Analyses # 51.35,52. & 53
HS20 Loadng (6-1 tire spacing)
30 D ~ L mner ~ s c k A n d ~ s c k fane1
I
- TSB MOE = 1 WSP47
-40 I I I 48.05 96 15 144 25
Location across Bridge W~dth (in )
Figure 6.13 TSB bending moments diagrams for Analyses #35 and 51-53 showing sensitivity to TSB MOE
affect results as was seen earlier by increasing the TSB MOE. Changes in TSB geometry
affect the FE model's assumed TSB-deck bearing stifhess (see Section 5.2.5 for details),
which can affect TSB bending moment. The geometry changes affect the stress
calculations as well, therefore in this section, TSB bending moments and shear will be
compared more than stress utilization ratios.
Table 6.9 gives the results of analyses grouped by TSB stifhess factor ratio (TSB
EI / AASHTO minimum EI) to show the effect of aspect ratio (TSB width/TSB height)
on the TSB response and RPD. For the analyses listed in the table, EI is changing due to
TSB dimensional changes, not due to TSB MOE changes. In the analyses shown, for a
given TSB moment of Inertia (I), bridge configuration, and loading, as the TSB aspect
ratio increases (TSB area increases), TSB maximum bending moment is slightly affected
and TSB maximum shear increases insignificantly. Comparing Analyses #17 and 13
where TSB aspect ratio increases from 0.63 to 1 S O as TSB stiffness remains at 1.0 EImin
shows a 3% increase (from 3.23 kips to 3.32 kips) in shear force. Since the shear force is
relatively unchanged, the shear stress utilization ratio decreases at the rate of TSB area
increase.
TSB maximum bending moment is slightly affected by the TSB aspect ratio, but
the effect is also dependent on the TSB I. Considering Analyses #56-70 (for this bridge
configuration and loading), it can be seen that with the TSB EI/EImi, of 0.5 and 1.0 the
greater aspect ratios (shallower, wider beams) cause greater maximum TSB bending
moment, but with the TSB of EI/EI~, of 2.0 and 2.5, the smaller aspect ratios (taller,
narrower beams) cause the maximum TSB bending moments. Analysis #60 (TSB aspect
ratio of 0.67, EI/EImin of 2.5) has a maximum bending moment 9% greater than Analysis
#70 (TSB aspect ratio of 1 S O , EI/EImi, of 2.5). For the same bridge configuration (other
than TSB) and loading but with TSB EIIEImin of 1.5, the maximum TSB bending moment
is caused by the TSB with a 1.0 aspect ratio.
RPD is affected by aspect ratio and RPD utilization decreases as TSB aspect ratio
increases. For these analyses, this effect is not as great if the loading is placed further
from the TSB and is placed to maximize RPD. The RPD utilization with a TSB having a
0.67 aspect ratio was typically l7-2O% greater than the utilization ratio of TSB with a
1.50 aspect ratio when the loading was placed directly above the TSB (Analyses #56-70).
However, the utilization ratios for 0.67 aspect ratios were typically only 1-3% greater
than those for 1 S O aspect ratios when the loading was far from the TSB (Analyses # I l l -
125). Thus it appears that the TSB aspect ratio does not significantly affect RPD when
the loads are far from the TSB.
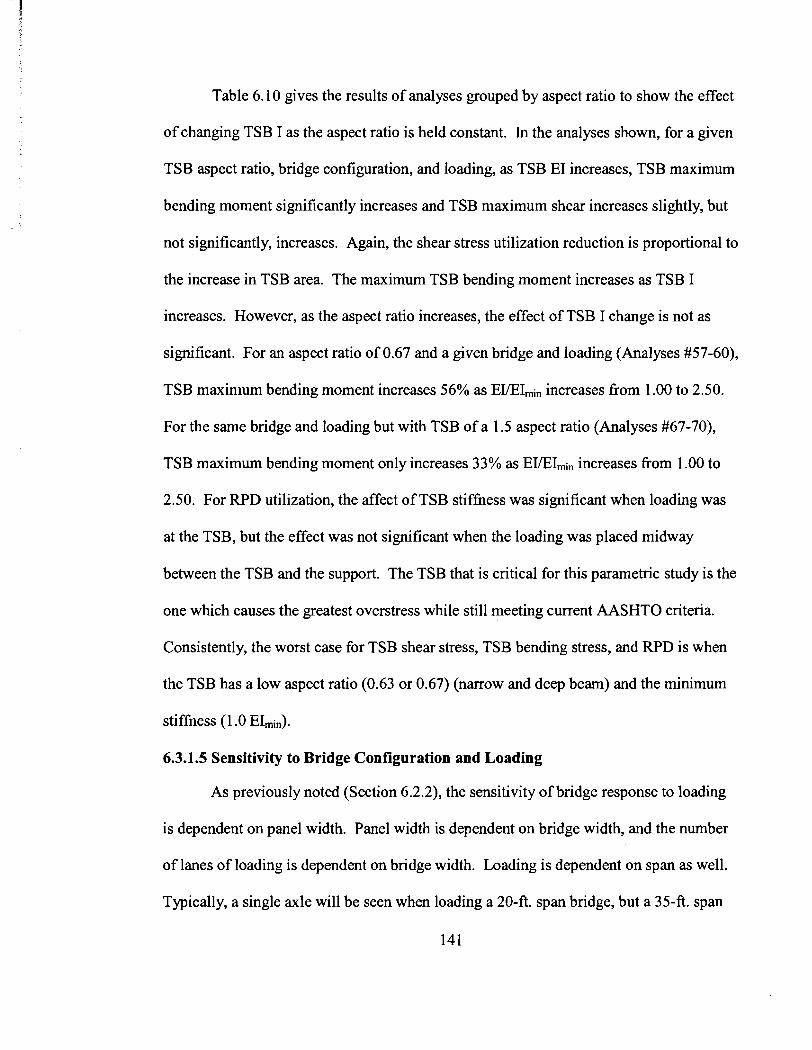
Table 6.10 gives the results of analyses grouped by aspect ratio to show the effect
of changing TSB I as the aspect ratio is held constant. In the analyses shown, for a given
TSB aspect ratio, bridge configuration, and loading, as TSB EI increases, TSB maximum
bending moment significantly increases and TSB maximum shear increases slightly, but
not significantly, increases. Again, the shear stress utilization reduction is proportional to
the increase in TSB area. The maximum TSB bending moment increases as TSB I
increases. However, as the aspect ratio increases, the effect of TSB I change is not as
significant. For an aspect ratio of 0.67 and a given bridge and loading (Analyses #57-60),
TSB maximum bending moment increases 56% as EyEImin increases from 1 .OO to 2.50.
For the same bridge and loading but with TSB of a 1.5 aspect ratio (Analyses #67-70),
TSB maximum bending moment only increases 33% as EI/EI~, increases fiom 1 .OO to
2.50. For RPD utilization, the affect of TSB stiffness was significant when loading was
at the TSB, but the effect was not significant when the loading was placed midway
between the TSB and the support. The TSB that is critical for this parametric study is the
one which causes the greatest overstress while still meeting current AASHTO criteria.
Consistently, the worst case for TSB shear stress, TSB bending stress, and RPD is when
the TSB has a low aspect ratio (0.63 or 0.67) (narrow and deep beam) and the minimum
stiffness (1.0 EImin).
6.3.1.5 Sensitivity to Bridge Configuration and Loading
As previously noted (Section 6.2.2), the sensitivity of bridge response to loading
is dependent on panel width. Panel width is dependent on bridge width, and the number
of lanes of loading is dependent on bridge width. Loading is dependent on span as well.
Typically, a single axle will be seen when loading a 20-ft. span bridge, but a 35-ft. span
141
Table 6.9 Analysis results of TSB response ant b showing sensitivity to TSB aspect ratio
FEA TSB 1 1 Panels I "A- TSB
$
1 I 1 T
m*- mdth Inl - --
14
- --
14
Bridge configuration does not meet AASHTO criteria

Table 6.10 Analysis results of TSB response and RPD showing sensitivity to TSB stiffness
Panels
-- El:
k 10.M 1 1 s
10.5 1166 w 0 Bridge configuration does not meet AASHTO criteria.
will typically have all three HS20 axles on it when loading for maximum stresses.
Because of the high level of interdependence of these parameters, this section considers
the sensitivity of TSB shear and bending stresses and FWD to panel width, bridge width,
span, and loading. The sensitivity of maximum TSB shear and bending stresses is
presented first, followed by sensitivity of maximum RPD to the parameters. Results are
grouped by panel width.
To quickly compare analyses and load cases for 42-inch wide panels, Figure 6.14
lists an analysis' results each in a separate cell. Each cell shows a sketch of the bridge
and loading locations. (All loading in this part is HS20 loading) Each cell of the figure
also contains the maximum TSB shear stress and bending stress utilization ratios. To
emphasize the configurations and loading which overstress the TSB, the utilization ratios
greater than one are in a bold font. If the utilization ratio is the maximum for the 42-inch
wide panels for the analyses considered, then the label and utilization ratio are in bold
and underlined font. The analyses are organized first by bridge span and then by analyses
number. Further details of the analyses and loading can be found in Table 6.11 and in
the load case and parametric study results sections of Appendix E. Table 6.1 1 presents
the results in a fashion similar to the previous results tables. Results for the other panel
widths are presented through similar figures and tables.
As is intuitively obvious, the TSB shear and bending stresses and FWD are
significantly affected by panel width, bridge width, and loading. Sensitivity to bridge
span is not as significant since the TSB shear and bending stresses and FWD are most
significantly affected by proximity of the load truck axle to the TSB. Therefore, aware of
these sensitivities, the study sought to determine the bridge configuration and loading that
would critically affect TSB shear and bending stresses and RPD.
For the 42-inch wide panels, maximum TSB shear stress was found when the
panels were loaded with a tire at the panel edge as in Load Case #1 (Analysis #3 in
Figure 6.14 and Table 6.1 1). Increasing the number of lanes on a bridge may not
increase the TSB stress, as can be seen by comparing the shear stress results of Analysis
#3 where the bridge has single lane of traffic for the 14-foot width to the results of
Analysis #2 1 where the bridge has two lanes of traffic on the 2 1 -foot wide superstructure.
Taking the same bridge used in Analysis #21 and reducing it to a single lane of traffic
(Analysis #22), maximized TSB bending stress utilization ratio for the 42-inch panels.
Bridges of 35-foot spans with various loading configurations did not cause greater stress
utilization ratios than the TSB maximum shear stress utilization ratio (1.46) found in
Analysis #3 and the TSB maximum bending stress utilization ratio (1.60) found in
Analysis #22. TSB maximum bending stress utilization ratio (1.59) in Analysis #32 is
equal to that for Analysis #22 for practical purposes (Figure 6.14 and Table 6.1 1).
For the 48-inch wide panels, the maximum TSB shear stress utilization (1.64) and
bending stress utilization (1.36) occurred in Analysis #35 (Figure 6.15 and Table 6.12).
Again the greater TSB spacing of the 20-foot span bridge, maximized TSB shear and
bending stresses.
For the 54-inch wide panels, it was determined with just a few loading and bridge
configurations that the wider panels transferred less load to the TSB, and thus would not
control the TSB shear and bending stress utilization. Analysis #41 had the maximum
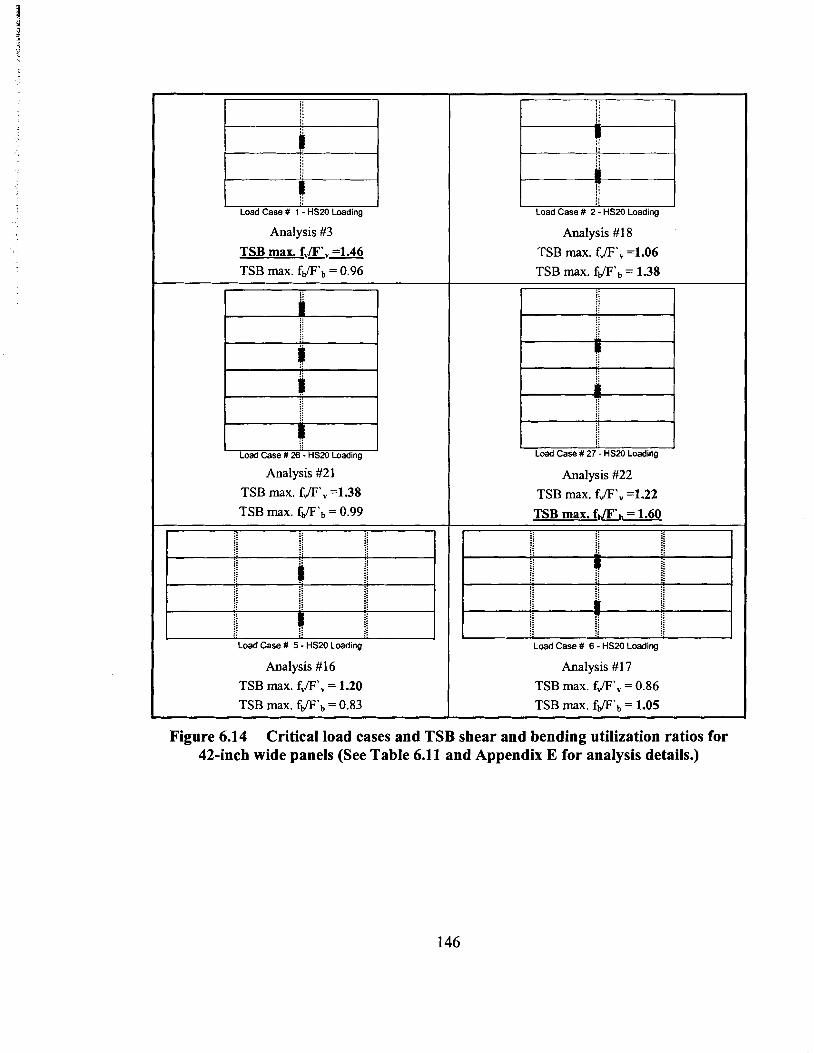
Analysis #3
TSB max. f v F v =1.46 TSB max. ffl'b = 0.96
i i
i:
'i
Load Case # 1': HS20 Loading
L I Load Case # 26 - HS20 Loading
ri j i
i i
ii
Load Case # 2 - HS20 Loading
Analysis #18
TSB max. f&', =1.06 TSB max. ffl'b = 1.38
Li
q
P
Load Case # 27 - HSM Loading
Load Case # 5 - HS20 Loading
Analysis # 16
TSB max. f&', = 1.20 TSB max. ffl'b = 0.83
Analysis #2 1 TSB max. f&'. =1.38
Load Case # 6 - HS20 Loading
Analysis #17
TSB max. f&', = 0.86
TSB max. ffi'b = 1.05
Analysis #22
TSB max. f&', =1.22
Figure 6.14 Critical load cases and TSB shear and bending utilization ratios for 42-inch wide panels (See Table 6.1 1 and Appendix E for analysis details.)

I Analysis #25 I I TSB max. fJF', = 0.91 I
Analysis #28 TSB max. fJF', = 0.91 TSB max. ffl'b = 1.22
Load Case # 13 - HS20 Loading
Analysis #29 TSB max. fJF', = 1.21 TSB max. ffl'b = 0.85
Load Case # 8 - HS20 Loading
Analysis #24 TSB max. fJF', = 0.87 TSB max. ffl'b = 0.93
Load Case # 10 - HS20 Loading
Analysis #26 TSB max. fJF', = 1.23 TSB max. ffl'b = 0.91
Analysis #27 TSB max. fJF', = 1.27 TSB max. ffl'b = 0.93
Analysis #32 TSB max. fJF', = 1.18 TSB max. fJF'b = 1.59
Figure 6.14 (Continued) Critical load cases and TSB shear and bending utilization ratios for 42-inch wide panels

Table 6.11 TSB stresses and RPD for TSB-critical42-inch-wide panel bridges
TSB Panels
-~
I d Lanes -
1
- -- 2 -
1 - -
1
- --
I
wed Ratio - -
0.83
F
0.83
-
0.83
083
Table 6.12 TSB stresses and RPD for TSB-critical48-inch-wide panel bridges
TSB Panels
-F &no EM-
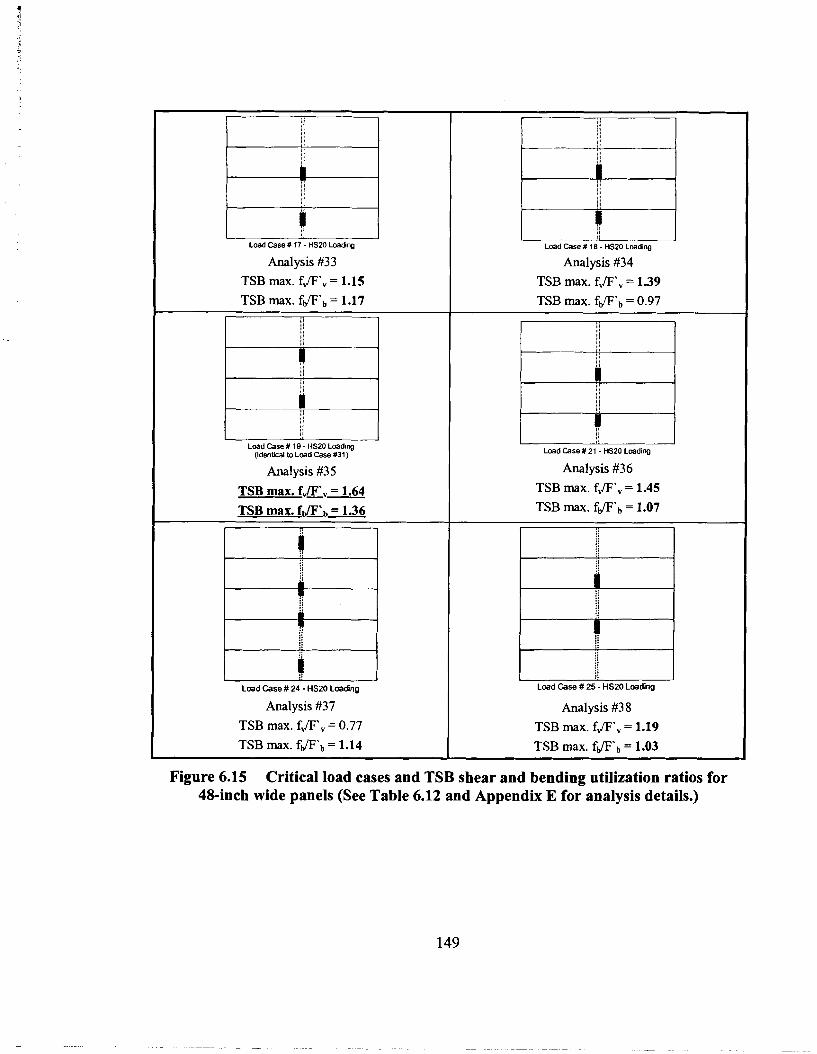
I I Load Case # 17 - HSX) Loading
Analysis #33 TSB max. f p ' , = 1.15
TSB max. f f l ' b = 1.17
I
Load Case # 19 - HS20 Loading (Identical to Lmd Case #31)
Analysis #3 5
TSB max. fvWv = 1.64
TSB max. fa/& = 1.36 -
ri
L
i i i
Load Case # 24 - HS20 Loading
Analysis #37
TSB max. fJF', = 0.77 TSB max. ffl'b = 1.14
Load Case # 18 - HS20 Loading
Analysis #34 TSB max. f p ' , = 1.39
TSB max. f f l ' b = 0.97
ii
q
I Ij
Load Case # 21 - HS20 Lmding
Analysis #36 TSB max. f p ' , = 1.45
TSB max. f f l ' b = 1.07 -
8 ;i
Load Case # 25 - HS20 Loading
Analysis #3 8
TSB max. f p ' , = 1.19
TSB max. f f lTb = 1.03
Figure 6.15 Critical load cases and TSB shear and bending utilization ratios for 48-inch wide panels (See Table 6.12 and Appendix E for analysis details.)

1 Load Case # 28 - HS20 Loading
Analysis #39
T S B max. fJF', = 1.35
TSB max. f@'b = 0.90
Lmd Case # 30 - HS20 Lmding
Analysis #40
T S B max. fJF', = 1.41
T S B max. f@'b = 1.22
t r
i Z
Load Case # 34 - HS20 Loading
Analysis #8 1
TSB max. fJF', = 1.32
TSB max. = 1.12
Analysis #82
TSB max. fJF', = 1.32
TSB max. f a ' b = 1.08
Analysis #80
T S B max. fJ', = 1.38
TSB max. f a ' b = 1.20
Figure 6.15 (Continued) Critical load cases and TSB shear and bending utilization ratios for 48-inch wide panels
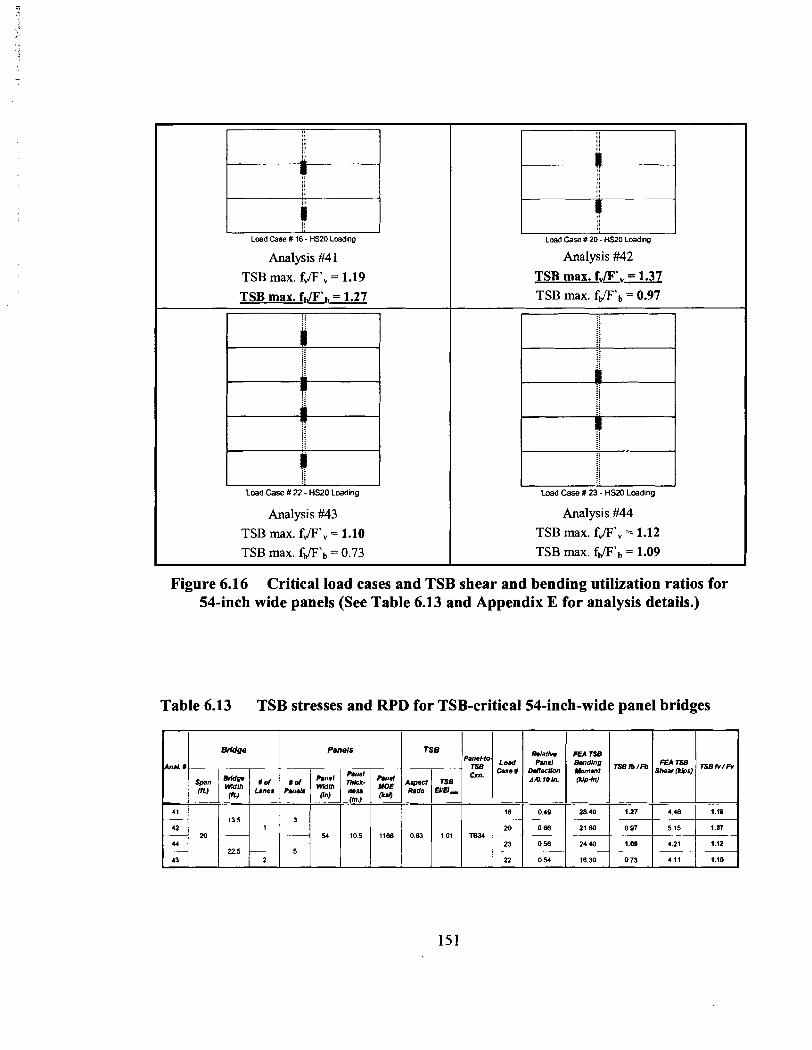
i i
C ! j
Load Case 1 16 - HS20 Loading
Analysis #4 1
TSB max. fJF', = 1.19 TSB max. fflh = 1.27
I :;
] I
ji I t $
r: Load Case # 22 - HS20 Loading
Analysis #43
TSB max. fJF', = 1.10 TSB max. fJF'b = 0.73
I Load Case X 20 - HS20 Loading
Analysis #42
TSB max. f v S V = 1.37 TSB max. fJF'b = 0.97
Analysis #44
TSB max. fJF', = 1.12 TSB max. fJF'b = 1.09
Figure 6.16 Critical load cases and TSB shear and bending utilization ratios for 54-inch wide panels (See Table 6.13 and Appendix E for analysis details.)
Table 6.13 TSB stresses and RPD for TSB-critical54-inch-wide panel bridges
Anal.:.
TSB & l a b F U T S B
?:- mu0 Ern*
TSB shear stress utilization (1.27), and Analysis #42 had the maximum bending stress
utilization (1.37) (Figure 6.16 and Table 6.13).
Analyses showed (Appendix E) that there is only one axle location for each
bridge that will maximize RPD, midway between TSB or midway between a TSB and the
support. Several load cases on the 35-ft. span bridges were checked to verify that the 20-
ft. span controlled RPD due to the greater TSB spacing. Both the 42-in. wide and 48-in.
wide panels were checked and the maximum RPD values were essentially equivalent
(1.62 RPD utilization ratio for the 42-in. and 1.64 utilization ratio for the 48-in. panels).
The load cases and analysis results are given in Figure 6.17 and Table 6.14.
6.3.2 Critical TSB Shear and Bending Stresses and RPD
Once the sensitivity of TSB shear and bending stresses and RPD to the parameters
was known, the critical, HS20-loaded bridge was analyzed. Panel MOE and TSB MOE,
although found to have an effect on the results being considered, were not changed from
their published values.
6.3.2.1 MaximumTSB Shear Stress
For TSB shear stress, the critical bridge was analyzed in Analysis #7 1. The
critical bridge configuration is a 20-ft. span, 16-ft. wide bridge consisting of four 48-in.
wide, 10.5-in. thick panels. The TSB has an aspect ratio of 0.67 and the minimum
required AASHTO EI. The TSB is connected to the panels with the stiffest connection
system, the seated-beam. HS20 loading to maximize utilization was Load Case #19.
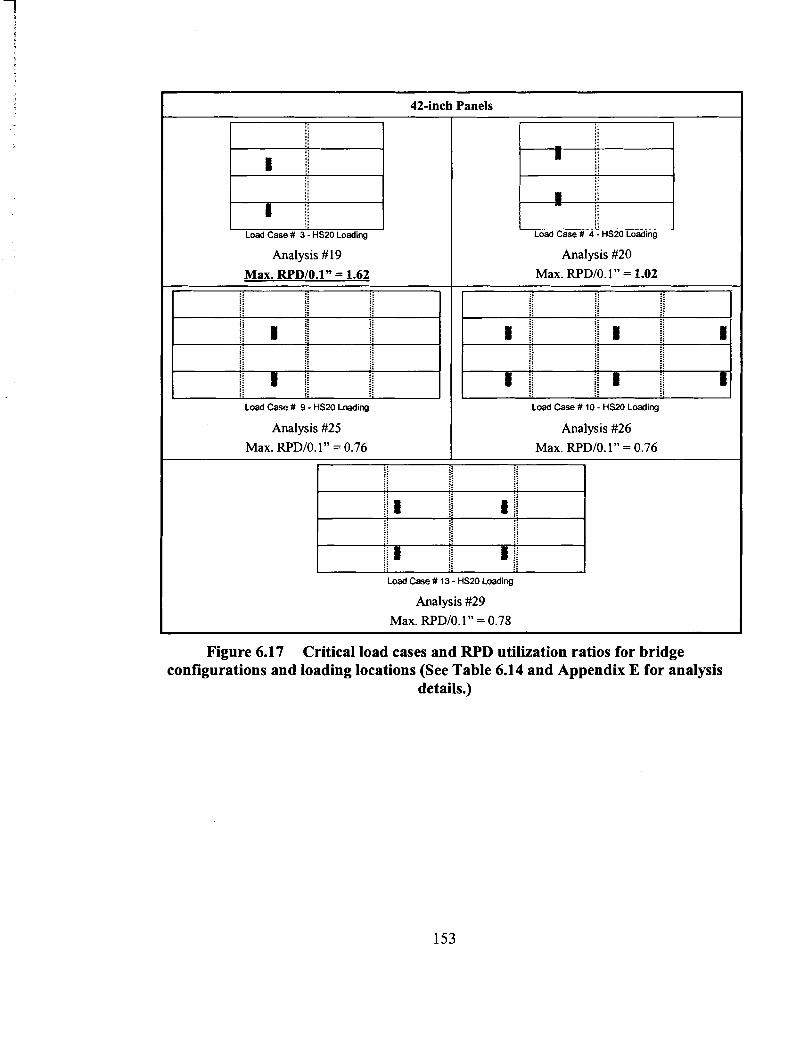
42-inch Panels
/I t.---_ Load Case # 3 - HS20 Loading
Analysis #19
Max. RPDlO.1" = 1.62
Load Case # 9 - HS20 Lading
Analysis #25 Max. RPDIO. 1" = 0.76
I
i
Load Case # 4 - HS20 Loading
Analysis #20
Max. RPDIO. 1 " = 1.02
Load Case # 10 - HS20 Loading
Analysis #26 Max. RPDlO.1" = 0.76
Load Case # 13 - HS20 Loading
Analysis #29 Max. RPDlO.1" = 0.78
Figure 6.17 Critical load cases and RPD utilization ratios for bridge configu~ations and loading locations (See Table 6.14 and Appendix E for &alysis
details.)

48-inch Panels
/ (
I j /
fl i j
Load Case # 19 - HS20 Loadinn I
Load Case 1 49 - HS20 Loading
Analysis # 145
Max. RPDIO.l" = 1.64
(Idenhl to Load Case 131) - Analysis #35
Max. FWDIO. 1" = 0.93
Load Case # 33 - HS20 Loading I Load Case # 34 - HS20 Loading
Analysis #8 1 Max. FWDIO. 1" = 0.81
Analysis #80
Max. FWDIO. 1" = 0.83
Figure 6.17 (Continued) Critical load cases and RPD utilization ratios for bridge configurations and loading locations
Table 6.14 RPD and TSB stresses for RPD-critical bridges
Panels
Maximum TSB shear stress utilization ratio for HS20 was 1.68. This high utilization
ratio shows the need for a improved design methodology for TSB shear.
6.3.2.2 Maximum TSB Bending Stress
For TSB bending stress, the critical bridge was analyzed in Analysis #90. The
critical bridge configuration is a 20-ft. span, 21-ft. wide bridge consisting of six 42411.
wide, 10.5-in. thick panels. The TSB has an aspect ratio of 0.67 and the minimum
AASHTO EI required. The TSB is connected to the panels with the least stiff connection
system, the aluminum bracket. HS20 loading used to maximize utilization was Load
Case #45. Maximum TSB bending stress utilization ratio for HS20 was 1.61. This high
utilization ratio shows the need for a improved design methodology for TSB bending.
6.3.2.3 Maximum Relative Panel Movement
For RPD, the critical bridge was analyzed in Analysis #127. The critical bridge
configuration is a 20-ft. span, 16-ft. wide bridge consisting of four 48-in. wide, 10.5-in.
thick panels. The TSB has an aspect ratio of 0.67 and the minimum AASHTO EI
required. The TSB is connected to the panels with the least stiff connection system, the
aluminum bracket. HS20 loading to maximize utilization was Load Case #49.
Maximum RPD utilization ratio for HS20 loading was 1.79. This analysis shows the
potential inadequacy of the current AASHTO TSB spacing to meet the 0.1-in. asphalt
serviceability criteria.
6.4 TSB Design
Before making recommendations for changes to the current AASHTO TSB
design criteria, other live load trucks were considered for analysis. The HS25 truck,
which has wheel loads 25% greater than the HS20 truck, was used, as was the alternate
military loading of two 24-kip axles spaced four feet apart. The alternate military loading
is designated ML24 in this thesis. The standard ML24 loading was also increased 25% in
a manner similar to the HS25 truck, and this has been designated as ML30. When the
ML24 truck is considered, the TSB shear stress utilization ratio can be 1.8 1 (Table 6.15),
the TSB bending stress utilization ratio can be 2.29 (Table 6.16), and the RPD utilization
ratio can be 2.39 (Table 6.17).
In recommending TSB design criteria, simplicity was desired. In considering
TSB design shear, the maximum shear forces obtained from analyses were divided by the
load truck wheel load (Appendix E). For the ML24 truck where the axles are only four
feet apart, a factor of 1.75 was applied to obtain an effective wheel load. The maximum
ratio of wheel load recommended for TSB shear design was 0.45.
For TSB design bending moment, the maximum bending moments obtained from
analyses were divided by the load truck wheel load (Appendix E) to give a moment arm.
The ML24 wheel loads were in the same manner as they had been for TSB design shear.
The maximum wheel load moment arm recommended for TSB bending moment design
was 3.5 inches.
6.5 Conclusions and Recommendations
The parametric study has shown that the current AASHTO design criteria for the
TSB of longitudinal glulam deck bridges can be inadequate. HS20 loading can cause the
TSB to be overstressed in shear by 68% and in bending by 6 1%. With HS20 loading the
RPD may be 79% greater than the limit set by the serviceability criteria for asphalt
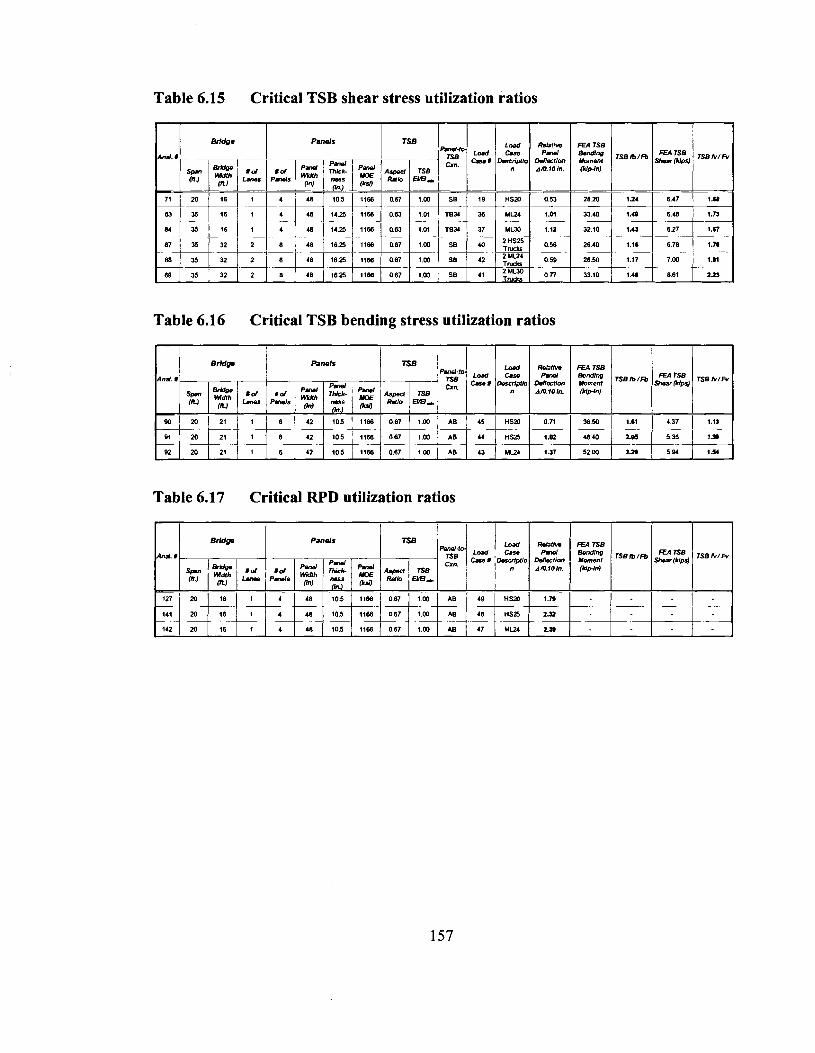
Table 6.15 Critical TSB shear stress utilization ratios
Table 6.16 Critical TSB bending stress utilization ratios - -
B r W p Panels Lomi R0bth-a FEATSB
And. # Lomi Cmse P m d Bsndlng cases ~ a c n p t m ~ ~ t l r n mrnent
TSBB/m
n ~ m i o r n . (kfprn)
91 M 21
Table 6.17 Critical RPD utilization ratios

(Ritter 1990). Other AASHTO live load trucks cause even greater overstress and FWD.
Clearly, the current AASHTO design criteria for the TSB are not adequate.
Based on the parametric study performed, the following design criteria are
recommended to replace the current AASHTO TSB design criteria.
In lieu of a more accurate analysis, the transverse stiffener beam
shall be designed for the following bending moment and shear.
1. Shear = 0.45*wheel load
2. Bending Moment = 3.5 arm*wheel load
Where wheel load is the maximum wheel load for HS & H
vehicles and 1.75*maximum wheel load for alternate military
loading
To give an example of the potential effect these recommendations would have, a
design example is included. For a 20-ft. span, 16-ft. wide bridge designed for a single,
HS20-rated lane and built using %-in. through bolts for panel-to-TSB connections, the
current AASHTO design criteria (AASHTO 1996) are used. The 48-in. wide, SP47
glulam panels would be 10.5 inches thick. A SP47 TSB at midspan and with a height of
6.75 in. and a width of 4.5 in. would easily meet the ASSHTO TSB spacing and
minimum EI criteria, but, as the analyses in this chapter has shown, the TSB may be
critically overstressed. With the recommended 0.45 wheel load shear design fraction and
the recommended 3.5 in. wheel load moment arm, the TSB would have to meet the
current AASHTO 80,000 kip-in2 minimum stiffness factor and now be designed for a
shear of 7.2 kips and a bending moment of 56 in-kips. A SP47 TSB placed at midspan
and with a height of 6 in. and a width of 6.67 in. meets current and recommended
158

AASHTO TSB design criteria. Thus, the recommended changes should not significantly
affect the cost of longitudinal glularn bridges whle providing adequate safety.

Chapter 7
CONCLUSIONS AND RECOMMENDATIONS
7.1 Conclusions
The conclusions f?om this study are divided into three areas: the longitudinal
FRP-reinforced glulam deck panels, the finite element model for longitudinal glulam
deck bridges, and the parametric study of the Transverse Stiffener Beam (TSB) in
longitudinal glulam deck bridges.
7.1.1 Longitudinal FRP-Reinforced Glulam Deck Panels
Specific conclusions with regard to longitudinal FRP-reinforced glulam deck
bridges are restricted to the particular design details, materials, and field conditions this
project.
1. FRP-glulam panels can be handled, on the construction site, in a manner
and with equipment similar to that used for conventional glulam panels
and prestressed concrete planks.
2. The weight of the FRP-glulam panels used in this project was only one
third the weight of equivalent prestressed concrete planks. This weight
reduction allows for cost savings in construction.
3. One percent (by area) FRP tension reinforcing of glulam panels with wet-
layup E-glasslphenol resorcinol formaldehyde composite in the middle
two-thirds of the span increased bending stiffness by an average of six
percent.
160

4. The durability of the FRP is crucial for proper performance of the FRP-
glulam deck panels. Although laboratory testing indicates durability
concerns with a PRF matrix (Battles 2000), the FRP used on the Milbridge
Pier has so far performed well in the marine environment. Visual
inspection has shown no apparent degradation after the first year of
service.
5. At an FOB cost of $36.37/ft2, the FRP-glulam deck used on the Milbridge
Pier was cost competitive with the prestressed concrete deck.
6. The wearing surface criteria for the Milbridge pier required resistance to
gasoline and oil spills, which pre-empted the use of an economically
competitive asphalt surface with an underlying waterproof membrane. A
more expensive oil-spill resistant wearing surface, consisting of two
different products (CIM1000 and Transpo T45) was developed and used.
This increased the square foot cost, so that the cost of the structure with
the special wearing surface on the FRP-glulam was no longer competitive
with prestressed concrete on a first-cost basis.
7.1.2 Finite Element Model for Longitudinal Glulam Deck Bridges
1. The finite element model of longitudinal deck bridges developed in this
study was compared with full-scale laboratory test data of longitudinal
deck bridges conducted as part of this study at The University of Maine as
well as test data published by Iowa State University. The UMaine test
data included panel deflections and strain in the seated-beam connection.
161

Iowa State University's test data included midspan panel deflections,
midspan panel bending strain, and TSB bending strain. This showed that
the FEA model developed in this study accurately analyses longitudinal
glulam deck bridges.
2. The nonlinear tension connection model used in this study more closely
represents the actual connection behavior than the linear models in the
published literature. However, the connection nonlinearity only slightly
influences the longitudinal glulam deck bridge's response.
3. The addition of connection elements that can be pretensioned allows
incorporation of the effect of initial tightening of the connections. The
element may also allow modeling of loose connections.
4. TSB-deck bearing elements should be included in a finite element model,
since the TSB bending moment is sensitive to the stiffness of the bearing
elements (see Section 5.2.5)
7.1.3 Parametric Study of Longitudinal Glulam Deck Bridges
1 . The finite element model developed as part of this study and described-in
this thesis was used to perform a parametric study of longitudinal glulam
deck bridges. Forty-three bridges were designed according to AASHTO
and were then analyzed under 50 loading conditions. Parameters varied
included two spans (20 ft. and 35 ft.), three AASHTO live loadings
(HS20, HS25, and alternate military loading), three panel widths (42 in.,
48 in., and 54 in.), eight bridge widths (13.5 ft., 14 ft., 16 ft., 20 ft., 2 1 ft.,
22.5 A., 24 A., and 32 A.), five panel thickness (8.5 in., 10.5 in., 12.25 in.,
14.25 in., and 16.25 in.), 23 TSB sizes (fiom 4.75 in. by 3.19 in. to 8.00 in.
by 5.35 in.), four connection systems (aluminum brackets, 518-in. through
bolts, %-in. through bolts, and seated beam), and four panel and TSB
MOE (75%, loo%, 125%, and 150% of published MOE (AFPA, AWC
1997)). Response values examined included maximum bending and shears
stresses in the TSB as well as differential deflection between adjacent
panels.
2. The current AASHTO design criteria for TSB (AASHTO 1996, Section
3.25.3.4) may result in overstressing the TSB under AASHTO HS20
loading as follows:
a. The TSB may be 68% overstressed in shear. The critical bridge
configuration that causes this condition is a 16-A. wide, 20-A. span
bridge constructed of four 48411. wide, 10.5-in. thick, southern pine
glulam axial combination #47 (SP47) panels joined through seated-
beam connections to a 5.66-in. high, 3.79-in. wide, SP47 TSB (EI
equals 80,000 ksi, the AASHTO minimum) placed at midspan. The
critical AASHTO HS20 loading that causes this condition is a 32-kip
axle placed symmetrically on the bridge at midspan.
b. The TSB may be 61% overstressed in bending. The critical bridge
configuration that causes this condition is a 21-A. wide, 20-A. span
bridge constructed of six 42-in. wide, 10.5-in. thick, SP47 panels
joined through aluminum-bracket connections to a 5.66-in. high, 3.79-
163
in. wide, SP47 TSB (EI equals 80,000 ksi, the AASHTO minimum)
placed at midspan. The critical AASHTO HS20 loading that causes
this condition is a 32-kip axle placed symmetrically on the bridge at
midspan.
c. The bridge may experience relative deflection between adjacent panels
79% greater than the often-cited 0. l-inch serviceability criteria for
asphalt (Ritter 1990). The critical bridge configuration that causes this
condition is a 16-ft. wide, 20-ft. span bridge constructed of four 48411.
wide, 10.5-in. thick, SP47 panels joined through aluminum-bracket
connections to a 5.66411. high, 3.79411. wide, SP47 TSB (EI equals
80,000 ksi, the AASHTO minimum) placed at midspan. The critical
AASHTO HS20 loading that causes this condition is a 32-kip axle
placed at quarter span and such that one tire is placed at the inside
edge of an outer bridge panel.
3. Other bridge configurations designed under the current AASHTO design
criteria can also result in overstressing of the TSB under AASHTO HS20
loading (see Chapter 6).
4. Under AASHTO HS25 or alternate military loading, the maximum TSB
overstress and relative panel deflection are greater than the values
described in (2) above.
5. Using the results of the parametric study, the following TSB design
criteria are proposed, in addition to the current AASHTO requirements
(AASHTO 1996, Section 3.25.3.4)
164

In lieu of a more accurate analysis, the transverse stiffener
beam shall be designed for the following bending moment
and shear, in addition to maintaining EI> 80,000 ksi:
Shear = 0.45*wheel load
Bending Moment = (3.6 inches) * wheel load
In which the wheel load is the maximum wheel load
for HS & H vehicles and 1.75*maximum wheel
load for alternate military loading
7.2 Recommendations for Future Work
Recommendations listed here for future work would broaden the research scope
and would increase the utilization of the work reported in this thesis.
1. An alternative, more durable FRP should be investigated for reinforcing
glulam panels. Options that may be researched include the E-glasslvinyl
ester composite researched by Xu (2001) and preconsolidated E-glass
conlposite.
2. An alternative membranelwearing surface system should be researched
that meets the flexibility, water-inlpermeability, impact resistance,
petroleum-product spill durability, and adhesion criteria for marine piers.
3. Kurain has shown that the curbs' effect on TSB bending stress can be
significant (Kurain 2001). The bridge configurations and loading that
produce maximum TSB moments, TSB shears, and relative panel
deflections should be analyzed with "typical" glulam curbs. Analyses of
two models, one with non-composite curbs and one with composite curbs,
would provide bounds for the curbs' effect on the TSB-stress critical
bridge configurations and loadings. Upon analysis, the changes
recommended in this thesis to AASHTO design criteria should be
evaluated and adjusted as necessary.
4. Although major changes are not expected from analyses with other wood
species, it is recommended that other wood species/glulam layups
commonly used for longitudinal glulam deck bridges be analyzed. The
change in panel MOE and shear n~odulus may change the system's
behavior and thus may warrant a slight change in the recommended shear
wheel load fraction or the bending moment wheel load a m . One
recommended layup would be the commonly used douglas fir axial
combination #2 glulam layup. Upon analysis, the recommended changes
to AASHTO design criteria should be evaluated and adjusted as necessary.
REFERENCES
AASHTO. (1 996). Standard Speczjcations for Highway Bridges. Washington, DC: American Association of State Highway and Transportation Officials.
AFPA, AWC. (1 997). Design Values for Wood Construction. A Supplement to the National Design Specification for Wood Construction. Washington, DC: American Wood Council - American Forest and Paper Association.
Agarwal, B.D., Broutman, L. J. (1990). Analysis and Performance of Fiber Composites. New York: John Wiley and Sons, Inc.
AITC. (1994). Timber Construction Manual. 4th ed. New York: John Wiley and Sons, Inc.
AITC. (2001). Design Standard Specification For Structural Glued Laminated Timber Of Softwood Species. AITC 11 7-2001-Design. Englewood, CO: American Institute Of Timber Construction.
ANSYS. (2000a). ANSYS 5.7 University High Option. [CD-ROM] Canonsburg, PA: SAS IP, Inc. Available: SAS IP, Inc.
ANSYS. (2000b). ANSYS Online Help. [Online] Canonsburg, PA: SAS IP, Inc. Available: http:l/wwwl .ansys.com/customerlcontent/documentationl 5 7lansystoc.html.
APA. (2001). "Engineering Bulletin Number 98-3: Allowable Horizontal Shear Stresses for Glulam." Tacoma, WA: APA - the Engineered Wood Association Headquarters.
ASTM. (2000a). ASTM A153/A153M-Ola Standard Specification for Zinc Coating (Hot- Dip) on Iron and Steel Hardware. West Conshohocken, PA: American Society for Testing and Materials.
ASTM. (2000b). ASTM Dl 98-99 Standard Test Methods of Static Tests of Lumber in Structural Sizes. West Conshohocken, PA: American Society for Testing and Materials.
Battles, E.P. (2000). "Environmental Durability of FRP Reinforcement for Timber Bridges." Summary Report. Orono, ME: Advanced Engineered Wood Composites Center, University of Maine.
Bhide, S. (2001). Material Usage on Condition of Existing Bridges in the US. Skokie, IL: Portland Cement Association.
Busel, J. (2000). "Environmental Durability of Composites." FRP Composite Products for Bridge Applications - Product Selection Guide. Harrison, NY: Market Development Alliance.
CERF. (200 1). Gap Analysis for Durability of Fiber Reinforced Polymer Composites in Civil Infrastructure. Reston, VA: American Society of Civil Engineers.
Dagher, H.J., Kimball, T., Abdel-Magid B., and Shaler, S.M. (1996). "Effect of FRP Reinforcement on Low-Grade Eastern Hemlock Glulams." National Conference on Wood Transportation Structures, Madison, WI.
Dagher, H.J., Poulin, J., Abdel-Magid, B., Shaler, S.M., Tjoelker, W., and Yeh, B. (1 998a). "FRP Reinforcement of Douglas Fir and Western Hemlock Glulam Beams." International Composites Expo '98, Nashville, TN.
Dagher, H.J., Bragdon, M.M. (2001). "Advanced FRP-Wood Composites in Bridge Applications" Structural Engineering Institute 2001 Structures Congress, Washington, DC.
Dagher, H.J., Abdel-Magid, B., Lindyberg, R.F., Poulin, J., Shaler, S.M. (1998b). Static Bending Test Results of Douglas Fir and Western Hemlock FRP-Reinforced Glulam Beams: 21 foot Span Series. AEWC Report 98-4. Orono, ME: Advanced Engineered Wood Composites Center, University of Maine.
Foster, B.W. (1998). Flexural repair and strengthening of timer beams usingjiber reinforcedpolymers. MS Thesis. Orono, ME: University of Maine.
FPL. (1974). Wood Handbook - Wood as an Engineering Material. Agriculture Handbook No. 72 Washington, DC: U.S. Department of Agriculture, Forest Service, Forest Products Laboratory.
FPL. (1 999). Wood Handbook - Wood as an Engineering Material. Gen. Tech. Rep. FPL-GTR-113. Madison, WI: U.S. Department of Agriculture, Forest Service, Forest Products Laboratory.
Funke, R.W. (1986). Behavior of Longitudinal Glued Laminated Timber Deck Bridges. MS Thesis. Ames, IA: Iowa State University.
Gilham, P. (2002) Personal Phone Conversation on September 10.
Hajdu, T. (1994). Dynamic Behavior of Longitudinal Glued Laminated Timber Bridges. MS Thesis. Arnes, IA: Iowa State University.
Hale, C.Y. (1 978). "Stiffened Longitudinal Decked Bridge - Evaluation of Stiffener Hardware." [Unpublished Report] Report No. 045- 1609-3. Tacoma, WA: Weyerhaeuser Company.
Iqbal, M.A. (2000). Fatigue Life of Pultruded and Hand Lay-Up GFRP Exposed to DzHerent Environmental Conditions. MS Thesis. Orono, ME: University of Maine.
Kurain, A.V. (2001). Finite Element Analysis of Longitudinal GIulam Timber Deck and Glulam Timber Girder Bridges. MS Thesis. Ames, IA: Iowa State University.
Lacross, V.D. (1 997). Fatigue of Interconnected Deck Connections in Hardwood Glued- Laminated Bridge Decks. MS Thesis. University Park, PA: Penn State.
Mathcad. (2000). Mathcad 2000 Professional. [CD-ROM]. Eden Prairie, MN: Mathsofi Engineering & Education, Inc. Available: Mathsofi Engineering & Education, Inc.
Matlab. (2000). Matlab 6.0.0.42~ Release 12 Student Version. [CD-ROM]. Natick, MA: The Mathworks, Inc. Available: The Mathworks, Inc.
Novotoney, M.E. (2001). "Wearing Surfaces for FRP-Glularn Composite Ocean Pier Decks." [Unpublished Report]. Orono, ME: Advanced Engineered Wood Composites Center, University of Maine.
Pottle, P., Dagher, H.J. (2000). Phone Conversation.
Ritter, M.A. (1 990). Timber Bridges: Design, Construction, Inspection, and Maintenance. Washington, DC: U.S. Department of Agriculture, Forest Service, Forest Products Laboratory.
Sanders, W.W., Jr., Klaiber, F.W., Wipf, T.J. (1985). "Load Distribution in Glued Laminated Longitudinal Timber Deck Highway Bridges." Report No. ERI-85441. Ames, L4: Iowa State University - Engineering Research Institute.
Tomforde, D.G. (1 996). Lag Screw and Deck Clip Performance Evaluation in Hardwood GIuIam Timber Bridge Decking Connections. MS Thesis. University Park, PA: Penn State.
Waldron, P., Byars, E.A., Dejke, V. (2001). "Durability of FRP in Concrete - A State of the Art." In Proceedings of The International Workshop of Composites in Construction: A Reality, July 20-2 1,200 1, Capri, Italy.
Witmer, R.W. (1 996). Load Distribution Characteristics of Hardwood Glued-Laminated Timber Bridges and Bridge Components. MS Thesis. University Park, PA: Penn State.

Wood, K.S. (2000). Environmental exposure characterization offiber reinforcedpolymer materials used in bridge deck systems. MS Thesis. Orono, ME: University of Maine.
Xu, H. (2001). Development of FRP-Glulam Panel for Bridge Deck Replacement. MS Thesis. Orono, ME: University of Maine.

APPENDICES

Appendix A
LONGITUDINAL GLULAM DECK BRIDGE DESIGN METHODOLOGY
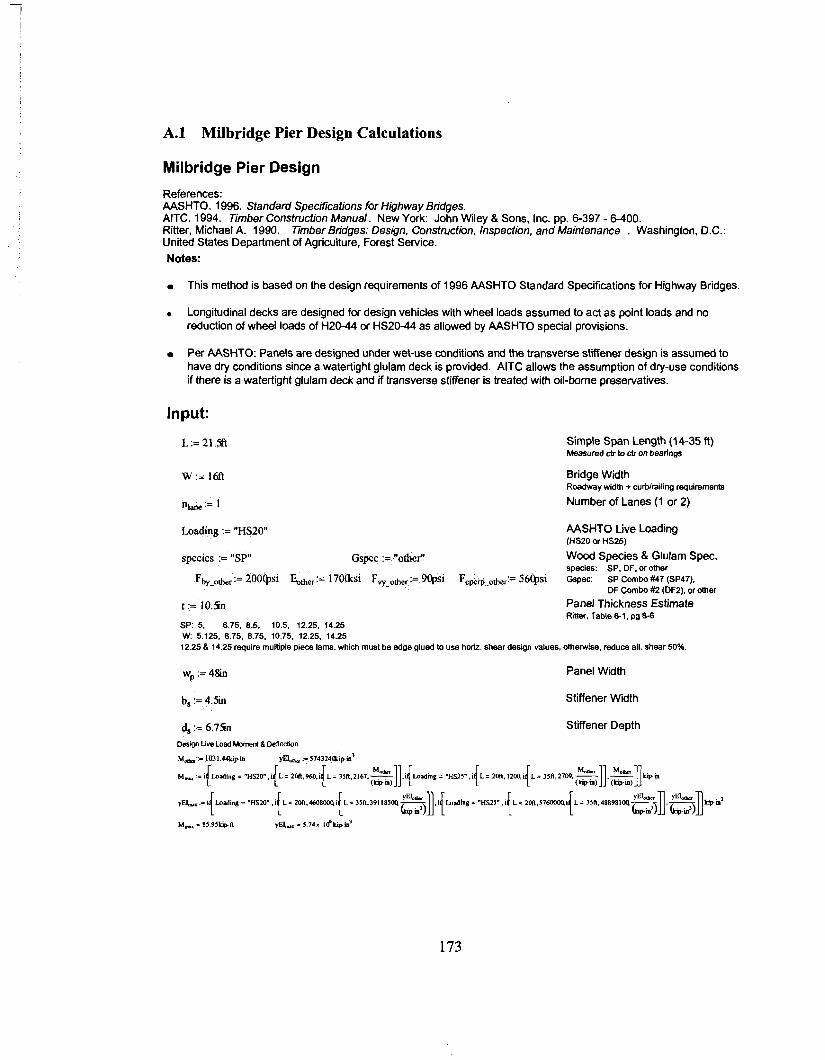
A.l Milbridge Pier Design Calculations
Milbridge Pier Design
References: AASHTO. 1996. Standard Specifications for Highway Bridges. AITC. 1994. Timber Construction Manual. New York: John Wiley 8 Sons, Inc. pp. 6-397 - 6-400. Ritter, Michael A. 1990. Timber Bridges: Design, Construction, Inspection, and Maintenance . Washington, D.C.: United States Department of Agriculture, Forest Service. Notes:
r This method is based on the design requirements of 1996 AASHTO Standard Specifications for Highway Bridges.
. Longitudinal decks are designed for design vehicles with wheel loads assumed to act as point loads and no reduction of wheel loads of H20-44 or HS20-44 as allowed by AASHTO special provisions.
Per AASHTO: Panels are designed under wet-use conditions and the transverse stiffener design is assumed to have dry conditions since a watertight glulam deck is provided. AITC allows the assumption of dry-use conditions if there is a watertight glulam deck and if transverse stiffener is treated with oil-borne preservatives.
Input:
Loading := "HS20"
Simple Span Length (1 4-35 ft) Measured CIJ to CIJ on bearings
Bridge Width Roadway width + curblrailing requirements
Number of Lanes (1 or 2)
AASHTO Live Loading (HS20 or HS25)
species := "SP" Gspec := "other" Wood Species 8 Glulam Spec. species. SP, DF. or other
Fbybyoth,, := 200Qsi %the, := 170asi Fv-oh, := 9@si Fcperp-other:= 56Qsi Gspec: SP Combo #47 (SP47). DF Combo #2 (DFZ), or other
t := 10.5h Panel Thickness Estimate Ritter. Table 8-1. pg 8-6
SP: 5. 6.75. 8.5, 10 5. 12 25. 14.25 W 5 125. 6.75. 8.75. 1075. 12.25. 14.25 12 25 8 14 25 require multiple Piece lam?.. which must be edge glued to use horiz. shear design values. otherwise. reduce all shear 50%
w, := 48in Panel W i t h
b, := 4.5in Stiffener Width
4 := 6.7% Design Lve Load Moment EL Deflection
Stiffener Depth
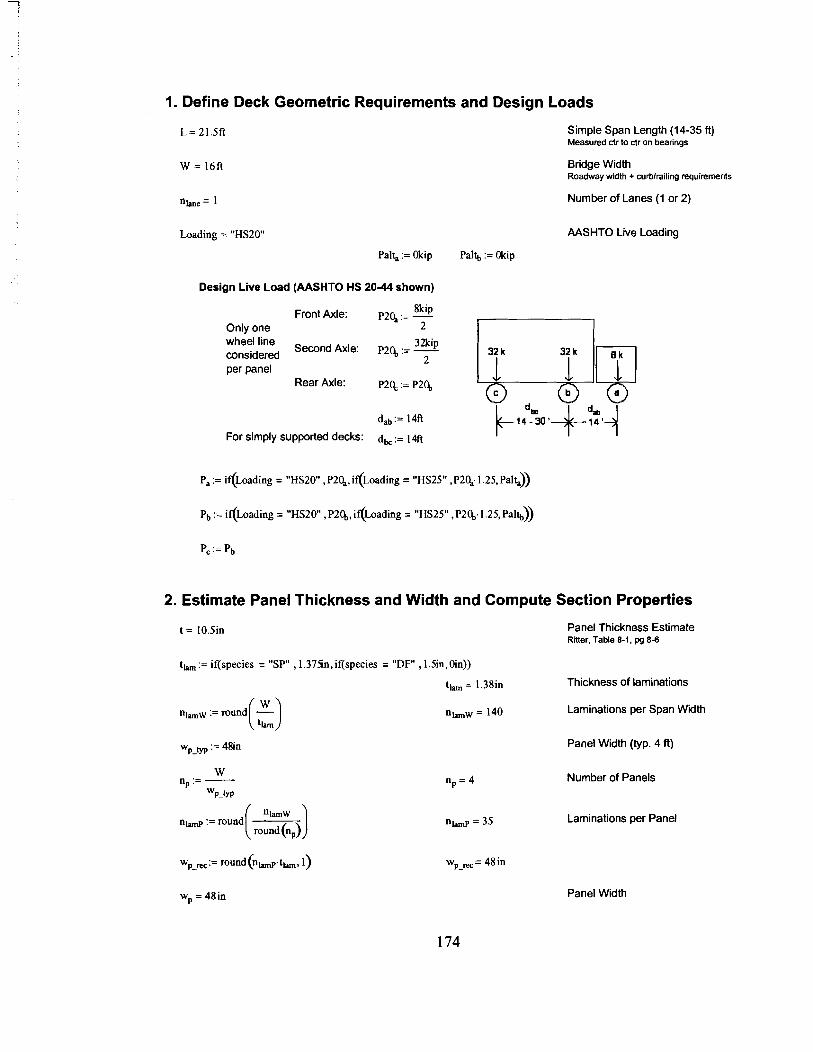
1. Define Deck Geometric Requirements and Design Loads
Loading = "HS20"
Palt, := Okip
Design Live Load (AASHTO HS 2 0 4 shown)
8kip Front Axle: p 2 4 := - Only one 2
32kip line Second Axle: p 2 g := - considered 2 per panel
Rear Axle: p20, := ~ 2 %
dab := 14ft
For simply supported decks: d, := 14fi
Simple Span Length (14-35 ft) Measured d r to d r on bearings
Bridge Width Roadway width + wrblrailing requirements
Number of Lanes (1 or 2)
AASHTO Live Loading
Pal$, := Okip
2. Estimate Panel Thickness and Width and Compute Section Properties
t h := if(species = "SP" ,1.375n,if(species = "DF" ,1.5in,Oin))
n m := round (ro::~cp)]
Panel Thickness Estimate Ritter, Table 8-1, pg 8-6
Thickness of laminations
Laminations per Span Width
Panel Width (typ. 4 it)
Number of Panels
Laminations per Panel
Panel Width

3. Compute Panel Dead Load wDLP := 5Cpcf.A
A = 504in2 Panel Area
3 S, = 882in Panel Section Modulus
I, = 4.63 x l d in4 Panel Moment of Inertia
WDL, = 175plf Panel Dead Load AASHTO 3.3.6
WD,, = 150plf Asphalt Wearing Surface DL AASHTO 3.3.6
Est. Transverse Stiffener DL
Est. CurbIRailings DL On outer panel AASHTO 3.3.6 in Tonias (1995) pg 93.
WDL = 380plf TOTAL DEAD LOAD
4. Determine Wheel Load Fraction for Live Load Distribution No longitudinal distribution of wheel loads is assumed; wheel loads act as point loads.
WLF = 0.797
5. Determine Dead Load and Live Load Moment
6. Compute Bending Stress and Select a Deck Combination Symbol
Design Stresses (based on standard glulam choices or manually input) Species values fmm the 1999 ASD Sbuctural Glued Laminated Timber Supplement Combination Symbol 2 for Westem Spedes and 47 for Swthem Pine
Bending
Fb, := if(~spec = "SP47", 175Q1si,if(~spec = "DF2" , 18@$si,Fby - other)) Table 3.2

Ch,::=if(t<6in,I.lO,if(t<8in,l.O7,if(t< lOin,1.04,1.01))) Table 4.6
cf"= 1.01
CM := 0.80 Table 3.2
CD:=l.O C,:=l.O CL:=I.O q, :=l .O
Ftby := Fby.CD.CM.c,.CL.G.Ch,: Foby = 1 .616~ 18ps i Allowable Bending Stress
MOE
Table 3,2 AITC 117-2001 Design gives E := it(Gspec = "SP47" . I .4 1 06psi, it(Gspec = "DF2" , I .7.10~psi, 1.6Msi for combination 2
E = 1 . 7 ~ 106psi
CM := 0.833 Table 3.2
E'= 1 . 4 2 ~ 106psi Allowable MOE
Shear Parallel to Grain
Table 3,2 APA Engineering Bulletin F, := if(Gspec = "SP47" ,27lpsi, if(Gspec = "DF2" ,24lpsi, F,,,,)) Number 98-3
F, = 90psi
F, := i t 2 4 F, = 90psi Reduction for non-edge gluing of multiple-piece laminations
CM := 0.875 Table 3.2
F', = 78.75psi Allowable Shear Stress
Compression Perpendicular to Grain
Fcperp := if(Gspec = "SP47" ,65@si, if(Gspec = "DF2" ,56@si, F ~ ~ ~ ~ - ~ ~ ~ ~ ) ) Table 3.1
Fwrp = 560psi
CM := 0.53 Table 3. I
F'-, = 296.8psi Allowable Compressive Stress
176
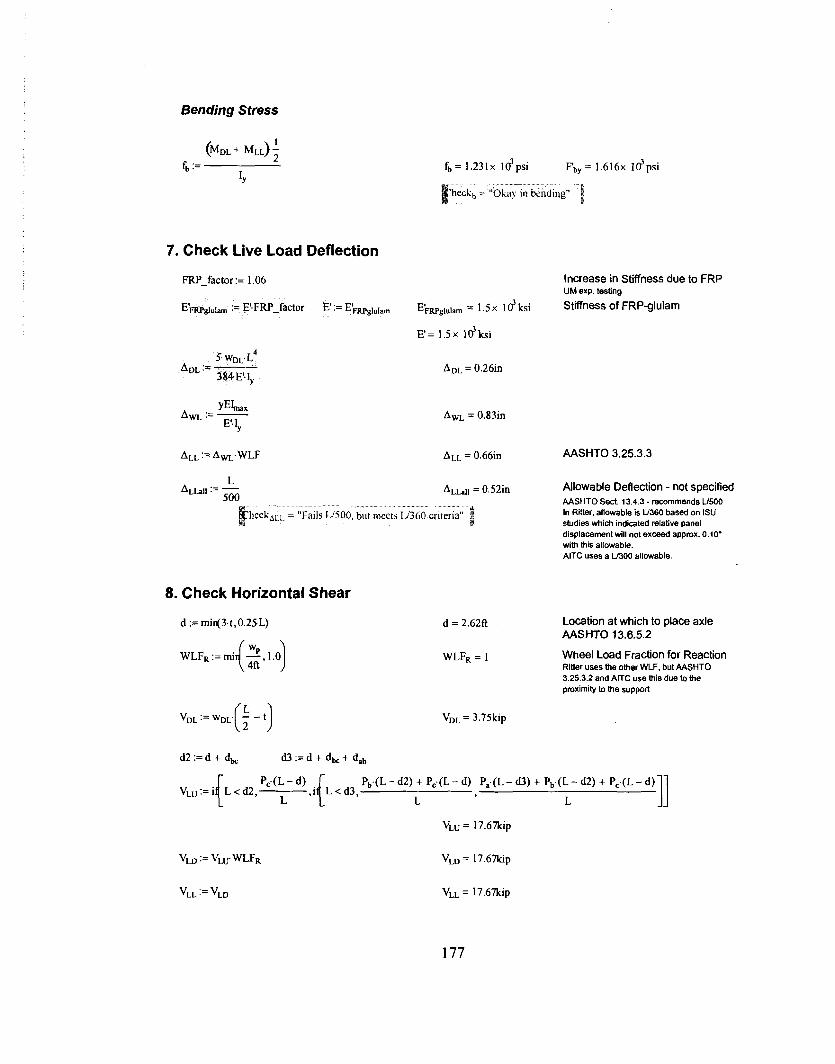
Bending Stress
7. Check Live Load Deflection
FRYfactor := 1.06
E'FRPdulam := EFRLfactor E':= E'mglulam
f b = 1 . 2 3 1 ~ ~ d p s i pby = 1 . 6 1 6 ~ ]$psi --
heckb = "Okay In bending"
Increase in Stiffness due to FRP UM exp. testing
E'F,,luI,, = 1 . S X l d k s i Stiffness of FRP-glulam
ALL = 0.66in AASHTO 3.25.3.3
ALLII = 0.52in Allowable Deflection - not specified
8. Check Horizontal Shear
d := mir(3.t,0.25L)
AASHTO Sect. 13.4.3 - recommends U500 In Ritter, allowable is U360 based on ISU shdies which indicated relative Danel - ~
displacement will not exceed appmx. 0.10' with this allowable. AlTC uses a LO00 allowable.
Location at which to place axle AASHTO 13.6.5.2
Wheel Load Fraction for Reaction Ritler uses the other WLF, but AASHTO 3.25.3.2 and AlTC use this due to the proximity to the support
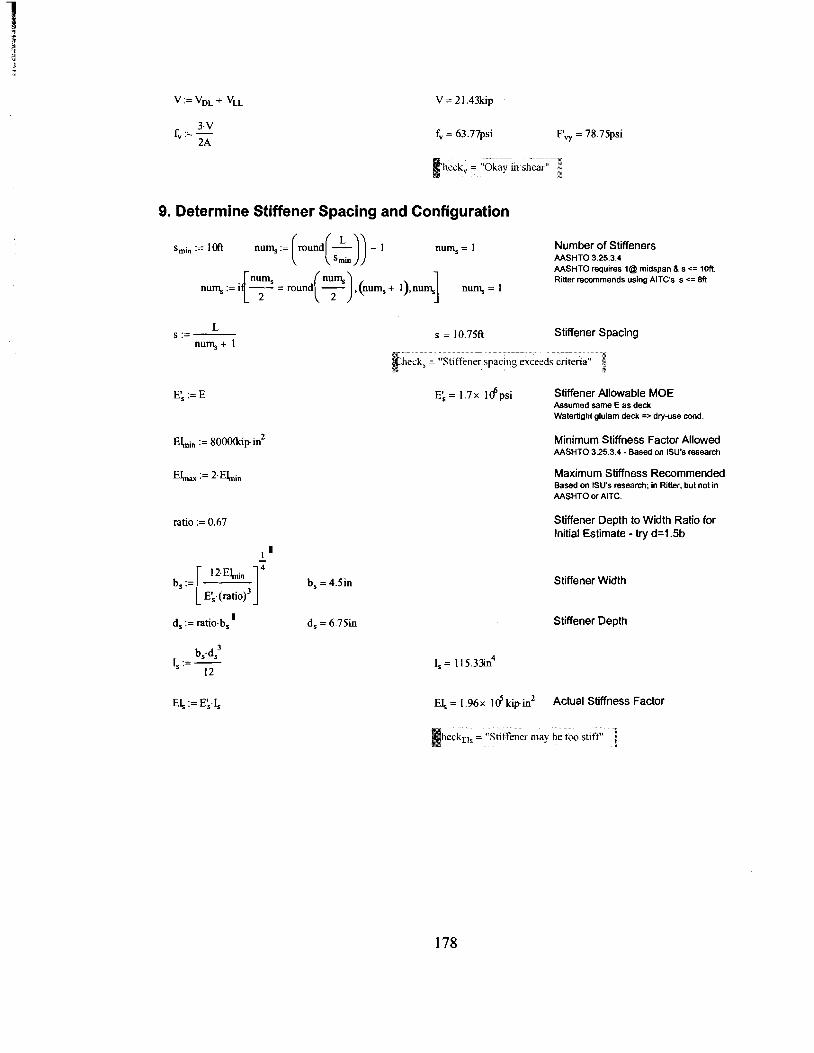
- -- - heck, = "Okay in shear" f -
9. Determine Stiffener Spacing and Configuration
smin := 1M num, := round - - 1 ( (,:in)) num, = 1 Number of Stiffeners
AASHTO 3.25.3.4
I AASHTO requires 1@ midspan 8 s <= 1Mt. Ritler recommends using AITC's s <= 8R
num, := i { y = round(?), (nuQ + i),num, num, = I
L S := -
num, + 1
ratio := 0.67
s = 10.75A Stiffener Spacing
heck, = "~tlffenei spacing exceeds cntena" h
= 1 . 7 ~ lcPpsi Stiffener Allowable MOE Assumed same E as deck Watertight glulam deck => dry-use cond.
Minimum Stiffness Factor Allowed AASHTO 3.25.3.4 -Based on ISU's research
Maximum Stiffness Recommended Based on ISU's research; in Ritter, but not in AASHTO or AITC.
Stiffener Depth to Width Ratio for Initial Estimate - try d=l.5b
b, = 4.5in Stiffener Width
d, = 6 . 7 5 ~ Stiffener Depth
heckEl, = "Stiffener may be tuo stift" i

10. Determine Bearing Configuration and Check Bearing Stress
Length of Bearing Ritter recommends 10-12'for stability L deck attachment. pg 8-13, if less than 6' Cb I= 1
KL := RWL.WLFR RLL = 21.58kip Live Load Reaction to Panel
RDL = 4.08kip Dead Load Reaction
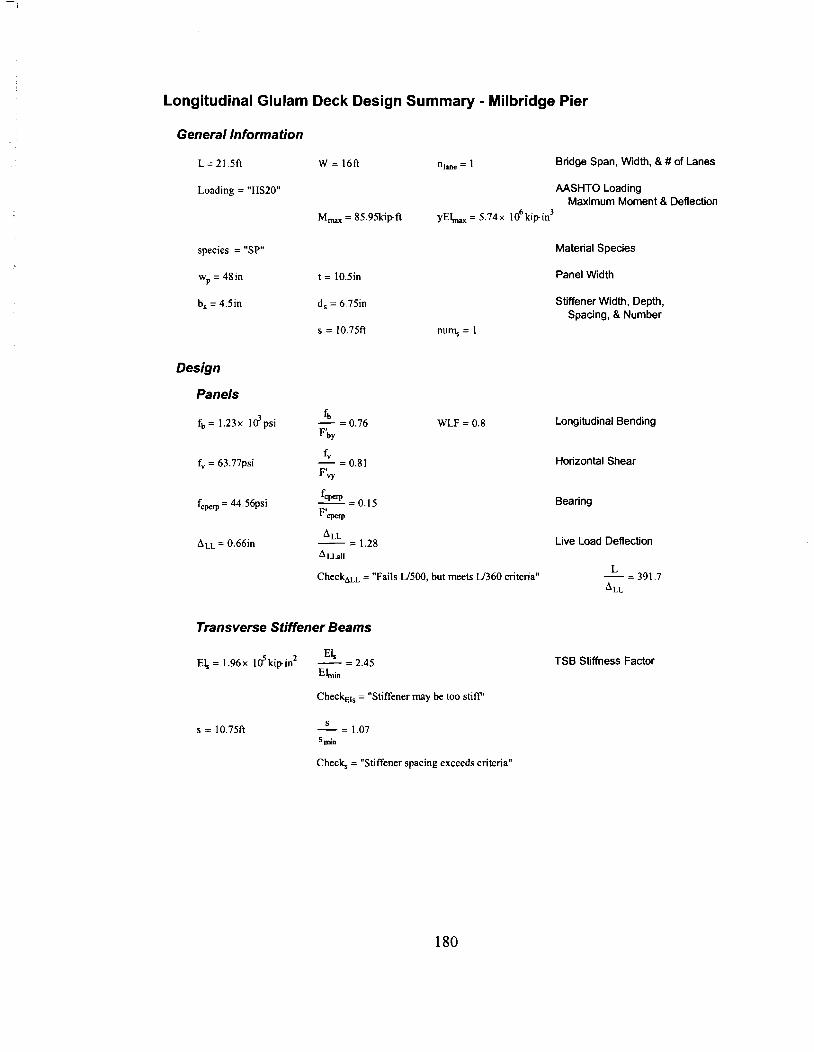
Longitudinal Glulam Deck Design Summary - Milbridge Pier
General Information
L = 21.Sft W = 16ft n~ane = 1 Bridge Span, Width. 8 # of Lanes
Loading = "HS20" AASHTO Loading Maximum Moment 8 Deflection
M, = 85.95kipft y E L = 5 . 7 4 ~ 106kipin3
species = "SP"
wp = 48in t = 10.5in
bs = 4.5in d, = 6.7511
s = 10.75ft
Design
Panels
WLF = 0.8
Material Species
Panel Width
Stiffener Width, Depth, Spacing, 8 Number
Longitudinal Bending
Horizontal Shear
Bearing
Live Load Deflection
CheckuL = "Fails U500, but meets U360 criteria" - =391.7 ALL
Transverse Stiffener Beams
CheckEls = "Stiffener may be too stiff'
TSB Stiffness Factor
Check, = "Stiffener spacing exceeds criteria"

Appendix B
MILBRIDGE PIER LOAD TEST RESULTS

Figure
I Tire Footprint and Loading Truck for Milbridge Pier Load Test #I Span #I I
Tires 730W Jsed for Tire #3
Load Test
Tire #I
Note: All dimensions in inches. 1 I
a-m
Tire #4 I Tire #2
B.l Truck footprint and wheel loads for pier load test
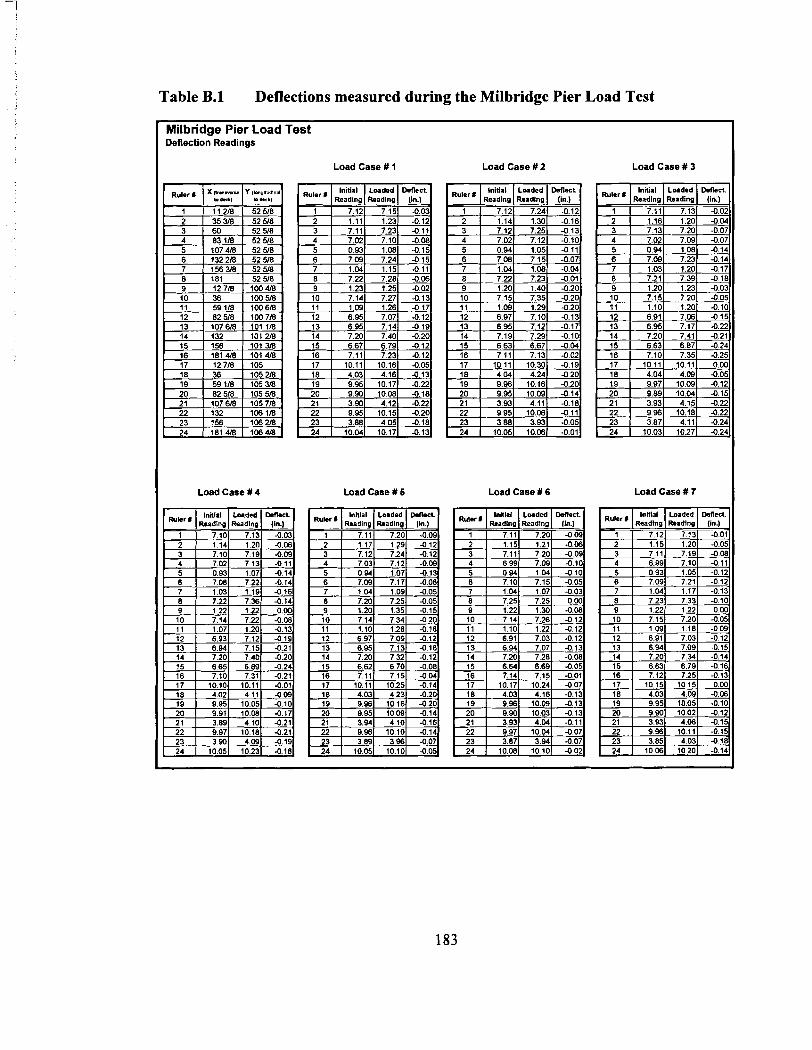
Table B.l Deflections measured during the Milbridge Pier Load Test
- Deflection Readings Milbridae Pier Load Test
Load Case # I Load Case # 2 Load Case# 3 I
Load Case # 4 Load Case # 6 Load Case # 6 Load Case # 7

Panel Deflections: Span 1 - Load Case 1
1 . Panel Defl. - Qtr Span -+Panel Defl. - ~ 4 4
-0.40
Figure B.2 Panel deflections during load test: Load Case 1
Panel Deflections: Span 1 - Load Cases 2 & 3
I I 0 Panel - Qtr Span: LC2 4 - P a n e l - Midspan: LC2 o Panel - Qtr Span: LC3 4 - P a n e l -
Figure B.3 Panel deflections during load test: Load Cases 2 & 3
184

Panel Deflections: Span 1 - Load Cases 4 8 5
Load Case 5 Load Case 4 Load Case 5 Load Case 4 Wheel Loadng Wheelloadng WheelLoadlng W M badmg
- -- r* Panel - ~ t r Span: L C ~ -Panel - Midspan: L C ~ o Panel - Qtr Span: LC5 +-Panel - Midspan: L
-0.40
Figure B.4 Panel deflections during load test: Load Cases 4 & 5
Panel Deflections: Span 1 - Load Cases 6 8 7 Load Case 6 Load Case 7 Load Case 6 Load Case 7
Wheel Load~ng W M L o a d r g W M n g Wheel Lordng
# -4 - .--- -_ ----(
-- v = = n : LC6 -8- "Panel - Midspan. LC6 0 Panel - Qtr Span: LC7 +-Panel - Midspan: LC7
Figure B.5 Panel deflections during load test: Load Cases 6 & 7
Appendix C
LABORATORY TEST RESULTS
The laboratory test results presented in this appendix are discussed and the testing
described in Chapter 4 of this thesis. Tables C. 1 to C.3 present the DCDT deflection
readings at maximum loads. The figures show the deflections at several loadings as the
panels were loaded.

Table C.l Deflection readings from laboratory testing, Load Case #1
DCDT Locations Across Bridge Width (in.) -oad Case #I 27.75 1 51.00 1 77.25 1 113.88 1 137.56 I 165.25
TSB# Load Cell
Connection DCDT Measured Deflection (in.) Reading
-0.43 -0.19 -. --
Seated Beam - - - 1 - -
Loose - -- Seated Beam - - - - - - - -
Loose
-- ~p
2 --
Loose ---- - -- Seated Beam - -32 -0.23 -0.43 -0.46 -0.42 -0.44 -0.18
Loose Through Bolt -
Tight :" "" -o:.
-0: , -0.38 - 0 . 3 9 -0.23 - -- -
Seated Beam - -0.26 -0.40 -0.42 -0.37 -0.37 -0.24 3 Tight -~ ---
"~ugh Bolt - i - 1 - - - Loose -
Seated Beam - -32 -0.23 -0.44 -0.47 -0.44 -0.48 -0.14 Loose

Table C.2 Deflection readings from laboratory testing, Load Case #2
I DCDT Locations Across Bridge Wdth (in.) I ,oad Ca!
TSB#
- ..
. .
? #2 24.00 ( 72.10 ( 102.20 1 138.20 ( 150.30 1 186.30 Load Cell
Connection Readin DCDT Measured Deflection (in.) I
/ Through Bolt - / I G t e d Beam - 1 - 1 -
T i g h t -- Through Bolt - I - I 1
Through Bdt - Tight
(Actual R e a d 1 2 4 "Of
-- Through Bolt - I
Tight 1 -32 1 -0.02 (Data
Seated Beam - Tight 1 -24 1 -0.01
(Actual Readings) --
I Tight 1 -32 1 -0.02 (Data
Loose Through Bolt -
Seated Beam - T i a h t l - - Through Bolt - / -
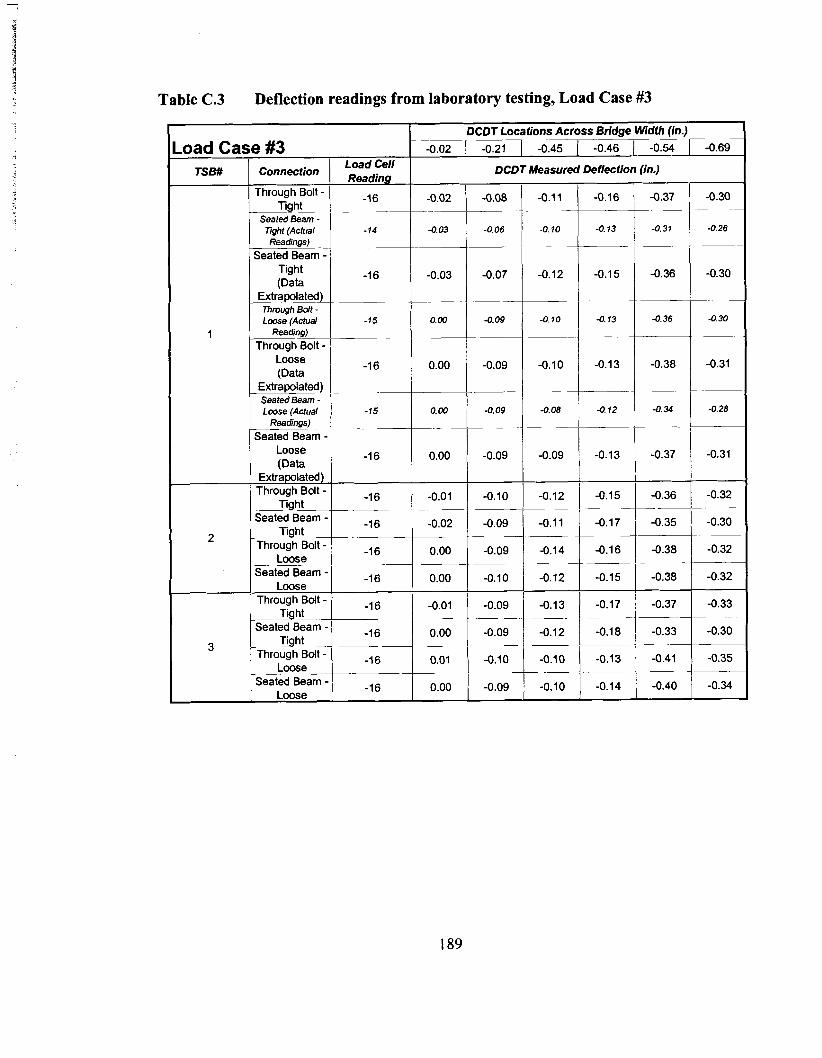
Table C.3 Deflection readings from laboratory testing, Load Case #3
DCDT Locations Across Bridge Width (in.) -- - ---
Load Cell Reading
-16
DCDT Measured Deflection (in.) Connection
Through Bolt - Tight
Seated &am - Tight (Actual Readings) --
Seated Beam - Tight (Data
Extrapolated) - Thmugh Bdt - L m e (Actual
Reading)
Through Bolt - Loose (Data
Extrapolated) Seated Beam - L m e (Actual
~eadings) - Seated Beam -
Loose (Data
Extrapolated) Through Bolt -
Tight -- Seated Beam -
Tight Through Bolt -
Loose Seated Beam -
Tight Seated Beam .
Tight Through Bdt - - Loose Seated Beam.
Loose
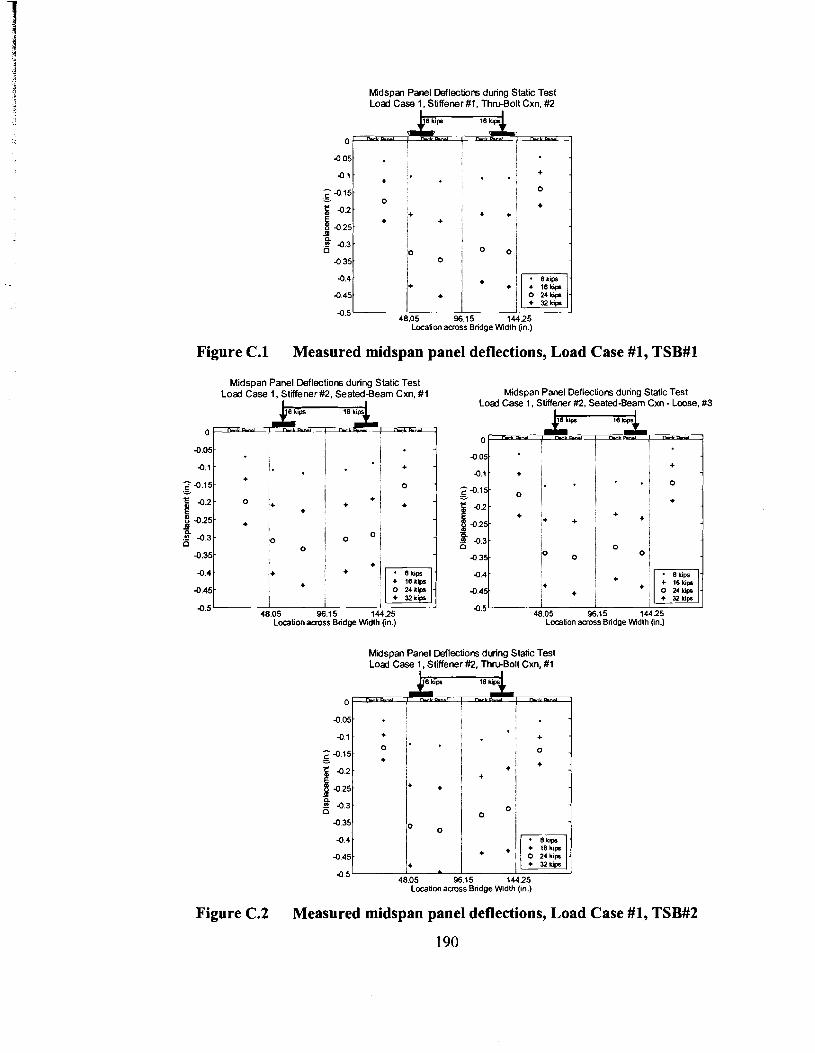
Midspan Panel Deflections during Static Test Load Case I, Stiffener#l, Thru-Bolt Cxn, #2
48.05 96.15 14425 Locationacross Bridge Width (in.)
Figure C.l Measured midspan panel deflections, Load Case #1, TSB#l
Midspan Panel Deflections during Static Test Load Case I, Stiffener#2. Seated-Beam Cxn, # I
4 .4 + W k i i
4.45 0 24 k'pa
0 . 5 48.05 96.15 144.25
Location across Bridge Wdth fin.)
Midspan Panel Deflections during Static Test Load Case 1. Stiffener #2. Seated-ham Cxn - Loose. #3
4s1 I , I
48.05 96.15 14425 Location amss Bridge Wdth (In.)
Miispan Panel Deflections during Static Test Load Case 1, Stiffener #2, Thru-Bolt Cxn. # I
0
4.05
4 .1
48.05 96.15 14425 Location acmss Bridge Wdth (in.)
Figure C.2 Measured midspan panel deflections, Load Case #1, TSB#2
190
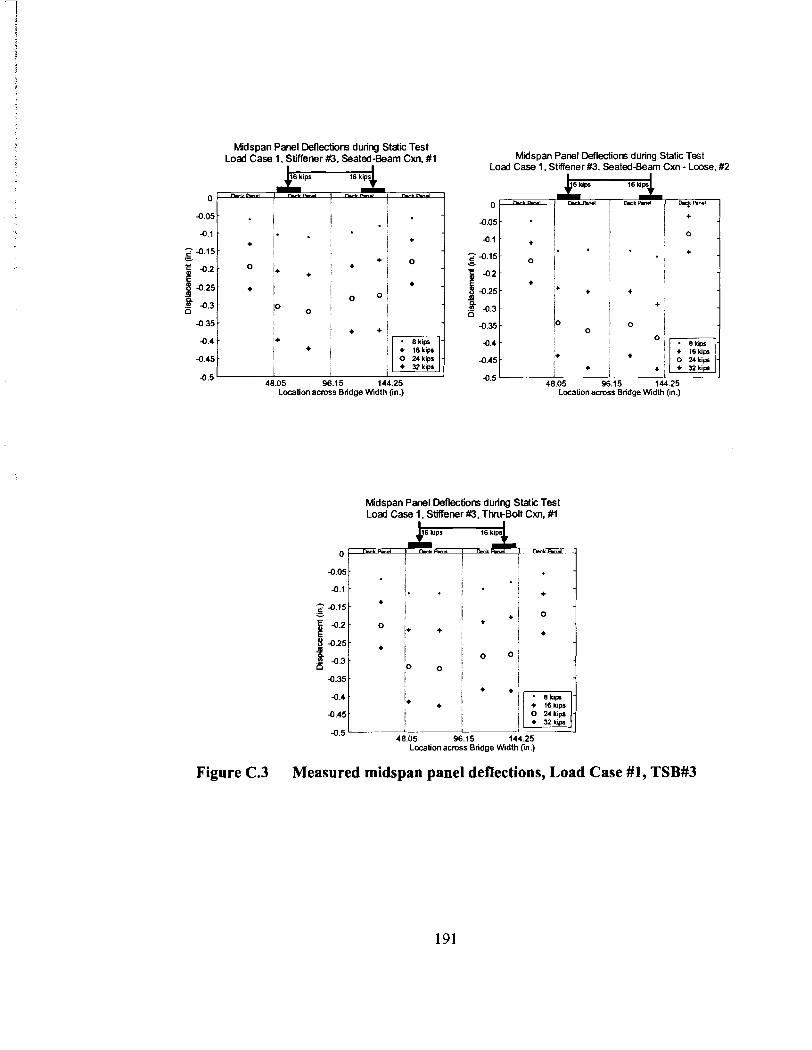
Midspan Panel Deflections during Static Test Load Case 1, Stiffener #3. Seated-Beam Cm. #I Midspan Panel Deflections during Static Test
Load Case 1. StifTener #3, Seated-Beam Cxn - Loose. #2
0
48.05 96.15 144.25 Localionacross Bridge W~dth (in.)
48.05 96.15 14425 Location across Bridge Width (in.)
Midspan Panel Deflections during Static Test Load Case 1. Stiffener #3. Thru-Bolt Cm. #I
L
6.1 Localion across Bridge W~dtl
Figure C.3 Measured midspan panel deflections, Load Case #I, TSB#3
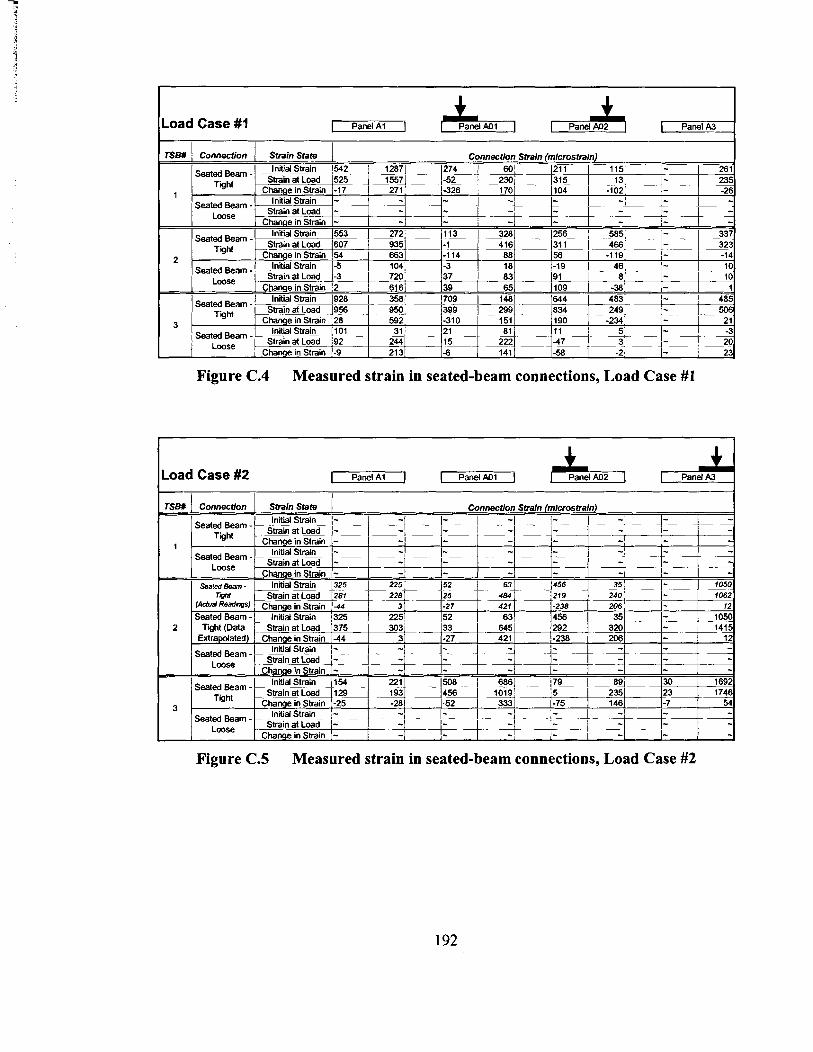
Load Case #1
Figure C.4 Measured strain in seated-beam connections, Load Case #1
TSSW
1
Load Case #2
Connection Sbain State Connection Strain (microstrain)
Initial Strain - Seated Beam - Strain at Load - - - -- Tight Change in Strain - - I - Initial Strain - 1 3 ' 1 - 1: 1 11 1- 1 - SeatL",y - t r a i n at ~ o a d I- - - 1 -I- -12
Change in Strain 1- I - - 1 - - - - - 421 12
Tih t (Data Strain at Load 375 Extrapolated) Change in Strain -44 - 1 12
Initial Strain - _ Seatgr - - strain at ~ o a d --
&awe in Strain - - 1 - Initial Strain I154 .. 221 508 I 6861 I79 8 9 30 1 1692
S.nyaF - strain at ~ o a i 1 I 29 193 456 1 1019j 15 2351 123 1 1746 Change in Strain -25 -28 -52 1 3331 1-75 146 1-7 1 54
Ingal Strain - - - 1-12 - IAL- - - SeatL",","" - t r a i n at ~ o a d - - -
-1 I - 1 - Change in Strain - - -
Seated Beam - Initid S* 1 5 5 3 1 585 2721 I113 1 3281 1256 - 337 - K a t ~ ~ ,607 9351 - 1 1 4161- 1311 466 - 323
'
Change in Strain 154 1 6631 1-114 1 88 1 56 -1 19 - -1 4 2 seat& hm. Initid strain&- .A -??!++I 46 -1. Id
Loose Strain at LoadJ-3 I 720 81 - -13 Change in Strain 12- 1 616 139 65 1 1109 -381 - - 1
485 506
3 Seated Beam - 1 Inlial Strain 1101 31
Loose Strain at Load 192 244 Change in Strain 1-9 21 3
Connection
seated Beam - Tight
SeatL",r -
Figure C.5 Measured strain in seated-beam connections, Load Case #2
Sbain State I Connection Strain (microstrain) lnitid Strain 1542 1 12871 s o l 1 2 1 1 1 115' - 1 261
Strain at Load 525 1 2 5 5 7 1 ~+k{ - 2301 I315 1 e- - 1 235 Change in Strain -17 27 1 1-326 1 1701 (104 1 -1021 - 1 -26
- 1- 1 - I- I - - - -22 Initid Strain
Strain at Load Change in Strain
- : -

Load Case #3 Panel A1 1-4 1 F'anelAOl 1 h-1 -1
Figure C.6 Measured strain in seated-beam connections, Load Case #3
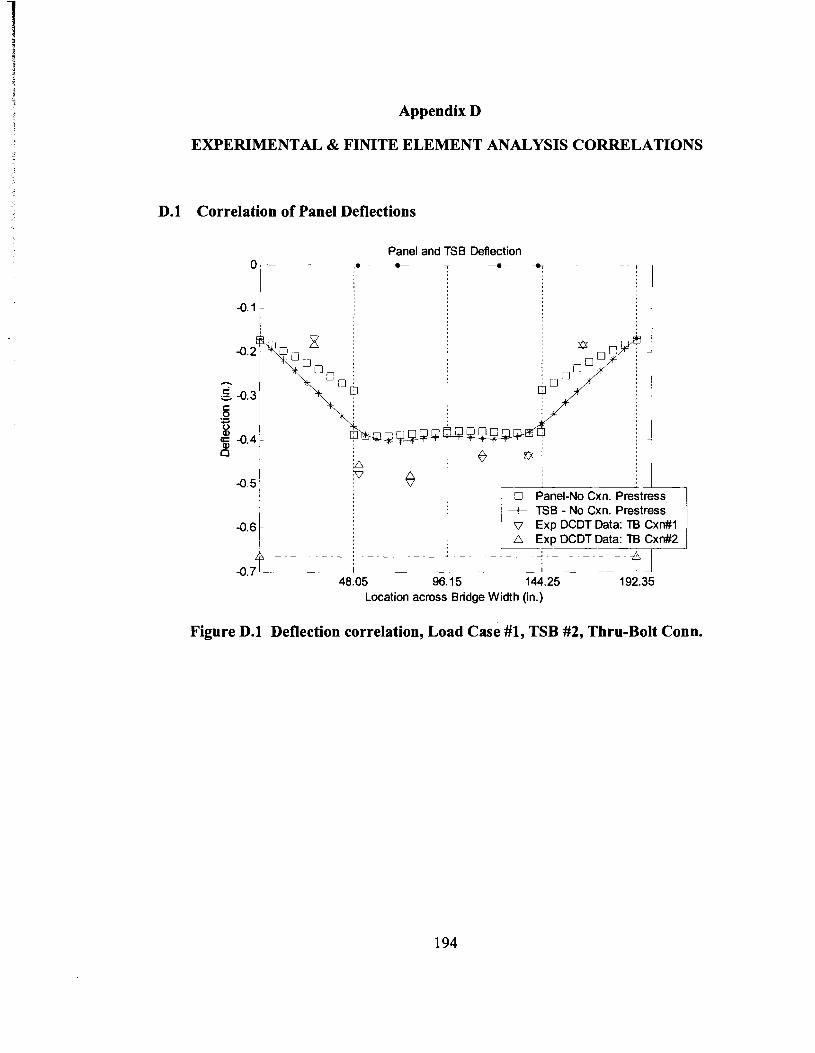
Appendix D
EXPERIMENTAL & FINITE ELEMENT ANALYSIS CORRELATIONS
D.l Correlation of Panel Deflections
Panel and TSB Deflection , 1
t TSB - No Cxn. Prestress o Exp DCDT Data: TB CxMl A Exp DCDT Data: TB CxM2
- 0 . h l 48.05 96.1 5 144.25 192.35
Location across Bridge Width (in.)
Figure D.l Deflection correlation, Load Case #I, TSB #2, Thru-Bolt Conn.

Panel and TSB Deflection
Figure D.2 Deflection correlation, Load Case #1, TSB #3, Thru-Bolt Conn.
Panel and TSB Deflection 0.1 I. a I - 1
0 Panel-No Cxn. prestress- - - TSB - No Cxn. Prestress P a n e l a n Prestress & Load
- - TSB - Cxn Prestress & Load Data: SB Cxn#l
B I -0.7 1
48.05 96.15 144.25 192.35 Location across Bridge Width (in.)
Figure D.3 Deflection correlation, Load Case #1, TSB #3, Seated-Beam Conn.
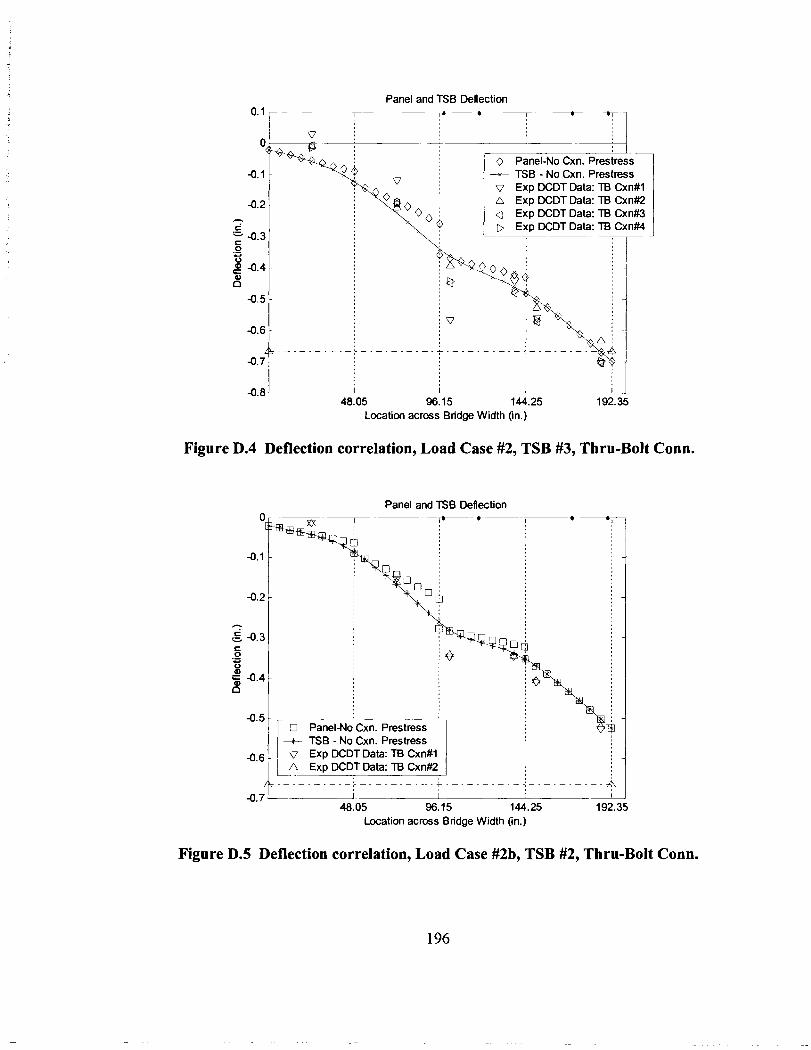
Panel and TSB Deflection
' I _ 0 Panel-No Cxn. Prestress -.- TSB - No Cxn. Prestress v Exp DCDT Data: TB Cxn#l n Exp DCDT Data: TB Cxn#2 a Exp DCDT Data: TB Cxn#3 D Exp DCDT Data: TB CxnM
- A
48.05 96.1 5 144.25 192. Location across Bridge Width (in.)
Figure D.4 Deflection correlation, Load Case #2, TSB #3, Thru-Bolt Conn.
Panel and TSB Deflection
Figure D.5 Deflection correlation, Load Case #2b, TSB #2, Thru-Bolt Conn.
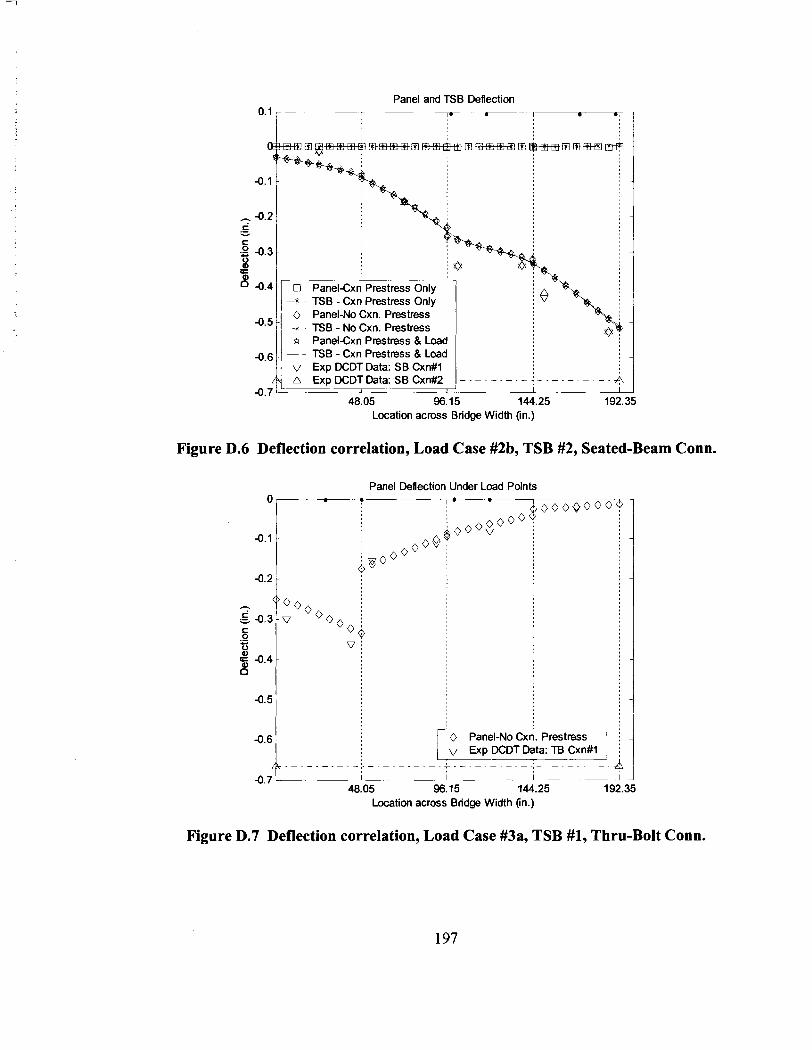
Panel and TSB Deflection
!* - ! I
5 ~ i ~ f ~ m w m 5 ~ ~ m e
~anel4xnTrestres.s Only -+ TSB - Cxn Prestress Only 0 Panel-No Cxn. Prestress
-0.' /I - TSB - NO Cxn. Prestress * PanelCxn Prestress 8 Load
-0.6!! - - TSB - Cxn Prestress 8 Load o Exp DCDT Data: SB Cxn#l
fl A E X ~ D C D T D ~ ~ ~ : S B C X ~ X Z , I - - - -0.7 - 3 -
48.05 96.15 144.25 192.35 Location across Bridge Width (in.)
Figure D.6 Deflection correlation, Load Case #2b, TSB #2, Seated-Beam Conn.
Panel Deflection Under Load Points
-- -0.6 1 1 0 Panel-No Cxn. Prestress
n Exp DCDT Data: TB Cxn#l 1 48.05 96.15 144.25 192.35
Location across Blidge Width (in.)
Figure D.7 Deflection correlation, Load Case #3a, TSB #1, Thru-Bolt Conn.

Panel Deflection Under Load Points
0 panel-~o%n. Prestress
---
1-
48.05 96.15 144.25 192.35 Location across Bridge Width (in.)
Figure D.8 Deflection correlation, Load Case #3a, TSB #2, Thru-Bolt Conn.
Panel Deflection Under Load Points
Panel-No Cxn. Prestress 0 Panel-No Cxn. Prestress a Panel-Cxn Prestress & Load v Exp DCDT Data: SB Cxn#l
48.05 96.15 144.25 192.35 Location across Bridge Width (in.)
Figure D.9 Deflection correlation, Load Case #3a, TSB #2, Seated-Beam Conn.
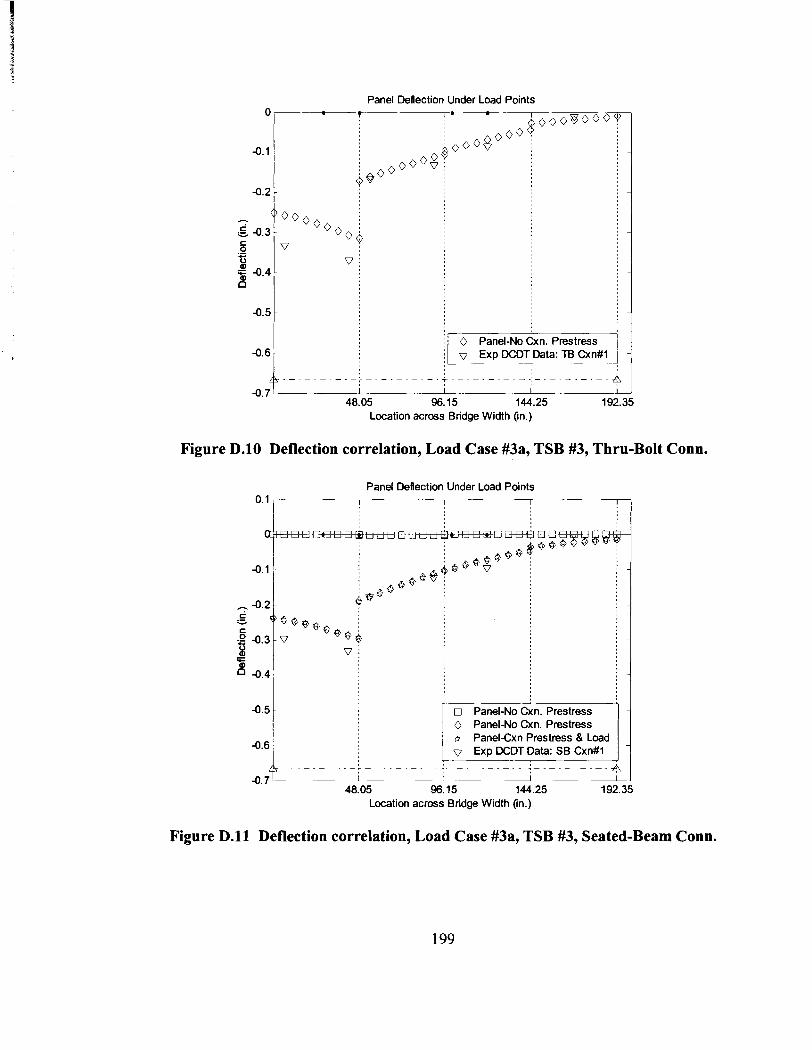
Panel Deflection Under Load Points
/ 0 Panel-No 6 n . Prestress i v Exp DCDT Data: TB Cxn#l
L - 48.05 i I
96.15 144.25 Location across Bridge Width (in.)
Figure D.10 Deflection correlation, Load Case #3a, TSB #3, Thru-Bolt Conn.
Panel Deflection Under Load Points
! -
0 Panel-No Cxn. Prestress tr PanelCxn Prestress & Load o Exp DCDT Data: SB C x M l i~.-
1 I I 48.05 96.15 144.25 19
Location across Bridge Width (in.)
Figure D. l l Deflection correlation, Load Case #3a, TSB #3, Seated-Beam Conn.
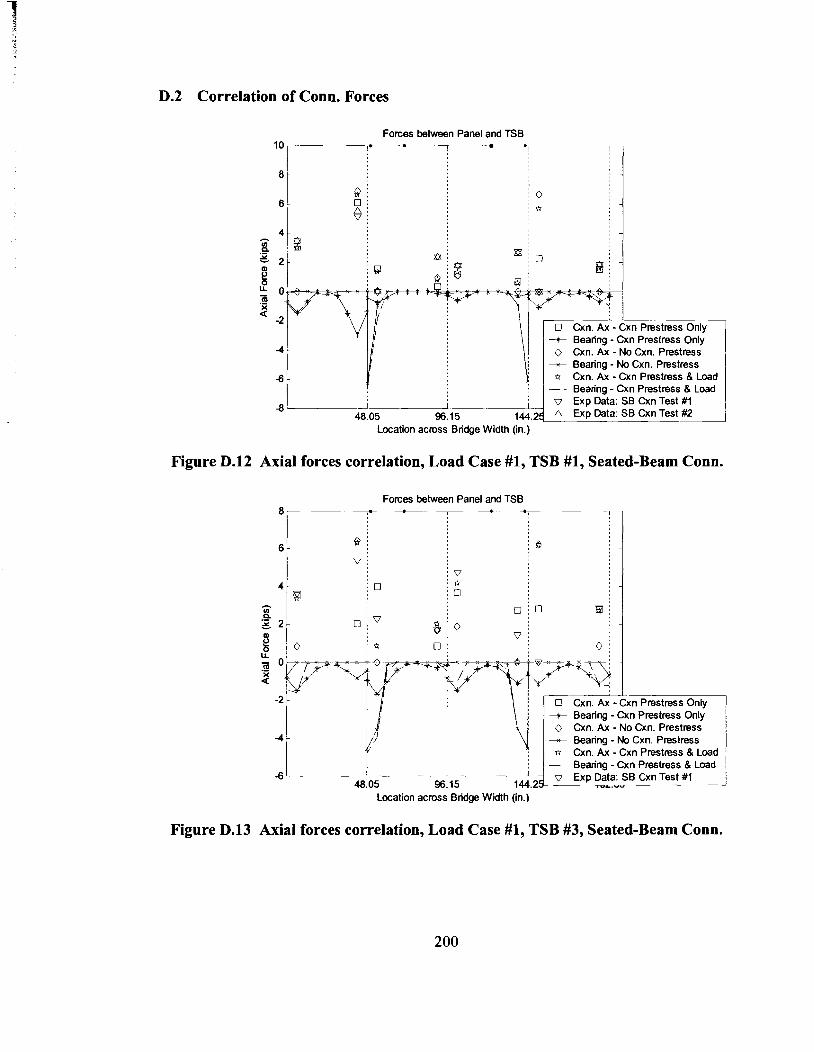
D.2 Correlation of Conn. Forces
Forces between Panel and TSB 9 7 - -- --
Cxn. Ax - Cxn Prestress & Load
-8 48.05 96.15
Location across Bridge Width (in.)
Figure D.12 Axial forces correlation, Load Case #1, TSB #1, Seated-Beam Conn.
Forces between Panel and TSB
+ Bearing - Cxn Prestress Only 0 Cxn. Ax - No Cxn. Prestress
--. Bearing - No Cxn. Prestress Cxn. Ax - Cxn Prestress & Load Bearing - Cxn Prestress & Load
-6 L----L-Li ;] Exp Data: SB Cxn Test # l 48.05 96.15 144.2 -L. - -
Location across Bridge Width (in.)
Figure D.13 Axial forces correlation, Load Case #1, TSB #3, Seated-Beam Conn.

Forces between Panel and TSB ~p -
Cxn. Ax - Cxn Prestress Only ~G;n~:;;;~:;y
BearinQ - No Cxn. Prestress I Cxn. Ax - Cxn Prestress & Load
48.05 96.15 - - Bearing - Cxn Prestress 8 Load Location across Bridge Width
-.
Figure D.14 Axial forces correlation, Load Case #2b, TSB #2, Seated-Beam Conn.
Forces between Panel and TSB
Cxn Prestress Only + Bearing - Cxn Prestress Only 0 Cxn. Ax - No Cxn. Prestress
--. - Bearing - No Cxn. Prestress * Cxn. Ax - Cxn Prestress & Load
-. Bearing - Cxn Prestress & Load v EXD Data: SB Cxn Test #I
Location across Bridge Width (in.) ' u
Figure D.15 Axial forces correlation, Load Case #3a, TSB #2, Seated-Beam Conn.

Forces between Panel and TSB
-- : I 0 Cxn. Ax - Cxn Prestress Only + Bearing - Cxn Prestress only 0 Cxn. Ax - NO Cxn. Prestress
--- Bearing - No Cxn. Prestress * Cxn. Ax - Cxn Prestress 8 Load -. Bearing - Cxn Prestress 8 Load v Exp Data: SB Cxn Test #I
I
i " 48.05 96.15 144.25 192.35
Location across Bridge Width (in.)
Figure D.16 Axial forces correlation, Load Case #3a, TSB #3, Seated-Beam Conn.
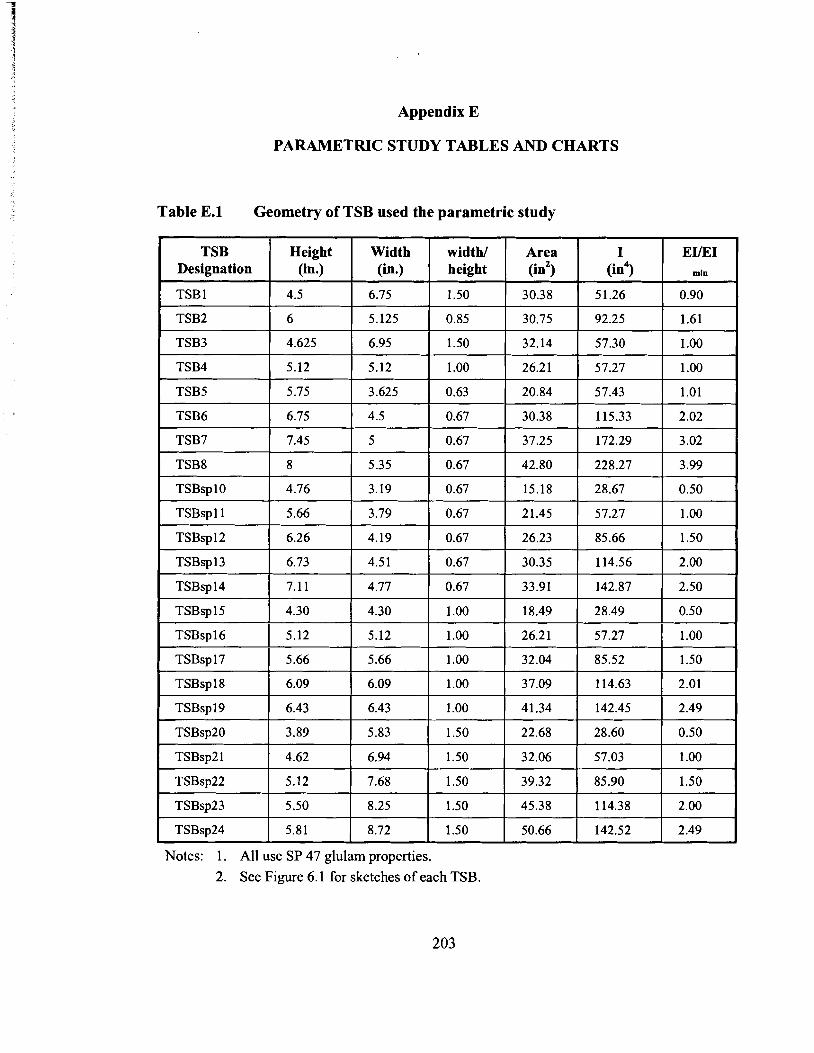
Appendix E
PARAMETRIC STUDY TABLES AND CHARTS
Table E.l Geometry of TSB used the parametric study
TSB Height Width width/ Designation (in.) (in.) height
TSB 1 4.5 6.75 1.50
Area (in2)
TSBsp 10
TSBspl 1
TSBspl6
TSBsp 17
TSBsp 18
TSBsp22
TSBsp23
TSBsp24 8.72
Notes: 1. All use SP 47 glulam properties.
2. See Figure 6.1 for sketches of each TSB.

E.1 Load Cases Used in the Parametric Study
This section contains information on the load cases used in the Parametric Study
reported in Chapter 6 of this thesis. Figure E. 1 is a detailed figure of a general load case
showing how tire locations specified in Table E.2 in which complete descriptions of each
load case may be found. Load Cases #1 to 13 were applied using the simple distribution
of the tire point load to point loads at nodes under the tire patch as described in Chapter
5. Load Case #14 applied the entire tire load to a single node. All Load Cases numbered
15 and greater used a uniform surface load applied to the deck elements as described in
Chapter 5. Load Cases #12, 14, and 15 have identical loading, but different methods of
applying the loads in the finite element program. Figures E.2, E.3, and E.4 show plan
views of each load case used in this study. The plan views of the load cases are grouped
according to panel width of the bridges to which they are applied.
Bridge Span (204. bridges have 1 TSB; 354. bridges have 3 TSB)
. . :: :: f f J TSB :: :: :: . .
Load Patch of
@ 8 F 'a LC 0 C 0 .- .- 8 0 - >
x location of axle 4 Figure E.l Key to figures of Load Cases
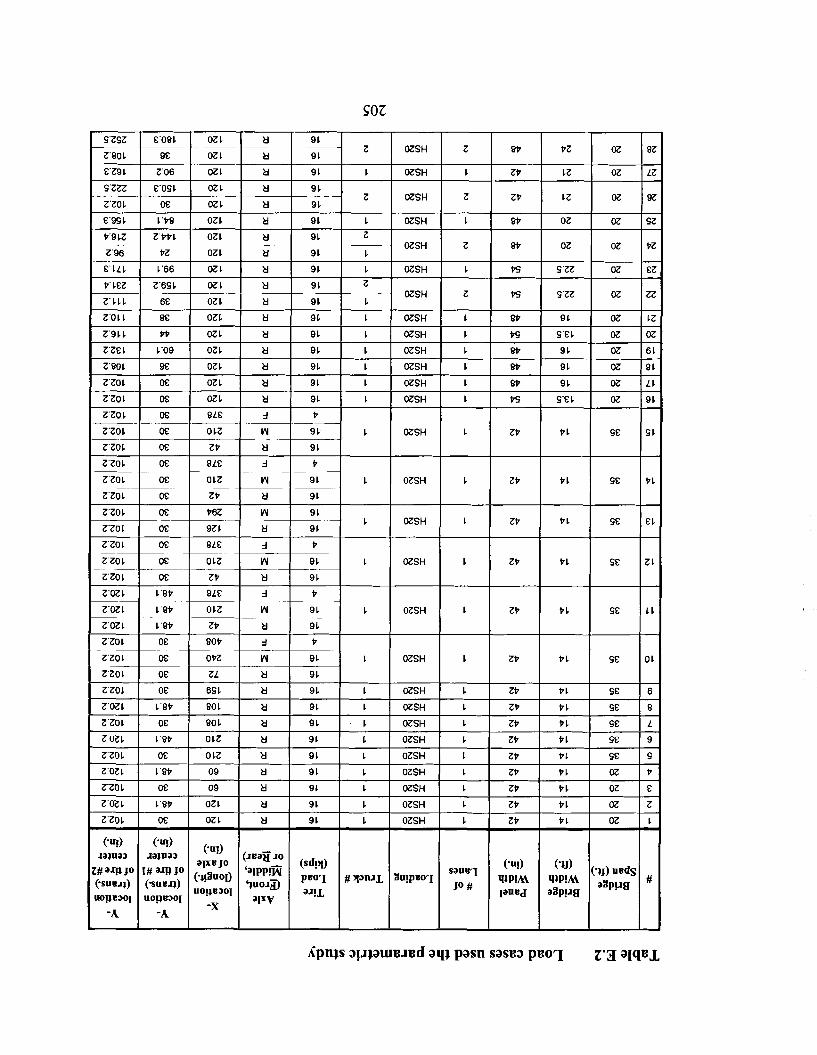
soz
Z'ZO C
Z'96
oz C tl .. - -
9 C
oz C tl I 9C Z OZSH
OZ C 9 C OZSH
oz C 9 C OZSH
9 C
E'CLC
Z'CCC
Z'O L L
oz I. tl 9 C z -- o z r l tl 9 L C
- OZSH
OZL I tl I 9 1 I L I OZSH I I I I
OZ C tl 9 C C OZSH
OZC I tl I 9C I L I OZSH
OZC I tl I 9C I L I OZSH
Z'ZO C
Z'ZO C = I F OZ L tl 9 L C OZSH
OZ C kt 9 L C OZSH
Z'ZOC --*- Z'ZOL
Z'ZOC ++ Z'ZOC OLZ I 1 :! I L ( OZSH
ZP
Z'OZ C
2--1*-1 9Z I 1 1 OZSH
OZSH
OCZ OZSH
OZSH
OZSH
Z'OZC
Z'ZOC
Z'ZO C
Z'ZOC
Z'ZOC
Z'OZC C'8P
OPZ
801 I tl I 91 I C I OZSH
Z'ZOC -++ z.02 L
Z'ZOC
80 C tl 9 L C OZSH
orz 1 tl 1 9 r I r I OZSH
09 tl 9C L OZSH
09 1 tl I 91 I C I OZSH
OZL I tl I 9L I C I OZSH
Z'ZOC 1 06 OZ C C I OZSH
I I I I
dpnp qqaurmzd a q pasn sasm p ~ o q z.3 a ~ q e ~
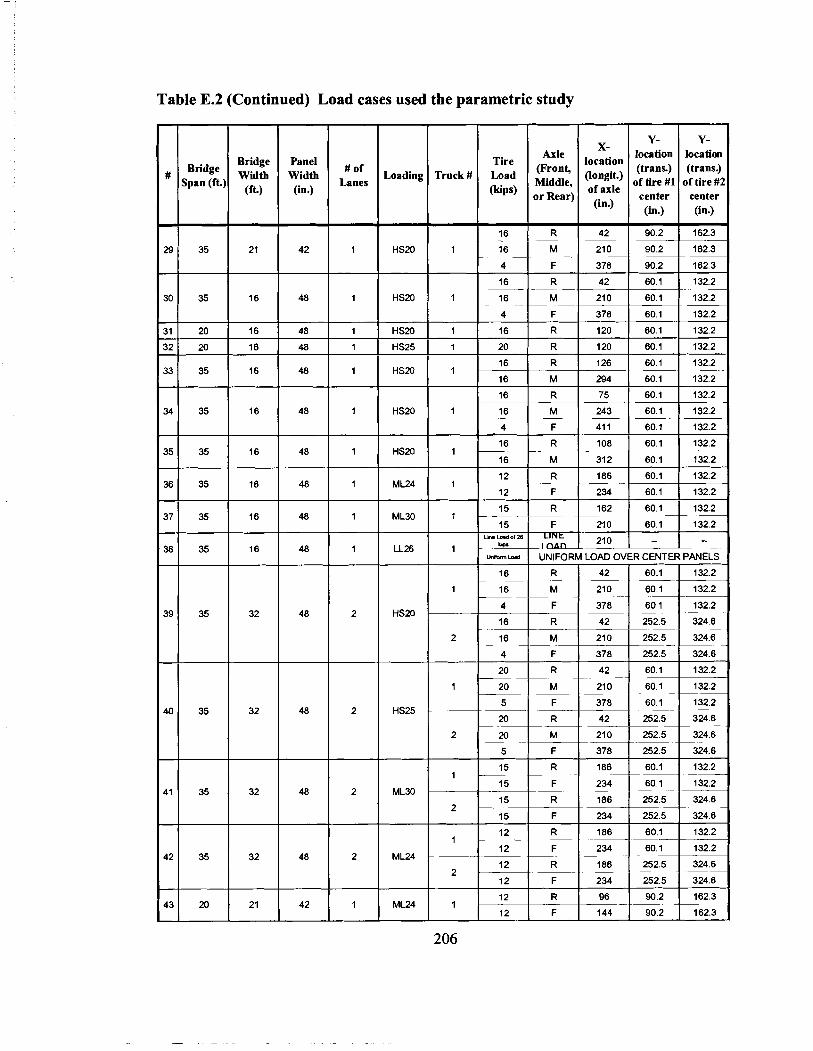
Table E.2 (Continued) Load cases used the parametric study
Tire Axle
Load (Front, Middle,
Ocips) or Rear)
X- location (longit.) of axle
(in.)
-m I UNIFORM LOAD OVER CENTER PANELS
16 I R 1 42 1 60.1 1 132.2

Table E.2 (Continued) Load cases used the parametric study
Y- Y- location location (trans.) (trans.)
of tire #1 of tire #2 center center (in.) (in.)
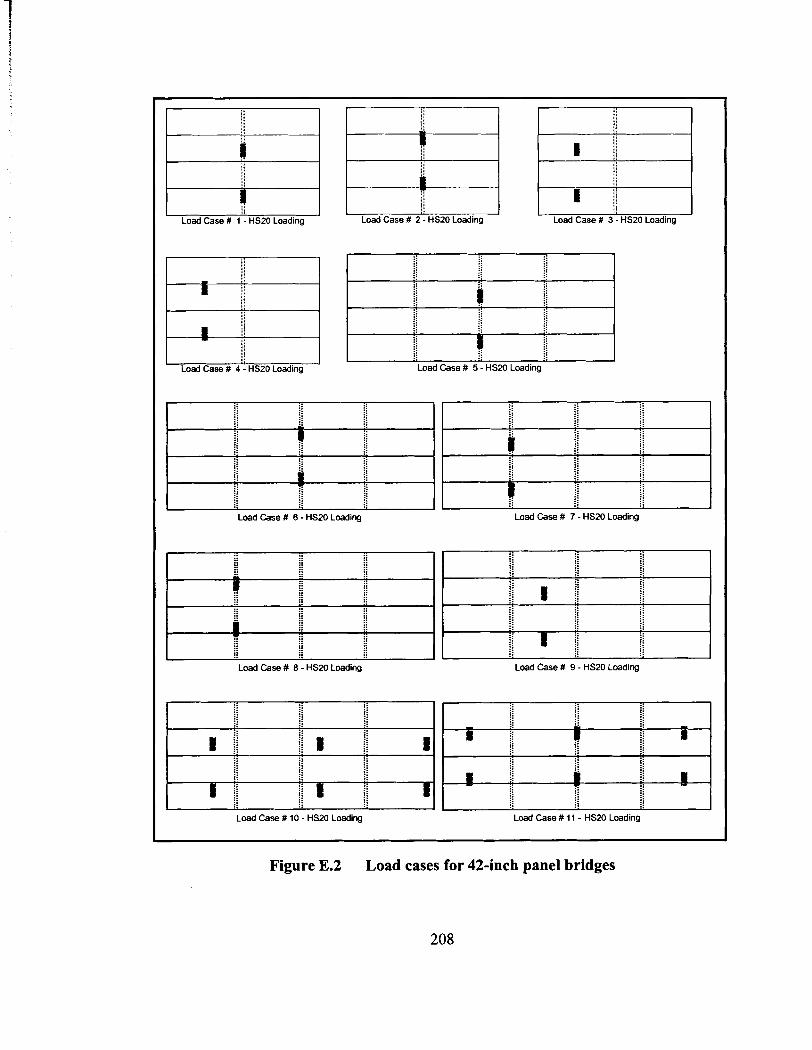
/. i:
1 i ;
$
I i l
Load Case 1 1 - HS20 Loading Load Case # 2 - HS20 Loading Load Case # 3': HS20 Loading
- j /
- 1
;;
Load Case # 4': HS20 Loading -
Load Case # 6 - HS20 Loading
Load Case # 10 - HS20 Loading
Load Case # 9 - HS20 Loading
Load Case # I I - HS20 Loading
-- -
Figure E.2 Load cases for 42-inch panel bridges
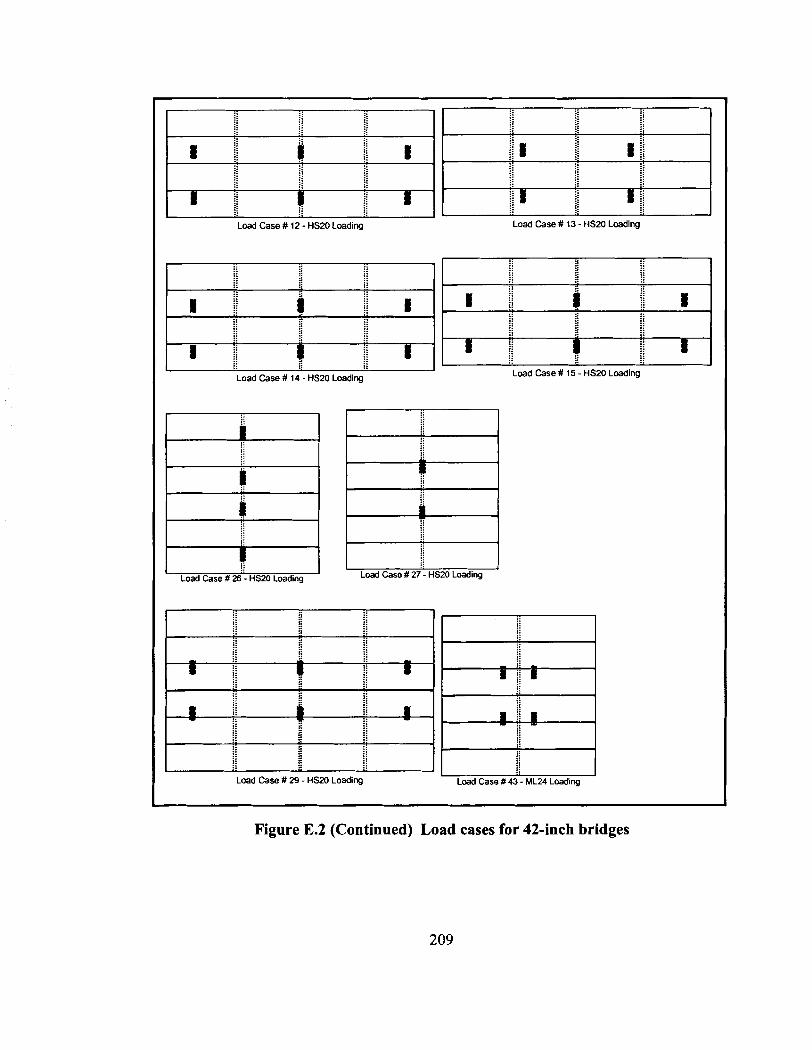
1 4 1
Load Case # 28'1 HS20 Loading
1 ; ; 5 ; I Load Case # 15 - HS20 Loading
L
g
, Load Case # 27 - HS20 Loading
Load Case # 29 - HS20 Loading Load Case # 43 - ML24 Loading
Figure E.2 (Continued) Load cases for 42-inch bridges
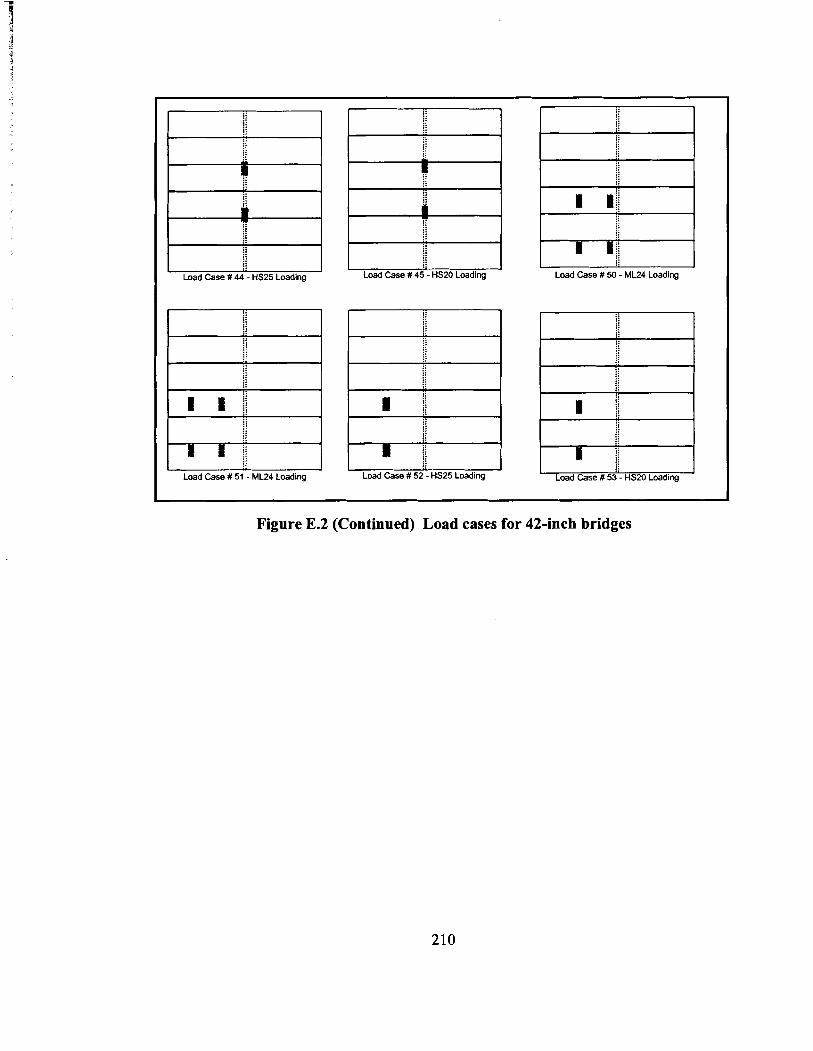
I J Load Case # 50 - ML24 Loading
I .;
i Load Case # 53:- HSX) Loading
Figure E.2 (Continued) Load cases for 42-inch bridges
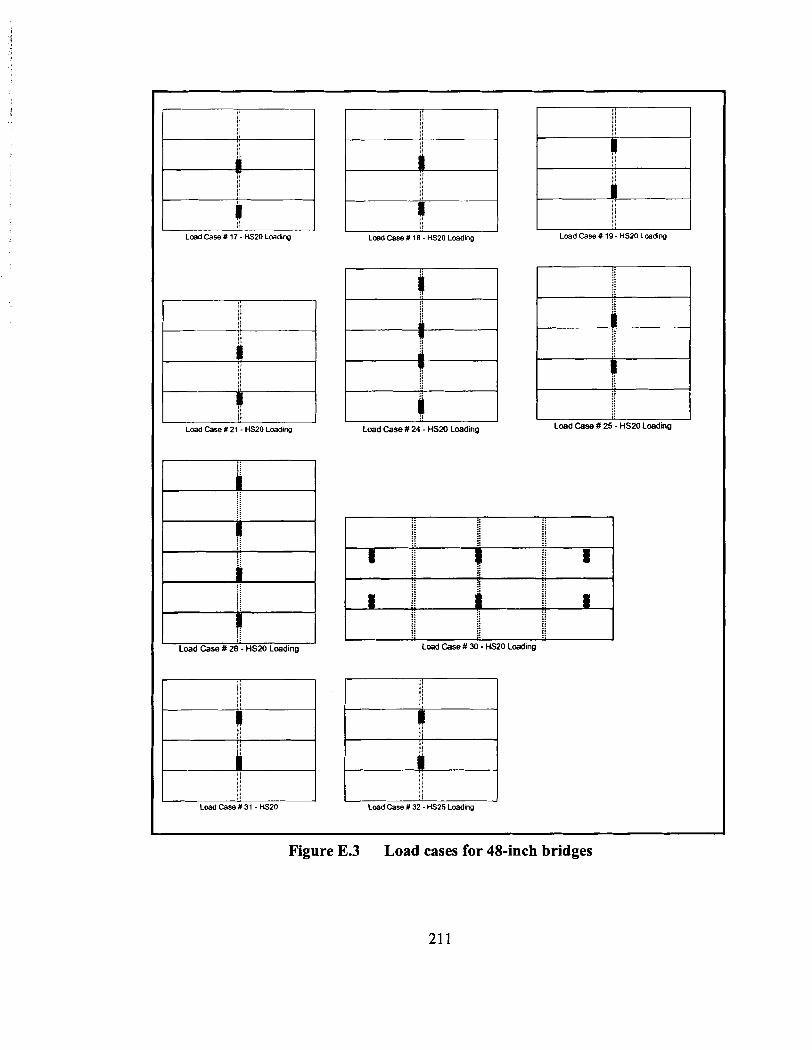
-
1 Load Case 1 17 - HS20 Loading
1
1 i i
I ii
;i Load Case # 21 - HS20 Loading
i j i i! j:
1 i!
8
i ij
Load Case # 28 - HS20 Loading
/I m 1;
!j Load Case # 18 - HS20 Loading
4
I
1 Load Case # 24 - HSZO Loading
R
r I I I
Load Case # 19 - HS20 Loading
ii
R
Load Case # 25 - HS20 Loading
Figure E.3 Load cases for 48-inch bridges
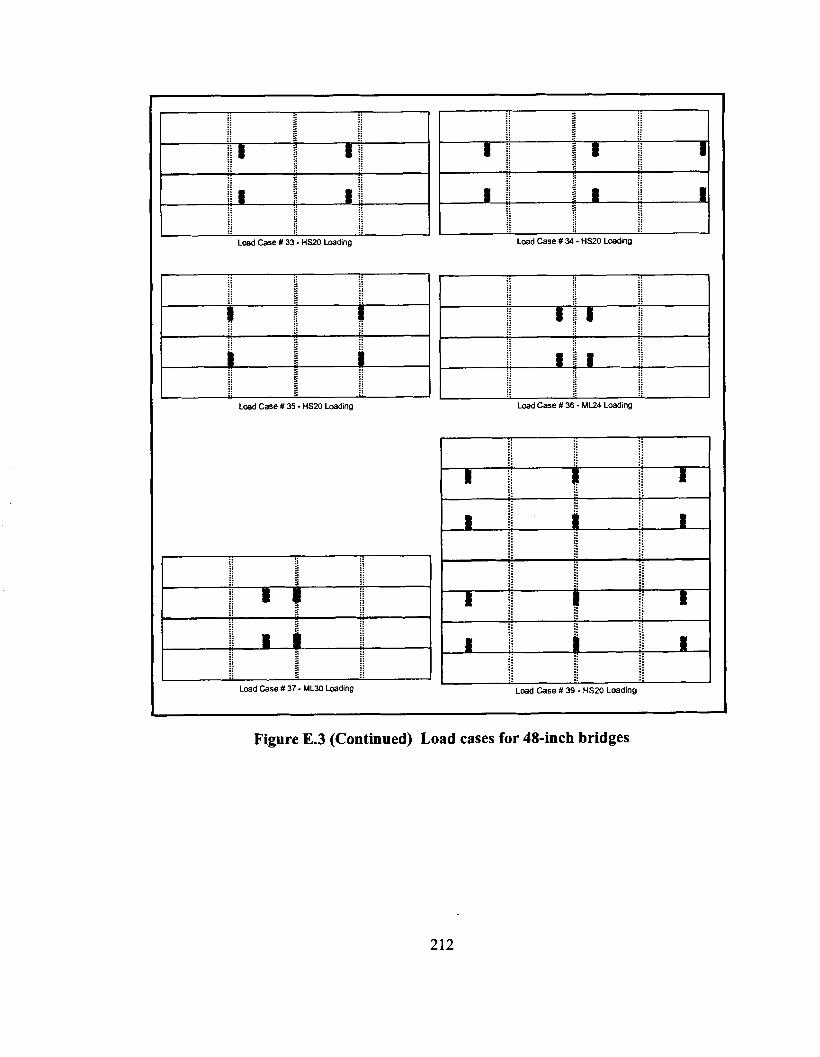
I - t i t
t rij i z Load Case # 33 - HS20 Loading Load Case # 34 - HS20 Loading
Load Case # 35 - HS20 Loading
# $ i
Load Case 136 - MU4 Loading
r #
Load Case # 37 - ML30 Loading Load Case # 39 - HS20 Loading
Figure E.3 (Continued) Load cases for 48-inch bridges

Load Case # 40 - HS25 Loading
Load Case # 42 - ML24 Loading
1 Load Case # 47 - MU4 Loading
j j
j
1 I !'
li I i. Load Case # 4 6 - MU4 Loading
1 , ;: Load Case # 48 - HS25 Loading
i j
fl
I Load Case # 49 - HS2O Loading
- - - -
Figure E.3 (Continued) Load cases for 48-inch bridges

Load Case # 16 - HS20 Loading
i / PI j i i l j i
Load Case # 20 - HSZO Loading
Figure E.4 Load cases for 54-inch bridges
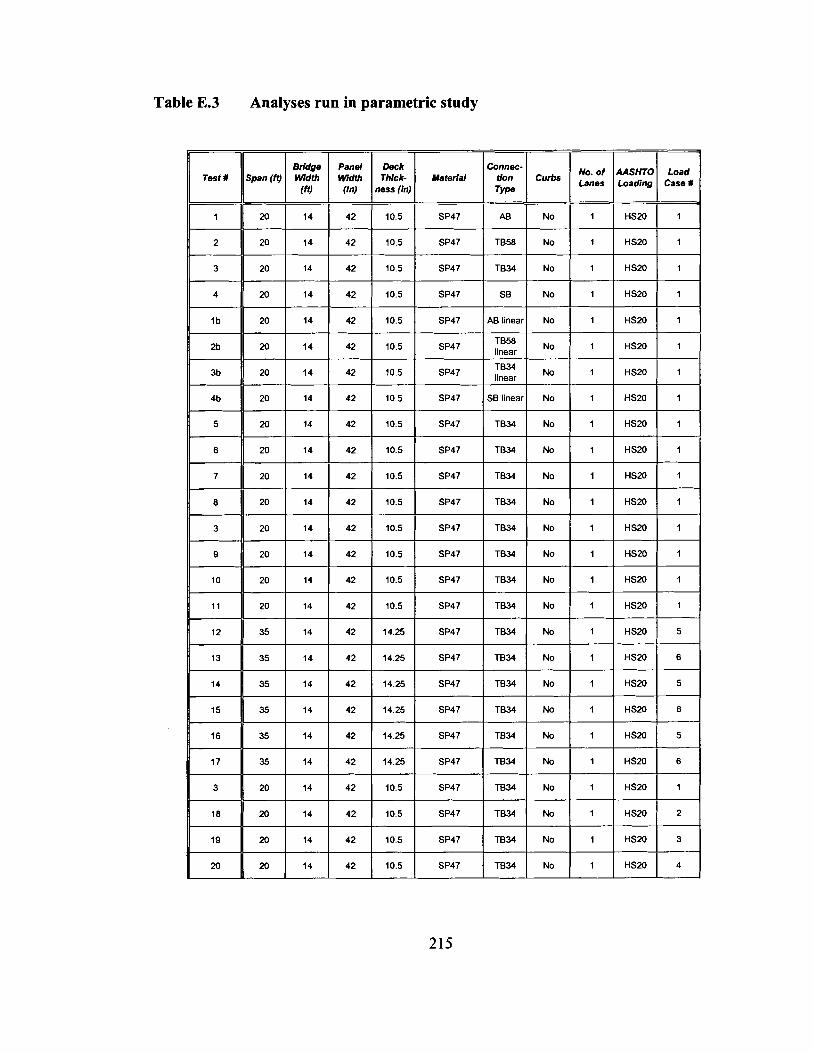
Table E.3 Analyses run in parametric study
,, 1 No. of Lanes
TYW
SB
AB linear
=qTtT linear
SB linear
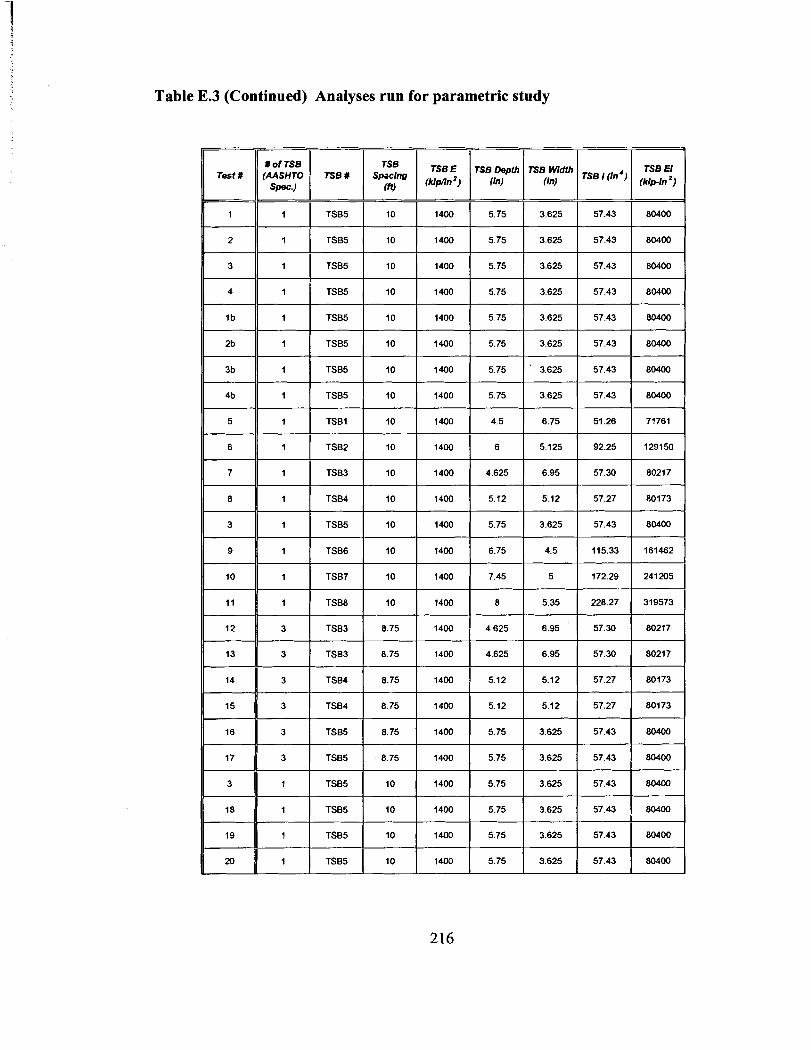
Table E.3 (Continued) Analyses run for parametric study
1 of TSB
Spec.)
TSB5 10
TSB El (kipin ')
TSB E (kipnn ')
TSB Depth (inl
I 1 TSBS 1 10
I I TSBS 1 10
1 TSBS 10
1 TSB5 10
1 TSB5 10
I TSBl 10
1 TSB2 10
I TSB3 10
I TSB4 10
I TSBS 10
I TSB6 10
1 TSB7 10
_1 1 TSBS
I TSB5
I TSBS 10
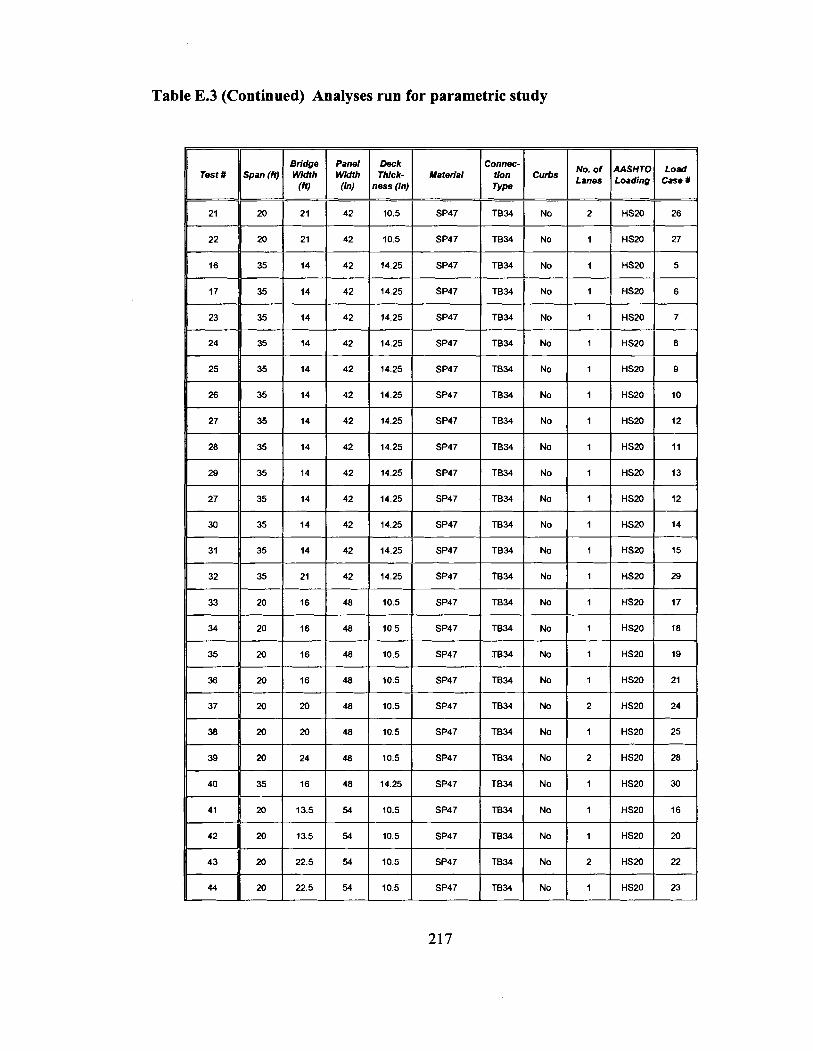
Table E.3 (Continued) Analyses run for parametric study
Connec. Uon TYW
TB34
ness (in)
No. of Lanes
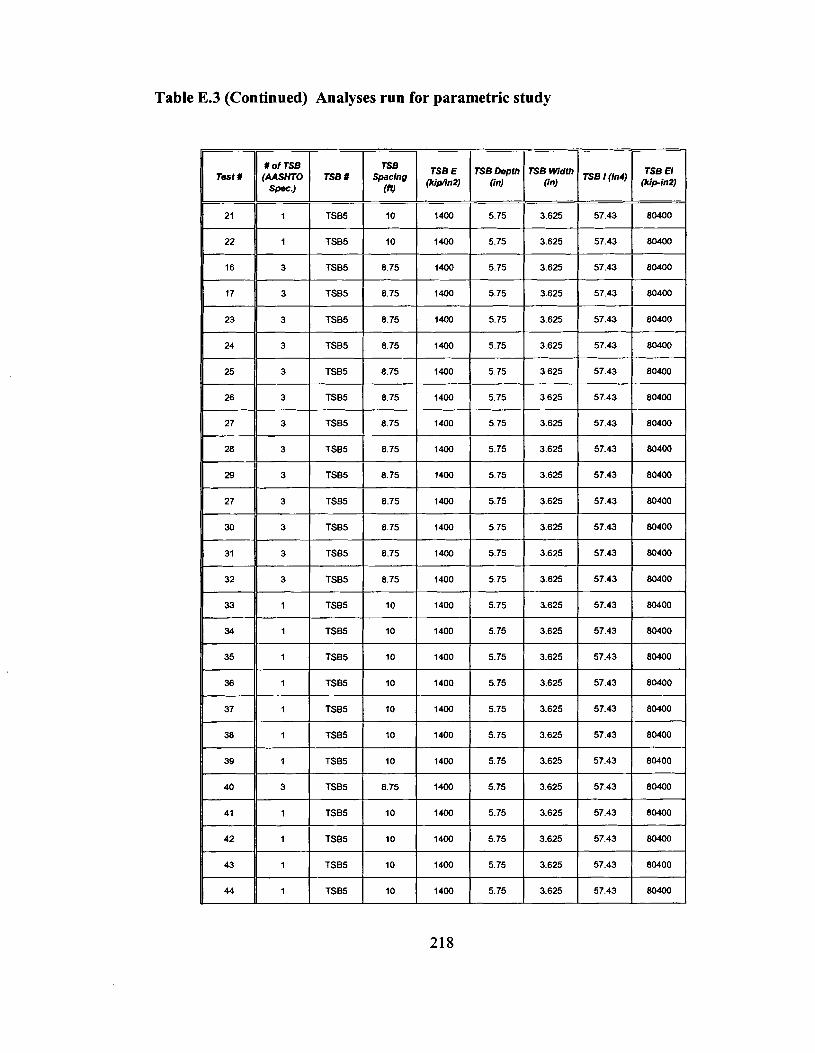
Table E.3 (Continued) Analyses run for parametric study
#of TSE AASHTO S W . )
TSE #
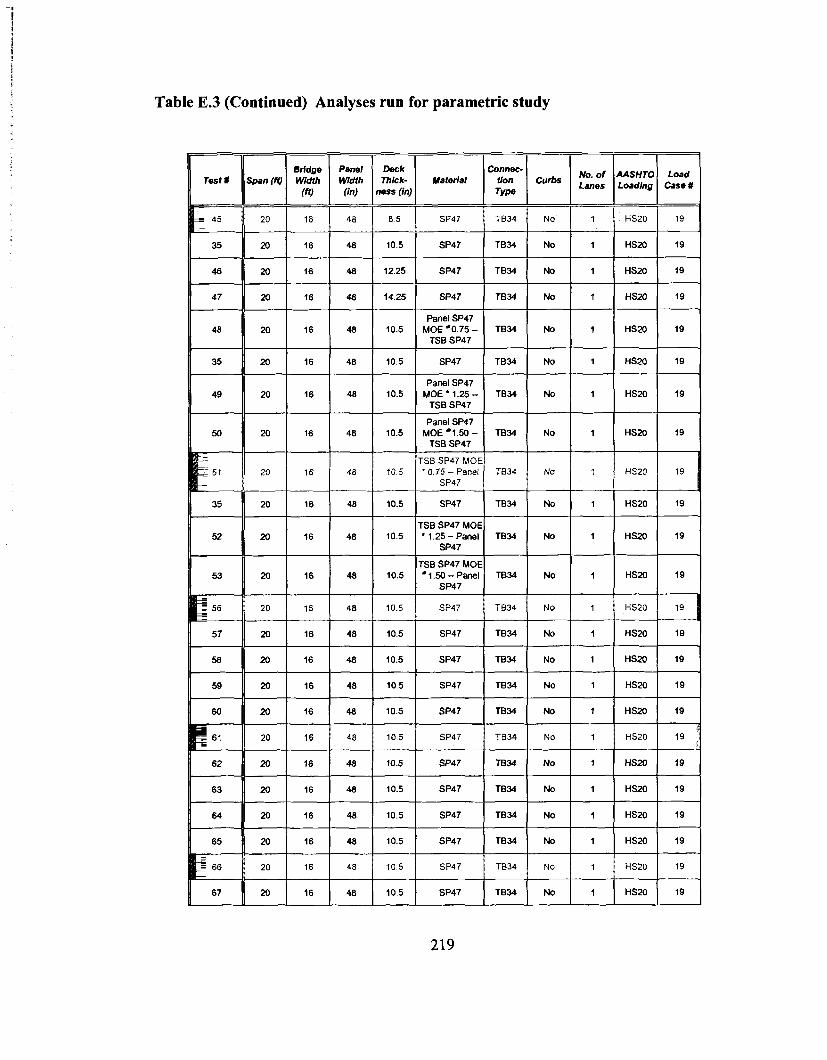
Table E.3 (Continued) Analyses run for parametric study
- curbs
N O
No. of AASHTO Load Lanes Loading Case # I I
1 I HSZO 1 19
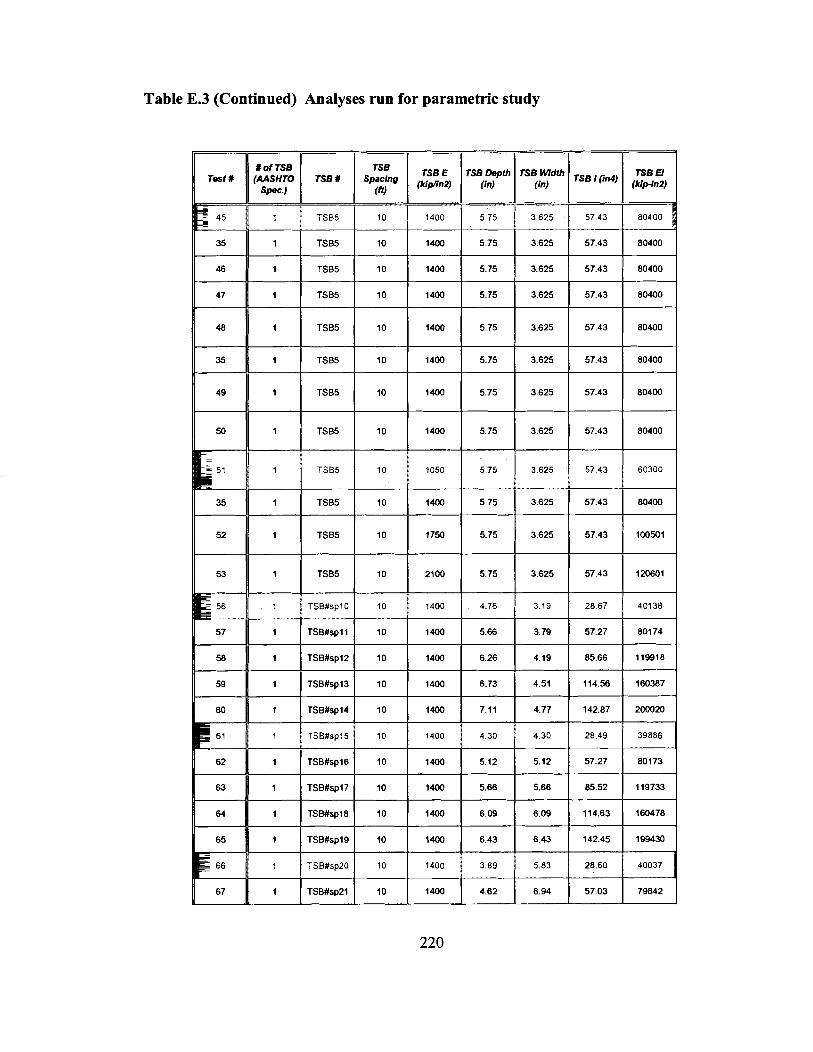
Table E.3 (Continued) Analyses run for parametric study
# of TSB 'MSHTO S W . )
TsB TSB E TSB Depth TSB Width TsB (inO TSB El spacfng 1 ( k i n ) 1 (in) 1 i n 1 1 (kiplnU
(ff)
TSB #

Table E.3 (Continued) Analyses run for parametric study
Test t
68
69
70
71
72
73
74
75
76
77
78
40
80
81
82
83
84
85
86
87
88
89
Zpqqz (in) ness (hJ Material

Table E.3 (Continued) Analyses run for parametric study
Y of TSB 'AASHTO S P W
M E TSB h p t h TSB Winn TsB TSB N sp:p I (kip%12) 1 (in) 1 ( 1 1 1 (kip-1112) 1 TSB #
TSBS
TSBS

Table E.3 (Continued) Analyses run for parametric study
Zq-iqE (in) ness (inJ
I ,,, 1 No. of IAAsHTO 1 Load
TVpe Lanes Loadlng Case Y Material
108
109
110
Ill
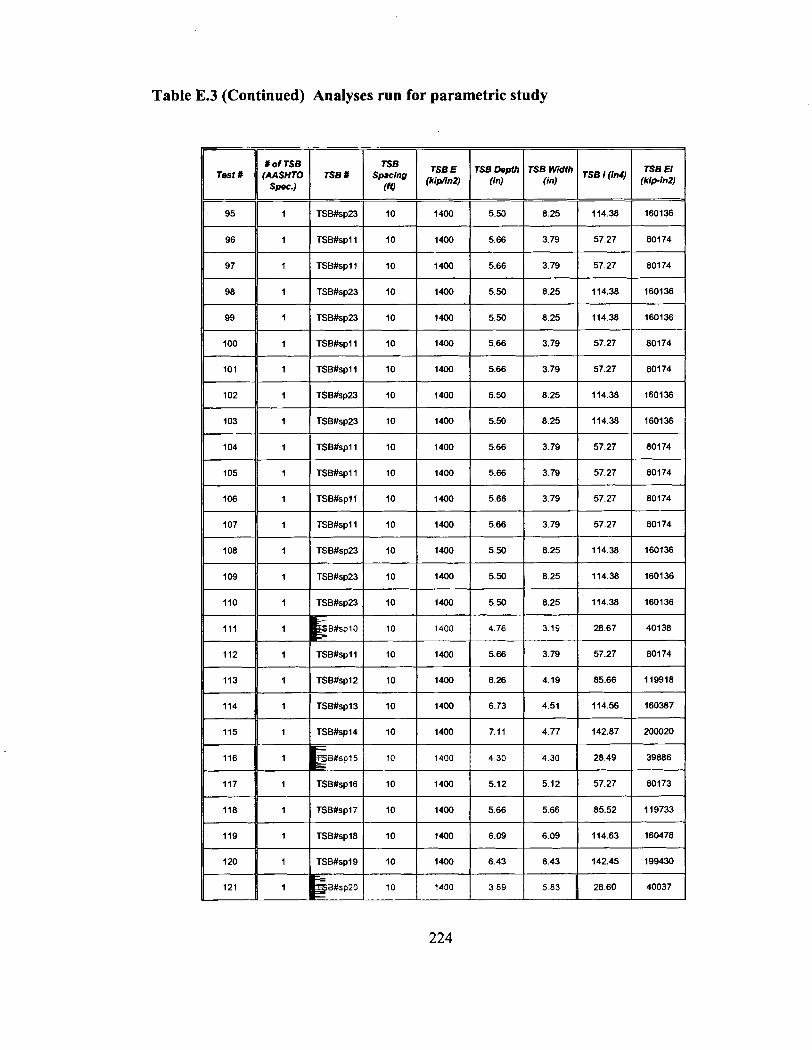
Table E.3 (Continued) Analyses run for parametric study
# of TSB
Spec.)
TSWspI I
TSB El (klpin2)
TSB Spacing
ffY
10
10
10
TSB E (kip4n2)
TSB Depth (in)
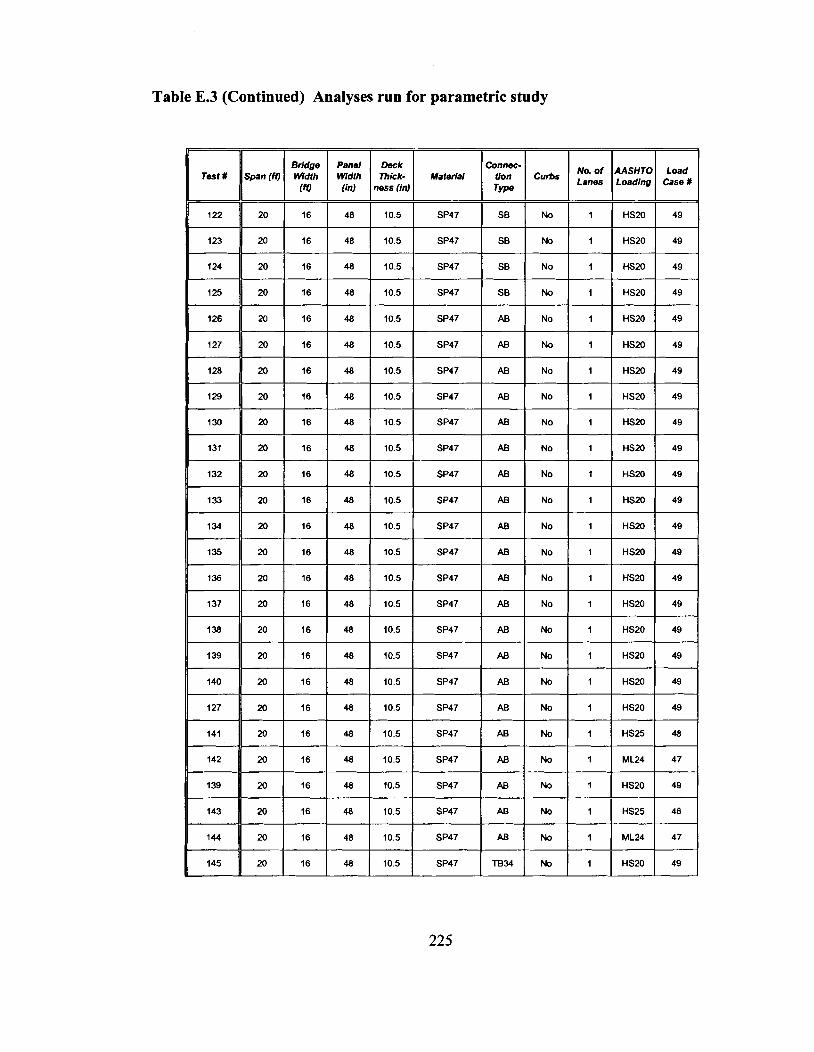
Table E.3 (Continued) Analyses run for parametric study
Panel Wdth ~ (in)
48
48
48
AASHTC Loading
1 HS20
1 HS20
Case #
Deck Thick-
ness (in)
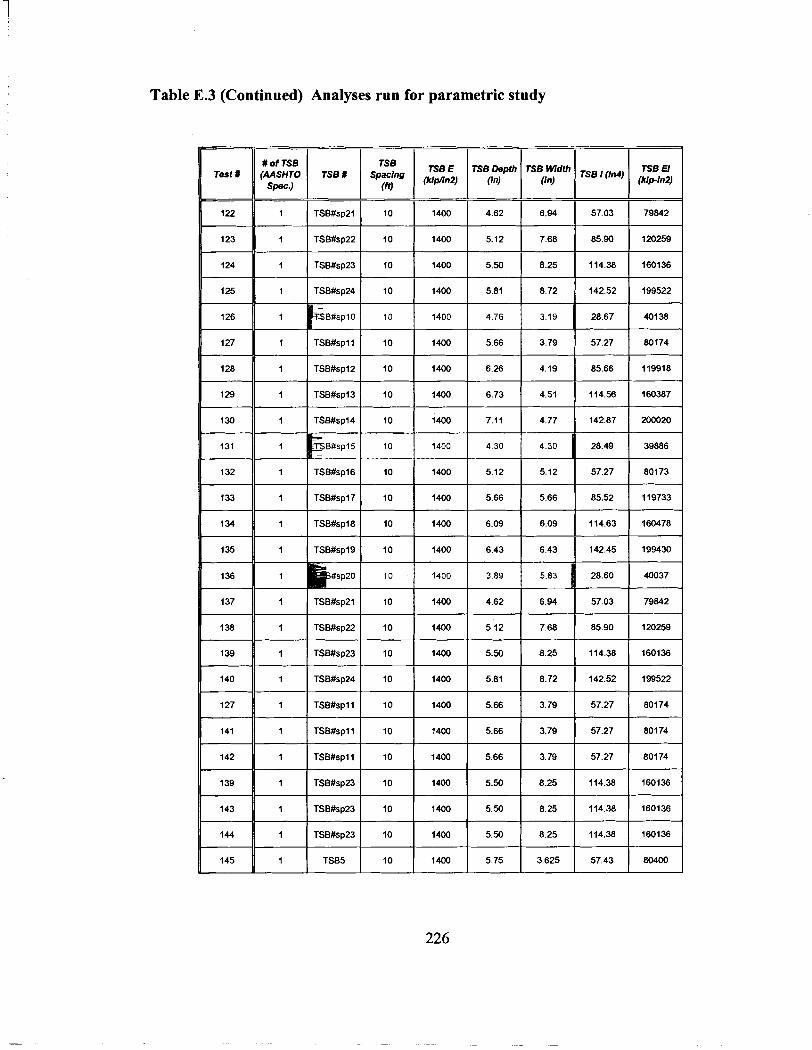
Table E.3 (Continued) Analyses run for parametric study
TSB I (ln4) #of TSB (AASHTO TSB#
Spec.)
TSB Spacing
(rg
TSB Depth (inl
TSB Width (in)
TSB El (kipin2)
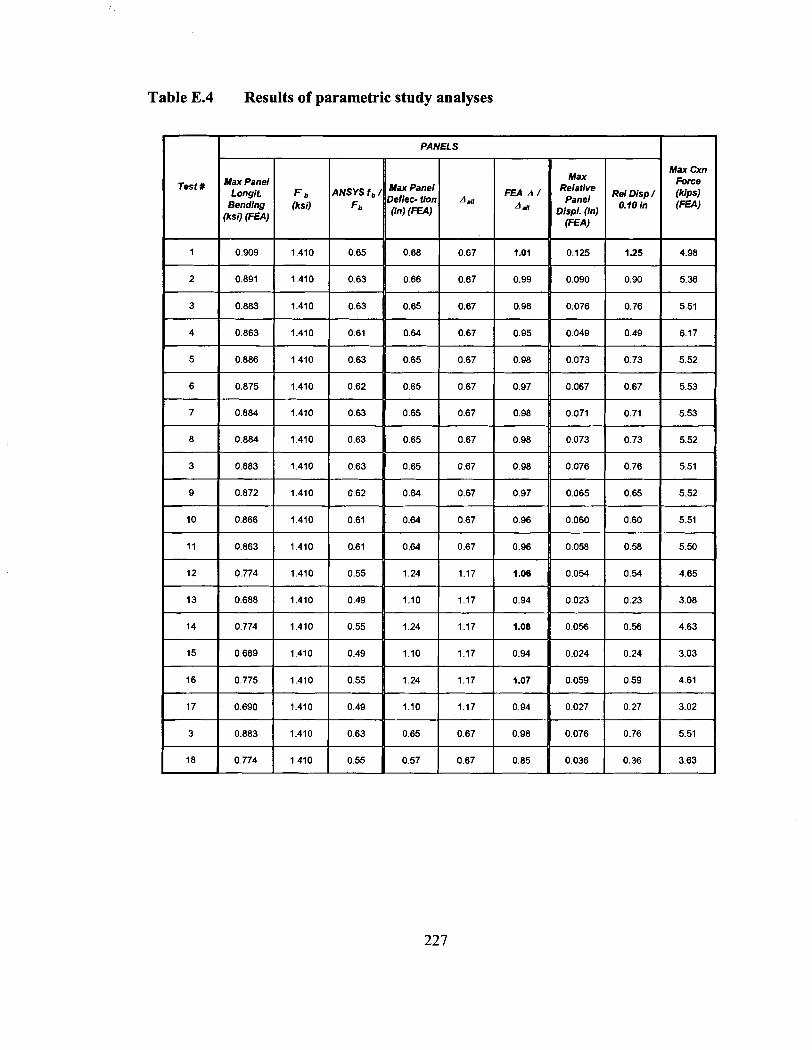
Table E.4 Results of parametric study analyses
I I PANELS
Max I Max Cxn Force (kips) ( F a )
Relative Disp O.1Oin
Displ. (in)
FEA A /
A JI
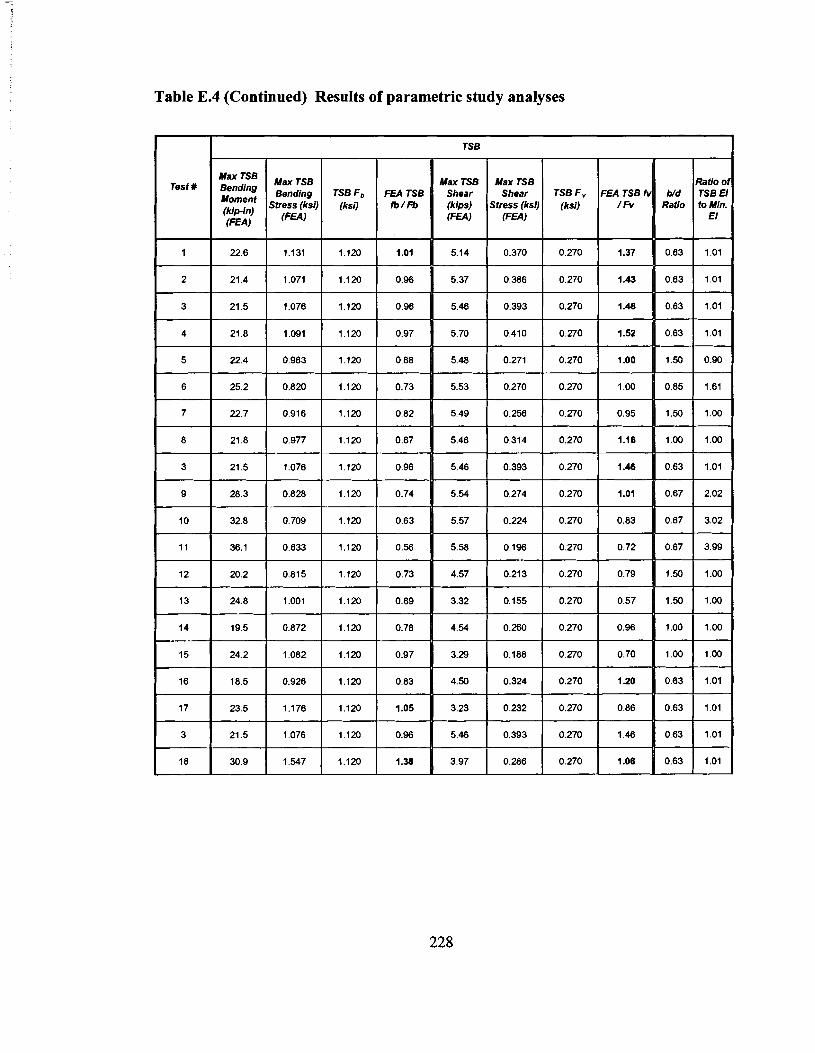
Table E.4 (Continued) Results of parametric study analyses
TSB
Test # Max TSB Max TSB Shear Shear TSB F , (kips) Stress (ksll (ksl) ( F a ) ( F a )
Ratio o b'd 1 TSB El FEA TSB 1
/Fv Ratio to Min. I
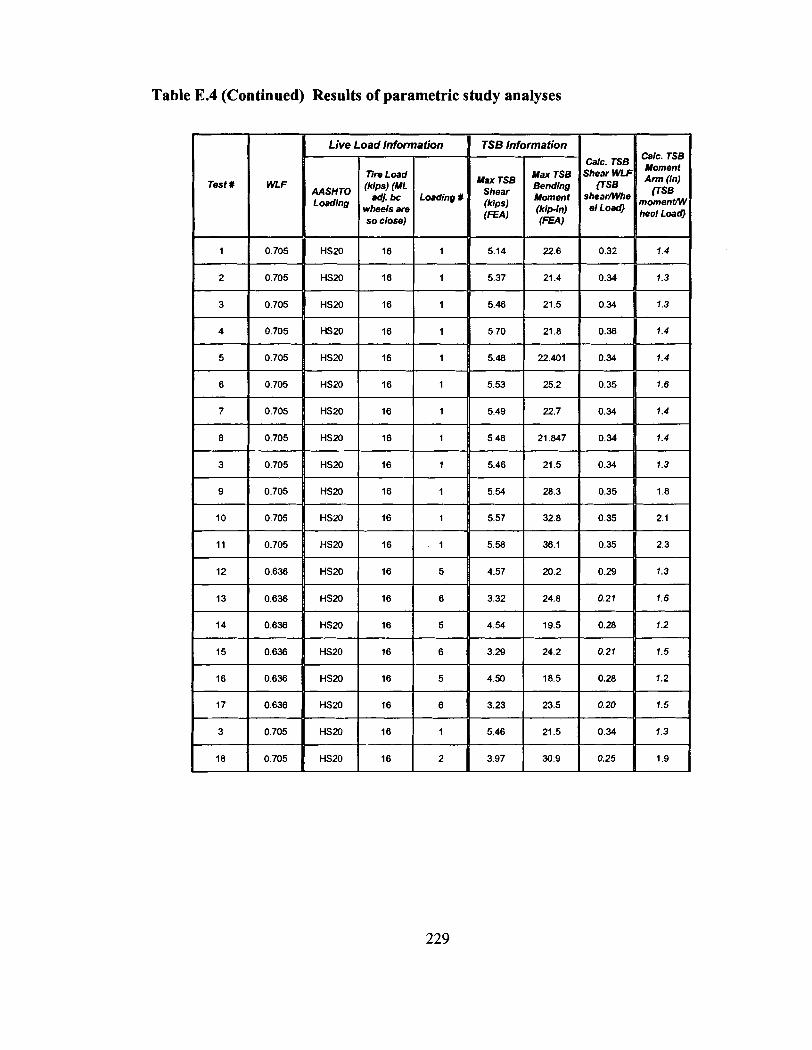
Table E.4 (Continued) Results of parametric study analyses
Live Load lnformation
nre Load
wheels are so close)
TSB lnformation I Calc. TSE Moment Arm (in)
lrSB momenVl heel Load
Calc. TSB Max TSB Shear
Moment shearme (kipin) el Load)
21.4 0.34
21.5
Max TSB Shear (kips) FEA) *
HSZO
HS20 16 1
HSZO 16 1
HS20 16 1
HS20 16 1
HSZO 16 1
HSZO 16 . 1
HS20 16 5
HS20 16 6

Table E.4 (Continued) Results of parametric study analyses
PANELS
Max Cxn Max Force
Re"tive Re1 Disp / (kips) Panel Displ. 0.10 In ( F W
FEA) (ksi) (FEA)
Wax Panel FEA D / Ienec- tion A& Da,, (in) (-1
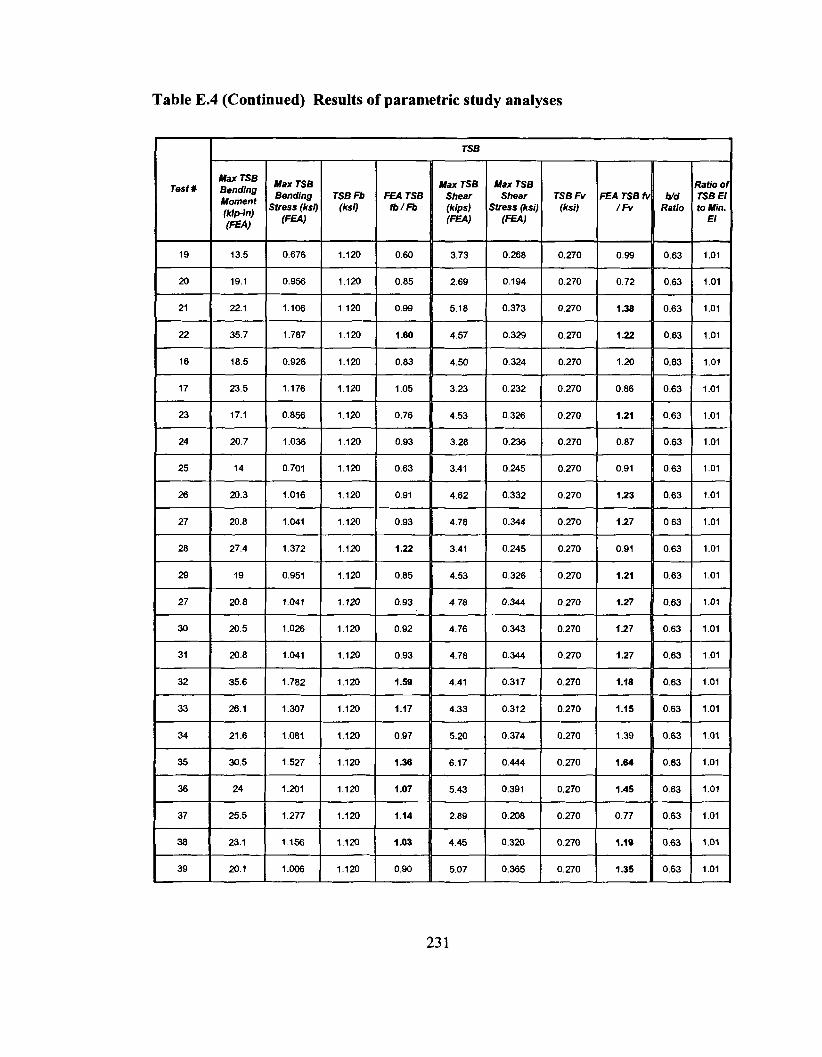
Table E.4 (Continued) Results of parametric study analyses
TSB
Max TSB Max TSB Shear Shear TSB Fv FEA TSB f (kips) Siress (ksi) (ksi) /Fv ( F W ( F a )
Ratio o tJd TSB EI
Ratio to Min. El
Max TsB Max TSB Bending TSB Fb FEA TSB
S ( h i ) 1 f i lm (FEA) (Fa)
Test #

Table E.4 (Continued) Results of parametric study analyses
Live Load lnformation - TSB lnformation
I Calc. TSB Moment A m (in)
iTSB momentN heei Load
Calc. TSB Shear WU
iTSB shearNYhe
el Loaa
1 Tire Load I Max TSB M$z Bending Moment (kips) (kipln)
(FEA)
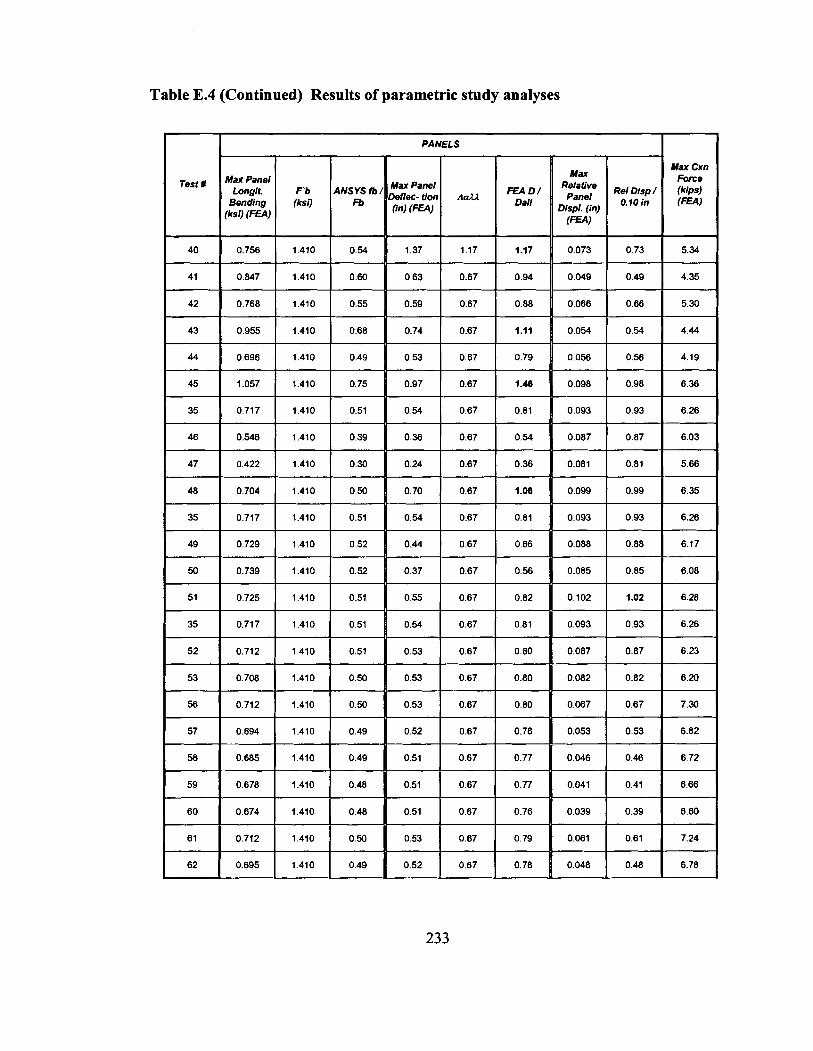
Table E.4 (Continued) Results of parametric study analyses
L
I I I PANELS
Max Cxn Max Force
Re1 Disp / (kips) 0.10in ( F W Displ. (in)
(=A)

Table E.4 (Continued) Results of parametric study analyses
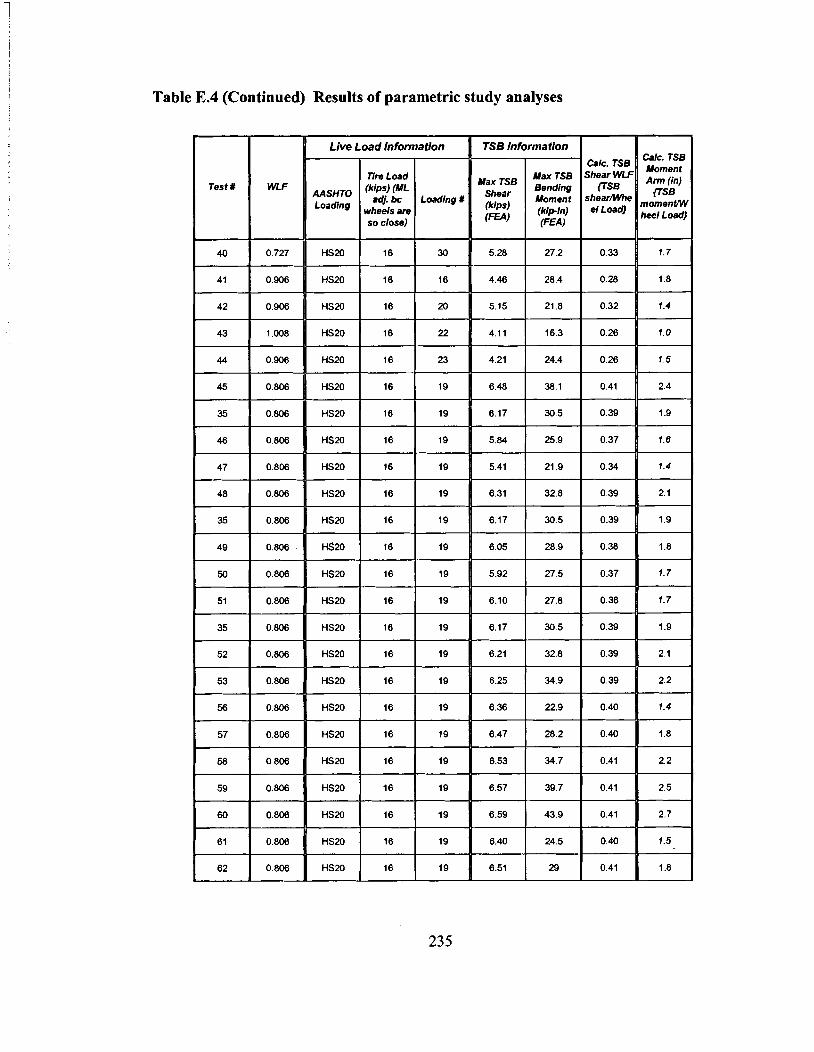
Table E.4 (Continued) Results of parametric study analyses
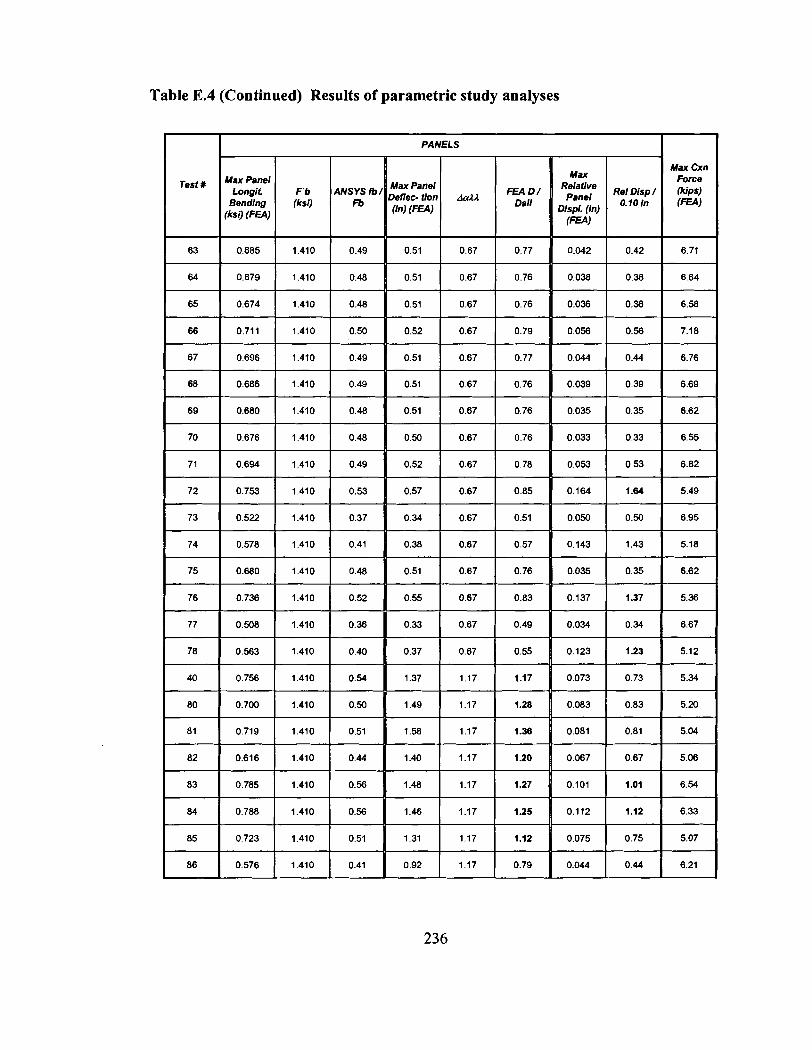
Table E.4 (Continued) Results of parametric study analyses
I I PANELS
-l--r- Max Cxn Force (kips) ( F a )
Max
R$z Re1 Disp / Dlspl. (In)
0.10 h
Uax Panel FEA D / kflec- Uon A d A Dall (in) (FEA)
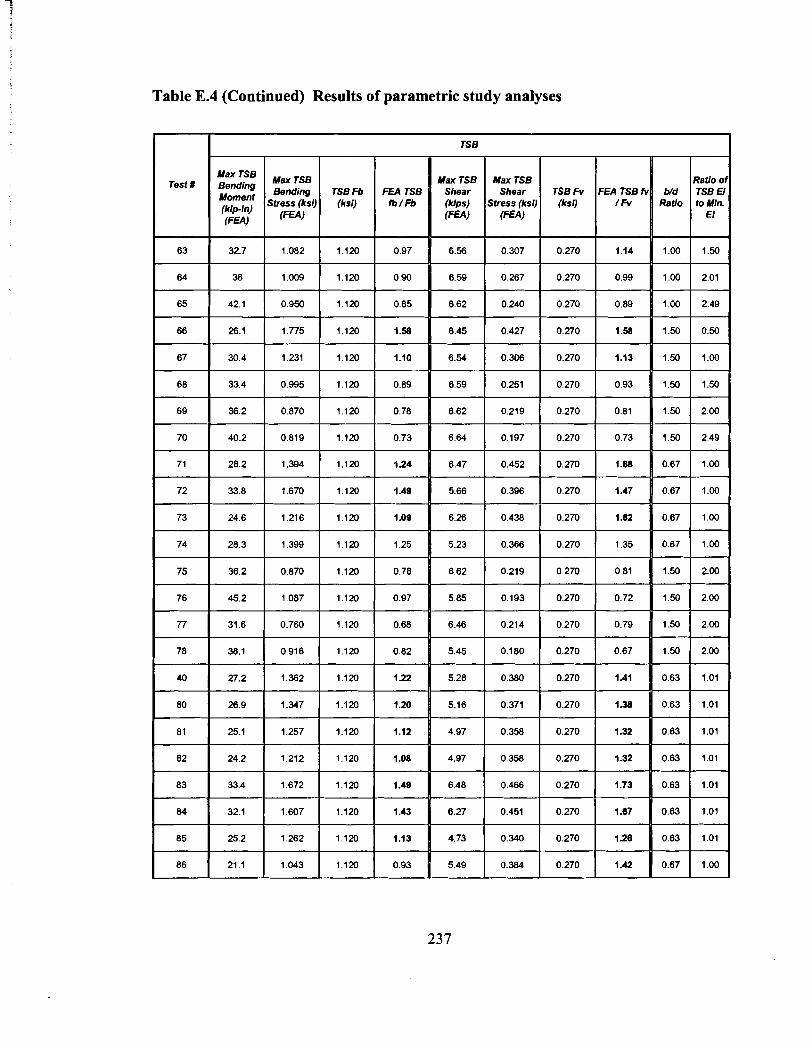
Table E.4 (Continued) Results of parametric study
I I
analyses
TSB
I FEA TSB fi
/Fv b/d
Ratio
1.00
Max TSB Max TSB Shear Shear (kips) Stress (ksi, ( F W ( F E 4
Ratio a TSB E to Min
El
- 1.50
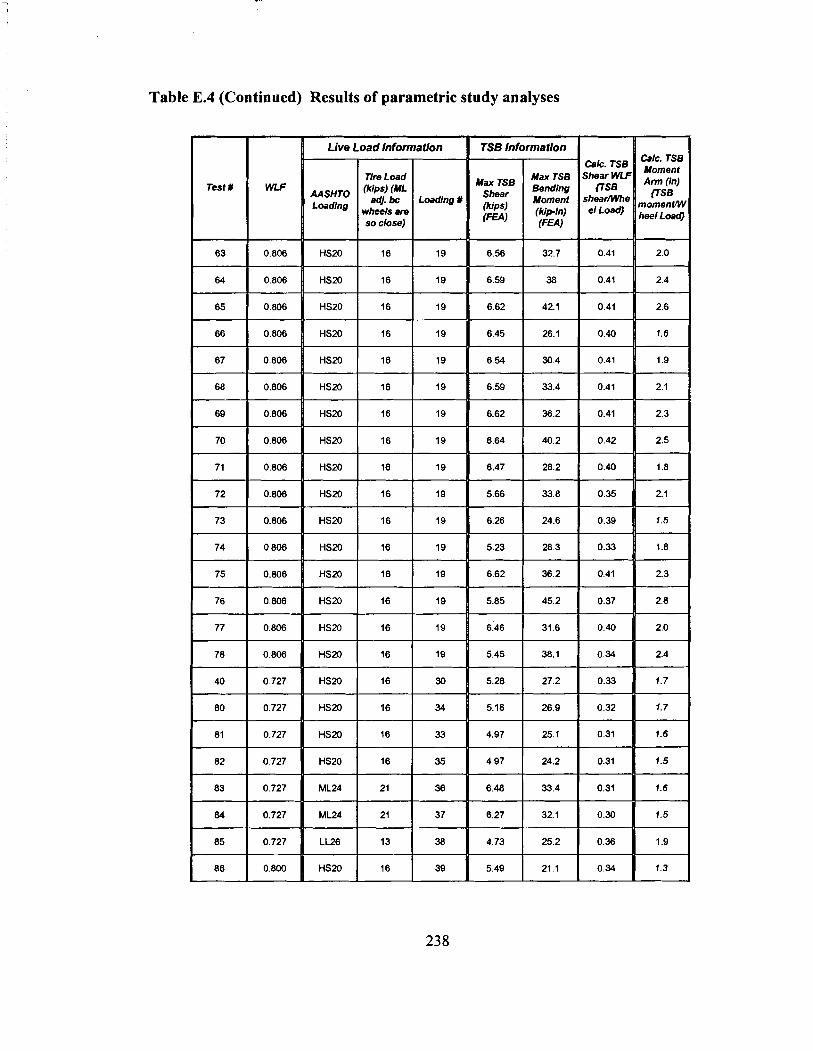
Table E.4 (Continued) Results of parametric study analyses
Live Load Information TSB Information I I Calc. TSfi
Moment Arm (in)
rzSB nomen6V heel Load
Calc. TSB Shear WLI
rzSB shearme el Load)
Tire Load Max TSB
M s H T o fkips) fML Bending adJ. bc Loading # Moment
wheels are (kipln) so close) fFEA) (FEA)
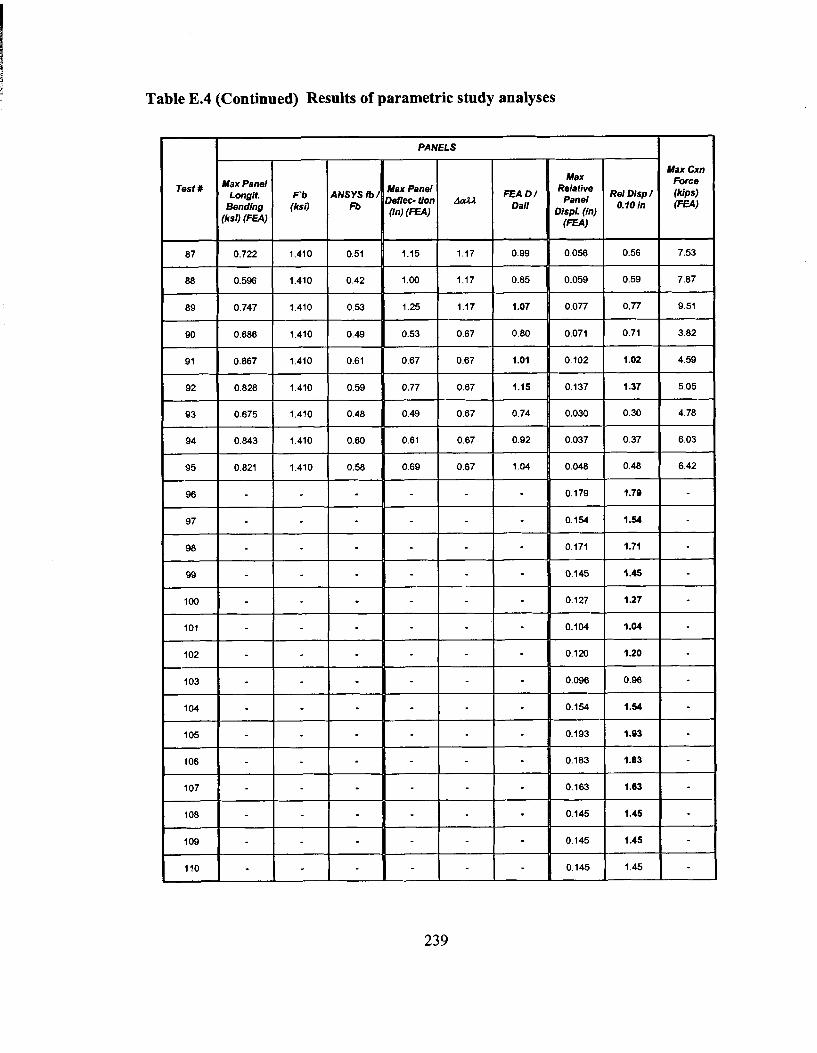
Table E.4 (Continued) Results of parametric study analyses
I I PANELS
FEA DI Dall
Max I Relative Dls,, ,
0.10 in %pl. (in)
(FEA)
Max Cxn Fome (kips) ( F W

Table E.4 (Continued) Results of parametric study analyses
TSB
Max lSB Max TSB Bending Bending TSB Fb FEA TSB
stress (ksi) (ksi) fb / f i (kipin)
(m) ( F a )
FEA TSB 1 /Fv
1.76
Ratio oi Wd TSB N
Max TSB Shear (kips) IF=)
Stress (ksl) (ksi) 1 ( F a ) I

Table E.4 (Continued) Results of parametric study analyses
TSB Information - Max TSB
M g r Bending Moment (kips) (kipin)
(FEA)
Calc. TSB Shear WLf
m a shearmhe
el LoadJ
Calc. TSB Moment A m (In)
momenW heel LoadJ

Table E.4 (Continued) Results of parametric study analyses
I I PANELS I
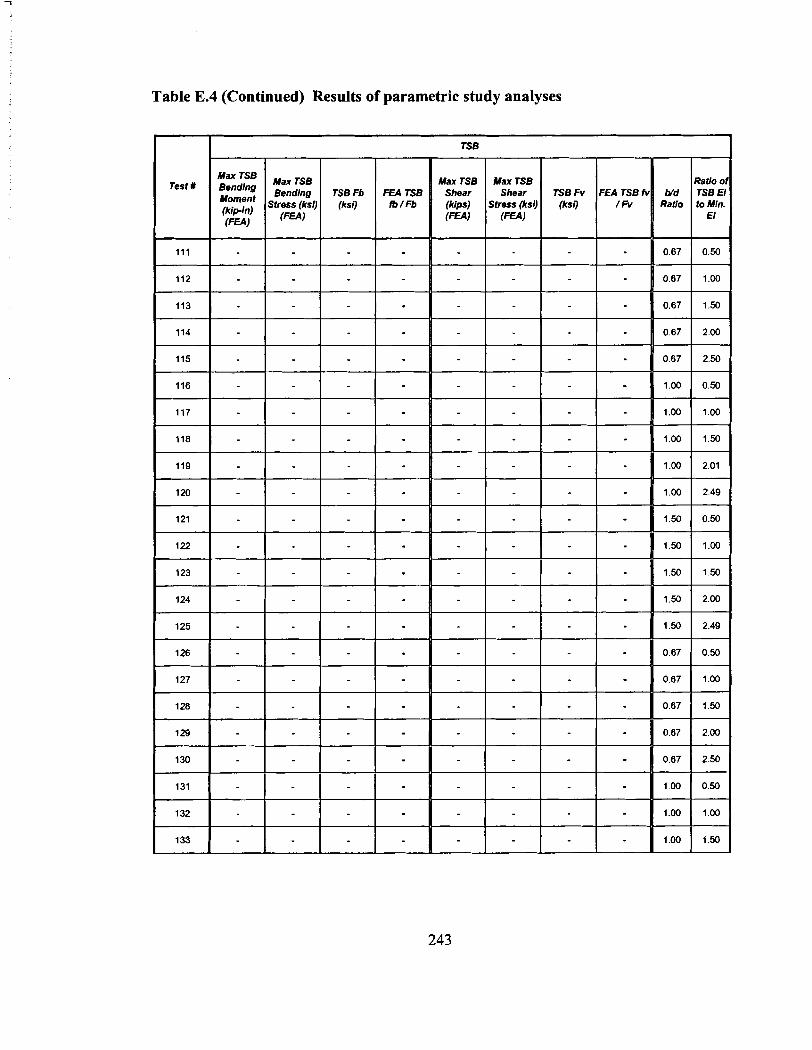
Table E.4 (Continued) Results of parametric study analyses
Test # Max Max TSB
Bending TSB Fb FEA TSB stress (ksl) (ksi) fb / ~b (kipln)
( F W ( F W
Ratio o d TSB N
Ratio to Min.
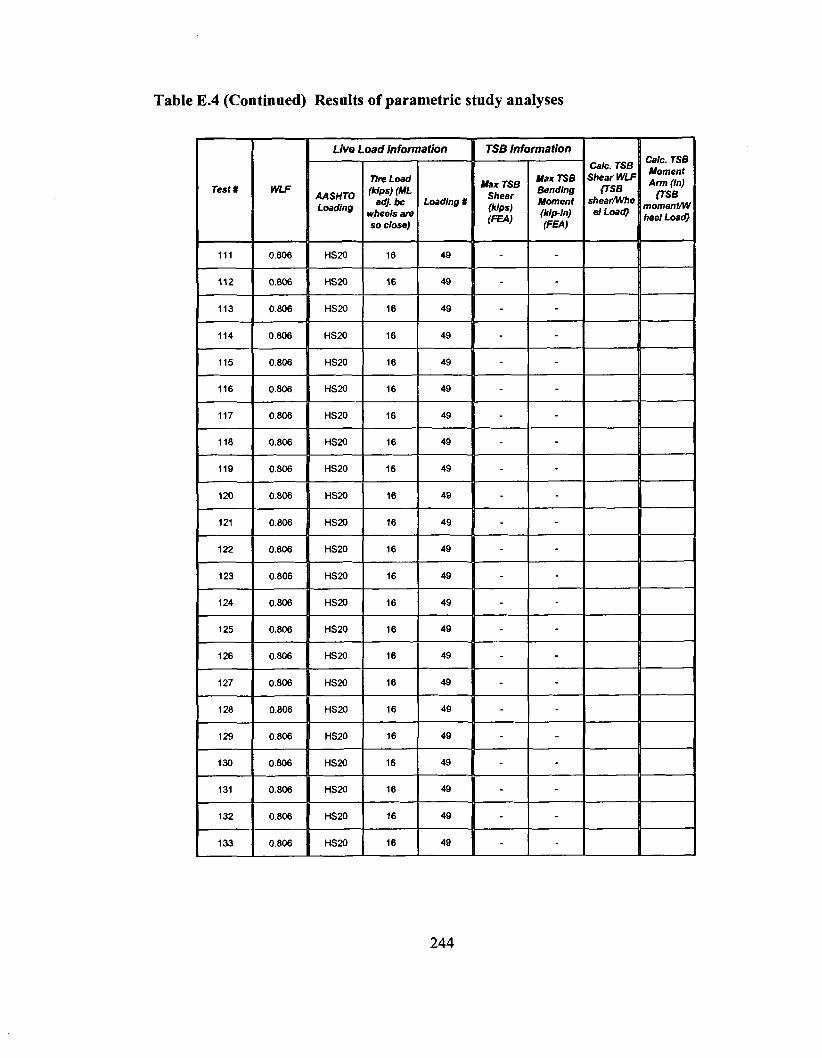
Table E.4 (Continued) Results of parametric study analyses
Live Load Information
HS20
HS20
HSM

Table E.4 (Continued) Results of parametric study analyses
I PANELS
Max Cxn Max Force
Re'ative Re1 Disp / (kips) Pane' 0.10 in ( F W
Displ. (in) ( F W
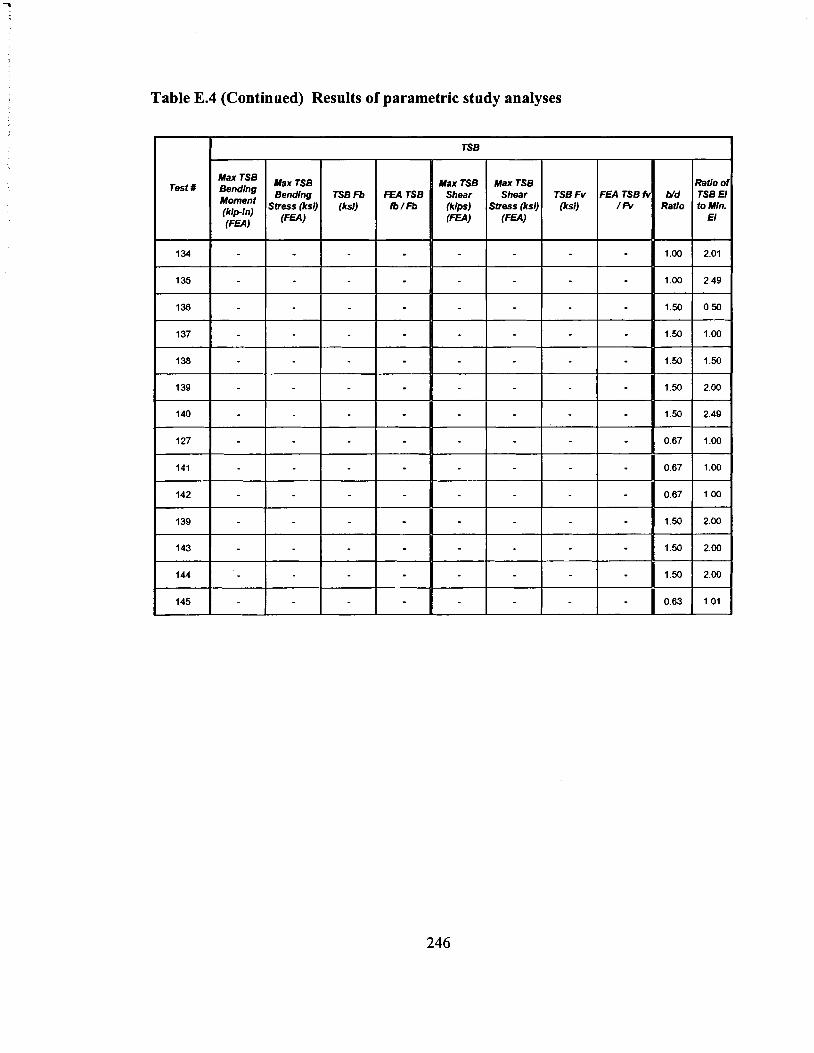
Table E.4 (Continued) Results of parametric study analyses
TSBFb FEATSB (ksl) tb / I%
TSB
Max TSB Max TSB Shear Shear TSB Fv FEA TSB fi (kips) Stress (ksij (ksi) /Fv ( F W ( F W
Ratio of
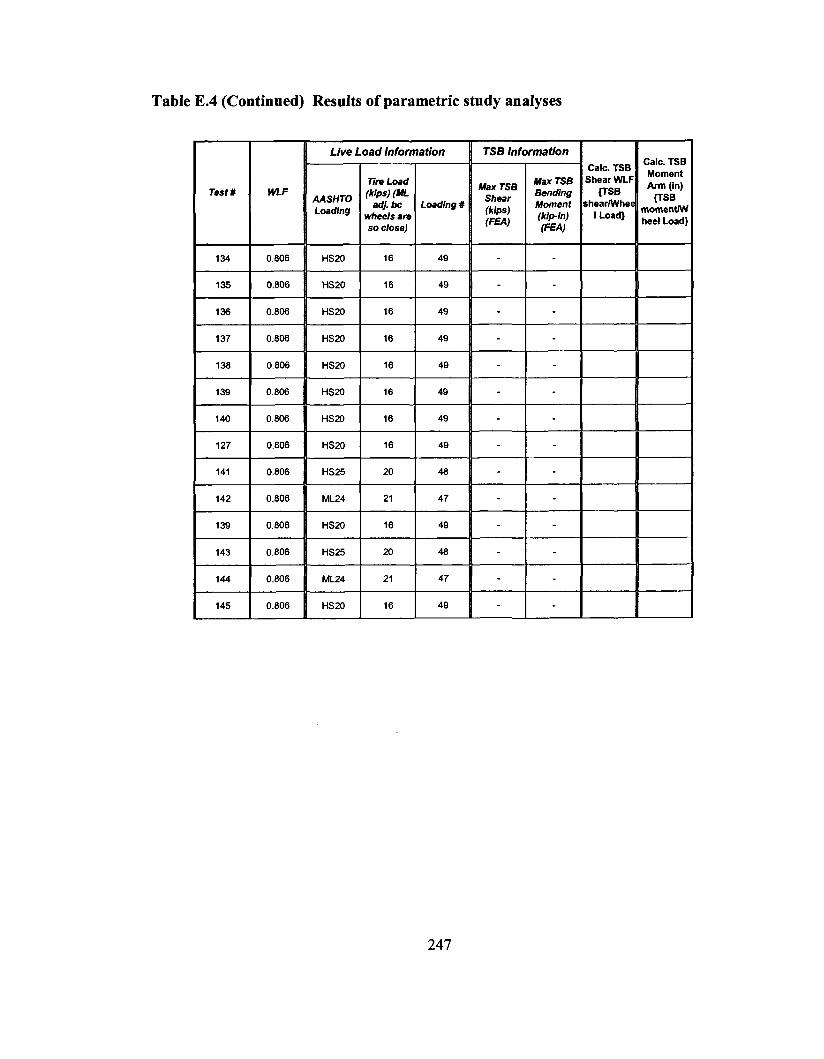
Table E.4 (Continued) Results of parametric study analyses
Live Load Information
I 7ire Load I AASHTo fk'ps) fML I ad,. h ( Loading # Loading wheels are I so close) I
Calc. TSB ~a TSB Shear WLl Bendhg U S 0 Shear Moment shearMlha (klpln) I Load) b-4 (m)
Calc. TSB Moment Arm (in) Use
momenW heel Load]

BIOGRAPHY OF THE AUTHOR
Melanie Bragdon was born in Bangor, Maine, on June 17, 1973. She was raised
in Bangor and graduated fiom Bangor Christian High School in 1991. She attended the
University of Maine and graduated in 1995 with a Bachelor's degree in Civil
Engineering. She entered the Civil Engineering graduate program at the University of
Maine in the summer of 2000.
After receiving her degree, Melanie will be joining Florida Power and Light and
beginning her career in structural engineering. Melanie is a candidate for the Master of
Science degree in Civil Engineering fiom The University of Maine in December, 2002.
Copyright © 2022 FDOKUMEN