Deflection behaviour of FRP reinforced concrete beams and slabs: An experimental investigation
10
Deflection behaviour of FRP reinforced concrete beams and slabs: An experimental investigation Raed Al-Sunna a , Kypros Pilakoutas a , Iman Hajirasouliha b,⇑ , Maurizio Guadagnini a a Department of Civil & Structural Engineering, The University of Sheffield, Sheffield, UK b Department of Civil Engineering, The University of Nottingham, Nottingham, UK article info Article history: Received 11 June 2011 Received in revised form 25 February 2012 Accepted 10 March 2012 Available online 19 March 2012 Keywords: A. Carbon fibre A. Glass fibre C. Analytical modelling D. Mechanical testing Deformation behaviour abstract The flexural response of FRP RC elements is investigated through load–deflection tests on 24 RC beams and slabs with glass FRP (GFRP) and carbon FRP (CFRP) reinforcement covering a wide range of reinforce- ment ratios. Rebar and concrete strains around a crack inducer are used to establish moment–curvature relationships and evaluate the shear and flexural components of mid-span deflections. It is concluded that the contribution of shear and bond induced deformations can be of major significance in FRP RC ele- ments having moderate to high reinforcement ratios. Existing equations to calculate short-term deflec- tion of FRP RC elements are discussed and compared to experimental values. Ó 2012 Elsevier Ltd. All rights reserved. 1. Introduction FRP reinforcement for concrete has been developed to replace steel in special applications, particularly in corrosion-prone RC structures. Under similar conditions, in terms of concrete strength, applied loading, member dimensions and area of reinforcement, FRP RC members are expected to develop larger deformations than steel reinforced members [1]. This can be mainly attributed to the lower modulus of elasticity of the FRP rebars, but also to their un- ique bond characteristics. As a result, the design of FRP RC elements is often governed by the serviceability limit state [2]. Accurate calculation of service deflections can be done through integration of curvatures [3,4] and making allowance for shear and bond deformations. However, such calculations are time con- suming and not suitable for design. It is therefore important to develop simplified design methods to evaluate the deflection of RC elements with an acceptable accuracy. The implementation of simple elastic analysis models, along with the use of an effective moment of inertia to describe the reduced stiffness of a cracked element, has proven effective in determining service deflections of steel reinforced concrete elements and has also been adopted for FRP reinforced concrete elements. ACI 440.1R-06 [5], for example, has adopted a modified form of the effective moment of inertia equation included in ACI 318 [6] and originally developed by Branson [7]. Although a similar model is also discussed in the design manual published by ISIS Canada [8], the use of an equation derived by implementing the tension stiffening effect included in Model Code 90 [3] is proposed as a more reliable model for con- crete elements reinforced with different types of FRP reinforce- ments. The tension stiffening model of Model Code 90 also underlies the method recommended in Eurocode 2 [9] to estimate service deflections for steel RC elements, and was shown to lead to acceptable results also for FRP RC elements [4]. CAN/CSA-S806 [10] recommends determining deflections by integration of curvatures along the span, but ignores the tension stiffening effect provided by the FRP reinforcement. Instead it proposes the use of a gross and cracked moment of inertia to represent the stiffness of un- cracked and cracked portions of the element, respectively. Although the code approaches for the prediction of short-term deflection account for a reduced flexural stiffness of the element due to cracking [11], this effective stiffness is treated as a global parameter and cannot capture the effect of localized cracking. As a result, the deflection derived using only cracked moment of iner- tia is expected to provide an upper bound limit for short-term deflections. However, tests on beams and slabs [12–14] show that deflections tend to exceed this upper bound even at relatively low load levels. Shrinkage related phenomena have also been shown to affect the deformation behaviour of an RC element to a certain extent [15]. Depending on the level of shrinkage, the tensile restraining forces imposed by the bonded reinforcement can cause the development of tensile strain in the surrounding concrete, and shrinkage-induced curvatures can develop as a result of the eccentricity of these 1359-8368/$ - see front matter Ó 2012 Elsevier Ltd. All rights reserved. http://dx.doi.org/10.1016/j.compositesb.2012.03.007 ⇑ Corresponding author. E-mail address: [email protected] (I. Hajirasouliha). Composites: Part B 43 (2012) 2125–2134 Contents lists available at SciVerse ScienceDirect Composites: Part B journal homepage: www.elsevier.com/locate/compositesb
-
Upload
independent -
Category
Documents
-
view
6 -
download
0
Transcript of Deflection behaviour of FRP reinforced concrete beams and slabs: An experimental investigation
Composites: Part B 43 (2012) 2125–2134
Contents lists available at SciVerse ScienceDirect
Composites: Part B
journal homepage: www.elsevier .com/locate /composi tesb
Deflection behaviour of FRP reinforced concrete beams and slabs: Anexperimental investigation
Raed Al-Sunna a, Kypros Pilakoutas a, Iman Hajirasouliha b,⇑, Maurizio Guadagnini a
a Department of Civil & Structural Engineering, The University of Sheffield, Sheffield, UKb Department of Civil Engineering, The University of Nottingham, Nottingham, UK
a r t i c l e i n f o
Article history:Received 11 June 2011Received in revised form 25 February 2012Accepted 10 March 2012Available online 19 March 2012
Keywords:A. Carbon fibreA. Glass fibreC. Analytical modellingD. Mechanical testingDeformation behaviour
1359-8368/$ - see front matter � 2012 Elsevier Ltd. Ahttp://dx.doi.org/10.1016/j.compositesb.2012.03.007
⇑ Corresponding author.E-mail address: [email protected]
a b s t r a c t
The flexural response of FRP RC elements is investigated through load–deflection tests on 24 RC beamsand slabs with glass FRP (GFRP) and carbon FRP (CFRP) reinforcement covering a wide range of reinforce-ment ratios. Rebar and concrete strains around a crack inducer are used to establish moment–curvaturerelationships and evaluate the shear and flexural components of mid-span deflections. It is concludedthat the contribution of shear and bond induced deformations can be of major significance in FRP RC ele-ments having moderate to high reinforcement ratios. Existing equations to calculate short-term deflec-tion of FRP RC elements are discussed and compared to experimental values.
� 2012 Elsevier Ltd. All rights reserved.
1. Introduction
FRP reinforcement for concrete has been developed to replacesteel in special applications, particularly in corrosion-prone RCstructures. Under similar conditions, in terms of concrete strength,applied loading, member dimensions and area of reinforcement,FRP RC members are expected to develop larger deformations thansteel reinforced members [1]. This can be mainly attributed to thelower modulus of elasticity of the FRP rebars, but also to their un-ique bond characteristics. As a result, the design of FRP RCelements is often governed by the serviceability limit state [2].Accurate calculation of service deflections can be done throughintegration of curvatures [3,4] and making allowance for shearand bond deformations. However, such calculations are time con-suming and not suitable for design. It is therefore important todevelop simplified design methods to evaluate the deflection ofRC elements with an acceptable accuracy. The implementation ofsimple elastic analysis models, along with the use of an effectivemoment of inertia to describe the reduced stiffness of a crackedelement, has proven effective in determining service deflectionsof steel reinforced concrete elements and has also been adoptedfor FRP reinforced concrete elements. ACI 440.1R-06 [5], forexample, has adopted a modified form of the effective momentof inertia equation included in ACI 318 [6] and originally developedby Branson [7]. Although a similar model is also discussed in the
ll rights reserved.
(I. Hajirasouliha).
design manual published by ISIS Canada [8], the use of an equationderived by implementing the tension stiffening effect included inModel Code 90 [3] is proposed as a more reliable model for con-crete elements reinforced with different types of FRP reinforce-ments. The tension stiffening model of Model Code 90 alsounderlies the method recommended in Eurocode 2 [9] to estimateservice deflections for steel RC elements, and was shown to lead toacceptable results also for FRP RC elements [4]. CAN/CSA-S806 [10]recommends determining deflections by integration of curvaturesalong the span, but ignores the tension stiffening effect providedby the FRP reinforcement. Instead it proposes the use of a grossand cracked moment of inertia to represent the stiffness of un-cracked and cracked portions of the element, respectively.
Although the code approaches for the prediction of short-termdeflection account for a reduced flexural stiffness of the elementdue to cracking [11], this effective stiffness is treated as a globalparameter and cannot capture the effect of localized cracking. Asa result, the deflection derived using only cracked moment of iner-tia is expected to provide an upper bound limit for short-termdeflections. However, tests on beams and slabs [12–14] show thatdeflections tend to exceed this upper bound even at relatively lowload levels.
Shrinkage related phenomena have also been shown to affect thedeformation behaviour of an RC element to a certain extent [15].Depending on the level of shrinkage, the tensile restraining forcesimposed by the bonded reinforcement can cause the developmentof tensile strain in the surrounding concrete, and shrinkage-inducedcurvatures can develop as a result of the eccentricity of these
2126 R. Al-Sunna et al. / Composites: Part B 43 (2012) 2125–2134
restraining forces. Shrinkage induced curvatures mainly developprior to the test. The presence of an initial non-zero state of strainin the concrete can result in a reduction of the imposed moment re-quired to cause cracking. Shrinkage, if significant, could also affectthe flexural deformations during loading tests. However, even byadopting the shifting of cracked moment of inertia approach byBischoff and Johnson [15], some of the additional deflections mea-sured in the tests cannot be justified [16]. Furthermore, the authorsbelieve that the pre-compression effect from shrinkage on the barwill not affect the cracked stiffness, and therefore, will not greatlyinfluence the overall load-deformation behaviour after cracking.
Materials and geometrical nonlinearity, along with the degrada-tion of the sectional composite behaviour, also contribute to in-crease the total deformation of an RC element, and their effect isparticularly significant at high load levels. The plane sections re-main plain assumption of section analysis is considered true forflexural elements at the macro scale, but it does not necessarily ap-ply in the regions around the crack. This may be amplified in thecase of FRP RC since the neutral-axes depth can be very small.However, results from lightly steel reinforced concrete elementsshow that there are no significant additional deformations at leastup to the point of yielding [16].
Mota et al. [17] and Rafai and Nadjai [18] examined severalexisting deflection models for FRP RC beams and slabs and con-cluded that their performance is highly dependent on the accuracyof the calculated cracking moment. The results of their study indi-cate that there is a critical need for reliability analysis of FRP codeequations to develop more accurate load–deflection formulas forFRP RC members.
Despite extensive research on the behaviour of FRP RC mem-bers, less research has been conducted on deflection prediction ofFRP RC elements considering the effects of different stress levelsand reinforcement ratio (for example [19,20]). To examine these,an experimental study was undertaken to investigate the deflec-tion behaviour of FRP RC concrete beams and slabs at service abil-ity and ultimate load levels. The experimental programmecomprised twelve beams and twelve slabs with glass FRP (GFRP)and carbon FRP (CFRP) with a wide range of reinforcement ratios.The experimentally determined deflections are used to examinethe accuracy of the predictive models discussed above and pre-sented in detail in the following sections.
2. Deflection prediction of FRP RC elements
To calculate short-term deflections of FRP RC beams, ACI440.1R-03 [21] adopted the following expression for effective mo-ment of inertia (Ie), which accounts for the lower FRP modulus ofelasticity (Ef) and different FRP bond characteristics.
Ie ¼ Icr þ ðbdIg � IcrÞMcr
Ma
� �3
6 Ie ð1Þ
Table 1Tensile properties of GFRP and CFRP rebars.
Rebartype
Nominal diameter(mm)
Manufacturer modulus ofelasticity (MPa)
Test modulus o(MPa)
GFRP 6.35 40800 389009.53 40800 42800
12.7 40800 4160019.05 40800 42000
CFRP 6.35 120000 1330009.53 123000 132000
12.7 112000 119000
bd ¼ abEf
Esþ 1
� �ð2Þ
where Ig and Icr are the gross and cracked moment of inertia; Mcr
and Ma are the cracking and applied moment; Ef and Es are theFRP and steel modulus of elasticity respectively; and ab is a bonddependent coefficient, which equals 0.5 for steel rebars. In the ab-sence of more research data, a value of 0.5 has been recommendedfor all FRP rebar types. ACI 440.1R-06 [5] abandons the reliance of bd
on bond, and takes bd as proportional to the ratio of reinforcementratio (qf) to the balanced reinforcement ratio (qfb).
bd ¼15
qf
qfb
!ð3Þ
Using the balanced reinforcement ratio (qfb) in this equation im-plies that deflection depends on the ultimate tensile stress of theFRP reinforcement.
After cracking, the composite action between the concrete andFRP rebars may not be as perfect as it is usually assumed [7,12].In addition, shrinkage and the non-linear behaviour of concretein the compression zone can affect the stiffness of an RC element[15]. To address this issue, a possible approach is to provide a tran-sition between Ig and a certain fraction of Icr in the calculation of Ie.Such an equation was proposed by Benmokrane et al. [12], but wascalibrated using a limited number of tests .
Ie ¼ a0Icr þIg
b0� a0Icr
� �Mcr
Ma
� �3
ð4Þ
where a0 and b0 are equal to 0.84 and 7, respectively. Naturally, thisequation offers more flexibility compared to the current ACI440.1R-06 [5] equation. The factor a0 can reflect the reduced com-posite action between the concrete and FRP rebars. The factor b0
was introduced in the equation to enable a faster transition fromIg to Icr, since the degradation in stiffness due to the 3rd power com-ponent was considered to be too low.
Bischoff [7] and Bischoff and Scanlon [22] analyzed extensivelythe ACI 318 [6] expression for Ie from a tension-stiffening stand-point. The results of their studies indicate that the ACI 318 [6] pro-posed method is not suitable for GFRP RC. The following equationwas proposed for Ie, which is analogous to the equation that can bededuced by implementing the provisions of CEB-FIP Model Code 90[3] to determine instantaneous curvatures or deflections. Thisequation is claimed to be equally applicable for FRP and steel RCbeams.
Ie ¼Icr
1� g McrMa
� �2 6 Ig ; and g ¼ 1� Icr
Igð5Þ
To predict the deformation of RC beam elements, Eurocode 2 [9]tries to account for the tension stiffening effect based on the CEB-FIP Model Code 90 [3] approach. Based on Eurocode 2 [8], the
f elasticity Manufacturer guaranteed tensilestrength (MPa)
Test tensile strength,(MPa)
Average Standarddeviation
830 600 70760 665 35690 620 40620 670 10
1450 1450 401380 1320 1701230 1475 60
250 steel stirrups,
Ø8mm/75mm
2Ø6mm
25mm clearmain rebars
150
Section A-A
main rebars
767
230025
0
125
2Ø6mm
125766 767
steel stirrups,Ø8mm/75mm
A
A
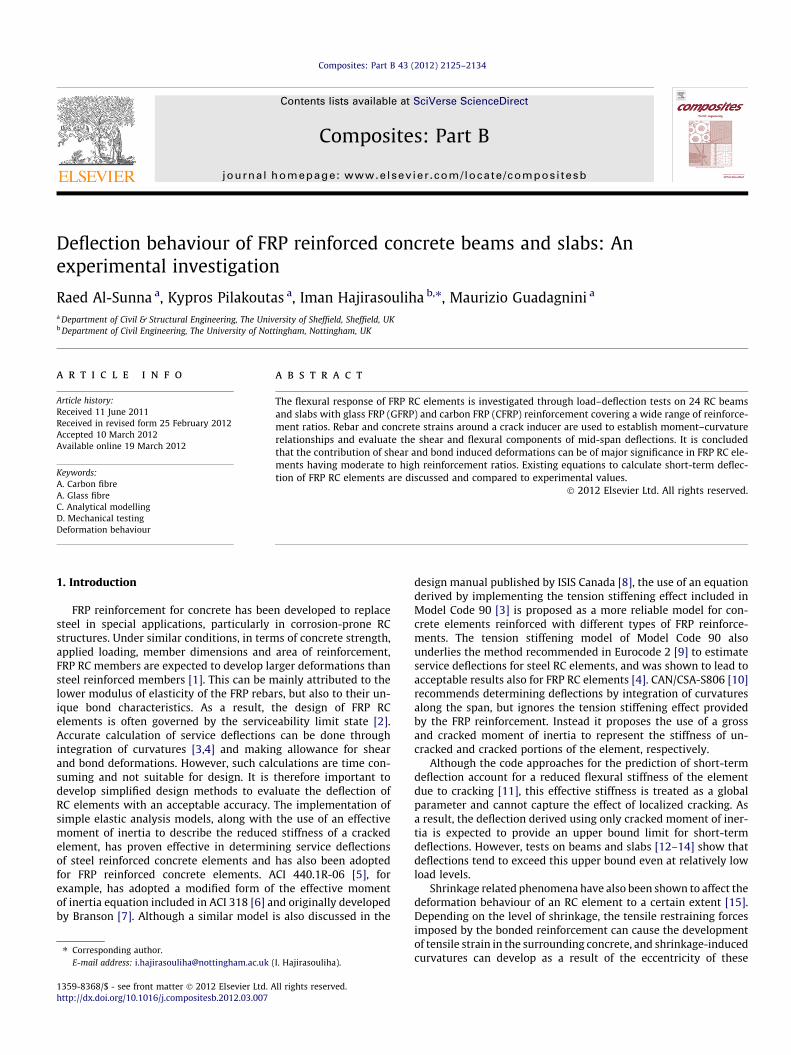
Fig. 1. Geometric and reinforcement details of the test beams.
Table 2Reinforcement details of the test beams.
Series designation Beam designation Rebar details Reinforcement ratio Type of failure
GFRP beams BG1 BG1a 2U9.53 0.0043 Rupture of rebarsBG1b
BG2 BG2a 2U12.7 0.0077 Almost balancedBG2b
BG3 BG3a 4U19.05a 0.0391 Concrete crushingBG3b
CFRP beams BC1 BC1a 3U6.35 0.0029 Rupture of rebarsBC1b
BC2 BC2a 3U9.53 0.0065 Almost balancedBC2b
BC3 BC3a 3U12.7 0.0116 Concrete crushingBC3b
Steel beams BS BSa 2U12 0.0069 Yielding of reinforcementBSb
a Two layers, with 25 mm clear spacing between them.
Transverse rebars
500
25mm cover to main rebars
120
Section A-A
750600 125125
120
2100
750
A
ATransverse rebars
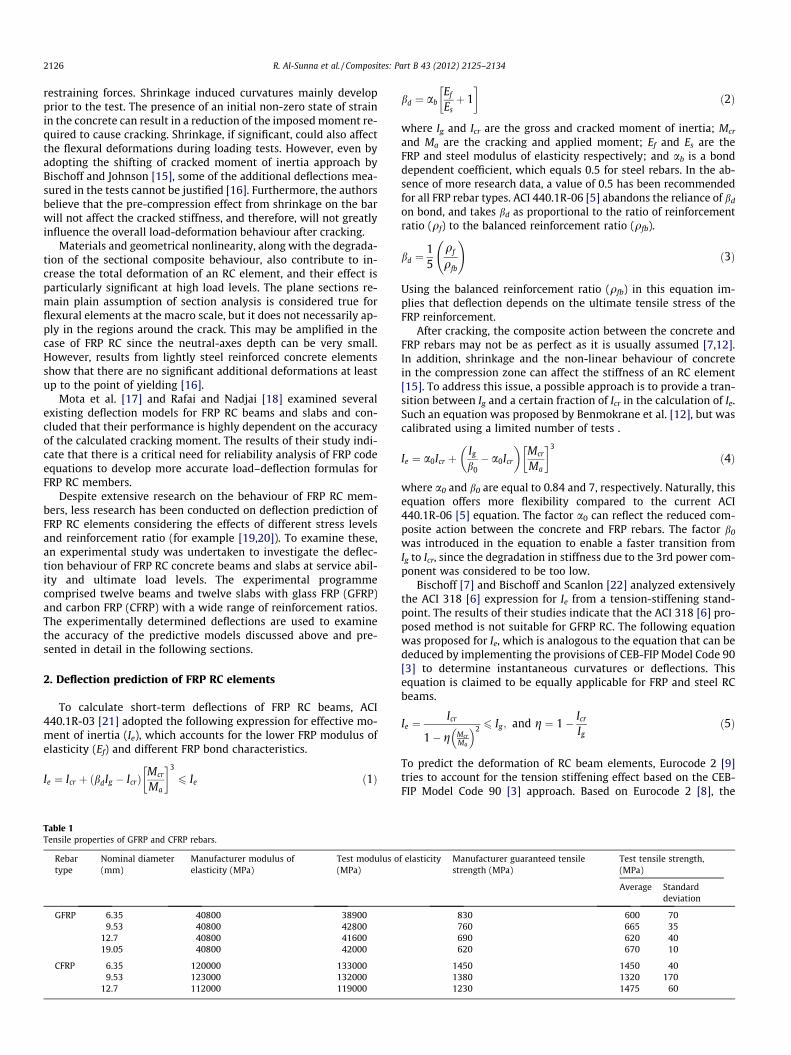
Fig. 2. Geometric and reinforcement details of the test slabs.
R. Al-Sunna et al. / Composites: Part B 43 (2012) 2125–2134 2127

Table 3Reinforcement details of the test slabs.
Series designation Slab designation Cover (mm) Main rebar Transverse rebar Reinforcement ratio Type of failure
GFRP slabs SG1 SG1a 27.5 5U6.35 7U9.53 /m 0.0035 Rupture of rebarsSG1b 27.5
SG2 SG2a 31 5U9.53 7U9.53 /m 0.0079 Almost balancedSG2b 31
SG3 SG3a 40 5U19.05 7U9.53 /m 0.0333 Concrete crushingSG3b 40
CFRP slabs SC1 SC1a 31 4U6.35 6U6.35 /m 0.0028 Rupture of rebarsSC1b 33
SC2 SC2a 38 4U9.53 6U6.35 /m 0.0063 Almost balancedSC2b 35
SC3 SC3a 42.5 4U12.7 6U6.35 /m 0.0114 Concrete crushingSC3b 36
Steel slabs SS SSa 25 4U10 5U8 /m 0.0070 Yielding of reinforcementSSb 25
2128 R. Al-Sunna et al. / Composites: Part B 43 (2012) 2125–2134
following equation can be used to calculate the short-term deflec-tion (D).
D ¼ bMcr
Ma
� �2
Dg þ 1� bMcr
Ma
� �2 !
Dcr ð6Þ
where Dg and Dcr are the uncracked-state and cracked-state deflec-tions, respectively. The coefficient b0 is a duration or repetition ofload factor (1.0 for short-term loading and 0.5 for sustained or cyclicloading). Eq. (5) can be derived directly from Eq. (6) by using the b0
value for short-term loading.
3. Experimental programme
The experiments consisted of three series of GFRP and three ser-ies of CFRP tests on RC beams and slabs. To ensure repeatability,each series comprised two identical elements (i.e. in total 24 tests).One series of steel RC beams and slabs was also tested for compar-ison purposes.
3.1. Materials
Aslan 100 CFRP and GFRP rebars were used for the main flexuralreinforcement of the beams and slabs. The surface treatment ofthese rebars is characterized by helically over-wound fibres andsand coating. The tensile properties were obtained by testing a rep-resentative number of samples in uni-axial tension, using resinfilled steel tubes in the grips, and are shown in Table 1. Most ofthe bars failed away from the grips, so the results reflect the tensile
Table 4Mechanical properties of the concrete.
Series designation Cube compressive strength (MPa)
Average Standard deviation
GFRP beams BG1 47.7 3.56BG2 47.7 3.56BG3 46.5 0.92
CFRP beams BC1 55.4 2.86BC2 52.6 2.38BC3 51.8 2.59
Steel beams BS 52.0 1.40
GFRP slabs SG1 51.0 1.44SG2 46.2 1.55SG3 45.9 2.02
CFRP slabs SC1 50.1 2.50SC2 51.0 2.41SC3 49.8 3.95
Steel slabs SS 50.6 2.56
strength of the composite. It should be noted that the strength ofthe larger diameter GRFP bars was similar to the strength of thesmaller diameter bars, contrary to the manufacturer’s supplieddata. The steel rebars had a nominal diameter of 12 mm and amean yield strength of 590 MPa and mean ultimate strength of675 MPa.
In this study, concrete was produced using 25 mm maximumaggregate size, 0.48 water to cement ratio and 380 kg/m3 cementcontent. The fresh concrete slump was about 75 mm, and the aver-age 28-day cube compressive strength and modulus of elasticitywas found to be around 50 MPa and 29,500 MPa, respectively.
3.2. Details of beam and slab elements
The beam series were designated as BG#, BC#, BS# and slab ser-ies as SG#, SC#, SS#. B and S stand for beam and slab, while G, Cand S identify the type of reinforcement used, GFRP, CFRP or steel,respectively. Notation # represents the series number, and the twoidentical elements within each series are identified by adding a orb to the end of the series name.
The beam elements were 150 mm wide, 250 mm high, 2550 mmlong, with the distance between the end-supports being 2300 mm(see Fig. 1). The shear span (767 mm) was reinforced with steelstirrups to avoid shear failure, while no shear reinforcement wasprovided in the constant bending moment zone. GFRP and CFRPrebars with nominal diameter of 6 mm were used as top reinforce-ment within the shear span to hold the stirrups in place. The clearconcrete cover to the main rebars was 25 mm in all cases. Eachbeam series was designed to be under-reinforced, balanced or
Split cylindrical tensile strength (MPa) Elastic modulus (MPa)
Average Standard deviation
4.1 0.29 293003.8 0.15 290003.6 0.08 28200
3.9 0.20 317003.6 0.05 301003.6 0.19 30700
4.1 0.28 29900
3.9 0.23 293003.4 0.24 278003.8 0.17 27700
3.9 0.21 303003.4 0.11 299003.8 0.24 29500
3.6 0.24 29600

0
20
40
60
80
100
120
140
0 10 20 30
Midspan Deflection, mm
Loa
d, k
N
BC1a, BC1b
BC2a, BC2bBC3a, BC3b
BSa, BSb
0
10
20
30
40
50
60
70
0 20 40 60 80
Midspan Deflection, mm
Loa
d, k
N
SC1a, SC1b
SC2a, SC2bSC3a, SC3b
SSa, SSb
0
10
20
30
40
50
60
0 25 50 75 100
Midspan Deflection, mm
Midspan Deflection, mm
Loa
d, k
N
SG1a, SG1b
SG2a, SG2b
SG3a, SG3b
SSa, SSb
0
20
40
60
80
100
120
0 10 20 30 40 50
Loa
d, k
N
BG1a, BG1b
BG2a, BG2b
BG3a, BG3b
BSa, BSb
(b)(a)
(c) (d)
Fig. 3. Experimental load vs. mid-span deflection; series (a) BG, (b) BC, (c) SG, (d) SC.
0102030405060708090
-3000 -2500 -2000 -1500 -1000 -500 0
Concrete Strain, microstrain
Loa
d, k
N
Strain gauge 15
Cracked-section analysis0
102030405060708090
0 2000 4000 6000 8000 10000 12000 14000
Rebar Strain, microstrain
Loa
d, k
N
Strain gauge 10Strain gauge 11Strain gauge 12Strain gauge 13Strain gauge 14Cracked-section analysis
1421 3110 11
(b)(a)
141311 2110
Midspan induced crack natural crack
90 mm
22.5 mm
10
14
Fig. 4. Typical experimental load vs. strain relationships for beam BG2 (a) rebar strain (b) concrete strain.
05
1015202530354045
0 20 40 60 80 100
Load
, kN
Midspan Deflection, mm
LVDT 6
Derived from curvatures
Cracked-section analysis05
1015202530354045
0 0.05 0.1 0.15 0.2
Load
, kN
Curvature, m-1
Curvature derived from experimental strainsCracked-section analysis
(a) (b)
(Mid-span)
Fig. 5. Typical experimental load vs. (a) curvature, and (b) mid-span deflection, slab SG2a.
R. Al-Sunna et al. / Composites: Part B 43 (2012) 2125–2134 2129
over-reinforced, with failure occurring by rupture of bars or crush-ing of concrete. The geometric and reinforcement details of GFRPand CFRP RC beams are given in Fig. 1 and Table 2. The reinforce-ment ratio of the corresponding beam and slab series is almost iden-tical to enable comparison between the deflection behaviour ofbeam and slab elements with similar reinforcement ratios.
The slab elements were 500 mm wide, 120 mm high, 2350 mmlong, whilst the distance between the end-supports was 2100 mm.The geometric and reinforcement details of the GFRP and CFRP RCslabs are shown in Fig. 2 and Table 3. The clear concrete cover to
the main rebars was specified at 25 mm. However, the flotationof the FRP mesh reinforcement during casting resulted in slightlydifferent cover values as reported in Table 3. Similar to the beamelements, each slab series had a different reinforcement ratio (un-der-reinforced, balanced and over-reinforced).
3.3. Instrumentation and test procedure
The two elements in each beam and slab series, along with eightcontrol cubes and eight control cylinders were constructed from

02000400060008000
10000120001400016000
0 250 500 750 1000 1250
Reb
ar S
trai
n,
mic
rost
rain
Distance From Support, mm
45.03 kN34.15 kN23.07 kN12.09 kN
Applied loadMid-span induced
crack
Adjacent crack
Adjacentcrack
Fig. 6. Typical experimental profile of strains along a rebar, SG2.
2130 R. Al-Sunna et al. / Composites: Part B 43 (2012) 2125–2134
the same batch of concrete. All the specimens in each series,including the control cubes and cylinders, were cured under simi-lar conditions and tested on the same day. The cubes were used todetermine the compressive strength, while the cylinders were usedto determine the tensile strength and elastic modulus of the con-crete according to ASTM C496-96 [23] and ASTM C469-94 [24],respectively. The beam and slab elements were covered with wethessian and polythene sheets, cured for one week and subse-quently stored under standard laboratory conditions. In this study,all the elements were tested within 3–5 weeks after curing. Table 4shows the compressive and tensile strength of concrete for differ-ent beam and slab series.
As shown in Figs. 1 and 2, the elements were tested under four-point loading. The total load was applied by means of a 600 kNhydraulic actuator and a loading beam was used to subject bothbeams and slabs to two equal concentrated loads symmetricallyplaced about mid-span. One rebar of every beam and slab wasinstrumented with a total of fourteen strain gauges. Four straingauges were used to evaluate strain development and average bondstresses within the shear span. The other ten strain gauges were con-centrated around a crack inducer at mid-span to investigate tension
0
10
20
30
40
50
0 10 20 30 40 50
Load
, kN
Midspan Deflection, mm
LVDT 6
Flexural deflections derived from experimental curvatures
(a)
(Mid-span)
Fig. 7. Experimental load vs. mid-span
0
4
8
12
16
20
0 10 20 30 40
Load
, kN
Midspan Deflection, mm
LVDT 6
Flexural deflections derived from experimental curvatures
(a)
(Mid-span)
Fig. 8. Experimental load vs. mid-span
stiffening and bond profiles. Two dial gauges were used to measuresettlements at the end supports and five linear variable displace-ment transducers (LVDT) were used to measure deflections (Figs. 1and 2). One strain gauge was also used to measure the top surfaceconcrete strain at mid-span. The testing was carried out in displace-ment control and the load was paused at about 5 kN intervals tomark and measure the cracks and to take notes. Two load cycleswere performed for each specimen. In the first cycle, the load was in-creased to a service load level corresponding to a stress of about 45%of the estimated concrete compressive strength in the top concretefibre at mid-span. In the second cycle, the load was increased untilfailure occurred, either by rupture of bars or by crushing of concrete.All data (load, strains and deflections) were collected by a dataacquisition system at a sampling frequency of 1 Hz.
4. Test results and discussion
Fig. 3 shows the experimental load–deflection response at mid-span for all tested beams and slabs. It is clear from this figure thatthe results of the two replicate elements within each series arevery similar. The only exception is in the SC3 series (Fig. 3d), wherethe clear cover is significantly different for SC3a and SC3b slabs.Therefore, it can be confirmed that in general the materials used,the production of the elements and the test procedure were all wellcontrolled. Due to limitations of space, only some of the results arediscussed in this paper in detail. Similar behaviour was observedfor all of the tested specimens.
4.1. Modes of failure
The three series of FRP RC beams and slabs were designed toinvestigate different flexural failure modes including rupture ofthe rebars (under-reinforced), compressive failure of the concrete(over reinforced) and balanced failure (compressive concrete
0
30
60
90
120
0 5 10 15 20 25 30
Load
, kN
Midspan Deflection, mm
LVDT 6
Flexural deflections derived from experimental curvatures
(b)
(Mid-span)
deflection for (a) BG1, and (b) BG3.
0
10
20
30
40
50
60
70
0 20 40 60 80Midspan Deflection, mm
LVDT L6
Flexural deflections derived from experimental curvatures
Load
, kN
(b)
(Mid-span)
deflection for (a) SG1, and (b) SG3.

R. Al-Sunna et al. / Composites: Part B 43 (2012) 2125–2134 2131
failure followed immediately by rupture of the rebars). The modesof failure for all tested beam and slab elements are given in Tables2 and 3. It should be mentioned that under-reinforced FRP RC sec-tions are not usually of interest for design purposes, since the fail-ure is brittle and drastically catastrophic; however, they result inmuch higher stress levels in the FRP bars which is of interest interms of deflection behaviour.
4.2. Strain in the concrete and rebars
A cracked-section analysis was performed to estimate the loaddeflection response of each of the tested specimens. The assump-tion of plane sections remain plane was implemented in this anal-ysis. A linear elastic behaviour for the FRP reinforcement wasconsidered, while the stress–strain relationship for the concretein compression was based on the Eurocode 2 model [9]. The con-crete was assumed to resist no tension. Typical experimentalload–rebar strain relationships for BG2 are shown in Fig. 4a. The re-sults show that cracked-section analysis predicts reasonably wellthe maximum rebar strain at the location of the pre-formed crack.Beyond cracking, the rebar strains around the crack inducer followalmost a linear relationship with load up to failure. From the anal-ysis of Fig. 4a it can be seen that cracking at the location of thecrack inducer takes place at 13 kN, as captured by gauge No. 10.However, the first natural crack takes place at 18 kN and its devel-opment was captured by gauge No. 14. At higher load levels, thenatural crack developed wider than the induced crack and hencethe rebar undergoes additional strain when moving away frommid-span induced crack.
0
10
20
30
40
50
60
0 5 10 15 20 25 30
Load
, kN
Midspan Deflection, mm
BC1aACI 440.1R-06Eurocode 2, BischoffBenmokraneIgIcr
0
20
40
60
80
100
0 5 10 15 20 25
Load
, kN
Midspan Deflection, mm
BC2aACI 440.1R-06Eurocode 2, BischoffBenmokraneIgIcr
0
20
40
60
80
100
120
0 5 10 15 20
Load
, kN
Midspan Deflection, mm
BC3aACI 440.1R-06Eurocode 2, BischoffBenmokraneIgIcr
Fig. 9. Experimental and predicted deflections – CFRP beams.
The load–concrete strain relationships shown in Fig. 4b indicatethat the concrete strain at the extreme top fibre (above the locationof the crack) considerably exceeds that predicted by cracked-sec-tion analysis. This can be attributed to the fact that cracked-sectionanalysis assumes a linear strain distribution in the section thatmay not be accurate enough for FRP RC beams, as the low modulusof elasticity of FRP rebars leads to wider cracks, and therefore,more localized effects compared to steel RC beams.
4.3. Curvature
FRP rebars have high tensile strength and their stress–strainbehaviour is linear up to failure. Using the experimental top-fibreconcrete strain (ec), an average of the rebar strains around the crackinducer (efave), and the effective reinforcement depth (d), the curva-ture (u) at every load level was evaluated from the test resultsaccording to the general approach of CEB, as follows:
/ ¼ ec þ efave
dð7Þ
The experimentally derived load–curvature relationships, ingeneral, compare well to those derived by cracked-section analysis(Fig. 5a). In this study, the experimentally derived moment–curva-ture relationships were used to calculate the mid-span deflectionsthat are associated with the flexure behaviour as shown in Fig. 5b.It can be seen that for SG2 (balanced reinforced slab) the measureddeflections are larger than the predicted flexural deflections, andthey start to deviate shortly after shear cracking (14.8 kN). The dif-ference between the measured and flexural deflections can be
05
1015202530354045
0 5 10 15 20 25 30 35 40
Load
, kN
Midspan Deflection, mm
BG1aACI 440.1R-06Eurocode 2, BischoffBenmokraneIgIcr
01020304050607080
0 10 20 30 40 50
Load
, kN
Midspan Deflection, mm
BG2aACI 440.1R-06Eurocode 2, BischoffBenmokraneIgIcr
0
20
40
60
80
100
120
0 5 10 15 20 25
Load
, kN
Midspan Deflection, mm
BG3aACI 440.1R-06Eurocode 2, BischoffBenmokraneIgIcr
Fig. 10. Experimental and predicted deflections – GFRP beams.

2132 R. Al-Sunna et al. / Composites: Part B 43 (2012) 2125–2134
investigated further by examining the strain profiles along the re-bar at different load levels. The small difference in the crackingloads observed in Fig. 5a and b is attributable to the fact thatdeflections are affected by localized effects to a lesser extent thansection curvatures. Fig. 6 shows the experimental profile of strainsalong a rebar in slab element SG2. Any noticeable increase in therebar strain is caused by the development of a nearby crack (i.e.mid-span induced crack and adjacent cracks). The strain profilesalong the rebar in the shear span indicate that the rebar undergoesadditional strains, in excess of the strains due to flexure, since thestrains at the centre span are lower than in the region near theloading points. This behaviour is not observed in steel RC sincethe considerably higher steel stiffness controls crack widths andrestricts the spread of additional deformations. In other words,due to the low modulus of elasticity of the FRP rebars (especiallyGFRP rebars), the contribution of shear and bond-slip induceddeformations could be of major significance for FRP RC elements.For example, this additional deflection for beam BG2 was esti-mated to be 20% of the measured deflection at failure [16].
4.4. Deflection
Calculated load-mid-span flexural deflections of beams BG1a(low reinforcement ratio) and BG3a (high reinforcement ratio)are compared to the measured deflections in Fig. 7. Fig. 8 showsthe calculated flexural deflections and experimental measureddeflections of their corresponding slab elements SG1a (low rein-forcement ratio) and SG3a (high reinforcement ratio).
05
10152025303540
0 10 20 30 40 50 60 70
Load
, kN
Midspan Deflection, mm
SC1aACI 440.1R-06Eurocode 2, BischoffBenmokraneIgIcr
0
10
20
30
40
50
60
0 10 20 30 40 50 60 70
Load
, kN
Midspan Deflection, mm
SC2aACI 440.1R-06Eurocode 2, BischoffBenmokraneIgIcr
0
10
20
30
40
50
60
0 10 20 30 40 50 60
Load
, kN
Midspan Deflection, mm
SC3aACI 440.1R-06Eurocode 2, BischoffBenmokraneIgIcr
Fig. 11. Experimental and predicted deflections – CFRP slabs.
As shown in Figs. 7a and 8a, the effect of the additional compo-nent of the mid-span deflection is not prominent for series BG1 andSG1 (low reinforcement ratio elements) because premature failureoccurred by rupture of the rebars, when the load level was rela-tively low. For BG3 and SG3 (Figs. 7b and 8b) the high amount ofreinforcement could provide better control over the additionaldeformations (shear or bond-slip induced deformations) at thelower load levels. As a result, the additional deflections were ob-served at the higher load level. It is therefore suspected that theadditional deformations are more important in beams and slabswith a moderate reinforcement ratio (see Fig. 5b). Based on theabove discussion, for GFRP RC elements with moderate to highreinforcement ratios, it would be important to evaluate the addi-tional deformations [16].
5. Prediction of deflection
Figs. 9–12 compare experimental mid-span deflections for alltested beams and slabs to the deflections predicted using differentsimple prediction equations. It should be noted that, based on thegeometry of the specimens and the provided curing conditions,shrinkage was considered to have affected the deformation behav-iour of the specimens prior to the tests (permanent deformationdue to shrinkage curvature) and up to the cracking load. The resultsof this study showed that, in general, the accuracy of the predicteddeflection is highly dependent on the accuracy of the calculatedcracking moment. Accurate estimation of concrete cover is alsoimportant for thin RC slabs where a small variation in the concrete
0
3
6
9
12
15
18
21
0 10 20 30 40 50 60 70 80 90
Load
, kN
Midspan Deflection, mm
SG1aACI 440.1R-06Eurocode 2, BischoffBenmokraneIgIcr
05
10152025303540
0 10 20 30 40 50 60 70 80 90
Load
, kN
Midspan Deflection, mm
SG2aACI 440.1R-06Eurocode 2-BischoffBenmokraneIgIcr
0
10
20
30
40
50
60
0 10 20 30 40 50 60 70
Load
, kN
Midspan Deflection, mm
SG3aACI 440.1R-06Eurocode 2, BischoffBenmokraneIgIcr
Fig. 12. Experimental and predicted deflections – GFRP slabs.

Table 5Analytical to experimental mid-span deflection for FRP reinforced elements.
Series designation Load state Ratio of analytical to experimental mid-span deflection
ACI 440.1R- 06 Eurocode 2, Bischoff Benmokrane
CFRP beams BC1 Service 1.13 0.75 1.21Ultimate 0.95 0.90 1.13
BC2 Service 0.90 0.78 1.15Ultimate 0.80 0.78 0.95
BC3 Service 0.88 0.87 1.25Ultimate 0.76 0.75 0.90
GFRP beams BG1 Service 1.14 0.76 1.15Ultimate 0.84 0.81 0.97
BG2 Service 0.89 0.81 1.28Ultimate 0.77 0.75 1.01
BG3 Service 0.87 0.86 1.34Ultimate 0.79 0.79 0.95
CFRP slabs SC1 Service 1.08 0.73 1.13Ultimate 0.92 0.88 1.08
SC2 Service 0.61 0.72 1.05Ultimate 0.83 0.82 1.01
SC3 Service 0.71 0.81 1.13Ultimate 0.82 0.85 1.11
GFRP slabs SG1 Service 1.18 0.95 1.10Ultimate 0.79 0.93 0.63
SG2 Service 0.66 0.92 1.24Ultimate 0.79 0.84 1.06
SG3 Service 0.65 0.97 1.42Ultimate 0.84 0.86 1.23
Average 0.89 0.83 0.83 0.83 1.20 1.00
Standard deviation 0.20 0.06 0.09 0.06 0.11 0.15
R. Al-Sunna et al. / Composites: Part B 43 (2012) 2125–2134 2133
cover would result in a considerable variation in the crackedmoment of inertia. To better evaluate the accuracy of differentanalytical methods, the ratio of the analytical to the experimentalmid-span deflection was calculated for all FRP RC elements at bothservice and ultimate limit states (Table 5). In the present study, theservice load is that corresponding to a stress level in the topconcrete fibre of about 40% of the concrete compressive strength.
5.1. Service limit state
The results show that ACI 440.1R-06 [5] approach, in general,overestimates deflections (up to 18%) for FRP RC elements withlow reinforcement ratio (beams: BG1 and BC1; slabs: SG1 andSC1) at service limit state. However, for FRP RC beams and slabswith moderate to high reinforced ratio this method always under-estimates the service level deflections (on average by 11% and 34%for FRP reinforced beams and slabs, respectively).
As mentioned before, the effective moment of inertia (Ie) pro-posed by Bischoff [7] and Eurocode 2 [9] are both based on the ten-sion stiffening provisions of CEB-FIP Model Code 1990 [3]; andtherefore, lead to identical deflection predictions. Figs. 9–12 showthat the deflections predicted according to Eurocode2 [9] andBischoff [7] approach in general compare well with the measureddeflections at low load levels. However, the predicted deflectionsfor the FRP RC elements were on average 17% less than the mea-sured deflections.
Benmokrane et al. [12] equation is found to considerably over-estimate (up to 42%) the deflection of FRP RC beams and slabs atservice load level (see Table 5). The reason could be attributed tothe use of b0 factor in this equation that leads to a high degradationin stiffness at service load level as shown in Figs. 9–12.
5.2. Ultimate limit state
The results of this study indicate that both ACI 440.1R-06 [5]and Eurocode 2 [9] (and Bischoff [7]) equations underestimate
the measured deflections of FRP RC elements by up to 25% at highlevels of load. Table 5 indicates that predicted mid-span deflectionsare on average 12% and 20% less than the measured deflections oflow and moderate to high reinforced ratio FRP RC elements,respectively. As discussed in previous sections, the difference be-tween the calculated and measured deflections in moderate to highreinforced ratio FRP RC elements may be mainly attributed to theadditional deformations induced by shear and bond-slip. It isshown in Figs. 9–12 that, except for two GFRP RC slabs (SG1andSG3), Benmokrane et al. [12] proposed method was fairly accuratein predicting the ultimate mid-span deflection of FRP RC elements.Table 5 shows that this method underestimates the ultimatedeflection of Slab SG1 by 37% and overestimates the ultimatedeflection of Slab SG3 by 23%.
The results of this study indicate that additional deformationsother than those induced by pure flexure could be significant par-ticularly in FRP RC beams and slabs with moderate to high rein-forced ratio. However, it seems that most of the existingsimplified methods to predict deflections of FRP RC elements donot adequately take into account these additional deformations.This usually leads to un-conservative predictions especially athigher load levels. It should be mentioned that additional deforma-tions may not always be significant at the serviceability load. Nev-ertheless, it is still important to predict deformation of FRP RCelements over the entire loading range with good accuracy. This re-quires developing more fundamental methods to evaluate shearand bond-slip induced deflections [25,26]. Further analytical inves-tigations will be published by the authors in a separate, forthcom-ing paper.
6. Conclusions
This study experimentally investigated the deflection behaviourof 24 GFRP and CFRP RC beams and slabs covering a wide range ofreinforcement ratios. Based on the results, the following conclu-sions can be drawn:

2134 R. Al-Sunna et al. / Composites: Part B 43 (2012) 2125–2134
� For FRP RC beams and slabs, the plain section remains plainassumption across the entire section may not be valid for highlevels of loading.� Although initial shrinkage could account for some of the addi-
tional deformations observed during the tests, it was notconsidered to have affected the overall load-deformationbehaviour of the test specimens after cracking to a great extent.� Existing approaches to estimate deflections of RC elements by
considering solely their flexural behaviour tend to underesti-mate overall deformations. The contribution to overall deflec-tions of other possible stiffness-reducing mechanisms (e.g.shear cracking, shrinkage and loss of bond) can be significant,particularly in FRP RC elements having moderate to high rein-forcement ratios and should be further investigated. The accu-racy of the predicted deflection for FRP RC elements(particularly in thin slabs) is highly dependent on the accuracyof the calculated cracking moment and concrete cover.� The ACI 440.1R-06 [5] equation leads to overestimated service
level deflections at low reinforced ratios, and underestimateddeflections at moderate to high reinforced ratio FRP RC beamsand slabs. This method underestimates the measured ultimatedeflections especially for moderate to high reinforced ratioFRP RC elements.� The faster transition to a fully cracked response assumed in the
model proposed by Benmokrane et al. [12] can overestimateservice deflections, especially for moderate to high reinforce-ment ratios.� The performance of the approach recommended in Eurocode 2
[9] and the analogous model proposed by Bischoff [7] offermore consistent predictions throughout the range of reinforce-ment ratios explored in this experimental programme. Thesemethods, however, tend to underestimate deflections at serviceload (on average by 17%) and to a larger extent at ultimate limitstates, especially for moderate to high reinforced ratio (up to25%).
References
[1] Gdoutos A, Pilakoutas K, Rodopoulos C, editors. Failure analysis of industrialcomposite materials. New York: McGraw-Hill Professional Engineering; 2000.p. 51–108.
[2] Pilakoutas K, Neocleous K, Guadagnini M. Design philosophy issues of fiberreinforced polymer reinforced concrete structures. J Compos Constr2002;6(3):154–61.
[3] CEB. CEB-FIP Model Code 1990. Comite Euro-International du Beton, ThomasTelford Ltd, 1993.
[4] fib Bulletin No. 40. FRP reinforcement in RC structures. International federationfor structural concrete. Lausanne: Switzerland; 2007.
[5] ACI Committee 440. Guide for the design and construction of concretereinforced with FRP bars (ACI 440.1R-06). Farmington Hills (USA): Americanconcrete institute; 2006.
[6] ACI Committee 318. Building code requirements for structural concrete (ACI318–08) and commentary (ACI 318R-08). Farmington Hills (Mich,USA):American concrete institute; 2008.
[7] Bischoff PH. Deflection calculation of FRP reinforced concrete beams based onmodifications to the existing Branson equation. J Compos Constr2007;11(1):4–14.
[8] ISIS Canada. Reinforcing concrete structures with fibre reinforced polymers-design manual No. 3. University of Manitoba (Winnipeg, Manitoba Canada):ISIS Canada Corporation; 2001.
[9] CEN. Eurocode 2: Design of concrete structures - Part 1-1: General rules andrules for buildings (EN 1992-1-1:2004). European committee forstandardisation; 2004.
[10] CAN/CSA-S806. Design and construction of building components with fibre-reinforced polymers. Mississauga (Ontario, Canada): Canadian StandardsAssociation; 2002.
[11] Achillides Z, Pilakoutas K. Bond behaviour of fiber reinforced polymer barsunder direct pullout conditions. J Compos Constr 2004;8(2):173–81.
[12] Benmokrane B, Chaallal O, Masmoudi R. Flexural response of concrete beamsreinforced with FRP reinforcing bars. ACI Struct J 1996;93(1):46–55.
[13] Wei Z. crack and deformation behaviour of FRP reinforced concrete structures.PhD thesis, The University of Sheffield (Sheffield, UK); 1999.
[14] Al-Sunna R, Pilakoutas K, Waldron P, Al-Hadeed T. Deflection of FRP reinforcedconcrete beams. In: 4th middle east symp on struct compos inf appl (MESC-4).Alexandria, Egypt; 2005.
[15] Bischoff PH, Johnson RD. Effect of shrinkage on short-term deflection ofreinforced concrete beams and slabs. Structural Implications of Shrinkage andCreep of Concrete, SP-246. Gardner J, Chiorino M, editors. American ConcreteInstitute (Michigan); 2007.p. 167–80 [SP-246-10].
[16] Al-Sunna R. Deflection behaviour of FRP reinforced concrete flexural members.PhD thesis. The University of Sheffield (Sheffield, UK); 2006.
[17] Mota C, Alminar S, Svecova D. Critical review of deflection formulas for FRP-RCmembers. J Compos Constr 2006;10(3):183–94 [ASCE].
[18] Rafi MM, Nadjai A. Evaluation of ACI 440 deflection model for fiber-reinforcedpolymer reinforced concrete beams and suggested modification. ACI Struct J2009;106(6):762–71.
[19] Masmoudi R, Theriault M, Benmokrane B. Flexural behavior of concrete beamsreinforced with deformed fiber reinforced plastic reinforcing rods. ACI Struct J1998;95(6):665–75.
[20] Yost JR, Gross SP, Dinehart DW. Effective moment of inertia for glass fiber–reinforced polymer–reinforced concrete beams. ACI Struct J2003;100(6):732–9.
[21] ACI Committee 440. Guide for the design and construction of concretereinforced with FRP bars, (ACI 440.1R-03). American Concrete Institute(Farmington Hills); 2003.
[22] Bischoff PH, Scanlon A. Effective moment of inertia for calculating deflectionsof concrete members containing steel reinforcement and fiber–reinforcedpolymer reinforcement. ACI Struct J 2007;104(1):68–76.
[23] ASTM C496–96 Standard test method for splitting tensile strength ofcylindrical concrete specimens. ASTM Committee (Philadelphia); 1996.
[24] ASTM C469–94 Standard test method for static modulus of elasticity andpoisson’s ratio of concrete in compression. (Philadelphia): ASTM Committee ;1994.
[25] Guadagnini M, Pilakoutas K, Waldron P. Shear resistance of FRP RC beams:experimental study. J Compos Constr 2006;10(6):464–73.
[26] Imjai T, Guadagnini M, Pilakoutas K. Estimation of shear crack induceddeformations of FRP RC beams, 9th int sympos fiber reinf polym reinforcementconcr struct, Sydney, Australia; 2009.