Session 7b: Deflection & Disruption Testing - UNOOSA
73
Session 7b: Deflection & Disruption Testing Chairs: Patrick Michel | Angela Stickle | Megan Syal Presenters: M. Burkey | A. Stickle | C. Raskin | M. DeCoster | M. Owen
-
Upload
khangminh22 -
Category
Documents
-
view
3 -
download
0
Transcript of Session 7b: Deflection & Disruption Testing - UNOOSA

Session 7b: Deflection & Disruption Testing
Chairs: Patrick Michel | Angela Stickle | Megan Syal
Presenters: M. Burkey | A. Stickle | C. Raskin | M. DeCoster | M. Owen

LLNL-PRES-821486This work was performed under the auspices of the U.S. Department of Energy by Lawrence Livermore National Laboratory under contract DE-AC52-07NA27344. Lawrence Livermore National Security, LLC
Progress on Developing a Simplified Model of X-Ray Energy Deposition for Nuclear Mitigation MissionsPlanetary Defense Conference, April 28th 2021
Mary BurkeyRob Managan, Kirsten Howley, Nick Gentile,
Megan Bruck Syal, Mike Owen

2LLNL-PRES-821486
§ A nuclear mitigation mission is dependent on many asteroid properties that may be poorly constrained before launch.
An Option for Planetary Defense: Nuclear Deflection/Disruption
Bennu: photo from the NASA OSIRIS-REx mission
X rays & neutronsMass?
Rotation?
Shape?
Structure?
Composition?Density?
Size?
Mitigation Mission
✓
✓
X
Successful Deflection Mission: asteroid remains intact and misses Earth
Successful Disruption Mission: asteroid is blasted into many small, fast-moving fragments
Failed Mission: asteroid breaks into slow-moving fragments that could hit Earth

3LLNL-PRES-821486
A problem with two parts
X-Ray Energy Deposition Hydrodynamics
• X rays penetrate 1 μm – 1 cm into the material, causing heating and ionization. Some energy re-radiates away.
• Only a full radiation-hydrodynamics code can cover all the physics that is happening in this process.
• Everything that happens after the energy deposition. • The deposited energy causes material to begin moving
and expanding.
• At this point, only a standard hydrocode is needed to follow the material’s movement and energy.
1 ns
10 ns
50 ns100 ns 500 ns
depth (cm)
Inte
rnal
Ene
rgy
(jk*/
cc)
Image credit: Megan Bruck Syal*1 jerk = 1e16 ergs

4LLNL-PRES-821486
Nuclear Deflection/Disruption Modeling: X-ray Energy Deposition
Old Way: Mercury New Way: Kull
Kull is a mesh-based radiation-hydrodynamics code that was developed for High Energy Density Physics
6LLNL-PRES-xxxxxx
Mercury Energy Depositions for X rays and Neutrons
X ray normalized energy depositions
*The x ray energy depositions are a simplified with constant opacity. The opacity of the material changes as it is radiated.
1.E-12
1.E-11
1.E-10
1.E-09
0 20 40 60 80 100
Ener
gy D
epos
ition
(cm
-1)
depth(cm)
Neutron Energy Deposition Placeholder
SiO2
Fe3Ni
S-Type
C-type
103
102
101
100
10-1
10-5 10-4 10-3 10-2 10-1
depth (cm)
Ener
gy d
epos
ition
(cm
-1)
1 ns
10 ns
50 ns 100 ns 500 ns
depth (cm)En
ergy
Den
sity
(jk/c
c)
Frac
tion
of e
nerg
y re
radi
ated
Time (nanoseconds)
“Low fluence”
“Middle fluence”
“High fluence”
Easy-to-fit energy depositions
profiles can be easily scaled by yield and angle of incidence
Cold opacities assumed
No re-radiation
No radiation-hydrodynamics coupling
✓
X
✓
X
X
Includes re-radiation and rad-hydro effects!
Uses best-available opacitiesNo more easy fits
✓✓ XX-ray normalized energy
depositions
Mercury is a Monte Carlo particle transport code, which works well for neutron energy deposition

5LLNL-PRES-821486
1D Kull Energy Deposition Tests:
Can we initialize Kull with a Kull-generated energy profile at a specific time and get roughly the same answer as a normal Kull simulation?
We can in most cases reproduce the pure Kull blowoff momentum to within ±50%.
-20
0
20
40
60
80
100
120
si-low
si-mid
si-high
fo-low
fo-mid
fo-high
ice-lo
w
ice-m
id
ice-high
fe-low
fe-mid
fe-high
Blowoff Momentum Comparison: Source Duration
10ns src 50ns src 100ns src
MaterialsSilicon Dioxide (SiO2)Forsterite (Mg2SiO4)Ice (H2O)Iron (Fe)Source1 keV Black Body at 4 Fluences:Low – 1e-4 kt/m2
Mid – 2.5e-3 kt/m2
Mid-High – 0.12 kt/m2
High – 1 kt/m2
Test Asteroid/Case:R=150m, Standoff=50m
*Source duration estimates taken from Glasstone, 1977
*
Scope of Study:
-20
0
20
40
60
80
100
si-low
si-mid
si-high
fo-lowfo-m
id
fo-high
ice-lo
w
ice-m
id
ice-high
fe-low
fe-mid
fe-high
% d
evia
tion
from
orig
inal
Kul
l cal
cula
tion
Blowoff Momentum Comparison: Incident Angle
A=0.2 A=0.4 A=0.6A=0.8 A=1.0

6LLNL-PRES-821486
Level Up: 2D Kull Energy Deposition Tests
Fluence Level Low Mid Mid-High High
2D blowoff momentum (g cm/μs) 4.66e6 3.81e7 4.65e8 1.98e9
1D integrated blowoff momentum (g cm/μs) 4.74e6 3.92e7 4.55e8 1.91e9
Time after “detonation” (μs) 1.36 5.0 3.48 2.19
SiO2 Mid-High Fluence Energy Depositions
§ The 1D and 2D blowoff momentum results from pure Kull simulations match closely
§ The energy deposition profiles also match reasonably well…— …And will improve when a time-dependent source is implemented into the
1D simulation.
§ We will use the “cleaner” 1D data for fitting an angle-dependent function.

7LLNL-PRES-821486
Fitting to 1D Depositions (Preliminary):En
ergy
Den
sity
(jk/c
c)
Depth (cm)
Ener
gy D
ensit
y (jk
/cc)
Ener
gy D
ensit
y (jk
/cc)
Ener
gy D
ensit
y (jk
/cc)
Ener
gy D
ensit
y (jk
/cc)
Energy Deposition Data Energy Deposition Fit (Fit – Data)/Avg(Data)
“Hig
h” F
luen
ce“L
ow”
Flue
nce
Sample 1D Energy Deposition Fit

8LLNL-PRES-821486
Preliminary Results and Still To Do
§ Still lots to do:— Global fit over all fluences/source durations— Scaling based on density/porosity— Same analysis for remaining materials (Forsterite, Ice, and Iron)— Thorough study of model weaknesses/errors
Depth (cm)
Ener
gy D
epos
ition
(jk/
cc) ρ = 2.6 g/cc
ρ = 2.1 g/ccρ = 1.6 g/ccρ = 1.1 g/ccρ = 0.6 g/cc
Deposition Shape vs Density/Porosity
§ Preliminary results are promising but should improve with better 1D data.
§ Exercise: Asteroid diameter is 120m, material is SiO2, and a “High” Fluence is applied (Yield = 1Mt, Standoff = 9m)
Fluence Level Low Mid Mid-High High Exercise
2D Pure Kull momentum (g cm/μs) 4.66e6 3.81e7 4.65e8 1.98e9 1.17e8
2D Deposition Function momentum (g cm/μs) 4.98e6 4.92e7 4.77e8 1.81e9 1.73e8
Time after “detonation” (μs) 1.36 5.0 3.48 2.19 1.34
9LLNL-PRES-821486
Conclusions and Exercise Test with Spheral
§ The PD community can use our model to more efficiently explore the vast space of potential scenarios and uncertainties.
§ Modeling the x-ray energy deposition is complicated and requires a full rad-hydro simulation to get right.
§ Our analytic deposition model is progressing quickly and shows promise.
00.10.20.30.40.50.60.70.8
0 0.2 0.4 0.6 0.8
Defle
ctio
n Ve
loci
ty F
ract
ion
Time (s)
(Mercury Deposition “ΔV”)/(Kull Deposition “ΔV”)
Getting ΔV right requires rad-hydro simulations of the x-ray energy deposition.

DisclaimerThis document was prepared as an account of work sponsored by an agency of the United States government. Neither the United States government nor Lawrence Livermore National Security, LLC, nor any of their employees makes any warranty, expressed or implied, or assumes any legal liability or responsibility for the accuracy, completeness, or usefulness of any information, apparatus, product, or process disclosed, or represents that its use would not infringe privately owned rights. Reference herein to any specific commercial product, process, or service by trade name, trademark, manufacturer, or otherwise does not necessarily constitute or imply its endorsement, recommendation, or favoring by the United States government or Lawrence Livermore National Security, LLC.The views and opinions of authors expressed herein do not necessarily state or reflect those of the United States government or Lawrence Livermore National Security, LLC, and shall not be used for advertising or product endorsement purposes.
The Double Asteroid Redirection Test (DART) Impact Modeling Working Group Inverse TestAngela M. Stickle, Megan Bruck Syal, Wendy K. Caldwell, Mallory DeCoster, Dawn Graninger, Martin Jutzi,Robert Luther, Mike Owen, Jason Pearl, Catherine S. Plesko, Sabina Raducan, Emma Rainey, Cody Raskin, Tane Remington, Andy Rivkin, and the AIDA/DART Impact Modeling Working Group
Planetary Defense Conference 2021April 28, 2021
19 April 2021 1

2
It allows a deflection demonstration on an asteroid of the relevant size by
changing its orbital period by ~1% about the larger asteroid.
The Ideal Target

Planetary-scale Impacts Provide Partially Well-controlled Experiments• The DART impact will join Deep Impact and LCROSS
as planetary-scale impact experiments- Initial impactor parameters are well known
- Physical properties of Dimorphos are not well constrained
Credit: NASA/JPL-Caltech/UMD
19 April 2021 3A.M. Stickle et al, PDC 2021
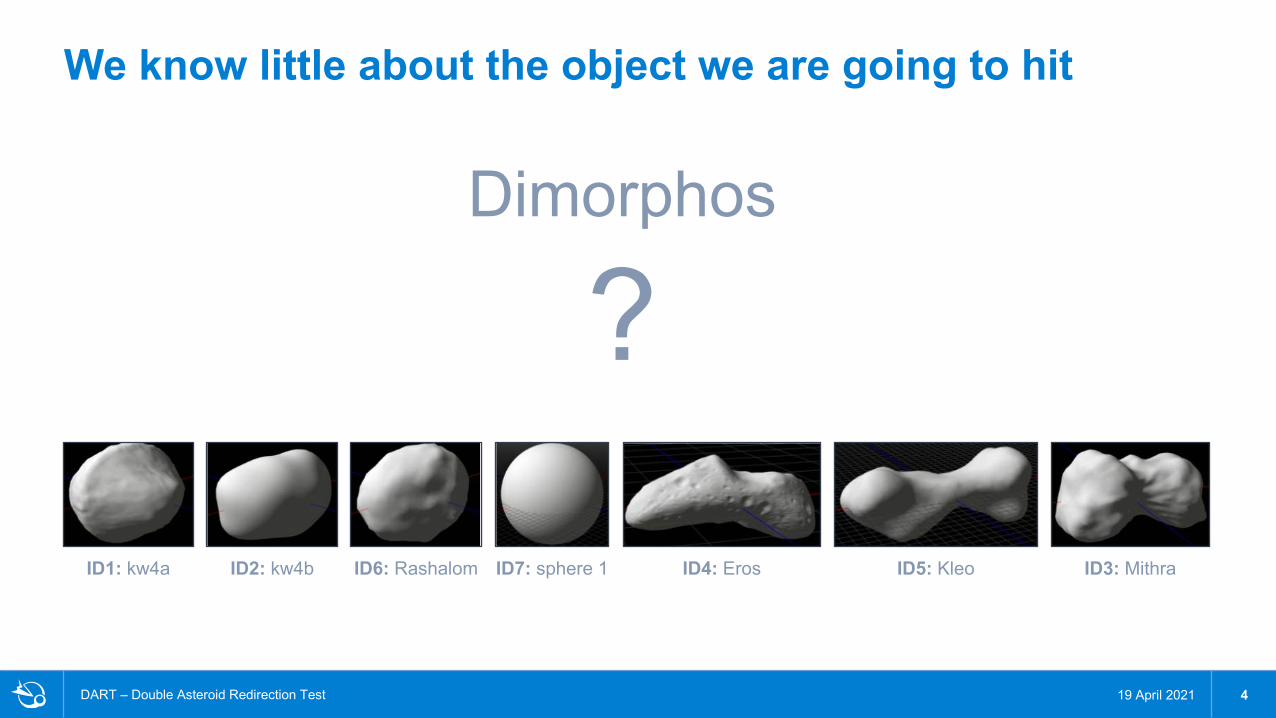
We know little about the object we are going to hit
19 April 2021DART – Double Asteroid Redirection Test 4
ID1: kw4a ID2: kw4b ID6: Rashalom ID7: sphere 1 ID4: Eros ID5: Kleo ID3: Mithra
Dimorphos
?

Planetary-scale Impacts Provide Partially Well-controlled Experiments• The DART impact will join Deep Impact and LCROSS
as planetary-scale impact experiments- Initial impactor parameters are well known
- Physical properties of Dimorphos are not well constrained
• Understanding the conditions of the DART impact is essential for interpreting the ability of the kinetic impactor to deflect an asteroid (estimating β)
Credit: NASA/JPL-Caltech/UMD
19 April 2021 5A.M. Stickle et al, PDC 2021

What Is Beta?
19 April 2021DART – Double Asteroid Redirection Test 6
Beta = 1No ejecta and smallmomentum increase
Beta = 2Moderate ejecta andmomentum increase
Beta = 4Heavy ejecta and large
momentum increase

The DART Impact Modeling Inverse Test• Inverse problems tell us about parameters that we cannot directly observe• Goal: determine the model parameters that best fit a given deflection observation
- Trial and Error Method- Optimization algorithms (see Cody Raskin’s talk, next)
Questions we want answered:• What is the expected uncertainty on β estimates following the DART impact from
simulations? How do target property choices affect the predicted values?• How well can the impact scenario be recreated from limited information? • Are current data analysis procedure and handoffs adequate or do new tools need to be
developed?• How long do these simulations take to provide answers and how many different
simulations need to be run?
19 April 2021A.M. Stickle et al., PDC 2021 7

Step 1: Set up “observations” à “The Game Masters”/Truth team
DART “Inverse Test” provides a different controlled experiment
Step 2: Simulate post-impact modeling activities à “The Adventurers”Receive shape model, mass estimate, period change, impact angle,simulated impact site
image
Use prediction simulations to identify
range of possible material parameters
Turn Δv into a β with assumed material
properties
Test shape model and impact scene
generated by ProxOps team
Impact models generate a Δv from a
DART impact
Turn Δv into an “observed” Δp and
period change
Pass to impact team
Work with other working
groups
A.M. Stickle et al, PDC 2021 19 April 2021 8

DART Truth Model #1 – simple case
Impactor properties, limited target properties, impact geometry, and deflection velocity were provided to team
19 April 2021A.M. Stickle et al., PDC 2021 9
2D Simulation 3D Simulation
CTH Simulations run by Emma Rainey

19 April 2021
DART Truth Model #1 – simple case
A.M. Stickle et al., PDC 2021 10
2D Simulation 3D Simulation
Δv = 0.096 ± 0.0029 cm/s Δv = 0.115 ± 0.017 cm/s
Width = 2.11 mDepth = 1.20 m
CTH Simulations run by Emma Rainey

Analytic model illustrates that a range of strength/porosity values can give you the same momentum enhancementModel by Sabina Raducan
19 April 2021A.M. Stickle et al., PDC 2021 11

19 April 2021A.M. Stickle et al., PDC 2021 12
SL WCB diameter ~ 7.5 m
Models by Andy Cheng, Mallory DeCoster, Dawn Graninger, Robert Luther, Mike Owen, Jason Pearl Cody Raskin, Tane Remington

A.M. Stickle, DART Investigation Team Meeting 2020
The second exercise provides a more stressing caseBeta will be estimated using procedure determined by DART team
Impact Location from DRACO (simulated)
Impact Location Plotted on STL
Truth models still in construction. Stay tuned!
A.M. Stickle et al, PDC 2021
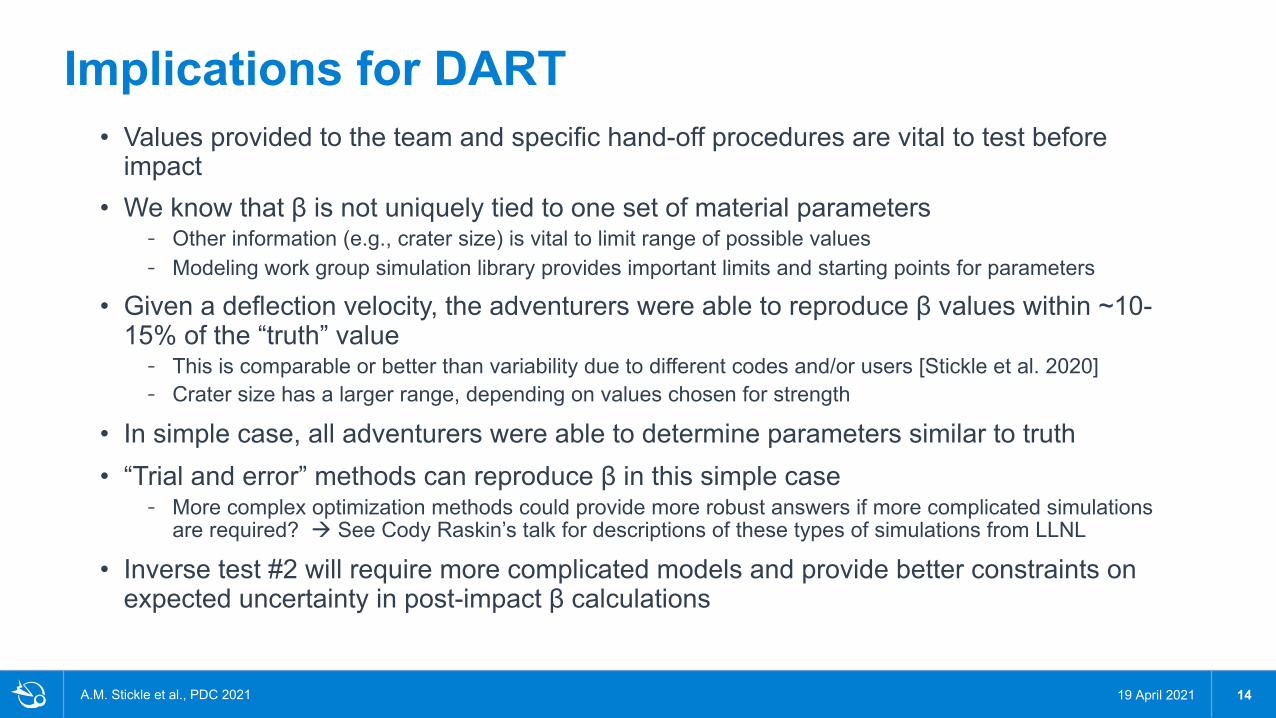
Implications for DART• Values provided to the team and specific hand-off procedures are vital to test before
impact• We know that β is not uniquely tied to one set of material parameters
- Other information (e.g., crater size) is vital to limit range of possible values- Modeling work group simulation library provides important limits and starting points for parameters
• Given a deflection velocity, the adventurers were able to reproduce β values within ~10-15% of the “truth” value- This is comparable or better than variability due to different codes and/or users [Stickle et al. 2020]- Crater size has a larger range, depending on values chosen for strength
• In simple case, all adventurers were able to determine parameters similar to truth• “Trial and error” methods can reproduce β in this simple case
- More complex optimization methods could provide more robust answers if more complicated simulations are required? à See Cody Raskin’s talk for descriptions of these types of simulations from LLNL
• Inverse test #2 will require more complicated models and provide better constraints on expected uncertainty in post-impact β calculations
19 April 2021A.M. Stickle et al., PDC 2021 14

19 April 2021 15

LLNL-PRES-821561This work was performed under the auspices of the U.S. Department of Energy by Lawrence Livermore National Laboratory under Contract DE-AC52-07NA27344. Lawrence Livermore National Security, LLC
Accelerated Root Finding for the DART Inverse Test Using Machine Learning Decision Trees
Cody Raskin, Tane Remington, Jason Pearl
April 23, 2021

Lawrence Livermore National Laboratory LLNL-PRES-8215612
§ Triaxial, rocky body• Uniform, constant density• No porosity
§ Spherical impactor mass = 570kg• Impactor momentum = 3.42E11gcm/s• No impact angle (head on)
§ Vary the yield strength and density parameters to drive to ∆𝑣 = 0.115 cm/s
The DART Inverse Test

Lawrence Livermore National Laboratory LLNL-PRES-8215613
§ SPH with Tillotson EOS• No damage model— Damage in all cases pushed beta much too high for this exercise
§ Monolithic material (no boulder-like inclusions)
§ 10cm resolution at impact site
§ Assuming no information about total mass (or density) of Dimorphos – fixing only the triaxial dimensions (volume)
3D Calculations

Lawrence Livermore National Laboratory LLNL-PRES-8215614
§ Varying density and yield strength together results in families of ∆𝑣 or 𝛽, grouped by the choice of
maximum yield stress. 𝑌! = 𝑌" +#!$
%&#!$/()"*)#)
The Simulation Outputs Group Into Families
Beta
Cycle
𝑌!=1.5 GPa
𝑌!=2.0
𝑌!=2.5
𝑌!=3.0
𝜌=2.65-2.85 g/cc

Lawrence Livermore National Laboratory LLNL-PRES-8215615
§ Repeated guessing and checking or running thousands of simulations and hoping for a “hit”
Inverse Problems are Typically Time-Consuming
𝑓(𝑥1, 𝑥2, 𝑥3…𝑥𝑛) 𝑔(𝑦1, 𝑦2, 𝑦3…𝑦𝑚)
goal
Informed guessing
Simulations

Lawrence Livermore National Laboratory LLNL-PRES-8215616
§ Most popular fast, supervised machine learning algorithm
§ Non-parametric• Makes no assumptions about the parametric form of the
output functor (good)• Generally requires large datasets to be accurate (bad)
§ Steerable (good)
§ Naïve (bad)
Decision Tree Regressor
Lawrence Livermore National Laboratory LLNL-PRES-8215617
§ Future trials may involve many more input and output parameters• Difficult for humans to find trends
• Easy for computers
§ Computer cycles are cheap – Human cycles are not
§ “Going too far is half the fun of getting nowhere.”- Bill Griffith
Is this Overkill?

Lawrence Livermore National Laboratory LLNL-PRES-8215618
An Initial Scan of the Parameter Space Already Found Two Successes
∆𝑣 = 0.115 cm/s

Lawrence Livermore National Laboratory LLNL-PRES-8215619
ML Algorithm Chooses the Next Parameter Set From the Prediction Space
Prediction space
Mitchell’s Best Sampling choice

Lawrence Livermore National Laboratory LLNL-PRES-82156110
ML Algorithm Refines the Prediction Space and Chooses More Samples

Lawrence Livermore National Laboratory LLNL-PRES-82156111
Enhance…

Lawrence Livermore National Laboratory LLNL-PRES-82156112
Enhance!!!
Lawrence Livermore National Laboratory LLNL-PRES-82156113
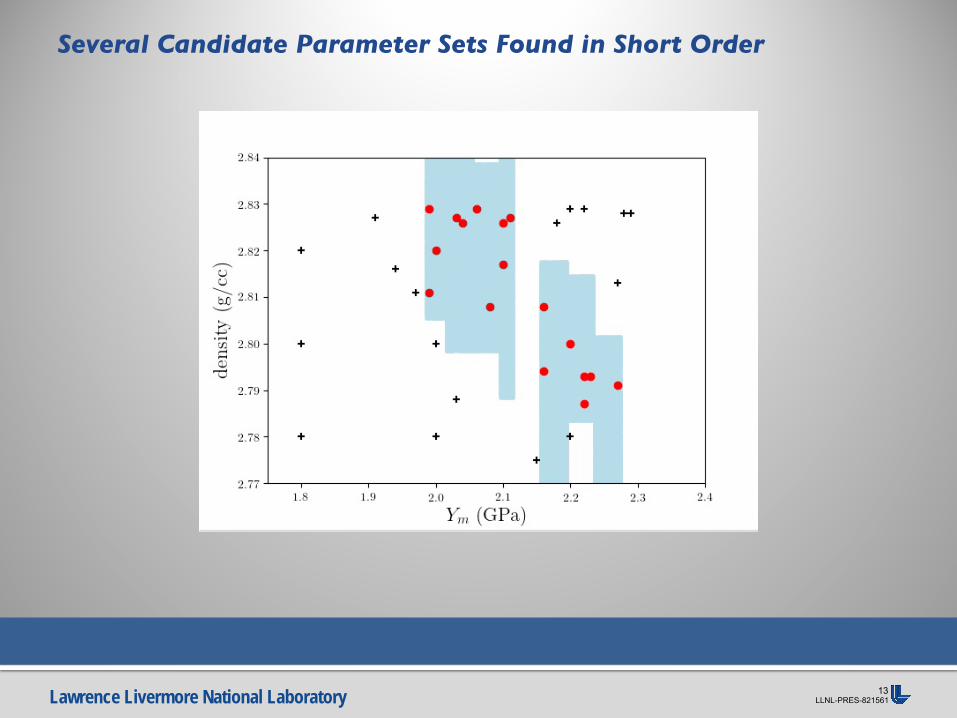
Several Candidate Parameter Sets Found in Short Order

Lawrence Livermore National Laboratory LLNL-PRES-82156114
§ The synthetic observations are most consistent with a uniform, non-porous, single-density body with 𝜌 ≈ 2.79 − 2.83 g/cc and 𝑌- ≈ 2.3 − 2.0 GPa.
§ Including any damage model would require tuning the damage parameters to something akin to no damage, or tuning the density and yield strength to something very unlike rock.
§ We did not assess the effects of porosity as this would not drive the ∆𝑣 results in a helpful direction. Additionally, guidance from the Red Team briefing suggested bulk densities that are inconsistent with porous granite. It is still possible for a highly porous, metallic body to result in a similar ∆𝑣.
Key judgments from the Exercise

Lawrence Livermore National Laboratory LLNL-PRES-82156115
§ 𝜌 and 𝑌- alone are probably not a sufficient input parameter set• A curve of possible input choices yield the same output• 𝑌! and porosity could also drive the decision tree• Lack of damage model is simplifying, but unrealistic
§ ∆𝑣 need not be the only output parameter• Crater size• Velocity dispersion of the debris• Flavor profile of the caramelized debris…
§ I made no mention of the error analysis• And I’m not going to
Major Caveats / Things to Try Next


Projectile Geometry Effects on Momentum Enhancement of Hypervelocity Impact Simulations
Mallory E. DeCoster,1 Dawn Graninger,1 Emma Rainey,1 Michael Owen,2 Angela Stickle, 1
1Johns Hopkins University/Applied Physics Laboratory2Lawrence Livermore National Laboratory

Dimorphos
Is momentum enhancement (𝜷) tied to the efficiency of the projectile to generate ejecta during crater formation? If so, is a simplified point
source solution accurate for efficiently modeling the DART intercept?
Ikeda et al., Procedia Engineering 204 (2017) 138-145
2D
3D
𝑽𝒊𝒎𝒑𝒂𝒄𝒕 = 𝟔𝟓𝟎𝟎𝒎/𝒔
2

Mass = 550 kgVelocity = 6.65 km/s
The simulation parameters defined for the 3D CTH tests were adapted from the benchmarking study and standardized across the different codes. This time
we used a more realistic target material of 30% porous basalt.
3
Asteroid Equation of State: Sesame
Base Asteroid StrengthDimorphos (Target) Shape
Impactor Shapes
Impactor Properties
r
SphereRadius (r) = 80 mMass = 1.3x10⁹ kg
Material
Bulk density = 2.65 g/ccPorous density = 1.8536 g/cc (30% porosity)Pore compaction pressure = 280 MPaP-alpha describes pore crushing process
30% porous basalt
Model: Brittle Damage with Localized Thermal Softening (BDL-Basalt)
2D/3D
Cohesion of intact material: 90 MPaLimiting strength: 3.5 GPaTensile/spall strength: -10 MPa
Simple shapes: Fully dense AluminumSpacecraft: 10 different materials (Al, Al alloys, steel, oxides, water, xenon)

The temporal evolution of 𝜷 for the 2D and 3D spheres are very similar. The momentum enhancement for the 3D sphere over predicts the spacecraft β by
~10%.
4
2D
3D
2D

The temporal crater evolution of the 3D spacecraft is much different than the 3D sphere. In contrast to a singular transient crater that is wider than it is deep, the spacecraft produces a very complex-looking crater shape with side lobes.
4/15/2021 5
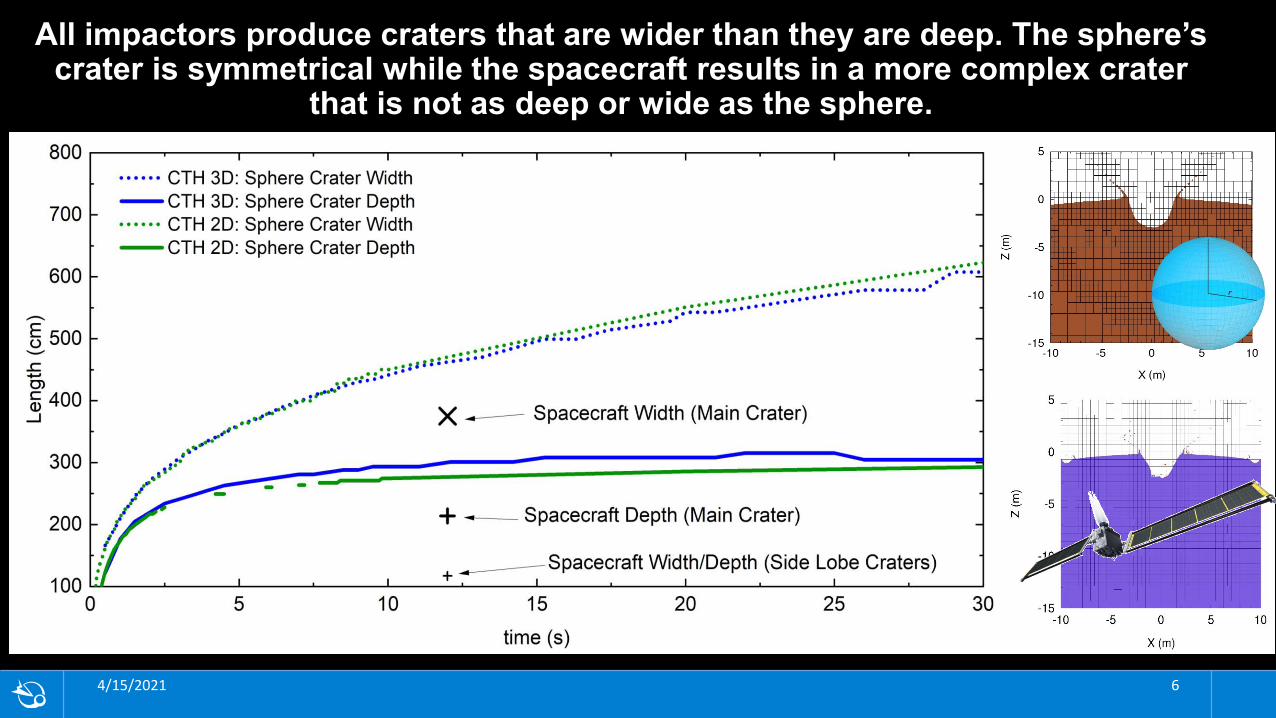
All impactors produce craters that are wider than they are deep. The sphere’s crater is symmetrical while the spacecraft results in a more complex crater
that is not as deep or wide as the sphere.
4/15/2021 6

The 3D DART spacecraft produces ~3x less ejecta mass than the sphere, which is responsible for the smaller β. Our results suggest a fully dense Al sphere
projectile excessively over predicts β for the DART intercept event.
7
𝜷 = 𝟏 +σ𝒎𝒆𝒋𝒆𝒄𝒕𝒂𝒗𝒆𝒋𝒆𝒄𝒕𝒂
𝒎𝒑𝒓𝒐𝒋𝒆𝒄𝒕𝒊𝒍𝒆𝒗𝒑𝒓𝒐𝒋𝒆𝒄𝒕𝒊𝒍𝒆

The sphere projectile creates a very different ejecta cloud compared to the spacecraft. While the range of ejecta velocities are similar, the ejecta formed from the sphere has a
higher population of fast moving material.
4/15/20218

Conclusion: The results show that a simplified model of the projectile over predicts 𝜷 by ~ 10%. The sphere is a more efficient projectile resulting in more total ejecta mass and a
larger population of fast moving material.
This study investigates the effects of projectile geometry on the momentum enhancement factor (𝛽) for efficiently simulating the DART hypervelocity impact.
9

Contact Information:Mallory E. DeCosterSpace and Missile Defense Applications GroupJohns Hopkins University Applied Physics Lab11100 Johns Hopkins Rd.Laurel, MD 20723-6099Office: 240-228-2351e-mail: [email protected]
Session Date and Time: Wednesday, 28 April, 2021
10
DisclaimerThis document was prepared as an account of work sponsored by an agency of the United States government. Neither the United States government nor Lawrence Livermore National Security, LLC, nor any of their employees makes any warranty, expressed or implied, or assumes any legal liability or responsibility for the accuracy, completeness, or usefulness of any information, apparatus, product, or process disclosed, or represents that its use would not infringe privately owned rights. Reference herein to any specific commercial product, process, or service by trade name, trademark, manufacturer, or otherwise does not necessarily constitute or imply its endorsement, recommendation, or favoring by the United States government or Lawrence Livermore National Security, LLC.The views and opinions of authors expressed herein do not necessarily state or reflect those of the United States government or Lawrence Livermore National Security, LLC, and shall not be used for advertising or product endorsement purposes.
Lawrence Livermore National Laboratory is operated by Lawrence Livermore National Security, LLC, for the
U.S. Department of Energy, National Nuclear Security Administration under Contract DE-AC52-07NA27344.
Release Number: LLNL-PRES-821485

Backups
4/15/2021 11

The processes which form large impact craters resulting from hypervelocity impacts are not fully known. We’d like to understand if the projectile can be represented as a simplified point source to make modeling more efficient.
Contact/Compression Stage Excavation StageFrench, Traces of Catastrophe, Lunar and Planetary Institute (2003).
12
is
≈
?

DART benchmarking studies show the propagation of error associated with variables in the phase space. The strength model and material parameters produce the largest uncertainty (~ 20%) in the prediction of crater size and
momentum enhancement.
Stickle et al., Icarus 338 (2020) 113446
13

While it has been shown that β is directly linked to the target material properties, the effects of the projectile geometry on momentum enhancement are relatively unknown. Due to the extra boost provided to β by escaping crater ejecta, it
has been suggested that projectile configurations that promote large amounts of ejecta excavation will be more efficient impactors.
𝜷 =∆𝑷𝑫𝒊𝒎𝒐𝒓𝒑𝒉𝒐𝒔
𝒎𝒑𝒓𝒐𝒋𝒆𝒄𝒕𝒊𝒍𝒆𝒗𝒑𝒓𝒐𝒋𝒆𝒄𝒕𝒊𝒍𝒆
𝜷 = 𝟏 +𝑻𝒐𝒕𝒂𝒍 𝑬𝒋𝒆𝒄𝒕𝒂 𝑴𝒐𝒎𝒆𝒏𝒕𝒖𝒎
𝒎𝒑𝒓𝒐𝒋𝒆𝒄𝒕𝒊𝒍𝒆𝒗𝒑𝒓𝒐𝒋𝒆𝒄𝒕𝒊𝒍𝒆
𝜷 > 1, maybe >> 1
Ejecta = any material with mass above 80 cm of impact plane (1% target radius) with positive velocity normal to the impact plane, and a volume fraction < 1.
14
Ikeda et al., Procedia Engineering 204 (2017) 138-145

The simulation parameters defined for the initial 2D CTH tests were adapted from the benchmarking study and performed with no porosity in the basalt
target.
15
Asteroid Equation of State: Sesame
Base Asteroid StrengthDimorphos (Target) Shape
Impactor Shapes Impactor Properties
Composition: Fully dense AluminumMass = 650 - 1462 KgVelocity = 6.65 km/s
r
SphereRadius (r) = 80 mMass = 1.3x10⁹ Kg
MaterialBulk density = 2.648 g/cc
𝐹 𝑉, 𝑇 = 𝜙0 𝑉 + 𝐹𝑖𝑜𝑛 𝑉, 𝑇 + 𝐹𝑒𝑙(𝑉, 𝑇)
Fully dense basaltCohesion=90 MPa (strong target)
Model: Brittle
Damage with
Localized Thermal
Softening (BDL)
2D
Damage is evolved in Asteroid
10 cm wall 15 cm wall
650 Kg
650 Kg650 Kg1462 Kg

The 2D results show that there is not a strong dependence between 𝜷 and projectile shape when the projectile mass is evenly distributed during impact. A natural question to ask is how does this translate to a more complex projectile
shape, like the full spacecraft model with deployed solar panel wings?
16

The temporal crater evolution of the 3D spacecraft is much different than the 3D sphere. In contrast to a singular transient crater that is wider than it is
deep, the spacecraft produces a very complex-looking crater shape.
17

A much more complex crater is created by the spacecraft, as the solar panels contribute to the coupling of the spacecraft to the target .
18
12 ms39 ms
12 ms
LLNL-PRES-821498This work was performed under the auspices of the U.S. Department of Energy by Lawrence Livermore National Laboratory under contract DE-AC52-07NA27344. Lawrence Livermore National Security, LLC
Spacecraft Geometry Effects on Cratering and Deflection in the DART Mission
J. Michael Owen1, Mallory DeCoster2, and Dawn Graninger2
1Lawrence Livermore National Laboratory, [email protected] Hopkins University/Applied Physics Laboratory
April 28, 2021
Presented at the 2021 Planetary Defense Conference

2LLNL-PRES-821498
▪ We compared models using spheres, cubes, and a spacecraft model based on DAWN.— We found the impactor geometry could affect b by 10%-15% (lowest for the spacecraft model,
highest for symmetric impactors like the sphere).— The crater morphology was also affected:
• Diameters and depths varied by roughly a meter (10%), again with the larger/deeper craters for simple symmetric impactors like the sphere and smaller craters due to the most realistic spacecraft model.
▪ This year we would like to finalize this study with several improvements over our prior study:— Improved material modeling, with damaged rock behaving more like granular material rather than a
strengthless fluid (in Spheral – CTH already had this model).— Higher fidelity models of the spacecraft scenario:
• Realistic materials (previously just used Si and Al).• Real CAD based geometry with true geometry, components, panels, and voids.
– Prior simulations relied on full density solid impactor models, implying we shrank the spacecraft volume in order to match the true mass.
▪ Multiple codes used to model the problem: Spheral (ASPH) and CTH (AMR Eulerian).
At the 2019 PDC we presented early work looking at spacecraft geometry effects.

3LLNL-PRES-821498
▪ We use STL models for each part in a simplified model— Roughly 50 individual components (panels, camera, struts, etc.)— We use one of 4 material models for each component in the model:
Al, Ti-6Al, Stainless Steel, and Si.
▪ Spheral fills each STL part model with ASPH (Adaptive SPH) points, while CTH paints in each component on an AMR mesh.
▪ The total spacecraft mass is 535kg, which isdistributed between the materials as:
The spacecraft model is based on a simplified DART CAD model.
Material Mass
Al 377kg
Si 57.3kg
Ti-6Al 41.35kg
Stainless Steel 59.35kg
DART geometry rendering
Polyhedral reconstruction in Spheral (materials)

4LLNL-PRES-821498
▪ The game here is to maintain the same impactor mass (535 kg) and impact velocity (6.65 km/sec), while varying the geometry.
▪ In both Spheral and CTH we compare two impactorgeometries: DART and a sphere.
▪ In Spheral we have also modeled a few more cases:— A hollow cuboid with the same moment of inertia
as DART.— A series of solid cylinders (or disks), with diameters
in the range D=[0.5, 1, 1.25, 1.5] meters.
▪ All cases model Dimorphos as a uniform SiO2
sphere of 160 m diameter and bulk porosity f=30%.
We consider a variety of idealized impactor geometries for comparison with the high fidelity DART model.
Sphere
Hollow cuboid
Cylinders (or disks)

5LLNL-PRES-821498
▪ In these models we impact with solar arrays parallel to Dimorphos’ surface.
▪ This animation shows the materials in Spheral’spolyhedral reconstruction.
▪ This is a slice through the simulation, run to 50 milliseconds final time.
▪ The crater is not a simple bowl: the solar panel structures (primarily the stainless steel boomsand rollers) result in shallow craters on both sides of the primary crater.
The full DART model impactor results in a fairly complex crater, with evident side craters due to the solar arrays and booms.

6LLNL-PRES-821498
▪ In these mass density images we can clearly see the imprint of full DART geometry at 50 ms.— Compared with the spherical impactor the central crater is shallower and not as wide.— The side craters are evident from the solar arrays (at least for this simple monolithic target at early time).
The effect of the CAD geometry on the crater is evident compared with the spherical impactor.
DART impactorMass density
Sphere impactorMass density

7LLNL-PRES-821498
The crater tends to be smaller for more complex impactor shapes that do not penetrate as well.
SphereDART Cuboid
Disk (50cm) Disk (100cm) Disk (125cm) Disk (150cm)
▪ This is particularly clear for the cylinder/disk impactors: the wider/thinner the disk, the shallower and narrower the crater.
▪ CTH tends to find smaller crater volumes than Spheral.— Note, the CTH DART model is shown at 13 ms (not 50 ms), and so may grow with time still.
t=13ms
8LLNL-PRES-821498
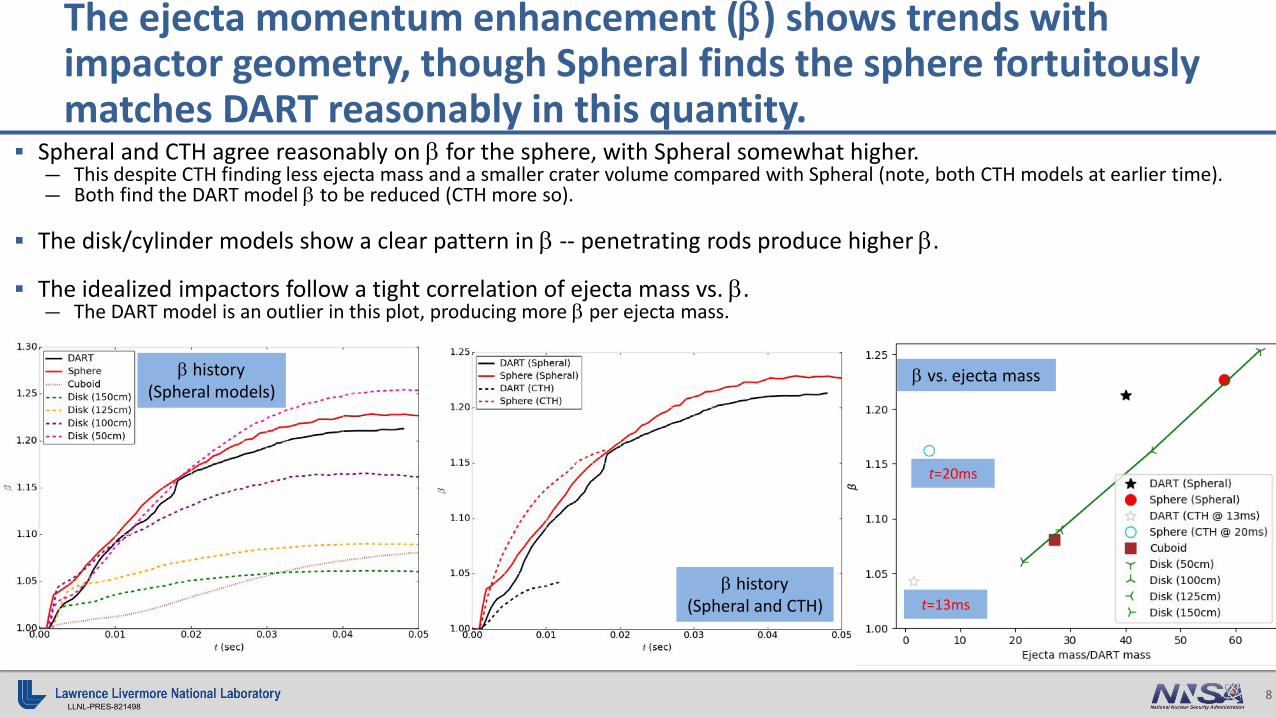
▪ Spheral and CTH agree reasonably on b for the sphere, with Spheral somewhat higher.— This despite CTH finding less ejecta mass and a smaller crater volume compared with Spheral (note, both CTH models at earlier time).— Both find the DART model b to be reduced (CTH more so).
▪ The disk/cylinder models show a clear pattern in b -- penetrating rods produce higher b.
▪ The idealized impactors follow a tight correlation of ejecta mass vs. b.— The DART model is an outlier in this plot, producing more b per ejecta mass.
The ejecta momentum enhancement (b) shows trends with impactor geometry, though Spheral finds the sphere fortuitously matches DART reasonably in this quantity.
b history (Spheral models)
b history (Spheral and CTH)
b vs. ejecta mass
t=20ms
t=13ms

9LLNL-PRES-821498
The ejecta velocity distribution is also affected by impactor geometry, though again the sphere and DART agree reasonably.
Velocity/mass distribution:CTH vs. Spheral
Velocity/mass distribution:assorted impactors
▪ The shapes of the ejecta distributions are similar for the sphere vs. DART.— Spheral finds the magnitudes of the two case are close, though the mass of slow ejecta is reduced for DART.— CTH shows the DART distributions are similar in shape but reduced in magnitude vs. the sphere.— Recall though the CTH calculations are at earlier times (20ms for the sphere, 13ms for DART).
▪ The disk/cylinder models showconsistent effects:— Ejecta from flat disks
is systematicallylower at all velocities.
— The rod shows the most ejecta/highestb of all cases.
10LLNL-PRES-821498
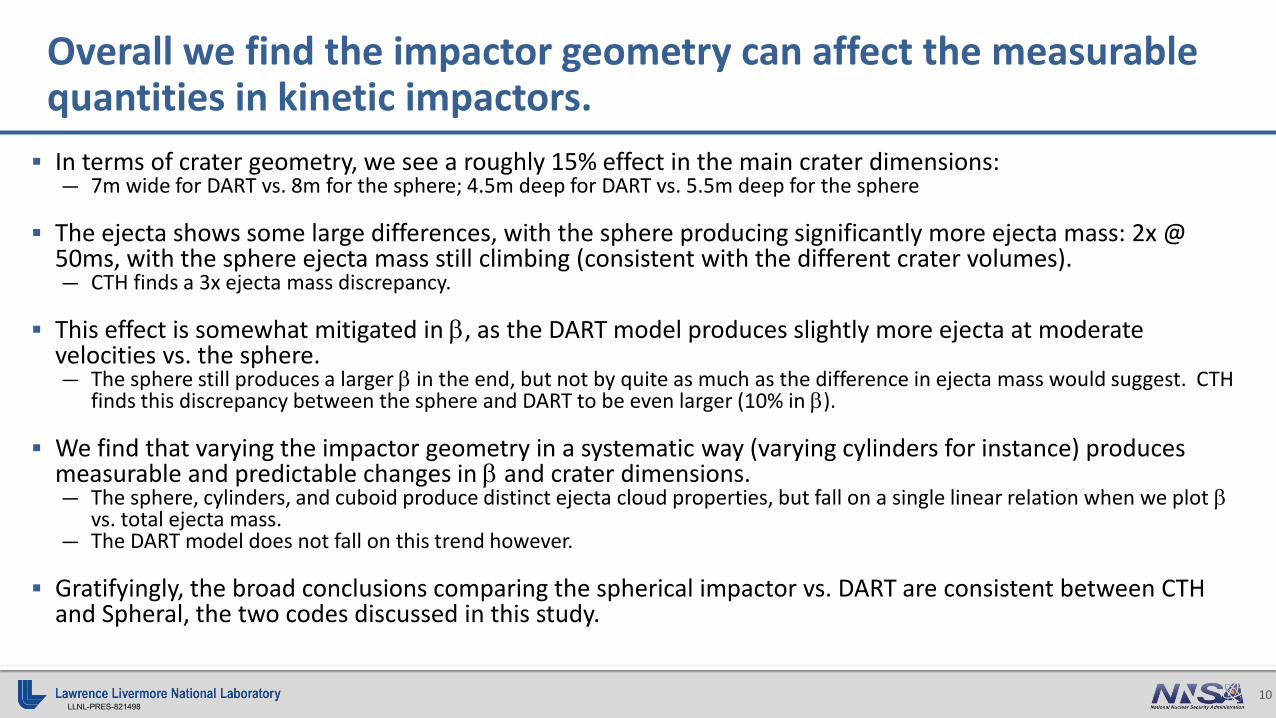
▪ In terms of crater geometry, we see a roughly 15% effect in the main crater dimensions:— 7m wide for DART vs. 8m for the sphere; 4.5m deep for DART vs. 5.5m deep for the sphere
▪ The ejecta shows some large differences, with the sphere producing significantly more ejecta mass: 2x @ 50ms, with the sphere ejecta mass still climbing (consistent with the different crater volumes).— CTH finds a 3x ejecta mass discrepancy.
▪ This effect is somewhat mitigated in b, as the DART model produces slightly more ejecta at moderate velocities vs. the sphere.— The sphere still produces a larger b in the end, but not by quite as much as the difference in ejecta mass would suggest. CTH
finds this discrepancy between the sphere and DART to be even larger (10% in b).
▪ We find that varying the impactor geometry in a systematic way (varying cylinders for instance) produces measurable and predictable changes in b and crater dimensions.— The sphere, cylinders, and cuboid produce distinct ejecta cloud properties, but fall on a single linear relation when we plot b
vs. total ejecta mass.— The DART model does not fall on this trend however.
▪ Gratifyingly, the broad conclusions comparing the spherical impactor vs. DART are consistent between CTH and Spheral, the two codes discussed in this study.
Overall we find the impactor geometry can affect the measurable quantities in kinetic impactors.

DisclaimerThis document was prepared as an account of work sponsored by an agency of the United States government. Neither the United States government nor Lawrence Livermore National Security, LLC, nor any of their employees makes any warranty, expressed or implied, or assumes any legal liability or responsibility for the accuracy, completeness, or usefulness of any information, apparatus, product, or process disclosed, or represents that its use would not infringe privately owned rights. Reference herein to any specific commercial product, process, or service by trade name, trademark, manufacturer, or otherwise does not necessarily constitute or imply its endorsement, recommendation, or favoring by the United States government or Lawrence Livermore National Security, LLC.The views and opinions of authors expressed herein do not necessarily state or reflect those of the United States government or Lawrence Livermore National Security, LLC, and shall not be used for advertising or product endorsement purposes.
Lawrence Livermore National Laboratory is operated by Lawrence Livermore National Security,
LLC, for the U.S. Department of Energy, National Nuclear Security Administration under
Contract DE-AC52-07NA27344.

Q&A Session 7b: Deflection & Disruption Testing

Break Up next: Session 8b - Mission & Campaign Design