Flexural and Cyclic Behaviour of Hollow and Concrete-filled ...
Upload
khangminh22Category
view
1download
0
Citation: Gu, W.; Liu, H.; Dong, Y.
Experimental Study on the Flexural
Properties of Concrete Beams
Reinforced with Hybrid Steel/
Fiber-Belt-Bars. Materials 2022, 15,
3505. https://doi.org/10.3390/
ma15103505
Academic Editor: Francesco
Fabbrocino
Received: 11 April 2022
Accepted: 11 May 2022
Published: 13 May 2022
Publisher’s Note: MDPI stays neutral
with regard to jurisdictional claims in
published maps and institutional affil-
iations.
Copyright: © 2022 by the authors.
Licensee MDPI, Basel, Switzerland.
This article is an open access article
distributed under the terms and
conditions of the Creative Commons
Attribution (CC BY) license (https://
creativecommons.org/licenses/by/
4.0/).
materials
Article
Experimental Study on the Flexural Properties of ConcreteBeams Reinforced with Hybrid Steel/Fiber-Belt-BarsWenhu Gu 1, Hengrui Liu 1,2,* and Yun Dong 1
1 Faculty of Architecture and Civil Engineering, Huaiyin Institute of Technology, Huai’an 223001, China;[email protected] (W.G.); [email protected] (Y.D.)
2 College of Water Conservancy and Hydropower Engineering, Hohai University, Xikang Road No. 1,Nanjing 210098, China
* Correspondence: [email protected]; Tel.: +86-188-5200-0661
Abstract: Reinforcement corrosion poses a great threat to the safety of reinforced concrete structures,and the fiber-reinforced polymer is the ideal material to partially replace steel bars due to the highstrength, light weight and good durability. However, the selection of appropriate fiber materials anda reasonable ratio of fiber bar to steel bar is not clear. Here, we measured the mechanical propertiesof fiber bars containing aramid fiber and carbon fiber. The deflection deformation, crack distributionand maximum crack width of the concrete upon various loads were experimentally and theoreticallyinvestigated. The predictions of the maximum crack width and deflection of reinforced concretebeams under various loads were proposed in ACI standard, which may provide guidance for furtherapplications of fiber-belt-bar-containing concrete beams.
Keywords: fiber-belt-bar; reinforced concrete beam; mechanical property; flexural test; bearing capacity
1. Introduction
Reinforcement corrosion is an important factor affecting the durability of reinforcedconcrete structures, and this poses a great threat to the safety of reinforced concrete (RC)structures [1–3]. Particularly, the corrosion in prestressed concrete bridge-beams provokessignificant prestress losses, which induces cracking and excessive deflections during serviceconditions [4,5]. Fiber-reinforced polymer (FRP) is considered to be an ideal material toreplace steel bars due to its high strength, light weight and good durability [6,7].
In the past few decades, FRP has been widely used in civil engineering, especially insome corrosive environments. However, the FRP bars are linear elastic materials with alow elastic modulus and brittle failure, which limits the further applications of FRP bars.For typical FRP materials, including carbon-fiber materials (CFRP), aramid-fiber materials(AFRP) and glass-fiber materials (GFRP), all have the weaknesses of linear elasticity, brittlefailure and low elongation [8]. The ultimate strains of CFRP, AFRP and GFRP were 1.5%,3% and 4%, respectively [9,10]. As a result, the ductility of current FRP bars and concretestructures was not ideal [11].
In recent years, mixtures of FRP and steel bars have been attempted to improve thestiffness and bearing capacity [12–15]. Tan et al. first proposed the concept of a replacementreinforcement ratio (Af/As, Af: Cross-sectional area of fiber and As: Cross-sectional areaof steel) and found that mixed RC beams can provide sufficient bearing capacity whenthe tensile force provided by FRP bars does not exceed half of the total tensile force [16].The effect of replacement reinforcement ratio (Af/As) on the structural bearing capacitywas also studied.
Aiello et al., deduced that using sufficient reinforcement in FRP-RC beams can improvethe bearing capacity and bending deformation of beams [17]. Leung and Balendran foundthat reducing the content of FRP can improve the ductility of concrete; however, the bearing
Materials 2022, 15, 3505. https://doi.org/10.3390/ma15103505 https://www.mdpi.com/journal/materials
Materials 2022, 15, 3505 2 of 16
capacity is insufficient [18]. More studies have been focused on the reasonable range ofAf/As ratio in mixed concrete beams.
Qin et al. deduced that Af/As in the range of 1 to 2.5 had high ductility and bearingcapacity [19]. Pang et al. [20] suggested that the most reasonable value of Af/As was in therange of 0.1–2.1. In further study of the mixed concrete beams, Qu et al. [21] calculatedthe average reinforcement ratio of beams by the equal-stiffness principle EsAs = EfAf andcompared it with RC beams in ACI318-19 [22]. The relationship between the reinforcementratio and failure modes of beams was proposed. The acceptability and debate of FRP wereboth increasing in the civil engineering field.
Here, we characterized performance of fiber-belt-bars containing aramid fiber andcarbon fiber and their mixtures. The tensile reinforcements in the tensile zone were replacedby fiber-belt-bars in reinforced concrete beams, and the crack distribution and deflectiondeformation of the concrete beam under various vertical loads were studied. The theo-retical calculations support our experimental results, which will contribute to the furtherdevelopment and wider applications of fiber-reinforced concretes.
2. Materials and Methods2.1. Materials
The flexural behavior of RCs with single and hybrid fiber-belt-bars has been studiedindependently. In our experiments, aramid fiber (Kevlar29 and Kevlar49) and carbon fiber(T300) were selected because they possess excellent tensile properties in contrast to otherfiber materials. In the four types of single fiber-belt-bars, AF-K29-1 and AF-K29-2 are madeof Kevlar29 with actual cross-sectional areas of 16.5 and 25 mm2, respectively. AF-K49-1and AF-K49-2 are made of Kevlar49 with actual cross-sectional areas of 16.5 and 25 mm2,respectively. In the two types of hybrid fiber-belt-bars, HAA1 is made of 80% Kevlar29,10% Kevlar49 and 10% T300. HAC1 contains 80% Kevlar29 and 20% T300. The actualcross-sectional area of both hybrid fiber-belt-bars is 25 mm2. Table 1 gives the detailedparameters of these fiber-belt-bars, and Figure 1 presents the photos of them.
Table 1. Details of the fiber-belt-bar parameters.
Sample Code Materials Representation Area (mm2) Actual Cross-Sectional Area (mm2)
AF-K29-1 AFRP (Kevlar29) 12 × 3 16.5AF-K29-2 AFRP (Kevlar29) 20 × 3 25AF-K49-1 AFRP (Kevlar49) 12 × 3 16.5AF-K49-2 AFRP (Kevlar49) 20 × 3 25
HAA1 80% K29 + 10% K49 + 10% T300 20 × 3 25HAC1 80% K29 + 20% T300 20 × 3 25
Materials 2022, 15, x FOR PEER REVIEW 3 of 17
Figure 1. The photos of fiber-belt-bars.
A total of four beams were designed, and their corresponding codes were RAL-1, RAL-2, RAL-3 and RHL-1. The tensile reinforcement was made of fiber-belt-bar and steel bar, and AF-K49 and HAC1 were selected as fiber-belt-bars. HRB400 was used for tension reinforcement, and HPB235 was used for stirrup and reinforcement in compression zone. In Table 2, the types and quantity of fiber-belt-bar and reinforcement ratio and other pa-rameters are listed.
Table 2. Details of the beam specimen parameters.
Sample Code Fiber Types Number of Fiber-Belt-Bar (Root)
ρf (%) As (mm2) ρs (%) Kf
RAL-1 AF-K49-2 1 0.18 100.48 0.3 0.37 RAL-2 AF-K49-2 3 0.54 100.48 0.3 0.64 RAL-3 AF-K49-2 4 0.73 100.48 0.3 0.72 RHL-1 HAC1 3 0.54 100.48 0.3 0.64
Note: Af: Cross section area of fiber with reinforcement; ρf: fiber-belt-bar reinforcement ratio; As: Reinforcement section area; ρs: Ratio of steel reinforcement; Kf: Af/(Af + As).
Table 3 lists the properties of concrete and different kinds of fiber-belt-bar in concrete beams. The compressive strength of concrete is obtained by compression of cubic stand-ard specimens. Different types of fiber-belt-bars have different tensile moduli, tensile strengths and elongation by tension.
Table 3. The material properties of beam specimens.
Materials Concrete AF-K49-2 HAC1
Performance In-dictors
The Compressive Strength fcu (MPa)
Tensile Modulus Eaf (GPa)
Tensile Strength ffu (MPa)
Elongation εafu
Tensile Modulus Eaf (GPa)
Tensile Strength ffu (MPa)
Elongation εafu
Average values 48 24 946 0.039 21 783 0.037 Standard values 43 — 922 — — 760 —
2.2. Experimental Methods The single fiber-belt-bar in this test are aramid fiber (Kevlar29 and Kevlar49). Hybrid
fibers include Kevlar29, Kevlar49, T300 and Kevlar29, T300. Figure 2 shows the tensile test device, mainly using WE300 tensile-testing machine and independently developed an-chor. In the process of tensile testing, the deformation of fiber-belt-bars is made by con-trolling the load. For each time, we increase 10 kN, and the deformation of the fiber-belt-bar was measured after the specimen became stable for 30 s. For each type of fiber-belt-bar, 10 samples with 100 mm in length were used for tensile testing. The specific size of each group is shown in Table 1.
Figure 1. The photos of fiber-belt-bars.
The mechanical properties of fiber-belt-bars are affected by different braiding tech-niques. In our work, the fiber-belt-bar was braided with a plain weave. According to thetensile characteristics of the fiber-belt-bar, the tension was mainly borne by the meridionalfibers, while the weft fibers bore little load.

Materials 2022, 15, 3505 3 of 16
A total of four beams were designed, and their corresponding codes were RAL-1,RAL-2, RAL-3 and RHL-1. The tensile reinforcement was made of fiber-belt-bar and steelbar, and AF-K49 and HAC1 were selected as fiber-belt-bars. HRB400 was used for tensionreinforcement, and HPB235 was used for stirrup and reinforcement in compression zone.In Table 2, the types and quantity of fiber-belt-bar and reinforcement ratio and otherparameters are listed.
Table 2. Details of the beam specimen parameters.
Sample Code Fiber Types Number ofFiber-Belt-Bar (Root) ρf (%) As (mm2) ρs (%) Kf
RAL-1 AF-K49-2 1 0.18 100.48 0.3 0.37RAL-2 AF-K49-2 3 0.54 100.48 0.3 0.64RAL-3 AF-K49-2 4 0.73 100.48 0.3 0.72RHL-1 HAC1 3 0.54 100.48 0.3 0.64
Note: Af: Cross section area of fiber with reinforcement; ρf: fiber-belt-bar reinforcement ratio; As: Reinforcementsection area; ρs: Ratio of steel reinforcement; Kf: Af/(Af + As).
Table 3 lists the properties of concrete and different kinds of fiber-belt-bar in concretebeams. The compressive strength of concrete is obtained by compression of cubic standardspecimens. Different types of fiber-belt-bars have different tensile moduli, tensile strengthsand elongation by tension.
Table 3. The material properties of beam specimens.
Materials Concrete AF-K49-2 HAC1
PerformanceIndictors
The CompressiveStrength fcu (MPa)
TensileModulusEaf (GPa)
TensileStrengthffu (MPa)
Elongationεafu
TensileModulusEaf (GPa)
TensileStrengthffu (MPa)
Elongationεafu
Average values 48 24 946 0.039 21 783 0.037Standard values 43 — 922 — — 760 —
2.2. Experimental Methods
The single fiber-belt-bar in this test are aramid fiber (Kevlar29 and Kevlar49). Hybridfibers include Kevlar29, Kevlar49, T300 and Kevlar29, T300. Figure 2 shows the tensile testdevice, mainly using WE300 tensile-testing machine and independently developed anchor.In the process of tensile testing, the deformation of fiber-belt-bars is made by controllingthe load. For each time, we increase 10 kN, and the deformation of the fiber-belt-barwas measured after the specimen became stable for 30 s. For each type of fiber-belt-bar,10 samples with 100 mm in length were used for tensile testing. The specific size of eachgroup is shown in Table 1.
Materials 2022, 15, x FOR PEER REVIEW 4 of 17
The main control parameters of the fiber-belt-bar were the type of fiber material and the sectional size of the fiber-belt-bar. The mechanical properties of fiber-belt-bars under different control parameters were studied. This test mainly included the tensile strength, elastic modulus, ultimate elongation and stress–strain curve of the fiber-belt-bar.
Figure 2. The photos of tensile testing device.
The mechanical properties of concrete were tested in accordance with the Chinese standard GBT 50081-2019. The section size of the specimen was B × H = 150 mm × 250 mm, the total length of the specimen was L = 2400 mm, and the span of the beam was 2100 mm. The specific parameters of the specimen are shown in Table 2. Beam loading instruments and equipment mainly include the loading support, distribution beam, jack, sensor, dis-placement meter, etc. The loading device is shown in Figure 3a. All beams were subjected to two concentrated loads, which were applied by hydraulic jacks. The loading was in-creased step by step with 5 kN until the cracking appeared. Then, the loading was increas-ing 10 kN at each step until failure of the specimen.
Figure 3. Loading test of the beam. (a) Beam loading device diagram, (b) Specimen size and rein-forcement diagram, (c) Reinforcement diagram of cross section of specimen.
3. Result and Discussion 3.1. Experimental Study on the Mechanical Properties
Figure 2. The photos of tensile testing device.

Materials 2022, 15, 3505 4 of 16
The main control parameters of the fiber-belt-bar were the type of fiber material andthe sectional size of the fiber-belt-bar. The mechanical properties of fiber-belt-bars underdifferent control parameters were studied. This test mainly included the tensile strength,elastic modulus, ultimate elongation and stress–strain curve of the fiber-belt-bar.
The mechanical properties of concrete were tested in accordance with the Chinese stan-dard GBT 50081-2019. The section size of the specimen was B × H = 150 mm × 250 mm,the total length of the specimen was L = 2400 mm, and the span of the beam was 2100 mm.The specific parameters of the specimen are shown in Table 2. Beam loading instrumentsand equipment mainly include the loading support, distribution beam, jack, sensor, dis-placement meter, etc. The loading device is shown in Figure 3a. All beams were subjected totwo concentrated loads, which were applied by hydraulic jacks. The loading was increasedstep by step with 5 kN until the cracking appeared. Then, the loading was increasing 10 kNat each step until failure of the specimen.
Materials 2022, 15, x FOR PEER REVIEW 4 of 17
The main control parameters of the fiber-belt-bar were the type of fiber material and the sectional size of the fiber-belt-bar. The mechanical properties of fiber-belt-bars under different control parameters were studied. This test mainly included the tensile strength, elastic modulus, ultimate elongation and stress–strain curve of the fiber-belt-bar.
Figure 2. The photos of tensile testing device.
The mechanical properties of concrete were tested in accordance with the Chinese standard GBT 50081-2019. The section size of the specimen was B × H = 150 mm × 250 mm, the total length of the specimen was L = 2400 mm, and the span of the beam was 2100 mm. The specific parameters of the specimen are shown in Table 2. Beam loading instruments and equipment mainly include the loading support, distribution beam, jack, sensor, dis-placement meter, etc. The loading device is shown in Figure 3a. All beams were subjected to two concentrated loads, which were applied by hydraulic jacks. The loading was in-creased step by step with 5 kN until the cracking appeared. Then, the loading was increas-ing 10 kN at each step until failure of the specimen.
Figure 3. Loading test of the beam. (a) Beam loading device diagram, (b) Specimen size and rein-forcement diagram, (c) Reinforcement diagram of cross section of specimen.
3. Result and Discussion 3.1. Experimental Study on the Mechanical Properties
Figure 3. Loading test of the beam. (a) Beam loading device diagram, (b) Specimen size andreinforcement diagram, (c) Reinforcement diagram of cross section of specimen.
3. Result and Discussion3.1. Experimental Study on the Mechanical Properties3.1.1. Analysis of the Mechanical Properties of Single Fiber Belt
According to the test results of tensile failure specimens in the whole process of stress,the stress–strain curve relationship of fiber-reinforced specimens is drawn in Figure 4.The results showed that the stress–strain relationship changed linearly in the whole processfrom the beginning of loading to the complete failure of the specimen, and the failure ofthe specimen had no obvious warning.
The sudden fracture failure of the fiber-belt-bar without an obvious yield stage be-longed to brittle failure. The stress–strain relationship curve was “downward convex”,and the strain change rate slowed down with the increase of stress. As the fibrin in theribbon was bent, the fibrin changed from bent to straightened when the ribbon begins tostretch. The deformation of the filament was mainly its own deformation, and thus thedeformation of the fiber-belt-bar became slow.

Materials 2022, 15, 3505 5 of 16
Materials 2022, 15, x FOR PEER REVIEW 5 of 17
3.1.1. Analysis of the Mechanical Properties of Single Fiber Belt According to the test results of tensile failure specimens in the whole process of
stress, the stress–strain curve relationship of fiber-reinforced specimens is drawn in Figure 4. The results showed that the stress–strain relationship changed linearly in the whole process from the beginning of loading to the complete failure of the specimen, and the failure of the specimen had no obvious warning.
The sudden fracture failure of the fiber-belt-bar without an obvious yield stage be-longed to brittle failure. The stress–strain relationship curve was “downward convex”, and the strain change rate slowed down with the increase of stress. As the fibrin in the ribbon was bent, the fibrin changed from bent to straightened when the ribbon begins to stretch. The deformation of the filament was mainly its own deformation, and thus the deformation of the fiber-belt-bar became slow.
Figure 4. Stress–strain curves of fiber-belt-bars.
It can be seen from the figure that the tensile strength of fiber-belt-bars with different materials and sectional sizes was also different. When the sectional size of Kevlar29 was fixed, the tensile strength of Kevlar29 was obviously smaller than that of Kevlar49. There-fore, when different fiber materials were used for braiding, the tensile strength of the fiber-belt-bar was distinctive. The tensile strength of Kevlar29 fiber material was greater than Kevlar49 fiber material; however, the tensile strength of Kevlar29 braided fiber-belt-bar was smaller than Kevlar49 braided fiber-belt-bar, because the loss degree of Kevlar29 fiber was greater than Kevlar49 fiber in the weaving process.
The tensile strength is also affected by the change of the sectional size of the fiber-belt-bar. In the above tensile test, the sectional size of the fiber-belt-bar was 12 × 3 and 20 × 3, and the tensile strength of the fiber-belt-bar with a section of 20 × 3 was slightly larger than that of the fiber-belt-bar with a section of 12 × 3. When the fiber-belt-bar was loosely braided, the tightness M value was small and the tensile strength of the fiber-belt-bar was large. Otherwise, the tensile strength was low.
As shown in Table 4, the elastic modulus of the fiber-belt-bar was significantly smaller than that of the fiber filament, which was about 20~30% of the elastic modulus of the fiber filament. When the fiber-belt-bar was in the natural state, the meridional filament in the fiber-belt-bar was bent. When the band was subjected to tension, the deformation of the meridional bundle consists of two behaviors, the process of fiber bundle from bend-ing state to straightening state and the stretching deformation process of fiber bundle it-self.
When tensile force was applied to the fiber-belt-bar, two kinds of deformation oc-curred in the fiber filament of the fiber-belt-bar. However, for the determination of elastic
Figure 4. Stress–strain curves of fiber-belt-bars.
It can be seen from the figure that the tensile strength of fiber-belt-bars with differentmaterials and sectional sizes was also different. When the sectional size of Kevlar29was fixed, the tensile strength of Kevlar29 was obviously smaller than that of Kevlar49.Therefore, when different fiber materials were used for braiding, the tensile strength of thefiber-belt-bar was distinctive. The tensile strength of Kevlar29 fiber material was greaterthan Kevlar49 fiber material; however, the tensile strength of Kevlar29 braided fiber-belt-barwas smaller than Kevlar49 braided fiber-belt-bar, because the loss degree of Kevlar29 fiberwas greater than Kevlar49 fiber in the weaving process.
The tensile strength is also affected by the change of the sectional size of the fiber-belt-bar. In the above tensile test, the sectional size of the fiber-belt-bar was 12 × 3 and 20 × 3,and the tensile strength of the fiber-belt-bar with a section of 20 × 3 was slightly largerthan that of the fiber-belt-bar with a section of 12 × 3. When the fiber-belt-bar was looselybraided, the tightness M value was small and the tensile strength of the fiber-belt-bar waslarge. Otherwise, the tensile strength was low.
As shown in Table 4, the elastic modulus of the fiber-belt-bar was significantly smallerthan that of the fiber filament, which was about 20~30% of the elastic modulus of the fiberfilament. When the fiber-belt-bar was in the natural state, the meridional filament in thefiber-belt-bar was bent. When the band was subjected to tension, the deformation of themeridional bundle consists of two behaviors, the process of fiber bundle from bending stateto straightening state and the stretching deformation process of fiber bundle itself.
When tensile force was applied to the fiber-belt-bar, two kinds of deformation occurredin the fiber filament of the fiber-belt-bar. However, for the determination of elastic modulusof fiber filament, the deformation of fiber material only included its own deformation.Therefore, when the fiber-belt-bar and the fiber filament were subjected to tension, the fiber-belt-bar produced large deformation under the same load; therefore, the elastic modulus ofthe fiber-belt-bar was relatively small.
The results indicated that the ultimate elongation of the fiber-belt-bar was larger thanthat of the fiber filament. When the fiber-belt-bar was braided and the larger the coefficientM was, the closer the fiber was braided. The deformation of the fiber-belt-bar in thestretching process was mainly reflected in the elongation deformation of the fiber bundleitself. When the coefficient M was smaller and the fiber braid was looser, the deformationof the fiber-belt-bar was mainly reflected in the deformation process from bending state tostraightening state of the meridional fiber bundle.

Materials 2022, 15, 3505 6 of 16
Table 4. Elastic modulus and elongation of fiber-belt-bars.
Sample Code AF-K29-1 AF-K29-2 AF-K49-1 AF-K49-2 HAA1 HAC1
Effective cross section (mm2) 16.5 25 16.5 25 25 25Average values (MPa) 873 874 921 946 845 783Standard values (MPa) 829 828 871 922 824 760standard deviation σ 27 28 31 24 13 14
Modulus of elasticity (GPa) 26 22 26 24 20 21Elongation (%) 3.36 3.97 3.54 3.94 5.35 5.50
3.1.2. Analysis of Mechanical Properties of Hybrid Fiber-Belt-Bars
From the above test analysis, it can be seen that the stress–strain curve of a singlefiber strip tensile showed a linear change and there was no obvious yield stage. Therefore,the fiber strip tensile had good ductility unlike the steel bar. According to the theoryof fiber composite material, the hybrid braiding of two or more kinds of fiber materialhad excellent properties that single fiber material did not have, which can improve thestiffness and toughness of fiber material. This test mainly uses aramid fiber and carbon-fibermaterials. The common fiber hybrid structures mainly include uniform hybrid, interlayerhybrid, sandwich hybrid and composite hybrid. The fiber-belt-bars in this test mainlyadopt uniform hybrid structure to weave fiber materials evenly.
Table 4 lists the average values and standard values of tensile strength of HAA1and HAC1, respectively. It can be seen from Table 4 that the tensile strength of hybridfiber-belt-bars was smaller than that of Kevlar49 woven with single fiber material in theabove test. In the process of hybrid fiber-belt-bar stretching, the carbon-fiber material firstreached the ultimate tensile strain, the carbon-fiber material broken, and then the aramidfiber material broken. Therefore, the tensile strength of the specimen was smaller than thatof the fiber-belt-bar sample braided by a single aramid fiber material.
The failure of hybrid fiber-belt-bars in tensile test was obvious, and there was a timesequence of failure between different materials, and thus the stress–strain relationship curvewas a folded line. Therefore, the elastic modulus of hybrid fiber-belt-bars is distinctiveat different stress stages. Taking Kevlar29 and T300 hybrid braided fiber-belt-bar as anexample, when the fiber-belt-bar just began to be affected by tension, its elastic moduluswas mainly reflected by Kevlar29 and T300. When the tension reached a certain degree,T300 broken.
Only Kevlar29 in the fiber-belt-bar was affected by the tension; thus, the elasticmodulus at this time was mainly reflected by Kevlar29. For concrete structures with fiberbars, the elastic modulus of origin of fiber bars was mainly considered in the study of theperformance of fiber bars, that is, the initial elastic modulus of hybrid braided fiber barswas studied. Based on the above analysis, the hybrid braided fiber-belt-bar had a certainductility compared with the single fiber-belt-bar; however, its tensile strength decreased.With the increase of carbon fiber content, the decrease degree of tensile strength of hybridfiber-belt-bar increased.
3.2. Flexural Test on Normal Section of Fiber Reinforced Concrete Beam3.2.1. Characteristics of Cracking Load and Crack Distribution
Figure 5 shows the crack distribution and characteristics of RAL-1, RAL-2, RAL-3and RHL-1, respectively. The sketch of crack distribution and characteristics of each testbeam under load is redrawn in Figure 6. The results showed that the development of eachfracture was not synchronous. At the beginning of loading, the crack on the side of concreteextends up faster; however, when it reached a certain height, the crack extension heightchanged slowly.

Materials 2022, 15, 3505 7 of 16
Materials 2022, 15, x FOR PEER REVIEW 7 of 17
3.2. Flexural Test on Normal Section of Fiber Reinforced Concrete Beam 3.2.1. Characteristics of Cracking Load and Crack Distribution
Figure 5 shows the crack distribution and characteristics of RAL-1, RAL-2, RAL-3 and RHL-1, respectively. The sketch of crack distribution and characteristics of each test beam under load is redrawn in Figure 6. The results showed that the development of each fracture was not synchronous. At the beginning of loading, the crack on the side of con-crete extends up faster; however, when it reached a certain height, the crack extension height changed slowly.
At the same time, the crack spacing of the component with different reinforcement ratio was different. The amount of reinforcement in the tensile zone of the four test beams was the same; however, the number of fiber-belt-bars was distinctive. When there were more fiber-belt-bars in the tension zone, the width of cracks was smaller and the number of cracks was larger. The crack width and the average crack spacing were larger when the fiber-belt-bars were less in the tension zone.
Figure 5. Test photos of RAL-1, RAL-2, RAL-3 and RHL-1. (a) Beam bending deformation, (b) Dis-tribution of major fractures, (c) Crushing failure of concrete . Figure 5. Test photos of RAL-1, RAL-2, RAL-3 and RHL-1. (a) Beam bending deformation, (b) Distri-bution of major fractures, (c) Crushing failure of concrete.
Materials 2022, 15, x FOR PEER REVIEW 8 of 17
Figure 6. Crack shape and distribution of the test beam. (a) RAL-1, (b) RAL-2, (c) RAL-1, (d) RHL-1.
Figure 7a shows the development of the maximum crack width of each test beam with the change of load. When the load was applied to about 30 kN, the crack-width–load relationship curve had an obvious “inflection point”. According to the above strain anal-ysis of the fiber belt and steel bar in the tensile zone under different loads, when the load reached about 30 kN, the steel bar entered the yield stage, because the crack width in the tensile zone was mainly related to the applied load and the bond between concrete, fiber belt and steel bar.
When the reinforcement reached the yield, the tensile force of the reinforcement re-mains unchanged, and the increase of the bending moment of the beam section was mainly realized by the increase of the tensile force of the fiber-belt-bar. With the increase of external load, a little slippage occurred in the fiber-belt-bar reinforcement, and thus the bond between the fiber-belt-bar reinforcement and concrete decreased. According to the stress mechanism of cracks, it can be considered that the cracks in the tensile zone ex-panded faster.
Figure 6. Crack shape and distribution of the test beam. (a) RAL-1, (b) RAL-2, (c) RAL-1, (d) RHL-1.

Materials 2022, 15, 3505 8 of 16
At the same time, the crack spacing of the component with different reinforcementratio was different. The amount of reinforcement in the tensile zone of the four test beamswas the same; however, the number of fiber-belt-bars was distinctive. When there weremore fiber-belt-bars in the tension zone, the width of cracks was smaller and the number ofcracks was larger. The crack width and the average crack spacing were larger when thefiber-belt-bars were less in the tension zone.
Figure 7a shows the development of the maximum crack width of each test beamwith the change of load. When the load was applied to about 30 kN, the crack-width–loadrelationship curve had an obvious “inflection point”. According to the above strain analysisof the fiber belt and steel bar in the tensile zone under different loads, when the loadreached about 30 kN, the steel bar entered the yield stage, because the crack width in thetensile zone was mainly related to the applied load and the bond between concrete, fiberbelt and steel bar.
Materials 2022, 15, x FOR PEER REVIEW 9 of 17
Figure 7. The test related data results. (a) Maximum crack width curves of specimens under differ-ent loads, (b) Deflection curves of specimens under different load, (c) Stress-strain curves of speci-men RAL-1 under different loads, (d) Stress-strain curves of specimen RAL-2 under different loads, (e) Stress-strain curves of specimen RAL-3 under different loads .
When the ratio of reinforcement used in the beam was different, the width of crack generated was distinctive. The maximum crack width increased with the increase of rein-forcement ratio. As can be seen from Figure 7a, the maximum crack width of RAL-1 was larger than that of RAL-3 under the same load. When the applied load was small, the fiber-belt-bar reinforcement, steel bar and concrete kept close bond. When the reinforcement ratio was large, the crack width of the tensile zone was small.
With the increase of the load, the bond property between the tensile bar and concrete decreased, and the crack width in the tensile zone was less affected by the bond property of steel bar, fiber-belt-bar bar and concrete. Therefore, the difference of crack width in the tensile zone of the beam was not obvious even when the ratio of fiber-belt-bar reinforce-ment was increased, indicating the influence of fiber-belt-bar reinforcement on the crack of the beam was limited. In the design of the beam, the crack width can control the design bearing capacity of members, which can make the structure had a greater degree of safety.
Table 5 lists the cracking load, ultimate load and failure of components. When the beam adopted different reinforcement ratio, its cracking load changed. With the increase of the section reinforcement ratio, its cracking load also increased. It can be found from the cracking load difference of the four test beams, the maximum difference was 16%. The reinforcement ratio of the section had an effect on the cracking load of beams; however, the effect was limited. When the reinforcement ratio of fiber-reinforced concrete beam was different, its ultimate load was also distinctive. With the increase of reinforcement ratio, the ultimate load increased, which was similar to the reinforced concrete beam.
Table 5. The cracking, ultimate load and failure of test beams.
Sample Code Cracking Load (kN) Ultimate Load (kN) Damage RAL-1 13.5 68 Tensile failure of fiber-belt-bar RAL-2 15.5 95 Concrete crushing RAL-3 16 80 Concrete crushing
Figure 7. The test related data results. (a) Maximum crack width curves of specimens under differentloads, (b) Deflection curves of specimens under different load, (c) Stress-strain curves of specimenRAL-1 under different loads, (d) Stress-strain curves of specimen RAL-2 under different loads,(e) Stress-strain curves of specimen RAL-3 under different loads.
When the reinforcement reached the yield, the tensile force of the reinforcementremains unchanged, and the increase of the bending moment of the beam section wasmainly realized by the increase of the tensile force of the fiber-belt-bar. With the increaseof external load, a little slippage occurred in the fiber-belt-bar reinforcement, and thusthe bond between the fiber-belt-bar reinforcement and concrete decreased. According tothe stress mechanism of cracks, it can be considered that the cracks in the tensile zoneexpanded faster.
When the ratio of reinforcement used in the beam was different, the width of crackgenerated was distinctive. The maximum crack width increased with the increase ofreinforcement ratio. As can be seen from Figure 7a, the maximum crack width of RAL-1 waslarger than that of RAL-3 under the same load. When the applied load was small, the fiber-belt-bar reinforcement, steel bar and concrete kept close bond. When the reinforcementratio was large, the crack width of the tensile zone was small.

Materials 2022, 15, 3505 9 of 16
With the increase of the load, the bond property between the tensile bar and concretedecreased, and the crack width in the tensile zone was less affected by the bond propertyof steel bar, fiber-belt-bar bar and concrete. Therefore, the difference of crack width in thetensile zone of the beam was not obvious even when the ratio of fiber-belt-bar reinforcementwas increased, indicating the influence of fiber-belt-bar reinforcement on the crack of thebeam was limited. In the design of the beam, the crack width can control the design bearingcapacity of members, which can make the structure had a greater degree of safety.
Table 5 lists the cracking load, ultimate load and failure of components. When thebeam adopted different reinforcement ratio, its cracking load changed. With the increaseof the section reinforcement ratio, its cracking load also increased. It can be found fromthe cracking load difference of the four test beams, the maximum difference was 16%.The reinforcement ratio of the section had an effect on the cracking load of beams; however,the effect was limited. When the reinforcement ratio of fiber-reinforced concrete beam wasdifferent, its ultimate load was also distinctive. With the increase of reinforcement ratio,the ultimate load increased, which was similar to the reinforced concrete beam.
Table 5. The cracking, ultimate load and failure of test beams.
Sample Code Cracking Load (kN) Ultimate Load (kN) Damage
RAL-1 13.5 68 Tensile failure offiber-belt-bar
RAL-2 15.5 95 Concrete crushingRAL-3 16 80 Concrete crushingRHL-1 15 95 Shear failure of fiber-belt-bar
The failure of concrete flexural specimens with fiber reinforcement can be divided intotensile failure of fiber reinforcement and crushing failure of concrete in compression zone.However, the shear failure of fiber-belt-bar reinforcement was not the ideal failure mode ofbeam normal section bending, because the shear force of beam was large, which lead to theshear failure of fiber-belt-bar reinforcement. This kind of phenomenon should be avoidedin the future design of beams.
3.2.2. Strain Changes of Tensile Bars
Figure 7c–e depicts the changes of steel bars and fiber-belt-bars in the tensile zoneof RAL-1, RAL-2 and RAL-3 as a result of loading. When the initial load was applied,the strain difference between the steel bar and the fiber-belt-bar was not obvious; however,with the increase of the load, the strain difference between the steel bar and the fiber-belt-bar increased. Under the same load, the strain of reinforcement was greater than that offiber-belt-bar reinforcement.
At the initial stage of loading, the bond between fiber-belt-bar reinforcement, steel barand concrete were kept close, and the deformation between fiber-belt-bar reinforcementand steel bar was basically the same, and the deformation difference between them wasrelatively small. With the increasing of the load, the bond between the tensile bar andconcrete changes, and the strain of the fiber-belt-bar bar and steel bar increased rapidly.When the steel bar in tension zone changed from the elastic stage to plastic stage, it canproduce large strain even if a small load is applied. In this stage, the strain of reinforcementwas greater than that of fiber-belt-bar reinforcement under the same load.
3.2.3. Load-Deflection Curve
Using three-point loading, the mid-span deflection changes of the beam with purebending section and shear force and bending moment coexist were obtained, as shown inFigure 7b. The results showed that the load deflection curve of fiber-reinforced concretebeams can be divided into three stages: from the beginning of loading to the cracking ofconcrete in the tension zone of the beam, from the cracking of concrete to the yieldingof reinforcement, and from the yielding of reinforcement to the failure of the specimen.

Materials 2022, 15, 3505 10 of 16
The turning point corresponds to the cracking load of the concrete beam and the corre-sponding load when the reinforcement in the tensile zone of the beam reached the yield.
There was a linear relationship between the deflection and load in each stage. The anal-ysis of the stress of the steel bar and the fiber-belt-bar bar in the beam section showed that,with the increase of the load, the tensile steel bar entered the yield stage first, while thefiber-belt-bar bar was still in the linear elastic stage. With the further increase of the load,the tensile force of the reinforcement basically remains unchanged, and the increase of thebending moment of the section was mainly realized by the tensile fiber-belt-bars.
The relationship between deflection and load of reinforced concrete beams was relatedto the proportion of reinforcement and fiber reinforcement in the tensile zone. Before thecracking of the beam specimen, the main factors affecting the deflection of the beam werethe size of the beam section, the span of the beam, the strength grade of the concrete andthe way of loading, etc., while the influence of the ratio of reinforcement was relativelysmall, showing the characteristics of a plain concrete beam.
The deflection of beam specimens from concrete cracking to the steel yielding stage ismainly related to the ratio of tensile reinforcement in the tensile zone. The larger the ratioof reinforcement was, the smaller the deflection was. With the further increase of the load,the reinforcement yielded and the subsequent increase of the load was mainly borne by thefiber-belt-bar reinforcement in the tension zone.
Therefore, the deflection deformation of the beam was mainly affected by the ratioof fiber-belt-bar reinforcement in the tensile zone. The higher the ratio of fiber-belt-barreinforcement in the tensile zone, the smaller the deflection deformation of the beam.According to the reinforcement of the four beams, the same reinforcement was used inthe tensile zone of the beams. The As was the same; however, the cross-section area offiber-belt-bar reinforcement Af was different. Under the same load, the deflection changewas not very obvious. From the overall consideration of the fiber-reinforced concretebeam, it can be considered that the fiber-reinforced concrete beam contributed little to thedeflection of the beam specimen.
When the coefficient Kf was large, the beam was mainly the fiber-reinforced concretebeam, and its deflection was obviously larger than that of the reinforced concrete beam.However, when Kf was small, the beam mainly showed the characteristics of reinforcedconcrete beam and the deflection was reduced. Based on the above analysis, it can beconcluded that for different values of Kf, the deflection size was also different. When thedeflection size of the beam needed to be changed, the value of Kf can be changed, that is,it was also an effective method to consider changing the proportion relationship betweenthe fiber-belt-bar and steel bar.
3.3. Improved Calculation of Crack Width and Deflection of Fiber Reinforced Concrete Beams3.3.1. Derivation of Calculation Formula for Crack Width
It was known from the above experimental analysis that the crack mechanism offiber-reinforced concrete beams was similar to that of reinforced concrete members sub-jected to bending. Combined with the characteristics of fiber-reinforced concrete beams:(i) Fiber-reinforced concrete beams and steel bars borne tensile force together. (ii) Theelastic modulus and bond performance of two kinds of tensile bars were different; thereby,the calculation formula of crack width of fiber-reinforced concrete beams was derived [23].
According to the above analysis, the main factors affecting the crack width of fiber-reinforced concrete beams were: the stress or strain of tensile bars, the thickness of concreteprotective layer, the bond between tensile bars and concrete, the binding effect of tensilebars on local concrete, the area and number of tensile bars. According to the Gergely–Lutzformula for crack width of reinforced concrete beams adopted in the Canadian code andACI code [21], the calculation formula for maximum crack width of reinforced concretebeams with fiber bars under short-term load is given as follows:
ωmax = kg · ε · β′ · 3√
dc A× 10−6 (1)

Materials 2022, 15, 3505 11 of 16
where dc is the distance from the center of the bottom row of the beam to the edge of theconcrete tensile zone. A is the average effective area of the tensile concrete around eachtensile bar. ε is the strain of the tension bar under the action of bending moment. β′ isthe strain gradient. kg = f (ρs, ρ f , υs, υ f ) is a function that reflects the influence of bondproperty of tensile bars on crack width in fiber-reinforced concrete beams. νs is the relativebond coefficient of steel bars, which is 1 for deformed steel bars and 0.7 for smooth roundsteel bars. ν f is the relative bond coefficient of fiber-belt-bar, which is =0.52. ρs and ρ f arethe reinforcement ratio of steel bar and fiber-belt-bar bar, respectively.
As the bond force of the tensile bar is related to the contact area of the fiber-belt-bar bar.For the convenience of calculation, the section shape of the fiber-belt-bar can be equivalentto a circle. According to the relation between area and diameter, the cross section area of thetension bar has a square relation with its diameter. The crack width was a function of thereinforcement ratio. With the increase of the reinforcement ratio, the crack width decreased,and there was a certain relationship between the reinforcement ratio and the section area ofthe tensile reinforcement. Therefore, the variables in the kg expression can be regarded asonly two, νs
√ρs and ν f
√ρ f . The kg can be computed by introducing the variability:
y =1
νs√
ρs + ν f√
ρ f(2)
kg = k1y (3)
where k1 is an undetermined constant, which needs to be determined by the test.According to the maximum crack width ωmax measured by each specimen in the test
and the strain value ε of the tension bar, the corresponding value of kg can be obtained fromEquation (1). The specific value can be seen in Table 6. The y can be calculated accordingto the ratio of reinforcement of the specimen and the relative bond coefficient of steel barand fiber-belt-bar reinforcement. Under short-term load, the maximum crack width of thebeam can be expressed as:
ωmax =0.43
νs√
ρs + ν f√
ρ fεβ′ 3√
dc A× 10−6 (4)
Table 6. The measured values of crack width of test beam.
Sample Code ρfs (%) ρ0 (%) K f
Mean Crack Width
20 kN 40 kN 60 kN
Width(mm)
Width(mm)
Width(mm)
RAL-1 0.49 0.18 0.37 0.16 1.00 2.85RAL-2 0.85 0.54 0.64 0.06 0.77 2.5RAL-3 1.03 0.72 0.72 0.05 0.72 2.4RHL-1 0.85 0.54 0.64 0.06 0.79 2.52
In order to verify the rationality of the proposed formula, the experimental andtheoretical values of the beam were compared and analyzed. Table 6 lists the comparisonbetween the measured and theoretical crack width values of the specimens under theloading of 20, 40 and 60 kN, respectively.
By analyzing the comparison between the calculated value and the test value ofthe crack width in the tensile zone of the test beam under the load of 20, 40 and 60 kN,Equation (4) can better predict the maximum crack width in the tensile zone of the fiber-reinforced concrete beam under the load.
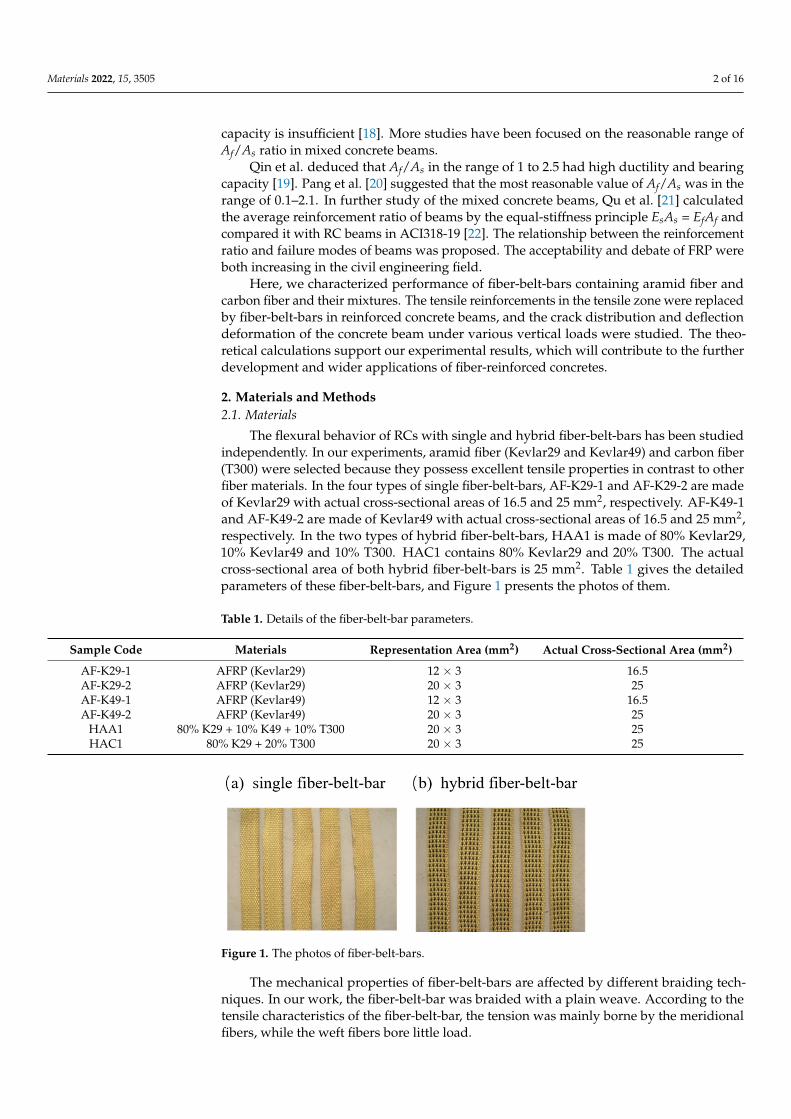
In order to describe the stress process and crack development of beams more clearly,Figure 8 describes the relationship between measured and theoretical values of maximumcrack width of specimens RAL-1, RAL-2 and RAL-3 during the whole process of loading.Figure 8 can reflect the deviation degree between the measured value and the theoretical
Materials 2022, 15, 3505 12 of 16
value of the crack width of the test beam in the whole process of stress. The research onthe maximum crack width of ordinary specimens mainly considered the calculation of themaximum crack width under normal service load. The results showed that the theoreticalvalue was in good agreement with the measured value.
Materials 2022, 15, x FOR PEER REVIEW 13 of 17
Figure 8. Comparison between experimental and theoretical values of crack width of test beam. (a) RAL-1, (b) RAL-2, (c) RAL-3 .
3.3.2. Calculation of Deflection of Flexural Component under Short-Term Load For uniform elastic beam, the bending stiffness remains unchanged at each section,
and the deflection can be calculated by structural mechanics or finite element method. But for reinforced concrete beams and fiber-reinforced concrete beams, cracks leaded to the reduction of the bending stiffness of the cross section, and there was a certain distance between cracks. The concrete also bears part of the tension between the cracks, which in-creased the stiffness of the components.
Therefore, even in the pure bending section with the same bending moment, the stiff-ness of each section was not equal, and the stiffness at the crack section was the smallest. These factors bring great difficulties to deflection calculation, and thus the key to deflec-tion calculation was to determine the bending stiffness EI. In consideration of the differ-ences in bond properties between fiber-belt-bar bars, steel bars and concrete in the tensile zone of beams, the coefficients α and β were introduced to modify Ie formula in the code. The expression of effective moment of inertia of fiber-reinforced concrete beam can be further simplified [22].
When crk MM < :
ge II = (5)
When crk MM ≥ :
gk
crcr
k
crge I
MM
IMM
II ≤
−+
=
33
1αβ (6)
where Mk is the standard bending moment value calculated according to the standard combination of load effects. Mcr is the cracking moment of fiber-reinforced concrete beam member.
The Ig is the moment of inertia of section of concrete beam member with fiber rein-forcement before cracking.
[ ]ffssg bhI ραρα )1(7.1)1(7.1112/3 −+−+= (7)
where css EE /=α and cff EE /=α are the ratio of the elastic modulus between steel bar and fiber reinforcement and concrete, respectively.
After cracks appeared in the member, the effect of concrete in the tensile zone was ignored, and only the fiber-belt-bar and steel bar borne the tensile effect in the tensile zone. The area of fiber-belt-bar and steel bar can be converted into the concrete area of the same height, and the moment of inertia Icr of the cracked section can be calculated. The con-verted cross section is shown in Figure 9.
Figure 8. Comparison between experimental and theoretical values of crack width of test beam.(a) RAL-1, (b) RAL-2, (c) RAL-3.
3.3.2. Calculation of Deflection of Flexural Component under Short-Term Load
For uniform elastic beam, the bending stiffness remains unchanged at each section,and the deflection can be calculated by structural mechanics or finite element method.But for reinforced concrete beams and fiber-reinforced concrete beams, cracks leaded tothe reduction of the bending stiffness of the cross section, and there was a certain distancebetween cracks. The concrete also bears part of the tension between the cracks, whichincreased the stiffness of the components.
Therefore, even in the pure bending section with the same bending moment, the stiff-ness of each section was not equal, and the stiffness at the crack section was the smallest.These factors bring great difficulties to deflection calculation, and thus the key to deflectioncalculation was to determine the bending stiffness EI. In consideration of the differences inbond properties between fiber-belt-bar bars, steel bars and concrete in the tensile zone ofbeams, the coefficients α and β were introduced to modify Ie formula in the code. The ex-pression of effective moment of inertia of fiber-reinforced concrete beam can be furthersimplified [22].
When Mk < Mcr:Ie = Ig (5)
When Mk ≥ Mcr:
Ie = βIg
(Mcr
Mk
)3+ αIcr
[1−
(Mcr
Mk
)3]≤ Ig (6)
where Mk is the standard bending moment value calculated according to the standardcombination of load effects. Mcr is the cracking moment of fiber-reinforced concretebeam member.
The Ig is the moment of inertia of section of concrete beam member with fiber rein-forcement before cracking.
Ig = bh3/12[1 + 1.7(αs − 1)ρs + 1.7(α f − 1)ρ f
](7)
where αs = Es/Ec and α f = E f /Ec are the ratio of the elastic modulus between steel barand fiber reinforcement and concrete, respectively.
After cracks appeared in the member, the effect of concrete in the tensile zone wasignored, and only the fiber-belt-bar and steel bar borne the tensile effect in the tensile zone.The area of fiber-belt-bar and steel bar can be converted into the concrete area of the same

Materials 2022, 15, 3505 13 of 16
height, and the moment of inertia Icr of the cracked section can be calculated. The convertedcross section is shown in Figure 9.
Materials 2022, 15, x FOR PEER REVIEW 14 of 17
Figure 9. Schematic diagram of conversion section.
For the single-bar rectangular section shown in Figure 9, the converted section area A0 and the converted section moment of inertia Icr are:
ffss AAbxA αα ++=0 (8)
20
3 ))((31 xhAAbxI ffsscr −++= αα (9)
where h0 is the effective stiffness of the tension bar. x is the height of the compression zone of cracked section concrete.
According to the neutral axis of the cracking section of the bending specimen, through the centroid axis of the converted section, namely, the static moment of the com-pression zone to the neutral axis is equal to the static moment of the tension zone to the neutral axis. The formula for x is as follows:
))((21
02 xhAAbx ffss −+= αα (10)
bAAAAbhAA
x ffssffssffss )()(2)( 02 αααααα +−+++
= (11)
β is the reduction coefficient, which is related to the elastic modulus of steel bar, fiber-belt-bar bar and bond property. For reinforced concrete beam, desirable β = 1. When Kf =
1, β = βf is assumed for pure fiber-reinforced concrete beams. For fiber-reinforced concrete beams, β can be obtained by interpolation in the following formula:
)/()1( fssff AAA +−+= βββ (12)
)/1( sfbf EE+= αβ (13)
where αb is the coefficient related to the bond performance between fiber-belt-bar rein-forcement and concrete, αb = 0.5, and substituted into Equation (13), βf = 0.56. α in Equation (6) is another reduction coefficient, and the value of α can be determined according to the test of FRC beams. Through data fitting, α = 0.26.
In order to verify the rationality of the effective moment of inertia mentioned above, the section stiffness of RAL-1 and RAL-2 were calculated and compared with the meas-ured values. Figure 10 compares the experimental and theoretical equivalent moment of inertia of experimental beams RAL-1 and RAL-2. The results showed that when the ap-plied load was small, there was a certain difference between the measured value and the theoretical value of the beam section moment of inertia, and the two curves were in good
Figure 9. Schematic diagram of conversion section.
For the single-bar rectangular section shown in Figure 9, the converted section area A0and the converted section moment of inertia Icr are:
A0 = bx + αs As + α f A f (8)
Icr =13
bx3 + (αs As + α f A f )(h0 − x)2 (9)
where h0 is the effective stiffness of the tension bar. x is the height of the compression zoneof cracked section concrete.
According to the neutral axis of the cracking section of the bending specimen, through thecentroid axis of the converted section, namely, the static moment of the compression zoneto the neutral axis is equal to the static moment of the tension zone to the neutral axis.The formula for x is as follows:
12
bx2 = (αs As + α f A f )(h0 − x) (10)
x =
√(αs As + α f A f )
2 + 2bh0(αs As + α f A f )− (αs As + α f A f )
b(11)
β is the reduction coefficient, which is related to the elastic modulus of steel bar, fiber-belt-bar bar and bond property. For reinforced concrete beam, desirable β = 1. When Kf = 1,β = βf is assumed for pure fiber-reinforced concrete beams. For fiber-reinforced concretebeams, β can be obtained by interpolation in the following formula:
β = β f + (1− β f )√
As/(As + A f ) (12)
β f = αb(1 + E f /Es) (13)
where αb is the coefficient related to the bond performance between fiber-belt-bar reinforce-ment and concrete, αb = 0.5, and substituted into Equation (13), βf = 0.56. α in Equation (6)is another reduction coefficient, and the value of α can be determined according to the testof FRC beams. Through data fitting, α = 0.26.
In order to verify the rationality of the effective moment of inertia mentioned above,the section stiffness of RAL-1 and RAL-2 were calculated and compared with the measuredvalues. Figure 10 compares the experimental and theoretical equivalent moment of inertiaof experimental beams RAL-1 and RAL-2. The results showed that when the applied loadwas small, there was a certain difference between the measured value and the theoreticalvalue of the beam section moment of inertia, and the two curves were in good agreementwith the increase of the applied load. Figure 10 also showed that the effective moment ofinertia of beams can be well predicted by using Equation (6).

Materials 2022, 15, 3505 14 of 16
Materials 2022, 15, x FOR PEER REVIEW 15 of 17
agreement with the increase of the applied load. Figure 10 also showed that the effective moment of inertia of beams can be well predicted by using Equation (6).
Figure 10. Comparison between experimental and theoretical values of equivalent moment of iner-tia of beam. (a) RAL-1, (b) RAL-2 .
Finally, the short-term stiffness Bs of the beam can be expressed by the product of the elastic modulus Ec of concrete and the effective moment of inertia Ie of the section. Using structural mechanics or finite element method, the deflection of the specimens under the short-term load can be calculated.
In order to verify the rationality of the formula, it was also necessary to compare and analyze the measured values of the test components with those of the above theoretical equation. In addition, the deflection calculation of the component was mainly concerned with its deflection in the stage of normal service load; therefore, the deflection calculation of the component was mainly concerned with its calculation value under normal service load.
When the deflection calculation formula proposed above was applied, the ratio be-tween the test value and the theoretical value ranged from 0.77 to 1.06, thus,indicating that the deflection test value of the test beam was close to the theoretical value under the loading of 20, 40 and 60 kN. In Figure 10, the relationship between experimental and the-oretical values of effective moment of inertia of concrete beams with fiber bars can reflect the relationship of deflection of beams under short-term load to a certain extent. When the relationship between the two curves was close, it means that the deflection test value of the beam was in good agreement with the theoretical value. Based on the above two as-pects, the deflection calculation formula can be used to predict the deflection of fiber-re-inforced concrete beams.
4. Conclusions In this paper, we mainly made an experimental study and theoretical analysis on the
mechanical properties and the mechanical properties of fiber-reinforced concrete beams. By replacing part of tensile steel bar with fiber-belt-bar, the advantages of fiber-belt-bar and steel bar can be brought into play simultaneously, and the durability of concrete struc-ture can be improved. Experimental studies on six groups of tensile specimens and four fiber-reinforced concrete beams were performed. The main conclusions are as follows: 1. The tensile strength of the fiber-belt-bars was lower than that of the fiber filament.
The tensile strength of the fiber was generally about 30% of the tensile strength of the fiber filament. The tensile failure of a single fiber-belt-bar was a fracture failure, and the stress–strain curve changed linearly before failure. However, the stress–strain re-lationship of hybrid fiber-belt-bars had strain mutation, and the stress–strain rela-tionship showed a broken line change.
Figure 10. Comparison between experimental and theoretical values of equivalent moment of inertiaof beam. (a) RAL-1, (b) RAL-2.
Finally, the short-term stiffness Bs of the beam can be expressed by the product ofthe elastic modulus Ec of concrete and the effective moment of inertia Ie of the section.Using structural mechanics or finite element method, the deflection of the specimens underthe short-term load can be calculated.
In order to verify the rationality of the formula, it was also necessary to compare andanalyze the measured values of the test components with those of the above theoreticalequation. In addition, the deflection calculation of the component was mainly concernedwith its deflection in the stage of normal service load; therefore, the deflection calculation ofthe component was mainly concerned with its calculation value under normal service load.
When the deflection calculation formula proposed above was applied, the ratio be-tween the test value and the theoretical value ranged from 0.77 to 1.06, thus, indicatingthat the deflection test value of the test beam was close to the theoretical value underthe loading of 20, 40 and 60 kN. In Figure 10, the relationship between experimental andtheoretical values of effective moment of inertia of concrete beams with fiber bars can reflectthe relationship of deflection of beams under short-term load to a certain extent. When therelationship between the two curves was close, it means that the deflection test value of thebeam was in good agreement with the theoretical value. Based on the above two aspects,the deflection calculation formula can be used to predict the deflection of fiber-reinforcedconcrete beams.
4. Conclusions
In this paper, we mainly made an experimental study and theoretical analysis on themechanical properties and the mechanical properties of fiber-reinforced concrete beams.By replacing part of tensile steel bar with fiber-belt-bar, the advantages of fiber-belt-barand steel bar can be brought into play simultaneously, and the durability of concretestructure can be improved. Experimental studies on six groups of tensile specimens andfour fiber-reinforced concrete beams were performed. The main conclusions are as follows:
1. The tensile strength of the fiber-belt-bars was lower than that of the fiber filament.The tensile strength of the fiber was generally about 30% of the tensile strength ofthe fiber filament. The tensile failure of a single fiber-belt-bar was a fracture failure,and the stress–strain curve changed linearly before failure. However, the stress–strain relationship of hybrid fiber-belt-bars had strain mutation, and the stress–strainrelationship showed a broken line change.
2. The coefficient in the formula for calculating the maximum crack width of reinforcedconcrete beams proposed in ACI standard was adjusted appropriately so that theformula can meet the requirements of the maximum crack width of concrete beamswith fiber bars. By comparing the theoretical calculation value of the formula with themeasured value of the test, the crack calculation formula proposed in this paper canpredict the maximum crack width of the beam under various loads.

Materials 2022, 15, 3505 15 of 16
3. The effective moment of inertia Ie in the ACI standard was modified by introducingthe coefficients α and β. The coefficient α was derived from the test beam, and thecoefficient β was derived from the elastic modulus and relative bond coefficientof the fiber-belt-bar. Through data comparison, we concluded that the deflectioncalculation formula proposed in this paper can better predict the deflection size ofthe beam. According to the bending characteristics of fiber-reinforced concrete beamsunder a normal service load, the maximum crack width or deflection limit may bereached before the test beams reached the ultimate state of bearing capacity. Therefore,the beam may be controlled by the limit state of normal service or the limit state of thebearing capacity with a different reinforcement ratio, section size and coefficient Kf.
Author Contributions: Conceptualization, W.G.; formal analysis, W.G.; Methodology, W.G.; val-idation W.G.; investigation, W.G.; writing original draft, H.L.; writing review and editing, H.L.;Investigation, W.G.; supervision, Y.D.; data curation, Y.D. All authors have read and agreed to thepublished version of the manuscript.
Funding: This study was financially supported by the National Natural Science Foundation ofChina (Nos. 51904112 and 51904113). This study was also financially supported by the PostgraduateResearch & Practice Innovation Program of Jiangsu Province.
Institutional Review Board Statement: Not applicable.
Informed Consent Statement: Not applicable.
Data Availability Statement: Data sharing is not applicable.
Conflicts of Interest: The authors declare no conflict of interest.
References1. Touileb, K.; Hedhibi, A.C.; Djoudjou, R.; Ouis, A.; Bensalama, A.; Ibrahim, A.; Abdo, H.S.; Ahmed, M.M.Z. Mechanical,
Microstructure, and Corrosion Characterization of Dissimilar Austenitic 316L and Duplex 2205 Stainless-Steel ATIG WeldedJoints. Materials 2022, 15, 2470. [CrossRef] [PubMed]
2. Saura, P.; Zornoza, E.; Andrade, C.; Ferrandiz-Mas, V.; Garces, P. Composition of Corroded Reinforcing Steel Surface in SolutionsSimulating the Electrolytic Environments in the Micropores of Concrete in the Propagation Period. Materials 2022, 15, 2216.[CrossRef] [PubMed]
3. Rehman, F.U.; Cashell, K.A.; Anguilano, L. Experimental Study of the Post-Fire Mechanical and Material Response of Cold-WorkedAustenitic Stainless Steel Reinforcing Bar. Materials 2022, 15, 1564. [CrossRef] [PubMed]
4. Kioumarsi, M.; Benenato, A.; Ferracuti, B.; Imperatore, S. Residual flexural capacity of corroded prestressed reinforced concretebeams. Materials 2021, 11, 442. [CrossRef]
5. Bonopera, M.; Chang, K.C. Novel method for identifying residual prestress force in simply supported concrete girder-bridges.Adv. Struct. Eng. 2021, 24, 3238–3251. [CrossRef]
6. Protchenko, K. Residual Fire Resistance Testing of Basalt- and Hybrid-FRP Reinforced Concrete Beams. Materials 2022,15, 1509. [CrossRef]
7. Tang, L. Maintenance and Inspection of Fiber-Reinforced Polymer (FRP) Bridges: A Review of Methods. Materials 2021,14, 7826. [CrossRef]
8. El-Nemr, A.; Ahmed, E.A.; Benmokrane, B. Flexural Behavior and serviceability of normal- and high-Strength concrete beamsreinforced with glass fiber-reinforced polymer bars. ACI Struct. J. 2013, 110, 1077–1087.
9. Saleem, S.; Pimanmas, A.; Qureshi, M.I.; Rattanapitikon, W. Axial Behavior of PET FRP-Confined Reinforced Concrete. J. Compos.Constr. 2021, 25, 04020079. [CrossRef]
10. Saleem, S.; Hussain, Q.; Pimanmas, A. Compressive Behavior of PET FRP-Confined Circular, Square, and Rectangular ConcreteColumns. J. Compos. Constr. 2017, 21, 04016097. [CrossRef]
11. Ye, Y.-Y.; Smith, S.T.; Zeng, J.-J.; Zhuge, Y.; Quach, W.-M. Novel ultra-high-performance concrete composite plates reinforced withFRP grid: Development and mechanical behaviour. Compos. Struct. 2021, 269, 114033. [CrossRef]
12. Badawi, M.; Soudki, K. Flexural strengthening of RC beams with prestressed NSM CFRP rods—Experimental and analyticalinvestigation. Constr. Build. Mater. 2009, 23, 3292–3300. [CrossRef]
13. Chan, T.K.; Niall, M.A. Strengthening of one-way slabs using carbon fibre plates: The effect of preload. Civ. Eng. Res. 2001,14, 1–4.
14. Triantafillou, T.C.; Plevris, N. Strengthening of RC beams with epoxy-bonded fibre-composite materials. Mater. Struct. 1992, 25,201–211. [CrossRef]

Materials 2022, 15, 3505 16 of 16
15. Foraboschi, P. Predictive multiscale model of delayed debonding for concrete members with adhesively bonded externalreinforcement. Compos. Mech. Comput. Appl. 2012, 3, 307–329. [CrossRef]
16. Aiello, M.A.; Ombres, L. Structural Performances of Concrete Beams with Hybrid (Fiber-Reinforced Polymer-Steel) Reinforce-ments. J. Compos. Constr. 2002, 6, 133–140. [CrossRef]
17. Leung, H.Y.; Balendran, R.V. Flexural behaviour of concrete beams internally reinforced with GFRP rods and steel rebars. Struct.Surv. 2003, 21, 146–157. [CrossRef]
18. Tang, W.C.; Balendran, R.V.; Nadeem, A.; Leung, H.Y. Flexural strengthening of reinforced lightweight polystyrene aggregateconcrete beams with near-surface mounted GFRP bars. Build. Environ. 2006, 41, 1381–1393. [CrossRef]
19. Qin, R.; Zhou, A.; Lau, D. Effect of reinforcement ratio on the flexural performance of hybrid FRP reinforced concrete beams.Compos. Part B Eng. 2017, 108, 200–209. [CrossRef]
20. Pang, L.; Qu, W.; Zhu, P.; Xu, J. Design Propositions for Hybrid FRP-Steel Reinforced Concrete Beams. J. Compos. Constr. 2016,20, 04015086. [CrossRef]
21. Qu, W.J.; Zhang, X.L.; Huang, H.Q. Flexural behavior of concrete beams reinforced with hybrid (GFRP and steel) bars. J. Compos.Constr. 2009, 13, 350–359. [CrossRef]
22. Farmington, H. Building Code Requirements for Structural Concrete; ACI 318-19; American Concrete Institute: Michigan, MI,USA, 2019.
23. Qu, W.J.; Zhang, J.; Huang, H.Q. Flexural Test and Crack and Deflection Algorithm of Reinforced GFRP Reinforced ConcreteBeams. Build. Struct. 2006, 36, 38–41.
Copyright © 2022 FDOKUMEN