Insulating, Semiconducting and Metallic 2D Materials for ...
EXPERIMENTAL STUDY OF
SUPERCONDUCTING WIRE MOTION ON THE BASE INSULATING MATERIAL IN MAGNETIC
FIELD
A Dissertation Submitted to
The Department of Accelerator Science,
School of High Energy Accelerator Science,
Graduate University for Advanced Studies, Japan
as a Partial Fulfillment of the Requirements for the Degree of
Doctor of Philosophy
Kailash Ruwali
2009

ii
A Ph.D. Thesis
Experimental study of
superconducting wire motion on
the base insulating material in magnetic field
By
Kailash Ruwali

iii
SUPERVISOR CERTIFICATE
This is to certify that the thesis entitled “EXPERIMENTAL STUDY OF
SUPERCONDUCTING WIRE MOTION ON THE BASE INSULATING
MATERIAL IN MAGNETIC FIELD” describes the original work done by
Kailash Ruwali, under my supervision for the degree of Doctor of Philosophy of the
Graduate University for Advanced Studies, Japan. Mr. Kailash Ruwali has fulfilled
the required formalities as per the university rules known to us.
Prof. Kenji Hosoyama
Head, Cryogenics Division
KEK, Japan
iv
Acknowledgement
I should like to express my appreciation to Dr. S.P. Mhaskar, who initially
directed my attention to the field of magnets. My appreciation is also extended to
each person at RRCAT, Indore, India, with whom I have been working since 1994.
Special thanks to Prof. Shin-ichi Kurokawa for taking personal interest in my case
and solving the visa problem for Indian Researchers (due to visa problem, I could not
come to Japan in October 2004 to pursue my thesis work) which eventually made my
stay as Doctoral student at KEK possible. Special thanks are due to Dr. P.D. Gupta,
Director, RRCAT, Indore, India and Shri. Gurnam Singh, Head, IOAPDD, RRCAT,
Indore, India for allowing me to pursue my thesis work at KEK, Japan.
I would like to express my deep gratitude to Prof. Kenji Hosoyama of KEK,
Japan for accepting me as his graduated student and gave me an opportunity to study
the superconducting wire motion in magnetic field. Prior coming to KEK, I have very
little experience of working at cryogenic temperature. I would like to thank him for
his valuable comments and suggestions in writing this thesis. I would like to thank
him and Dr. Atsuhiko Yamanaka for their help in design and fabrication of
experimental setup. Without their help and suggestions, it was impossible to complete
this work in time.
I would like to thank Dr. Atsuhiko Yamanaka for preparing Zylon / Dyneema
fiber based samples and also for carrying out their frictional coefficient measurement
at room temperature at Toyobo Co. Ltd., Japan.
The support of Ministry of Education, Culture, Sports, Science and
Technology (MEXT), Japan was certainly appreciated in granting me the scholarship.
A special word of appreciation is due to Dr. Kota Nakanishi for his help in
handling enormous measurement data just before my final presentation of
dissertation. At that time, I was running short of time and it is because of his timely
help, I could finish my work in due course of time.
First of all, I want to thank my wife Meena for her warm encouragement,
steady support and taking care of our kids Harshit and Tanishka during this three-year

v
gestation period of my thesis. Without her help it would not be possible for me to
continue my work.
I would like to express my gratitude to my parents for their constant
inspiration in learning science since my childhood. It is their motivation (especially
my father, who happened to be a Plant Physiologist) by which I have chosen my
career in research.
Thanks to my friends Dr. Randeep Rakwal, Anand Valecha, Subrata Das, Hari
Vaswani, Navin Awale, Ashutosh Upadhayaya, Pramod R., Puneet Jain and Puneet
Tyagi for their generosity and support they provided during my stay at KEK.
I am grateful to many individuals who have contributed to my education in
magnets over the past years. I am indebted to Dr. Elwyn Baynham and Dr. Martin
Wilson for many valuable comments and discussions.
The staff of KEK has been uniformly helpful and encouraging. I want
especially to thank Mr. Yuuji Kojima for his help in conducting the experiments.
Working at KEK has strongly enriched my mind and character; for this reason
I would like to thank all those people who made this experience possible, and helped
me to successfully accomplish this work. My admiration is to Ms. Misa Miyai for her
sincere cooperation.
Kailash Ruwali
vi
THESIS
DEDICATED
TO
MY FAMILY
Especially to my wife Meena
for her consistent encouragement through out my Doctoral course.
She suffered a lot, staying alone in India and also in Japan but never complaint.
Everybody has difficult years, but a lot of times the difficult years end up being the
greatest years of your whole entire life, if you survive them.
Brittany Murphy, Seventeen Magazine, September 2003
vii
Summary
One of the most prominent applications of superconductivity is high field
magnet. Mechanical disturbance such as abrupt conductor motion is one of the main
origin of premature quench (transition from superconducting state to the normal
resistive state) in high current density superconducting coils. The wire motion occurs
when electromagnetic force to conductor exceeds constrain force including frictional
force on the surface of conductor. Behavior of superconducting wire motion depends
on the electromagnetic force acting on it, frictional property of the insulating material
and thrust force applied to the superconducting wire.
The experiments for superconducting wire motion in magnetic field was
carried out using small coil wound on stainless steel (SUS) bobbin using Polyimide
film as an insulating material and high strength polyethylene fiber (Dyneema: DF)
reinforced plastic (DFRP) bobbin [1]. The Dyneema fiber has negative thermal
expansion [2] and low coefficient of friction [3]. It was found that voltage spikes
generated due to sudden wire motion in case of DFRP bobbin are a few and small in
amplitude. The speculations are; the negative thermal expansion of the DFRP bobbin
restrains the wire motion and low coefficient of friction between superconducting
wire and DFRP bobbin reduces sudden motion.
In order to study the effect of frictional coefficient of insulating material on
superconducting wire motion under the influence of electromagnetic force, a special
experimental setup was designed and fabricated. The main distinctiveness of the
experimental setup is that the tension of the superconducting wire can be changed
during the experiments. The experimental set up consists of a cryostat,
superconducting solenoid magnet, sample holder, tensional unit to apply tension to
the superconducting wire, power supplies and pen recorder or a 16-bit data recorder
to measure the voltage tap signal. The sample holder consists of two parts, a semi-
circular head and a body part. Experiments were conducted at 4.2 K by varying the
experimental conditions such as the tension to the superconducting wire,
superconducting wire current ramp rate and different insulating materials at the
interface of the superconducting wire and semi-circular head.
viii
Voltage taps to measure the signal generated due to the superconducting wire
motion are connected at the end of the semi-circular head. To reduce the voltage tap
loop area, a groove was incorporated in the semi-circular head and the voltage tap
wire was passed through it. The voltage tap signal is measured by a pen recorder or a
16-bit data recorder with a sampling rate of 1 MS/s. Sudden wire motion was
indicated by observing the voltage spikes.
In order to examine the effect of the current ramp rate on the superconducting
wire motion, ramp rate was changed from 0.4 A/s to 1.69 A/s. The superconducting
wire tension was varied from 7.1 N to 35.8 N to study the effect of tension on the
superconducting wire motion. During all experiments, a constant magnetic field of 6
T was applied by superconducting solenoid magnet.
In the thesis work, different types of insulating material were used to study
superconducting wire motion under electromagnetic force. They are Polyimide film,
cloth / sheet material fabricated using Dyneema fiber, Zylon fiber and Teflon. The
Dyneema / Zylon fiber has negative thermal expansion and a low coefficient of
friction.
We have verified the effectiveness of this system. We could measure the
pattern of voltage spikes. The time duration of voltage spikes are of the same order
for all the samples. The peak voltage tap signal amplitude, velocity of wire motion,
distance moved by wire and energy dissipated due to wire motion in case of
Polyimide film is more than 2 order of magnitude larger than Dyneema based
insulating materials and Zylon cloth. Hence use of Dyneema / Zylon based materials
as an interface material between layers of superconducting wire may reduce the
frictional heat generated due to wire motion and could make superconducting magnet
performance more reliable.
ix
List of publications by the candidate
The following is the list of external publications (i.e. the papers that are published in
Journal, conference proceedings etc.) that are related to the research work described
in this thesis.
1. “Stability of Superconducting Wire in Magnetic Field”, K. Ruwali, A. Yamanaka,
Y. Teramoto, K. Nakanishi, K. Hosoyama, in Proceedings of the 11th
European
Particle Accelerator Conference, Genoa, 2008 (EPS-AG, Genoa, Italy, 2008), p. 2449.
2. “Superconducting wire motion under the influence of electromagnetic force”, K.
Ruwali, A. Yamanaka, Y. Teramoto, K. Nakanishi, K. Hosoyama, in Proceedings of
the Cryogenic Engineering Meeting, Autumn 2008 (In Japanese).
3. “ Study of superconducting wire motion in magnetic field”, K. Ruwali, A.
Yamanaka, Y. Teramoto, K. Nakanishi, K. Hosoyama, in Proceedings of the 4th
Indian Particle Accelerator Conference (InPAC2009), Indore, 2009.
4. “Experimental setup to detect superconducting wire motion”, K. Ruwali, A.
Yamanaka, Y. Teramoto, K. Nakanishi, K. Hosoyama, Phys. Rev. ST Accel. Beams
12, 042401 (2009).
5. “Dependence of superconducting wire motion on the base insulating material in
magnetic field”, K. Ruwali, A. Yamanaka, Y. Teramoto, K. Nakanishi, K. Hosoyama,
Presented in PAC’09, Vancouver, Canada (Proc. To be published).
x
Contents
Supervisor certificate iii
Acknowledgement iv
Summary vii
List of publications ix
Contents x
List of Figures xiii
List of tables xvii
1. Introduction 1
1.1 Superconducting magnets 1
1.2 Superconducting wire motion under the influence of
electromagnetic force 5
1.3 Review of wire motion studies and motivation 8
1.4 Principle of superconducting wire motion 10
1.5 Objective of our study 13
1.6 Organization of dissertation 14
2. Experimental setup to detect wire motion 15
2.1 Experimental setup 15
2.1.1 Cryostat 15
2.1.2 Solenoid Magnet 17
2.1.3 Sample Holder 18
2.1.4 Superconducting wire 21
2.1.5 Tensional Unit 22
2.1.6 Instrumentation 22
2.2 Insulating Materials 23
2.2.1 Polyimide film 26
2.2.2 Dyneema Based Insulating Materials 27
xi
2.2.2.a Dyneema Cloth 29
2.2.2.b Dyneema Non-Woven Sheet 30
2.2.2.c Dyneema Random Sheet 31
2.2.3 Zylon Cloth 32
2.2.4 Teflon 33
3. Experiment methodology and findings 34
3.1 Experimental Procedure 34
3.1.1 Insulating Material 34
3.1.2 Cool Down 34
3.1.3 Current excitation scheme 35
3.1.4 Data collection 36
3.2 Experimental Findings 36
3.2.1 Experimental data obtained when voltage tap signal was
fed to Pen recorder 36
3.2.1.1 Polyimide Film 36
3.2.1.2 Dyneema cloth 38
3.2.1.3 Zylon Cloth 40
3.2.1.4 Dyneema Non-Woven Sheet 41
3.2.1.5 Dyneema Random Sheet 42
3.2.1.6 Comparison of data measured using pen recorder 44
3.2.2 Experimental data obtained when voltage tap signal
was fed to Data recorder 46
3.2.2.1 Polyimide Film 46
3.2.2.2 Dyneema cloth 48
3.2.2.3 Dyneema random sheet 53
3.2.2.4 Zylon cloth 56
3.2.2.5 Teflon sheet 58
3.2.2.6 Comparison of data measured using data recorder 60
3.2.3 Comparison of measured data using pen recorder and

xii
data recorder 63
4. Conclusion 64
Appendix I 66 Appendix II 71
Bibliography 74
xiii
List of figures
1.1 Superconducting/resistive phase transition surface of niobium-
titanium.
2
1.2 Schematic view of operation of cryostatically stabilized
conductor.
3
1.3 Cross-section of the optimized coil for the prototype SCC 50 mm
main collider magnet.
7
1.4 Magnitude of the components of the Lorentz force on the
individual turns in a SCC 50 mm prototype magnet.
7
1.5 Schematic illustration of sample coil and back up coil 9
1.6 Induced voltage and excitation current of SUS and DFRP bobbin. 9
1.7 Working principle of the experimental setup. 10
1.8 Thrust force applied by the superconducting wire to the semi-
circular head.
11
1.9 View of forces acting on superconducting wire. 12
1.10 Measurement principle of wire motion experiment. 12
2.1 Schematic view of experimental set up. 16
2.2 Schematic view of sample holder. 19
2.3 Picture showing groove incorporated in the semi-circular head
part of the sample holder.
20
2.4 Picture showing sample holder sitting inside solenoid magnet. 20
2.5 Typical current densities of NbTi superconductor. 21
2.6 Schematic view of the experimental set up for the frictional
coefficient measurement at room temperature.
24
2.7 Frictional measurement plot in case of Polyimide film. 24
2.8 Superconducting cable being insulated using Polyimide film. 26
2.9 Molecular orientation in case of Dyneema SK60. 28
2.10 Sample holder along with Dyneema cloth sheet and scissor used
for cutting.
29
xiv
2.11 Photo of Dyneema non-woven sheet. 30
2.12 Photo of Dyneema random sheet. 31
2.13 Photo of Zylon cloth. 33
3.1 Current waveform pattern of superconducting wire. 35
3.2 Voltage tap signal due to superconducting wire motion in case of
Polyimide film.
37
3.3 Training effect as observed in case of Polyimide film. 37
3.4 Typical current waveform and measured voltage tap signal due to
wire motion in case of Dyneema cloth.
38
3.5 Typical voltage pattern due to wire motion after reversing the
current polarity in case of Dyneema cloth.
39
3.6 Typical voltage pattern due to wire motion after reversing the
current polarity in case of Zylon cloth.
40
3.7 Typical voltage pattern due to wire motion after reversing the
current polarity in case of Dyneema non-woven sheet.
41
3.8 Typical voltage pattern due to wire motion after reversing the
current polarity in case of Dyneema random sheet.
42
3.9 Voltage tap signal pattern as a function of tension and current in
case of Dyneema random sheet.
43
3.10 Comparison of voltage tap signal amplitude as a function of
current.
44
3.11 Dependence of wire motion on tension 45
3.12 Typical voltage tap signal amplitude in case of Polyimide film. 47
3.13 Peak voltage spike pattern in case of Polyimide film. 47
3.14 Typical voltage tap signal pattern in case of Dyneema cloth. 49
3.15 Peak voltage spike pattern in case of Dyneema cloth. 49
3.16 Typical voltage tap signal amplitude as a function of averaging of
data points in case of Dyneema cloth.
50
3.17 Typical voltage tap spike amplitude plot as a function of
averaging of data points in case of Dyneema cloth.
50

xv
3.18 Voltage spike width as a function of current in case of Dyneema
cloth.
51
3.19 Product of voltage tap signal amplitude with voltage spike width
as a function of current in case of Dyneema cloth.
51
3.20 Integrated voltage spike amplitude as a function of current in case
of Dyneema cloth.
52
3.21 Total energy dissipated during wire motion as a function of
current in case of Dyneema cloth.
52
3.22 Typical voltage tap signal pattern in case of Dyneema random
sheet when current ramp rate is 0.84 A/s.
54
3.23 Peak voltage spike pattern in case of Dyneema random sheet
when current ramp rate is 0.84 A/s.
54
3.24 Typical voltage tap signal pattern in case of Dyneema random
sheet when current ramp rate is 1.69 A/s.
55
3.25 Peak voltage spike pattern in case of Dyneema random sheet
when current ramp rate is 1.69 A/s.
55
3.26 Typical voltage tap signal plot as a function of averaging of data
points in case of Dyneema random sheet.
56
3.27 Typical voltage tap signal pattern in case of Zylon cloth. 57
3.28 Peak voltage spike pattern in case of Zylon cloth. 57
3.29 Typical voltage tap signal pattern in case of Teflon sheet. 58
3.30 Peak voltage spike pattern in case of Teflon sheet when tension is
15 N.
59
3.31 Peak voltage spike pattern in case of Teflon sheet when tension is
35.8 N.
59
3.32 Comparison of voltage tap signal amplitude as a function of
current for various samples.
61
3.33 Comparison of voltage tap signal amplitude, peak voltage spike
width and energy dissipated for various samples.
62
3.34 Voltage pulse pattern measured using data recorder and pen
recorder.
63
xvi
AI.1 Thrust force applied by the superconducting wire to the semi-
circular head.
69
AI.2 Approximation of polygon having N spacers. 69
AI.3 Detailed view of approximation of polygon having N spacers. 70
AII.1 Conceptual view of wire carrying current and distance moves a
distance dx in a magnetic field.
73
AII.2 Spike pattern with linear rise and fall. 73
xvii
List of tables
2.1 Specification of superconducting solenoid magnet. 17
2.2 Specification of superconducting wire. 17
2.3 Measured frictional coefficient at room temperature. 25
2.4 Properties of monofilament of Dyneema. 28
2.5 Properties of monofilament of Zylon. 32
3.1 Comparison of peak voltage tap signal amplitude, velocity of wire
motion and energy dissipated due to wire motion for various materials.
62
1
Chapter 1 Introduction
The aim of this chapter is to introduce the importance of study of the superconducting
wire motion under the influence of electromagnetic force, principle of
superconducting wire motion measurement, review of work carried out in the field of
superconducting wire motion and organization of dissertation.
1.1 Superconducting Magnets
Superconducting magnets are now being used in variety of applications such
as charge particle accelerators for High Energy Physics Research, Medical Resonance
Imaging (MRI), Magnetic Levitation, Mossbauer Spectroscopy etc. Design and
fabrication of superconducting magnets requires the highest quality of engineering.
The most outstanding feature of a superconducting magnet is its ability to
support a very high current density with zero resistance while at the same time the
operating costs are reduced. This characteristic permits magnets to be constructed that
generate intense magnetic fields with little or no electrical power input. Since the
current densities are high, superconducting magnet systems are quite compact and
occupy only a small amount of laboratory space. Another feature of superconducting
magnets is the stability of the magnetic field in the persistent mode of operation. In
the persistent mode of operation, the time constant is extremely long and the magnet
can be operated for days or even months at a nearly constant field.
Superconducting magnets are mostly intended for operation above 3 T, the
superconducting coils primarily determine field shape. The two main design goals for
superconducting magnets are to obtain a good quench performance (a quench implies
the loss of superconductivity in the wire/cable) and a good field quality.
The superconducting state only exists when superconducting materials are
maintained below the critical temperature. This temperature depends on the amount
of current carried by the conductors and the magnetic field to which the conductor is
subjected. A three-dimensional surface, called the critical surface, is defined by the
2
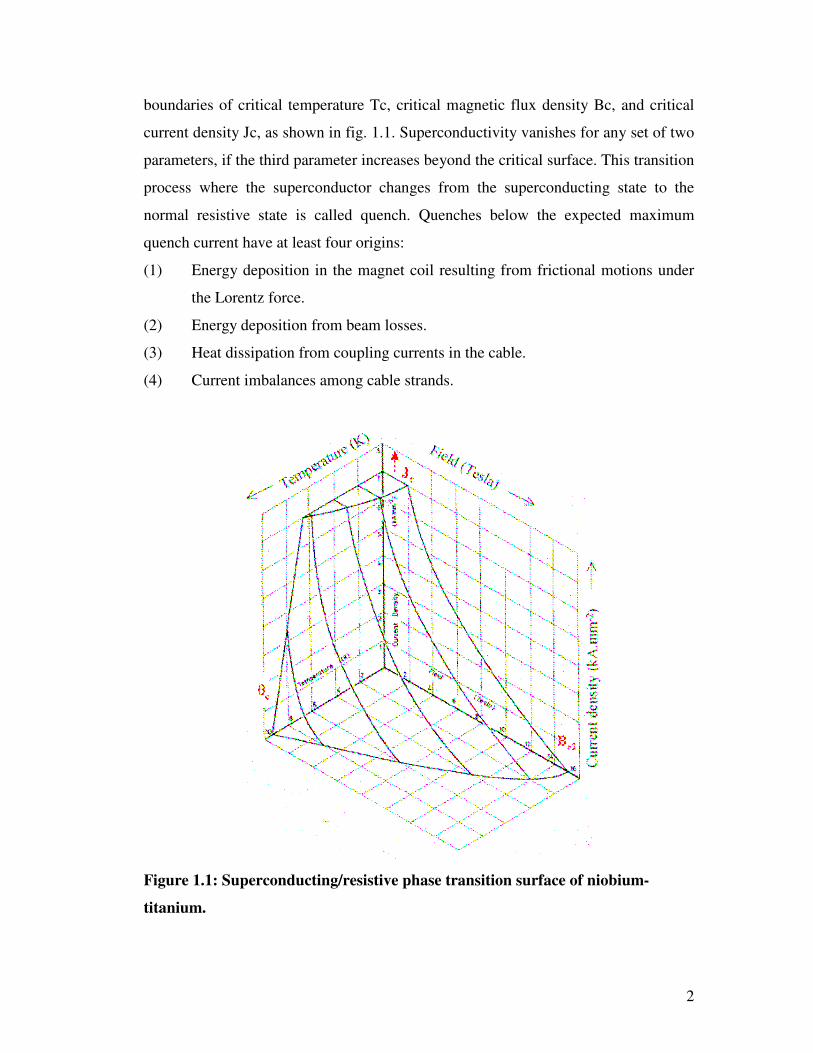
boundaries of critical temperature Tc, critical magnetic flux density Bc, and critical
current density Jc, as shown in fig. 1.1. Superconductivity vanishes for any set of two
parameters, if the third parameter increases beyond the critical surface. This transition
process where the superconductor changes from the superconducting state to the
normal resistive state is called quench. Quenches below the expected maximum
quench current have at least four origins:
(1) Energy deposition in the magnet coil resulting from frictional motions under
the Lorentz force.
(2) Energy deposition from beam losses.
(3) Heat dissipation from coupling currents in the cable.
(4) Current imbalances among cable strands.
Figure 1.1: Superconducting/resistive phase transition surface of niobium-
titanium.
3
Quenches of the first origin are revealing of flaws in the mechanical design or
in the assembly procedures, which must be analyzed and corrected.
Good quench performance of the superconducting magnets is closely related
to a good mechanical design, which minimizes the motion of the superconducting
wires. The design must be structurally sound to deal with the Lorentz forces when the
magnet is energized, the thermal forces during cool down of the magnet.
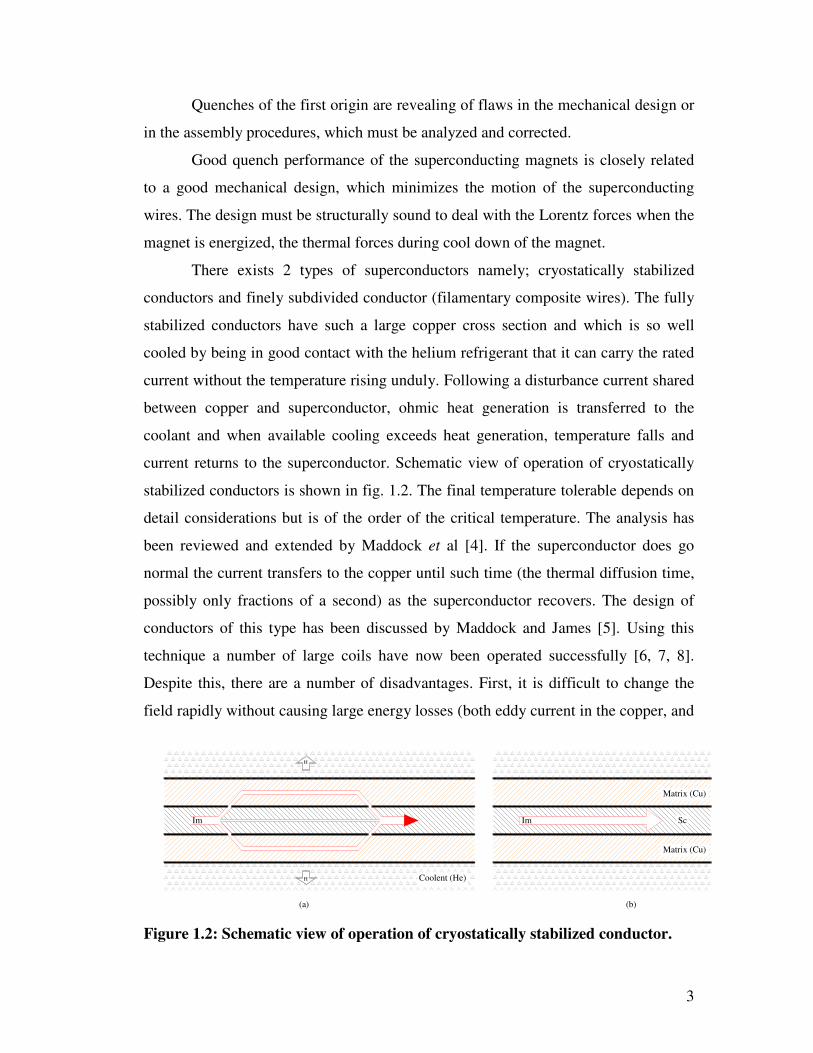
There exists 2 types of superconductors namely; cryostatically stabilized
conductors and finely subdivided conductor (filamentary composite wires). The fully
stabilized conductors have such a large copper cross section and which is so well
cooled by being in good contact with the helium refrigerant that it can carry the rated
current without the temperature rising unduly. Following a disturbance current shared
between copper and superconductor, ohmic heat generation is transferred to the
coolant and when available cooling exceeds heat generation, temperature falls and
current returns to the superconductor. Schematic view of operation of cryostatically
stabilized conductors is shown in fig. 1.2. The final temperature tolerable depends on
detail considerations but is of the order of the critical temperature. The analysis has
been reviewed and extended by Maddock et al [4]. If the superconductor does go
normal the current transfers to the copper until such time (the thermal diffusion time,
possibly only fractions of a second) as the superconductor recovers. The design of
conductors of this type has been discussed by Maddock and James [5]. Using this
technique a number of large coils have now been operated successfully [6, 7, 8].
Despite this, there are a number of disadvantages. First, it is difficult to change the
field rapidly without causing large energy losses (both eddy current in the copper, and
H
H
Matrix (Cu)
Matrix (Cu)
Im
Coolent (He)
(a) (b)
Im Sc
Figure 1.2: Schematic view of operation of cryostatically stabilized conductor.

4
hysteresis in the superconductor in the forms first developed) and so driving the coil
normal; secondly, the optimum design of conductor is different for each coil, thus
leading to high manufacturing costs, and thirdly, the coil design is considerably
complicated by the need to provide many helium ducts. As these difficulties are
avoided in the alternative conductors, full stabilization is now largely obsolete.
Most superconducting magnets are wound using conductors, which are
comprised of many fine filaments of a niobium-titanium (NbTi) alloy embedded in a
copper matrix. NbTi had good mechanical properties (ductility) but is generally
limited to producing ~7.5 T at 4.5 K and ~10.5 T at 1.8 K. The Titanium in NbTi
alloy is generally about 46% by weight. The coils are kept below a temperature of 4.2
K inside a cryostat. The cryogenic system is designed to minimize the heat leak to
room temperature outside the cryostat.
Superconducting magnet coils fabricated using finely subdivided conductors
are stable against flux jumping (the sudden and dissipative rearrangement of magnetic
flux within a superconductor) [9] but are subjected to mechanical disturbances, which
are the major cause for the premature quench. Mechanical disturbances such as
conductor motion caused by the Lorentz force on the conductor in the magnet are the
dominant source of degradation in the performance of high current density magnets
and a major cause for concern in the design of very large high magnetic field systems
[10]. Because of the very low heat capacities and the very high stresses, which can be
set up, movements of only a few micrometers may theoretically be sufficient to
trigger off a quench. Quenching at lower currents than the critical current is generally
known as degradation. It is often accompanied by a related behavior known as
training. After successive quenches, the magnet is able to achieve progressively
higher currents. To avoid this training effect, it is necessary that the conductors be
securely bonded in place to prevent them from moving.
In practical magnets, it is impossible to wind coils which fit together snugly at
the micron level and the problem of wire movements has therefore been tackle by
impregnating the coil with resins or waxes which fill all the remaining spaces.
Impregnation has been very successful in reducing wire motion and is now standard
practice in magnet construction. Even in the impregnanted magnet, training is one of

5
the major concern. Unfortunately, the resin contracts much more than the metal, so it
goes into tension. Furthermore, almost all organic materials become brittle at low
temperature. The use of organic impregnates can introduce other kinds of energy
disturbance. A plausible explanation of the long training sequences generally
displayed by resin-impregnated magnet is that, during the training process, all those
places, which must crack, are cracking. Once the cracking has happened, the coil is
“trained” and able to reach higher currents before quenching. Wire motions in the
magnetic field, cracking epoxy, and eddy currents generate heat.
1.2 Superconducting wire motion under the influence of electromagnetic force
Superconducting wire motion under the influence of electromagnetic force
(Lorentz force) are the main cause of premature quench in high performance and high
current density superconducting magnets [11, 12]. In the first approximation, Lorentz
force is proportional to 2B
BIFrrr
×= α2B
and is extremely high in high-field magnets.
Accelerator magnets are operated close to the critical current limit (~ 90% of
critical current) of their wire / cables, the electromagnetic work produced by minute
wire motions in the coils are of the same order of magnitude as the energy depositions
needed to trigger a quench [13]. During the excitation of the superconducting coil, the
wires / strands are subjected to strong Lorentz forces, which induce shear stress at the
metal / metal and metal / insulation interfaces. The later is considered to be the largest
and potentially most harmful source of frictional heating. Hence, frictional properties
on contacting combinations of the superconducting wire and winding structures are
important parameters for characterizing stability of the superconducting windings.
Kinsley and Iwasa [14] have made a detailed study to observe sliding behavior at 4.2
K, 77 K and 295 K for a number of polymers, laminated composites and coated
pieces sliding against either copper or aluminum. They found that, some surfaces

6
show stick-slip friction with sudden release of energy, some slide gradually in a stable
fashion and therefore release the stored energy quite slowly.
This leaves two possibilities; either to prevent wire or coil motions by
providing a rigid support against the various components of the Lorentz force or to
reduce to a minimum the friction coefficients between potentially moving parts of
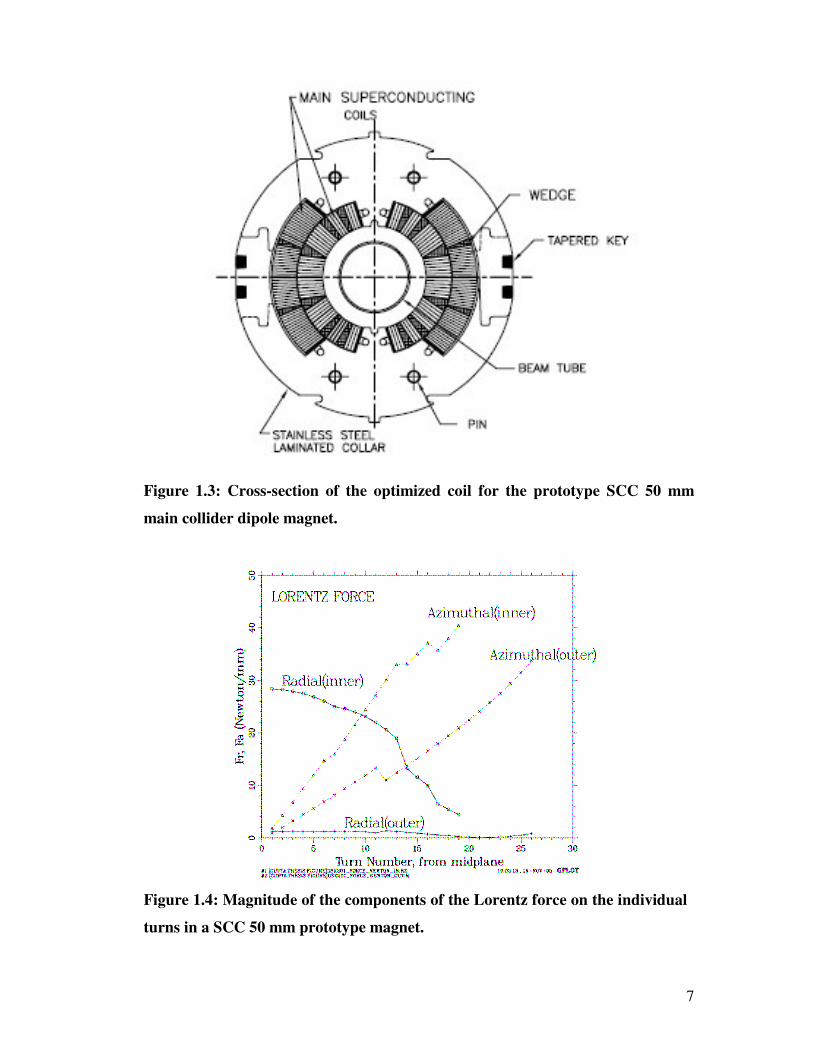
magnet assembly [15]. In the superconducting magnets used for accelerator, in the
radial direction; the coils are confined by laminated collars, which are locked around
the coils by means of keys or tie rods as shown in fig.1.3 [16]. In the azimuthal
direction; the collars are assembled so as to pre-compress the coils. In the axial
direction; the coils either are free to expand or are restrained by means of stiff end
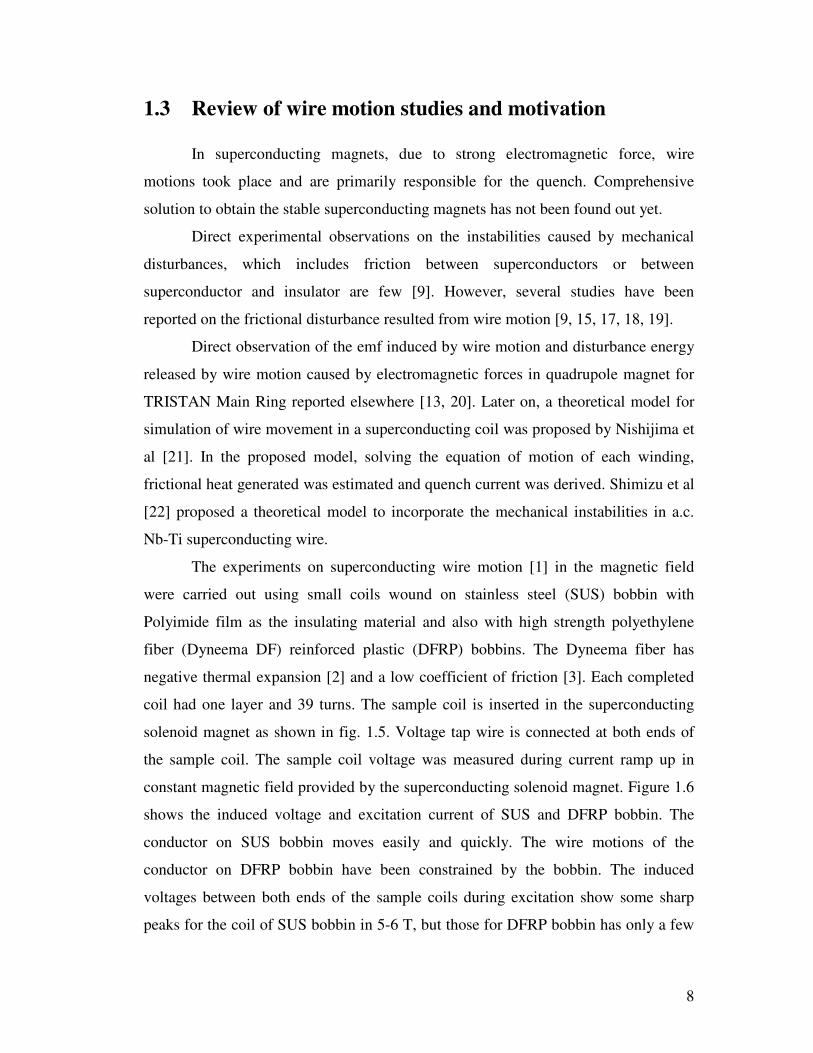
plates. Figure 1.4 shows the magnitude of the components of the individual turns in a
SSC 50 mm prototype dipole magnet [16]. The radial component of the force (Fr)
pushes the coil outward and the azimuthal component (Fa) compresses the coil
towards the midplane (horizontal plane).
In order to study the effect of the frictional coefficient of insulating material
on the superconducting wire motion under the influence of electromagnetic force, a
special experimental set up was designed and fabricated. The main distinctiveness of
the experimental set up is that the tension of the superconducting wire can be changed
during the experiments.
7
Figure 1.4: Magnitude of the components of the Lorentz force on the individual
turns in a SCC 50 mm prototype magnet.
Figure 1.3: Cross-section of the optimized coil for the prototype SCC 50 mm
main collider dipole magnet.
8
1.3 Review of wire motion studies and motivation
In superconducting magnets, due to strong electromagnetic force, wire
motions took place and are primarily responsible for the quench. Comprehensive
solution to obtain the stable superconducting magnets has not been found out yet.
Direct experimental observations on the instabilities caused by mechanical
disturbances, which includes friction between superconductors or between
superconductor and insulator are few [9]. However, several studies have been
reported on the frictional disturbance resulted from wire motion [9, 15, 17, 18, 19].
Direct observation of the emf induced by wire motion and disturbance energy
released by wire motion caused by electromagnetic forces in quadrupole magnet for
TRISTAN Main Ring reported elsewhere [13, 20]. Later on, a theoretical model for
simulation of wire movement in a superconducting coil was proposed by Nishijima et
al [21]. In the proposed model, solving the equation of motion of each winding,
frictional heat generated was estimated and quench current was derived. Shimizu et al
[22] proposed a theoretical model to incorporate the mechanical instabilities in a.c.
Nb-Ti superconducting wire.
The experiments on superconducting wire motion [1] in the magnetic field
were carried out using small coils wound on stainless steel (SUS) bobbin with
Polyimide film as the insulating material and also with high strength polyethylene
fiber (Dyneema DF) reinforced plastic (DFRP) bobbins. The Dyneema fiber has
negative thermal expansion [2] and a low coefficient of friction [3]. Each completed
coil had one layer and 39 turns. The sample coil is inserted in the superconducting
solenoid magnet as shown in fig. 1.5. Voltage tap wire is connected at both ends of
the sample coil. The sample coil voltage was measured during current ramp up in
constant magnetic field provided by the superconducting solenoid magnet. Figure 1.6
shows the induced voltage and excitation current of SUS and DFRP bobbin. The
conductor on SUS bobbin moves easily and quickly. The wire motions of the
conductor on DFRP bobbin have been constrained by the bobbin. The induced
voltages between both ends of the sample coils during excitation show some sharp
peaks for the coil of SUS bobbin in 5-6 T, but those for DFRP bobbin has only a few
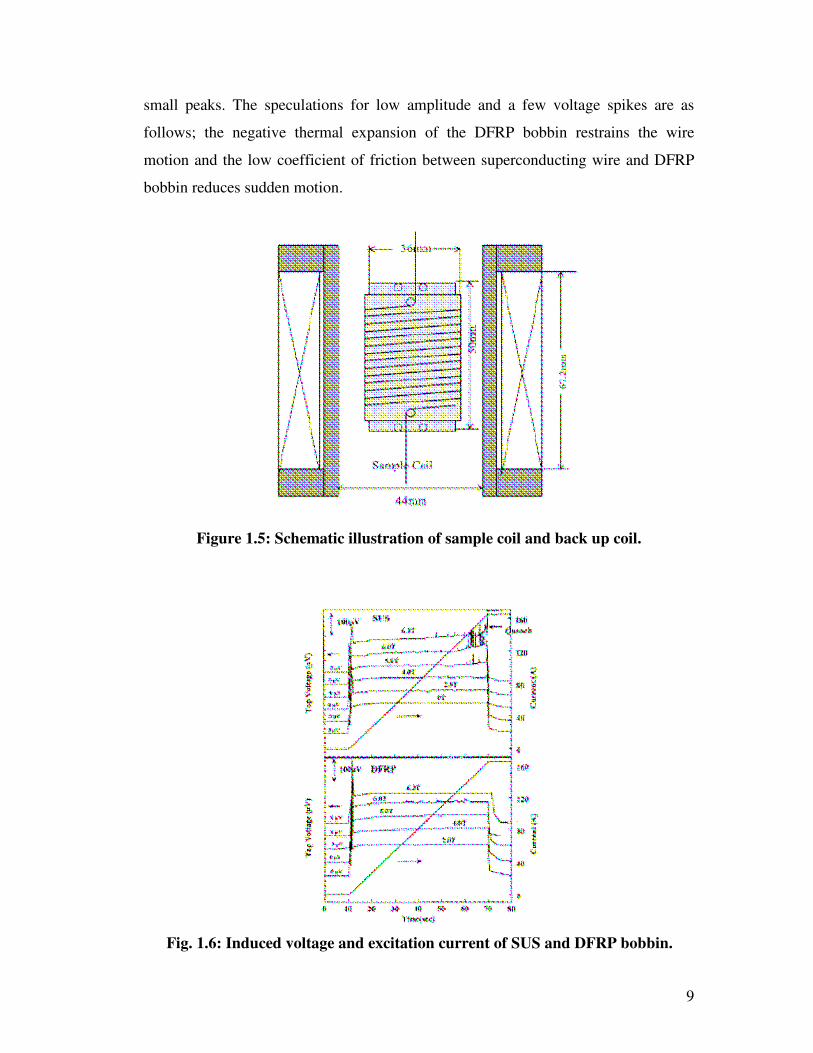
9
small peaks. The speculations for low amplitude and a few voltage spikes are as
follows; the negative thermal expansion of the DFRP bobbin restrains the wire
motion and the low coefficient of friction between superconducting wire and DFRP
bobbin reduces sudden motion.
Figure 1.5: Schematic illustration of sample coil and back up coil.
Fig. 1.6: Induced voltage and excitation current of SUS and DFRP bobbin.
10
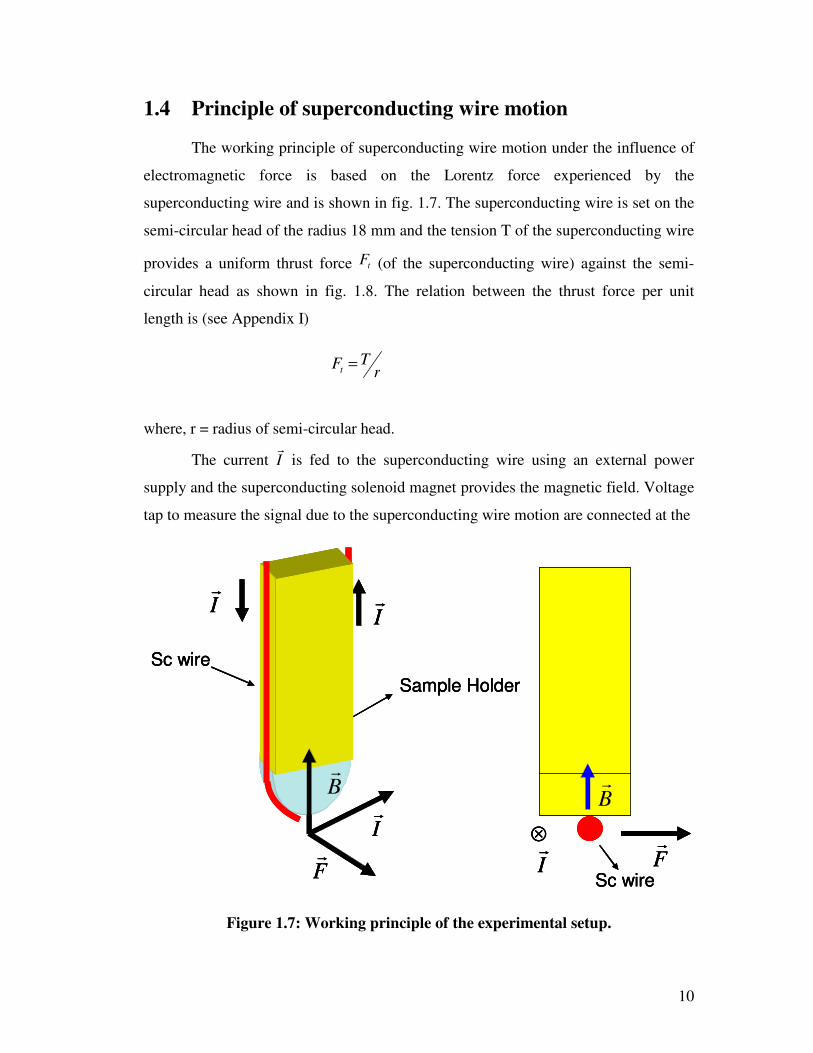
1.4 Principle of superconducting wire motion
The working principle of superconducting wire motion under the influence of
electromagnetic force is based on the Lorentz force experienced by the
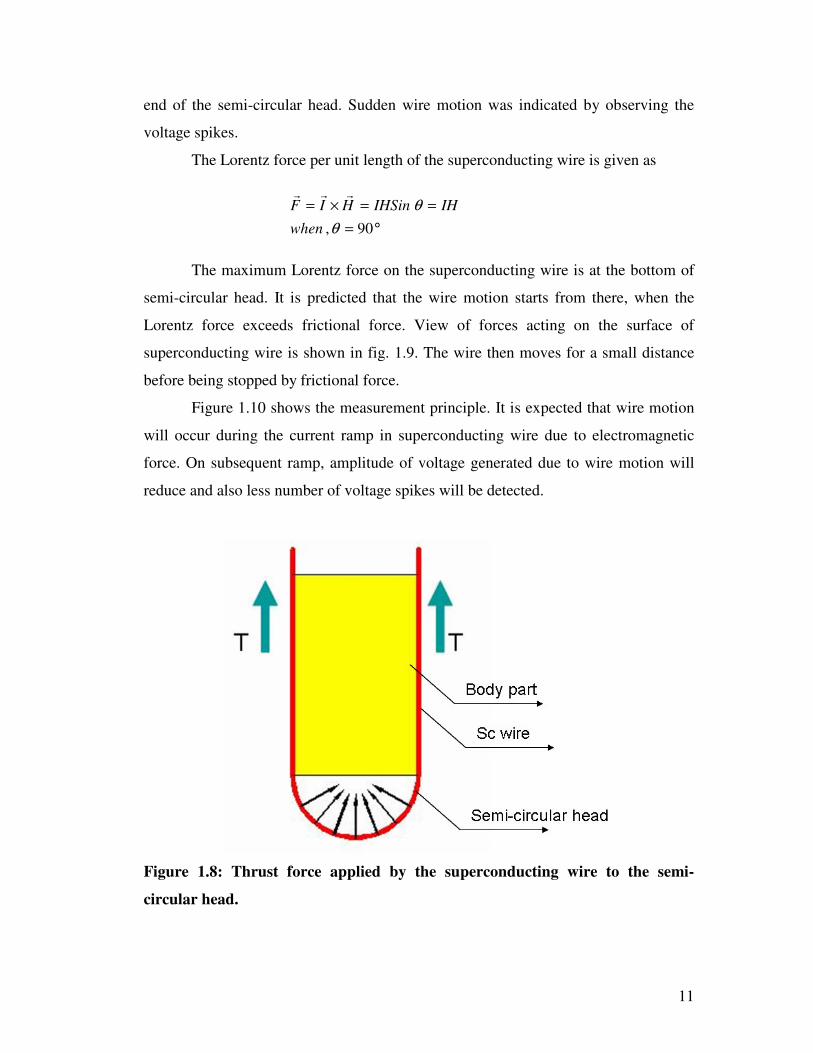
superconducting wire and is shown in fig. 1.7. The superconducting wire is set on the
semi-circular head of the radius 18 mm and the tension T of the superconducting wire
provides a uniform thrust force tF (of the superconducting wire) against the semi-
circular head as shown in fig. 1.8. The relation between the thrust force per unit
length is (see Appendix I)
where, r = radius of semi-circular head.
The current Ir
is fed to the superconducting wire using an external power
supply and the superconducting solenoid magnet provides the magnetic field. Voltage
tap to measure the signal due to the superconducting wire motion are connected at the
Sc wire
⊗
Ir
Fr
Br
Ir
Sc wire
Sample Holder
IrI
r
Fr
Br
Sc wire
⊗
Ir
Fr
Br
Sc wire
⊗
Ir
Fr
Br
Ir
Sc wire
Sample Holder
IrI
r
Fr
Br
Ir
Sc wire
Sample Holder
IrI
r
Fr
Br
Figure 1.7: Working principle of the experimental setup.
rTFt =
11
end of the semi-circular head. Sudden wire motion was indicated by observing the
voltage spikes.
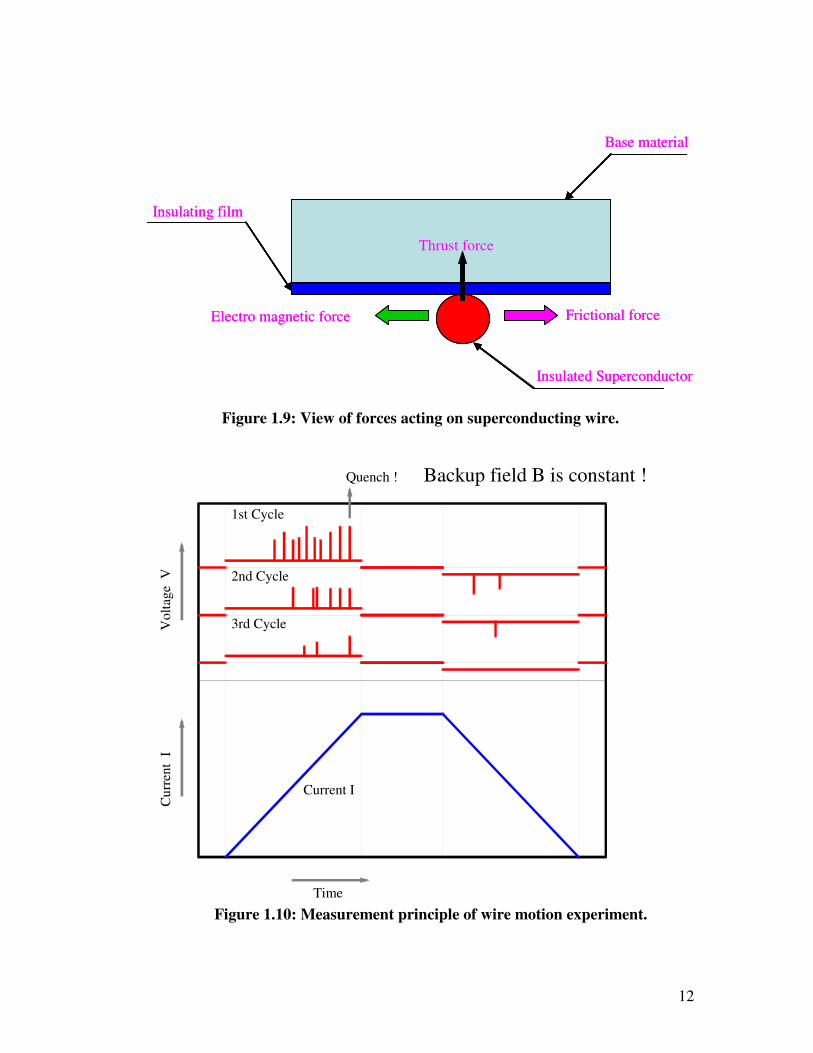
The Lorentz force per unit length of the superconducting wire is given as
The maximum Lorentz force on the superconducting wire is at the bottom of
semi-circular head. It is predicted that the wire motion starts from there, when the
Lorentz force exceeds frictional force. View of forces acting on the surface of
superconducting wire is shown in fig. 1.9. The wire then moves for a small distance
before being stopped by frictional force.
Figure 1.10 shows the measurement principle. It is expected that wire motion
will occur during the current ramp in superconducting wire due to electromagnetic
force. On subsequent ramp, amplitude of voltage generated due to wire motion will
reduce and also less number of voltage spikes will be detected.
Figure 1.8: Thrust force applied by the superconducting wire to the semi-
circular head.
°=
==×=
90,θ
θ
when
IHIHSinHIFrrr
12
1st Cycle
2nd Cycle
3rd Cycle
Quench !
Current I
Backup field B is constant !
Time
Vo
ltag
e V
Cu
rren
t I
Figure 1.10: Measurement principle of wire motion experiment.
Frictional forceElectro magnetic force
Insulating film
Base material
Insulated Superconductor
Thrust force
Frictional forceElectro magnetic force
Insulating film
Base material
Insulated Superconductor
Thrust force
Figure 1.9: View of forces acting on superconducting wire.

13
1.5 Objective of our study
The main aim of present research work is
(1) Design and development of an experimental setup to detect superconducting
wire motion.
(2) To study the time dependence profile of wire motion.
(3) To study the dependence of superconducting wire motion on:
(i) coefficient of friction of insulating material
(ii) applied tension to the superconducting wire
(iii) current ramp rate
(iv) current polarity
A special experimental set up was designed and fabricated to study the effect
of the frictional coefficient of insulating material on the superconducting wire motion
under the influence of electromagnetic force. The experimental set up consists of a
cryostat, superconducting solenoid magnet, sample holder, tensional unit to apply
tension to the superconducting wire, power supplies and pen recorder or a 16-bit data
recorder to measure the voltage tap signal. The main distinctiveness of the
experimental setup is that the tension of the superconducting wire can be changed
during the experiments.
Superconducting wire motion depends on the electromagnetic force acting on
it and frictional property of the insulating material. If the coefficient of friction of the
insulating material is low, then one expects smooth and many wire motions. During
this process, the energy will be released quite smoothly. On the contrary, if the
coefficient of friction of insulating material is high, then one expects sudden and less
number of wire motions with a sudden release in the energy. Hence, frictional
properties of the conductors and winding structures are important parameters for
characterizing stability of the superconducting windings.
Experiments were carried out at 4.2 K to study the superconducting wire
motion under different experimental conditions such as; different insulating material
at the interface of superconducting wire and semi-circular head, varying the tension to
the superconducting wire, varying the current ramp rate and varying the
14
electromagnetic force. The insulating materials which are commonly used in high
field superconducting magnets are taken for study such as Polyimide film, Teflon,
Zylon cloth and Dyneema based materials.
1.6 Organization of dissertation
An overview of the superconducting wire motion measurement principle
under the influence of electromagnetic force, review of work in wire motion studies
and objective of our study are described in previous sections. Chapter 2 introduces the
experimental equipments, measurement technique and properties of insulating
materials used during experiments. Experimental procedure and findings during the
course of thesis work are illustrated in Chapter 3. Conclusions drawn during the
course work and further work to be carried out are discussed in Chapter 4.
15
Chapter 2 Experimental setup to detect wire motion
Design details of the experimental setup and instruments used to measure the
superconducting wire motion under the influence of electromagnetic force are
described in this chapter. Superconducting wire motion depends on the frictional
property of the insulating material, tension applied to the superconducting wire and
electromagnetic force experienced by the superconducting wire. Generally, a coating
of insulating material is applied to the base material before the start of coil winding,
between the coil layers, after completion of coil and as a spacer. Some of the
commonly used insulating materials such as Polyimide film, Teflon, Zylon Cloth and
Dyneema based materials are taken for the study. The properties of materials that
were used during the experiments are also discussed in this chapter.
2.1 Experimental setup
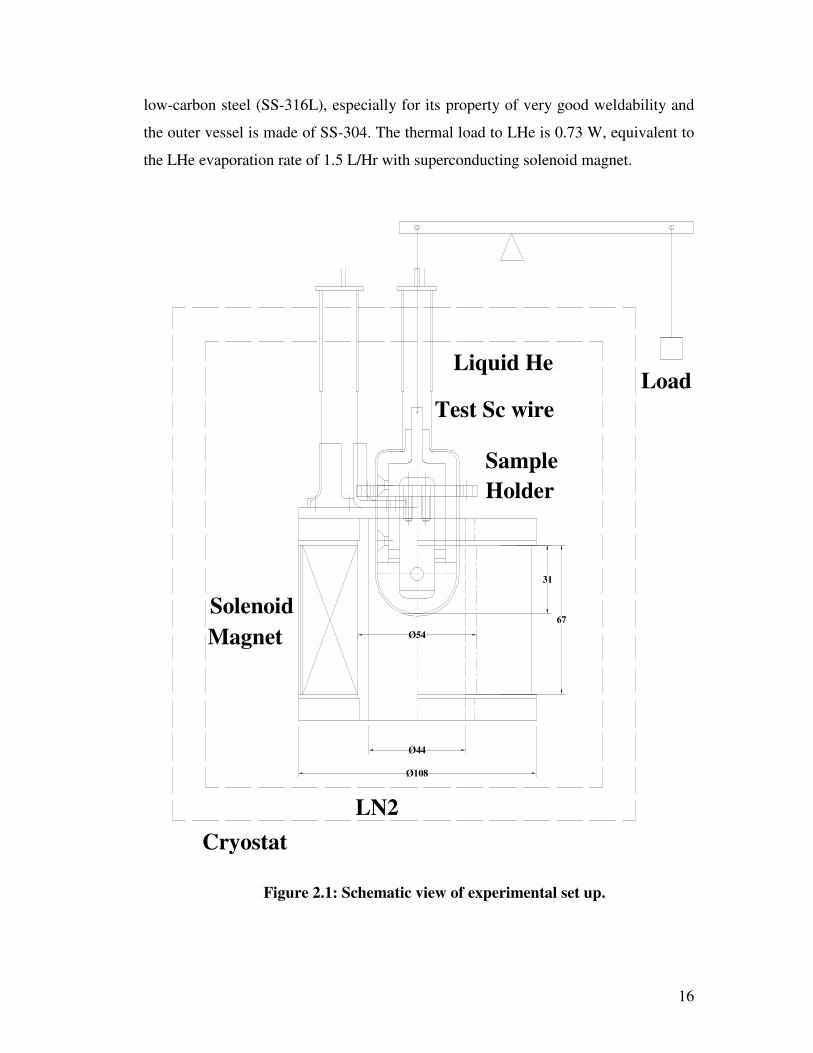
The experimental setup consists of a cryostat, superconducting solenoid
magnet, sample holder, tensional unit to apply tension to the superconducting wire,
power supplies and pen recorder or a 16-bit data recorder to measure the voltage tap
signal. Schematic view of the experimental setup is shown in fig. 2.1. In order to save
the cost and time, we used the cryostat and superconducting solenoid magnet, which
were readily available with KEK Crab Cavity Group. The details of sub-systems are
described in following sub-sections.
2.1.1 Cryostat
Vertical cryostat of 200 mm in diameter and 1250 mm in height was used for
the experiments. It consists of two vessels; the inner one for cooling the
superconducting magnet with liquid helium and the outer one for providing the heat
sink of 80 K thermal shield with liquid nitrogen. The thermal shields are placed
between the liquid helium vessel and the external housing, which are wrapped with
multi layered super insulation. The inner vessel is made of cryogenically compatible
16
low-carbon steel (SS-316L), especially for its property of very good weldability and
the outer vessel is made of SS-304. The thermal load to LHe is 0.73 W, equivalent to
the LHe evaporation rate of 1.5 L/Hr with superconducting solenoid magnet.
Cryostat
LN2
Liquid He
Solenoid
Sample
Holder
Test Sc wire
Load
Ø44
Ø108
31
Ø54
67
Magnet
Figure 2.1: Schematic view of experimental set up.

17
2.1.2 Solenoid Magnet
Superconducting solenoid magnet can provide a magnetic field of 7 T at 148
A. The inner and outer diameter of the magnet is 54 mm and 103 mm respectively.
The length of magnet is 67.5 mm. Main parameters of superconducting solenoid
magnet are given in table 2.1. It is wound using NbTi superconducting wire and the
characteristics of superconducting wire are given in table 2.2.
Table 2.1: Specification of superconducting solenoid magnet
Parameter Value
Designed magnetic field 7 T
Inner/Outer diameter 54/103 mm
Total no. of turns 3839
Current @ 7 T 148 A
Length of magnet 67.5 mm
Inductance 0.65 H
Table 2.2: Specification of superconducting wire
Parameter Value
Material NbTi in copper matrix
Wire diameter 0.7 mm
Insulation Formvar
Insulation thickness ~ 10 µm
No. of filaments ~ 10,000
Filament diameter 6 µm
Twist pitch 30 mm
NbTi/Cu 1:1.8
Ic 383 A @ 4T
260 A @ 6 T
100 A @ 8.57 T

18
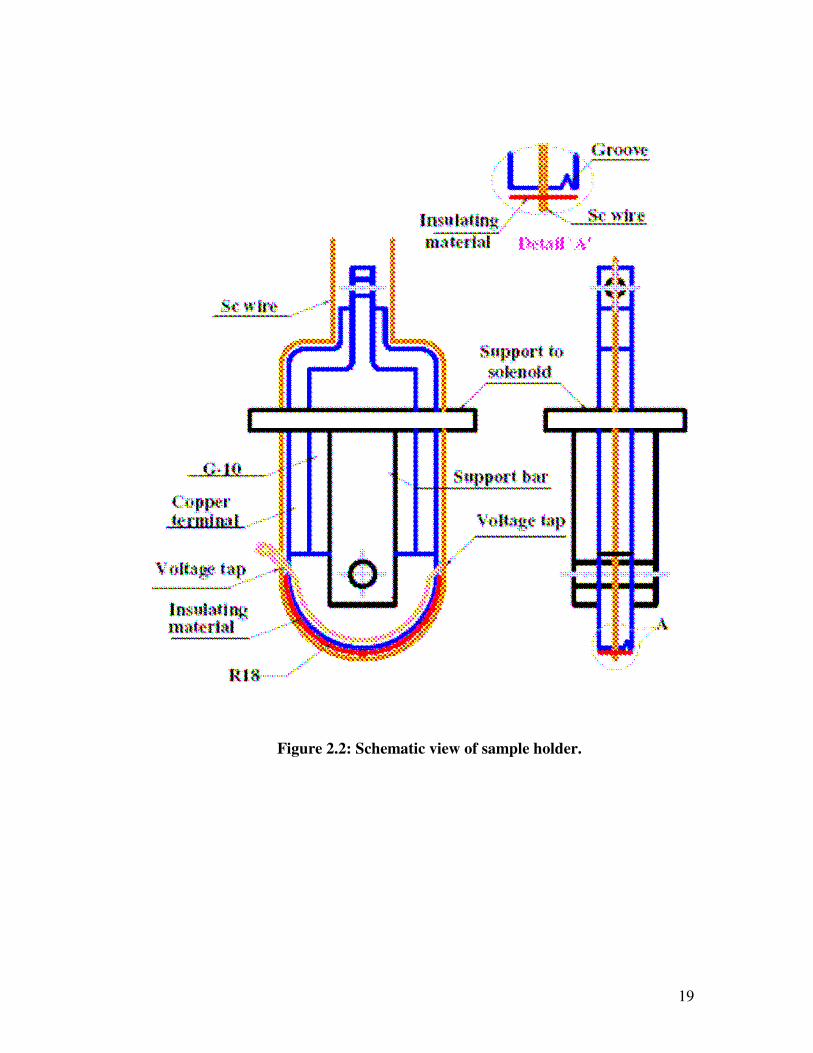
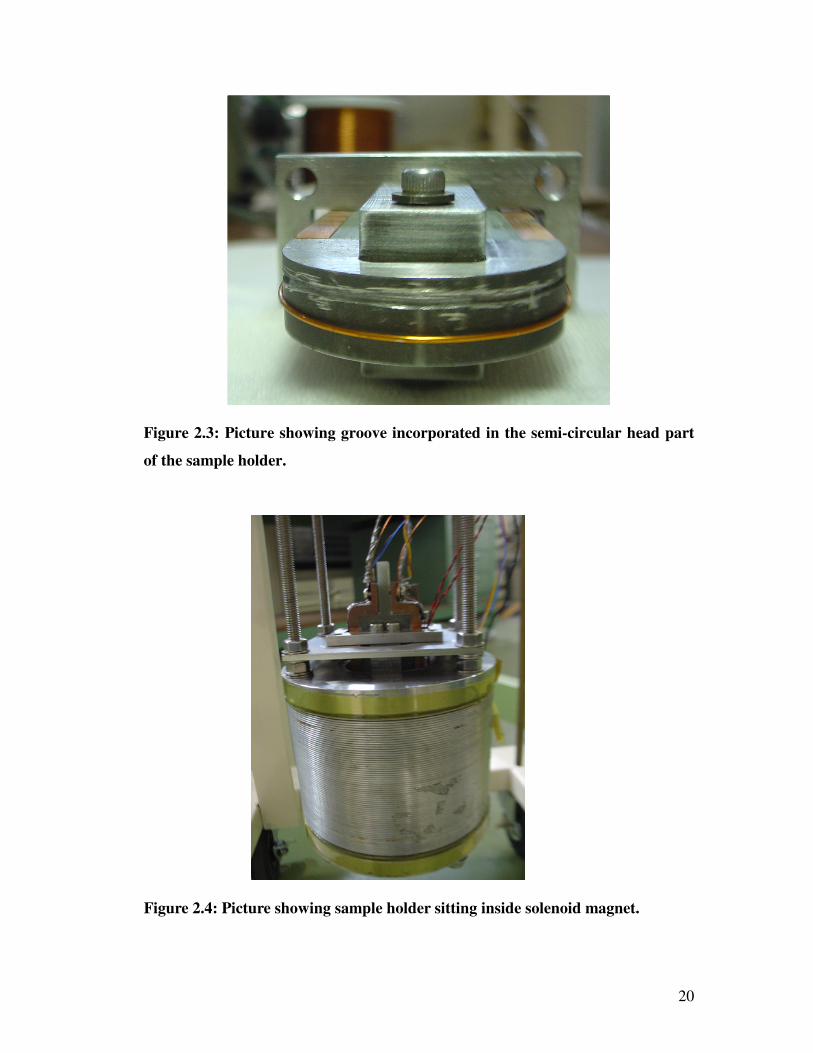
2.1.3 Sample Holder
The sample holder shown in fig. 2.2 consists of two parts; a semi-circular
head of radius 18 mm fabricated using SS316 L and a body part fabricated using G-
10. Dimensions of the superconducting solenoid magnet were taken as a reference for
the design of sample holder. The superconducting wire is wound on the semi-circular
head and soldered to the copper terminals. The semi-circular head is installed and
fixed to the superconducting solenoid magnet using support bars. The body part can
move upward to change the tension of the superconducting wire. Insulating material
is inserted between the semi-circular head and the superconducting wire. Voltage taps
to measure the signal due to the superconducting wire motion are connected at the
end of semi-circular head. To reduce the voltage tap loop area, a groove was
incorporated in the semi-circular head as shown in fig. 2.3 and the voltage tap wire
was passed through it. In order to reduce the noise and thermoelectric voltage,
enameled copper wire (Φ 0.2 mm) was twisted and is directly connected to pen
recorder / data recorder. Figure 2.4 shows the picture of sample holder placed inside
the aperture of superconducting solenoid magnet.
19
Figure 2.2: Schematic view of sample holder.
20
Figure 2.3: Picture showing groove incorporated in the semi-circular head part
of the sample holder.
Figure 2.4: Picture showing sample holder sitting inside solenoid magnet.
21
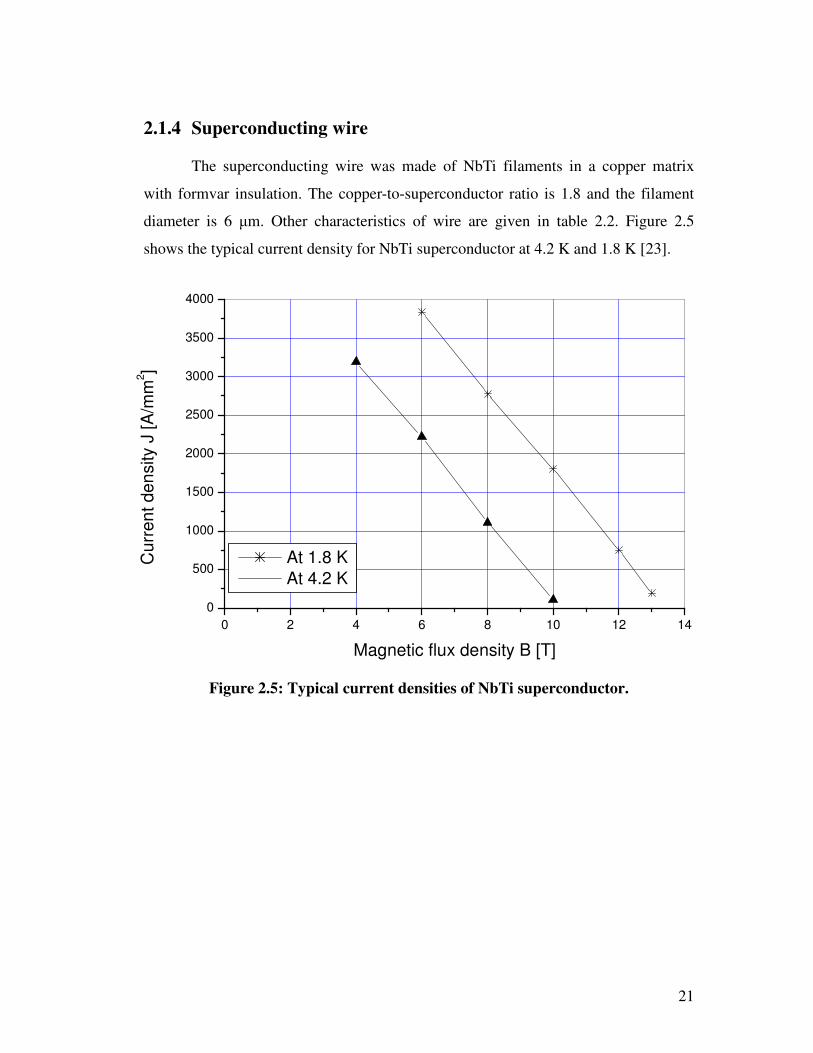
2.1.4 Superconducting wire
The superconducting wire was made of NbTi filaments in a copper matrix
with formvar insulation. The copper-to-superconductor ratio is 1.8 and the filament
diameter is 6 µm. Other characteristics of wire are given in table 2.2. Figure 2.5
shows the typical current density for NbTi superconductor at 4.2 K and 1.8 K [23].
0 2 4 6 8 10 12 14
0
500
1000
1500
2000
2500
3000
3500
4000
At 1.8 K
At 4.2 K
Cu
rre
nt d
en
sity J
[A
/mm
2]
Magnetic flux density B [T]
Figure 2.5: Typical current densities of NbTi superconductor.
22
2.1.5 Tensional Unit
In order to apply tension to the superconducting wire, a string is attached to
the body part of the sample holder from the top flange and tension is applied via lever
mechanism. The tension of the superconducting wire provides a uniform thrust force
to the semi-circular head part as shown in fig. 1.5. The tension can be varied as per
requirement by adjusting the load. The superconducting wire tension was varied from
7.1 N to 35.8 N to study the effect of tension on the superconducting wire motion
under the influence of electromagnetic force.
During the winding of superconducting solenoid magnet which was used
during the experiments, tension of 29.4 N was applied to the superconducting wire.
2.1.6 Instrumentation
Programmable power supplies (6V, 160A) were used to feed the current to the
superconducting solenoid magnet and the superconducting wire. Current in the
solenoid magnet was fixed (120 A) while the current in the superconducting wire was
ramped from 0 A to 118 A. The current ramp up and ramp down rate was 0.85 A/s
with a flat top of 60s. In order to examine the effect of the current ramp rate on the
superconducting wire motion, the current ramp rate was changed from 0.4 A/s to 1.69
A/s. Voltage taps to measured the signal due to the superconducting wire motion are
connect at the end of the semi-circular head. The voltage tap signal is measured by a
pen recorder [24] or a 16-bit data recorder with a sampling rate of 1MS/s [25].
Liquid helium level sensor is installed to measure the helium level in the
cryostat.
23
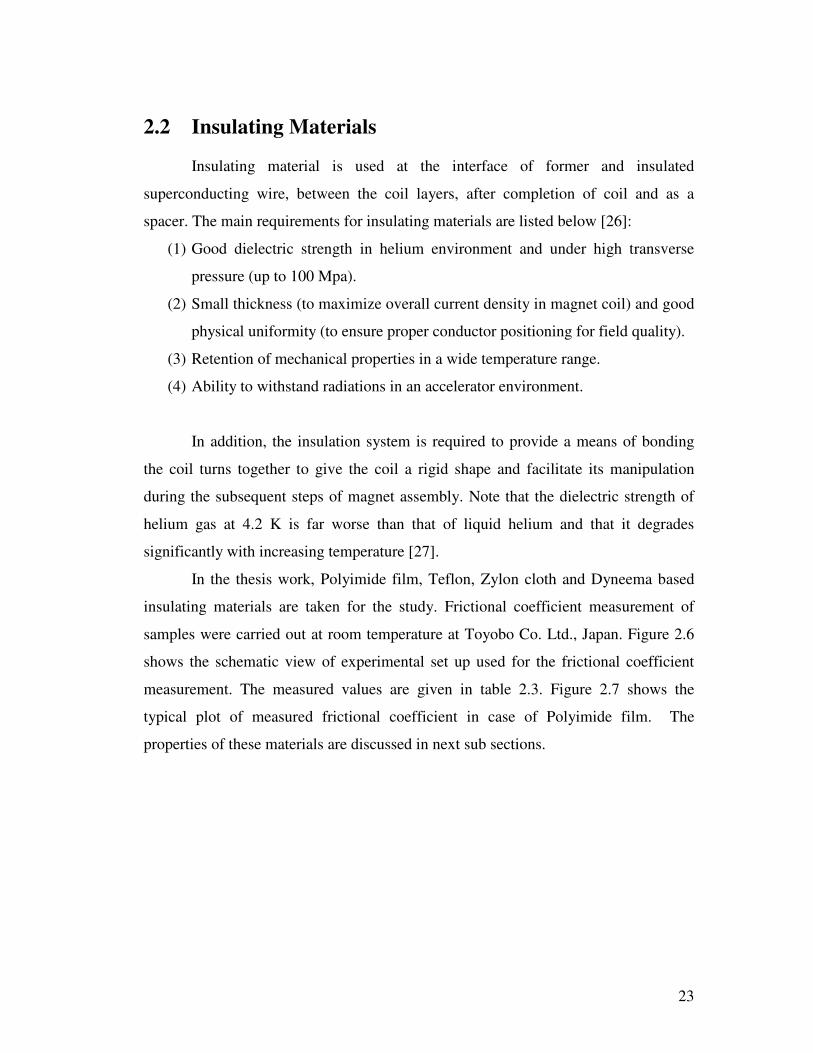
2.2 Insulating Materials
Insulating material is used at the interface of former and insulated
superconducting wire, between the coil layers, after completion of coil and as a
spacer. The main requirements for insulating materials are listed below [26]:
(1) Good dielectric strength in helium environment and under high transverse
pressure (up to 100 Mpa).
(2) Small thickness (to maximize overall current density in magnet coil) and good
physical uniformity (to ensure proper conductor positioning for field quality).
(3) Retention of mechanical properties in a wide temperature range.
(4) Ability to withstand radiations in an accelerator environment.
In addition, the insulation system is required to provide a means of bonding
the coil turns together to give the coil a rigid shape and facilitate its manipulation
during the subsequent steps of magnet assembly. Note that the dielectric strength of
helium gas at 4.2 K is far worse than that of liquid helium and that it degrades
significantly with increasing temperature [27].
In the thesis work, Polyimide film, Teflon, Zylon cloth and Dyneema based
insulating materials are taken for the study. Frictional coefficient measurement of
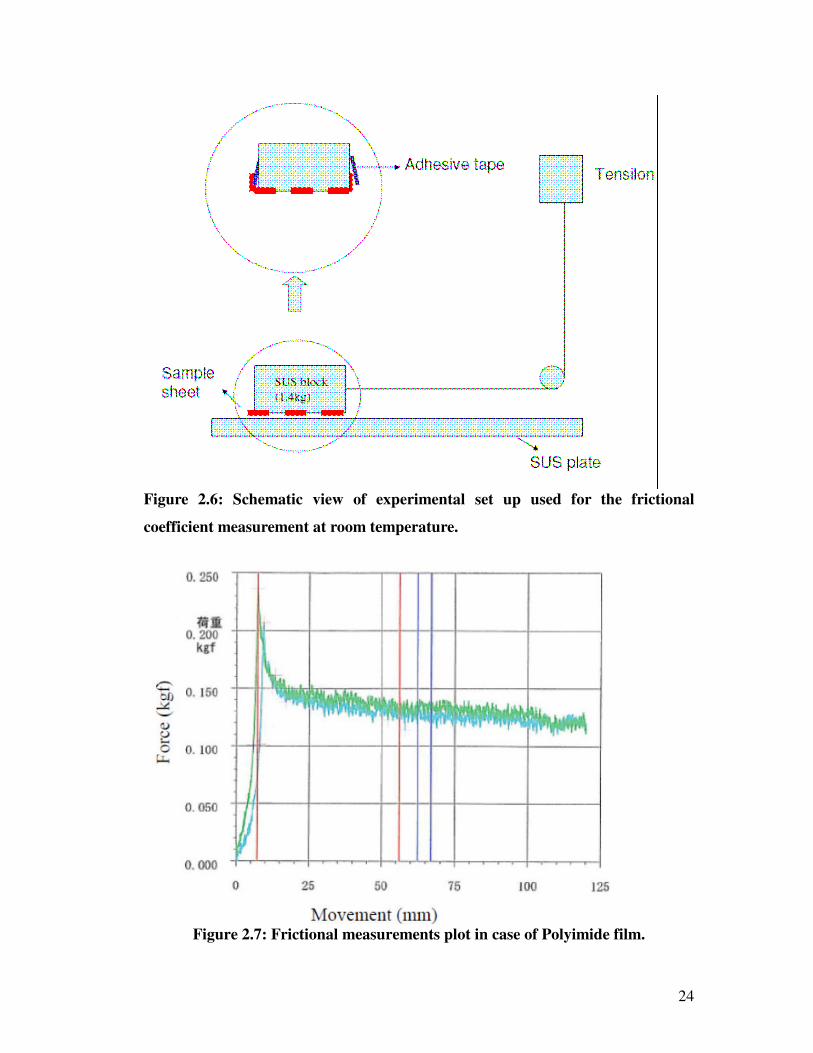
samples were carried out at room temperature at Toyobo Co. Ltd., Japan. Figure 2.6
shows the schematic view of experimental set up used for the frictional coefficient
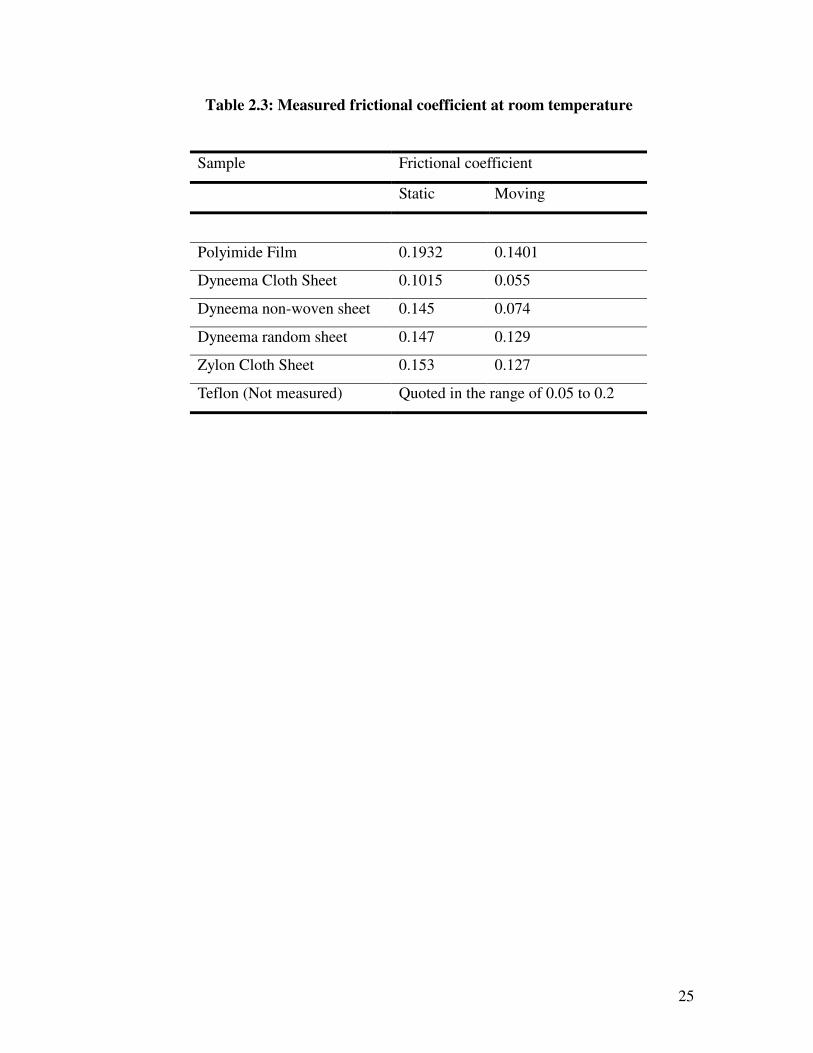
measurement. The measured values are given in table 2.3. Figure 2.7 shows the
typical plot of measured frictional coefficient in case of Polyimide film. The
properties of these materials are discussed in next sub sections.
24
Figure 2.6: Schematic view of experimental set up used for the frictional
coefficient measurement at room temperature.
Figure 2.7: Frictional measurements plot in case of Polyimide film.
25
Table 2.3: Measured frictional coefficient at room temperature
Sample Frictional coefficient
Static Moving
Polyimide Film 0.1932 0.1401
Dyneema Cloth Sheet 0.1015 0.055
Dyneema non-woven sheet 0.145 0.074
Dyneema random sheet 0.147 0.129
Zylon Cloth Sheet 0.153 0.127
Teflon (Not measured) Quoted in the range of 0.05 to 0.2
26
2.2.1 Polyimide film
Polyimide film posses unique combinations of properties that make it deal for
a variety of applications in many different industries. It maintains its excellent
physical, electrical, and mechanical properties over a wide temperature range. It is
synthesized by polymerizing an aromatic diahydride and an aromatic diamine.
Polyimide film is commonly used insulating material in high field
superconducting magnets and also for room temperature electromagnets. The
insulation of Tevatron, HERA magnets, SSC magnets and LHC magnets are
constituted of one or two inner layers of Polyimide film, wrapped helically with a 50-
60% overlap, completed by an outer layer of resin-impregnated glass fiber tape,
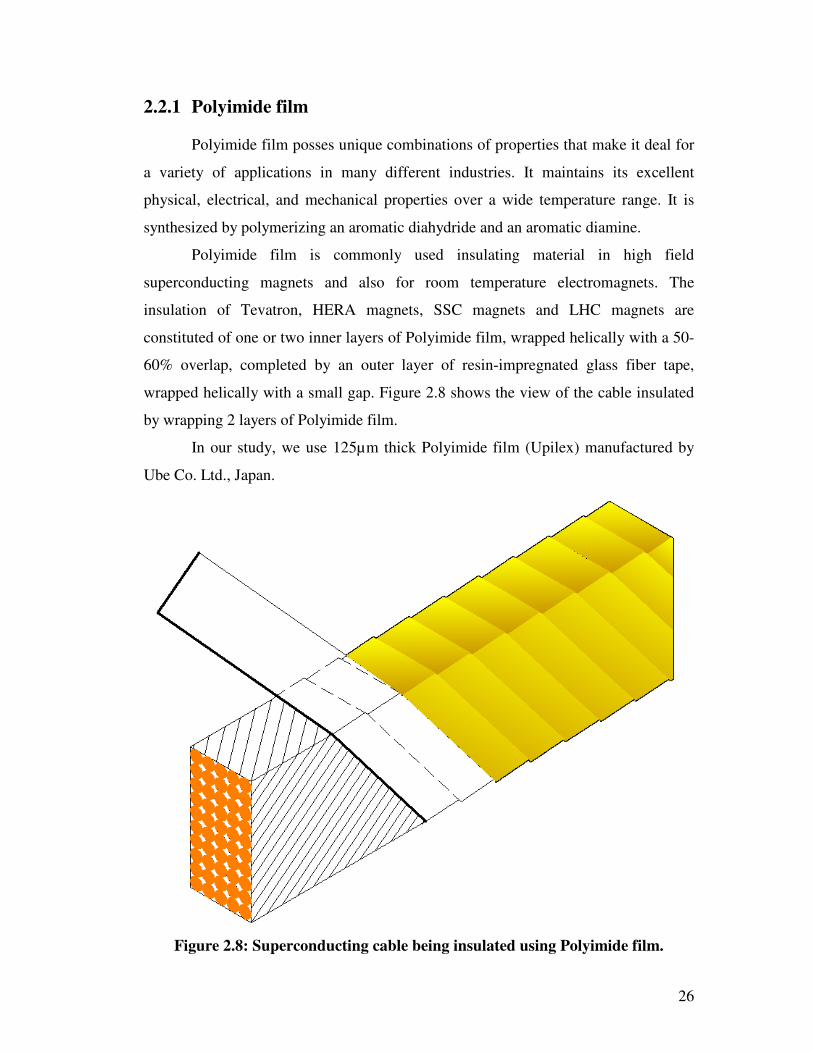
wrapped helically with a small gap. Figure 2.8 shows the view of the cable insulated
by wrapping 2 layers of Polyimide film.
In our study, we use 125µm thick Polyimide film (Upilex) manufactured by
Ube Co. Ltd., Japan.
Figure 2.8: Superconducting cable being insulated using Polyimide film.

27
2.2.2 Dyneema Based Insulating Materials
Dyneema ® is a registered trademark in Japan. Polyethylene with an ultra
high molecular weight is used as the starting material for the manufacturing of
Dyneema fibers. Dyneema fibers are produced by gel spinning, a process invented
and patented by the Du Point Company (DSM) in 1979. In the gel spinning process
the molecules are dissolved in a solvent and spun through a spinneret [28]. In the
solution the molecules that form clusters in the sold state become disentangled and
remain in that state after the solution is cooled to give filaments. As the fiber is
drawn, a very high level of macromolecular orientation is attained resulting in a fiber,
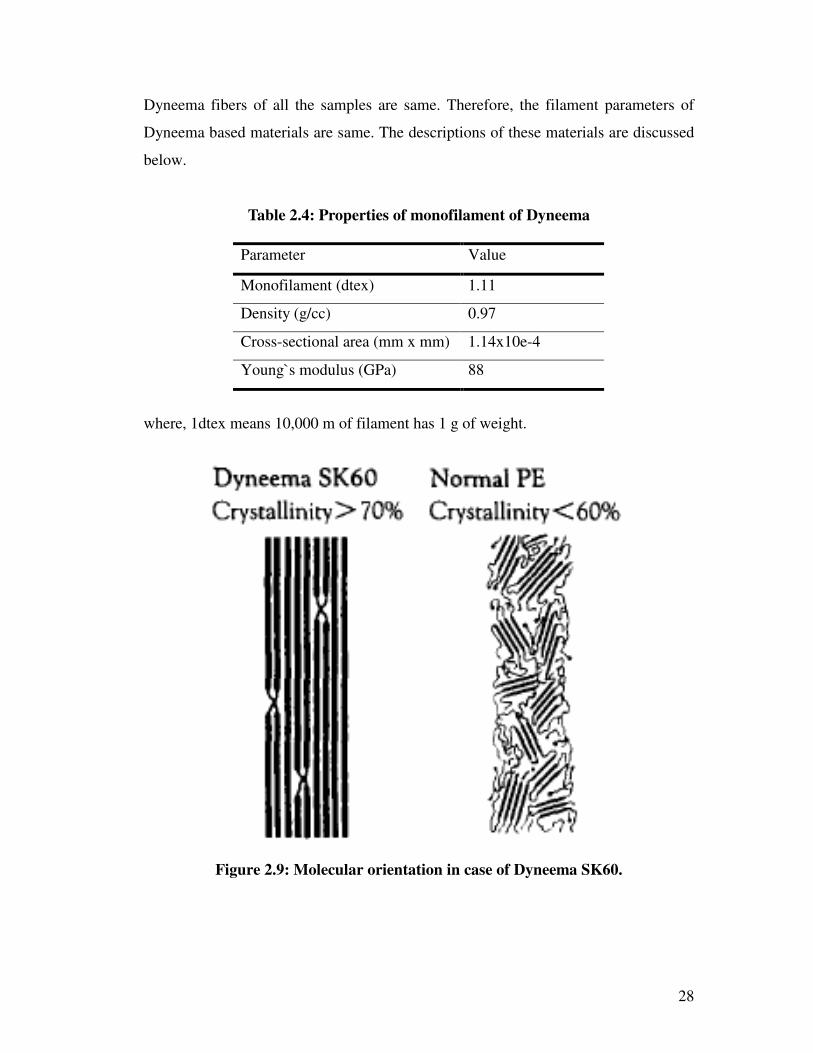
as shown in fig. 2.9, with a very high tenacity and modulus. When formed to fibers,
the polymer chains can attain a parallel orientation greater than 95% and a level of
crystallinity of up to 85%. It has extremely long chains, with molecular weight
numbering in the millions, usually between 2 and 6 million. Each chain is bonded to
the others with so many Van der Waals bonds that the whole can support great tensile
loads. The longer chain serves to transfer load more effectively to the polymer
backbone by strengthening intermolecular interactions. This result in a very tough
material, with the highest impact strength of any thermoplastic presently made. In
normal polyethylene the molecules are not oriented and are easily torn apart.
Dyneema fiber expands to the longitudinal direction during cooling down
from room temperature to liquid helium temperature, and fiber contracts to the
transversal direction [29]. The coefficient of thermal expansion is –12E-06/K.
Another unique property of Dyneema fiber is low coefficient of friction [30]. The
molecular structure [31] of polyethylene fiber DYNEEMA® is
n
HH
CCHH
−−−||
||
Typically, n is of the order of 106.
In our study, we used Dyneema cloth, Dyneema non-woven sheet and
Dyneema random sheet as an insulating material. Toyobo Co. Ltd., Japan makes these
materials. The properties of monofilament of Dyneema are given in table 2.4.
28
Dyneema fibers of all the samples are same. Therefore, the filament parameters of
Dyneema based materials are same. The descriptions of these materials are discussed
below.
Table 2.4: Properties of monofilament of Dyneema
Parameter Value
Monofilament (dtex) 1.11
Density (g/cc) 0.97
Cross-sectional area (mm x mm) 1.14x10e-4
Young`s modulus (GPa) 88
where, 1dtex means 10,000 m of filament has 1 g of weight.
Figure 2.9: Molecular orientation in case of Dyneema SK60.
29
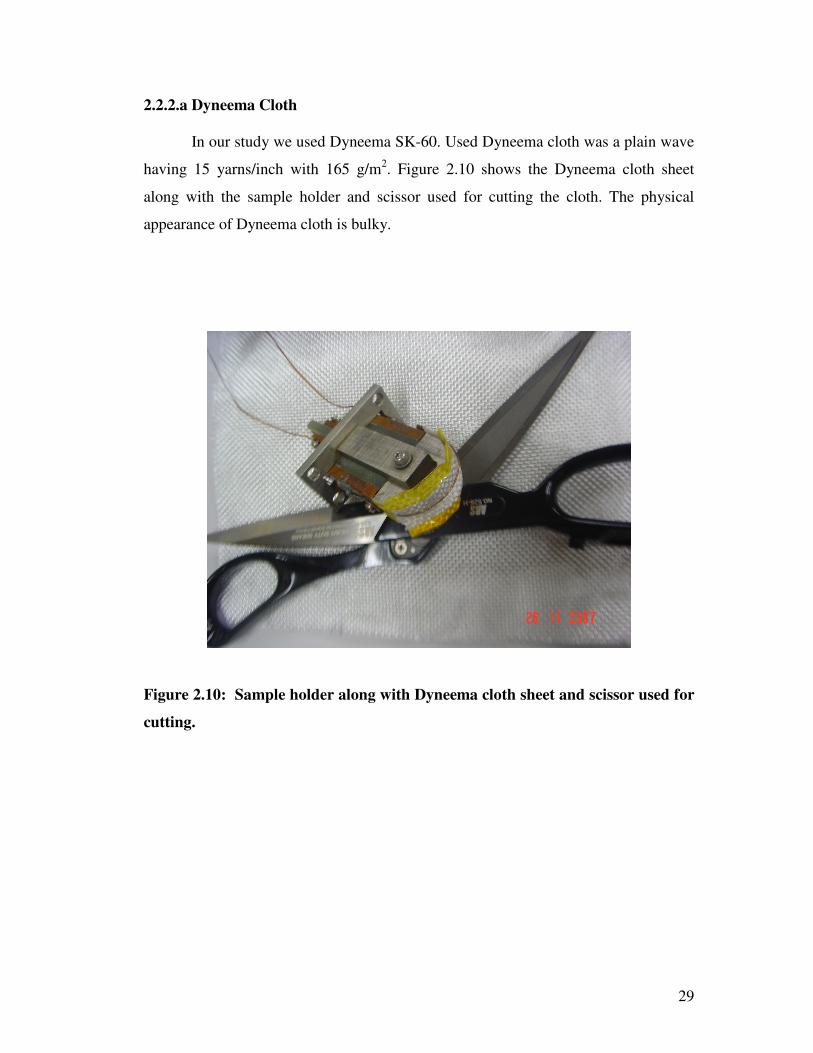
2.2.2.a Dyneema Cloth
In our study we used Dyneema SK-60. Used Dyneema cloth was a plain wave
having 15 yarns/inch with 165 g/m2. Figure 2.10 shows the Dyneema cloth sheet
along with the sample holder and scissor used for cutting the cloth. The physical
appearance of Dyneema cloth is bulky.
Figure 2.10: Sample holder along with Dyneema cloth sheet and scissor used for
cutting.
30
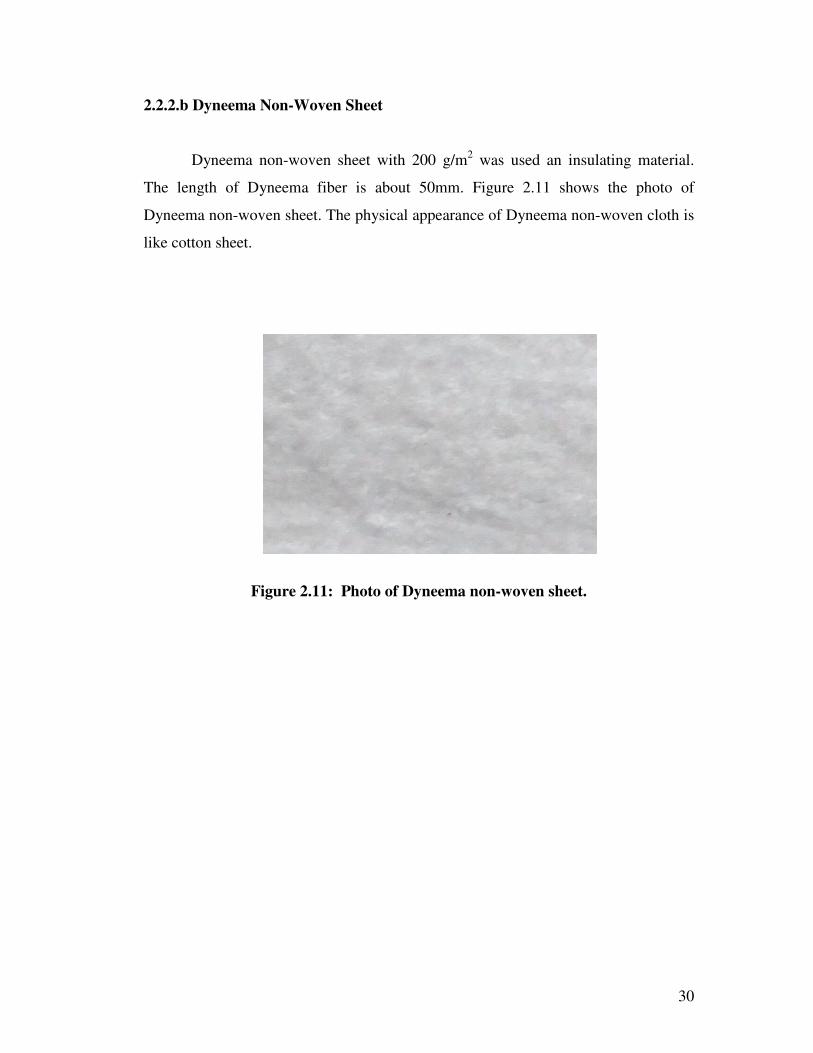
2.2.2.b Dyneema Non-Woven Sheet
Dyneema non-woven sheet with 200 g/m2 was used an insulating material.
The length of Dyneema fiber is about 50mm. Figure 2.11 shows the photo of
Dyneema non-woven sheet. The physical appearance of Dyneema non-woven cloth is
like cotton sheet.
Figure 2.11: Photo of Dyneema non-woven sheet.
31
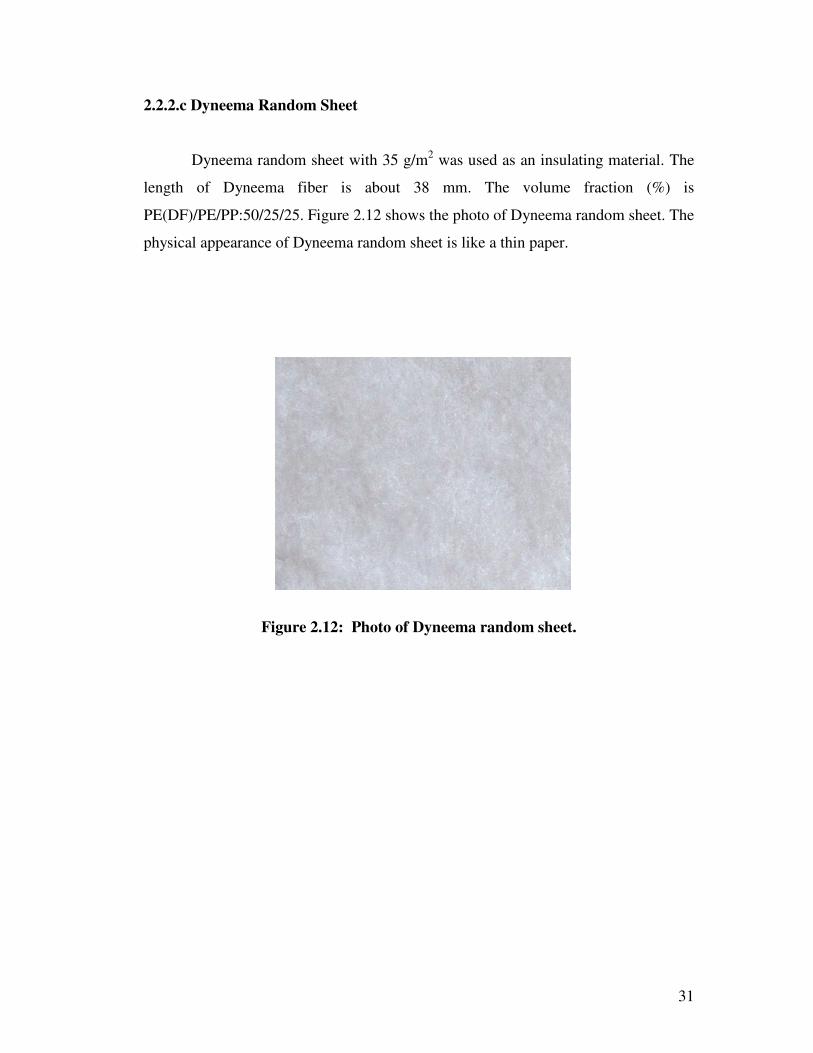
2.2.2.c Dyneema Random Sheet
Dyneema random sheet with 35 g/m2 was used as an insulating material. The
length of Dyneema fiber is about 38 mm. The volume fraction (%) is
PE(DF)/PE/PP:50/25/25. Figure 2.12 shows the photo of Dyneema random sheet. The
physical appearance of Dyneema random sheet is like a thin paper.
Figure 2.12: Photo of Dyneema random sheet.
32
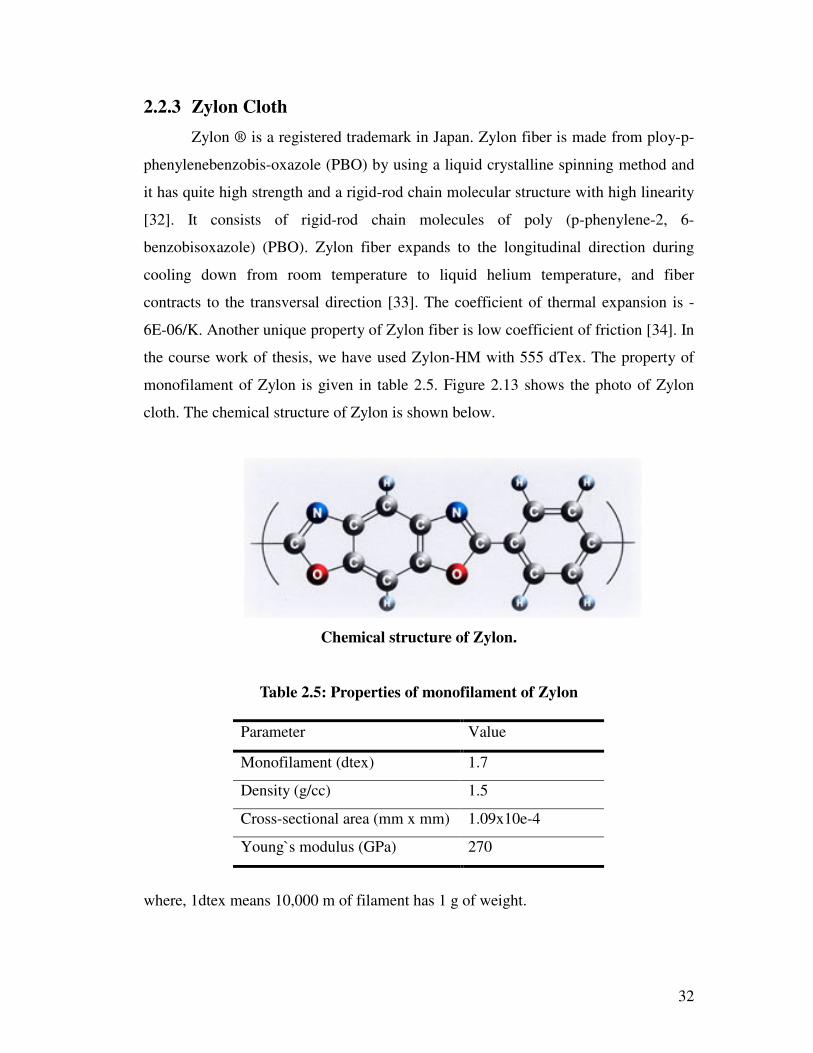
2.2.3 Zylon Cloth
Zylon ® is a registered trademark in Japan. Zylon fiber is made from ploy-p-
phenylenebenzobis-oxazole (PBO) by using a liquid crystalline spinning method and
it has quite high strength and a rigid-rod chain molecular structure with high linearity
[32]. It consists of rigid-rod chain molecules of poly (p-phenylene-2, 6-
benzobisoxazole) (PBO). Zylon fiber expands to the longitudinal direction during
cooling down from room temperature to liquid helium temperature, and fiber
contracts to the transversal direction [33]. The coefficient of thermal expansion is -
6E-06/K. Another unique property of Zylon fiber is low coefficient of friction [34]. In
the course work of thesis, we have used Zylon-HM with 555 dTex. The property of
monofilament of Zylon is given in table 2.5. Figure 2.13 shows the photo of Zylon
cloth. The chemical structure of Zylon is shown below.
Chemical structure of Zylon.
Table 2.5: Properties of monofilament of Zylon
Parameter Value
Monofilament (dtex) 1.7
Density (g/cc) 1.5
Cross-sectional area (mm x mm) 1.09x10e-4
Young`s modulus (GPa) 270
where, 1dtex means 10,000 m of filament has 1 g of weight.
33
Figure 2.13: Photo of Zylon cloth.
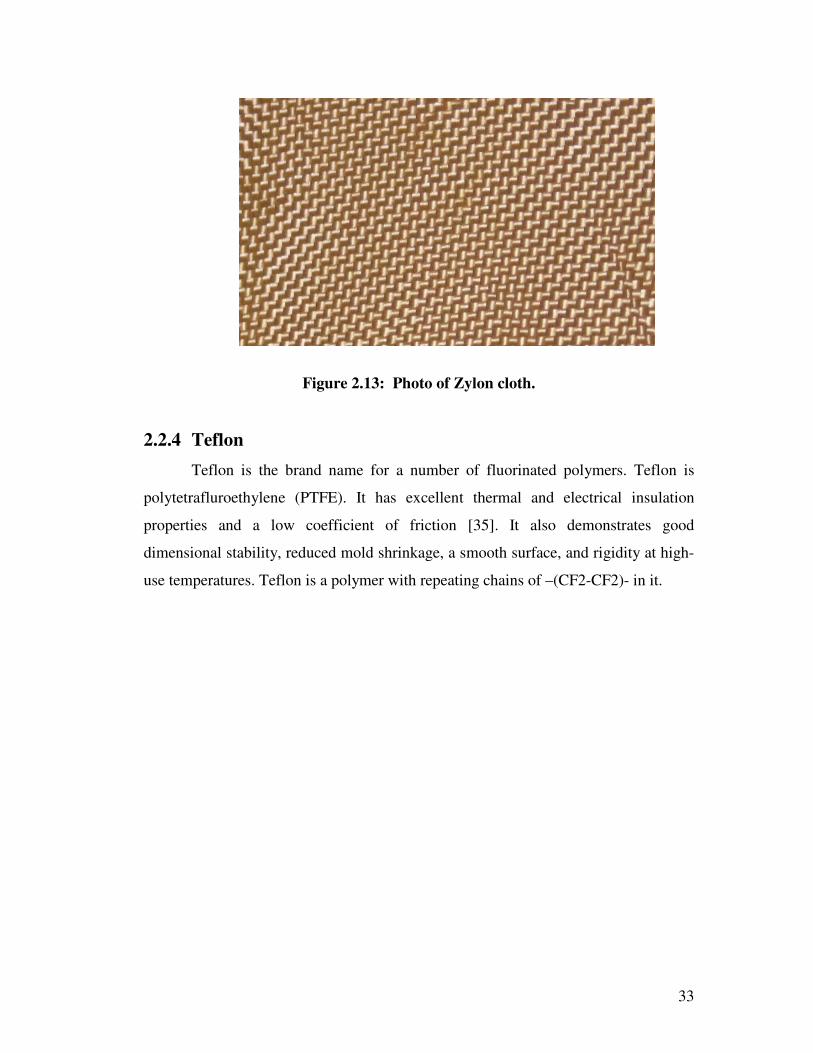
2.2.4 Teflon
Teflon is the brand name for a number of fluorinated polymers. Teflon is
polytetrafluroethylene (PTFE). It has excellent thermal and electrical insulation
properties and a low coefficient of friction [35]. It also demonstrates good
dimensional stability, reduced mold shrinkage, a smooth surface, and rigidity at high-
use temperatures. Teflon is a polymer with repeating chains of –(CF2-CF2)- in it.

34
Chapter 3
Experiment methodology and findings
Experiments were conducted at 4.2 K to study the dependence of
superconducting wire motion on the base insulating material under the influence of
electromagnetic force. Voltage tap signal is measured using pen recorder or 16-bit
data recorder with a sampling rate of 1MS/s. The experimental method implemented
during the course work, experimental findings and comparison of measured data
using pen recorder and data recorder are discussed in this chapter.
3.1 Experimental Procedure
3.1.1 Insulating Material
Measurements were carried out at 4.2 K using Polyimide film, Dyneema
based materials, Zylon cloth and Teflon as an insulating material between the semi-
circular head and the superconducting wire. The properties of these materials were
discussed in chapter 2.
3.1.2 Cool Down
Superconducting solenoid magnet along with the sample holder is installed
inside the 200 mm diameter vertical cryostat. During the cool down, tension of 28.4
N was applied to the superconducting wire. The main operation modes are:
Cool-down to 80 K;
Cool-down to 4.2 K;
Warm-up: After the final measurement, all the liquid helium from the cryostat
is transferred back to gasbag and dumped into decanter until the liquid helium level
meter show zero.
35
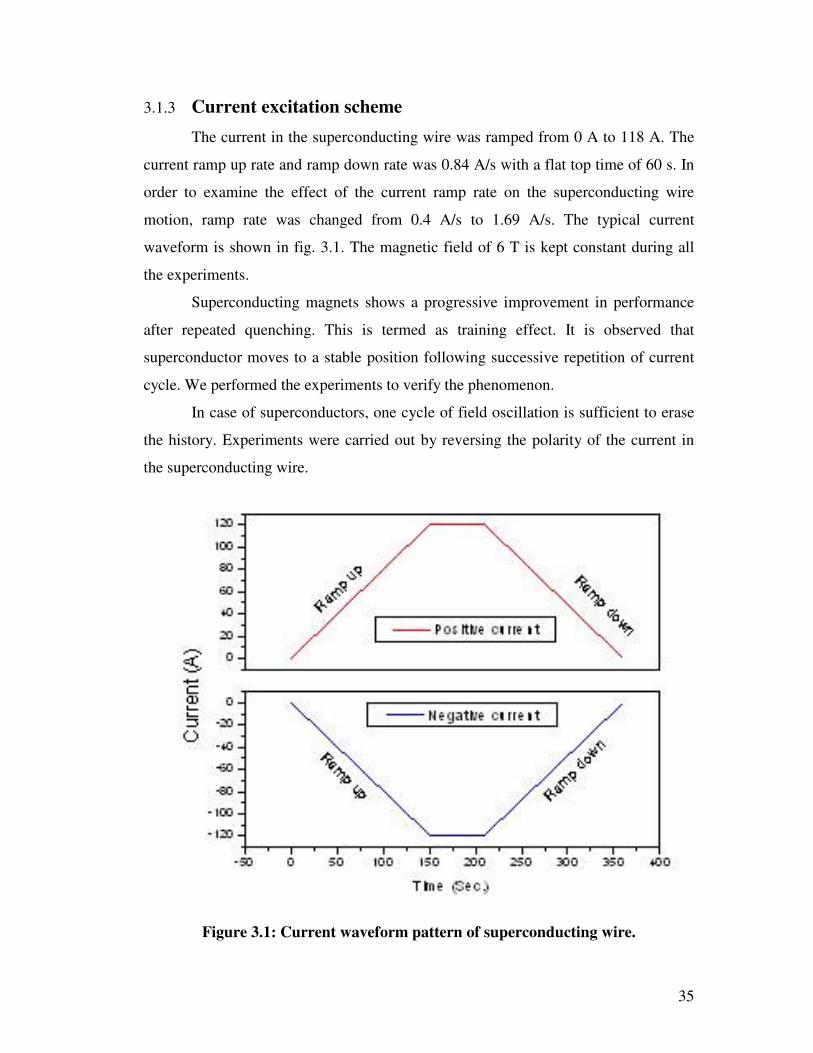
3.1.3 Current excitation scheme
The current in the superconducting wire was ramped from 0 A to 118 A. The
current ramp up rate and ramp down rate was 0.84 A/s with a flat top time of 60 s. In
order to examine the effect of the current ramp rate on the superconducting wire
motion, ramp rate was changed from 0.4 A/s to 1.69 A/s. The typical current
waveform is shown in fig. 3.1. The magnetic field of 6 T is kept constant during all
the experiments.
Superconducting magnets shows a progressive improvement in performance
after repeated quenching. This is termed as training effect. It is observed that
superconductor moves to a stable position following successive repetition of current
cycle. We performed the experiments to verify the phenomenon.
In case of superconductors, one cycle of field oscillation is sufficient to erase
the history. Experiments were carried out by reversing the polarity of the current in
the superconducting wire.
Figure 3.1: Current waveform pattern of superconducting wire.

36
3.1.4 Data Collection
Voltage taps to measure the signal due to the superconducting wire motion are
connected at the end of the semi-circular head as shown in fig. 2.2. To reduce the
voltage tap loop area, a groove was incorporated in the semi-circular head and the
voltage tap wire (twisted pair of enameled copper wire 0.2 mm in diameter) was
passed through it. In order to reduce noise, voltage tap wire is directly connected to
the pen recorder [24] or a 16-bit data recorder with a sampling rate of 1 MS/s [25] to
measure the voltage tap signal. Sudden wire motion was indicated by observing the
voltage spike.
3.2 Experimental Findings
3.2.1 Experimental data obtained when voltage tap signal was fed to Pen
recorder
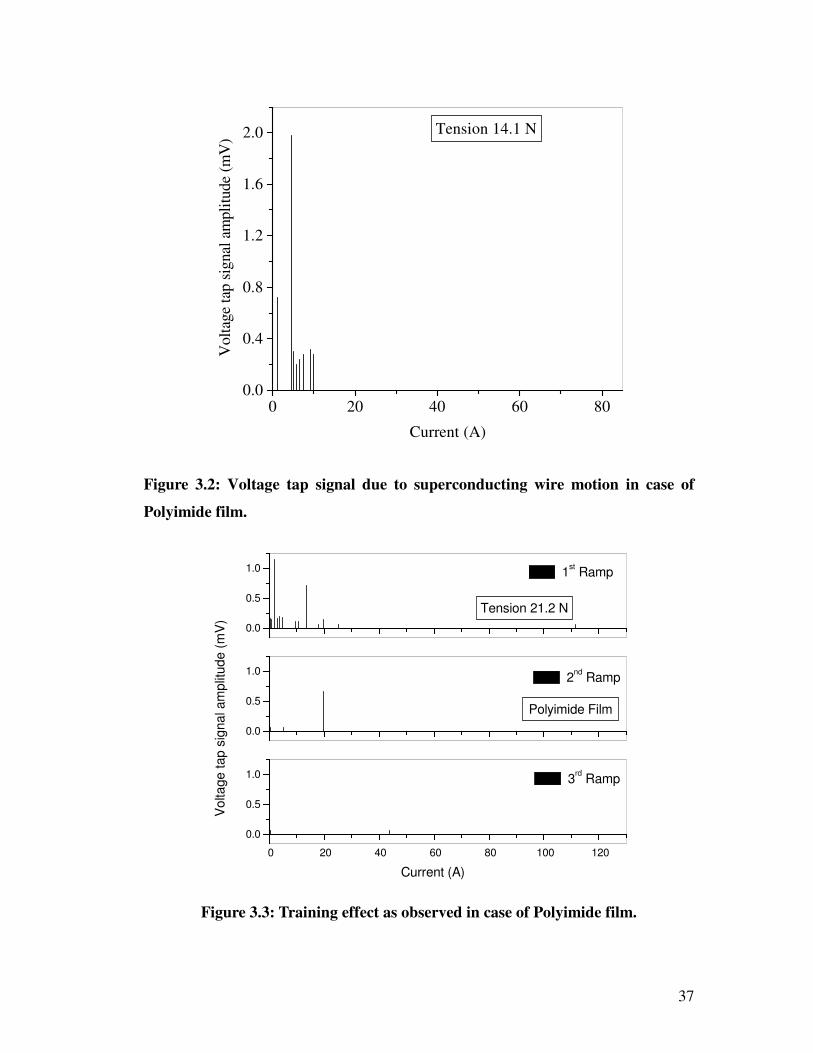
3.2.1.1 Polyimide Film
Large amplitude wire motions were observed when tension was 7.1 N. The
amount of frictional heat generated during these wire motions was sufficient to
quench the wire. Figure 3.2 shows the voltage tap signal pattern measured using the
pen recorder with the tension set at 14.1 N. Figure 3.3 shows the training behavior
when the tension was 21.2 N. The number of voltage spikes reduced from ramp to
ramp. At higher tension the voltage spike amplitude decreased.
37
0 20 40 60 800.0
0.4
0.8
1.2
1.6
2.0 Tension 14.1 N
Volt
age
tap s
ignal
am
pli
tude
(mV
)
Current (A)
Figure 3.2: Voltage tap signal due to superconducting wire motion in case of
Polyimide film.
0 20 40 60 80 100 120
0.0
0.5
1.0
Polyimide Film
Tension 21.2 N
3rd Ramp
0.0
0.5
1.0
2nd
Ramp
0.0
0.5
1.0
Vo
lta
ge
tap
sig
na
l am
plit
ud
e (
mV
)
1st Ramp
Current (A)
Figure 3.3: Training effect as observed in case of Polyimide film.

38
3.2.1.2 Dyneema Cloth
A large number of voltage spikes with low amplitude were observed when the
tension was 7.1 N. Heat generated during these wire motions was not sufficient to
quench the wire. The voltage tap signal pattern is shown in fig. 3.4. At low tension,
the superconducting wire motion occurs during the current ramp up and current ramp
down.
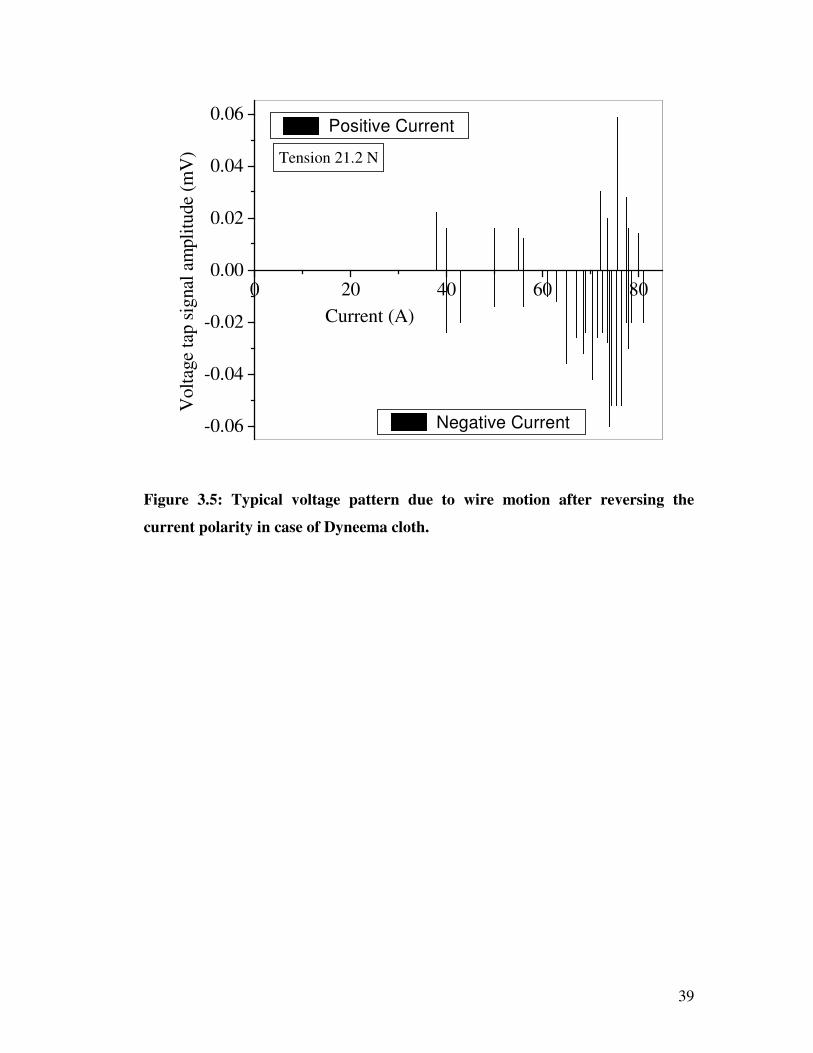
Reversing the polarity of current in the superconducting wire erases the
history and no significant effect on the electromagnetic force need to start the
superconducting wire motion was observed. However, an asymmetric voltage signal
pattern was observed presumably due to asymmetric position of superconducting wire
in the semi-circular head. A typical pattern obtained when the tension was 21.2 N is
shown in fig. 3.5. At higher tension, the voltage spike amplitude decreased and
relatively large electromagnetic force was needed to start the wire motion.
Figure 3.4: Typical current waveform and voltage tap signal due to wire motion
in case of Dyneema cloth.
0 50 100 150 200 250 300 350
-0.05
0.00
0.05
0.10
0.15
0.20
0.25
Back Up Field = 6 T
Dyneema cloth
Tension 7.1 N
Vo
ltag
e t
ap s
ign
al a
mplit
ude (
mV
),
0.5
E+
03
* C
urr
ent
(A)
Time (S)
Tap voltage
Current pattern
39
0 20 40 60 80
-0.06
-0.04
-0.02
0.00
0.02
0.04
0.06
Negative Current
Tension 21.2 N
Volt
age
tap s
ignal
am
pli
tude
(mV
)
Current (A)
Positive Current
Figure 3.5: Typical voltage pattern due to wire motion after reversing the
current polarity in case of Dyneema cloth.
40
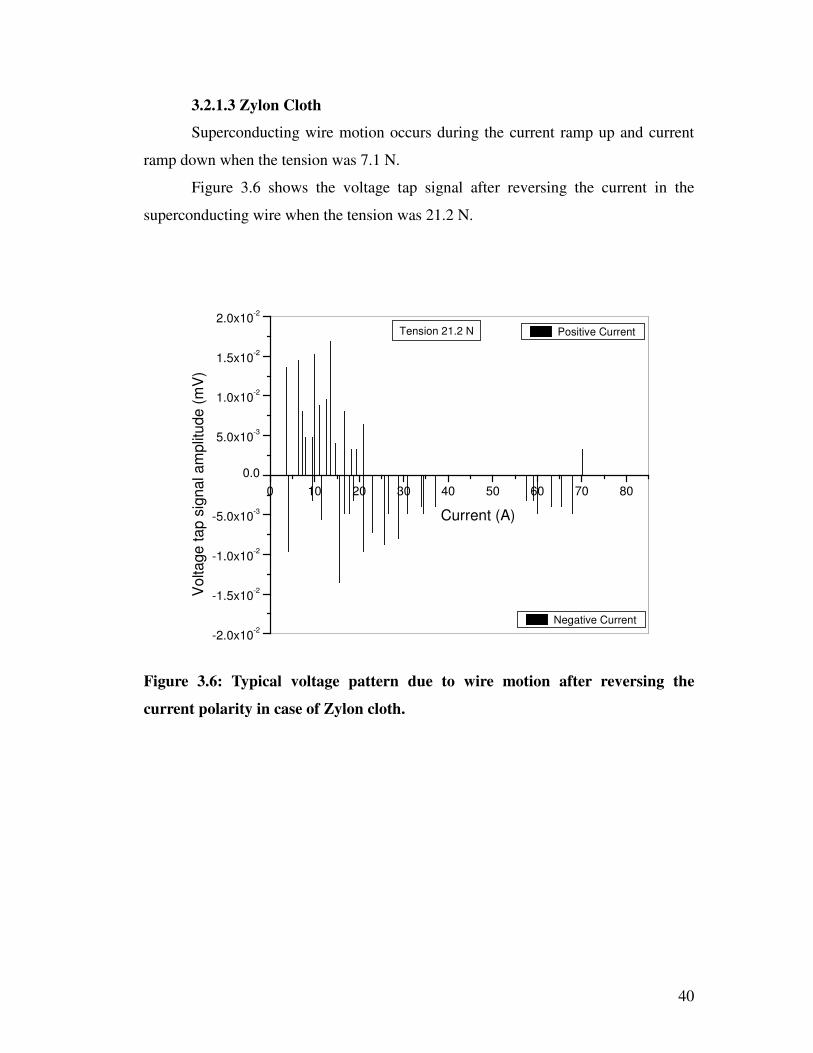
3.2.1.3 Zylon Cloth
Superconducting wire motion occurs during the current ramp up and current
ramp down when the tension was 7.1 N.
Figure 3.6 shows the voltage tap signal after reversing the current in the
superconducting wire when the tension was 21.2 N.
0 10 20 30 40 50 60 70 80
-2.0x10⁻²
-1.5x10⁻²
-1.0x10⁻²
-5.0x10⁻³
0.0
5.0x10⁻³
1.0x10⁻²
1.5x10⁻²
2.0x10⁻²
Tension 21.2 N
Negative Current
Voltage ta
p s
ignal am
plit
ude (
mV
)
Current (A)
Positive Current
Figure 3.6: Typical voltage pattern due to wire motion after reversing the
current polarity in case of Zylon cloth.
41
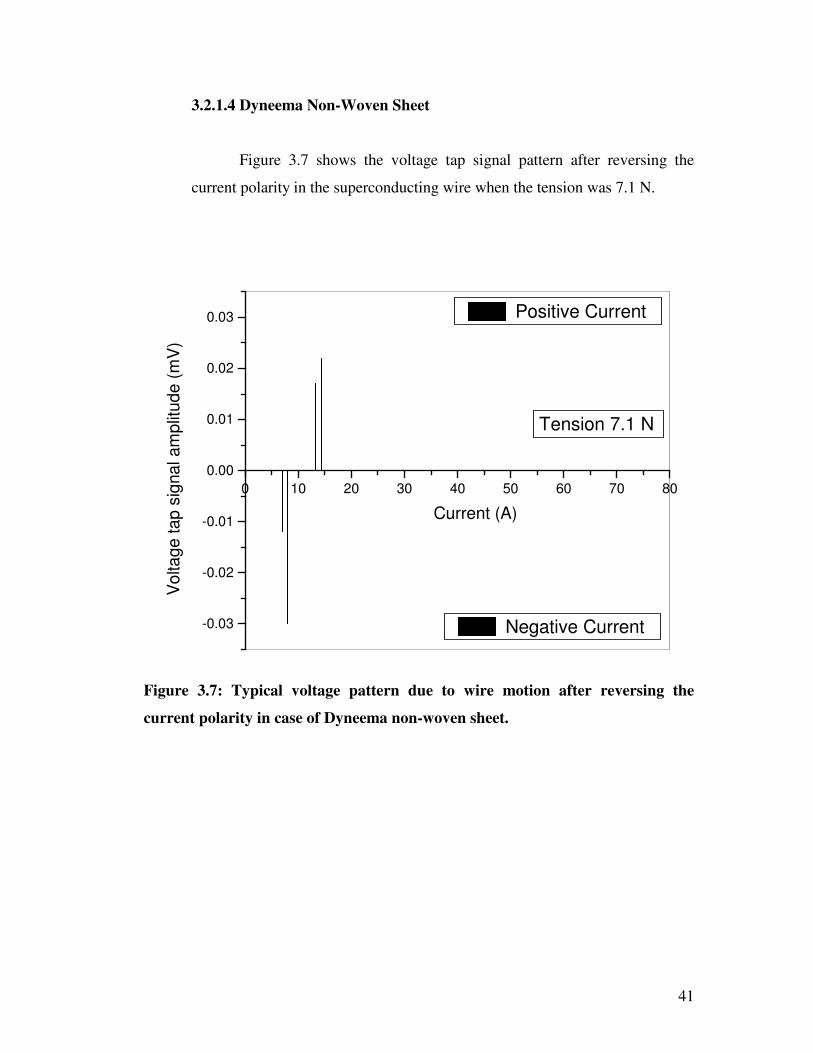
3.2.1.4 Dyneema Non-Woven Sheet
Figure 3.7 shows the voltage tap signal pattern after reversing the
current polarity in the superconducting wire when the tension was 7.1 N.
0 10 20 30 40 50 60 70 80
-0.03
-0.02
-0.01
0.00
0.01
0.02
0.03
Negative Current
Tension 7.1 N
Current (A)
Vo
lta
ge
ta
p s
igna
l am
plit
ud
e (
mV
)
Positive Current
Figure 3.7: Typical voltage pattern due to wire motion after reversing the
current polarity in case of Dyneema non-woven sheet.
42
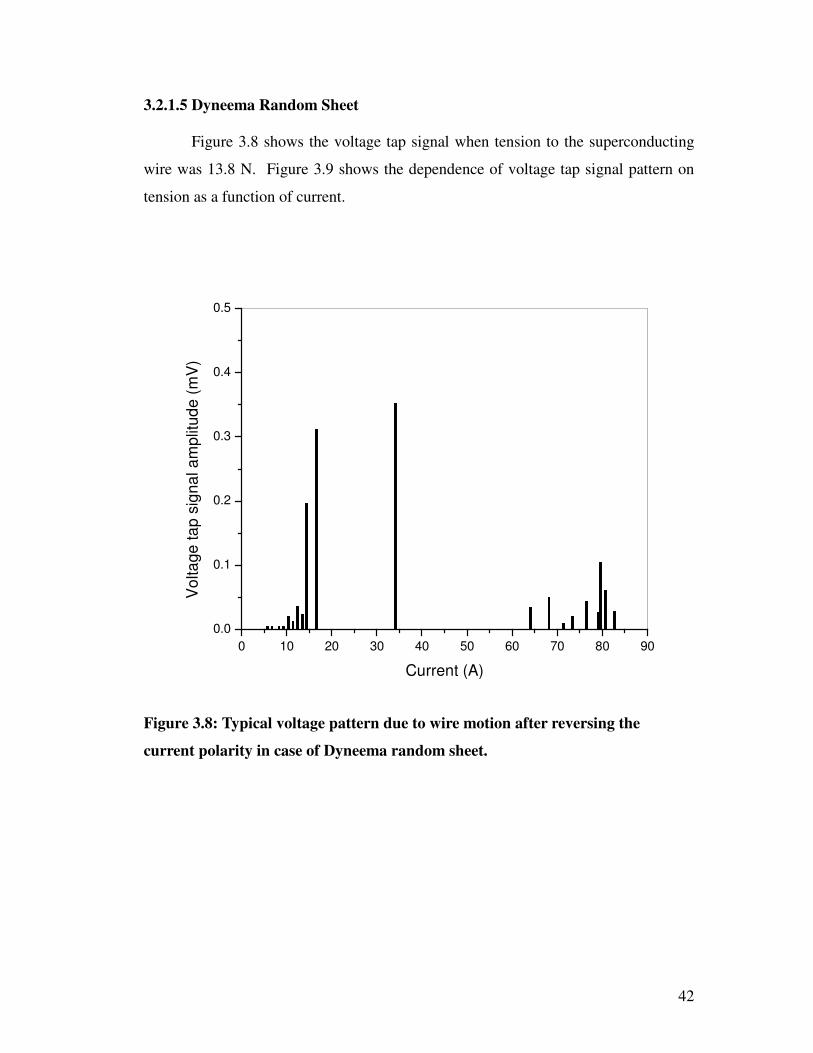
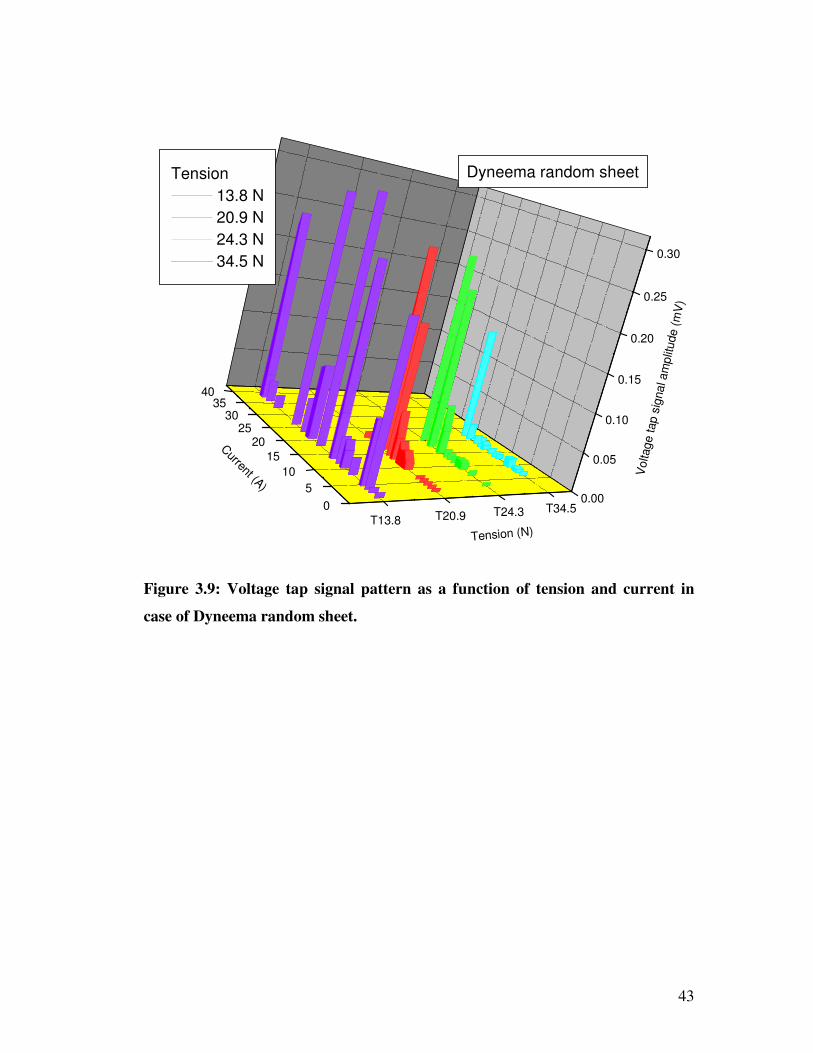
3.2.1.5 Dyneema Random Sheet
Figure 3.8 shows the voltage tap signal when tension to the superconducting
wire was 13.8 N. Figure 3.9 shows the dependence of voltage tap signal pattern on
tension as a function of current.
0 10 20 30 40 50 60 70 80 90
0.0
0.1
0.2
0.3
0.4
0.5
Vo
lta
ge
ta
p s
ign
al a
mp
litu
de
(m
V)
Current (A)
Figure 3.8: Typical voltage pattern due to wire motion after reversing the
current polarity in case of Dyneema random sheet.
43
0
5
10
15
2025
3035
40
0.00
0.05
0.10
0.15
0.20
0.25
0.30
T13.8 T20.9 T24.3 T34.5
Dyneema random sheetTension
13.8 N
20.9 N
24.3 N
34.5 N
Volta
ge tap s
ignal a
mplit
ude (
mV
)
Tension (N)
Current (A)
Figure 3.9: Voltage tap signal pattern as a function of tension and current in
case of Dyneema random sheet.
44
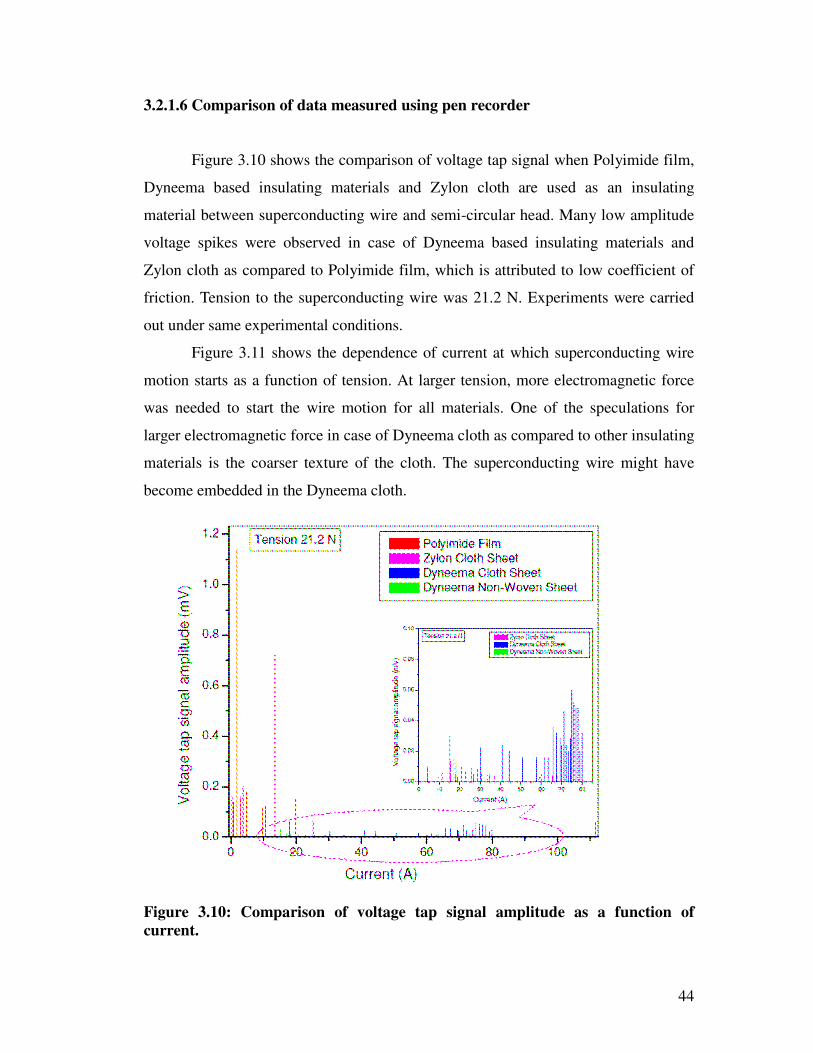
3.2.1.6 Comparison of data measured using pen recorder
Figure 3.10 shows the comparison of voltage tap signal when Polyimide film,
Dyneema based insulating materials and Zylon cloth are used as an insulating
material between superconducting wire and semi-circular head. Many low amplitude
voltage spikes were observed in case of Dyneema based insulating materials and
Zylon cloth as compared to Polyimide film, which is attributed to low coefficient of
friction. Tension to the superconducting wire was 21.2 N. Experiments were carried
out under same experimental conditions.
Figure 3.11 shows the dependence of current at which superconducting wire
motion starts as a function of tension. At larger tension, more electromagnetic force
was needed to start the wire motion for all materials. One of the speculations for
larger electromagnetic force in case of Dyneema cloth as compared to other insulating
materials is the coarser texture of the cloth. The superconducting wire might have
become embedded in the Dyneema cloth.
Figure 3.10: Comparison of voltage tap signal amplitude as a function of current.

45
5 10 15 20 25 30 35 40
0
20
40
60
80
100
Teflon
B = 6T
Tension (N)
Cu
rre
nt
(A)
@ F
irst w
ire
mo
tio
n
Zylon cloth
Dyneema random sheet
Polyimide film
Dyneema cloth
Figure 3.11: Dependence of wire motion on tension.
46
3.2.2 Experimental data obtained when voltage tap signal was fed to Data
recorder
The pen recorder was not suitable for measurements of short duration pulses.
So, we used a commercially available, 16-bit data recorder to measure the voltage tap
signal. The sampling rate of the recorder was 1 MS/s. From the measured peak
pattern, peak voltage tap signal amplitude, time duration of voltage spike, velocity of
wire motion, distance moved by wire and energy dissipated due to wire motion is
estimated (see appendix II for formulation).
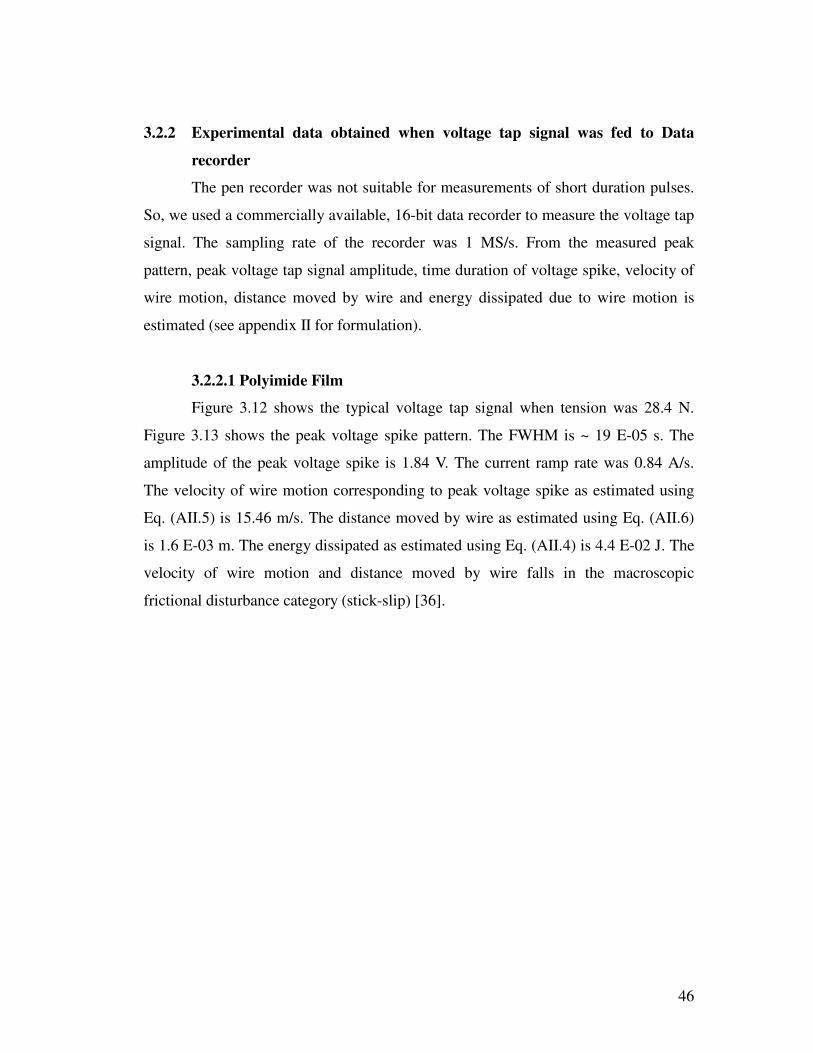
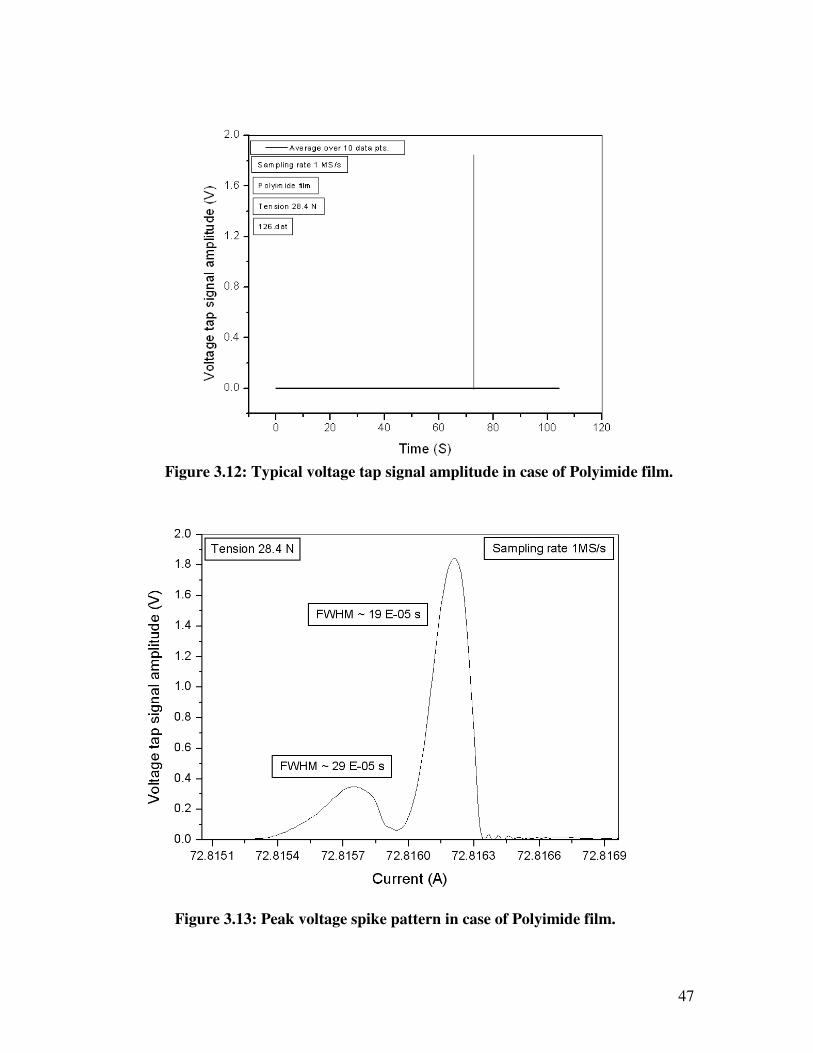
3.2.2.1 Polyimide Film
Figure 3.12 shows the typical voltage tap signal when tension was 28.4 N.
Figure 3.13 shows the peak voltage spike pattern. The FWHM is ~ 19 E-05 s. The
amplitude of the peak voltage spike is 1.84 V. The current ramp rate was 0.84 A/s.
The velocity of wire motion corresponding to peak voltage spike as estimated using
Eq. (AII.5) is 15.46 m/s. The distance moved by wire as estimated using Eq. (AII.6)
is 1.6 E-03 m. The energy dissipated as estimated using Eq. (AII.4) is 4.4 E-02 J. The
velocity of wire motion and distance moved by wire falls in the macroscopic
frictional disturbance category (stick-slip) [36].
47
Figure 3.12: Typical voltage tap signal amplitude in case of Polyimide film.
Figure 3.13: Peak voltage spike pattern in case of Polyimide film.
48
3.2.2.2 Dyneema Cloth
Figure 3.14 shows the typical voltage tap signal pattern when tension was 7.1
N. Figure 3.15 shows the peak voltage spike pattern. The FWHM is ~ 22 E-05s. The
current ramp rate is 0.84 A/s. The amplitude of the peak voltage spike is 2.14 E-03 V.
The velocity of wire motion corresponding to peak voltage spike as estimated using
Eq. (AII.5) is 1.8 E-02 m/s. The distance moved by wire as estimated using Eq.
(AII.6) is 2.4 E-06 m. The energy dissipated as estimated using Eq. (AII.4) is 5.5 E-
05 J. The velocity of wire motion and distance moved by wire falls in the microslip
frictional disturbance category [36].
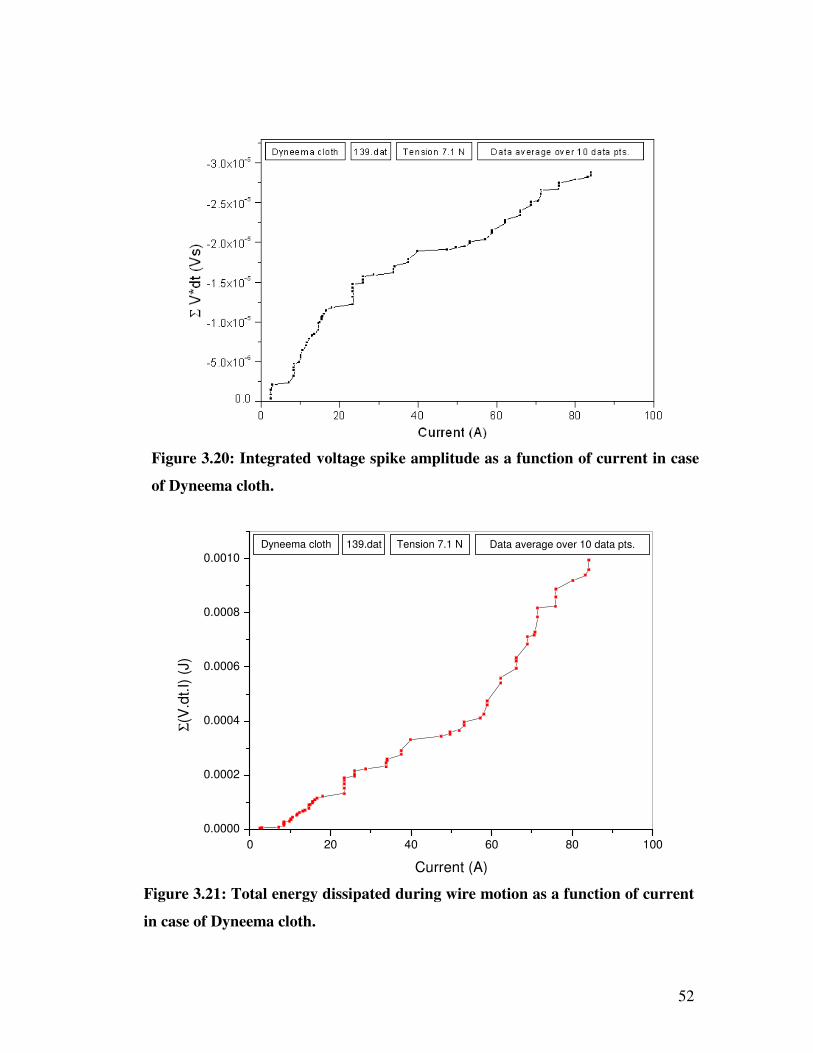
Figure 3.16 shows the typical voltage tap signal amplitude as a function of
averaging over various data points. Figure 3.17 shows the typical voltage spike
amplitude / pattern dependence on averaging over data points. The voltage tap signal
amplitude decreased and peak width increase with an increase in number of data
points used for averaging. Figure 3.18 shows the voltage spike width as a function of
current. The voltage spike width is of the same order for all the peaks. Figure 3.19
shows the product of voltage tap signal amplitude with voltage spike width as a
function of current. Figure 3.20 shows the integrated voltage spike amplitude as a
function of current. The total energy E (=ΣdE), released by the wire motion is shown
in fig. 3.21, which is obtained by integrating the energy dissipated by wire motions.
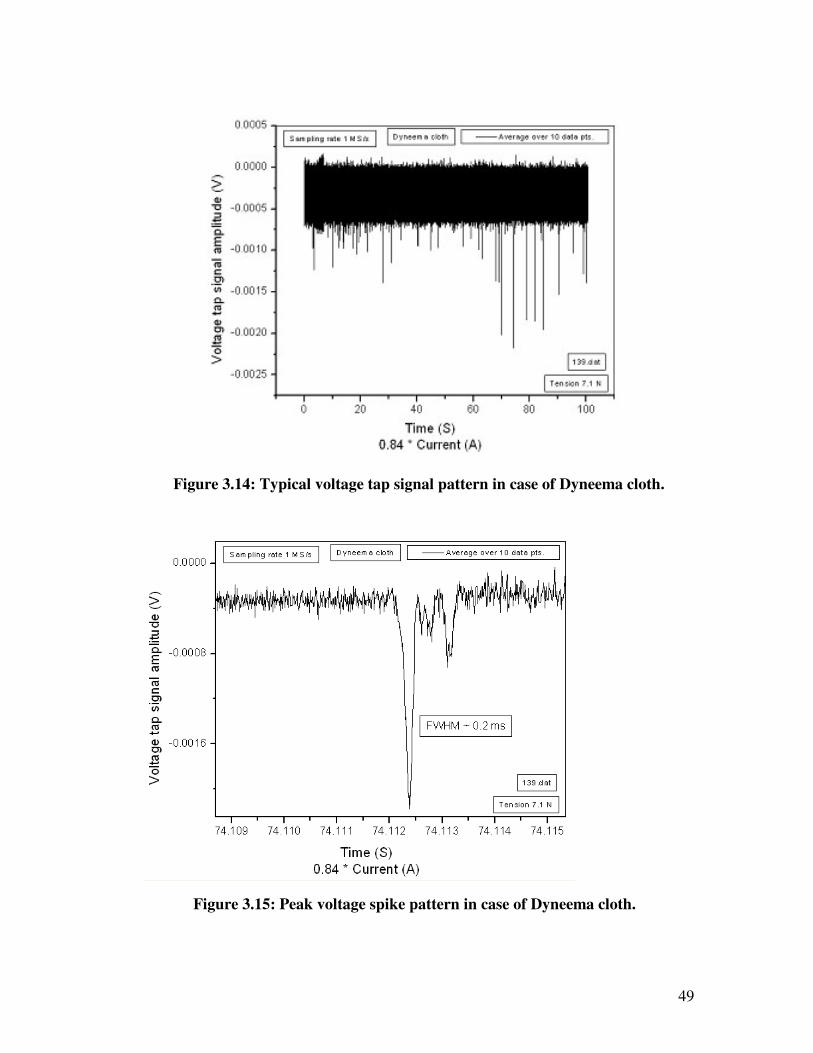
49
Figure 3.14: Typical voltage tap signal pattern in case of Dyneema cloth.
Figure 3.15: Peak voltage spike pattern in case of Dyneema cloth.

50
Figure 3.16: Typical voltage tap signal amplitude as a function of averaging of
data points in case of Dyneema cloth.
Figure 3.17: Typical voltage tap spike amplitude plot as a function of averaging of
data points in case of Dyneema cloth.

51
0 20 40 60 80 100
0.0
2.0x10⁻⁴
4.0x10⁻⁴
6.0x10⁻⁴
8.0x10⁻⁴
1.0x10⁻³
1.2x10⁻³
1.4x10⁻³
1.6x10⁻³
1.8x10⁻³
2.0x10⁻³
Sampling rate 1 MS/s
Tension 7.1 N
139.dat
Dyneema clothV
olta
ge
sp
ike
wid
th (
S)
Current (A)
Data average over 10 data pts.
Figure 3.18: Voltage spike width as a function of current in case of Dyneema cloth.
0 10 20 30 40 50 60 70 80 90
0.0
-4.0x10⁻⁷
-8.0x10⁻⁷
-1.2x10⁻⁶
-1.6x10⁻⁶
-2.0x10⁻⁶
Tension 7.1 N
139.dat
Dyneema cloth
Sampling rate 1MS/s
(Vo
lta
ge t
ap
sig
nal am
plit
ud
e)
* (V
oltage s
pik
e w
idth
)
(V
s)
Current (A)
Vdt
Figure 3.19: Product of voltage tap signal amplitude with voltage spike width as a
function of current in case of Dyneema cloth.
52
Figure 3.20: Integrated voltage spike amplitude as a function of current in case
of Dyneema cloth.
0 20 40 60 80 100
0.0000
0.0002
0.0004
0.0006
0.0008
0.0010Data average over 10 data pts.Tension 7.1 N139.datDyneema cloth
Σ(V
.dt.
I) (
J)
Current (A)
Figure 3.21: Total energy dissipated during wire motion as a function of current
in case of Dyneema cloth.
53
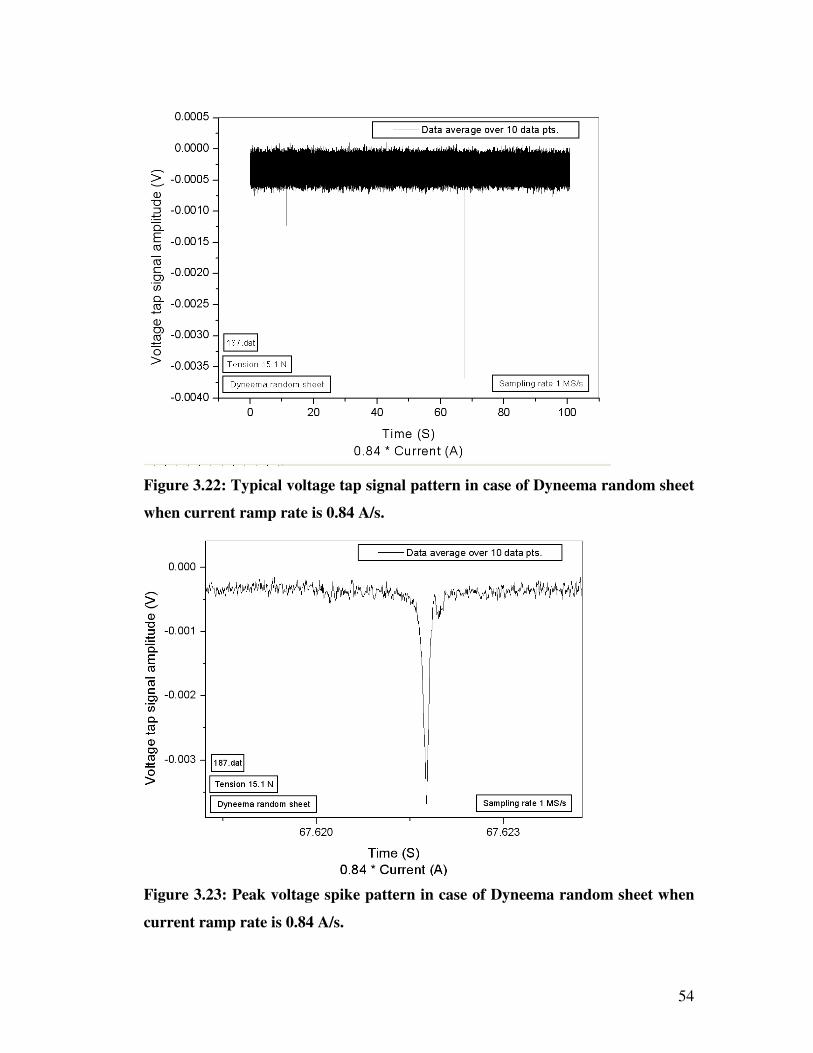
3.2.2.3 Dyneema Random Sheet
Figure 3.22 shows the voltage tap signal pattern when tension is 15.1 N.
Figure 3.23 shows the peak voltage spike pattern. The amplitude of the peak voltage
spike is 3.59 E-03 V. The current ramp rate is 0.84 A/s. The maximum velocity of
wire motion corresponding to peak voltage spike as estimated using Eq. (AII.5) is 3.0
E-02 m/s. The distance moved by wire as estimated using Eq. (AII.6) is 3.6 E-06 m.
The energy dissipated as estimated using Eq. (AII.4) is 7.8 E-05J.
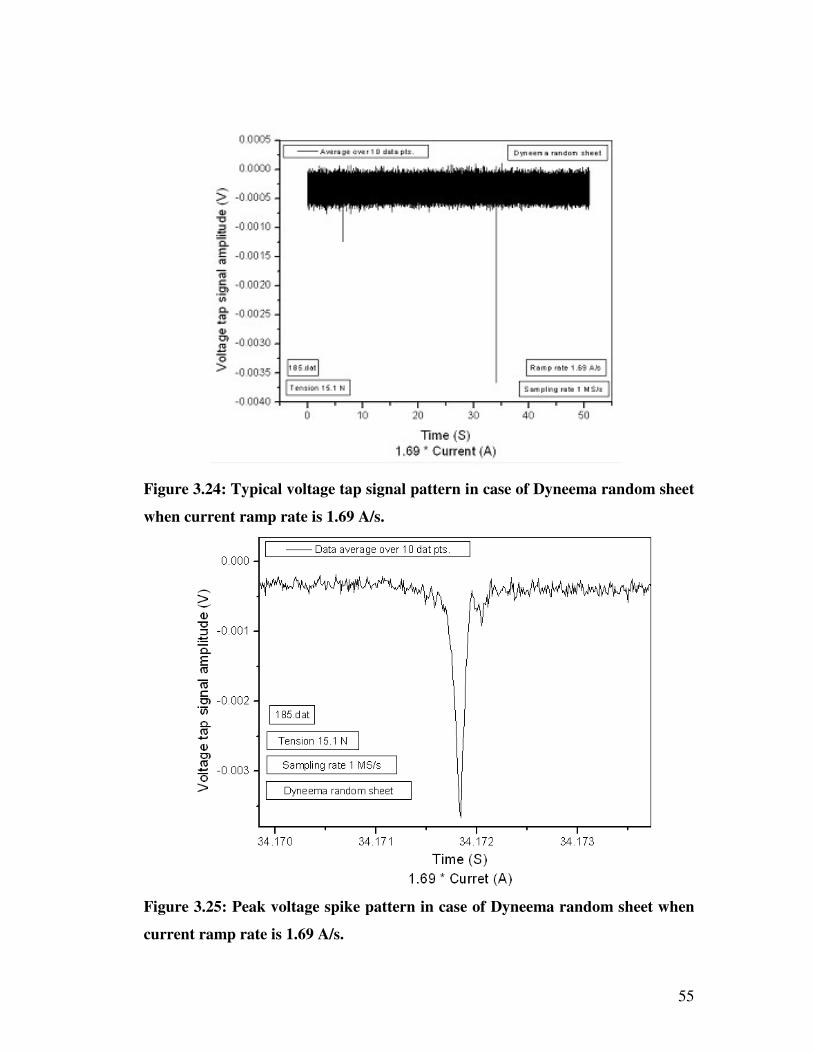
In order to observe the effect of current ramp on superconducting wire motion,
measurements were carried out with a ramp rate of 1.69 A/s. Figure 3.24 shows the
voltage tap signal pattern when tension was 15.1 N. Figure 3.25 shows the peak
voltage spike pattern. The amplitude of the peak voltage is 3.66 E-03 V. From the
peak profile, the FWHM was found to be ~1.5 E-04 s. The velocity of wire motion
corresponding to the peak voltage spike as estimated using Eq. (AII.5) is 3.0 E-02
m/s. The distance moved by the wire as estimated using Eq. (AII.6) is 2.3 E-06 m.
The energy dissipated as estimated using Eq. (AII.4) is 1.9 E-05 J.
No significant dependence of current ramp rate on voltage tap signal pattern,
peak voltage spike amplitude, velocity of wire motion, distance moved by wire and
energy dissipated was observed. The velocity of wire motion and distance moved by
wire falls in the microslip frictional disturbance category [36].
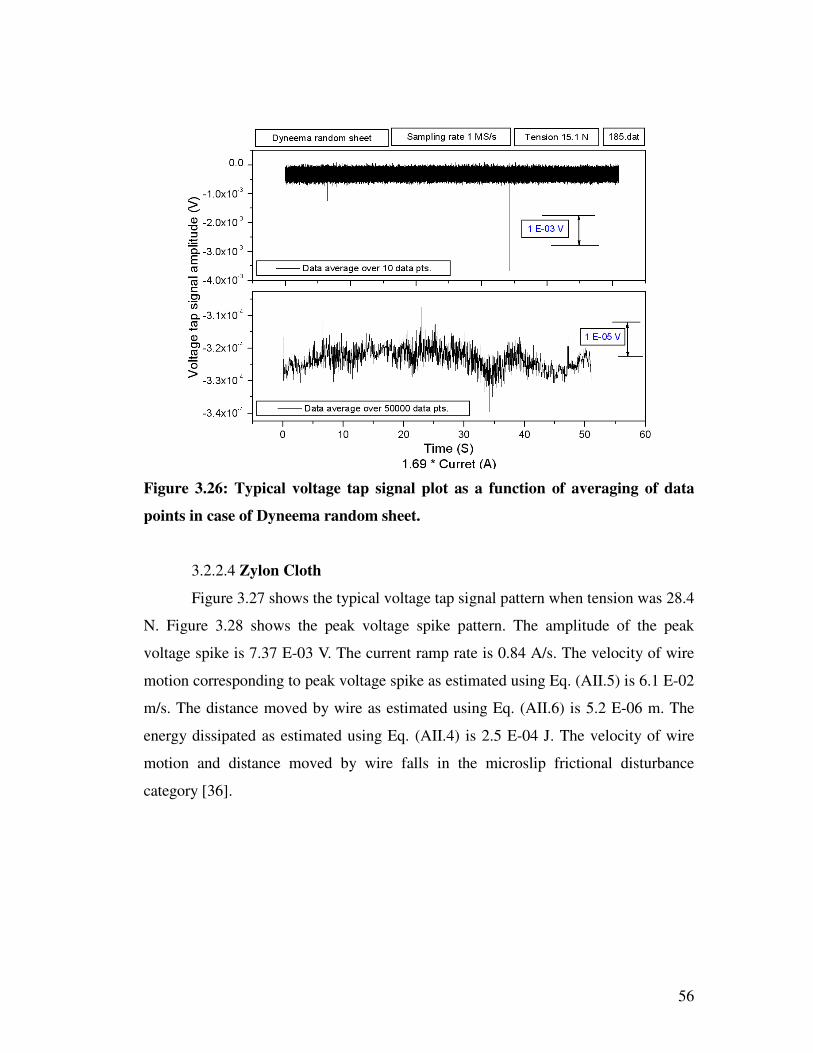
Figure 3.26 shows the voltage tap signal plot when the measured data was
averaged over 10 data points and 50,000 data points. A negative offset of magnitude ~
3.0 E-04 V is observed. The value and direction of offset is independent of current
ramp rate, tension to the superconducting wire and current direction in
superconducting wire. The speculations are; the thermoelectric voltage of voltage tap
signal wire and the voltage induced due to mutual inductance between voltage tap
loop wire and superconducting wire.
54
Figure 3.22: Typical voltage tap signal pattern in case of Dyneema random sheet
when current ramp rate is 0.84 A/s.
Figure 3.23: Peak voltage spike pattern in case of Dyneema random sheet when
current ramp rate is 0.84 A/s.
55
Figure 3.25: Peak voltage spike pattern in case of Dyneema random sheet when
current ramp rate is 1.69 A/s.
Figure 3.24: Typical voltage tap signal pattern in case of Dyneema random sheet
when current ramp rate is 1.69 A/s.
56
Figure 3.26: Typical voltage tap signal plot as a function of averaging of data
points in case of Dyneema random sheet.
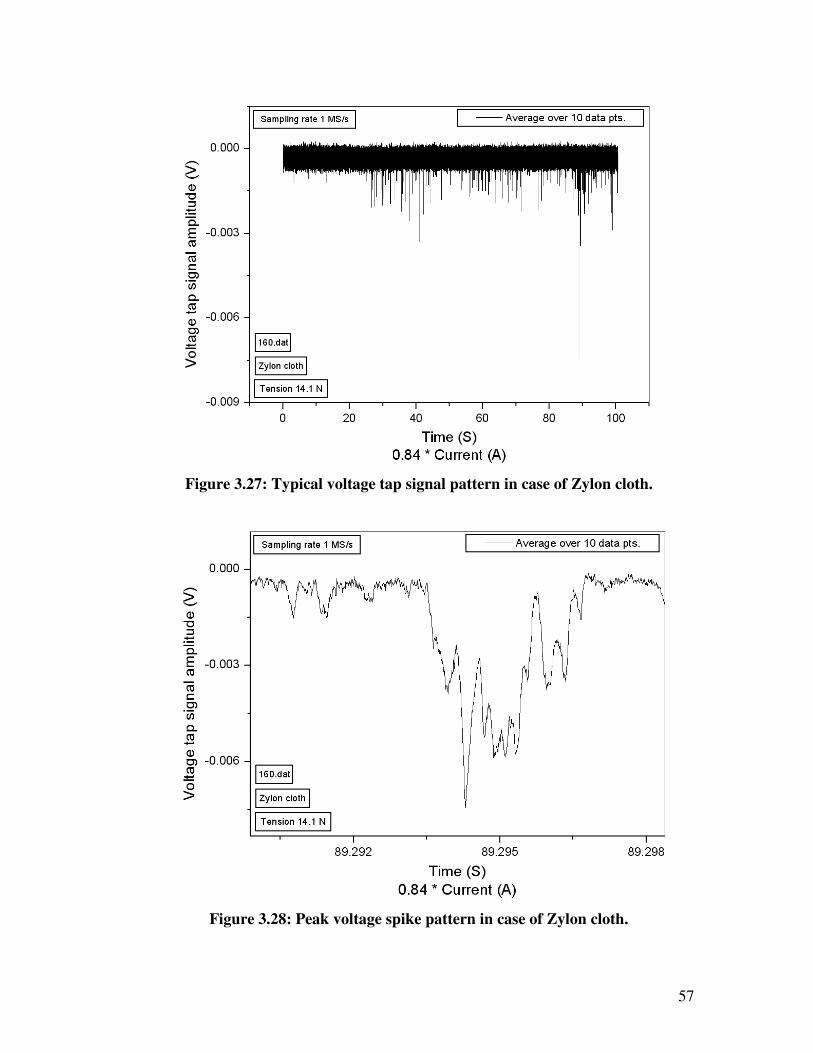
3.2.2.4 Zylon Cloth
Figure 3.27 shows the typical voltage tap signal pattern when tension was 28.4
N. Figure 3.28 shows the peak voltage spike pattern. The amplitude of the peak
voltage spike is 7.37 E-03 V. The current ramp rate is 0.84 A/s. The velocity of wire
motion corresponding to peak voltage spike as estimated using Eq. (AII.5) is 6.1 E-02
m/s. The distance moved by wire as estimated using Eq. (AII.6) is 5.2 E-06 m. The
energy dissipated as estimated using Eq. (AII.4) is 2.5 E-04 J. The velocity of wire
motion and distance moved by wire falls in the microslip frictional disturbance
category [36].
57
Figure 3.27: Typical voltage tap signal pattern in case of Zylon cloth.
Figure 3.28: Peak voltage spike pattern in case of Zylon cloth.
58
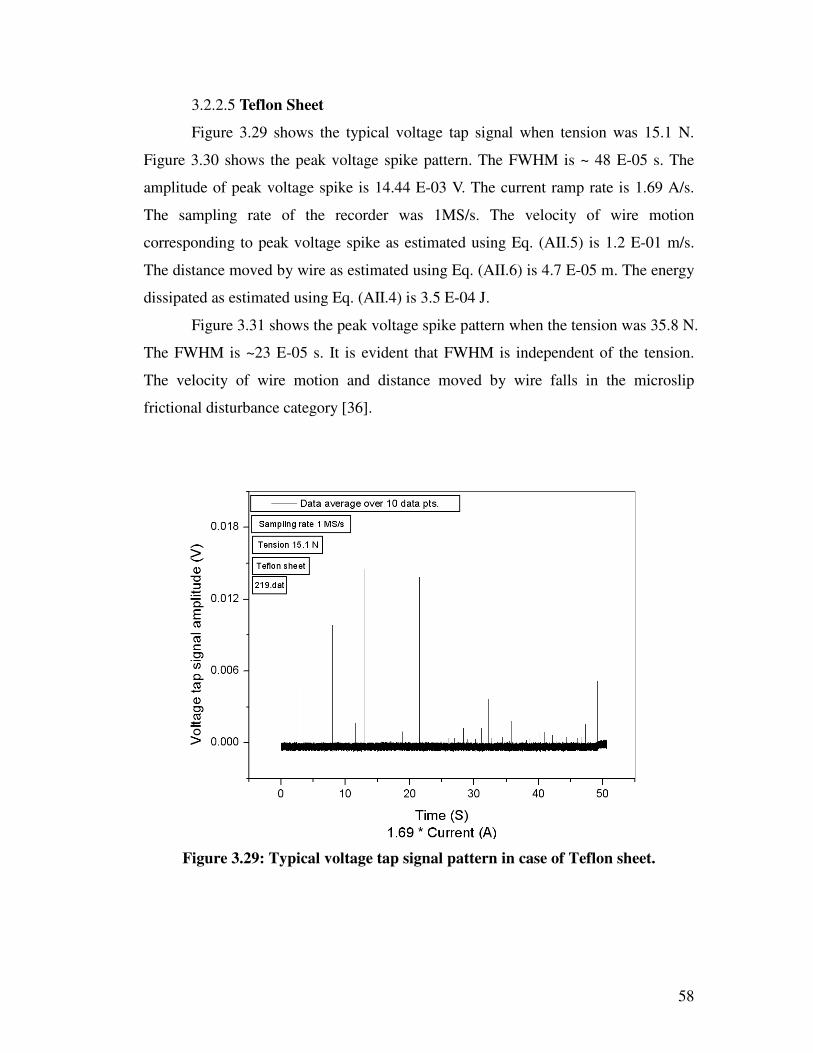
3.2.2.5 Teflon Sheet
Figure 3.29 shows the typical voltage tap signal when tension was 15.1 N.
Figure 3.30 shows the peak voltage spike pattern. The FWHM is ~ 48 E-05 s. The
amplitude of peak voltage spike is 14.44 E-03 V. The current ramp rate is 1.69 A/s.
The sampling rate of the recorder was 1MS/s. The velocity of wire motion
corresponding to peak voltage spike as estimated using Eq. (AII.5) is 1.2 E-01 m/s.
The distance moved by wire as estimated using Eq. (AII.6) is 4.7 E-05 m. The energy
dissipated as estimated using Eq. (AII.4) is 3.5 E-04 J.
Figure 3.31 shows the peak voltage spike pattern when the tension was 35.8 N.
The FWHM is ~23 E-05 s. It is evident that FWHM is independent of the tension.
The velocity of wire motion and distance moved by wire falls in the microslip
frictional disturbance category [36].
Figure 3.29: Typical voltage tap signal pattern in case of Teflon sheet.

59
Figure 3.30: Peak voltage spike pattern in case of Teflon sheet when tension is
15.1 N.
Figure 3.31: Peak voltage spike pattern in case of Teflon sheet when tension is
35.8 N.
60
3.2.2.6 Comparison of data measured using data recorder:
Figure 3.32 shows the comparison of voltage tap signal amplitude as a
function of current for various samples. Low amplitude voltage spikes in case of
Zylon / Dyneema based materials as compared to Polyimide film is attributed to low
coefficient of friction. Similar voltage signal pattern (a large number of small
amplitude voltage spikes) in case of Dyneema cloth and Zylon cloth is attributed to
similar texture of material. Both the materials have no other materials in them i.e.,
they consists of monofilament of Dyneema / Zylon. Hence, smooth wire motion
occurs because of low coefficient of friction of Dyneema / Zylon monofilaments.
The voltage signal pattern in case of Dyneema random sheet is similar to
Teflon sheet, which is attributed to short length of Dyneema fiber and presence of
polypropylene (PP) and polyethylene (PE) in Dyneema random sheet.
Figure 3.33 shows the peak voltage tap signal amplitude, time duration of
voltage spike, velocity of wire motion, distance moved by wire and energy dissipated
during peak voltage spike for various insulating materials used during the course
work. The peak voltage tap signal amplitude, velocity of wire motion, distance moved
by wire and energy dissipated during peak voltage spike in case of Polyimide film is
more than 2 order of magnitude larger than Dyneema based insulating materials and
Zylon cloth. The time duration of voltage spike is found to be same order for all the
samples.
The velocity of wire motion and distance moved by wire falls in the macroslip
frictional disturbance category in case of Polyimide film whereas in case of Zylon /
Teflon / Dyneema based materials it falls in the microslip frictional disturbance
category [36].
Table 3.1 shows the comparison of peak voltage tap signal amplitude, time
duration of voltage spike, velocity of wire motion, distance moved by wire, kinetic
energy and energy dissipated during peak voltage spike for various materials used in
the study.
A negative offset was observed during the measurements. The value and
direction of offset is independent of current ramp rate, current direction in
superconducting wire and sample characteristics. Measured data average over 10 data

61
0 10 20 30 40 50 60 70 80 90
0.01
1
100
Current (A)
Dyneema Cloth, 7.1 N
0.01
1
100Dyneema Random Sheet, Tension 15 N
0.01
1
100
Vo
lta
ge
ta
p s
ign
al a
mp
litu
de
(m
V)
Zylon Cloth, 14.2 N
1
100Teflon, Tension 15 N
0.01
1
100Polyimide Film, Tension 28.4 N
points and 50, 000 data points are shown in fig. 3.26. The magnitude of offset voltage
is ~ 3.0 E-04 V. The speculations are; the thermoelectric voltage of voltage tap
signal wire and the voltage induced due to mutual inductance between voltage tap
loop wire and superconducting wire.
Figure 3.32: Comparison of voltage tap signal amplitude as a function of current
for various samples.
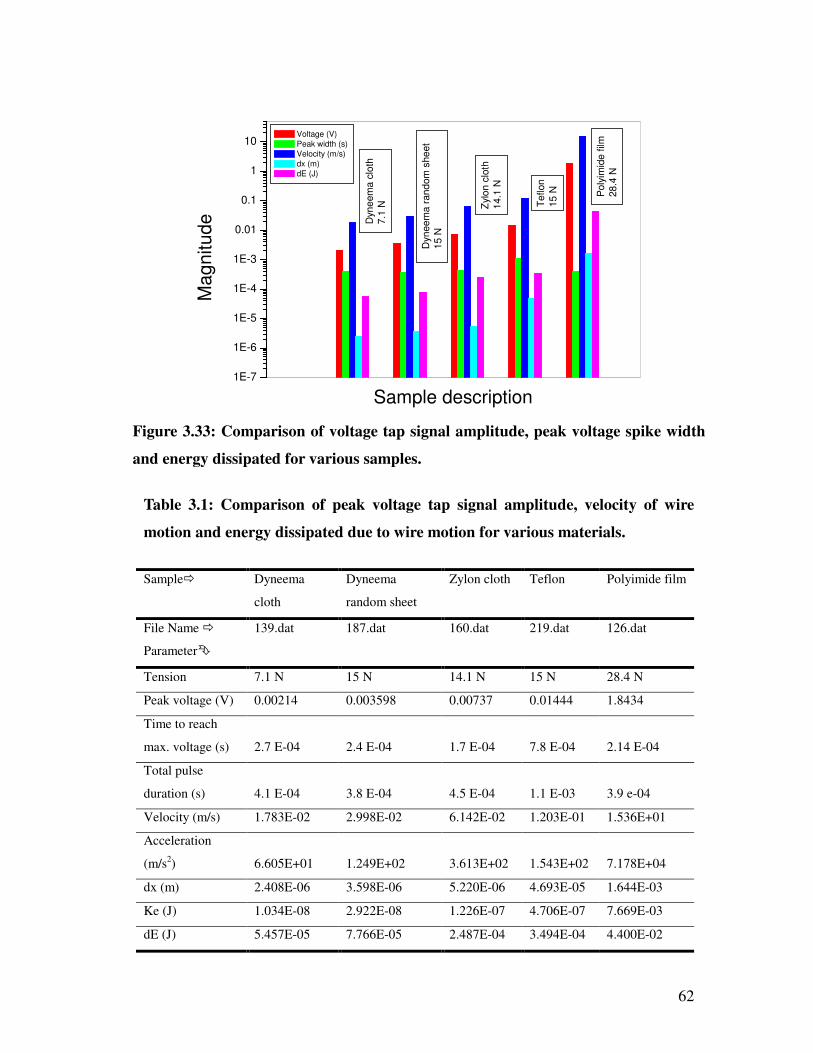
62
1E-7
1E-6
1E-5
1E-4
1E-3
0.01
0.1
1
10
Poly
imid
e f
ilm
28
.4 N
Te
flon
15
N
Zylo
n c
loth
14
.1 N
Dyn
ee
ma
ran
dom
she
et
15
N
Dyn
eem
a c
loth
7.1
N
Magnitude
Sample description
Voltage (V)
Peak width (s)
Velocity (m/s)
dx (m)
dE (J)
Figure 3.33: Comparison of voltage tap signal amplitude, peak voltage spike width
and energy dissipated for various samples.
Table 3.1: Comparison of peak voltage tap signal amplitude, velocity of wire
motion and energy dissipated due to wire motion for various materials.
Sample� Dyneema
cloth
Dyneema
random sheet
Zylon cloth Teflon Polyimide film
File Name �
Parameter�
139.dat 187.dat 160.dat 219.dat 126.dat
Tension 7.1 N 15 N 14.1 N 15 N 28.4 N
Peak voltage (V) 0.00214 0.003598 0.00737 0.01444 1.8434
Time to reach
max. voltage (s) 2.7 E-04 2.4 E-04 1.7 E-04 7.8 E-04 2.14 E-04
Total pulse
duration (s) 4.1 E-04 3.8 E-04 4.5 E-04 1.1 E-03 3.9 e-04
Velocity (m/s) 1.783E-02 2.998E-02 6.142E-02 1.203E-01 1.536E+01
Acceleration
(m/s2) 6.605E+01 1.249E+02 3.613E+02 1.543E+02 7.178E+04
dx (m) 2.408E-06 3.598E-06 5.220E-06 4.693E-05 1.644E-03
Ke (J) 1.034E-08 2.922E-08 1.226E-07 4.706E-07 7.669E-03
dE (J) 5.457E-05 7.766E-05 2.487E-04 3.494E-04 4.400E-02

63
3.2.3 Comparison between pen recorder and data recorder data
The voltage tap signal was measured using pen recorder and 16-bit data
recorder. The voltage tap signal amplitude measured by the data recorder was more
than 1 order of magnitude greater than with the pen recorder. The difference in the
voltage tap signal amplitude was validated by feeding a short duration pulse
generated using a pulse generator to the data recorder and the pen recorder. Figure
3.37 shows the measured pulse pattern using data recorder and pen recorder when a
pulse of 12 ms and 1 V was feed using pulse generator.
Figure 3.34: Voltage pulse pattern measured using data recorder and pen recorder.
64
Chapter 4
Conclusion
To study the superconducting wire motion under the influence of
electromagnetic force, we developed an experimental setup and verified the
effectiveness of this system. The main objective of our study is to examine the time
dependence profile of superconducting wire motion in magnetic field on frictional
property of insulating materials, tension on the superconducting wire, current ramp
rate and effect of polarity of current in the superconducting wire.
Large amplitude wire motions were observed when the insulating material
was Polyimide film and tension was 7.1 N. The amount of frictional heat generated
during these wire motions was sufficient to quench the wire.
A large number of voltage spikes with low amplitude were observed when the
insulating material was Dyneema / Zylon cloth and tension was 7.1 N. Heat generated
during these wire motions was not sufficient to quench the wire. At low tension, the
superconducting wire motion occurs during the current ramp up and current ramp
down.
At higher tension the voltage spike amplitude decreased and relatively large
electromagnetic force was needed to start the wire motion. One of the speculations for
larger electromagnetic force in the case of Dyneema cloth as compared to other
insulating materials used during study is the coarser texture of the cloth. The
superconducting wire might have become embedded in the Dyneema cloth. To
overcome the embedding of the superconducting wire in the Dyneema cloth, sheet
material was fabricated with Dyneema fiber.
The peak voltage tap signal amplitude, velocity of wire motion, distance
moved by wire and energy dissipated due to wire motion in case of Polyimide film is
more than an 2 order of magnitude larger than Zylon / Dyneema based insulating
materials. Low voltage tap signal amplitude in case of Zylon / Dyneema based
materials as compared to Polyimide film is attributed to low coefficient of friction.

65
Hence, use of Zylon / Dyneema based material as an insulating material may reduce
the frictional heat generated due to the wire motion.
No significant dependence of the voltage tap signal pattern and amplitude,
duration of pulse width and energy dissipated due to wire motion was observed on
wire current ramp rate.
Time duration of voltage spike is of the same order for all the samples used
during the study. No significant dependence of time duration of voltage spike on wire
current ramp rate and tension to the superconducting wire was observed.
Reversing the polarity of current in the superconducting wire erases the
history and no significant effect on the electromagnetic force need to start the
superconducting wire motion was observed. However, an asymmetric voltage signal
pattern was observed presumably due to asymmetric position of superconducting wire
in the semi-circular head.
A negative offset was observed during the measurements. The value and
direction of offset is independent of current ramp rate, current direction in
superconducting wire, tension to the superconducting wire and sample characteristics.
The magnitude of offset voltage is ~ -3.0 E-04 V. The speculations are as follows;
the thermoelectric voltage of voltage tap signal wire and the voltage induced due to
mutual inductance between voltage tap loop wire and superconducting wire. The
experimental results are repeatable under the same experimental conditions.
Zylon / Dyneema based materials can be used in superconducting magnets for
practical applications. Superconducting coils wound on DFRP bobbins showed stable
behavior in case of AC coils [37]. Dyneema random sheet can be placed / inserted
between the coil layers and also as a spacer. Monofilament of Zylon / Dyneema can
be wrapped in superconducting cables before wrapping with Polyimide film.
Presently, punch through test and other electrical properties of Zylon / Dyneema
based materials are not available. In view of this, we cannot replace Polyimide film
with Zylon / Dyneema based materials, which is basically used as an insulating
material. More study is to be carried out on Zylon / Dyneema based materials.
66
APPENDIX I
Formulation of thrust force exerted by superconducting wire to the semi-circular
head
The superconducting wire is set on the semi-circular head and the tension T ,
provides a thrust force tF (of the superconducting wire) against the semi-circular
head as shown in fig. AI.1. The formulation of thrust force is estimated assuming
head part as polygon and also a circle. Both the assumptions lead to same result. The
formulations are described below.
1. Formulation in case of polygon
Figure AI.2 shows the approximation of polygon having N spacers in a
coil. Figure AI.3 shows the details of various parameters involved for
calculations. The thrust force exerted by superconducting wire to one spacer is
( ) ( ) ( )N
SinTN
SinTSinTFtππθ ⋅=⋅=⋅= 2
222
221 (AI.1)
where, T = tension of the superconducting wire.
The thrust force exerted by superconducting wire to N spacers is
( )N
SinTNFNF ttNπ⋅⋅=×= 21 (AI.2)
The thrust force per unit length of a spacer having width w is
( ) ( )N
Sinw
Tw
Ftt
πσ ⋅== 21 (AI.3)
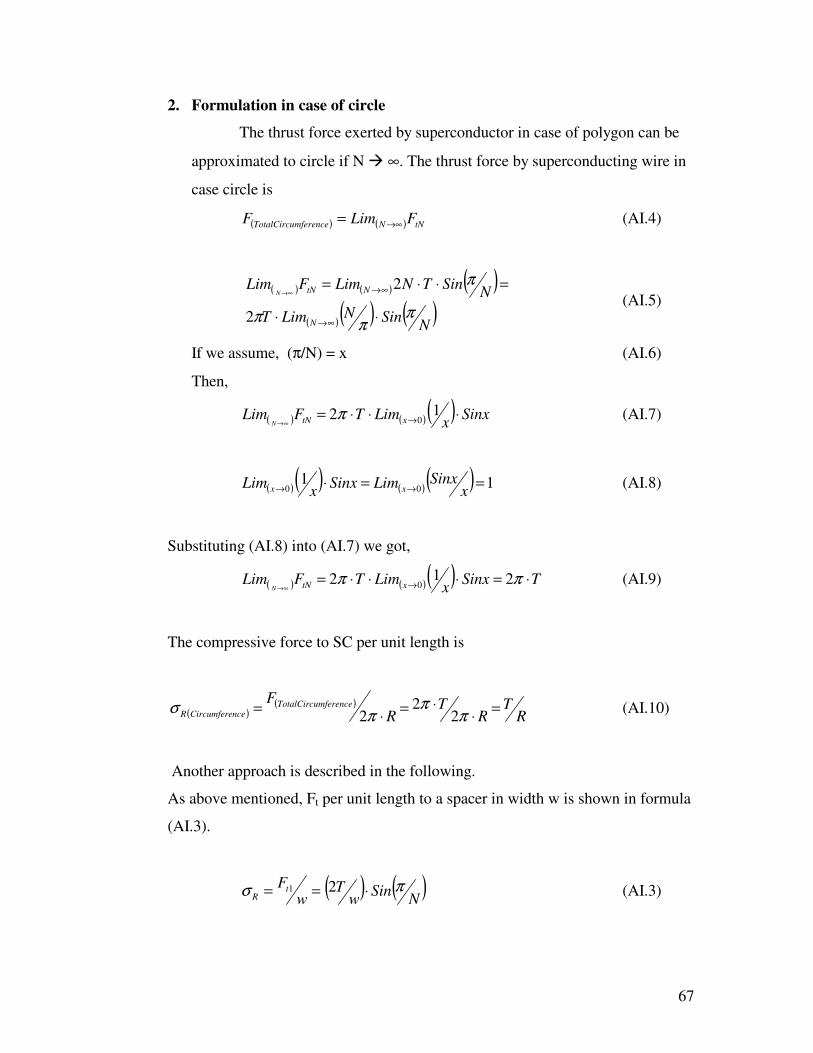
67
2. Formulation in case of circle
The thrust force exerted by superconductor in case of polygon can be
approximated to circle if N � ∞. The thrust force by superconducting wire in
case circle is
( ) ( ) tNNmferenceTotalCircu FLimF →∞= (AI.4)
( ) ( ) ( )
( )( ) ( )N
SinNLimT
NSinTNLimFLim
N
NtNN
ππ
π
π
⋅⋅
=⋅⋅=
∞→
∞→∞→
2
2 (AI.5)
If we assume, (π/N) = x (AI.6)
Then,
( ) ( )( ) Sinxx
LimTFLim xtNN⋅⋅⋅= →∞→
12 0π (AI.7)
( )( ) ( )( ) 1100 ==⋅ →→ x
SinxLimSinxx
Lim xx (AI.8)
Substituting (AI.8) into (AI.7) we got,
( ) ( )( ) TSinxx
LimTFLim xtNN⋅=⋅⋅⋅= →∞→
ππ 212 0 (AI.9)
The compressive force to SC per unit length is
( )( )
RT
RT
R
F mferenceTotalCircunceCircumfereR =
⋅⋅=
⋅=
ππ
πσ
22
2 (AI.10)
Another approach is described in the following.
As above mentioned, Ft per unit length to a spacer in width w is shown in formula
(AI.3).
( ) ( )N
Sinw
Tw
FtR
πσ ⋅== 21 (AI.3)

68
When the circumference is covered all over with spacers, the width of spacer (w)
is approximated to
( )N
Rw ⋅= π2 (AI.11)
From formula (AI.3) and (AI.11), we get
( ) ( ) ( ) ( )N
SinR
NTN
SinR
NTw
FRR
ππ
ππ
σ ⋅⋅
⋅=⋅⋅
⋅==2
21 (AI.12)
In case of polygon to circle approximation (N→∞)
( ) ( )( ) ( )( ) ( )( ) ( )
NSinNLim
RT
NSin
RNTLimLim
N
NRNCircleR
ππ
ππ
σσ
⋅
=⋅⋅
⋅==
∞→
∞→∞→
RT
CircleR =σ (AI.13)
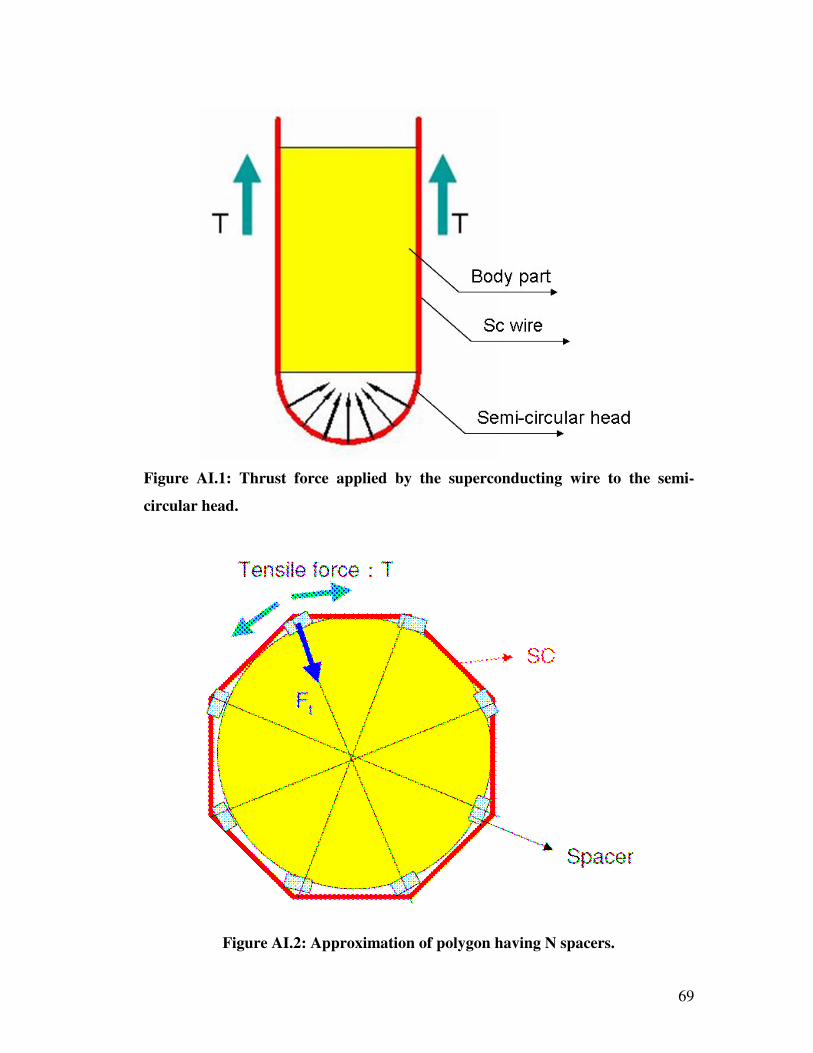
69
Figure AI.1: Thrust force applied by the superconducting wire to the semi-
circular head.
Figure AI.2: Approximation of polygon having N spacers.

70
Figure AI.3: Detailed view of approximation of polygon having N spacers.
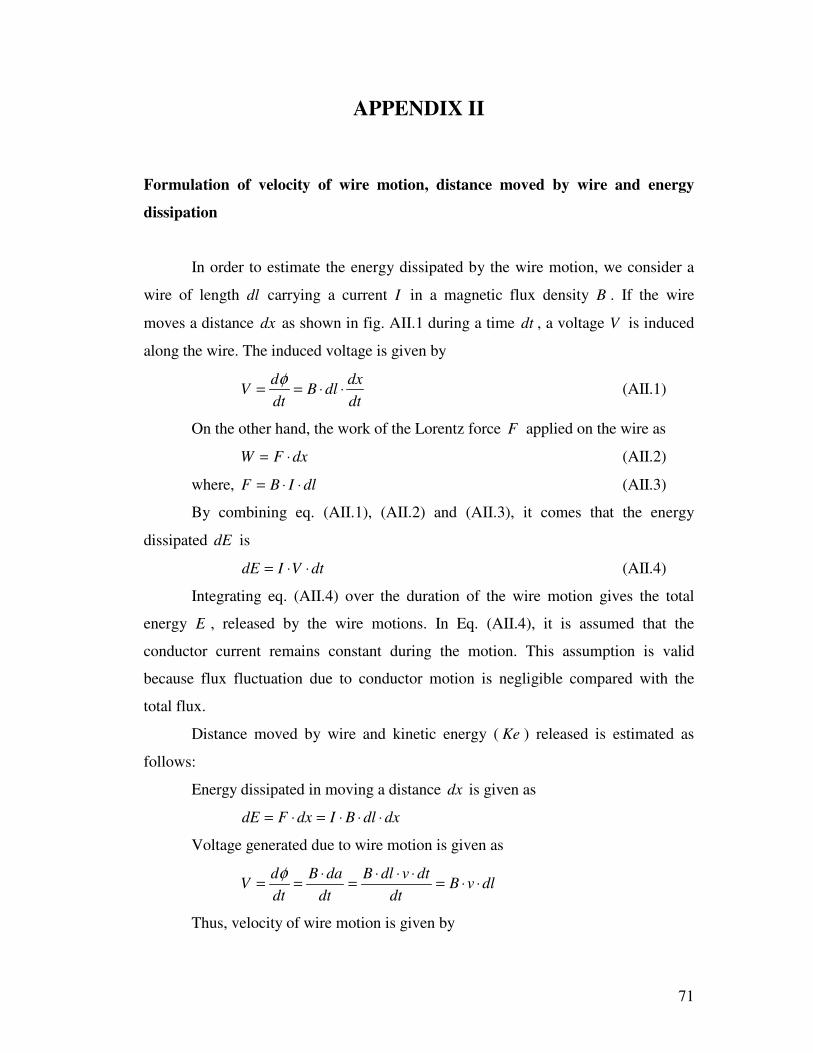
71
APPENDIX II
Formulation of velocity of wire motion, distance moved by wire and energy
dissipation
In order to estimate the energy dissipated by the wire motion, we consider a
wire of length dl carrying a current I in a magnetic flux density B . If the wire
moves a distance dx as shown in fig. AII.1 during a time dt , a voltage V is induced
along the wire. The induced voltage is given by
dt
dxdlB
dt
dV ⋅⋅==
φ (AII.1)
On the other hand, the work of the Lorentz force F applied on the wire as
dxFW ⋅= (AII.2)
where, dlIBF ⋅⋅= (AII.3)
By combining eq. (AII.1), (AII.2) and (AII.3), it comes that the energy
dissipated dE is
dtVIdE ⋅⋅= (AII.4)
Integrating eq. (AII.4) over the duration of the wire motion gives the total
energy E , released by the wire motions. In Eq. (AII.4), it is assumed that the
conductor current remains constant during the motion. This assumption is valid
because flux fluctuation due to conductor motion is negligible compared with the
total flux.
Distance moved by wire and kinetic energy ( Ke ) released is estimated as
follows:
Energy dissipated in moving a distance dx is given as
dxdlBIdxFdE ⋅⋅⋅=⋅=
Voltage generated due to wire motion is given as
dlvBdt
dtvdlB
dt
daB
dt
dV ⋅⋅=
⋅⋅⋅=
⋅==
φ
Thus, velocity of wire motion is given by

72
dlB
V
dt
dxv
⋅== (AII.5)
where, dl = length of wire which moves under the Lorentz force (for
calculation, we assumed 20 E-03 m).
dt = time to reach peak voltage.
Figure AII.2 shows the spike pattern and assuming linear rise of voltage spike
(A to B), maximum velocity (at point B) is,
dtav *max =
Distance moved by a wire is
2*2
1tadx = (AII.6)
We can write kinetic energy as
2*2
1vmKe = (AII.7)
where, a = acceleration of wire motion.
m = mass of wire.
t = total time duration of voltage pulse.

73
Figure AII.1: Conceptual view of wire carrying current and moves a distance dx
in magnetic field.
Figure AII.2: Spike pattern with linear rise and fall.
74
Bibliography
1. A. Yamanaka, T. Kashima, S. Nago, K. Hosoyama, T. Takao, S. Sato, and M.
Takeo, Physica C 372-376, 2002, 1447.
2. T. Kashima, A. Yamanaka, S. Takasugi, and S. Nishihara, Adv. Cryog Eng.
46, 2000, 329.
3. T. Takao, T. Nemoto, H. Konda, T. Kashima, and A. Yamanaka,
ICECE16/ICMC, ICMC, 1997, 1993.
4. Maddock B J, James G B and Norris W T, Cryogenics, 9, 1969, 261.
5. Maddock B J and James GB, Proc. IEE 115, 1968, 543.
6. Stekly Z J J 1967 Proc. Cony. oii Ititetise .Magtietic Fields, Grenoble (Paris:
CNRS) p 237).
7. Appleton AD and MacNab RB 1970 Proc. 3rd In/. Crjogenic Eng. Cotif.,
Berlin.
8. Purcell J R I968 Proc. Summer Study on Superconducting Devices,
Brookhaven, US Dept of Commerce report BNL 50155 (C-55) p 765.
9. M.N. Wilson, Superconducting Magnets, Oxford University Press; 1986.
10. N.Yanagi, K. Seo, S. Imagawa, H. Sekiguchi, K. Takahata, S. Yamada, T.
Mito, T. Ishigohka, A. Ninomiya, Fusion Engineering and Design 81 (2006)
2561.
11. Y. Iwasa, Proceedings of the Workshop on Stability of Superconductors in
Helium I and II, Saclay, France, November 16-19, 1981, pp. 125, edited by
Institu International du froid (Commision A1/2), Paris, France;
12. A. Devred, US Particle Accelerator School, Upton, NY, USA, July 29-
August 4, 1990.
13. T. Ogitsu, K. Tsuchiya and A. Devred, IEEE Trans. On Mag., Vol. 27
(2),1991, 2132.
14. R.S. Kensley and Y. Iwasa, Cryogenics January 1980, 25.
15. A. Devred, CAS-CERN Proc. 98-05.
16. Ramesh Gupta, Lecture notes of School on Superconductivity, Cryogenics
Application and Technology, CAT, Indore, India, 1998.
75
17. H. Maeda, O. Tsukamoto, Y. Iwasa, Proc. of 9th
International Cryogenic
Engineering Conference, Kobe, Japan, 1982, 543.
18. O. Tsukamoto, H. Maeda, Y. Iwasa, Appl. Phys. Lett., 39, 1981, 918.
19. T. Yamada, M. Iwamoto, H. Sakamoto, M. Morita, Y. Jizo, S. Karino, IEEE
Trans. On Mag., 17(5), 1981, 1799.
20. K. Tsuchiya, K. Hosoyama, Y. Ajima, K. Egawa, N. Kumagai, S. Mitsunobu,
Y. Sakakibara, A. Terashima, T. Ogitsu, Ad. Cryo. Eng. 31, 1986, 173.
21. S. Nishijima, T. Kushida, T. Okada, S. Namba, IEEE Trans. On App.
Supercond., Vol. 7, No. 2 (1997), 163.
22. H. Shimizu, T. Shiroki, Y okomizu, IEEE Trans. On Appl. Supercond. 10(1),
2000, 689.
23. J. Perot. Special Magnets. CAS - Superconductivity in Particle Accelerators,
1996. CERN 96-03.24.
24. K. Ruwali, A. Yamanaka, Y. Teramoto, K. Nakanishi and K. Hosoyama, in
Proceedings of the 11th European Particle Accelerator Conference, Genoa,
2008 (EPS-AG, Genoa, Italy, 2008), p. 2449.
25. K. Ruwali, A. Yamanaka, Y. Teramoto, K. Nakanishi and K. Hosoyama,
Phys. Rev. ST Accel. Beams 12, 042401 (2009).
26. A. Devred, CAS-CERN 98-05.
27. R.A. Haarman and K.D. Williamson, Jr., Electrical Breakdown and tracking
characteristics of pulsed high voltages in cryogenic helium and nitrogen,
Advances in Cryogenic Engineering, 21: 102–108, 1975.
28. Toyobo Co., Ltd., http://www.toyobo.co.jp/e/seihin/dn/dyneema/ index.htm.
29. T. Kashima et al, Advances in Cryogenics Engineering, Vol. 42, 1996, 147.
30. T. Takao, T. Nemoto, H. Konda, T. Kashima and A. Yamanaka,
ICECE16/ICMC, ICMC, 1997, 1993.
31. H. Fujishiro et al, Jpn. J. Appl. Phys. Vol. 36, 1997, 5633.
32. Department of Zylon, Toyobo Co., Ltd. Home page, Osaka. Available from
http://www.toyobo.co.jp/e/seihin/ke/pbo/index.htm.
33. T. Kuroki, K. Yabuki, “Physical properties and application of PBO fiber
Zylon”, Sen`I gakkaishi, vol. 54, no. 1, pp. 16-20 (1998) (in Japanese).
76
34. T. Takao, T. Kashima, A. Yamanaka, “Frictional properties on surfaces of
high strength polymer fiber reinforced plastics”, Adv. in Cryog. Eng., 2000,
46A, 127.
35. S.B. Ainbinder and L.M. Liberman, Mechanics of Composite Materials, Vol.
9, No. 5, 1973, 825.
36. Y. Iwasa, I.I.F.-I.I.R.-Commission A1/2 Scalay (France) 1981/6.
37. T. Kashima, A. Yamanaka, E. S. Yoneda, S. Nishijima, T. Okada, Adv. Cryog.
Eng. 41 (1996) 441.
Copyright © 2022 FDOKUMEN