Analytical, numerical, and experimental investigations of ...
Upload
khangminh22Category
view
4download
0
Experimental investigations in improving the VAPEX performance for
recovery of heavy oil and bitumen
by
Nima Rezaei
A thesis
presented to the University of Waterloo
in fulfilment of the
thesis requirement for the degree of
Doctor of Philosophy
in
Chemical Engineering
Waterloo, Ontario, Canada, 2010
© Nima Rezaei 2010

ii
Author’s Declaration
I hereby declare that I am the sole author of this thesis. This is a true copy of the thesis, including
any required final revisions, as accepted by my examiners.
I understand that my thesis may be made electronically available to the public.

iii
Abstract
The process of vapor extraction (VAPEX) is a recovery process which targets the heavy oil and
bitumen resources. Owing to high viscosity values for these unconventional types of oil, the
recovery processes in such reserves are still challenging. The unconventional oil recovery
processes usually include a mechanism for reducing the oil viscosity by means of heat, solvent,
or both. The process of VAPEX utilizes the injection of a light hydrocarbon solvent into a
reservoir for recovering the viscous oil in place by diffusing into the oil and by providing
sufficient mobility to the oil upon dilution. Although this process offers a variety of advantages
over the alternative thermal recovery processes such as SAGD or CSS, it suffers from two major
drawbacks. First, the oil production rates obtained in the VAPEX process are considerably lower
than those obtained in the thermal processes. Second, the solvent cost is considerably high. We
tried to tackle these two problems during this research and we searched for potentials for an
improved VAPEX process. Three potentially improved occurrences of a VAPEX project were
found when: 1) the injected solvent was superheated, 2) the wettability of media was altered to
oil-wet, and 3) the vugs were distributed in the porous media.
Warm VAPEX process is introduced in which the VAPEX process is thermally augmented
through superheating the solvent vapor. An attractive feature of this process is the capability of
the solvent in being able to condense at the bitumen-solvent interface, which provides the
opportunity for the bitumen to be upgraded in-situ through asphaltene precipitation. The
asphaltene precipitation was not observed during the conventional vapor extraction process and
was only observed during the warm VAPEX process. Upon a moderate level of superheating, the
production rate of bitumen was sufficiently improved while the solvent content of the produced
oil was significantly decreased as a result of decreased solubility of solvent in the oil at elevated
temperatures. Therefore, more oil was produced at lower costs. The warm VAPEX experiments
were conducted at 4 temperature levels in high and low permeability media using Cold Lake
bitumen and Lloydminster heavy oil blend, n-pentane was used as solvent. The warm VAPEX
process was found to be more effective for Cold Lake bitumen and for less permeable media.
The potential of in-situ upgrading decreased when the level of superheating increased.
The second potential for an improved VAPEX process obtained when the wettability of porous
iv
medium was altered to oil-wet conditions. Although this wettability condition is harmful to
steam-based recovery processes, such as SAGD, it becomes beneficial to VAPEX. For the
application of VAPEX process in fractionally wet media the wettability of glass beads was
altered to oil-wet conditions through silylation process, and the VAPEX experiments were
conducted in a random packing of water-wet and oil-wet beads of similar size at 7 different
compositions. A substantial increase in the oil production rate was observed in a completely oil-
wet medium, compared to the water-wet medium. By increasing the fraction of oil-wet beads in
the packing up to a critical composition, the production rate of live oil increased linearly with the
increase in the fraction of oil-wet beads in the packing during the vapor extraction process.
Beyond this critical composition, however, the production rate of live oil did not change
significantly with further increase in the fraction of the oil-wet beads in the randomly packed
medium.
Vugs were also found to be beneficial to the production performance of the VAPEX process. The
presence of vugs was investigated in synthesized vugular media at 4 different levels of vuggy-to-
total pore volume ratios. The performance of vugular media was compared to that of the
homogeneous sintered media. The vugs facilitated the production of oil during the VAPEX
process by providing flow communication between the vugs and the surrounding matrix, and
therefore, by providing a local high permeability pathways towards the production well. A peak
in the oil production rate was observed whenever a series of vugs were simultaneously invaded
by the solvent vapor. The overall production rate of oil was higher in vuggy media compared to a
homogeneous media at the same overall porosity and permeability. Furthermore, the magnitude
of residual oil saturation left behind was also slightly lower in vuggy medium because the vugs
were perfectly drained.
Finally, a constant rate air injection (CRAI) porosimetry method was developed for
characterization of vugs in a vugular media. This method was successfully tested in different
synthetic vugular media, and the results illustrated higher accuracy in CRAI porosimetry method
compared to constant rate mercury porosimetry. CRAI porosimetry method was also employed
for identification of higher permeability regions embedded in a matrix of lower permeability.
The analysis of a typical porosimetry signal was also modified.

v
Acknowledgements
I would like to thank my supervisor Professor Ioannis Chatzis for his continuous support, and for
sharing his knowledge with me.
Thank you to Professor Maurice B. Dusseault, Professor Marios Ioannidis, Professor Ali
Elkamel and Professor Leo Rothenburg for your help and support during my studies.
The technical assistance of the staff of Chemical Engineering Department of the University of
Waterloo, especially Mr. Bert Habicher, Mr. Ravindra Singh, Mr. Siva Ganeshligam and Mrs.
Jennifer Moll is highly appreciated. I would also like to thank the technical help from the
personnel of Engineering Student Shop and Engineering Machine Shop of the University of
Waterloo, especially Mr. John Potzold, Mr. John Boldt, Mr. Rick Forgett, Mr. Jorge Cruz, and
Mr. Kwai Chan.
Many thanks to my supportive friends and colleagues who have been kind enough to help me in
difficult times. They are so many of them that I cannot specifically name, one by one.
The financial support from the Iranian Ministry of Petroleum (NIOC) and the Natural Science
and Engineering Research of Canada (NSERC) is acknowledged.
My deepest gratitude goes to my family members for their unconditional support.

vi
This thesis is dedicated to my parents Irandokht and Hadi

vii
Table of Contents
List of Figures ................................................................................................................................ x
List of Tables .............................................................................................................................. xiv
Nomenclature .............................................................................................................................. xv
1 Introduction ........................................................................................................................... 1
1.1 Background ................................................................................................................ 1
1.2 Motivation ................................................................................................................. 2
1.3 Contributions ............................................................................................................. 2
1.4 Thesis structure .......................................................................................................... 4
2 Warm VAPEX: A Thermally Improved Vapor Extraction Process for Recovery of Heavy Oil and Bitumen ....................................................................................................... 5
2.1 Overview ................................................................................................................... 5
2.2 Introduction ............................................................................................................... 6
2.3 Experimental aspects ............................................................................................... 10
2.3.1 Design of Experiments ............................................................................................ 10
2.3.2 Physical packed model ............................................................................................ 12
2.3.3 Experimental procedure of the vapor extraction process ........................................ 13
2.3.4 Heat losses to the surrounding environment ............................................................ 17
2.4 Results and Discussion ............................................................................................ 17
2.4.1 Heat loss analysis ..................................................................................................... 17
2.4.2 The effect of temperature and solvent concentration on the viscosity of bitumen and heavy oil .................................................................................................................. 23
2.4.3 Conventional and warm VAPEX processes ............................................................ 30
2.5 Conclusions ............................................................................................................. 52
3 The Effect of Reservoir Wettability on the Production Characteristics of the VAPEX Process ................................................................................................................................ 54
3.1 Overview ................................................................................................................. 54
3.2 Introduction ............................................................................................................. 55
3.3 Experimental Aspects .............................................................................................. 57
3.3.1 Experimental procedure for VAPEX experiments .................................................. 57

viii
3.3.2 Wettability alteration ............................................................................................... 59
3.3.3 Design of experiments ............................................................................................. 62
3.4 Results and discussion ............................................................................................. 63
3.4.1 Oil production history .............................................................................................. 63
3.4.2 Solvent requirement analysis ................................................................................... 72
3.4.3 Residual oil analysis ................................................................................................ 74
3.4.4 Pore-scale observations ........................................................................................... 75
3.5 Conclusions ............................................................................................................. 78
4 Experimental Investigation of Vapor Extraction Process for the Recovery of Bitumen from Vuggy Porous Media ................................................................................................ 80
4.1 Overview ................................................................................................................. 80
4.2 Introduction ............................................................................................................. 81
4.3 Experimental aspects ............................................................................................... 82
4.3.1 Sintered glass bead models ...................................................................................... 82
4.3.2 VAPEX experiments in sintered vugular media ...................................................... 86
4.4 Results and Discussion ............................................................................................ 89
4.4.1 Oil production history during the VAPEX experiments ......................................... 89
4.4.2 Solvent content analysis .......................................................................................... 97
4.4.3 Residual oil analysis ................................................................................................ 98
4.5 Conclusions ........................................................................................................... 100
5 Characterization of Heterogeneities in Porous Media Using Constant Rate Air Injection Porosimetry ...................................................................................................... 101
5.1 Overview ............................................................................................................... 101
5.2 Introduction ........................................................................................................... 101
5.3 Experimental aspects ............................................................................................. 104
5.3.1 The physical vugular models ................................................................................. 104
5.3.2 Experimental Setup ................................................................................................ 106
5.4 Theoretical background ......................................................................................... 108
5.5 Results and discussion ........................................................................................... 114
5.5.1 Analyzing the CRAI porosimetry pressure trace ................................................... 114
5.5.2 Determining the vug sizes ..................................................................................... 119
ix
5.5.3 Quantifying the vug size distribution .................................................................... 125
5.5.4 Investigating the effect of matrix permeability on pressure trace signal ............... 126
5.5.5 Identifying the Pore space of clusters of larger particles in a continuum of smaller particles .................................................................................................................. 127
5.5.6 Filtering the CRAI porosimetry pressure trace signal ........................................... 129
5.6 Conclusions ........................................................................................................... 135
Recommendations ..................................................................................................................... 136
References .................................................................................................................................. 137

x
List of Figures
Figure 2.1: The sketch of physical model of the porous medium ................................................ 13
Figure 2.2: Process flow diagram for the conventional VAPEX and also warm VAPEX experiments at 36 ºC .................................................................................................. 15
Figure 2.3: Process flow diagram for the warm VAPEX experiments—with some degree of superheating—and also for the heat loss experiments ............................................... 16
Figure 2.4: Energy and mass flow across the system boundary .................................................. 18
Figure 2.5: The heat loss results for three different modes of operation including: 1) isothermal chamber, 2) vacuum chamber, and 3) isolated chamber ............................................ 19
Figure 2.6: Instability in the temperature of superheated solvent vapor ...................................... 21
Figure 2.7: The pool boiling curve for pentane, and heated copper surface (Berenson 1960) .... 22
Figure 2.8: The temperature variation of the Cold Lake bitumen and Lloydminster heavy oil .. 25
Figure 2.9: The effect of solvent content on the viscosity of oil-solvent mixture at 3 different levels of temperature, for both the Cold Lake bitumen and Lloydminster heavy oil. 26
Figure 2.10: The effect of temperature on the viscosity of (a) Cold Lake bitumen, and (b) Lloydminster heavy oil at different levels of the live oil solvent content. ................. 27
Figure 2.11: Cumulative live oil production versus sampling time in an experimental set for the case of Cold Lake bitumen, at the high level of permeability (BT2), as a function of temperature................................................................................................................. 31
Figure 2.12: The effect of solvent temperature and permeability of medium on the live oil production rate during VAPEX process using Cold Lake bitumen. .......................... 32
Figure 2.13: The effect of oil type on the live oil production rates in the BT2 porous medium. 33
Figure 2.14: The effect of solvent temperature and permeability of the packed medium on the dead oil production rates in (a) Cold Lake bitumen and (b) Lloydminster heavy oil blend ........................................................................................................................... 34
Figure 2.15: The solvent content of the live oil for (a) Cold Lake bitumen and (b) Lloydminster heavy oil, as a function of solvent temperature and permeability of the packed medium....................................................................................................................... 36
Figure 2.16: The effect of oil viscosity and the solvent temperature on the solvent content of the produced live oil in the low permeability (BT3) medium ......................................... 36
Figure 2.17: The solvent-to-oil ratio for the Cold Lake bitumen as a function of solvent temperature and permeability of medium .................................................................. 37
Figure 2.18: Cumulative weight percent of Cold Lake bitumen versus true boiling point temperature................................................................................................................. 39
Figure 2.19: C-100 hydrocarbon analysis for Cold Lake bitumen .............................................. 39
Figure 2.20: The effect of temperature on the solubility of n-pentane in the Cold Lake bitumen .................................................................................................................................... 41

xi
Figure 2.21: The residual oil saturation in the VAPEX experiments using (a) Cold Lake bitumen and (b) Lloydminster heavy oil versus solvent temperature and permeability of the packed media.............................................................................................................. 43
Figure 2.22: The effect of oil type and solvent temperature on the residual oil saturation in the low permeability (BT3) media during warm VAPEX experiments .......................... 44
Figure 2.23: The asphaltene content of the produced dead oil in (a) Cold Lake bitumen and (b) Lloydminster heavy oil as a function of solvent temperature and permeability of the packed medium. ......................................................................................................... 47
Figure 2.24: The fraction of asphaltene content of the Cold Lake bitumen precipitated in the model as a function of temperature and permeability of the packed medium. .......... 50
Figure 2.25: The effect of oil type on the asphaltene content of produced dead oil as a function of solvent temperature at lower permeability level. ................................................... 51
Figure 3.1: The wettability alteration mechanism by reaction between dichlorodimethylsilane (DCDMS) and the hydroxyl group on the silica surface (after Hair and Tripp 1995)60
Figure 3.2: Contact angle measurements for the live oil-air system on oil-wet and water-wet glass surfaces ............................................................................................................. 61
Figure 3.3: Cumulative live oil production of the VAPEX experiments at different packing compositions of 0, 25, 50, 75 and 100% oil-wet beads in the packed medium ......... 64
Figure 3.4: The effect of fractional wettability on the live oil production rates during the VAPEX process ......................................................................................................... 66
Figure 3.5: Identifying the critical threshold composition of the oil-wet beads in the packing during the application of the VAPEX process in fractionally wet media .................. 67
Figure 3.6: Approximating the live oil production rate of a desired packing composition below the critical threshold composition of oil-wet beads ................................................... 69
Figure 3.7: The effect of fractional wettability on the dead oil production rates during the VAPEX process ......................................................................................................... 70
Figure 3.8: The effect of contact angle on the area covered by the wetting liquid in a corner of an
equilateral triangular pore at low (1) and high (2) contact angles, during the gravity drainage process ......................................................................................................... 71
Figure 3.9: The solvent content of the produced live oil at different packing compositions ....... 73
Figure 3.10: The effect of fractional wettability on the residual oil saturation during the VAPEX process ........................................................................................................................ 75
Figure 3.11: Bitumen-solvent interface tracking during the VAPEX process in a completely oil-wet medium ................................................................................................................ 76
Figure 4.1: Photograph of portions of sintered beads in models (a) HBT2, (b) HBT3 and (c) HBT4. ......................................................................................................................... 84
Figure 4.2: The vug arrangements in the models (a) V20, (b) V40, (c) V60 and (d) V80 .......... 86
Figure 4.3: Experimental procedure for the application of VAPEX process in sintered vuggy models ........................................................................................................................ 88
xii
Figure 4.4: The cumulative live oil production in homogeneous sintered models, HBT2, HBT3 and HBT4 during the VAPEX experiments ............................................................... 89
Figure 4.5: Instantaneous live and dead oil production rates during the VAPEX experiment in the vuggy model V80 ................................................................................................. 90
Figure 4.6: Dead oil production rate versus the VAPEX scaling factor in (a) homogeneous models HBT2, HBT3 and HBT4 and (b) vuggy models V20, V30, V40 and V80. .. 94
Figure 4.7: The dead oil production rate of VAPEX versus the fraction of total pore volume occupied by vugs in the models HBT3, V20, V40, V60 and V80. ............................ 95
Figure 4.8: The dead oil production rates of bitumen scaled to the permeability and porosity of the baseline model (HBT3) as a function of the fraction of total porosity occupied by vugs. ........................................................................................................................... 97
Figure 4.9: The solvent content of produced live oil (wt. %) versus the scaling factor for homogeneous sintered models HBT2, HBT3 and HBT4. ......................................... 98
Figure 4.10: Residual oil saturation as a function of the fraction of porous space occupied by the vugs. ........................................................................................................................... 99
Figure 5.1: A photograph of (a) a carbonate vuggy core sample and (b) synthetic sintered vugular model .......................................................................................................... 104
Figure 5.2: Experimental setup of the CRAI porosimeter ......................................................... 108
Figure 5.3: Illustration of air invasion into a vug by direct invasion ......................................... 110
Figure 5.4: The pressure trace signal at the point of injection when a water saturated vug is invaded by air through the direct invasion mechanism ............................................ 110
Figure 5.5: Invasion of air into a vug by the snap-off mechanism ............................................ 112
Figure 5.6: Invasion of air-water interface into a vug by (a) direct invasion and (b) snap-off in model VN–1 ............................................................................................................. 116
Figure 5.7: A vug is being invaded by the combination of direct invasion and snap-off, in model VN–1. ....................................................................................................................... 117
Figure 5.8: Qualitative repeatability results for the pressure trace experiments in model VN–2: (a)- Run1 and (b)- Run2. .......................................................................................... 120
Figure 5.9: Repeatability of results in detecting the vug volumes in Run 1 and 2, in model VN–2. ............................................................................................................................... 122
Figure 5.10: Identification of vugs in model VN–1 by: 1) CRAI porosimetry and 2) mercury porosimetry. ............................................................................................................. 124
Figure 5.11: Number frequency of the real vug size distribution and detected vug size distribution by the CRAI porosimetry in model VN–5. ........................................... 125
Figure 5.12: Pressure trace in model VN–9 using a pumping flow rate of 2 cm3/hr. ................ 127
Figure 5.13: Pressure trace in model VN–10, using a pumping flow rate of 4 cm3/hr .............. 127
Figure 5.14: A photo of model VN–7 with 12 vugs and 6 lenses of large glass bead particles in a matrix of smaller beads. ........................................................................................... 128
Figure 5.15: The CRAI porosimetry pressure trace in the heterogeneous vugular model VN–7. .................................................................................................................................. 129

xiii
Figure 5.16: The baseline signal obtained during CRAI porosimetry in model VN–1 ............. 131
Figure 5.17: Applying Savitzky–Golay smoothing filter to the baseline pressure trace signal in the model VN–1. ...................................................................................................... 132
Figure 5.18: Applying a second-order derivative filter to the pre-filtered signal of the CRAI porosimetry in the model VN–1............................................................................... 133
Figure 5.19: The pressure trace signal after filtering ................................................................. 134

xiv
List of Tables
Table 2.1: Design of experiment for conventional and warm VAPEX experiments ................... 11
Table 2.2: The physical properties of the Cold Lake bitumen ..................................................... 23
Table 2.3: The viscosity of Cold Lake bitumen/n-pentane mixture at different solvent concentration and temperature ................................................................................... 28
Table 2.4: The viscosity of Lloydminster heavy oil/n-pentane mixture at different solvent concentration and temperature ................................................................................... 29
Table 2.5: The SARA analysis of the Cold Lake bitumen ........................................................... 38
Table 2.6: Experimental data for the VAPEX and warm VAPEX experiments in homogeneous packed media.............................................................................................................. 52
Table 3.1: Design of experiments for the VAPEX experiments .................................................. 62
Table 3.2: Experimental results for VAPEX experiments in fractionally wet media .................. 77
Table 4.1: Characteristics of the sintered glass bead models used for the VAPEX experiments 85
Table 4.2: Experimental results for VAPEX experiments in vuggy porosity media ................... 99
Table 5.1: Specifications of the vugular glass-bead models used .............................................. 105
Table 5.2: Specifications of glass beads used ............................................................................ 106
xv
Nomenclature
Variables and Parameters
a coefficient of viscosity-temperature correlation
Aw area occupied by the wetting phase in a pore corner (cm2)
b a parameter used in viscosity-temperature correlation (K-1)
cp specific heat capacity (J.kg-1.K-1)
f fugacity (psig)
Fso a dimensionless number, used to distinguish the vugs invaded by the snap-off mechanism
H enthalpy (J.kg-1)
K permeability of porous medium (Darcy)
m mass (kg)
mass flow rate (kg.s-1)
mB mass of bitumen (g)
mor mass of residual oil (g)
P pressure of gas at any time (cmH2O)
Q injection flow rate of water to pressurize a slug of air (cm3.h-1)
heat loss to surrounding (W)
Qdo dead oil production rate (g.min-1)
Qlo live oil production rate (g.min-1)
R universal gas constant (J.mol-1.K-1)
S oil saturation in the porous media (cm3.cm-3)
Sor residual oil saturation (cm3.cm-3)
SG specific gravity
T temperature (K)

xvi
V volume of the air slug at any time (cm3)
Vvug vug volume (cm3)
x mole fraction
P pressure difference between two characteristic states (cmH2O)
t time interval (s)
V volume difference between two characteristic states (cm3)
Greek Letters
an empirical parameter, and a pore corner angle
activity coefficient
1 low contact angle
2 higher contact angle
enthalpy of vaporization (J.kg-1)
viscosity (cP)
density (kg.cm-3)
B density of bitumen (g.cm-3)
or density of residual oil (g.cm-3)
porosity of porous medium
weight fraction
ow fraction of oil-wet beads in a random packing of beads
tow critical threshold composition of oil-wet beads in a random packing of beads
cementation factor of porous media

xvii
Subscripts
A asphaltene
B bitumen
c condensate
chamber isothermal chamber
do dead oil
i component i
in inlet
lo live oil
model inside the porous medium
or residual oil
out outlet
ref reference
S solvent
sat saturation
0 initial state
1 the time for invading into a vug
2 the time at which the expansion stage finishes and the gas starts compressing
3 the time at which the compression stage is finished and the invasion into adjacent matrix throat starts.
D detected size, obtained from CRAI porosimetry or mercury porosimetry
R real size
Exp expansion stage
Comp compression stage
ow oil-wet
ww water-wet
Superscripts
l liquid
f fusion

xviii
s solid
t threshold
v vapor

1
1 Introduction
1.1 Background
The extraordinary high viscosity values of heavy oil and bitumen make the conventional oil
recovery processes fail in these types of reserves mainly because of the adverse mobility ratio
between the displacing and displaced fluids. These recovery processes usually tend to leave
behind a major fraction of the oil in place. Conventionally, the recovery techniques dedicated to
heavy oil and bitumen reservoirs incorporate a mechanism for viscosity reduction. The viscosity
of these viscous types of oil can be dramatically reduced by means of applying heat, solvent, or
by combination of both. Based on the applied mechanism for the viscosity reduction, several
technologies were introduced. For example, cyclic steam stimulation (CSS), steam assisted
gravity drainage (SAGD), in-situ combustion, steam flooding, hot water flooding, and near
wellbore stimulation techniques utilize heat to reduce the viscosity of oil. On the other hand,
vapor extraction process (VAPEX) and solvent injection methods use solvent to reduce the
viscosity of oil in place. There are several variations of the thermal and the solvent based heavy
oil recovery techniques proposed in literature, which in general combine solvent and heat to
enhance the performance and efficiency of the recovery process.
The process of vapor extraction (VAPEX) of heavy oil and bitumen was introduced a decade
after steam-assisted gravity drainage (SAGD) process as an alternative to this well established
thermal recovery process. In the conventional VAPEX process light hydrocarbons are injected
into reservoir at operating conditions which enable the solvent to stay in the gas phase, at a
thermodynamic state close to that of dew point conditions. The injected solvent diffuses into the
oil and reduces the viscosity of oil dramatically. Upon sufficient dilution with the solvent, the oil
attains sufficient mobility to be produced. In this process the injection and production wells are
closely spaced at the bottom of the oil formation with the injection well drilled on the top of the
production well, and the process is solely progressed by gravity force. Therefore, this recovery
process is inherently slow but efficient (high recovery values).

2
1.2 Motivation
The overall estimated volume of viscous oil resources is estimated at approximately 9 trillion
barrels; about 2 trillion barrels of this quantity occurs in carbonate reservoirs (Dusseault and
Shafiei 2010). This vast quantity of oil draws attention to the recovery techniques applicable to
these types of reserves.
The VAPEX process has received interest mostly because of high material and energy
requirements in thermal processes, such as SAGD. However, the VAPEX process suffers from
major drawbacks such as low oil production rates and high solvent costs. Therefore, to modify
the VAPEX process, attempt has to be focused on increasing the oil production rates and
decreasing the solvent requirements. In the current research three potentially improved
occurrences of a VAPEX project were found when:
injected solvent was superheated,
wettability of media was altered to oil-wet,
vugs were distributed in the porous media
The incentives and motivations for performing the objectives of this research are discussed in
more details within the related chapters of this thesis.
1.3 Contributions
We performed VAPEX experiments in different types of porous media including the glass
micromodels, glass sintered micromodels and also randomly packed models of glass beads with
known size distribution. The experiments were performed in homogeneous as well as
heterogeneous porous models. The heterogeneities studied in this research included wettability
heterogeneity in the form of fractional wettability and also permeability heterogeneity in the
form of vugs embedded in a sintered matrix of glass beads. Four major contributions were made
during this research which can be summarizes as:
The process of warm VAPEX was introduced in which the solvent vapor was
superheated before being injected into reservoir. This process showed promising features
3
such as improved oil production rate and also decreased solvent requirement; both factors
contribute to a better process economy. The sensitivity of VAPEX process to the level of
superheating was studied by the response of several factors such as live and dead oil
production rates, solvent content, residual oil saturation and also asphaltene precipitation
analysis. Furthermore, a detail analysis of heat loss was performed.
The effect of fractional wettability on the performance of VAPEX process was also
studied. It was concluded that the oil-wet condition can significantly benefit the process
of VAPEX. Furthermore, the effect of different oil-wet compositions in a packing of
water-wet and oil-wet beads was studied during the VAPEX process. A critical
composition of oil-wet beads was found which beyond this critical composition the oil
production rate of VAPEX was not considerably changed with further increase in the
fraction of oil-wet beads in the medium anymore.
The effect of vugs on the production of oil in vugular porous media was studied and it
was concluded that the vugs can considerably accelerate the oil production rate. They can
also result in better oil recovery values when the vugs contribute a lot to overall pore
volume because vugs are perfectly drained. It was found that the dead oil production rate
from a vugular model can be significantly higher than that of a homogeneous model,
even at the same overall porosity and permeability levels. The flow communication
between the vugs with the matrix and also the enhanced mass transfer from solvent to
bitumen and from bitumen to draining live oil were found responsible in enhancing the
performance of VAPEX in the presence of vugs.
The vugs were identified in a vugular porous medium by a constant rate air injection
(CRAI) porosimetry. This method was successfully tested by several sintered models. In
addition, the analysis of a typical pressure signal of porosimetry project was also studied
in details and modified. Different mechanisms were identified on the pressure signal
which enabled to understand the type of invasion into a water-filled vug by the air. This
method was not only used in vuggy models but also was tested in heterogeneous models
in the form of lenses of higher permeability embedded in a matrix of smaller beads and it
was possible to identify the lenses of higher permeability and their corresponding
volumes.

4
1.4 Thesis structure
This thesis is being structured by separate chapters; all chapters have their own abstract,
introduction, literature review, experimental aspects, results and discussion, and also
conclusions. However, all references and nomenclatures are listed together at the end of the
thesis. After a short general introduction in this chapter the objectives of this research are listed
in Chapter 2-5. In chapter 2 the process of warm VAPEX is explained in details. Chapter 3
covers the necessary materials for the application of VAPEX in a fractionally wet medium. In
chapter 4 the application of VAPEX process in a vugular porous media is explained and chapter
5 explains the proposed methodology for identification of vugs in a vugular porous medium.

5
2 Warm VAPEX: A Thermally Improved Vapor Extraction
Process for Recovery of Heavy Oil and Bitumen
2.1 Overview
The advantages of solvent-based enhanced oil recovery processes for production of heavy oil and
bitumen have always been sacrificed with their inherent unattractive oil production rates.
Attempts have been made to integrate the solvent and thermal processes to attain better recovery
techniques in terms of improved oil production rate, oil quality, and material and energy
requirements. In this chapter, the sensitivity of the vapor extraction process to the level of
solvent superheating is investigated. During the warm VAPEX process, the temperature of
solvent vapor, permeability of the packed bed media, and the oil type were considered as the
experimental variables. Three treatment levels (36, 43 and 50 °C) were chosen for the injected
solvent temperature; 2 levels of permeability (220 and 830 Darcy) were used, and 2 oil of
different viscosity, namely Cold Lake bitumen and Lloydminster heavy oil blend were tested
during the experiments. The performance of warm VAPEX process was compared to a
baseline—the conventional VAPEX process—at all possible combinations of the experimental
factors. The packed model was placed in an isothermal bath of circulating hot air to lower the
heat loss to the surrounding and also to avoid temperature variation of the environment between
different trials. The production performance was enhanced, to some extent, when the solvent was
allowed to condense by lowering the temperature of the isothermal bath below the solvent bubble
point temperature. However, upon a moderate degree of superheating (i.e., the mid-level
temperature of 43 °C) the bitumen production was substantially increased at both levels of
permeability. This production enhancement was more pronounced in the case of the more
viscous oil (Cold Lake bitumen). The solvent content and solvent-to-oil ratio during the warm
VAPEX process decreased with increasing the degree of superheating. Except for the warm
VAPEX trial at bubble point temperature, the solvent-to-oil ratios were lower in the warm
VAPEX, as compared to the baseline. The asphaltene content analysis showed insignificant
deposition of asphaltene during the conventional VAPEX process in which condensation did not
occur. On the other hand maximum asphaltene precipitation was achieved at the lowest
6
temperature level—during the warm VAPEX process—at which a maximum amount of
condensation took place. At a fixed level of permeability and initial oil viscosity, the residual oil
saturation increased with the level of solvent superheating. Therefore, by applying optimal
operating conditions, the oil production rate significantly increases while the solvent-to-oil ratio
decreases as a result of decreased solubility of solvent in the bitumen. Both factors favor the
economy of process. In-situ upgrading of the crude will also occur, which contributes to the
improved quality of the produced oil.
2.2 Introduction
The idea of using a solvent for recovery of heavy oil and bitumen was introduced in 1974, when
Allen (1974) first introduced a variation of the cyclic steam stimulation process (CSS), in which
alternate cycles of steam and solvents such as propane or butane were used. There were other
experimental trials of solvent-based heavy oil recovery methods reported since then (Allen and
Redford 1976; Nenniger 1979; Dun et al. 1989). However, discouraging oil production rates
from the lab-scale experimental trials abandoned further research in this area. The technological
breakthrough of horizontal well drilling revitalized the idea of using solvent for the recovery of
heavy oil and bitumen. In 1989, Butler and Mokrys introduced Vapor Extraction Process
(VAPEX) as a solvent-analogue of the well-established Steam Assisted Gravity Drainage
(SAGD) process (Butler and Mokrys 1989). Although there have been some field scale pilot tests
of the VAPEX process, due to confidentiality reasons, the results have not yet been publicized
(Nenniger and Dunn 2008).
Even with the use of horizontal wells, the VAPEX process is still suffering from an inherent
drawback: the oil production rate is not economically attractive. The low rate of oil production in
the VAPEX process has forced researchers to augment it with a source of heat. The thermally-
improved VAPEX processes could be categorized into three main groups: 1) co-injection of
steam and solvent, which has been introduced by different tags like ESSAGD, hybrid VAPEX,
wet VAPEX and SAVEX; 2) well or near wellbore stimulation by heat (Thermal Solvent Reflux,
TSR method); and 3) injection of a hot hydrocarbon solvent into the reservoir (NSolv and
7
warm VAPEX processes). Among these processes, TSR and N–Solv are of great interest
because of the similarities to this study.
Although N–Solv, warm VAPEX, and electrical well heating in the TSR method share the same
ultimate goal of augmenting heat with pure VAPEX process, each process, however,
hypothesizes a different key mechanism for the production improvement—in addition to the
benefits from operating the VAPEX process at an elevated temperature. The major contribution
of the N–Solv process to VAPEX is through blocking the poisoning effect of less volatile
compounds in the solvent chamber by allowing them to condense in-situ (at bubble point
conditions). TSR improves the VAPEX process by having an in-situ solvent reflux as a result of
localized hot region in the proximity of the well pair. In the warm VAPEX process, the pore-
scale convective effects of the condensed solvent flowing over the nominal bitumen-solvent
interface provide benefits to the conventional VAPEX process.
Nenniger and co-workers first introduced the idea of the N–Solv process in which a light
hydrocarbon solvent, such as propane, is sufficiently heated above its dew point temperature (at
prevailing reservoir conditions) and then is injected into the reservoir in a process configuration
similar to a typical VAPEX process (Nenniger et al. 2005). The injected hydrocarbon solvent is
required to remain in the gas phase within the oil-swept area and is desired to condense at the
edge of the bitumen-solvent interface. It has been hypothesized that the additional heat will
enhance the bitumen extraction process by: increasing the diffusion coefficient of solvent into
the bitumen, reducing the viscosity of oil at the interface, increasing the quality of produced oil
upon in-situ upgrading, and most importantly, reducing the vulnerability of the process to the
mass and heat transfer poisoning effects which could be caused by the presence of non-
condensable gases. This process is best operated at a pressure as close as possible to the reservoir
hydraulic fracturing pressure (within 10%, most preferably), to improve the mass transfer of
solvent into the bitumen. Higher operating temperature is also believed to be more desirable.
Nenniger and Dunn (2008) have correlated the live oil mass flux to a combined parameter,
(K./)0.51 in which K and are the permeability and porosity of the porous medium,
respectively, and is the viscosity of raw bitumen. According to this correlation, modifying the
8
viscosity of oil is the only way to increase the oil production rate. The production rates of an N–
Solv process at different operating temperatures were compared to that of the SAGD process
and it was concluded that N–Solv can produce more oil (as high as 3 times), at lower energy
costs. This calculation was based on operating both the N-Solv and SAGD processes in a
hypothetical 20 m pay zone reservoir with the aid of 500 m long well pair. At 30 ºC, N-Solv
can potentially produce 70 m3/day of dead oil with a 90% energy reduction, compared to that of
the SAGD process. At 40 ºC the production rate becomes comparable to the SAGD project (140
m3/day), taking advantage of 85% energy saving, and finally, at 60 ºC the oil production rate
from N-Solv process reached 400 (m3/day) with 75% energy saving compared to energy
requirements of the SAGD process. However, the validity of these predictions depends to a great
extent on the goodness of fit in the desired range of the pay zone, which is uncertain. This
substantially higher bitumen production rate in an N–solve process was reported again by
Nenniger and Gunnewiek (2009) in which a 5 Darcy sand pack was used and the injected solvent
was continuously purified to achieve minor concentration of non-condensable contaminant gases
in the feed stream (i.e., lower than 0.3 mole percent of methane).
The thermal solvent reflux (TSR) methods in lab scale include thermal stimulation of the near
wellbore area by means of either steam injection or electrical heating. This limited hot area helps
the flow communication between the well pair, lowers the viscosity of heavy oil, enhances the
solvent diffusion into the bitumen, and also acts as an in-situ solvent trap. As a result, the solvent
requirement of these processes significantly decreases. This idea has been pioneered by research
groups at Alberta Research Council (ARC) since 2005 (Frauenfeld et al. 2005; Frauenfeld et al.
2006; Ivory et al. 2007; Frauenfeld et. al. 2008). Although the early experimental attempts
demonstrated that thermal stimulation of the near wellbore region by means of either steam
injection or electrical heaters (to a temperature of 180 °C) were equally effective in increasing
both the oil production rate and the extent of solvent in-situ recycling (Frauenfeld et al. 2005).
However, later trials revealed that employing steam (hybrid VAPEX process) was much more
efficient than TSR by electrical heating (Frauenfeld et al. 2006; Ivory et al. 2007; Frauenfeld et
al. 2008). According to the experimental results for a specific sand pack saturated with
Athabasca bitumen, a production rate of 3.6 cm3/min was obtained with the hybrid VAPEX

9
process compared to that of the TSR process, which was only 1.41 cm3/min (Ivory et. al. 2007).
Both methods offered lower energy consumption compared to SAGD, but the TSR method
resulted in higher cost per barrel of produced oil because of the lower production rate. The
hybrid VAPEX, however, suggested a lower overall cost per barrel of produced oil in which 40%
reduction in steam cost was obtained at the cost of some decrease in the oil production rate
(Frauenfeld et al. 2008). The near wellbore thermal stimulation was less effective in improving
the performance of VAPEX process in the presence of non-condensable gas in the initial oil in
place. It was justified that the non-condensable gas could accumulate inside the solvent chamber,
and its presence within the chamber could inhibit the process of solvent diffusion into the
bitumen (Frauenfeld et. al. 2005).
The warm VAPEX process was first captured by James (2003) when she accidentally found a
substantial increase in the pore-level sweep rate of bitumen as a result of undesired solvent
condensation during the pore scale visualization study of the VAPEX process in a glass
micromodel. A considerable amount of asphaltene precipitation was also observed when the
temperature of water bath, containing the glass micromodel, dropped by 2 ºC below the dew
point temperature of the injecting solvent (i.e., n-butane). The attributed pore level observations
were later documented and explained in detail (James et al. 2008). The pore-level enhancement
mechanism of heavy oil production in a warm VAPEX process was found to be as a result of a
so-called washing effect (or stripping effect) of the solvent condensate on the nominal solvent-
bitumen interface, facilitated by the gravity force. The drainage of solvent condensate film over
the solvent-bitumen interface not only increased the oil production rate as a result of the washing
effect, but also helped the pore scale mixing of solvent and bitumen along the tortuous draining
path of the live oil. It was also observed that the washing-out mechanism of the solvent
condensate created a perfect vertical interface in the middle of the pores, which had never been
observed during the pore scale visualization studies of the conventional VAPEX process (Chatzis
2002; James 2003; James and Chatzis 2004; Friedrich 2006). As a result, this vertically-suited
interface has been found to be the exclusive pore-scale feature of the warm VAPEX process.
Asphaltene precipitation phenomenon occurs during the course of warm VAPEX process; it was
observed that the bubbles of the solvent vapors were sometimes deformed and re-routed because
of the local precipitation and clogging of the asphaltene particles at the narrower pore

10
constrictions. In conclusion, a four-fold increase in the average pore velocity of the interface
sweeping, from 0.60 pore/hr (0.107 cm/hr) in the conventional VAPEX to 2.61 pore/hr (0.467
cm/hr) in the warm VAPEX, was observed only due to the solvent condensation along the
interface. Furthermore, the preliminary results of the VAPEX process using packed models
showed promising improvement in the process performance when the injected solvent was
superheated above its dew point temperature (James et al. 2008).
The objective of this study is to investigate the performance of a warm VAPEX process at the
macro-scale. The sensitivity of the VAPEX process to the temperature of solvent, permeability
of the porous medium, and the oil type was investigated. The VAPEX experiments were
conducted in 220 and 830 Darcy media of randomly packed glass beads in a rectangular physical
model using n-pentane as the solvent to recover the Cold Lake bitumen as well as the
Lloydminster heavy oil blend from the oil saturated model. The temperature of solvent was
varied from the dew point temperature to an elevated temperature at 3 levels, namely, 36, 43 and
50 °C.
2.3 Experimental aspects
2.3.1 Design of Experiments
The sensitivity of bitumen (and heavy oil) production to the superheating degree of solvent vapor
was investigated through the following design of experiments during the VAPEX process, as
summarized in Table 2.1. For the warm VAPEX experiments 3 factors were considered, namely:
1) the initial oil in place viscosity, 2) permeability of the packing, and 3) the temperature of
solvent vapor. For the conventional VAPEX experiments the third variable remained fixed. We
attempted to run the experiments with both bitumen and heavy oil. Therefore, Cold Lake
bitumen (B) with a viscosity of 40500 cP (at 35 °C) and Lloydminster heavy oil blend (HO) with
a viscosity of 5400 cP (at 35 °C) were tested during the experiments.

11
Table 2.1: Design of experiment for conventional and warm VAPEX experiments
Run No. Oil
Type Bead Type
K (Darcy) Tmodel (°C) Tchamber
(°C)
1 B BT2 830 36 37
2 B BT3 220 36 37
3 HO BT 2 830 36 37
4 HO BT 3 220 36 37
5 B BT 2 830 36 35
6 B BT 3 220 36 35
7 HO BT 2 830 36 35
8 HO BT 3 220 36 35
9 B BT 2 830 43 35
10 B BT 2 830 43 35
11 HO BT 2 830 43 35
12 HO BT 2 830 43 35
13 B BT 3 220 43 35
14 B BT 3 220 43 35
15 HO BT 3 220 43 35
16 HO BT 3 220 43 35
17 B BT 2 830 50 35
18 B BT 3 220 50 35
19 HO BT 2 830 50 35
20 HO BT 3 220 50 35
In this set of experiments, the model was packed on a vibrating bed to reduce the variability
originated from the packing process. The BT2 and BT3 types of glass beads provided porous
media with a permeability of 830 and 220 Darcy, respectively when the media were randomly
packed. Three levels were chosen for the temperature of solvent vapor in the porous medium,
namely, 36, 43 and 50 ºC. In addition two modes of operation (condensing and non-condensing)
were applied for the VAPEX experiments, depending on the temperature of housing. For the
conventional VAPEX experiments the temperature of housing was set slightly higher than the
dew point temperature of pentane, at 37±0.5 C. For the warm VAPEX experiments the

12
temperature of housing was lowered to about 35±0.5 ºC. Those experiments represented by run
numbers 1-4 characterize the conventional VAPEX process while runs 5 to 20 show the
operating conditions of the warm VAPEX experiments. The experiments have been replicated at
the mid-level temperature, 43 °C.
2.3.2 Physical packed model
The physical model was created by manufacturing a rectangular o-ringed frame, sandwiched
between two Plexiglas® plates, as depicted in Figure 2.1. The empty space between the two face
windows provided the packing space with a size of 41.91 cm (16½") long, 7.62 cm (3") wide and
1.905 cm (¾") thick. This empty space created a porous space with a bulk volume of about 600
cm3. The model was reinforced by aluminum bars, enabling it to withstand higher applied
pressures during the oil saturating stage. A 0.635 cm (¼") perforated gas injection tube was
passed through one side of the frame, resembling half of the VAPEX scheme. The gas injection
tube was perforated with increasing density of perforation towards the top of the model, to
compensate for the pressure drop inside the tube, and also to provide a more uniform solvent
distribution. The role of the injection tube was to ease the early communication stage between
the production and injection wells and also to facilitate the chamber growth towards the top of
the pay zone. There was another 0.317 cm (⅛") tube installed inside the vapor injection tube.
This inner tube was used to block the gas injection tube from the bitumen flowing into it through
perforations, during the oil saturating stage. In addition, this concentric dual tubing enabled for
heating of the well during the early stages of the experiments by circulating hot water through
the inner tube. This model design eliminated the potential of solvent condensation in the
injection well. A wire mesh was wrapped around the perforated gas injection tube to avoid glass
beads invading into the gas tube through the perforations and also to ease the communication
stage. Overall, the cell design is simple and is easy to assemble, and to dismantle for cleaning
purpose.

13
Figure 2.1: The sketch of physical model of the porous medium
2.3.3 Experimental procedure of the vapor extraction process
Two different experimental setups were used to investigate the conventional and the warm
VAPEX processes. The baseline experiments (conventional VAPEX) and also the warm VAPEX
trials at the lowest level of temperature (36 ºC) were performed in a process configuration
depicted in Figure 2.2. The packed model was placed in an isothermal heated chamber,
resembling the reservoir. The temperature of the isothermal chamber was adjusted to either 35 ºC
or 37 ºC for warm VAPEX and conventional VAPEX experiments, respectively. Liquid pentane
was brought to the boiling state in the boiler, and the solvent vapor was then injected into the
packed model through a perforated gas injection tube. The rate of boiling was adjusted at rates
higher than the one that the system could have taken up; therefore, some extra solvent was
allowed to leave the system from the top and to condense at an atmospheric condenser. The
14
condensed solvent at the top was collected in the collector vessel. Using this process scheme, the
system was allowed to uptake as much solvent as it needed for developing the live oil conditions
near the bitumen-solvent interface in the porous medium.
In these experiments the produced oil was continuously drained out of the system and was
collected in a sampling vessel, kept in an ice bath, to avoid the solvent from escaping from the
live oil sample. By adjusting the position of the needle valve at the bottom of the model, it was
possible to avoid short cut of solvent vapor from the solvent chamber to the atmosphere. The
isothermal bath was heated by injecting a 40 psig pressure air stream into a 1000 W band heater.
The power applied to the heater band was manually adjusted for achieving a desired set point
temperature at the housing chamber. To minimize the temperature gradient within the chamber,
the injected air was distributed along the chamber through a perforated vertical tube with higher
density of perforation at the top, and a fan was also installed inside the chamber to create
sufficient air mixing. A thermocouple was installed inside the porous medium in the middle of
model height by which the temperature of reservoir was monitored. The solvent injection stage
was started as soon as the reservoir temperature reached the design temperature (either 35 or 37
ºC). The flow communication between the production end and the line source injection well was
eventually accomplished at the end of the start up phase of the experiment when the oil near the
injection well drained.

15
Figure 2.2: Process flow diagram for the conventional VAPEX and also warm
VAPEX experiments at 36 ºC
During the spreading phase of the VAPEX process, in which the solvent chamber has reached
the top of the porous medium, we purposely allowed some production from the model before
starting the regular sampling procedure. The reason was to allow the nominal bitumensolvent
interface to move away from the gas injection tube, avoiding the uncertainties associated with
the near well bore drainage. The live oil samples were then taken every 5-15 minutes, depending
on the treatment levels of the experimental factors. The produced oil was continuously drained
out of the model to avoid direct contact of solvent and the diluted oil, and was collected in a
sealed sampling vessel, placed in an ice bath. It was possible to avoid solvent vapor short cut
from the solvent chamber to the sampling vessel, through the production tube, by maintaining a
certain level of live oil in the production tube. The ice bath was used for two reasons: first, to
eliminate the potential of solvent escaping the live oil sample; and second, to lower the vapor
pressure inside the sealed sampling vessel, which eases the live oil drainage from the model to
the sampling cups. The collected samples were later tested for asphaltene and solvent contents.

16
The rest of the warm VAPEX experiments (runs 9-20) with some degree of superheating were
conducted according to the process configuration as depicted in Figure 2.3. This figure shows a
more general process flow diagram which not only explains the warm VAPEX process but also
shows a schematic diagram of the heat loss experiments. Note that for the warm VAPEX
experiment the isothermal mode of the chamber was only employed. The superheated solvent
vapor was generated by pumping the liquid pentane at constant flow rate into a pre-heater (160
W) followed by a heater coil (600 W) at the steady state coil temperature. The pre-heater brought
the liquid solvent to the saturation temperature, while the second heater provided enough energy
to superheat the solvent vapor to the desired temperature. The two coils in series were used to
avoid instability in the temperature, caused by the alteration in the boiling behavior from
nucleation boiling regime to transient boiling and also from the transient boiling to film boiling
and vice versa.
Figure 2.3: Process flow diagram for the warm VAPEX experiments—with some degree of
superheating—and also for the heat loss experiments

17
2.3.4 Heat losses to the surrounding environment
It is inevitable to experience heat losses to the surrounding environment during a thermal heavy
oil recovery method. Heat loss not only increases the energy requirement of a thermal recovery
method, but also it will increase the solvent (or steam in SAGD) requirement in a thermal solvent
process. As more oil is drained from the system, more area will be available for the heat loss;
therefore, heat loss is continuously increasing during the thermal recovery processes.
The heat loss experiments were conducted in a similar configuration to the warm VAPEX tests
(Figure 2.3) with the difference that the porous medium was not saturated with oil and the whole
porous space was exposed to the solvent vapor. Therefore, the heat loss measured in this analysis
was the maximum possible heat loss, corresponding to a recovery of 100% of the initial oil in
place. There were 5 thermocouples installed inside the porous medium along the model height; 4
thermocouples were also installed to measure the temperature of inlet gas, outlet gas, liquid
condensate and also the housing. The inlet flow rate, outlet flow rate and the flow of condensate
were also measured at steady-state conditions. These measurements enabled for a heat balance,
and consequently allowed for quantification of the heat loss at different levels of solvent
temperatures. A bourdon pressure gauge was also installed on the porous media to check for
system pressure.
A vacuum chamber was initially built to house the model, and to reduce the heat loss through
conduction and convection. A maximum vacuum of 2 torr was achieved at steady-state, when the
air inside was evacuated using a vacuum pump. However, this level of vacuum was not enough
in satisfactorily removing the heat loss from model.
2.4 Results and Discussion
2.4.1 Heat loss analysis
During the heat loss experiments the housing chamber was operated at three different modes.
First, the chamber contained stagnant air, eliminating the convection effects. Second, a moderate
vacuum (2 torr) was applied to the chamber to remove the heat loss to the surrounding through

18
conduction and convection. Finally, hot air (at 35 ºC) was circulated in the chamber to lower the
temperature gradient between the model and the surrounding. The heat loss was then calculated
based on the measured flow rates and the temperatures of the input and output streams and by
solving the heat and mass balance equations, simultaneously, over the system boundaries as
shown below:
Figure 2.4: Energy and mass flow across the system boundary
Energy balance:
( 2.1)
Mass balance:
( 2.2)
in which, the mass streams, , and represent the input flow rate of superheated
solvent vapor, output flow rate of solvent vapor, and the flow rate of liquid solvent condensed in
the model, respectively. The corresponding enthalpies of these material flows represent by ,
and , respectively; is a reference state for the enthalpy in the vapor phase, and the

19
heat loss from the model is showed by . Coupling the energy and mass balance equations
and rearranging for the enthalpy of liquid condensate results in:
( 2.3)
in which and are the enthalpies of the saturated vapor and saturated liquid phases at
the prevailing pressure, respectively; represents the enthalpy of subcooled liquid condensate,
and λ is the enthalpy of condensation at the operating pressure condition. The term
can be removed from Equation ( 2.3) because subcooling did not occur. Substituting for the
enthalpy terms and rearranging Equation ( 2.4) will result in the following correlation for heat
loss calculation:
( 2.4)
Figure 2.5: The heat loss results for three different modes of operation
including: 1) isothermal chamber, 2) vacuum chamber, and 3) isolated chamber
Figure 2.5 shows the results of a heat loss analysis for the baseline case in which the housing
contains stagnant air, at room temperature, as well as for the isothermal housing and vacuum
chamber as the housing. According to Figure 2.5, the superheating decreases the heat loss to the
surrounding. This reduction in heat loss can be justified by the fact that at lower levels of
0
10
20
30
40
50
60
70
80
34 36 38 40 42 44 46 48 50 52
Hea
t los
s (W
)
Temperature (°C)
Isothermal
Vacuum
Isolated
20
superheating the temperature of solvent in the model is closer to the dew point temperature of
solvent at the prevailing pressure. Therefore, the heat of condensation can be easily transferred to
the surroundings through the liquid condensate formed on the surface, while at higher degrees of
superheating the heat transfer flux transferred to the surrounding is controlled by the lower heat
transfer coefficient of the gas stream. It is noteworthy that there is a critical level of superheating
after which the solvent appears only in the gas phase; the heat loss will increase with temperature
in this region, as observed in the case of heat loss from the isothermal chamber at 50 C
compared to its value at 43 °C. This behavior is analogous to the transition from nucleation
boiling to transition boiling, followed by transition from the transition boiling to film boiling
regimes, as described by the pool boiling curve. Therefore, running a thermally enhanced oil
recovery process (SAGD or thermal VAPEX), in the presence of a sharp temperature gradient
can be extremely risky at operating conditions close to the dew point conditions. Based on the
heat loss results, the injection of hot air at 35 C was very effective in substantially removing the
heat loss from model. For instance, an 85% reduction in the heat loss was observed at the lowest
operating temperature level.
As shown in Figure 2.5, applying a moderate vacuum of 2 torr was not effective in decreasing
the heat loss from the model to the surrounding. It is believed that a vacuum pressure of 0.01 torr
or less is required for significantly removing the heat loss through conduction (Roth 1990). To
establish an insulating vacuum the level of vacuum in the chamber should reach as low as 1×10⁻⁶
torr (Guyer 1999). While vacuum decreases the thermal conductivity of surrounding air, it also
increases the mean free path of the remaining air molecules in the chamber. Therefore, a rough
vacuum cannot effectively remove the heat loss because the remaining gas molecules can
transfer the heat from the model’s boundary, all the way, to the surroundings as a result of
increased mean free path.
Initially, we attempted to heat up the solvent in a single heating band. The power to the heated
band and the injection flow rate of pentane into the coil were fixed. However, it was very
difficult to control the temperature of the superheated solvent vapor within an acceptable range,
even with the privilege of a temperature controller. The system was set to run for a long period
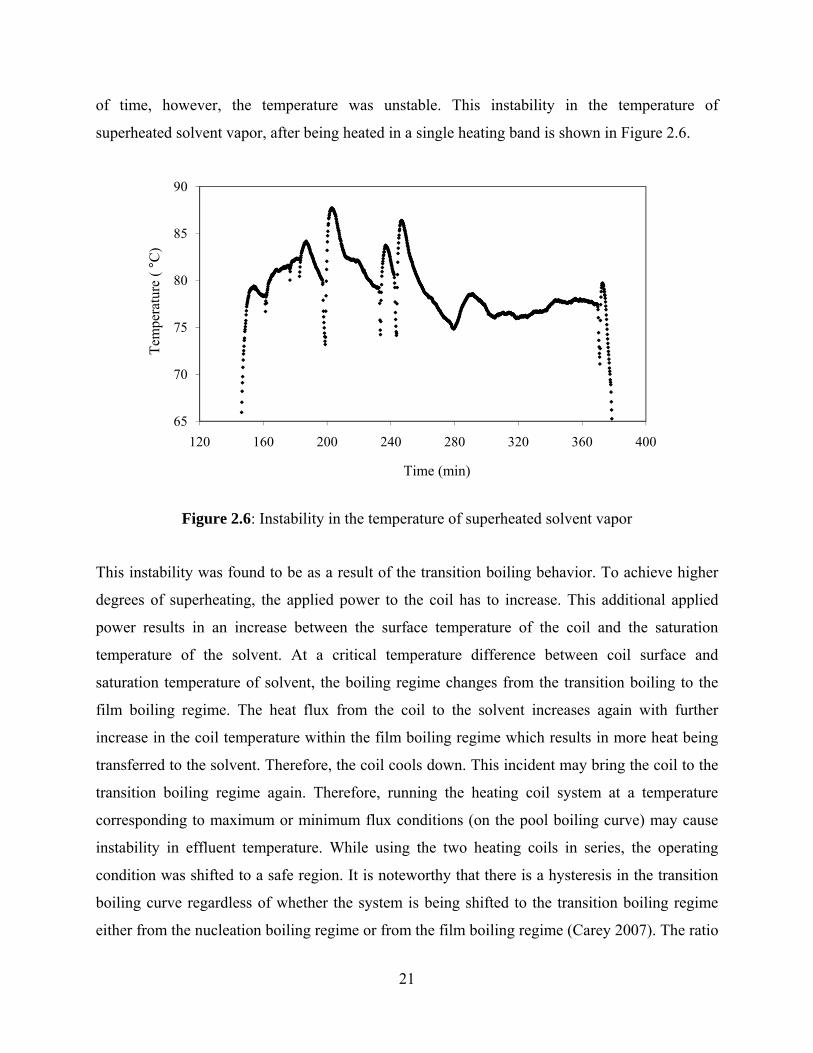
21
of time, however, the temperature was unstable. This instability in the temperature of
superheated solvent vapor, after being heated in a single heating band is shown in Figure 2.6.
Figure 2.6: Instability in the temperature of superheated solvent vapor
This instability was found to be as a result of the transition boiling behavior. To achieve higher
degrees of superheating, the applied power to the coil has to increase. This additional applied
power results in an increase between the surface temperature of the coil and the saturation
temperature of the solvent. At a critical temperature difference between coil surface and
saturation temperature of solvent, the boiling regime changes from the transition boiling to the
film boiling regime. The heat flux from the coil to the solvent increases again with further
increase in the coil temperature within the film boiling regime which results in more heat being
transferred to the solvent. Therefore, the coil cools down. This incident may bring the coil to the
transition boiling regime again. Therefore, running the heating coil system at a temperature
corresponding to maximum or minimum flux conditions (on the pool boiling curve) may cause
instability in effluent temperature. While using the two heating coils in series, the operating
condition was shifted to a safe region. It is noteworthy that there is a hysteresis in the transition
boiling curve regardless of whether the system is being shifted to the transition boiling regime
either from the nucleation boiling regime or from the film boiling regime (Carey 2007). The ratio
65
70
75
80
85
90
120 160 200 240 280 320 360 400
Tem
pera
ture
( °
C)
Time (min)

22
of the heat flux in the former to that of the latter is a function of the advancing and receding
contact angles of pentane on copper. So in case there is a big difference in the advancing and
receding contact angles, the heat flux transferred to the solvent will then be significantly affected
by the contact angle hysteresis, and may impose temperature instability. During the transition
state from the nucleation boiling to the transition boiling regime the contact angle is close to the
receding contact angle of pentane on copper; this contact angle would be close to the advancing
contact angle during the transition from the film boiling to the transition boiling regime (Carey
2007). Luckily, the experimental data of boiling curve for the copper and n-pentane was found in
the literature (Berenson 1960). This boiling curve for the copper–pentane system is shown in
Figure 2.7. In this figure the heat flux from a heated copper plate transporting to the surrounding
fluid is plotted against the temperature difference between the copper surface-temperature and
the fluid saturation temperature, at the prevailing pressure. This boiling curve exhibits a
hysteresis because of different wetting characteristics provided by the clean and the oxidized
copper surface. The oxidized surface is better wetted by n-pentane than the clean surface (Carey
2007); therefore, the minimum heat transfer flux is higher for this case. In addition, when
lowering the temperature of the hot surface in the film boiling regime, this minimum flux occurs
first for the surface with some oxidation which exhibits better wetting conditions.
Figure 2.7: The pool boiling curve for pentane, and heated copper surface (Berenson 1960)
5,000
50,000
500,000
5 50 500
Hea
t fl
ux (
W/m
2 )
Tw-Tsat (°C)
Clean Some Oxidation

23
2.4.2 The effect of temperature and solvent concentration on the viscosity of bitumen and
heavy oil
The physical properties of the Cold Lake bitumen used are summarized in Table 2.2. These
properties were used for the calculation of solvent-oil viscosity.
Table 2.2: The physical properties of the Cold Lake bitumen
SAPA Analysis S A P A
Wt. Fraction 0.224 0.308 0.294 0.174
Density Temperature (°C)
15 22 40 70
gcm 1.012 1.001 0.997 0.978
Viscosity Temperature (°C)
10.9 20.2 29.9 39.5 49.0 58.6 68.1 77.6 87.1
µ (cP) 1850000 350167 81006 22788 8625 3477 1568 777.6 420.7
The viscosity mixing rule proposed by Shu is conventionally used to correlate the viscosity of
bitumen-solvent mixture (Shu 1984). This correlation is more accurate when the viscosity of oil
is sufficiently high (i.e., µ>10000 cP). A modified Arrhenius mixture viscosity model was
proposed by Ledere in the following form (Ledere 1933):
ln ( 2.5)
in which, µ, µB and µS are the mixture viscosity, bitumen viscosity and solvent viscosity,
respectively; and xB is defined as (Shu 1984):
( 2.6)
in which, VB and VS are defined as the volume fraction of bitumen and solvent, respectively, and
is defined as (Shu 1984):
( 2.7)
In the above equation, is defined as (Shu, 1984):
24
17.04∆ . . . ( 2.8)
Where SGB and SGS represent the specific gravity of bitumen, and solvent, respectively, and SG
is defined as (Shu 1984):
( 2.9)
The viscosity-temperature relationship of the bitumen and heavy oil were measured by Hatch
Ltd, (2009) using Physica Modular Compact Rheometers (Anton Paar), as shown in Figure 2.8.
The Cold Lake bitumen viscosity was correlated to temperature in the form of:
( 2.10)
in which T is the applied temperature (°C) and µ is the viscosity of bitumen (cP). Using these
units, the parameters in Eq. ( 2.10) were obtained: a= (1.25879 ± 0.07850) 107 and b= 0.17596
± 0.00545. The viscosity of heavy oil was correlated to temperature by a power law correlation.
The density of the Cold Lake bitumen was measured in the temperature range of interest. The
temperature variation of the viscosity of the solvent (n-pentane) was obtained from Yaws (2003).
The modified Racket equation was used to model the density behavior of the solvent (Yaws
2003); the critical temperature of pentane, used in this correlation, was obtained elsewhere (Perry
and Green 2008). The density of water was described as a function of temperature by a cubic
polynomial (Alley 2006).

25
Figure 2.8: The temperature variation of the Cold Lake bitumen and Lloydminster heavy oil
The effect of solvent concentration on the viscosity of oil-solvent mixtures at 3 different levels of
temperature (36, 43 and 50 °C) is illustrated in Figure 2.9, for both the Cold Lake bitumen and
the Lloydminster heavy oil blend. It is interesting that the presence of 5% (by weight) pentane in
the Cold Lake bitumen, at any level of temperature, makes the bitumen behave like a heavy oil
(µ<5000 cP).
100
1,000
10,000
100,000
1,000,000
10,000,000
0 10 20 30 40 50 60 70 80 90
Vis
cosi
ty (
cP)
Temperature (C)
Cold Lake Bitumen
Lloydminster Heavy Oil
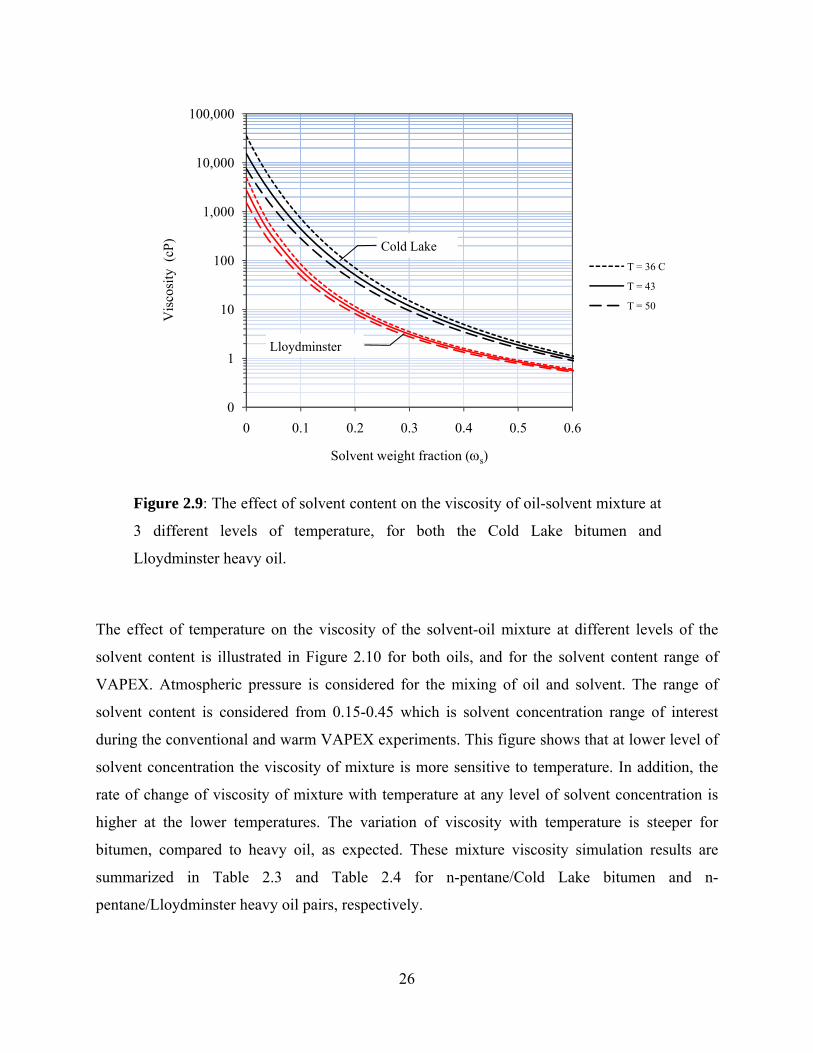
26
Figure 2.9: The effect of solvent content on the viscosity of oil-solvent mixture at
3 different levels of temperature, for both the Cold Lake bitumen and
Lloydminster heavy oil.
The effect of temperature on the viscosity of the solvent-oil mixture at different levels of the
solvent content is illustrated in Figure 2.10 for both oils, and for the solvent content range of
VAPEX. Atmospheric pressure is considered for the mixing of oil and solvent. The range of
solvent content is considered from 0.15-0.45 which is solvent concentration range of interest
during the conventional and warm VAPEX experiments. This figure shows that at lower level of
solvent concentration the viscosity of mixture is more sensitive to temperature. In addition, the
rate of change of viscosity of mixture with temperature at any level of solvent concentration is
higher at the lower temperatures. The variation of viscosity with temperature is steeper for
bitumen, compared to heavy oil, as expected. These mixture viscosity simulation results are
summarized in Table 2.3 and Table 2.4 for n-pentane/Cold Lake bitumen and n-
pentane/Lloydminster heavy oil pairs, respectively.
0
1
10
100
1,000
10,000
100,000
0 0.1 0.2 0.3 0.4 0.5 0.6
Vis
cosi
ty (
cP)
Solvent weight fraction (s)
T = 36 C
T = 43
T = 50
Cold Lake
Lloydminster
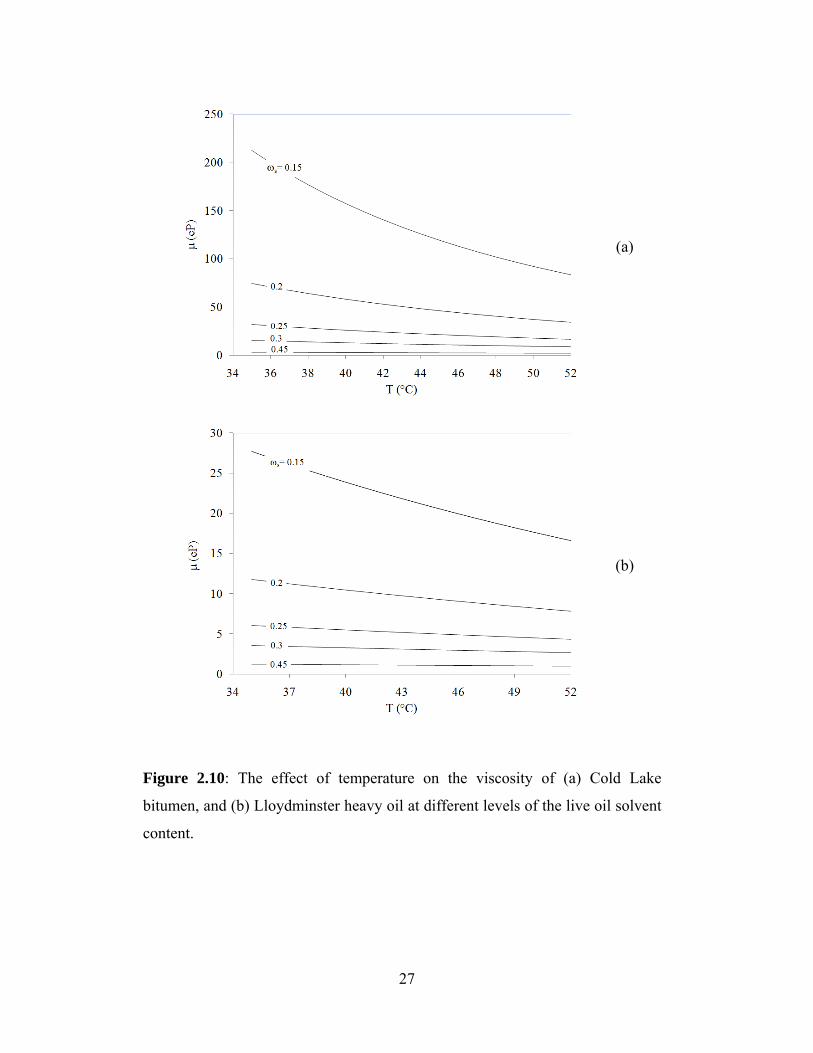
27
(a)
(b)
Figure 2.10: The effect of temperature on the viscosity of (a) Cold Lake
bitumen, and (b) Lloydminster heavy oil at different levels of the live oil solvent
content.
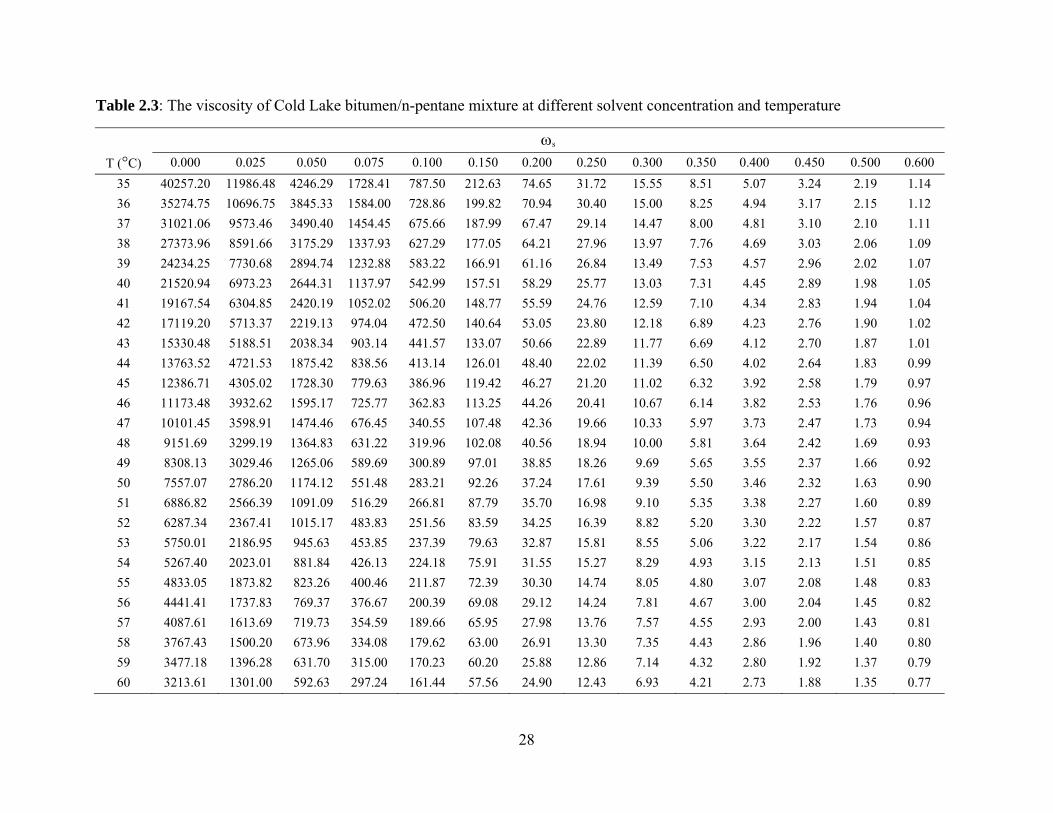
28
Table 2.3: The viscosity of Cold Lake bitumen/n-pentane mixture at different solvent concentration and temperature
s
T (°C) 0.000 0.025 0.050 0.075 0.100 0.150 0.200 0.250 0.300 0.350 0.400 0.450 0.500 0.600
35 40257.20 11986.48 4246.29 1728.41 787.50 212.63 74.65 31.72 15.55 8.51 5.07 3.24 2.19 1.14
36 35274.75 10696.75 3845.33 1584.00 728.86 199.82 70.94 30.40 15.00 8.25 4.94 3.17 2.15 1.12
37 31021.06 9573.46 3490.40 1454.45 675.66 187.99 67.47 29.14 14.47 8.00 4.81 3.10 2.10 1.11
38 27373.96 8591.66 3175.29 1337.93 627.29 177.05 64.21 27.96 13.97 7.76 4.69 3.03 2.06 1.09
39 24234.25 7730.68 2894.74 1232.88 583.22 166.91 61.16 26.84 13.49 7.53 4.57 2.96 2.02 1.07
40 21520.94 6973.23 2644.31 1137.97 542.99 157.51 58.29 25.77 13.03 7.31 4.45 2.89 1.98 1.05
41 19167.54 6304.85 2420.19 1052.02 506.20 148.77 55.59 24.76 12.59 7.10 4.34 2.83 1.94 1.04
42 17119.20 5713.37 2219.13 974.04 472.50 140.64 53.05 23.80 12.18 6.89 4.23 2.76 1.90 1.02
43 15330.48 5188.51 2038.34 903.14 441.57 133.07 50.66 22.89 11.77 6.69 4.12 2.70 1.87 1.01
44 13763.52 4721.53 1875.42 838.56 413.14 126.01 48.40 22.02 11.39 6.50 4.02 2.64 1.83 0.99
45 12386.71 4305.02 1728.30 779.63 386.96 119.42 46.27 21.20 11.02 6.32 3.92 2.58 1.79 0.97
46 11173.48 3932.62 1595.17 725.77 362.83 113.25 44.26 20.41 10.67 6.14 3.82 2.53 1.76 0.96
47 10101.45 3598.91 1474.46 676.45 340.55 107.48 42.36 19.66 10.33 5.97 3.73 2.47 1.73 0.94
48 9151.69 3299.19 1364.83 631.22 319.96 102.08 40.56 18.94 10.00 5.81 3.64 2.42 1.69 0.93
49 8308.13 3029.46 1265.06 589.69 300.89 97.01 38.85 18.26 9.69 5.65 3.55 2.37 1.66 0.92
50 7557.07 2786.20 1174.12 551.48 283.21 92.26 37.24 17.61 9.39 5.50 3.46 2.32 1.63 0.90
51 6886.82 2566.39 1091.09 516.29 266.81 87.79 35.70 16.98 9.10 5.35 3.38 2.27 1.60 0.89
52 6287.34 2367.41 1015.17 483.83 251.56 83.59 34.25 16.39 8.82 5.20 3.30 2.22 1.57 0.87
53 5750.01 2186.95 945.63 453.85 237.39 79.63 32.87 15.81 8.55 5.06 3.22 2.17 1.54 0.86
54 5267.40 2023.01 881.84 426.13 224.18 75.91 31.55 15.27 8.29 4.93 3.15 2.13 1.51 0.85
55 4833.05 1873.82 823.26 400.46 211.87 72.39 30.30 14.74 8.05 4.80 3.07 2.08 1.48 0.83
56 4441.41 1737.83 769.37 376.67 200.39 69.08 29.12 14.24 7.81 4.67 3.00 2.04 1.45 0.82
57 4087.61 1613.69 719.73 354.59 189.66 65.95 27.98 13.76 7.57 4.55 2.93 2.00 1.43 0.81
58 3767.43 1500.20 673.96 334.08 179.62 63.00 26.91 13.30 7.35 4.43 2.86 1.96 1.40 0.80
59 3477.18 1396.28 631.70 315.00 170.23 60.20 25.88 12.86 7.14 4.32 2.80 1.92 1.37 0.79
60 3213.61 1301.00 592.63 297.24 161.44 57.56 24.90 12.43 6.93 4.21 2.73 1.88 1.35 0.77

29
Table 2.4: The viscosity of Lloydminster heavy oil/n-pentane mixture at different solvent concentration and temperature
s
T (C) 0 0.025 0.05 0.1 0.15 0.2 0.25 0.3 0.35 0.4 0.45 0.5 0.6
35 5418.25 1352.40 450.17 87.93 27.73 11.74 6.04 3.56 2.31 1.62 1.19 0.92 0.61
36 4966.11 1262.49 425.70 84.53 26.91 11.47 5.93 3.50 2.28 1.60 1.18 0.91 0.60
37 4554.57 1179.01 402.65 81.27 26.12 11.20 5.81 3.45 2.25 1.58 1.17 0.90 0.60
38 4179.42 1101.39 380.92 78.14 25.36 10.94 5.70 3.39 2.22 1.56 1.15 0.89 0.59
39 3837.00 1029.15 360.41 75.13 24.62 10.69 5.59 3.33 2.18 1.54 1.14 0.88 0.58
40 3524.10 961.86 341.04 72.23 23.89 10.44 5.48 3.28 2.15 1.52 1.13 0.88 0.58
41 3237.90 899.13 322.74 69.45 23.19 10.19 5.38 3.22 2.12 1.50 1.11 0.87 0.57
42 2975.87 840.62 305.43 66.77 22.51 9.95 5.27 3.17 2.09 1.48 1.10 0.86 0.57
43 2735.80 786.00 289.06 64.20 21.85 9.72 5.17 3.12 2.06 1.46 1.09 0.85 0.56
44 2515.69 735.00 273.57 61.71 21.20 9.49 5.07 3.07 2.03 1.44 1.08 0.84 0.56
45 2313.77 687.35 258.91 59.32 20.57 9.26 4.97 3.01 2.00 1.42 1.06 0.83 0.55
46 2128.44 642.81 245.03 57.02 19.96 9.04 4.87 2.96 1.97 1.40 1.05 0.82 0.55
47 1958.25 601.18 231.88 54.80 19.36 8.82 4.77 2.91 1.94 1.38 1.04 0.81 0.54
48 1801.92 562.26 219.42 52.66 18.78 8.61 4.68 2.86 1.91 1.37 1.03 0.80 0.54
49 1658.26 525.85 207.63 50.61 18.22 8.40 4.58 2.81 1.89 1.35 1.01 0.79 0.53
50 1526.21 491.79 196.45 48.62 17.67 8.20 4.49 2.77 1.86 1.33 1.00 0.79 0.53
51 1404.80 459.93 185.86 46.71 17.13 8.00 4.40 2.72 1.83 1.31 0.99 0.78 0.52
52 1293.15 430.11 175.82 44.87 16.61 7.81 4.31 2.67 1.80 1.29 0.98 0.77 0.52
53 1190.44 402.21 166.31 43.09 16.10 7.61 4.22 2.63 1.77 1.28 0.97 0.76 0.51
54 1095.96 376.11 157.30 41.38 15.61 7.43 4.14 2.58 1.75 1.26 0.95 0.75 0.51
55 1009.03 351.68 148.76 39.73 15.13 7.24 4.05 2.53 1.72 1.24 0.94 0.74 0.50
56 929.03 328.81 140.67 38.14 14.66 7.06 3.97 2.49 1.69 1.23 0.93 0.73 0.50
57 855.41 307.42 133.00 36.61 14.21 6.88 3.89 2.44 1.67 1.21 0.92 0.73 0.49
58 787.64 287.39 125.74 35.14 13.76 6.71 3.80 2.40 1.64 1.19 0.91 0.72 0.49
59 725.26 268.65 118.86 33.72 13.33 6.54 3.72 2.36 1.62 1.17 0.90 0.71 0.48
60 667.84 251.12 112.34 32.35 12.91 6.37 3.64 2.31 1.59 1.16 0.88 0.70 0.48
30
2.4.3 Conventional and warm VAPEX processes
2.4.3.1 Oil production history
During the VAPEX experiments, the model was allowed to reach steady-state temperature before
starting the solvent injection, to avoid massive solvent condensation near the injection region as
a result of temperature gradient between the superheated solvent and the cold model surfaces.
The sampling was started after about 1 cm of the model was swept to avoid the near wellbore
effects. As a result, only the steady-state oil production rates were investigated, as they
contribute the most to the production history of a VAPEX process. We define live oil as the
mobilized produced oil which is a solution of oil and solvent; dead oil is defined as the solvent-
free oil after heating the live oil in the oven at a temperature of 52 °C. The oil sample taken from
the saturation vessel is called virgin oil.
The cumulative weight of produced live oil samples was monitored and was plotted for each
experiment. As an example, Figure 2.11 shows the cumulative live oil production plot for a set of
conventional and warm VAPEX experiments using Cold Lake bitumen, conducted at BT2
media. This set of experiments compares the cumulative production of the live oil from the
conventional VAPEX experiment to that of the warm VAPEX experiments conducted at 3
different levels of temperature at 36, 43 and 50 °C. The mid level temperature (43 °C) was
replicated as was discussed in the design of experiment. The cumulative plot from this
replication shows a very similar live oil production. For each trend shown in the Figure 2.11 the
time on the x-axis shows the sampling time not the process time. This figure shows that the
cumulative live oil productions have been fitted to a linear fit extremely well. This strong linear
correlation reveals that the live oil production rate during the experiments stays constant. For
experiment residual analysis was performed to check if the error residuals were well behaved.
For some of the experiments the outliers were deleted from the cumulative plot after matching
them with the observations made during the experiment—to make sure that there is a physical
rational for them. The statistical analysis of the experimental data was performed by
STATISTICA software (STATISTICA 2009).

31
Figure 2.11: Cumulative live oil production versus sampling time in an
experimental set for the case of Cold Lake bitumen, at the high level of
permeability (BT2), as a function of temperature.
The instantaneous live and dead oil productions were transformed into a cumulative basis. The
overall production rate was obtained from the slope of the straight line fit to this cumulative plot.
Figure 2.12 shows the live oil production rates (in grams per minute, per centimeter width of the
model) for the case of Cold Lake bitumen at the high (BT2) and low (BT3) permeability levels
as a function of solvent temperature (36, 43 and 50 °C). At each permeability level and oil type,
a baseline experiment (i.e., the conventional VAPEX process) was also performed for
comparison purpose. In the baseline experiment, the housing temperature was set slightly higher
than the dew point temperature of solvent vapor, at the corresponding operating pressure, to
ensure that the solvent is not condensing in the model as a result of heat loss. Throughout this
paper the solid-filled circles and the solid-filled triangles consistently represent the results of the
conventional VAPEX (i.e., the baseline) experiments while the open circles and triangles
0
20
40
60
80
100
120
140
160
180
0 20 40 60 80 100 120 140 160
Cum
. liv
e oi
l pro
duct
ion
(g)
Time (min)
Conventional T=36 T=43 T=43 T=50

32
represent the warm VAPEX experimental results. It is observed in Figure 2.12 that there is a
substantial increase in the live oil production rate from the conventional VAPEX to the warm
VAPEX experiments at 36 °C. This increase in the live oil production rate is a result of solvent
condensation upon the heat loss, as well as enhanced oil production because of the convective
mass transfer behavior of liquid condensate flowing on the interface of bitumen (James 2009;
James et al. 2008). Furthermore, this increase in the live oil production rate was experienced for
both permeability levels. The increase in the live oil production rate was also observed at the
mid-level temperature (43 °C) in which the live oil production rate was increased by more than
40% at both permeability levels. However, at the maximum temperature level (50 °C) the
production rate of live oil during the warm VAPEX process dropped even below that of the
baseline process at both levels of permeability. This reduction in the live oil production rate can
be explained by lower extent of solvent being condensed upon heat loss as well as by the lower
solubility value of pentane in the bitumen or, heavy oil at this elevated temperature.
Figure 2.12: The effect of solvent temperature and permeability of medium on
the live oil production rate during VAPEX process using Cold Lake bitumen.
The effect of oil type on the live oil production rate at a constant level of permeability (BT2) is
illustrated in Figure 2.13. This figure shows a similar trend for the live production rates versus
temperature for bitumen and heavy oil. The live oil production rates were always higher for the
lower viscosity oil at all levels of solvent temperatures. This behavior was expected because the
viscosity of the Cold Lake bitumen was about 7½ times of that of the Lloydminster heavy oil at
35 °C.
0.0
0.2
0.4
0.6
0.8
34 36 38 40 42 44 46 48 50 52
Qlo
(g
/min
.cm
)
Temperature,°C
BT2
BT3

33
Figure 2.13: The effect of oil type on the live oil production rates in the BT2
porous medium.
Figure 2.14 demonstrates the dead oil production rates for both oil types at low and high levels of
permeability and different temperature levels. As it was pointed out before, the dead oil
production rates were calculated after placing the live oil samples in a convection oven at a
temperature of 52 °C then flashing the solvent out of the live oil samples. We corrected the dead
oil analysis by accounting for the lighter fraction of the oil being evaporated at the oven
temperature. Figure 2.14(a) shows an increase in the dead oil production rates from the baseline
when the solvent was allowed to condense at the proximity of the solvent bubble point
conditions (i.e., at 36 °C). This increase in the oil production rate upon solvent condensation was
more pronounced in the lower permeability medium in which a 14% increase in the dead oil
production rate was observed, compared to an 8% increase in higher permeability medium. The
dead oil production rate was further increased at the mid-level temperature (43 °C) in which a
substantial increase in the production rate of oil was observed. At this temperature level the
improvement in the dead oil production rate (compared the baseline) was still higher in low
permeability medium in which a 66% increase in dead oil production rate was observed,
compared to a 56% increase in higher permeability medium. However, with further increase in
the temperature of solvent vapor to 50 °C the dead oil production rate was negatively affected by
superheating. At this elevated temperature level the produced oil was very viscous, as a result of
reduced solubility value of the solvent in the oil. The dead oil production rate was still higher
than that of the conventional VAPEX process at this temperature level in the high permeability
0.2
0.4
0.6
0.8
1.0
34 36 38 40 42 44 46 48 50 52
Qlo
(g/m
in.c
m)
Temperature (°C)
Heavy Oil
Bitumen
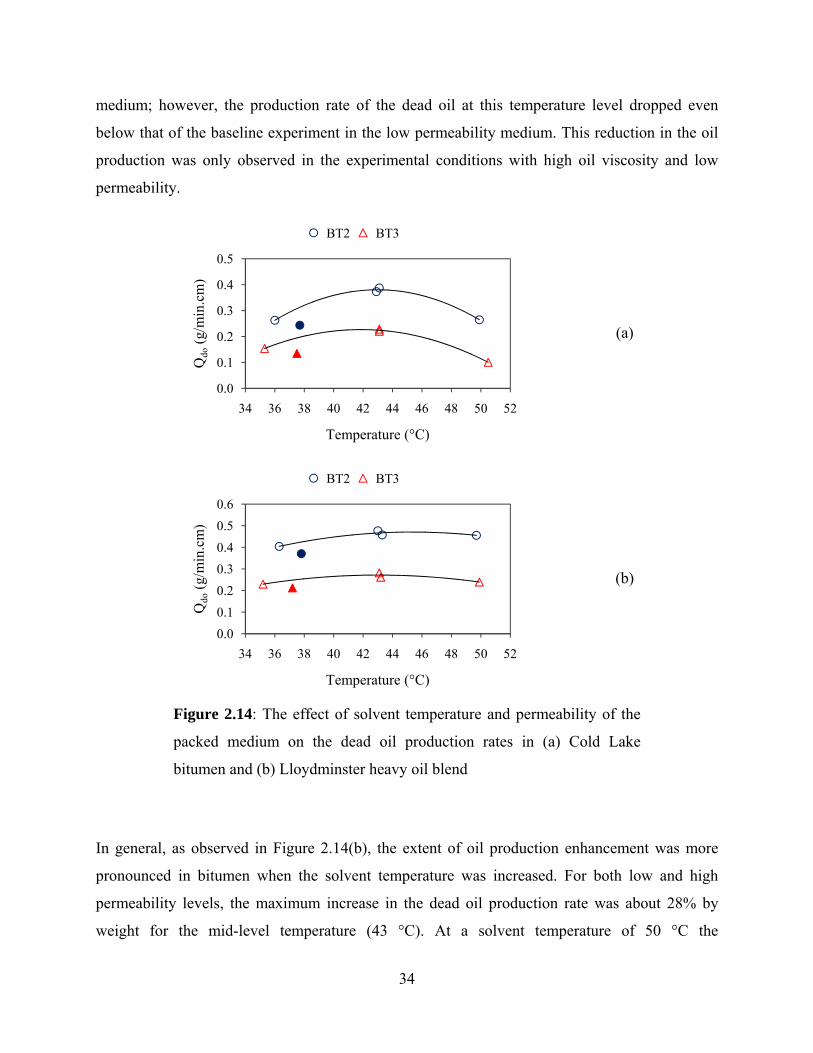
34
medium; however, the production rate of the dead oil at this temperature level dropped even
below that of the baseline experiment in the low permeability medium. This reduction in the oil
production was only observed in the experimental conditions with high oil viscosity and low
permeability.
In general, as observed in Figure 2.14(b), the extent of oil production enhancement was more
pronounced in bitumen when the solvent temperature was increased. For both low and high
permeability levels, the maximum increase in the dead oil production rate was about 28% by
weight for the mid-level temperature (43 °C). At a solvent temperature of 50 °C the
(a)
(b)
Figure 2.14: The effect of solvent temperature and permeability of the
packed medium on the dead oil production rates in (a) Cold Lake
bitumen and (b) Lloydminster heavy oil blend
0.0
0.1
0.2
0.3
0.4
0.5
34 36 38 40 42 44 46 48 50 52
Qdo
(g/m
in.c
m)
Temperature (°C)
BT2 BT3
0.0
0.1
0.2
0.3
0.4
0.5
0.6
34 36 38 40 42 44 46 48 50 52
Qdo
(g/m
in.c
m)
Temperature (°C)
BT2 BT3

35
Lloydminster heavy oil production rates were slightly higher than that of the conventional
VAPEX process at both permeability levels with the solvent requirement being about 60% lower.
The enhancement obtained by the warm VAPEX process would have been more pronounced if
the production rate was converted to volume basis, because the asphaltene precipitation lowers
the density of produced oil. Asphaltene precipitation occurs more severely in the warm VAPEX,
whereas in the conventional VAPEX process the precipitation is insignificant.
2.4.3.2 Solvent content and solvent-to-oil ratio
The solvent content of the produced oil was obtained by placing the live oil samples in the oven
at a temperature of 52 °C for about 2 days. The solvent content of the live oil was corrected,
accounting for the lighter components of the bitumen being evaporated in the oven along with
the solvent. Figure 2.15, shows the concentration of n-pentane in the produced live oil (in weight
percent) as a function of the solvent temperature. The solid-filled circles and triangles show the
solvent content of the live oil for the conventional VAPEX experiments (run1-4). For the
bitumen, the solvent content of the live oil decreased from about 54 percent by weight (in BT3)
at the lowest temperature level during the warm VAPEX to about 35% at the mid-level
temperature and to about 25% at the highest temperature level. The typical solvent content of the
live oil in the conventional VAPEX was about 42%. For Lloydminster heavy oil blend (Figure
2.15(b)) the solvent content decreased from about 45% at the lowest temperature limit (and,
BT3), to about 24% for the mid-level temperature and further reduced to about 15% at 50 °C.
The solvent content of the conventional VAPEX was about 40%. Therefore, the solvent
requirement of the VAPEX process substantially decreases with superheating.
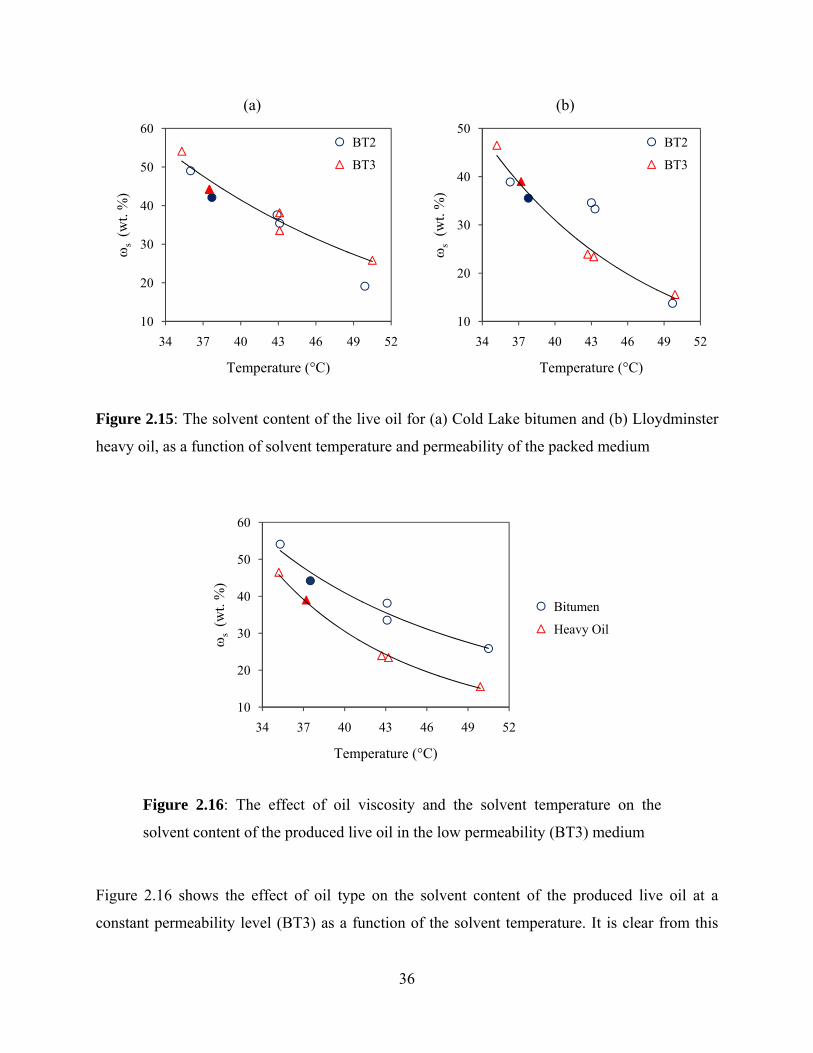
36
(a) (b)
Figure 2.15: The solvent content of the live oil for (a) Cold Lake bitumen and (b) Lloydminster
heavy oil, as a function of solvent temperature and permeability of the packed medium
Figure 2.16: The effect of oil viscosity and the solvent temperature on the
solvent content of the produced live oil in the low permeability (BT3) medium
Figure 2.16 shows the effect of oil type on the solvent content of the produced live oil at a
constant permeability level (BT3) as a function of the solvent temperature. It is clear from this
10
20
30
40
50
60
34 37 40 43 46 49 52
s
(wt.
%)
Temperature (°C)
BT2
BT3
10
20
30
40
50
34 37 40 43 46 49 52
s
(wt.
%)
Temperature (°C)
BT2
BT3
10
20
30
40
50
60
34 37 40 43 46 49 52
s
(wt.
%)
Temperature (°C)
Bitumen
Heavy Oil

37
figure that the Cold Lake bitumen demands higher solvent contents for attaining the live oil
conditions, compared to Lloydminster heavy oil. This higher solvent content in the bitumen is
resulted from the higher viscosity of bitumen compared to heavy oil.
The solvent-to-oil ratio (SOR) for both the conventional and warm VAPEX experiments is
shown in Figure 2.17, as a function of temperature and permeability of the packed medium, for
the Cold Lake bitumen. The weight basis solvent-to-oil ratio was obtained from the cumulative
solvent uptake versus the cumulative dead oil production data. The SOR is an important index in
the economics of the solvent-based heavy oil recovery processes. The warm VAPEX experiment
with moderate and high degrees of superheating show more attractive (lower) solvent-to-oil
ratios. However, moderate superheating appears to be more favorable in terms of higher oil
production rates. It appears that although the solvent content of the live oil was considerably
affected by the permeability of media, the SOR is not a strong function of permeability in the
warm VAPEX experiments.
Figure 2.17: The solvent-to-oil ratio for the Cold Lake bitumen as a function of
solvent temperature and permeability of medium
0.0
0.3
0.6
0.9
1.2
1.5
34 37 40 43 46 49 52
SO
R
Temperature (°C)
BT2
BT3

38
2.4.3.3 Temperature dependent solubility of nC5 in the Cold Lake bitumen
The decreasing trend of the solvent content of the produced live oil with temperature was
expected because the solubility of gas in a liquid usually decreases with increasing the system
temperature (Prausnitz et al. 1998). The solubility of normal pentane in the Cold Lake bitumen
was modeled using AspenPlus (2006). The bitumen was introduced as a 4 pseudo-component
mixture, including Saturates, Aromatics, Resins and Asphaltenes. The composition, molecular
weight, and specific gravity of each of these pseudo-components are tabulated in Table 2.5.
Table 2.5: The SARA analysis of the Cold Lake bitumen
Component Weight fraction† Mw* (g/mol) SG* at 25 °C
Saturates 0.194 378 0.874
Aromatics 0.381 424 0.994
Resins 0.267 825 1.022
Asphaltenes 0.158 1599 1.183
* Ref: Peramanu et al. 1999
† Ref: Alboudwarej et al. 2003

39
Figure 2.18: Cumulative weight percent of Cold Lake bitumen versus true boiling point
temperature
Figure 2.19: C-100 hydrocarbon analysis for Cold Lake bitumen
0
1
10
100
100 200 300 400 500 600 700 800
Cum
. wt.%
Tb (°C)
0
10
20
30
40
50
60
70
80
90
100
0 5 10 15 20 25 30 35 40 45 50 55 60
Cum
. wt.%
C-Number
40
High temperature simulated distillation (ASTM D5307) and also the C-100 hydrocarbon
analyses for the Cold Lake bitumen were performed by Maxxam Analytics Inc., 2006. These
tests were employed for defining the oil to the simulator. Figure 2.18 shows the results for
boiling point temperature of different cuts of the bitumen in a cumulative basis. The results for
C-100 cumulative hydrocarbon analysis are shown in Figure 2.19.
To obtain the solvent fraction of the live oil at the solubility limit, a proper activity coefficient
should be employed. Activity coefficients are comprised of two conventional parts:
combinatorial and residual. The combinatorial part mainly accounts for the non-ideality
associated with the size and shape of the molecules, while the residual part accounts for the
interaction between groups (Voutsas et al. 1995). The interaction between groups can be safely
removed for the system of alkane mixtures (Kontogeorgis et al. 1997). Therefore, most activity
coefficient models simply account for the combinatorial effects of the alkane mixtures. Parcher
et al. (1975) investigated the activity coefficient of nC5 in a mixture of heavier alkanes (nC20-36)
at infinite dilution conditions. Kniaź (1991) also studied the activity coefficient of nC5 in a
mixture of n-C16-28 at the infinite dilution state. Based on these experimental results, the modified
UNIFAC and free-volume based activity coefficient models were found to successfully predict
the activity coefficient of a short-chain molecule, such as n-pentane, in a mixture of long-chain
alkanes (Voutsas et al. 1995; Kontogeorgis et al. 1997).
The UNIFAC-FV activity coefficient model (Oishi and Prausnitz 1978), Sanchez-Lacombe
(1976) equation of state and Peng–Robinson (1976) equation of state were used to estimate the
solubility of nC5 in the Cold Lake bitumen. The effect of temperature on the solubility of n-
pentane in the bitumen (at atmospheric pressure) is illustrated in Figure 2.20. The SL model is
based on the lattice theory for the liquid phase, accommodating holes in the lattice to account for
the compressibilities. The experimental solvent content data of nC5 in the live oil, collected
during the VAPEX experiments, is also plotted along with the calculated solubility data for
comparison. The solubilites predicted by PR and UNIFAC-FV models behave very similarly,
with the PR equation estimating slightly higher solubility values than the UNIFAC-FV. The SL
model predicts a much slower rate of change in the solubility of the solvent in the oil with

41
temperature, as observed in Figure 2.20. Surprisingly, the SL model could, more or less, match
the solvent content data with temperature during the warm VAPEX experiments.
Figure 2.20: The effect of temperature on the solubility of n-pentane in the Cold Lake bitumen
2.4.3.4 Residual oil analysis
The residual oil saturation analysis was performed at the end of each experiment when the model
was dismantled and samples of the beads with residual oil were collected, and analyzed. These
samples were placed in the oven at a temperature of 50 °C, allowing the solvent to flash out. The
oily beads were then re-weighed and thoroughly washed afterwards with toluene. The difference
in the weights of the sample equals to the weight of the residual oil, plus the weight of oil flashed
in the oven. The density of the dead oil samples was used to convert the residual oil in the
packing to a volume basis. The washed beads were then dried and weighed. This weight of beads
was converted to pore volume, knowing the porosity of the beads (in the packed column) and the
density of beads. The density of BT2 and BT3 glass beads was measured to be 2.448±0.015 and
2.466±0.008 (g/cm3), respectively. The porosity of the packed column was measured to be 0.371
0
0.1
0.2
0.3
0.4
0.5
0.6
0.7
0.8
0.9
1
34 37 40 43 46 49 52
s
(wt.
%)
Temperature (°C)
ws, BT3
ws, BT2
UNIFAC-FV
Peng-Robinson
Sanchez-Lacombe
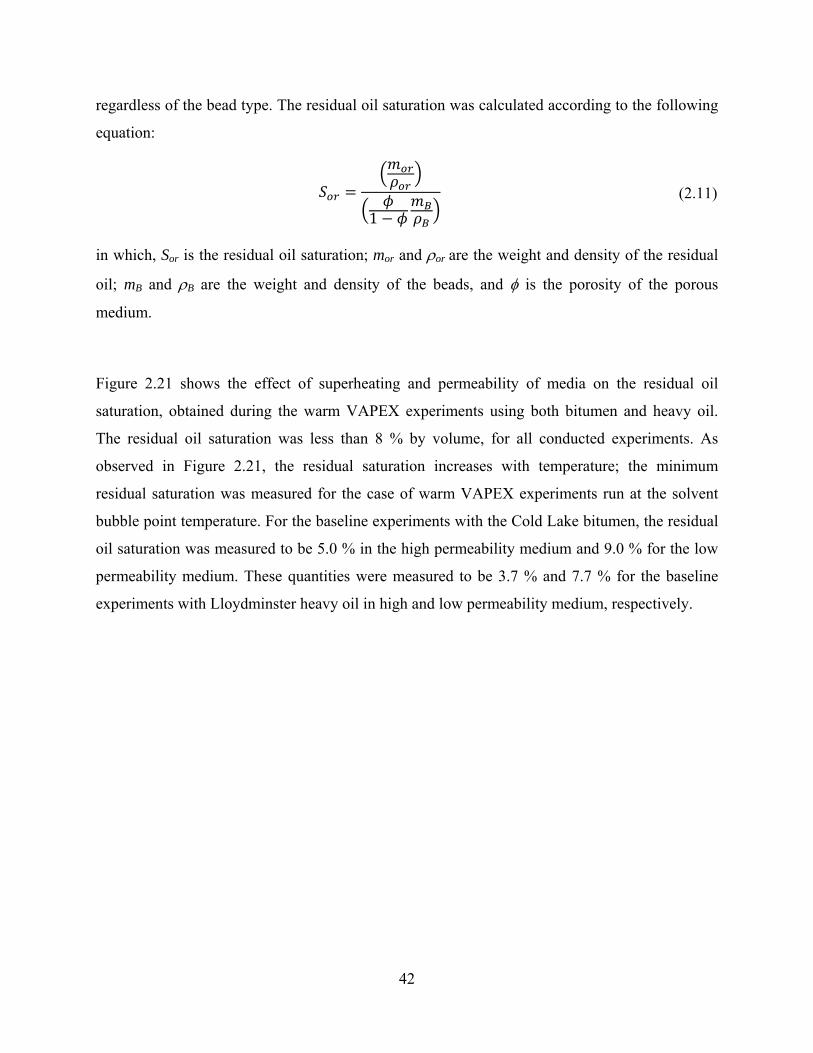
42
regardless of the bead type. The residual oil saturation was calculated according to the following
equation:
1
( 2.11)
in which, Sor is the residual oil saturation; mor and or are the weight and density of the residual
oil; mB and B are the weight and density of the beads, and is the porosity of the porous
medium.
Figure 2.21 shows the effect of superheating and permeability of media on the residual oil
saturation, obtained during the warm VAPEX experiments using both bitumen and heavy oil.
The residual oil saturation was less than 8 % by volume, for all conducted experiments. As
observed in Figure 2.21, the residual saturation increases with temperature; the minimum
residual saturation was measured for the case of warm VAPEX experiments run at the solvent
bubble point temperature. For the baseline experiments with the Cold Lake bitumen, the residual
oil saturation was measured to be 5.0 % in the high permeability medium and 9.0 % for the low
permeability medium. These quantities were measured to be 3.7 % and 7.7 % for the baseline
experiments with Lloydminster heavy oil in high and low permeability medium, respectively.
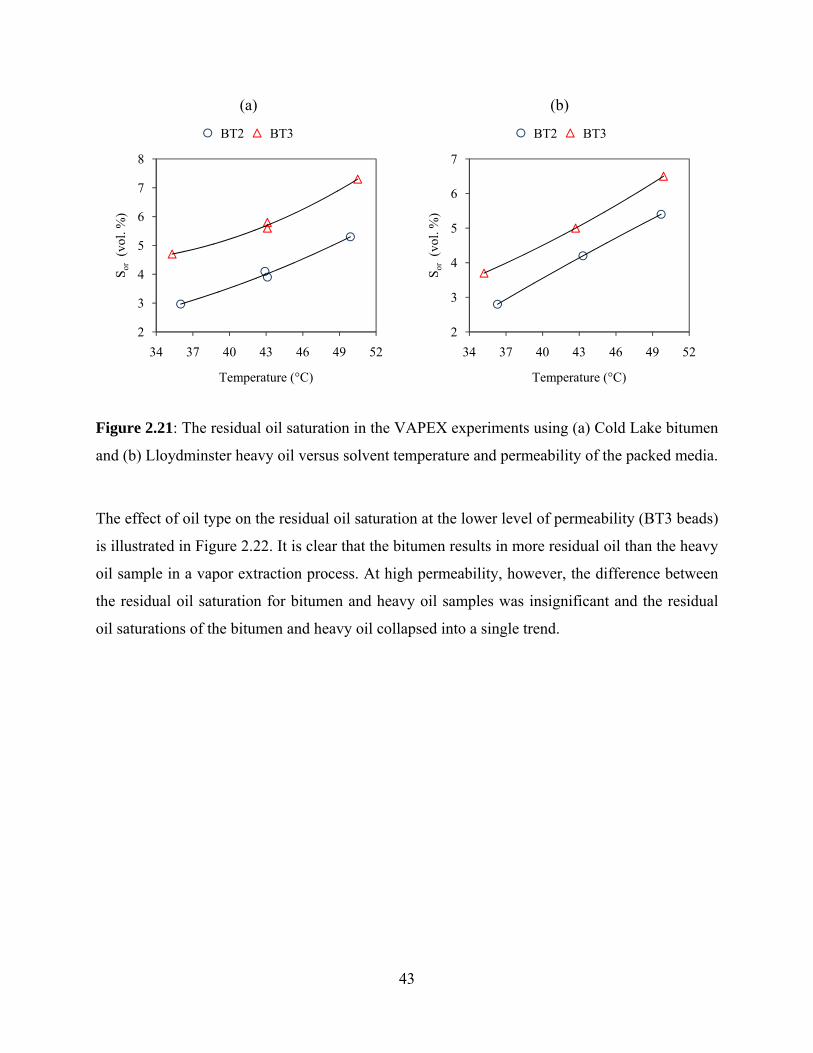
43
(a) (b)
Figure 2.21: The residual oil saturation in the VAPEX experiments using (a) Cold Lake bitumen
and (b) Lloydminster heavy oil versus solvent temperature and permeability of the packed media.
The effect of oil type on the residual oil saturation at the lower level of permeability (BT3 beads)
is illustrated in Figure 2.22. It is clear that the bitumen results in more residual oil than the heavy
oil sample in a vapor extraction process. At high permeability, however, the difference between
the residual oil saturation for bitumen and heavy oil samples was insignificant and the residual
oil saturations of the bitumen and heavy oil collapsed into a single trend.
2
3
4
5
6
7
8
34 37 40 43 46 49 52
Sor
(vol
. %)
Temperature (°C)
BT2 BT3
2
3
4
5
6
7
34 37 40 43 46 49 52
Sor
(vol
. %)
Temperature (°C)
BT2 BT3

44
Figure 2.22: The effect of oil type and solvent temperature on the residual oil
saturation in the low permeability (BT3) media during warm VAPEX experiments
2.4.3.5 Asphaltene precipitation analysis
As mentioned earlier, the warm VAPEX process provides a promising feature for the in-situ
upgrading—upon asphaltene precipitation. Although it was believed that asphaltene precipitation
occurs in the conventional VAPEX process (Mokrys and Butler 1993; Bulter and Mokrys 1998;
Das 1998; Das and Butler 1998; Oduntan 2001; Yazdani and Maini 2005; Moghadam et al.
2009), we did not observe an appreciable amount of asphaltene precipitation in the conventional
VAPEX experiments (Runs 1-4). In a series of pore-scale visual investigations of the
conventional VAPEX process in glass-etched micromodels of capillary networks, using
hydrocarbons such as propane, n-butane and n-pentane, the asphaltene precipitation was not
observed under controlled surrounding temperature (Chatzis 2002; James 2003; James 2009;
James et al. 2008). The controlled surrounding temperature was provided to avoid solvent
condensation occurring in the model as a result of heat loss to the environment. It was found that
when the bitumen comes in contact with the liquid solvent, asphaltene precipitation occurs at the
interface where the concentration of solvent is highest. In an experiment by James (2009) the
VAPEX experiment was conducted at two different modes of operation, namely, non-condensing
and condensing solvent modes. It was observed that when the solvent vapor was allowed to
3
4
5
6
7
8
34 37 40 43 46 49 52
Sor
(vol
. %)
Temperature (°C)
Heavy Oil Bitumen

45
condense in the micromodel, the solid particles of asphaltenes were clearly visible—precipitating
in the model—while there was no solid precipitation during the conventional VAPEX process
(James 2009; James et al. 2008). Ramakrishnan also reported no asphaltene precipitation during
the VAPEX experiments in a packed column, using propane (Ramakrishnan 2003).
Asphaltene precipitation occurred mostly in the warm VAPEX experiments. The glass beads
were bounded together with the asphaltene (solid) precipitates, especially near the solvent
injection tube where the solvent was introduced first. The same observation was made by Chatzis
during the pore-scale visual investigation of the VAPEX process in glass-etched capillary
networks, using butane as the solvent (Chatzis 2002). He observed no asphaltene precipitation in
the body of micromodel, but rather partial de-asphalting was observed at the injection face
(Chatzis 2002). This intense de-asphalting near the injection well can be explained by the fact
that a decrease in pressure, followed by a decrease in temperature, especially at the proximity of
the solvent bubble point conditions, influences the onset of solid precipitation from the bitumen-
solvent solution through a physicochemical instability mechanism (Speight 2001). This intense
precipitation resulted in production blockage in some of our experiments, especially for those
conducted at the bubble point conditions. The solvent vapor may encounter a phase change to
liquid solvent because of either heat losses or pressure drop in the tubing (e.g., valves).
For quantitative asphaltene precipitation measurements the solvent-free produced oil samples
(dead oil) were analyzed after the solvent was flashed out of the live oil samples in the oven. The
asphaltene fraction of bitumen was measured using a protocol roughly similar to ASTM D2006
method. N-pentane was used in excess (50 ml precipitant/g oil) to precipitate the asphaltene
fraction (solid) of the bitumen. The solid phase was filtered from the diluted bitumen phase
using a No.1 Whatman filter, having particle retention of 11 µm. The asphaltene precipitation
yield does not change with the composition of the precipitant if the solvent is provided well in
excess. As an example, the yield of asphaltene precipitation from both Lloydminster heavy oil
and Cold Lake bitumen by normal pentane was found to be constant for the solvent-to-oil ratios
greater than or equal to 5 wt/wt (Alboudwarej 2003). We measured the total precipitated phase
which not only included the asphaltenes but also the heavy metals. However, the concentration

46
of heavy metals was not significant to the extent of experimental accuracy. A total amount of
350 µg heavy metals/g oil were found in the Cold Lake bitumen, of which vanadium and nickel
contributed the most with concentrations of 243 and 86 µg/g oil, respectively. It is believed that
n-pentane precipitates up to 95% of the vanadium with a substantial reduction in the
concentration of iron and nickel (Speight 2001).
A total number of 20 live oil samples were collected for each warm VAPEX experiment. We
blocked the variability involved in the asphaltene content analysis, originated from the variation
in samples solvent content, by randomly selecting 10 samples and collecting 3-5 g (0.3-0.5 g
from each sample) of the oil. A similar procedure was followed to collect a replicate sample. The
asphaltene contents of the dead oil samples for both the Cold Lake bitumen and Lloydminster
heavy oil blend are shown in Figure 2.23, in which the average of two replicates are shown. This
figure shows that the asphaltene content of the dead oil (Ado) during the warm VAPEX
experiment increases with temperature for both the bitumen and heavy oil. This increase in the
asphaltene content of the produced dead oil can be translated to a decrease in the extent of
upgrading upon asphaltene precipitation. This reduction was expected because the increase in
temperature causes an increase in the solubility of asphaltene fractions of the heavy oil in the oil-
solvent-solid solution (Prausnitz et al. 1998). Therefore, the solution is able to hold the
asphaltene molecules better at higher temperatures.

47
(a) (b)
Figure 2.23: The asphaltene content of the produced dead oil in (a) Cold Lake bitumen and (b)
Lloydminster heavy oil as a function of solvent temperature and permeability of the packed
medium.
A solid component like asphaltene, may exist in the solid phase if the fugacity of that component
in the liquid solution is greater than or equal to that of the pure solid phase at the temperature and
pressure of the system. At the onset of precipitation these two fugacities must be equal. The
following equation describes the conditions for the solubility of a solute (e.g., asphaltene) in the
liquid solution (e.g., a solution of bitumen, solvent and asphaltene), at equilibrium neglecting
pressure effects (Firoozabadi 1999):
ln, ,
, ,ln
, ,
, ,
∆ 1 1 ∆1
∆
( 2.12)
In the above equation, , , , , , are the fugacities of pure component i, in the
pure solid state, and pure subcooled liquid state (a hypothetical state) at liquid solution
13
14
15
16
17
18
19
34 37 40 43 46 49 52
A
do(w
t. %
)
Temperature (°C)
BT2
BT3
13
14
15
16
17
18
19
34 37 40 43 46 49 52
A
do(w
t. %
)Temperature (°C)
BT2
BT3

48
temperature, respectively; , are the mole fraction of component i in the solid and liquid
solutions, respectively; , , , , , are the activity coefficient of component i in the
solid and liquid solution states; ∆ is the enthalpy of fusion of component i; is the melting
temperature of component i; ∆ is the heat capacity of fusion; and R is the universal gas
constant. The activity coefficient of asphaltene in the liquid solution, for low asphaltene
concentration, can be estimated from Scatchard-Hildebrand solubility theory. This activity model
has to be coupled with Flory-Huggins theory to account for the entropy changes upon mixing, for
the mixture of relatively large molecules of asphaltene being dissolved in the liquid solution
(Yarranton and Masliyah 1996).
Eq. ( 2.12) can be simplified by considering that the solute solution phase is ideal (Firoozabadi
1999). This will result in considering the activity coefficient of asphaltene to be unity. In
addition, if the precipitate is mainly asphaltene, then the mole fraction of asphaltene in the solid
phase can be approximated to be unity as well when the solubility of solvent in the solid is
negligible (Rousseau 1987). This assumption might be violated if the heavy metals and resins
also precipitate along with the asphaltene at a concentration comparable to that of the asphaltene
component. It is also a fair assumption to neglect the terms containing the specific heat of fusion
(Prausnitz et al. 1998). These simplifications change Equation. ( 2.12) to:
ln , ,∆ 1 1
( 2.13)
Equation ( 2.13) shows that an increase in temperature will result in an increase in the mole
fraction of asphaltene in the liquid solution phase ( . This means that the liquid solution can
dissolve the solute (asphaltene) better at higher temperatures. Therefore, the solid precipitates
less. Our experimental observations also qualitatively showed the same trend.
Figure 2.23(a) shows that with an increase in temperature the asphaltene content of the produced
dead oil increases which means that less asphaltene has been deposited in the model. In addition,
the rate of decrease in de-asphalting with temperature is very similar for both levels of
permeability. However, the lower permeability media results in a higher amount of asphaltene

49
precipitation in the porous medium. This permeability effect on the intensity of asphaltene
precipitation was also observed by others (Moghadam et al. 2009). The same observation was
made, in general, for the case of Lloydminster heavy oil blend, as depicted in Figure 2.23(b).
Again, the extent of asphaltene precipitation in the model was higher in the case of lower
permeability (BT3), just as the asphaltene content of the produced oil was higher in the case of
higher permeability (BT2). The decreasing rate of de-asphalting with temperature was not
appreciably affected by the permeability of media, as the two trends follow similar linear
approximations.
The high asphaltene content values in the dead oil for the case of Lloydminster were unexpected
because the amount of asphaltene in the virgin oil was as low as 13.0 percent by weight. The
reason for such high values of asphaltene concentration in the dead oil could be explained by the
fact that this oil blend contained more of the lighter hydrocarbons. Therefore, the lighter
hydrocarbons will also evaporate after being heated in the oven (at 52 °C) and this will change
the mass ratio of asphaltene over oil. The presence of n-pentane also accelerates the evaporation
of lighter components of the heavy oil. For example, the fraction of the virgin oil that evaporated
in the oven (at 52 °C) increased from 1.4 % (by weight) to 3.0 % in a sample in which 30% by
weight n-pentane was added to the virgin oil. These uncertainties prevented us from correcting
for the asphaltene content of the produced dead oil to account for the lighter fraction of the
Lloydminster heavy oil blend being evaporated in the oven.
The asphaltene content data shown in Figure 2.23 can be converted to the fraction of the total
asphaltene content of the oil deposited in the model. This information is very important as it
shows the practical potential of the process in removing the fraction of the oil which is of lesser
interest at this time. For this purpose, the initial asphaltene content of the Cold Lake bitumen was
measured to be 18.7% by weight. For the case of warm VAPEX experiments with Cold Lake
bitumen, 21.6 % of the total asphaltene content of the bitumen was deposited in the model at
lower level of permeability at 35 °C. This value was decreased to 13.2 %, and 4.8 % at 43 °C and
50 °C, respectively. For the higher permeability level (BT2 beads), 14.5 % of the asphaltene
content was precipitated at 35 °C. This value decreased to 6.4 % and 0.5 %, at 43 °C and 50 °C

50
respectively. The trend of asphaltene precipitation in the model for the case of Cold Lake
bitumen is shown in Figure 2.24.
Figure 2.24: The fraction of asphaltene content of the Cold Lake bitumen precipitated
in the model as a function of temperature and permeability of the packed medium.
Once again, the higher relative precipitation yield of the asphaltenes in the case of lower
permeability medium can be explained by the longer live oil residence time during the drainage
process in the porous medium. This longer residence time will also result in higher solvent
content of the produced live oil. Both the longer residence time and the higher solvent
concentration of the live oil favor the condition for more intense precipitation occurring in the
porous medium.
Figure 2.25 shows the effect of oil type on the asphaltene precipitation yield as a function of
temperature at the lower level of permeability. It is clear that for a fixed level of permeability,
both the Cold Lake bitumen and Lloydminster heavy oil blend exhibit similar trends of an
increase in asphaltene content of the produced oil (or a decrease in precipitation) when the
solvent temperature increases from 35 °C to 50 °C. It is evident that the asphaltene content of the
dead oil is higher for bitumen at all levels of temperature which is expected based on the higher
asphaltene concentration in the virgin oil.
0
5
10
15
20
25
34 37 40 43 46 49 52
% A
sp. c
onte
nt p
reci
pita
ted
Temperature (°C)
BT2
BT3

51
Figure 2.25: The effect of oil type on the asphaltene content of produced dead
oil as a function of solvent temperature at lower permeability level.
The asphaltene content of the Cold Lake bitumen was measured by both n-pentane and also n-
heptane under total reflux conditions (i.e., atmospheric pressure and the solvent bubble point
temperature). The asphaltene content of the feed was approximated at 18.7 percent by weight
with n-pentane as solvent. However, this value was approximated at 7.6 percent by weight when
n-heptane was used as solvent. Similar observations were reported by others (Firoozabadi 1999;
Speight 2001) in which the asphaltene content of a bitumen, precipitated by n-pentane and n-
heptane, were measured to be about 18 % and 10 % by weight, respectively. It is noteworthy that
the literature values for asphaltene content were measured at room temperature while they have
been measured at the solvent bubble point temperature in our work.
In summary, the results from all the experimental observations such as live oil and dead oil
production rates, solvent content of the produced live oil, asphaltene content of the produced
dead oil and also the residual oil saturation during VAPEX and warm VAPEX experiments are
summarized in Table 2.6.
12
13
14
15
16
17
18
19
34 37 40 43 46 49 52
A
do(w
t. %
)
Temperature (°C)
Bitumen
Heavy Oil
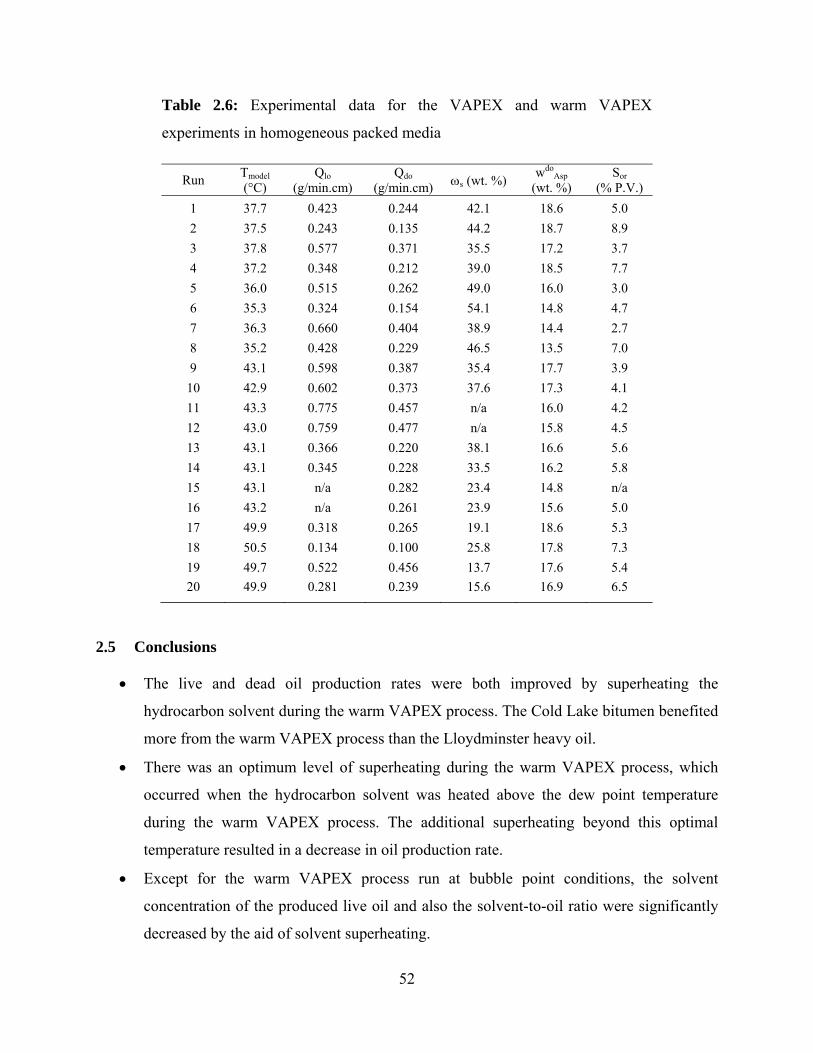
52
Table 2.6: Experimental data for the VAPEX and warm VAPEX
experiments in homogeneous packed media
Run Tmodel
(°C) Qlo
(g/min.cm) Qdo
(g/min.cm) s (wt. %) wdo
Asp (wt. %)
Sor (% P.V.)
1 37.7 0.423 0.244 42.1 18.6 5.0
2 37.5 0.243 0.135 44.2 18.7 8.9
3 37.8 0.577 0.371 35.5 17.2 3.7
4 37.2 0.348 0.212 39.0 18.5 7.7
5 36.0 0.515 0.262 49.0 16.0 3.0
6 35.3 0.324 0.154 54.1 14.8 4.7
7 36.3 0.660 0.404 38.9 14.4 2.7
8 35.2 0.428 0.229 46.5 13.5 7.0
9 43.1 0.598 0.387 35.4 17.7 3.9
10 42.9 0.602 0.373 37.6 17.3 4.1
11 43.3 0.775 0.457 n/a 16.0 4.2
12 43.0 0.759 0.477 n/a 15.8 4.5
13 43.1 0.366 0.220 38.1 16.6 5.6
14 43.1 0.345 0.228 33.5 16.2 5.8
15 43.1 n/a 0.282 23.4 14.8 n/a
16 43.2 n/a 0.261 23.9 15.6 5.0
17 49.9 0.318 0.265 19.1 18.6 5.3
18 50.5 0.134 0.100 25.8 17.8 7.3
19 49.7 0.522 0.456 13.7 17.6 5.4
20 49.9 0.281 0.239 15.6 16.9 6.5
2.5 Conclusions
The live and dead oil production rates were both improved by superheating the
hydrocarbon solvent during the warm VAPEX process. The Cold Lake bitumen benefited
more from the warm VAPEX process than the Lloydminster heavy oil.
There was an optimum level of superheating during the warm VAPEX process, which
occurred when the hydrocarbon solvent was heated above the dew point temperature
during the warm VAPEX process. The additional superheating beyond this optimal
temperature resulted in a decrease in oil production rate.
Except for the warm VAPEX process run at bubble point conditions, the solvent
concentration of the produced live oil and also the solvent-to-oil ratio were significantly
decreased by the aid of solvent superheating.

53
The potential of asphaltene precipitation in the model decreased when the extent of
solvent superheating increased during the vapor extraction process. No asphaltene
precipitation was observed in the porous medium when the potential of solvent
condensation was eliminated during the conventional VAPEX process.
The extent of residual oil saturation in the porous medium slightly increased with the
increase in temperature of the solvent vapor for both tested oil samples.
The heat loss from the oil-swept area to the surrounding decreased when the solvent
vapor was moderately superheated.
54
3 The Effect of Reservoir Wettability on the Production
Characteristics of the VAPEX Process
3.1 Overview
Based on pore-scale observations of the VAPEX process, the wettability of porous media plays a
profound role in the performance of this heavy oil recovery process through improved live oil
drainage by film-flow. The impact of fractional wettability on the production characteristics of a
VAPEX process at the macro-scale is investigated in this paper. Conventional VAPEX
experiments were conducted in a 220 Darcy random packing of glass beads in a rectangular
physical model, and n-pentane was used to recover the Cold Lake bitumen from the oil-saturated
model in the absence of connate water. The composition of the packed bed was altered from
completely water-wet to completely oil-wet conditions at different proportions of oil-wet beads
mixed with water-wet beads. A substantial increase (about 40%) in the production rate of live oil
was observed during the VAPEX process when the wettability of the porous packing was
entirely altered to oil-wet conditions. A critical oil-wet fraction of 0.66 was found for the
heterogeneous packing of water-wet and oil-wet beads of similar size distribution. Beyond this
critical composition, the live oil production rate was not affected by further increase in the
proportion of the oil-wet beads. It is believed that above this critical composition of the oil-wet
beads, the oil-wet regions dominate the film flow process as there will be a continuity of high
conductivity live oil films through the oil-wet regions, with thicker oil films between particles.
However, below this critical composition the live oil production rate increased linearly with the
fraction of the oil-wet beads in the packing. As the wetting condition of the oil-wet regions is in
favor of the live oil drainage compared to that of the water-wet regions, this improves the extent
of film flow drainage as well as enhances the rate of imbibition of the live oil from the oil-filled
pores to the vacated pores near the nominal VAPEX interface. These two factors enhance the
live oil production rate during the VAPEX process. The solvent content of the live oil, the
solvent-to-oil ratio (SOR), and the residual oil saturation did not correlate strongly with the
proportion of the oil-wet beads in the packing. The average solvent content of the live oil and the
residual oil saturation were measured to be 48% by weight and 7% by volume respectively.

55
3.2 Introduction
Wettability is defined as the relative tendency of two immiscible fluids to adhere to a solid
surface or spread on it (Craig 1971). For reservoir rocks, wettability is classified as either
homogeneous or heterogeneous. In the former case, the entire rock surface has a uniform affinity
for water or oil. In the latter case, which is more realistic in nature, the rock surface may exhibit
different wetting preferences at the microscopic (pore-level) or macroscopic scales. Depending
on the distribution of oil-wet and water-wet portions in terms of their continuity, heterogeneous
wettability is further categorized into two classes; fractional and mixed wettability. Fractional
wettability, as proposed by Brown and Fatt (1956), refers to the non-uniform wettability in which
the oil-wet and water-wet surfaces are randomly distributed throughout the reservoir rock. The
term mixed wettability describes a special case of fractional wettability in which the oil-wet
surfaces form a continuous path through the larger pores, and the water phase occupies the
smaller pores as well as the corners of the pore space (DiCarlo et al. 2000).
For many years, all oil reservoirs were considered to be strongly water-wet. The rational was that
the oil reservoirs have been formed by hydrocarbon migration into the pore spaces initially
occupied by brine. Moreover, it was assumed that even at the connate water saturation condition,
the strong preference of rock surface to the water phase prevents the oil phase from being in
direct contact with the rock surface through presence of some thin water films forming around
the grain particles (Anderson 1986). Nutting (1934) found that the wettability characteristics of
oil-bearing-pore surfaces could be altered to oil-wet through physical or chemical adsorption of
polar components in the oil that contain oxygen, nitrogen or sulfur. This mechanism is in fact the
basis for the development of oil reservoir rock surfaces which are heterogeneous in terms of their
wetting characteristics. Since then, extensive experimental and theoretical studies have been
carried out to investigate various properties of porous media with non-uniform wettability
conditions, such as capillary pressure (Brandford and Leij 1995; Motealleh 2009; Mirzaei 2010),
relative permeability (Dixit et al. 1998; DiCarlo et al. 2000), oil recovery (Vizika and Lombard
1996; Laroche et al. 1999; Parsaei and Chatzis 2008) and electrical properties (Morgan and
Pirson 1964). The results demonstrated that capillary pressure, relative permeability, oil recovery
factor and electrical properties of porous media are all strongly affected by the state under which

56
different fluids are distributed i.e., whether they spread in the form of film over the solid surfaces
or occupy the pore bodies of the reservoir rock as liquid blubs, which are determined by the
wettability characteristics of solid surfaces. In a non-uniformly-wetted porous media the pore-
scale mechanism of fluids flow varies from place to place, and hence the overall results deviate
from those of homogeneous water-wet porous media. For example, for gas-oil free-fall gravity
drainage process implemented in uniformly water-wet, uniformly oil-wet and fractionally-wet
media (Vizika and Lombard 1996), the drainage of oil is primarily occurred through the bulk
flow. Therefore, the water-wet porous medium yields the highest recovery factor since oil as the
non-wetting phase has access to the pathway of large pore bodies, corresponding to a larger oil
relative permeability. However, for the fractionally-wet porous media the oil relative
permeability is lower than that in the water-wet media, but less pore bodies are occupied by
water compared to the uniformly oil-wet media resulting in higher relative permeability
compared to the latter case. Consequently, the production curve for the fractionally-wet media
situates between the water-wet and oil-wet ones at the early stages of oil recovery. At the late
stage of oil recovery through free fall gravity drainage, however, the spreading film flow is the
dominant recovery mechanism and hence both the water-wet and fractional-wet cases show
similar performance in terms of the oil recovery factor.
The focus of studies involving wettability effects have been mainly on the impact of reservoir
wettability on conventional oil production characteristics. The occurrence of significant volumes
of heavy oil and bitumen resources deposited in the carbonate reservoirs, which fall into the
category of non-uniform wettability, and the difficulties involved in the thermal recovery
technologies within the carbonates motivate us to try the VAPEX process for heavy-oil
production from fractional-wet porous media. The viscous oil resources deposited in the
carbonates is estimated at about 2 trillion barrels, which accounts for about a quarter of overall
viscous oil resources (Dusseault and Shafiei 2010). Butler and Mokrys (1989) introduced Vapor
Extraction Process (VAPEX) as the solvent-analogue of the well-established Steam Assisted
Gravity Drainage (SAGD) process.
57
It is believed that the macro-scale performance of a typical displacement process through a
porous medium depends on the pertaining drainage mechanisms at the micro-scale. The pore-
scale aspects of the VAPEX process were systematically studied in the literature over the recent
years through the use of etched glass micromodels (Chatzis 2002; James 2003; James and
Chatzis 2004; James et al. 2008; James 2009). During these pore-scale investigations, it was
observed that the dilution of solvent is usually occurring within 1-3 pores at a time. Therefore,
the mass transfer occurs because of the diffusion of solvent into the oil as well as diffusion of
bitumen into the draining live oil. The mobilized live oil drains at the nominal vapor-bitumen
interface region through capillary drainage displacement as well as film-flow drainage
displacement mechanisms. The mobilized live oil could be drained in the form of narrow films
over the round surfaces of the solid particles within the porous structure. The mobilized oil left
behind in the invaded region of the pattern periodically forms closed-loop flow structures
involving thin films of live oil just ahead of the nominal VAPEX interface. If these films could
keep their inherent flow continuity over the limited distance of their extension, there would be a
possibility for these films to drain by-passed oil under the film-flow type of drainage mechanism.
This type of drainage displacement could also happen at the interfacial region of the VAPEX
process whose direct impact is to flatten out the peaks-and-valleys type of nominal VAPEX
interface to the extent at which an almost perfect vertical segregation line (i.e. surface) would be
observed between the solvent-invaded pores and those filled with the live oil draining over the
bitumen face (Chatzis 2002). Inspired by these pore scale observations, we attempted to
investigate the effect of the wettability of porous media on the performance of vapor extraction
process for recovery of bitumen. In this study, the effect of fractional wettability on the
production rates of the VAPEX process was investigated by varying the composition of oil-wet
beads in the packed column. All experiments were performed at 220 D random pack medium
using Cold Lake bitumen as the oil in place and n-pentane as the solvent.
3.3 Experimental Aspects
3.3.1 Experimental procedure for VAPEX experiments
The experiments were performed in a rectangular physical model as described earlier in Figure
2.1. The packing composition was obtained by randomly mixing known amounts (by weight) of

58
water-wet and oil-wet glass beads. The model was randomly packed with glass beads on a
vibrating bed to lower the variation caused by packing inconsistencies, which result in variations
in porosity and permeability. For all the experiments, BT3 type of glass beads was used. The
beads were sieved with 595–841 µm (20-30 mesh) sieve size to ensure a more uniform particle
size distribution as well as to avoid the presence of crushed beads in the packing. The porosity
and permeability of this random closely-packed medium was measured to be 37.1% and 220 D,
respectively. This porosity value is within the acceptable range of a random packing using a
vibrating bed (Jaeger and Nagel 1992; Song et al. 2008).
Initially, the packed model was saturated with Cold Lake bitumen. The saturation was performed
by heating the model and saturating vessel containing the oil to a moderate temperature
(approximately 60 °C), and then applying a 10 psig pressure to the saturation vessel so that the
oil enters into the packed model. All the models are saturated with oil in the absence of connate
water saturation. The bitumen-saturated model was then placed in an isothermal chamber of hot
air at a temperature slightly higher than the dew point temperature of the solvent at the operating
pressure (i.e. at 37 °C) to avoid solvent condensation occurring in the model. It is crucial to
eliminate the potential of solvent condensation during the conventional VAPEX experiments.
Drainage of solvent condensate on the bitumen interface increases the bitumen production rate
through a washing mechanism. Furthermore, direct contact of liquid solvent and bitumen may
also result in severe asphaltene precipitation at the bitumen-solvent interface (James et al. 2008;
James 2009).
The VAPEX experiments were conducted according to the process flow diagram illustrated in
Figure 2.2. Similarly, we utilized a free-uptake system in which the model was allowed to uptake
solvent freely. There were 5 thermocouples installed on the system measuring the temperature
of: injecting solvent, effluent solvent, live oil, solvent in the model and also the chamber. The
reservoir was allowed to reach a desired temperature of approximately 37 °C before solvent
injection, avoiding the solvent condensation at the model. During the spreading phase of the
VAPEX process whereby the solvent chamber had developed to the top of the porous medium,
we purposely allowed some oil production from the model before starting the regular sampling

59
procedure. The reason for this methodology was to allow the nominal bitumen-solvent interface
to move away from the gas injection tube, avoiding the uncertainties associated with the near-
wellbore drainage. The live oil samples were then taken every 7-10 minutes, depending on the
composition of the oil-wet beads in the packing. For a completely oil-wet medium, the samples
were taken every 7 minutes; this time interval was increased to 10 minutes for a completely
water-wet medium.
3.3.2 Wettability alteration
The wettability of glass beads was altered to oil-wet through the silylation process. During the
silylation process, the glass beads were soaked in a solution containing 5% by volume dri-film
(dichlorodimethylsilane) in n-hexane; the beads were later brought in contact with steam, and
then were dried in a convection oven at 250 °C (Holbrook and Bernard 1958). The mechanism
for wettability alteration was found to be as a result of reaction of dichlorodimethylsilane
(DCDMS) with the hydroxyl group on the silica surface. The hydrolytically stable attachment of
Si(CH3)2 group to the silica surface modifies the wettability of the silica surface to hydrophobic
(Rao et al. 2010). DCDMS is believed to react with the hydroxyl groups on the silica surface
both monofunctionally and difunctionally if the silanol groups on the surface are sufficiently
close to each other. The possible mechanisms suggested for this reaction are shown in Figure 3.1
(Hair and Tripp 1995):

60
(a)
(b)
Figure 3.1: The wettability alteration mechanism by reaction between
dichlorodimethylsilane (DCDMS) and the hydroxyl group on the silica surface (after Hair
and Tripp 1995)
(c)
Contact angle measurement is accepted as a universal measure of the wettability (Morrow 1990).
We performed contact angle measurements for the live oil-air system on the presence of glass
surface. The contact angle of live oil on both water-wet and oil-wet glass surfaces was measured
using Axisymmetric Drop Shape Analysis (ADSA) technique in the presence of air at room
conditions. The water-wet glass was treated with HCl followed by cleaning with methanol prior

61
to contact angle measurement. The oil-wet condition was attained by treating the water-wet glass
through the silylation process as discussed earlier. DCDMS was used to modify the surface
wettability of the commercial glasses. Both the water-wet and oil-wet contact angle tests were
replicated 10 times. The live oil mixture was made by mixing the Cold Lake bitumen and liquid
n-pentane at a composition of about 47% by weight solvent at room conditions. This
composition value was chosen because the average solvent content of the live oil during the
VAPEX experiment was measured at 47%. To make the oil-solvent mixture, the bitumen was
preheated in the oven to a temperature of 50 °C. The solvent was then added to the preheated
bitumen at a low flow rate while the bitumen was vigorously mixed. This mixing was essential to
avoid asphaltene precipitation occurring as a result of localized high liquid solvent concentration.
Figure 3.2 shows a snap shot of the contact angle measurements of the live oil-air system on the
solid surface of the water-wet and oil-wet glasses using the ADSA method.
Figure 3.2: Contact angle measurements for the live oil-air system on oil-wet and water-wet
glass surfaces
The average contact angle of the live oil on the water-wet and oil-wet glasses were measured to
be 65.6°± 4.4 and 44.4°± 2.3 respectively.
Live oil
Oil-wet glass Water-wet glass
Live oil
Air
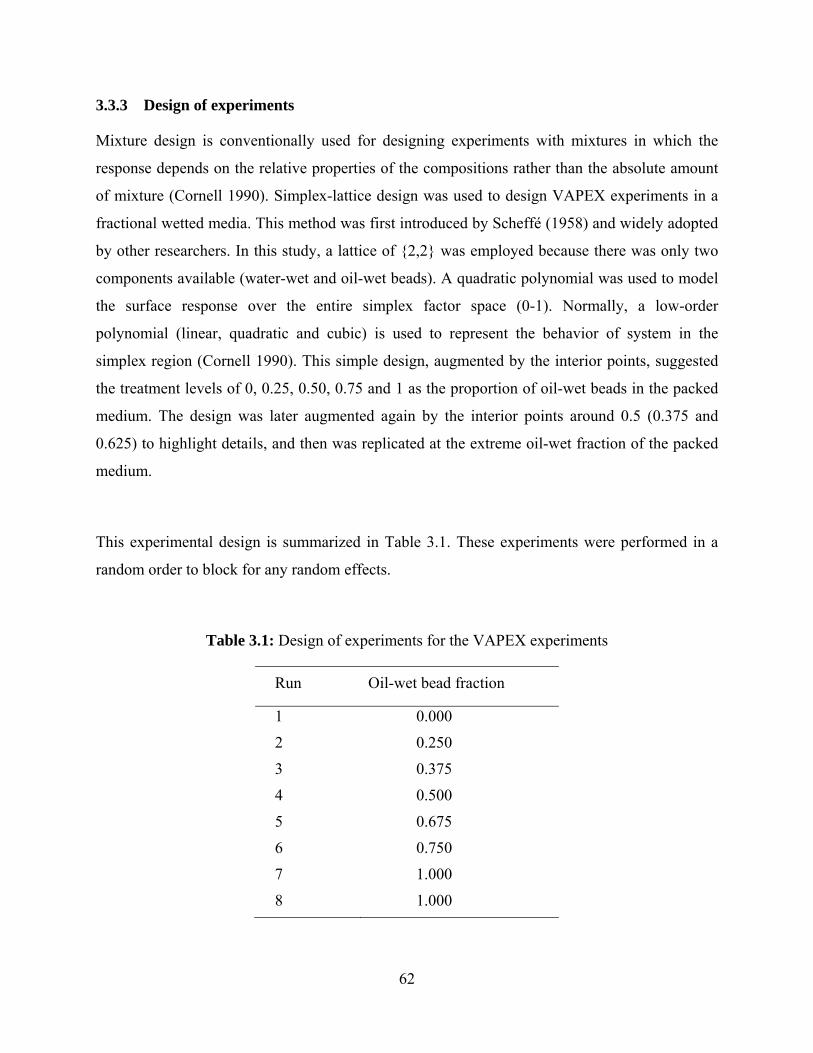
62
3.3.3 Design of experiments
Mixture design is conventionally used for designing experiments with mixtures in which the
response depends on the relative properties of the compositions rather than the absolute amount
of mixture (Cornell 1990). Simplex-lattice design was used to design VAPEX experiments in a
fractional wetted media. This method was first introduced by Scheffé (1958) and widely adopted
by other researchers. In this study, a lattice of {2,2} was employed because there was only two
components available (water-wet and oil-wet beads). A quadratic polynomial was used to model
the surface response over the entire simplex factor space (0-1). Normally, a low-order
polynomial (linear, quadratic and cubic) is used to represent the behavior of system in the
simplex region (Cornell 1990). This simple design, augmented by the interior points, suggested
the treatment levels of 0, 0.25, 0.50, 0.75 and 1 as the proportion of oil-wet beads in the packed
medium. The design was later augmented again by the interior points around 0.5 (0.375 and
0.625) to highlight details, and then was replicated at the extreme oil-wet fraction of the packed
medium.
This experimental design is summarized in Table 3.1. These experiments were performed in a
random order to block for any random effects.
Table 3.1: Design of experiments for the VAPEX experiments
Run Oil-wet bead fraction
1 0.000
2 0.250
3 0.375
4 0.500
5 0.675
6 0.750
7 1.000
8 1.000

63
3.4 Results and discussion
Results of the VAPEX experiments in the fractionally wet media were analyzed for the live and
dead oil production rates, solvent content of the produced live oil, and residual oil saturation.
Asphaltene precipitation analysis was not performed on the dead oil samples because we did not
observe asphaltene precipitation during the conventional VAPEX process in earlier experiments
(Rezaei et al. 2010a). In addition, asphaltene precipitation was not observed in a series of pore-
scale visual investigations of the conventional VAPEX process in glass-etched micromodels of
capillary networks under controlled surrounding temperature (Chatzis 2002; James 2003; James
2009; James et al. 2008). The pore-level conventional VAPEX experiments were also performed
using different light hydrocarbon solvents such as propane, n-butane and n-pentane.
Ramakrishnan (2003) also reported no asphaltene precipitation during the VAPEX experiments
in a packed column using propane as the solvent.
3.4.1 Oil production history
During the VAPEX experiments, the model was allowed to reach a steady-state temperature (37
°C) before starting the solvent injection. The sampling of the produced live oil was then started
when about 1 cm of the model was swept away by the solvent vapor. Therefore, only the steady-
state oil production rates were investigated as they contribute most to the production history of
the VAPEX process. The cumulative live oil productions of 5 different experiments are plotted
in Figure 3.3. The only experimental variable between these five trials is just the composition of
the packed medium, adjusted at 0, 25, 50, 75, and 100% oil-wet beads within the packed bed.
Note that the experiments conducted with the oil-wet beads compositions of 37.5, 62.5, and
replicate of 100% are not shown in Figure 3.3 to enhance the graph visibility. In this figure, the
cumulative live oil production is plotted against the sampling time. The sampling time is
different than the process time because we did not start the sampling procedure from the
beginning of the extraction process.
Figure 3.3 shows a strong linear correlation between the cumulative live oil production and the
sampling time for all the trials presented in this figure, which imposes a constant rate of live oil
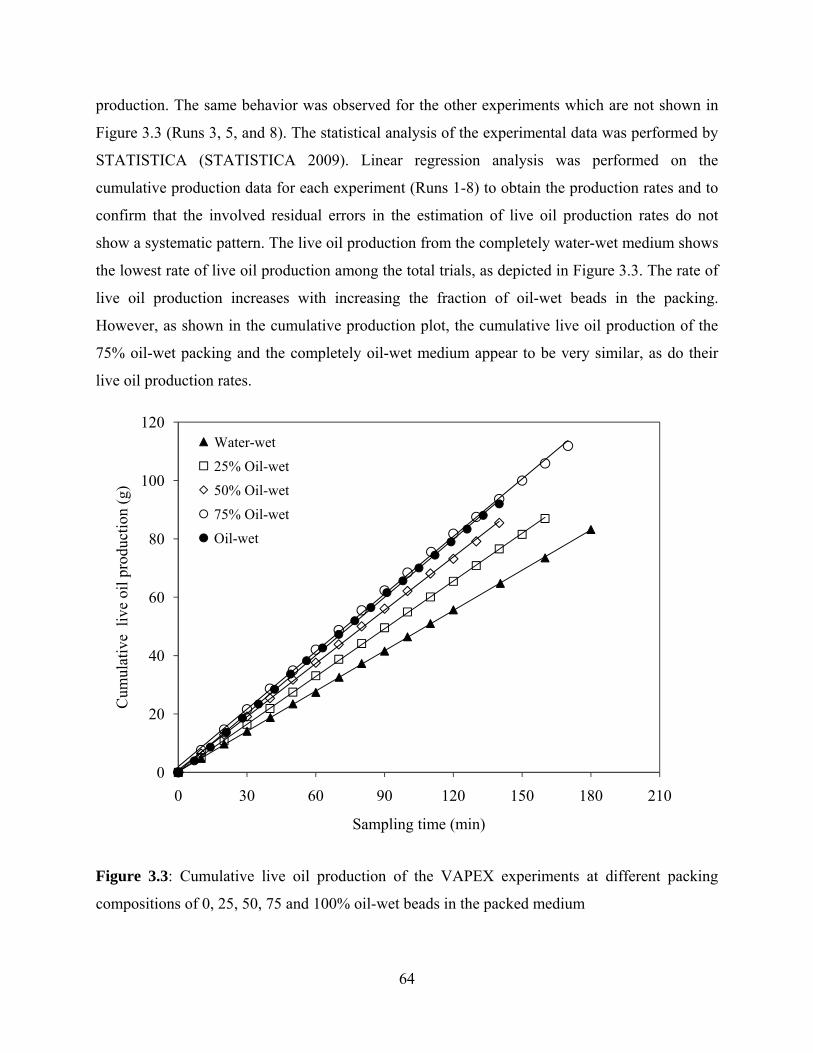
64
production. The same behavior was observed for the other experiments which are not shown in
Figure 3.3 (Runs 3, 5, and 8). The statistical analysis of the experimental data was performed by
STATISTICA (STATISTICA 2009). Linear regression analysis was performed on the
cumulative production data for each experiment (Runs 1-8) to obtain the production rates and to
confirm that the involved residual errors in the estimation of live oil production rates do not
show a systematic pattern. The live oil production from the completely water-wet medium shows
the lowest rate of live oil production among the total trials, as depicted in Figure 3.3. The rate of
live oil production increases with increasing the fraction of oil-wet beads in the packing.
However, as shown in the cumulative production plot, the cumulative live oil production of the
75% oil-wet packing and the completely oil-wet medium appear to be very similar, as do their
live oil production rates.
Figure 3.3: Cumulative live oil production of the VAPEX experiments at different packing
compositions of 0, 25, 50, 75 and 100% oil-wet beads in the packed medium
0
20
40
60
80
100
120
0 30 60 90 120 150 180 210
Cum
ulat
ive
live
oil
pro
duct
ion
(g)
Sampling time (min)
Water-wet
25% Oil-wet
50% Oil-wet
75% Oil-wet
Oil-wet
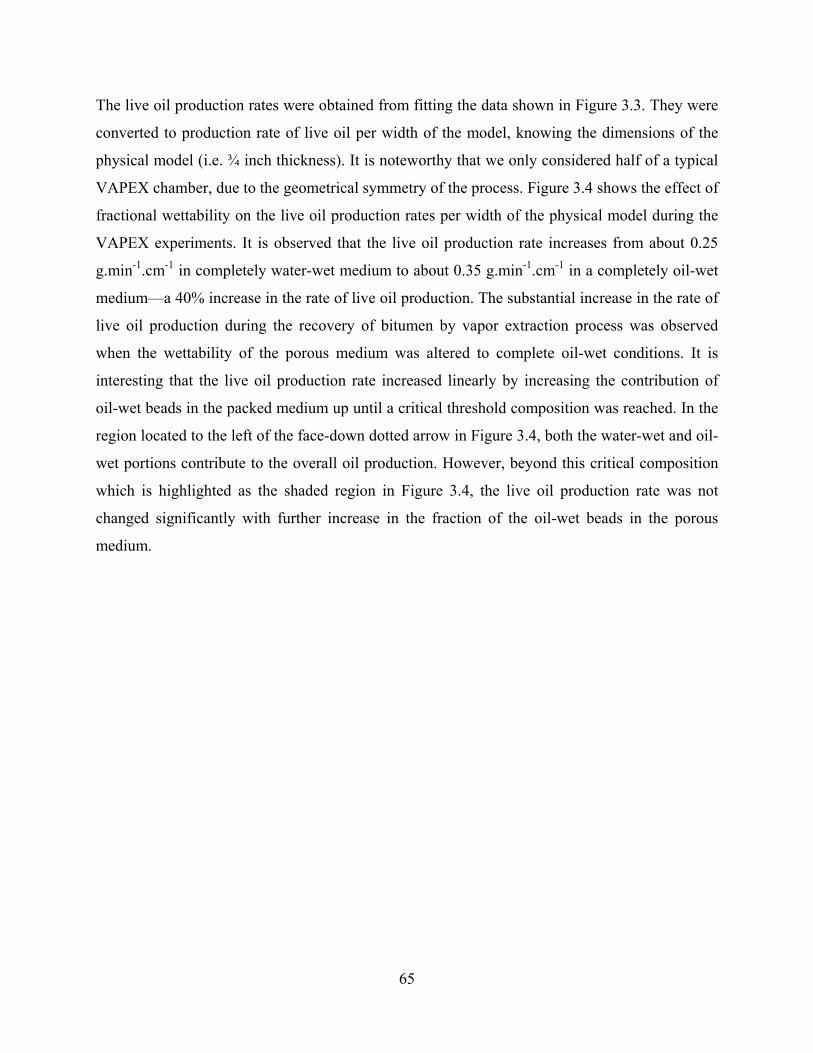
65
The live oil production rates were obtained from fitting the data shown in Figure 3.3. They were
converted to production rate of live oil per width of the model, knowing the dimensions of the
physical model (i.e. ¾ inch thickness). It is noteworthy that we only considered half of a typical
VAPEX chamber, due to the geometrical symmetry of the process. Figure 3.4 shows the effect of
fractional wettability on the live oil production rates per width of the physical model during the
VAPEX experiments. It is observed that the live oil production rate increases from about 0.25
g.min-1.cm-1 in completely water-wet medium to about 0.35 g.min-1.cm-1 in a completely oil-wet
medium—a 40% increase in the rate of live oil production. The substantial increase in the rate of
live oil production during the recovery of bitumen by vapor extraction process was observed
when the wettability of the porous medium was altered to complete oil-wet conditions. It is
interesting that the live oil production rate increased linearly by increasing the contribution of
oil-wet beads in the packed medium up until a critical threshold composition was reached. In the
region located to the left of the face-down dotted arrow in Figure 3.4, both the water-wet and oil-
wet portions contribute to the overall oil production. However, beyond this critical composition
which is highlighted as the shaded region in Figure 3.4, the live oil production rate was not
changed significantly with further increase in the fraction of the oil-wet beads in the porous
medium.

66
Figure 3.4: The effect of fractional wettability on the live oil production rates during the
VAPEX process
This critical composition was identified as a composition at which a maximum change in the
slope of the live oil production rate versus the fraction of the oil-wet beads was observed in the
live oil production rate plot. Figure 3.5 shows how the critical composition of the oil-wet beads
in the packing (tow) was obtained from the knowledge of the live oil production rates during the
VAPEX experiments in fractionally wet media. The critical composition was accordingly
obtained at a value of about 66% oil-wet beads in the packing. The region in which the live oil
production rate of the VAPEX process is unaffected by the packing composition is highlighted in
Figure 3.5 (i.e. shaded area). In this region, the water-wet glass beads do not percolate and the
drainage of the live oil through film flow mechanism is solely governed by the characteristics of
the oil-wet continuum.
0.22
0.24
0.26
0.28
0.30
0.32
0.34
0.36
0.000 0.125 0.250 0.375 0.500 0.625 0.750 0.875 1.000
Qlo
(g.m
in-1
.cm
-1)
ow, fraction of oil-wet beads

67
Figure 3.5: Identifying the critical threshold composition of the oil-wet beads in the packing
during the application of the VAPEX process in fractionally wet media
The effect of silylation treatment process on the average glass bead diameter and also on the
porous medium’s absolute permeability is expected to be insignificant because the adsorption of
the treatment chemicals onto the glass surface is on the molecular level. The wettability
alteration as a result of the adsorption of the treatment chemicals onto the core surface is
believed to have only a small effect on the reduction of the absolute permeability of a core
sample. However, some chemicals cause a reduction in the absolute permeability of a low
permeability (<1 Darcy) core sample (Fahes and Firoozabadi 2007; Noh and Firoozabadi 2008;
Wu and Firoozabadi 2010). Chemicals with a low molecular weight have negligible effect on the
absolute permeability reduction of a core sample during the wettability alteration process (Wu
and Firoozabadi 2010).
0.22
0.24
0.26
0.28
0.30
0.32
0.34
0.36
0.000 0.125 0.250 0.375 0.500 0.625 0.750 0.875 1.000
Qlo
(g.m
in-1
.cm
-1)
ow, fraction of oil-wet beads
tow 0.66
Water-wet beads
not percolating

68
The increase in the live oil production rate with the oil-wet beads composition is expected to be a
result of better wetting conditions in the oil-wet regions. The live oil production rate during the
VAPEX process was found to linearly increase from a completely water-wet medium to a
medium with the critical threshold composition of the oil-wet beads (tow), as presented in
Figure 3.5. Knowing the live oil production rates of a completely water-wet and completely oil-
wet medium, it is possible to estimate the live oil production rate at a desired composition,
assuming that the flow rate in water-wet and oil-wet regions are independent of each other. For
the composition of the oil-wet beads ranging from zero to its threshold value (i.e. 0 < ow< tow),
a normalized oil-wet bead composition ( ∗ ) is defined by dividing the composition of oil-wet
beads in the packing to the critical composition of the oil-wet beads:
∗ 3.1)
Taking into account the live oil production rates of an entirely water-wet medium (Qww) and that
of the entirely oil-wet medium (Qow), the live oil production rate of a desired oil-wet beads
composition (i.e. ow) is approximated by:
∗ 1 ∗ ( 3.2)
The live oil production rates estimated from Equation ( 3.2) are plotted in Figure 3.6 along with
the experimental data of the live oil production rates at different packing compositions. This
figure shows that the live oil production rates measured during the VAPEX process at different
packing compositions (0 < ow < 0.66) are described well by the linear correlation defined by
Equation ( 3.2). A strong coefficient of correlation was observed by applying the linear
regression as indicated in this figure.

69
Figure 3.6: Approximating the live oil production rate of a desired packing composition below
the critical threshold composition of oil-wet beads
The solvent content of the produced live oil was evaporated in the oven at a temperature of 50 °C
for a period of about 2 days. The live oil samples were randomly placed in a convection oven to
block the possible effect of temperature gradient within the oven. Three samples of virgin oil,
taken from the saturation vessel, were placed in the oven along with the live oil samples,
accounting for the fraction of the virgin oil which might be evaporated at the oven temperature.
The corrected dead oil productions were plotted in a cumulative plot for each oil-wet
composition level. The dead oil production rates of the Cold Lake bitumen during the VAPEX
process were obtained by applying linear regression analysis to the cumulative dead oil
production plot. The results are plotted in Figure 3.7 for different oil-wet composition levels.
Similar to the results of the live oil production rates, it is observed that the dead oil production
rate increases with the fraction of the oil-wet beads in the packing. The dead oil production rate
per unit width of the model increased from a completely water-wet medium to that of a medium
with the critical composition of the oil-wet beads. Thereafter, the dead oil production rate was
y = 0.001x + 0.2462R² = 0.998
0.24
0.26
0.28
0.30
0.32
0.34
0.0 0.1 0.2 0.3 0.4 0.5 0.6 0.7 0.8 0.9 1.0
Qlo
(g.m
in-1
.cm
-1)
*ow, normalized fraction of oil-wet beads

70
essentially unaffected by the composition of the oil-wet beads in the packing as the dead oil
production rates of media with compositions of 67.5, 75 and 100% oil-wet beads are very
similar.
Figure 3.7: The effect of fractional wettability on the dead oil production rates during the
VAPEX process
The increase in the oil production rates of the fractionally wet media during the VAPEX process
could be attributed to better wetting conditions offered by the oil-wet glass beads compared to
the water-wet beads. Figure 3.8 illustrates the effect of contact angle on the possible production
rates from bulk film flow in the corner of an equilateral triangle pore. It can be seen that at the
same radii of curvature, a larger wetting cross sectional area is provided by the lower contact
angle condition (1) compared to that of a higher contact angle (2). The area occupied by the
wetting phase (e.g. live oil) in this pore corner can be estimated by (Chatzis 1980):
0.13
0.14
0.15
0.16
0.17
0.18
0.19
0.0 0.1 0.2 0.3 0.4 0.5 0.6 0.7 0.8 0.9 1.0
Qdo
(g.m
in-1
.cm
-1)
ow, fraction of oil-wet beads

71
2
2
1
22 ( 3.3)
where, rc is the radius of curvature, is the contact angle of the wetting phase on the surface of
the pore corner, and is the pore corner angle.
The larger cross-sectional area of the film of oil in the case of lower contact angle results in
higher production rates obtained by the film flow drainage mechanism during the VAPEX
process. The variation of the liquid volume held in a liquid bridge between two touching spheres
was described as a function of contact angle, and this volume was found to rapidly approach zero
as the contact angle increases above 50° (Shahizadeh et al. 2003). A detailed quantitative and
mechanistic study of menisci motion in fractional wet conditions was recently performed by
Motealleh (2009) in which significant features of the drainage processes in fractionally oil-wet
conditions were reviewed.
During the film flow drainage of the live oil under the action of gravity (i.e. in the VAPEX
process), both the oil-wet and the water-wet beads contribute to live oil production in a cascade
of events. Several pore-scale mobilization mechanisms are responsible for the drainage of the
live-oil; capillary drainage displacement, film-flow drainage displacement, and snap-off of the
Figure 3.8: The effect of contact angle on the area covered by the wetting liquid in
a corner of an equilateral triangular pore at low (1) and high (2) contact angles,
during the gravity drainage process

72
unstable invading front of the non-wetting phase into the pores occupied by the wetting phase.
Above the critical composition of the oil wet beads in the packing (ow > tow), the oil
production is mainly governed by the drainage of live oil through the continuum of percolating
oil-wet beads as the water-wet beads do not percolate in this region. Therefore, the oil production
rate during the VAPEX process favors from the wettability alteration to the oil-wet condition.
According to the flow visualization results of the VAPEX process and based on the sequential
manner of the pore-scale displacement events, it was evident that the capillary drainage
displacement event happening at the upstream pores could result in the film-flow drainage of the
displaced oil at the downstream pores (James 2009). Furthermore, it was observed that the pores
previously swept by the solvent may refill through the imbibition of live oil into the adjacent
empty pore spaces. The live oil could imbibe into the neighboring gas-filled pore bodies and pore
throats at lower elevations of the pore space until they become filled with the live oil. The
associated wettability and capillary pressure characteristics of these gas-filled pores could
severely affect the imbibition process of the live oil. Favorable wetting characteristics of the
pores in terms of lower contact angle, which also result in an increased capillary pressure,
promote the imbibition process of the draining live oil into the already invaded pores at higher
rates. It is concluded that the oil wetness of the pores could enhance both the film flow drainage
of the live oil as well as the refilling process of the already swept pores at downstream structures
when the live oil is draining towards the production end.
3.4.2 Solvent requirement analysis
Normal pentane was used as the hydrocarbon solvent to provide sufficient mobility to the Cold
Lake bitumen by diffusion mechanism during the VAPEX process. The mobilized live oil is
drained and produced under the action of gravity. The solvent requirement in the solvent-based
heavy oil recovery processes dictates the economy of the recovery process. The solvent content
of the produced oil was obtained by placing the live oil samples in the oven at a temperature of
50 °C for a period of about 2 days. At this temperature, the solubility of n-pentane in the Cold
Lake bitumen significantly decreases compared to that at the room conditions (Rezaei et al.
2010a). When heating a sample of live oil, both the solvent and the lighter components of the oil
evaporate; however, the latter does not contribute much to the experimental error.

73
Figure 3.9 shows the solvent content of the produced live oil during the VAPEX process at
different packing compositions. For most of the experiments, the solvent content of the produced
live oil was within 47 ± 2 wt. %. There is no strong correlation between the solvent content of
the live oil and the fraction of the oil-wet beads in the packing. However, the solvent content
appears to increase slightly with an increase in the fraction of the oil-wet beads in the packing
which might be explained by the larger exposed interfacial area for the solvent to diffuse into the
oil phase in the oil-wet regions as explained earlier. The higher solvent content for the case of
packing with 62.5 % oil-wet beads was not realistic; a higher oven temperature was detected for
this specific data point. The solvent content results were converted into solvent-to-oil ratio
having the bitumen production and solvent content data available. The solvent-to-oil ratio was
calculated to be in the range of 0.9-0.95 (g/g) for most of the runs.
Figure 3.9: The solvent content of the produced live oil at different packing compositions
46
47
48
49
50
0.000 0.125 0.250 0.375 0.500 0.625 0.750 0.875 1.000
s
(wt.%
)
ow, fraction of oil-wet beads

74
3.4.3 Residual oil analysis
The residual oil saturation analysis was performed at the end of each experiment when the model
was dismantled and samples of the beads with residual oil were collected and analyzed. These
samples were placed in the oven at a temperature of 50 °C, allowing the solvent to flash out. The
residual oil weight was measured after washing the oily beads with toluene followed by
methanol and drying the beads in the oven. The density of the dead oil samples were used to
convert the residual oil in the packing to a volume basis. The beads’ weight was converted to
pore volume, knowing the porosity of the packing and density of the beads. The density of BT3
glass beads was measured to be 2.466±0.008 g/cm3. The residual oil saturation was calculated
according to the following equation:
The analysis of residual oil saturation showed that the residual oil saturation was not affected
much by the fractional wettability, as depicted in Figure 3.10. The value of residual oil saturation
was obtained to be 7±2% pore volume.

75
Figure 3.10: The effect of fractional wettability on the residual oil saturation during the VAPEX
process
3.4.4 Pore-scale observations
During the VAPEX experiments, the bitumen-solvent interface was tracked with time by taking
snapshot pictures of the model every 7-10 minutes. The pictures were then digitized and used to
define the vapor-bitumen interface. Figure 3.11 shows a sample of the interface tracking at 4
different times during the experiments in an oil-wet medium. We purposely eliminated the rest of
bitumen-solvent interfaces from Figure 3.11 to allow for a clearer view of the resultant trends.
0
2
4
6
8
10
12
0.000 0.125 0.250 0.375 0.500 0.625 0.750 0.875 1.000
Sor
(cm
3.cm
-3 )
ow, fraction of oil-wet beads

76
Figure 3.11: Bitumen-solvent interface tracking during the VAPEX process in a completely oil-
wet medium
A less tortuous interface was observed for the VAPEX experiment in a completely oil-wet
medium compared to the one in the water-wet medium. Chatzis (2002) observed the presence of
0
5
10
15
20
25
30
35
40
45
0 2 4 6 8
Ver
tica
l loc
atio
n (c
m)
Horizontal location (cm)
t = 0 min
t = 69
t = 139
t = 200
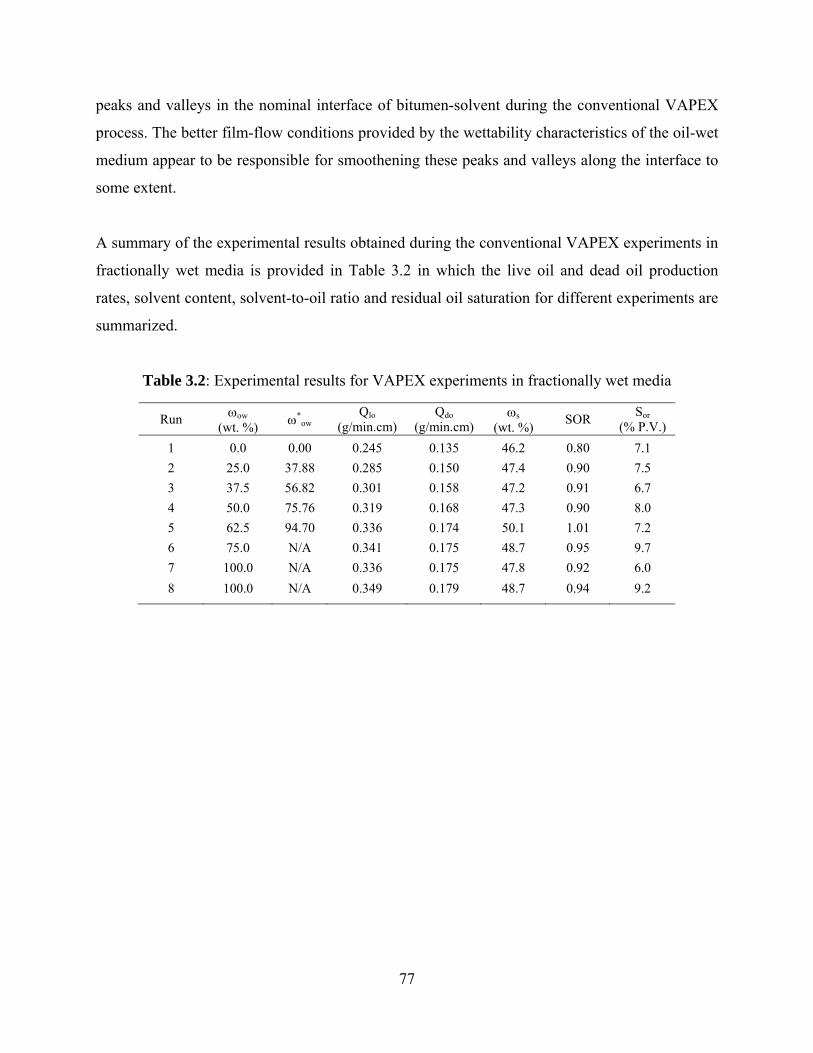
77
peaks and valleys in the nominal interface of bitumen-solvent during the conventional VAPEX
process. The better film-flow conditions provided by the wettability characteristics of the oil-wet
medium appear to be responsible for smoothening these peaks and valleys along the interface to
some extent.
A summary of the experimental results obtained during the conventional VAPEX experiments in
fractionally wet media is provided in Table 3.2 in which the live oil and dead oil production
rates, solvent content, solvent-to-oil ratio and residual oil saturation for different experiments are
summarized.
Table 3.2: Experimental results for VAPEX experiments in fractionally wet media
Run ow
(wt. %) *
ow Qlo
(g/min.cm) Qdo
(g/min.cm) s
(wt. %) SOR
Sor
(% P.V.)
1 0.0 0.00 0.245 0.135 46.2 0.80 7.1
2 25.0 37.88 0.285 0.150 47.4 0.90 7.5
3 37.5 56.82 0.301 0.158 47.2 0.91 6.7
4 50.0 75.76 0.319 0.168 47.3 0.90 8.0
5 62.5 94.70 0.336 0.174 50.1 1.01 7.2
6 75.0 N/A 0.341 0.175 48.7 0.95 9.7
7 100.0 N/A 0.336 0.175 47.8 0.92 6.0
8 100.0 N/A 0.349 0.179 48.7 0.94 9.2
78
3.5 Conclusions
The vapor extraction process was performed in fractionally-wet media where the packing was
obtained by randomly mixing the water-wet and oil-wet beads of similar size distribution. The
following conclusions were made by conducting the VAPEX process at different levels of oil-
wet composition in the porous medium and employing n-pentane to recover the Cold Lake
bitumen:
The live oil production rate during the VAPEX process increased by about 40% from its
value in the completely water-wet medium to that in an oil-wet medium. The enhanced
extent of the live oil film-flow as well as the improved imbibition rate of the live oil into
the adjacent empty pore spaces were found to be responsible for the increased rate of oil
production during the VAPEX process when the wettability of beads was altered to oil-
wet conditions.
By increasing the fraction of the oil-wet beads in the porous medium up to a critical
threshold composition, the production rate of the live oil increased linearly with the
increase in the fraction of oil-wet beads in the packing during the vapor extraction
process. Beyond this critical composition, however, the production rate of live oil did not
change significantly with further increase in the fraction of the oil-wet beads in the
randomly packed medium.
The critical composition of the oil-wet beads in the packing was identified at about 66
percent by volume, recognized as a composition at which the maximum change in the
slope of the live oil production rate curve versus the fraction of the oil-wet beads was
observed. It is believed that beyond this critical composition, the water-wet beads do not
percolate along the model, and the live oil drainage is governed by the characteristics of
the percolating oil-wet continuum.
The solvent content of the produced live oil and also the residual oil saturation showed no
strong correlation with the packing composition. The average solvent content of the
produced oil was 48% by weight, and the average residual oil saturation was obtained at
7% pore volume.

79
The pore-scale observations of the VAPEX process revealed that a less tortuous bitumen-
solvent interface is present in the completely oil-wet medium compared to the water-wet
medium. Furthermore, at any vertical location along the height of the model, the oil-
sweeping velocity in the horizontal direction was found to be mostly constant.
80
4 Experimental Investigation of Vapor Extraction Process
for the Recovery of Bitumen from Vuggy Porous Media
4.1 Overview
The application of VAPEX process was carried out in sintered homogeneous and vuggy porosity
media with different matrix permeability and porosity, to investigate the behavior of vapor
extraction process in vuggy media as potential recovery process. The VAPEX experiments were
conducted using Cold Lake bitumen, and n-pentane as the hydrocarbon solvent. 7 different
models were made, 4 of which were vugular media with different vuggy-to-total pore volume
ratios. The vugs were arranged in aligned and staggered configurations. Three homogeneous
sintered glass beads models of different permeability and porosity were also made. The vugs in
sintered models were created by embedding wood particles of uniform volume (20 mm3) along
with glass beads and by heating them in the furnace at the same time. During the VAPEX
experiments live and dead oil production rates, solvent content and residual oil analysis were
conducted. It was observed that the vugs could appreciably facilitate the production of bitumen
from the vuggy models when compared to the homogeneous model with the same matrix size.
The increase in the vug porosity of the porous space significantly increased the live and dead oil
production rate of bitumen and slightly decreased the extent of residual oil saturation left in the
model. Unlike the sintered homogeneous models in which the production rate of bitumen
remains more or less constant during the VAPEX process, the vuggy porosity models display a
boost in the rate of oil production when several vugs are being invaded by the solvent vapors.
This behavior was more pronounced in the case of aligned vugs where the vugs were closer to
each other and more vugs were invaded simultaneously, compared to the staggered vug
configuration. The enhanced pore-level mixing of solvent with bitumen, improved petrophysical
properties of the porous medium and the communication of matrix with the vugs were found to
be important in draining the live oil towards the production well at higher rates.

81
4.2 Introduction
The total viscous oil deposited in the carbonates is estimated at 2 trillion barrels (Dusseault and
Shafiei 2010). Despite enormous quantities of heavy oil and bitumen deposits in the vuggy
carbonates, there has not been considerable attention drawn to the enhanced oil recovery
techniques applicable to these reserves, owing to harsh production characteristics. Problems such
as lower porosity, mixed wettability condition, and lower permeability compared to tar sands
make the recovery of bitumen from these reserves to be very energy and material intensive
(Sedaee Sola and Rashidi 2006; Das 2007; Buschkuehle et al. 2007; Buza 2008). Das (2007)
conducted simulation studies of thermal process in fractured carbonate reservoirs and showed
that the oil production rate from these carbonates might be attractive in some reservoirs which
are highly fractured and have a thick pay zone, and he concluded that the wettability condition of
carbonates is a significant inhibiting variable. Unlike the steam-based methods like SAGD and
CSS in which the oil production is being negatively affected by the oil-wet conditions, the vapor
extraction process benefits from this wettability situation (Rezaei et al. 2010b).
The objective of this chapter is to investigate the effect of presence of vugs on the production
characteristics of the VAPEX process. It is hypothesized that the presence of vugs could increase
the oil production rates compared to a homogeneous porous medium, because of better pore-
scale mixing of solvent and oil. This additional mixing results from a series of pore-scale events
such as the snap-off of solvent vapor into the oil-filled vugs because of higher aspect ratio of the
vugs, as well as the convection effect of the diluted oil draining from a vug into the pore spaces
below it. In addition the presence of vugs improves the petrophysical properties of the porous
medium and consequently facilitates the drainage of live oil from both vug and matrix. The flow
communication between the vugs and the surrounding matrix enable the live oil in the matrix to
be drained through higher permeability pathways involving the vugs, all the way towards the
production well. Therefore, it is favorable to have vugs closer to each other for a better flow
communication between the matrix and the vugs in the direction of oil drainage.
The VAPEX experiments were conducted in sintered glass bead models at four different levels
of vuggy-to-total pore volume fractions using Cold Lake bitumen and n-pentane as oil and

82
solvent fluid pair. The experiments were performed in non-condensing mode of VAPEX by
providing an isothermal housing of hot air. The performance of VAPEX process in the vuggy
media was compared to that of the homogeneous model, having the same matrix characteristics
as the vuggy models.
4.3 Experimental aspects
4.3.1 Sintered glass bead models
The VAPEX experiments were conducted in sintered glass-bead models. A total number of 7
models were made for the set of experiments. In four of these models, the vugs were created in a
sintered matrix of 718 m diameter glass beads, and in the other three models a homogeneous
sintered matrix of glass beads with different porosity and permeability values was fabricated.
The homogeneous models were made by packing the glass beads between two 5-mm thick
(nominal size) glass plates of uniform width and height, and by fusing them in the furnace at a
temperature of 730 °C. When the furnace reached the temperature of 730 °C, the models were
allowed at this temperature for a period of 2 hours. Then the furnace was shut down, allowing
the models to cool overnight. The vuggy models were made by the same procedure. However,
we embedded wood particles along with glass beads during the packing process to create the
vugs. A cylindrical wood dowel of uniform diameter was cut to a number of smaller cylindrical
pieces. The height of these smaller pieces was set at a value close to the spacing between the two
glass plates (~4.5 mm) to allow the vugs to be attached to the top and bottom glass plates for a
better visibility into the model during the oil recovery process. The wood cylindrical pieces were
cut in a narrow range of height (4.5 mm) for a uniform size distribution. These wood pieces were
weighed and then glued with polyethylene glue onto one of the glass plates—in a known
arrangement—prior to adding the glass beads. The polyethylene glue was burned off at the
furnace temperature and did not leave behind anything in the porous medium. Two different
arrangements of aligned and staggered were used for distributing the vugs within the porous
medium (see Figure 4.2). Two 5 mm glass spacers were placed between the two glass plates and
the empty spaces between the vugs were then carefully filled with BT3 glass beads, creating a
packing of glass beads with wood particles embedded in between at desired arrangements—

83
resembling the vugs. The two sides of the packing were sealed temporarily by fiber adhesive
tapes. The wood particles were first burnt in the furnace and left empty spaces as the vugs, in the
sintered matrix of glass beads. There are several concerns regarding the fabrication of vuggy
models with these wood particles. The wood particles should leave minimal amount of ash after
the burning process. Furthermore, the temperature of furnace is required to rise quickly;
otherwise, the glass beads which are located in the neighborhood of vugs may collapse into the
holes created by the burnt wood particles before getting the chance to sinter. In this situation the
vugs do not have the same shape as the wood particles and the glass beads which are poured into
the holes will block the view of vugs. Furthermore, the packing near the vugs is disturbed. The
absence of excess oxygen in the furnace will result in an incomplete combustion of the wood
particles, turning them into charcoal particles left in the vugs. All the models were placed in the
furnace at the same time to create the vuggy models of similar matrix permeability.
Prior to making the vuggy models using the wood particles we had prepared vuggy models by
embedding calcium carbonate particles with glass beads and dissolving them away by flowing
HCl into the porous medium (Rezaei and Chatzis 2009). However, there are some drawbacks
involved in this method which made us think of an alternative method which is this new
procedure of burning the wood particles in-situ. First of all, the process of dissolving the
carbonate calcium particles with hydrochloric acid is very slow and unsafe. Injecting the HCl
into the porous medium at low flow rates delays the leaching process. By contrast, employing a
high injection rate will result in production of CO2 gas at high flow rates which will result in
pressurizing the model. Second, it is very difficult to obtain carbonate particles with a narrow
range of size distribution. Finally, any impurities in the carbonate particles will remain in the
vug.
Figure 4.1 shows high magnification snap shots of thin slabs from different homogeneous
models with different matrix particle sizes. The porous medium was obtained by the sintering of
glass beads which were sandwiched between two glass plates, as shown in Figure 4.1.
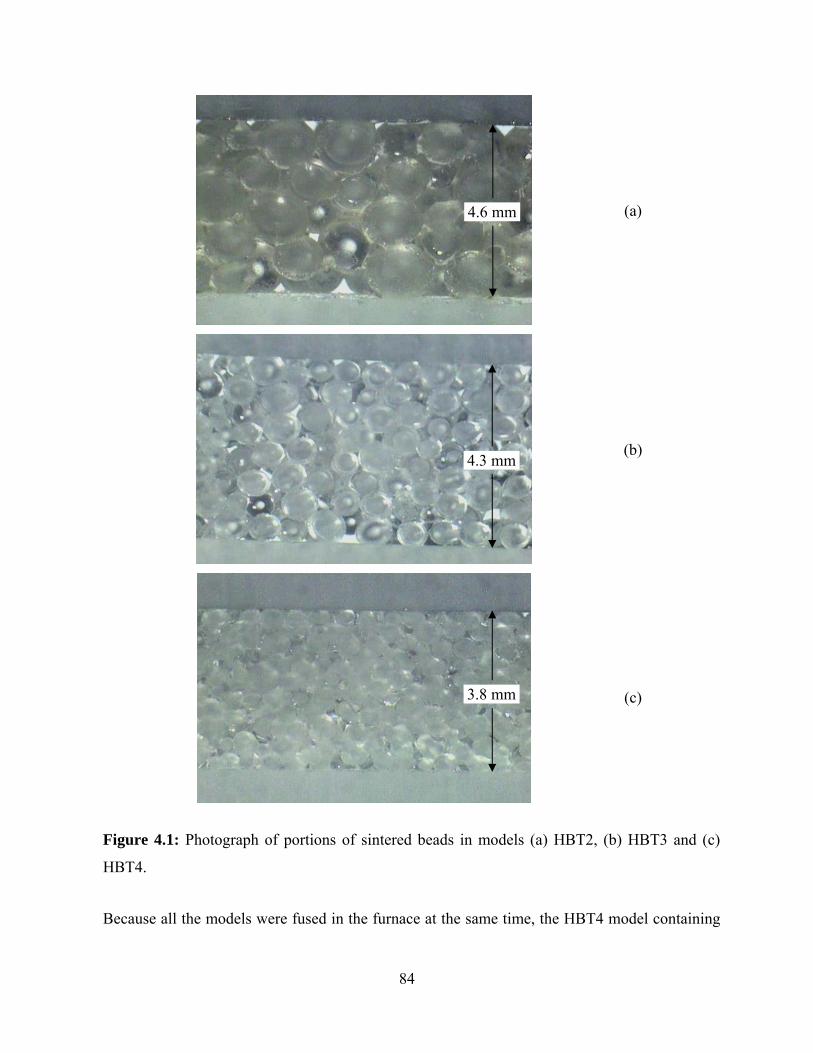
84
(a)
(b)
(c)
Figure 4.1: Photograph of portions of sintered beads in models (a) HBT2, (b) HBT3 and (c)
HBT4.
Because all the models were fused in the furnace at the same time, the HBT4 model containing
4.6 mm
3.8 mm
4.3 mm

85
reasonably smaller diameter glass beads was sintered considerably more than the other models
HBT3 and HBT2 in which the beads were sintered less. The extent of sintering can be observed
from the measurement of the thickness of the porous medium slab.
The characteristics of different models used in the VAPEX experiments are summarized in
Table 4.1. The homogeneous models are named HBT2, HBT3 and HBT4, highlighting the
matrix bead type. The vuggy models are designated by V20, V40, V60 and V80 for the number
of embedded vugs in the sintered matrix of BT3 type of beads. The dimensions of the models
are represented by the length (L), width (W) and the thickness (T) of each model. The average
vug size and the total vug volumes are obtained from knowledge of the wood particle size
distribution. The overall effective porosity (t) of the model was measured by the saturation
method and the un-steady state permeability measurement was conducted to obtain the
permeability of each model. An average of 6 different permeability measurements is reported in
Table 4.1 for the permeability value of each model.
Table 4.1: Characteristics of the sintered glass bead models used for the VAPEX experiments
Size (cm) Pore volume (cm3)
Model L W T Matrix No. Vug Vug size (mm3) Vuggy Total t K (D)
HBT2 36.0 6.33 0.461 BT2 0 N/A 0 39.0 0.371 784
HBT3 36.0 7.43 0.430 BT3 0 N/A 0 35.1 0.305 133
HBT4 36.0 7.47 0.376 BT4 0 N/A 0 20.7 0.205 18
V20 35.8 7.41 0.438 BT3 20 19.8 ± 0.7 0.396 32.7 0.280 109
V40 36.0 7.40 0.437 BT3 40 19.9 ± 0.6 0.795 34.0 0.294 117
V60 36.0 7.41 0.432 BT3 60 19.3 ± 0.5 1.160 34.7 0.301 121
V80 36.0 7.50 0.435 BT3 80 19.6 ± 0.4 1.567 37.8 0.321 132
The configurations of vugs in different vuggy models are shown in Figure 4.2. It is clear from
this figure that the two models V20 and V40 have staggered vug arrangement, while the vuggy
models V60 and V80 have aligned vug arrangement. By gluing the wood particles to one side of
the glass plates prior to the packing process it was possible to produce these patterns with the
known number of particles.

86
(a) (b) (c) (d)
Figure 4.2: The vug arrangements in the models (a) V20, (b) V40, (c) V60 and (d)
V80
4.3.2 VAPEX experiments in sintered vugular media
The fused models were cut to desired sizes and were sealed on both sides for oil saturation. Two
holes were drilled at the top and bottom of the models for injection and production of oil,
enabling the model to be saturated with bitumen. The sintered models were reinforced and
placed in a convection oven, heated to a temperature of about 50 °C. The Cold Lake bitumen

87
was heated in a pressure vessel, and was pressurized to 10 psig to facilitate the flow of heated oil
into the porous medium. Each model was weighted before and after the oil saturation, and the
initial oil saturation was determined from the knowledge of the pore volume of oil in the model
and the total pore volume of the model. It was observed that all models were fully saturated with
Cold Lake bitumen.
The experimental setup designed for the vapor extraction experiments in sintered glass beads
type of media with vugs is shown in Figure 4.3. The saturated models were placed in a so-called
solvent chamber where it was filled with n-pentane vapor at thermodynamic conditions just
above the dew point temperature of pentane at atmospheric pressure. The solvent chamber was
placed in another chamber (isothermal chamber) which was used as a heating jacket to avoid
solvent condensation occurring in the solvent chamber as a result of temperature gradient
between the solvent vapor and ambient conditions. The isothermal chamber was heated by
flowing air into a band heater with controlled power, and the temperature of isothermal chamber
was adjusted at 37 °C throughout the experiments. The temperature of isothermal chamber and
solvent chamber were measured during the experiments. Pentane was brought to the boiling state
in the solvent boiler, and the solvent vapor was injected into the solvent chamber at fairly low
flow rates, dictated by the heater power installed on the boiler. Some extra solvent was
withdrawn from the solvent chamber and was condensed at the top condenser. The diffusion of
solvent vapor into the bitumen caused a reduction in the viscosity of bitumen at the interface of
bitumen with solvent vapor, and enabled the bitumen to be produced after attaining sufficient
mobility. The produced live oil was taken out of the solvent chamber and was collected in a
collection tube which was located inside the isothermal chamber to avoid solvent condensation
from the solvent chamber into the live oil sample. The bottom valve on the production tube was
occasionally opened during the sampling process. The samples were regularly taken every 10 to
60 minutes depending on the permeability of media. For HBT4 model the samples were taken
every hour because of the low production rate of live oil while for HBT2 model the live oil
samples were taken every 10 minutes. For the rest of experiments the sampling interval was
adjusted at 15 minutes.
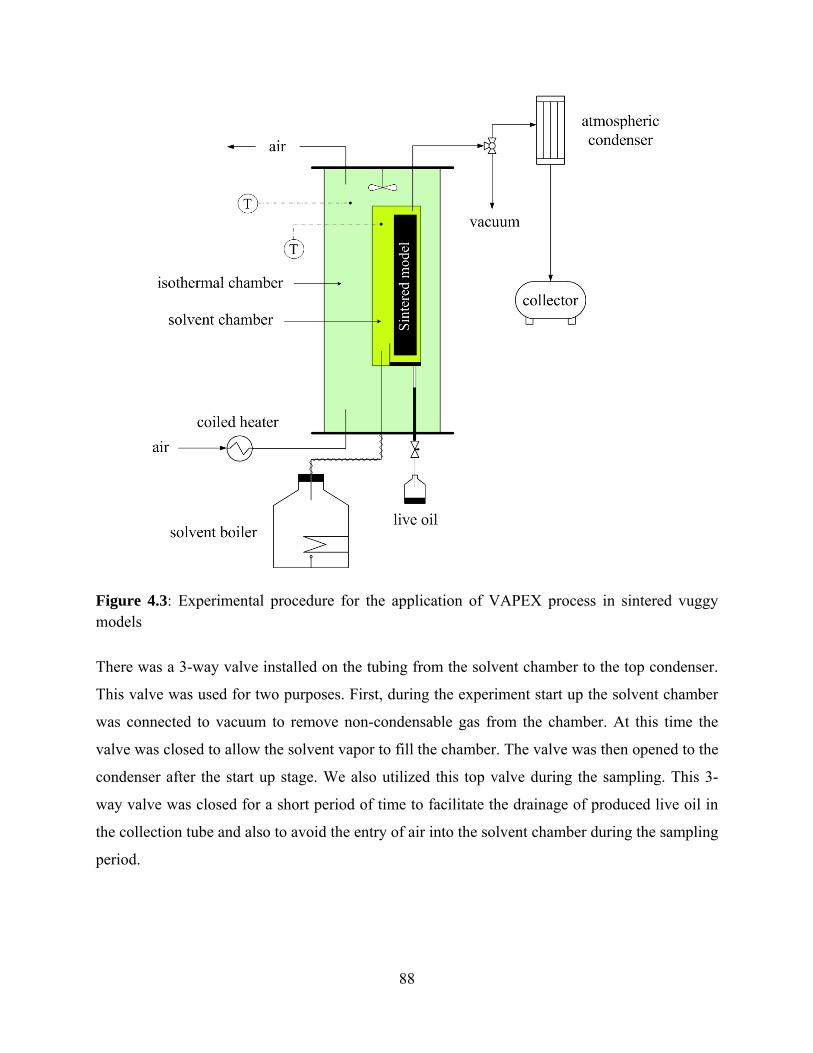
88
Figure 4.3: Experimental procedure for the application of VAPEX process in sintered vuggy models
There was a 3-way valve installed on the tubing from the solvent chamber to the top condenser.
This valve was used for two purposes. First, during the experiment start up the solvent chamber
was connected to vacuum to remove non-condensable gas from the chamber. At this time the
valve was closed to allow the solvent vapor to fill the chamber. The valve was then opened to the
condenser after the start up stage. We also utilized this top valve during the sampling. This 3-
way valve was closed for a short period of time to facilitate the drainage of produced live oil in
the collection tube and also to avoid the entry of air into the solvent chamber during the sampling
period.

89
4.4 Results and Discussion
4.4.1 Oil production history during the VAPEX experiments
The live oil production obtained during the VAPEX experiments was collected in the collection
tube inside the isothermal chamber and was drained on regular basis during the sampling times.
The live oil samples were converted into a cumulative live oil production versus time basis.
Figure 4.4 shows the cumulative live oil production (Qlocum) for the homogeneous sintered
models (HBT2, HBT3 and HBT4) versus the sampling time (t). This figure shows a strong linear
relationship between the cumulative mass of live oil over time and implies a constant production
rate of live oil during the steady-state production of bitumen in the VAPEX process. This
behavior was expected for these homogeneous sintered models based on the previous
experiments (James 2003). The production rate of live oil is obtained from the slope of each
cumulative plot. This live oil production rate is then divided by the thickness of porous medium
to block for the variation between the thicknesses of different models.
Figure 4.4: The cumulative live oil production in homogeneous sintered models, HBT2, HBT3
and HBT4 during the VAPEX experiments
Qlocum = 0.2739t - 0.1205
R² = 0.9994
Qlocum = 0.1393t + 0.7903
R² = 0.9977
Qlocum = 0.0265t + 0.5538
R² = 0.9982
0
10
20
30
40
50
60
0 100 200 300 400 500 600 700 800
Cum
ulat
ive
live
oil
pro
duct
ion
(g)
Time (min)
HBT2
HBT3
HBT4
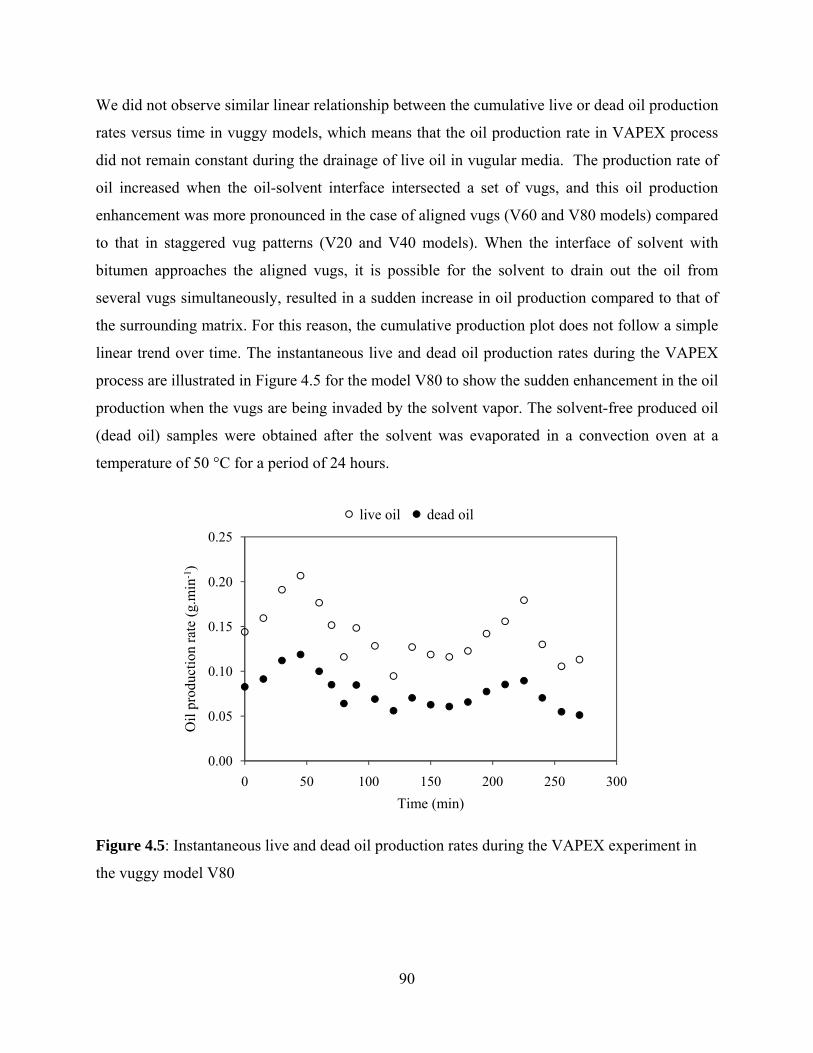
90
We did not observe similar linear relationship between the cumulative live or dead oil production
rates versus time in vuggy models, which means that the oil production rate in VAPEX process
did not remain constant during the drainage of live oil in vugular media. The production rate of
oil increased when the oil-solvent interface intersected a set of vugs, and this oil production
enhancement was more pronounced in the case of aligned vugs (V60 and V80 models) compared
to that in staggered vug patterns (V20 and V40 models). When the interface of solvent with
bitumen approaches the aligned vugs, it is possible for the solvent to drain out the oil from
several vugs simultaneously, resulted in a sudden increase in oil production compared to that of
the surrounding matrix. For this reason, the cumulative production plot does not follow a simple
linear trend over time. The instantaneous live and dead oil production rates during the VAPEX
process are illustrated in Figure 4.5 for the model V80 to show the sudden enhancement in the oil
production when the vugs are being invaded by the solvent vapor. The solvent-free produced oil
(dead oil) samples were obtained after the solvent was evaporated in a convection oven at a
temperature of 50 °C for a period of 24 hours.
Figure 4.5: Instantaneous live and dead oil production rates during the VAPEX experiment in
the vuggy model V80
0.00
0.05
0.10
0.15
0.20
0.25
0 50 100 150 200 250 300
Oil
pro
duct
ion
rate
(g.
min
-1)
Time (min)
live oil dead oil

91
Both sides of the sintered models were exposed to the solvent vapor during the VAPEX
experiments. By matching the production data on Figure 4.5 with experimental observations it
was concluded that the first peak in the live and dead oil production rate is achieved when the
interface of solvent and bitumen approached the first and last row of vugs in the sintered model
V80 (first and 4th row of vugs in Figure 4.2(d)). The second peak in the production rate in Figure
4.5 was experienced when the solvent-bitumen interface approached the second and third rows of
vugs in the same model. The magnitude of dead oil production rate at this second peak is smaller
than that of the first peak because by the time that the interface reaches these sets of vugs, the oil
in the model was already depleted to some extent. The same trend was observed in Figure 4.5 for
other vuggy models. However, for models with staggered vug configurations (V20 and V40) the
peaks in the production rate were less intense, but more frequent compared to the model V80.
The vugs enhance the overall porosity and permeability of the porous medium to some extent.
The vugs have much higher coordination number which enables them to be accessed through
different adjacent pore spaces, and the diffusion of solvent into the bitumen in the vug is more
effective than that in the matrix. In addition, the snap off of the solvent vapor into the vug also
enhances the production of bitumen in an oil-filled vug which is diluted with solvent. During the
VAPEX experiments, some of the vugs were observed to suddenly drain in a period of time
much shorter than the regular drainage time for the surrounding matrix. This sudden drainage of
oil in the vug indicates that the oil inside the vug has been diluted faster by the snap off
mechanism and that the diluted oil is displaced by direct invasion of solvent vapor. The volume
of diluted oil inside a vug is significant compare to that of the surrounding matrix, knowing that
the live oil is being drained through 1-2 pores at a time during the VAPEX process (Chatzis
2002; James et al. 2008; James 2009). This excess volume of diluted oil will drain onto the pores
below it in the matrix and the convection effect of this oil flow will cause a portion of the
bitumen in the matrix to be dissolved by this draining oil by a so-called washing mechanism
(James et al. 2008).

92
The objective of this work was to compare the production characteristics of vuggy porosity
sintered media with that of homogeneous sintered media having the same matrix during the
VAPEX process. Therefore, the production characteristics of the vuggy models have to be
compared to those of the HBT3 model. Both, the permeability and porosity of the HBT3 model
were expected to be less than that of the vuggy models. Unfortunately, this was not realized due
to the poor control in the sintering process. The permeability of the homogeneous model was
measured to be slightly higher than all of the vuggy models and the porosity value of this
homogeneous model HBT3 was also higher than those of V20 and V40 models. Because the
models have different porosity and permeability values, we cannot directly compare them with
each other unless they are properly scaled for these two factors. The bitumen production during
the VAPEX process in homogeneous pack of unconsolidated beads is scaled to permeability and
porosity by Qb , where K and are the permeability and porosity values of the packed
models, and Ω is the cementation factor of the randomly packed glass beads (Das and Butler
1998; Yazdani and Maini 2004). However, we were not able to find scaling criteria for sintered
glass beads media. It is expected that the same scaling correlation could be used for lightly
sintered media of uniform glass beads. To confirm whether or not this scaling is valid for our
system with lightly sintered beads, 3 homogeneous models HBT2, HBT3 and HBT4 were made
to be tested for VAPEX experiments for scaling purposes.
The cementation exponent has values less than 1 in fractured rocks (Aguilera 1976; Jorgensen
1988) to values above 5 in significantly consolidated porous media (Salem and Chilingarian
1999). In the extreme cases, large values of the cementation exponent (>5) are observed in
poorly interconnected vuggy medium in which the vugs contribute a lot to porosity (Knackstedt
et al 2007a; Focke and Munn 1987), as the cementation factor increases with the degree of vuggy
porosity (Lucia 1983). Conveniently the cementation exponent is considered to be equal to 2
(Knackstedt 2007a; Knackstedt 2007b). A cementation factor of 1.4-1.5 was suggested for
several cases such as uniform unconsolidated spherical particles (Knackstedt 2007a; Leroy et al.
2008), lightly consolidated glass beads of uniform size (Knackstedt 2007a; Sharma 1991), fused
glass beads of uniform size with high porosity matrix values >0.2 (Wong 1984), and also
homogeneously sintered solid materials (Nettelbald 1996). The cementation factor was not

93
considerably affected by the porosity of porous medium in different Fontainbleau sandstone
samples when the porosity value increased above 0.1 (Knackstedt 2007a). Wong (1984) also
suggested a higher cementation value of 2.3 when the porosity was decreased below 0.2. The
proposed literature values available for the magnitude of the cementation factor in vugular media
were very limited. For a highly vuggy porosity medium Padhy (2006) reported a value of 2.68
for cementation exponent. In this porous medium about 80% of the total porosity was occupied
by the vugs. The vuggy models V20-V80 exhibited characteristics such as high porosity values,
low degree of sintering, and low values for the vuggy-to-total pore volume ratios; therefore, a
cementation factor of 1.5 was chosen for all models in this work.
Based on the cementation exponent value of 1.5 the bitumen production rates per unit thickness
of the homogeneous sintered models are plotted against . for models HBT2, HBT3 and
HBT4 in Figure 4.6. This figure shows that the proposed scaling variable (Das and Butler 1998;
Yazdani and Maini 2004) can be satisfactorily used for the case of slightly sintered glass bead
models as well when a proper value for the cementation factor is employed, as a strong linear
relationship is observed in Figure 4.6. In this figure, the permeability value has Darcy units.
Figure 4.6(b) shows the dead oil production rate of bitumen per thickness of the model as a
function of the scaling parameter ( . ) for the sintered vuggy models. This figure also
shows a strong linear correlation between the dead oil production rate and this combined scaling
parameter for these vuggy models. The proposed scaling parameter is also used to compare the
results of vuggy models with those of the homogeneous model.
The dead oil production rates in different vuggy models and also the baseline model (HBT3) are
plotted in Figure 4.7 as a function of the fraction of total pore volume of the vugular models
occupied by the vugs. The model HBT3 has the same matrix size as the vuggy models and this
model is used as the baseline to investigate the effectiveness of the VAPEX process in vuggy
porosity models.

94
It is concluded from the results shown in Figure 4.7 that the oil production rate increases as the
fraction of pore volume occupied by the vugs increases. In addition, the production rate of oil in
the baseline model is lower than that in all the vuggy models except for the model V20.
However, as shown in Table 4.1 the baseline model (HBT3) has a higher permeability value than
all the vuggy models. Moreover, the porosity of this baseline model is also higher than all vuggy
(a)
(b)
Figure 4.6: Dead oil production rate versus the VAPEX scaling factor in (a)
homogeneous models HBT2, HBT3 and HBT4 and (b) vuggy models V20,
V30, V40 and V80.
y = 0.0258x + 0.011R² = 0.9913
0.00
0.10
0.20
0.30
0.40
0 3 6 9 12 15
Qdo
(g.m
in-1
.cm
-1)
(½
y = 0.0453x - 0.0365R² = 0.9944
0.12
0.14
0.16
0.18
0.20
3.8 4.0 4.2 4.4 4.6 4.8 5.0
Qdo
(g.m
in-1
.cm
-1)
(½
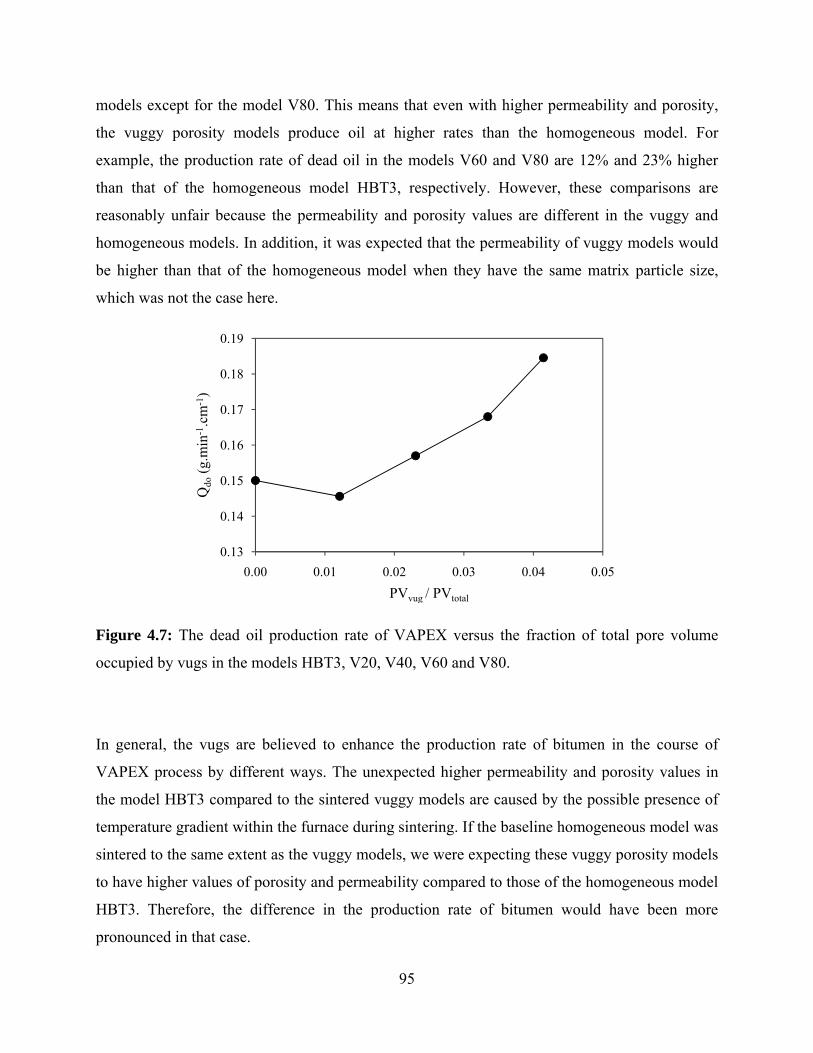
95
models except for the model V80. This means that even with higher permeability and porosity,
the vuggy porosity models produce oil at higher rates than the homogeneous model. For
example, the production rate of dead oil in the models V60 and V80 are 12% and 23% higher
than that of the homogeneous model HBT3, respectively. However, these comparisons are
reasonably unfair because the permeability and porosity values are different in the vuggy and
homogeneous models. In addition, it was expected that the permeability of vuggy models would
be higher than that of the homogeneous model when they have the same matrix particle size,
which was not the case here.
Figure 4.7: The dead oil production rate of VAPEX versus the fraction of total pore volume
occupied by vugs in the models HBT3, V20, V40, V60 and V80.
In general, the vugs are believed to enhance the production rate of bitumen in the course of
VAPEX process by different ways. The unexpected higher permeability and porosity values in
the model HBT3 compared to the sintered vuggy models are caused by the possible presence of
temperature gradient within the furnace during sintering. If the baseline homogeneous model was
sintered to the same extent as the vuggy models, we were expecting these vuggy porosity models
to have higher values of porosity and permeability compared to those of the homogeneous model
HBT3. Therefore, the difference in the production rate of bitumen would have been more
pronounced in that case.
0.13
0.14
0.15
0.16
0.17
0.18
0.19
0.00 0.01 0.02 0.03 0.04 0.05
Qdo
(g.m
in-1
.cm
-1)
PVvug / PVtotal

96
In Figure 4.8 the bitumen production rates from the vuggy models are scaled to the porosity and
permeability of the baseline model (HBT3) using the petrophysical characteristics of the models
offered in Table 4.1, and the scaling correlation of ∝ . was used for these results. For
any vuggy model with permeability of K and porosity of the scaled production rate of dead oil
Q*do can be obtained by taking into account the permeability and porosity of the baseline model
K° and °, respectively:
∗° ° .
( 4.1)
The normalized production rates of bitumen Q*do enables the comparison of the production rate
of a vuggy medium with that of the homogeneous medium at the same level of permeability and
porosity.
As expected, the presence of vugs results in improved oil production during the VAPEX process
when the production rate of oil in vuggy medium was scaled to the petrophysical properties of
the homogeneous model. According to Figure 4.8, the models with aligned vugs (V60 and V80)
show similar scaled dead oil production rate per thickness of the model and the models with
staggered vugs (V20 and V40) also show similar trend. The scaled production rates from the
aligned vugs are slightly higher than that in the staggered vugs as it is expected, because the
draining live oil in the matrix can communicate with the emptied vugs below it and can drain the
oil toward the production well through a local higher permeability pathway of vugs. It should be
noted that in a real case, the role of vugs is even more pronounced because they also enhance the
permeability and porosity of the medium, which was not considered here.

97
Figure 4.8: The dead oil production rates of bitumen scaled to the permeability and porosity of
the baseline model (HBT3) as a function of the fraction of total porosity occupied by vugs.
4.4.2 Solvent content analysis
The solvent content of live oil was obtained after placing the live oil samples in the oven to a
temperature of 50 °C for a period of 24 hours. The solvent content of the homogeneous models
were found to decrease by increasing the permeability of sintered model. For example, the
solvent content of live oil for the model HBT2 with a permeability of 784 D was about 40 % by
weight compared to a value of about 52 % in the model HBT3, and about 56 % in the model
HBT4 with permeability of 133 and 18 D, respectively. The reason for lower solvent content in
the case of high permeability media is related to shorter contact time of bitumen with solvent
before being produced. The solvent content data were plotted against the VAPEX scaling
parameter . , and a strong correlation was observed as illustrated in Figure 4.9.
0.14
0.15
0.16
0.17
0.18
0.19
0.00 0.01 0.02 0.03 0.04 0.05
Q* do
(g.m
in-1
.cm
-1)
PVvug / PVtotal

98
Figure 4.9: The solvent content of produced live oil (wt. %) versus the scaling factor for
homogeneous sintered models HBT2, HBT3 and HBT4.
We did not observe the same correlation between the solvent content in the vuggy porosity
models with the scaled permeability and porosity values of the sintered models V20-V80. The
solvent content in the vuggy models varied from a value of about 52% in the model V20 to about
45% in the model V80. The increase in the extent of vuggy porosity in general, reduced the
solvent content of the produced live oil.
4.4.3 Residual oil analysis
The residual oil saturation analysis was performed on the sintered vuggy models, and the results
were compared to the baseline homogeneous model HBT3. The models were brought to a final
recovery stage by allowing them to be extracted with pentane as solvent for a long period of
time, and then the residual oil saturation was calculated based on the weight of model before and
after vapor extraction process. In general it is expected to observe less quantity of residual oil
saturation in vuggy models compared to the sintered homogeneous model of the same matrix
size because the vugs are essentially drained perfectly. If the vugs contribute a lot to the total
pore volume of the sintered models then the effect of vugs would be more pronounced. In our
y = -1.3314x + 58.1656R² = 0.9984
30
35
40
45
50
55
60
0 3 6 9 12 15
s
(wt.
%)
(½

99
experiments, similar residual oil saturation was obtained for the baseline model and the V20
model. The residual oil saturation decreased by increasing the contribution of vug pore volume
to overall pore volume of the models as observed in Figure 4.10. The residual oil saturation
slightly decreased from a value of 4.4% in V20 to 3.8% in V80 model.
Figure 4.10: Residual oil saturation as a function of the fraction of porous space occupied by the
vugs.
The experimental results of the VAPEX experiments in different homogeneous and vuggy
porosity media are tabulated in Table 4.2 in which the live oil and dead oil production rates,
residual oil saturation and solvent content of produced live oil are provided.
Table 4.2: Experimental results for VAPEX experiments in vuggy porosity media
Model No. K
(Darcy) t PVvuggy/PvtQlo
(g/min.cm) Qdo
(g/min.cm) Sor
(%. P.V.) s
(wt. %)
H-BT2 780.8 37.12 0.0000 0.586 0.350 N/A 40.3
H-BT4 148.8 30.52 0.0000 0.075 0.032 N/A 56.2
H-BT3 19.1 20.48 0.0000 0.327 0.150 4.40 52.2
V20-BT3 119.1 27.98 0.0121 0.312 0.146 4.42 50.7
V40-BT3 147.1 29.85 0.0231 0.285 0.157 3.95 44.9
V60-BT3 132.4 30.12 0.0334 0.353 0.168 3.86 48.5
V80-BT3 143.7 32.14 0.0414 0.328 0.185 3.87 44.8
3.5
3.7
3.9
4.1
4.3
4.5
0.00 0.01 0.02 0.03 0.04 0.05
Sor
(vo
l. %
)
PVvug / PVtotal
100
4.5 Conclusions
Based on results of VAPEX experiments carried out in vuggy porosity porous media, the
following conclusions can be made:
The presence of vugs improves the production characteristics of the VAPEX process in
terms of increased oil production rate and decreased residual oil saturation. The increase
in the extent of vuggy porosity in sintered models improved the production rate of the
VAPEX process.
An increase of about 23% by weight was observed in the bitumen production from the
vuggy porosity model with the largest number of vugs (V80) compared to the baseline
homogeneous model (HBT3).
Unlike the sintered homogeneous models, the production rate of bitumen during the
VAPEX process was not constant in the vuggy models. An increase in the production rate
of oil was observed whenever a number of vugs were simultaneously invaded.
The communication of live oil flow in the matrix with the live oil flow in the vugs is an
important mechanism that facilitates higher production rate of oil.
For media of the same length, the parameter . was found to satisfactorily describe
the bitumen production rate in homogeneous and vuggy porosity sintered porous media.
The residual oil saturations in vuggy porosity models were slightly lower those in
homogeneous models.

101
5 Characterization of Heterogeneities in Porous Media
Using Constant Rate Air Injection Porosimetry
5.1 Overview
This paper elucidates the pore-scale physics of the gas invasion into a vugular heterogeneous
porous media, using a constant-rate air injection (CRAI) method. For very low injection rates the
magnitude of capillary pressure at the pore scale determines the pathways selected by the
invading gas. Because the gas invades relatively larger pores, or vugs, the gas pressure registered
near the face of injection suddenly drops and then builds up again to invade the largest pore
throat connecting the invaded vug to adjacent pores. The pressure trace enables identifying the
volume and size distribution of macroscopic heterogeneities, such as vugs or clusters of high
permeability, surrounded by a matrix of low permeability. Flow visualization results obtained by
conducting CRAI experiments in sintered glass bead models validated the rational of this method
that offers an inexpensive way for characterizing the pore structure of heterogeneous porous
media. Results of vug size characterization are in good agreement with the actual vug sizes in the
micromodels. The CRAI porosimetry has applications for routine core analysis in determining
vugs with a size greater than 1 mm3 in porous media when accessed by a gas phase during
constant rate gas injection. Core samples with a pore volume up to 10 cm3 can be analyzed by
CRAI porosimetry.
5.2 Introduction
A frequent heterogeneity in reservoir rocks is the presence of vugs. They play an important role
in accommodating a considerable amount of oil and in increasing the permeability of porous
medium. Vugs usually create the capillary instability conditions in immiscible two phase flow
through vugular media, because of the capillary pressure contrast in the vugs and the matrix.
Therefore, it is very important to distinguish between porosity due to vugs and porosity due to
matrix. Despite the attempts in measuring the vuggy porosity, estimating the vuggy porosity still
remains a challenging problem in core analysis in the petroleum industry.
102
In general, three different methods have been employed in identifying the vuggy porosity
including well-logging, porosimetry and tomographic techniques. The early attempts in
identifying the vuggy porosity were based on well-log interpretation, initiated in 1867 (Bertrand
et al. 1867) and tried again in 1968 (Desbrandes 1968); however, the results were discouraging.
Recently the image processing techniques based on X-ray CT and MRI imaging are extensively
used for pore structure characterization. Estimating the petrophysical properties of a vugular
carbonate by tomographic imaging methods has always been more challenging than a sandstone
sample (Hidajat et al. 2004) because of the diverse variety of pore types (Arns et al. 2005). The
vuggy porosity was characterized by the tomographic methods in a number of works, such as X-
ray, CT-scan, and MRI (Hidajat et al. 2004; Arns et al. 2005; Iwere et al. 2002; Hurley et al.
1998; Ausbrooks et al. 1999; Camacho-Velázquez et al. 2002; Padhy et al. 2006). The
tomographic techniques have the advantages of being non-invasive, non-destructive, and fast,
compared to the conventional pore space characterization methods (Hidajat et al. 2004; Arns et
al. 2005); however, they require very expensive research tools with limited applicability to
routine core analysis. The other disadvantage of the imaging methods is the huge load of
computation which significantly controls the sample size.
Mercury porosimetry has been widely used as an alternative for pore structure characterization.
The application of mercury porosimetry in pore throat size distribution of a porous medium was
first introduced in 1921 by Washburn. There have been a few applications of mercury
porosimetry in the estimation of the vuggy porosity, including a non-published report by Shell in
1959 (Yuan and Swanson 1989) as well as a work by Gaulier (1971). In the mercury porosimetry
method, the details of pore space are characterized by analyzing a pressure profile, a so-called
finger print of the reservoir rock, when mercury is injected at constant rate (Toledo and Scriven
1994). In 1989 the APEX (apparatus for pore examination) technique was developed to study the
invaded pore spaces, based on a rate-controlled mercury porosimetry. A fairly low flow rate of
mercury injection is required for monitoring the capillary pressure fluctuations (Yuan and
Swanson 1989). The large contrast in the capillary pressure of the vugs and the matrix enables
the mercury porosimetry method to be applied to the vugular porous media as well.

103
In this work we have advanced the use of constant rate air injection porosimetry (CRAI) in
detecting the pore space when accessed by the non-wetting phase along the gas breakthrough
pathways—characterized by the continuum of large pore throats interconnecting large pore
bodies (Smith et al. 2005). It is well known that the pathways followed by the invading non-
wetting phase contribute most to the permeability of the sample. Characterization of this pore
space is of practical significance for heterogeneous porous media as the large pores are
encountered along these pathways which determine the permeability of the porous media (Smith
et al. 2005). Heterogeneities in the form of enclosed clusters of large pores—surrounded by
matrix of much smaller pores—tend to trap oil during waterflooding a water-wet formation
(Smith et al. 2005). Therefore, it is very important to differentiate the matrix porosity from the
vuggy porosity. Because of the relatively larger pore coordination number and size of the vugs, a
substantially large fraction of the vugs is getting accessed by the invading gas (air). If a low
permeability barrier is employed at the exit end of a sample, all of the vugs may become
accessible through air invasion in the pore matrix space because of the relatively higher capillary
pressure of the barrier layer.
The primary objective of this chapter is to report details of a new experimental technique for the
measurement of the porosity associated with vugs and other types of heterogeneities that are
accessed at the breakthrough capillary pressure. This technique involves the injection of a slug of
the non-wetting phase at constant flow-rate while monitoring the pressure trace at the face of
injection. Several experiments were conducted in synthetic porous media with macroscopic
heterogeneities to validate the feasibility of the CRAI porosimetry tests. Matching different
events on the pressure fluctuation trace with the experimental observation enabled us to
differentiate between 3 mechanisms for invasion of air into water-saturated vugs from the
corresponding signature of invasion, seen in the pressure fluctuation profile. Furthermore, the
quality of this pressure trace in the course of gas invasion was improved through applying
different FIR filters in series. The filtered signal provided higher signal-to-noise value and
facilitated the identification of the vugs in a vugular porous medium.

104
5.3 Experimental aspects
5.3.1 The physical vugular models
Experiments were conducted in a synthetic porous medium, having vugs of known size
distribution. Figure 5.1 shows a snap shot of a real vugular core sample next to a synthetic
vugular model prepared in our laboratory by sintering glass beads with embedded large
carbonate rock particles, relative to glass bead size.
(a) (b)
Figure 5.1: A photograph of (a) a carbonate vuggy core sample and (b) synthetic sintered
vugular model
A total number of 10 different physical models were made and tested in this work. These models
facilitated visualization of the wetting phase (water) being displaced by air. In these micromodels
the heterogeneities (vugs or clusters of big pores) were surrounded by a homogeneous matrix of
smaller particles, sintered in the furnace. Table 5.1 summarizes the specification of these models.
Each model was unique in terms of:
number of vugs
vug size distribution
matrix permeability
the ratio of vuggy to total porosity
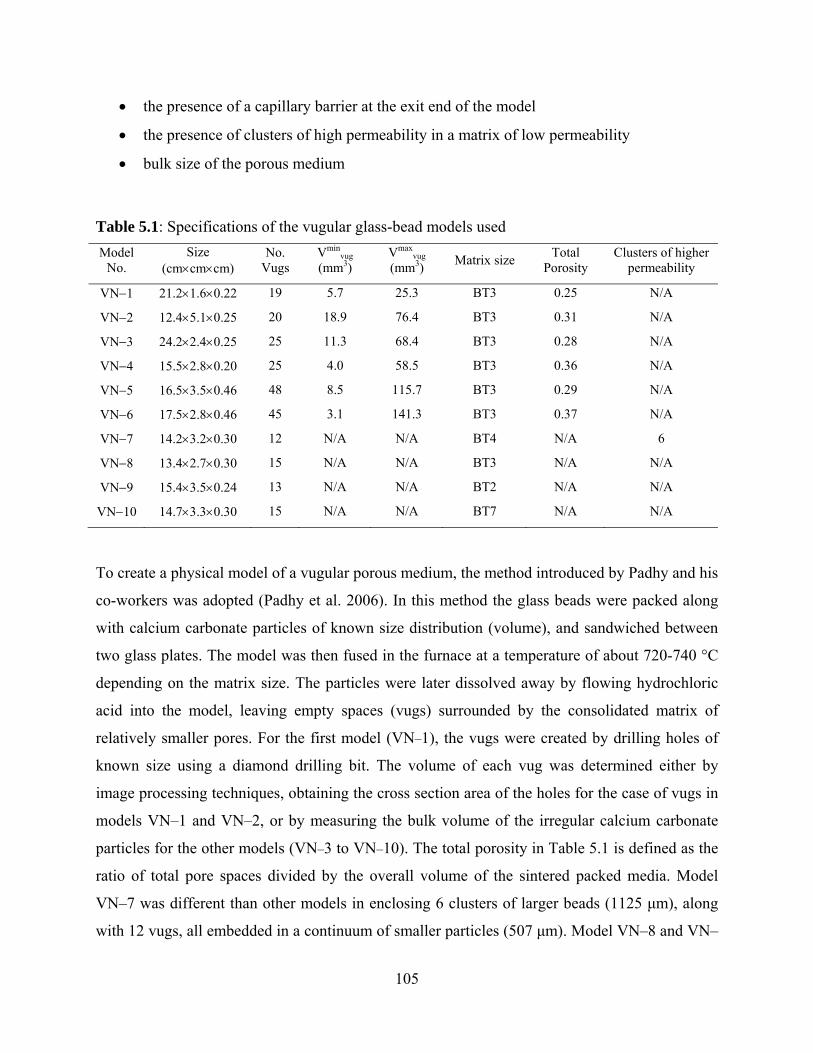
105
the presence of a capillary barrier at the exit end of the model
the presence of clusters of high permeability in a matrix of low permeability
bulk size of the porous medium
Table 5.1: Specifications of the vugular glass-bead models used
Model No.
Size (cmcmcm)
No. Vugs
Vminvug
(mm3) Vmax
vug (mm3)
Matrix size Total
Porosity Clusters of higher
permeability
VN1 21.21.60.22 19 5.7 25.3 BT3 0.25 N/A
VN2 12.45.10.25 20 18.9 76.4 BT3 0.31 N/A
VN3 24.22.40.25 25 11.3 68.4 BT3 0.28 N/A
VN4 15.52.80.20 25 4.0 58.5 BT3 0.36 N/A
VN5 16.53.50.46 48 8.5 115.7 BT3 0.29 N/A
VN6 17.52.80.46 45 3.1 141.3 BT3 0.37 N/A
VN7 14.23.20.30 12 N/A N/A BT4 N/A 6
VN8 13.42.70.30 15 N/A N/A BT3 N/A N/A
VN9 15.43.50.24 13 N/A N/A BT2 N/A N/A
VN10 14.73.30.30 15 N/A N/A BT7 N/A N/A
To create a physical model of a vugular porous medium, the method introduced by Padhy and his
co-workers was adopted (Padhy et al. 2006). In this method the glass beads were packed along
with calcium carbonate particles of known size distribution (volume), and sandwiched between
two glass plates. The model was then fused in the furnace at a temperature of about 720-740 °C
depending on the matrix size. The particles were later dissolved away by flowing hydrochloric
acid into the model, leaving empty spaces (vugs) surrounded by the consolidated matrix of
relatively smaller pores. For the first model (VN–1), the vugs were created by drilling holes of
known size using a diamond drilling bit. The volume of each vug was determined either by
image processing techniques, obtaining the cross section area of the holes for the case of vugs in
models VN–1 and VN–2, or by measuring the bulk volume of the irregular calcium carbonate
particles for the other models (VN–3 to VN–10). The total porosity in Table 5.1 is defined as the
ratio of total pore spaces divided by the overall volume of the sintered packed media. Model
VN–7 was different than other models in enclosing 6 clusters of larger beads (1125 μm), along
with 12 vugs, all embedded in a continuum of smaller particles (507 μm). Model VN–8 and VN–

106
9 included a 1 cm layer of smaller beads (213 μm), sintered at the exit end of the synthetic
heterogeneous porous medium. This capillary barrier prevented the gas from bypassing vugs or
clusters of higher permeability. When the threshold capillary pressure of this low permeability
layer is sufficiently high, a complete accessibility to vugs in the porous medium is possible,
when performing a CRAI test.
Model VN–9 was fabricated to check whether or not the CRAI method is feasible when the sizes
of pores in the matrix are significantly large. This model consisted of 13 vugs embedded in a
matrix of large beads (1125 μm). On the contrast, model VN–10 consisted of 15 vugs surrounded
by a matrix of small particles (213 μm).
The specifications of glass beads used for physical models VN–1 through VN–10 are shown in
Table 5.2 below.
Table 5.2: Specifications of glass beads used
Sizing US mesh size Min size (mm) Max size (mm) Average size (mm)
BT2 14-20 0.841 1.410 1.125
BT3 20-30 0.594 0.841 0.718
BT4 30-40 0.419 0.594 0.507
BT7 60-80 0.178 0.249 0.213
The models were sealed with polyethylene glue on the sides, and reinforced by two aluminum
clamp bars, prior to starting the experiments.
5.3.2 Experimental Setup
A constant rate air injection (CRAI) porosimeter was designed for determining the vug sizes in a
heterogeneous vugular medium, as shown in Figure 5.2. The objective for CRAI porosimetry
was to determine the volumes of vugs and also large-scale heterogeneities (clusters of higher
permeability medium surrounded by a relatively lower permeability matrix), by allowing the

107
non-wetting phase (air) to invade the porous medium. As sketched in Figure 5.2, water was
continuously pushing a known volume of air into the model at a reasonably low flow rate (0.1–
0.5 mm3/s), using an ISCO pump. As the air-water interface invaded a vug, the pressure of the
gas slug dropped over a short period of time because of gas expansion and then built up just
enough to penetrate the largest pore throat neighboring the vug. A 2 psi pressure transducer
(ValidyneTM) was employed to measure the gas pressure with time, near the sample inlet. A
USB-based I/O module was used (Measurement Computing TM) to transfer the data to computer.
The interface was capable of sampling rates up to 1.2 kS/s (kilosamples per second). In CRAI
experiments 60 pressure data samples were taken per second and transferred to computer.
The physical vuggy porosity model was fully saturated with water prior to injecting the slug of
air at constant rate. It was crucial to achieve a perfect level of initial water saturation in the
vugular medium because the performance of CRAI porosimetry method is negatively affected by
the presence of residual air in the medium. In such vugular models, it is very easy for the non-
wetting phase (air) to be trapped in the vugs because of the low capillary pressure of the vugs.
The following steps were followed to achieve high level of initial water saturation:
1. Injected CO2 to replace the air initially trapped in the porous medium
2. Injected de-ionized (DI) water into the porous sample model to obtain a rough level of
water saturation
3. Injected dilute NaOH solution to react with entrapped CO2
4. Injected 2-3 pore volumes of DI water to remove all NaOH solution
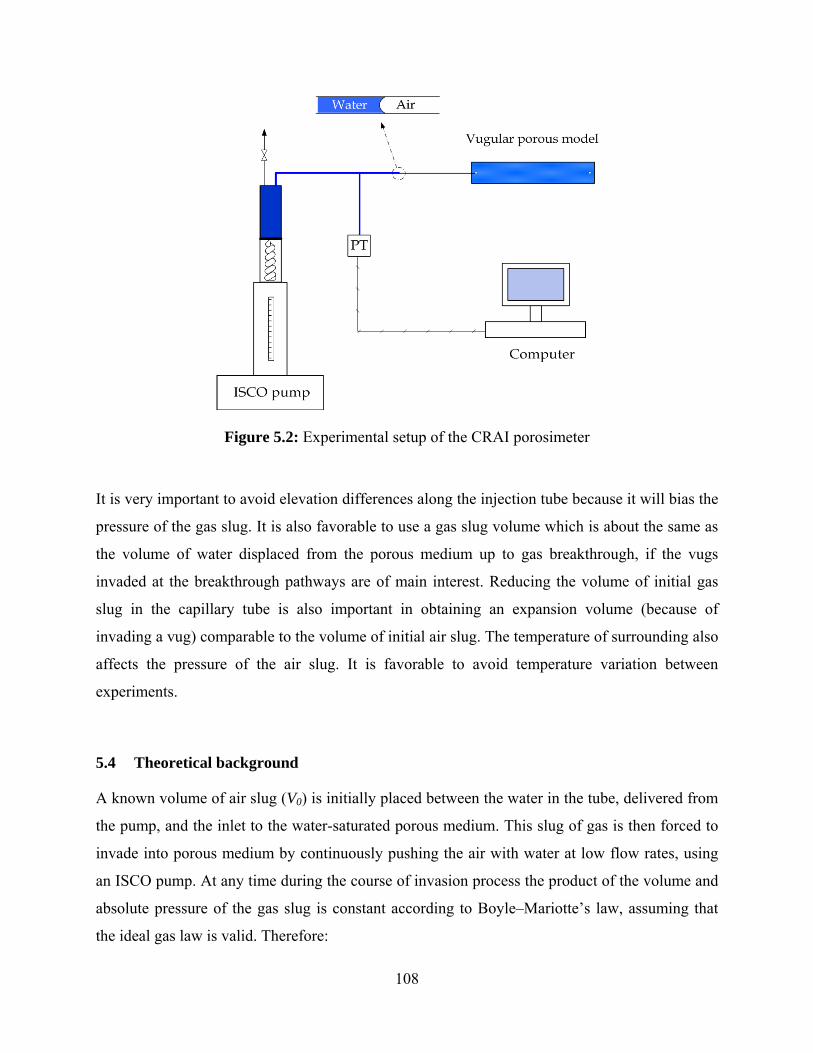
108
Figure 5.2: Experimental setup of the CRAI porosimeter
It is very important to avoid elevation differences along the injection tube because it will bias the
pressure of the gas slug. It is also favorable to use a gas slug volume which is about the same as
the volume of water displaced from the porous medium up to gas breakthrough, if the vugs
invaded at the breakthrough pathways are of main interest. Reducing the volume of initial gas
slug in the capillary tube is also important in obtaining an expansion volume (because of
invading a vug) comparable to the volume of initial air slug. The temperature of surrounding also
affects the pressure of the air slug. It is favorable to avoid temperature variation between
experiments.
5.4 Theoretical background
A known volume of air slug (V0) is initially placed between the water in the tube, delivered from
the pump, and the inlet to the water-saturated porous medium. This slug of gas is then forced to
invade into porous medium by continuously pushing the air with water at low flow rates, using
an ISCO pump. At any time during the course of invasion process the product of the volume and
absolute pressure of the gas slug is constant according to Boyle–Mariotte’s law, assuming that
the ideal gas law is valid. Therefore:

109
( 5.1)
in which, V0 and P0 are the volume and absolute pressure of the air slug at the beginning of
experiment and V(t) and P(t) are the volume and pressure of the gas slug at any time, t. Having
the pressure recorded with time, the volume of the air slug can be calculated from Equation ( 5.1)
at any time over the course of experiment.
As the water-air interface reaches a big pore space, such as a vug or a cluster of larger particles,
the air can easily expand into that pore space because the capillary pressure associated with vugs
(or cluster of big pores) is significantly lower, according to Laplace’s law of capillarity.
Therefore, the pressure of gas slug drops over a short period of time because of the gas
expansion. The pressure then increases to enable the gas interface penetrate the largest pore
throat leading away from the vug. The step-by-step mechanism of invasion into a vug by direct
invasion mechanism is illustrated in Figure 5.3, and the corresponding pressure signal is
sketched in Figure 5.4. It is noteworthy that there are other invasion mechanisms possible,
depending on the neighboring pore structure of a vug, which will be discussed next.
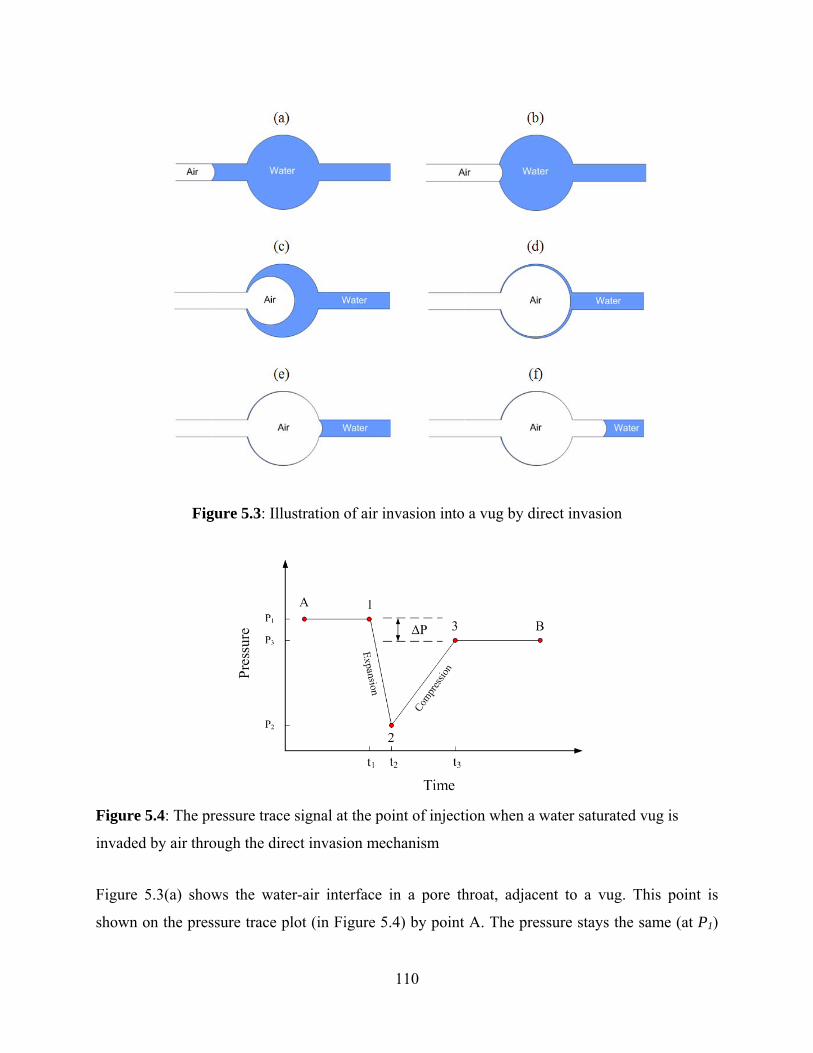
110
Figure 5.3: Illustration of air invasion into a vug by direct invasion
Figure 5.4: The pressure trace signal at the point of injection when a water saturated vug is
invaded by air through the direct invasion mechanism
Figure 5.3(a) shows the water-air interface in a pore throat, adjacent to a vug. This point is
shown on the pressure trace plot (in Figure 5.4) by point A. The pressure stays the same (at P1)

111
when the water-air interface advances to the position shown on Figure 5.3(b), denoted by point
B. When the air invades the vug (in Figure 5.3(c)) the lower capillary pressure of the vug allows
the air to easily expand into it. Therefore, the pressure of gas drops from P1 to P2 during the
expansion process (stages (c) to (e) in Figure 5.3). This expansion phase is followed by a
compression process in which the air-water interface pressurizes to a threshold capillary
pressure, corresponding to the largest pore throat neighboring the vug. Figure 5.3(e) illustrates
the position at which the air-water interface has stopped at the pore throat downstream the vug.
This capillary interface is essentially stationary until the pressure builds up to a threshold
capillary pressure corresponding to this pore throat size. This threshold capillary pressure has
been exceeded at point 3 in Figure 5.4. At this point, the slope in the rate of pressure build up has
suddenly changed, indicating that the air-water interface is no longer stationary, but rather,
advancing into the adjacent pore matrix. During the compression phase of invasion, the rate of
increase in pressure is solely dictated by the pumping flow rate and the initial state (P0 and V0),
which are all constant. However, soon after the air invades the nearby matrix the interface is no
longer stationary. Therefore, the pressure of the gas inside the porous medium is influenced by
the pore structure characteristics of the matrix. The characteristic pressure states denoted on
Figure 5.4 by the points 1, 2 and 3, are required to be accurately identified for the purpose of vug
size formulation. The entrance capillary pressure to the matrix (P3) is dictated by the size of the
largest pore throat attached to the vug, which can be equal, lower, or higher than P1.
The volume of a vug is correlated to the invasion characteristics through the following formula:
∆ ∆ ∆ ( 5.2)
in which, the first term V is the difference in the volume of the gas slug just before and just
after the invasion process (corresponding to P) which accounts for the compressibility of the
air. tExp and tComp are the time duration of the expansion and compression phases of invasion
defined by (t2-t1) and (t3-t2), respectively, and Q is the flow rate of water pushing the slug of air.
Using Equation ( 5.1):
∆1 1
( 5.3)

112
The vug volume formulated through Equation ( 5.2) is valid for the vug is being invaded by direct
invasion mechanism. If the ratio of the vug size to pore throat size exceeds a critical value, the
capillary instability condition occurs at the air-water interface (Roof 1970). Upon the capillary
instability condition the invasion of air into a vug occurs through the snap-off mechanism, as
shown in Figure 5.5.
In this case, the invasion of the non-wetting phase is being carried out by single bubbles of air,
snapping off into the water-filled vug. It is noteworthy that Equation ( 5.1) is no longer valid if
the snap-off mechanism takes place, because the volume of gas slug (V(t)) is being divided to
two parts: 1) continuous gas phase and 2) isolated gas phase in the vug due to snap-off events.
During the course of invasion by snap-off, the volume of the continuous phases decreases while
the volume of the isolated phase increases. At the end of snap-off mechanism both the
continuous and isolated gas phases collapse into a single continuous phase.
Figure 5.5: Invasion of air into a vug by the snap-off mechanism
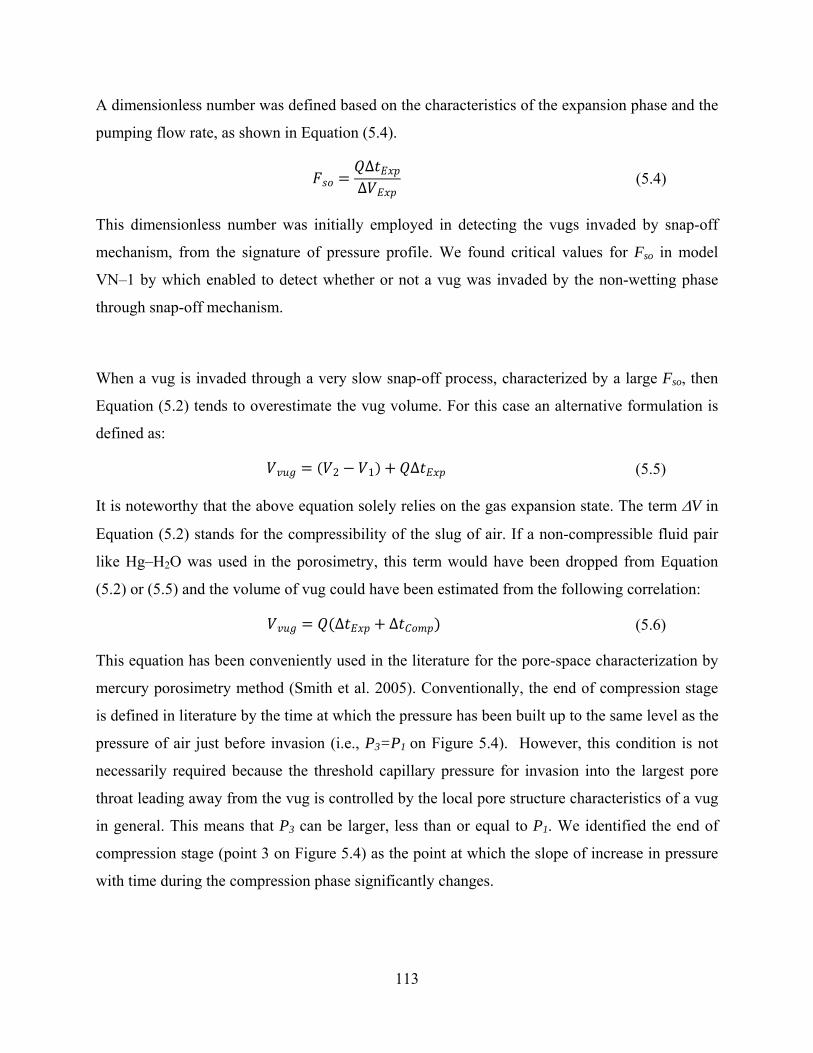
113
A dimensionless number was defined based on the characteristics of the expansion phase and the
pumping flow rate, as shown in Equation ( 5.4).
∆
∆ ( 5.4)
This dimensionless number was initially employed in detecting the vugs invaded by snap-off
mechanism, from the signature of pressure profile. We found critical values for Fso in model
VN–1 by which enabled to detect whether or not a vug was invaded by the non-wetting phase
through snap-off mechanism.
When a vug is invaded through a very slow snap-off process, characterized by a large Fso, then
Equation ( 5.2) tends to overestimate the vug volume. For this case an alternative formulation is
defined as:
2 1 ∆ ( 5.5)
It is noteworthy that the above equation solely relies on the gas expansion state. The term V in
Equation ( 5.2) stands for the compressibility of the slug of air. If a non-compressible fluid pair
like Hg–H2O was used in the porosimetry, this term would have been dropped from Equation
( 5.2) or ( 5.5) and the volume of vug could have been estimated from the following correlation:
∆ ∆ ( 5.6)
This equation has been conveniently used in the literature for the pore-space characterization by
mercury porosimetry method (Smith et al. 2005). Conventionally, the end of compression stage
is defined in literature by the time at which the pressure has been built up to the same level as the
pressure of air just before invasion (i.e., P3=P1 on Figure 5.4). However, this condition is not
necessarily required because the threshold capillary pressure for invasion into the largest pore
throat leading away from the vug is controlled by the local pore structure characteristics of a vug
in general. This means that P3 can be larger, less than or equal to P1. We identified the end of
compression stage (point 3 on Figure 5.4) as the point at which the slope of increase in pressure
with time during the compression phase significantly changes.
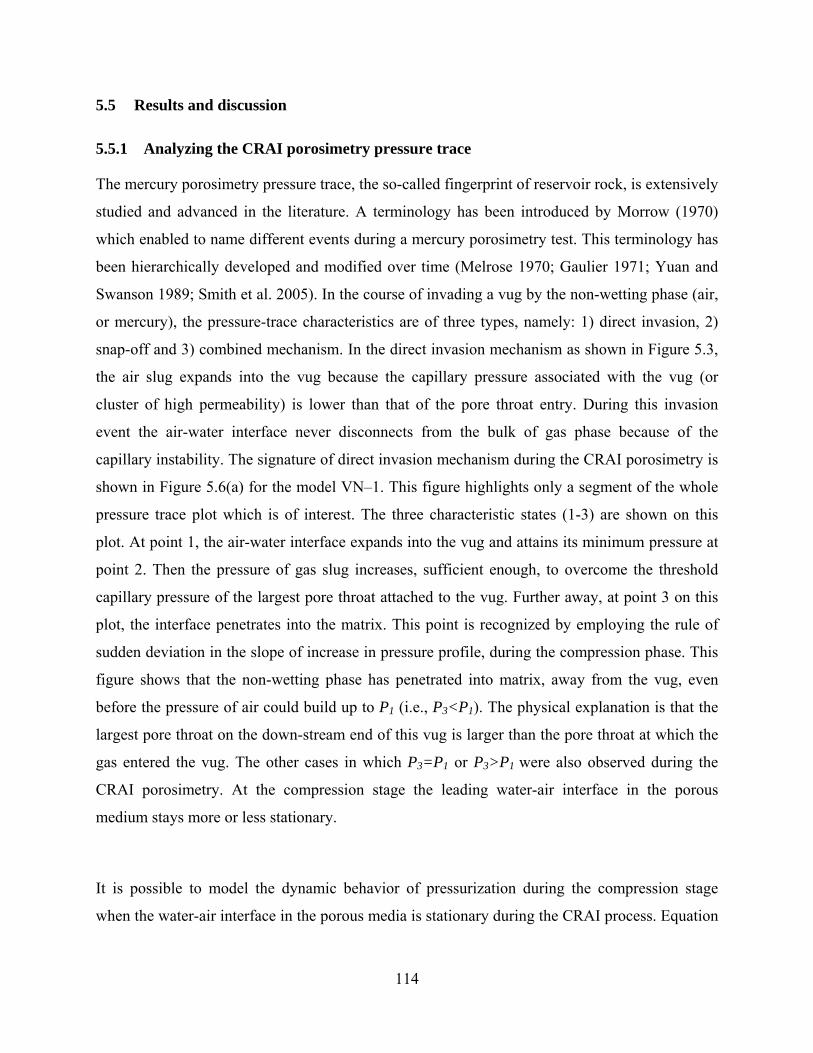
114
5.5 Results and discussion
5.5.1 Analyzing the CRAI porosimetry pressure trace
The mercury porosimetry pressure trace, the so-called fingerprint of reservoir rock, is extensively
studied and advanced in the literature. A terminology has been introduced by Morrow (1970)
which enabled to name different events during a mercury porosimetry test. This terminology has
been hierarchically developed and modified over time (Melrose 1970; Gaulier 1971; Yuan and
Swanson 1989; Smith et al. 2005). In the course of invading a vug by the non-wetting phase (air,
or mercury), the pressure-trace characteristics are of three types, namely: 1) direct invasion, 2)
snap-off and 3) combined mechanism. In the direct invasion mechanism as shown in Figure 5.3,
the air slug expands into the vug because the capillary pressure associated with the vug (or
cluster of high permeability) is lower than that of the pore throat entry. During this invasion
event the air-water interface never disconnects from the bulk of gas phase because of the
capillary instability. The signature of direct invasion mechanism during the CRAI porosimetry is
shown in Figure 5.6(a) for the model VN–1. This figure highlights only a segment of the whole
pressure trace plot which is of interest. The three characteristic states (1-3) are shown on this
plot. At point 1, the air-water interface expands into the vug and attains its minimum pressure at
point 2. Then the pressure of gas slug increases, sufficient enough, to overcome the threshold
capillary pressure of the largest pore throat attached to the vug. Further away, at point 3 on this
plot, the interface penetrates into the matrix. This point is recognized by employing the rule of
sudden deviation in the slope of increase in pressure profile, during the compression phase. This
figure shows that the non-wetting phase has penetrated into matrix, away from the vug, even
before the pressure of air could build up to P1 (i.e., P3<P1). The physical explanation is that the
largest pore throat on the down-stream end of this vug is larger than the pore throat at which the
gas entered the vug. The other cases in which P3=P1 or P3>P1 were also observed during the
CRAI porosimetry. At the compression stage the leading water-air interface in the porous
medium stays more or less stationary.
It is possible to model the dynamic behavior of pressurization during the compression stage
when the water-air interface in the porous media is stationary during the CRAI process. Equation

115
( 5.1) is valid at any time during the CRAI porosimetry process, unless capillary-instability
occurs. Therefore:
( 5.7)
Because the water-air interface in the vug is immobile during the compression process, the
volume of air V(t) can be correlated to the stage-2 variables (i.e., V2 and t2 on Figure 5.4) in the
following form:
( 5.8)
in which, t2 is the starting time of the compression stage and t3 corresponds to the time at which
the compression stage ends. Taking derivative with respect to time from both sides of Equation
( 5.8) gives:
( 5.9)
Because the volume change of air upon gas compression is very small, compared to the volume
of air slug at the beginning of the compression stage (i.e., Q(t-t2) << V2), the rate of increase in
pressure during the compression stage can be satisfactorily approximated by a linear fit. This rate
of increase in pressure is suddenly changed at t3 at which the air-water interface is no longer
stationary, but the leading air-water interface is rather invading the nearby matrix pores. In
addition, the part of pressure signal beyond t3 exhibits more fluctuations compared to the
compression stage, which occurred between t2 and t3. This inherently noisy behavior is
originated from the alteration of capillary pressure in pore throats and pore bodies invaded by the
gas. These observations may be utilized to identify point 3, which is crucial in formulating the
calculation of the vug volumes.
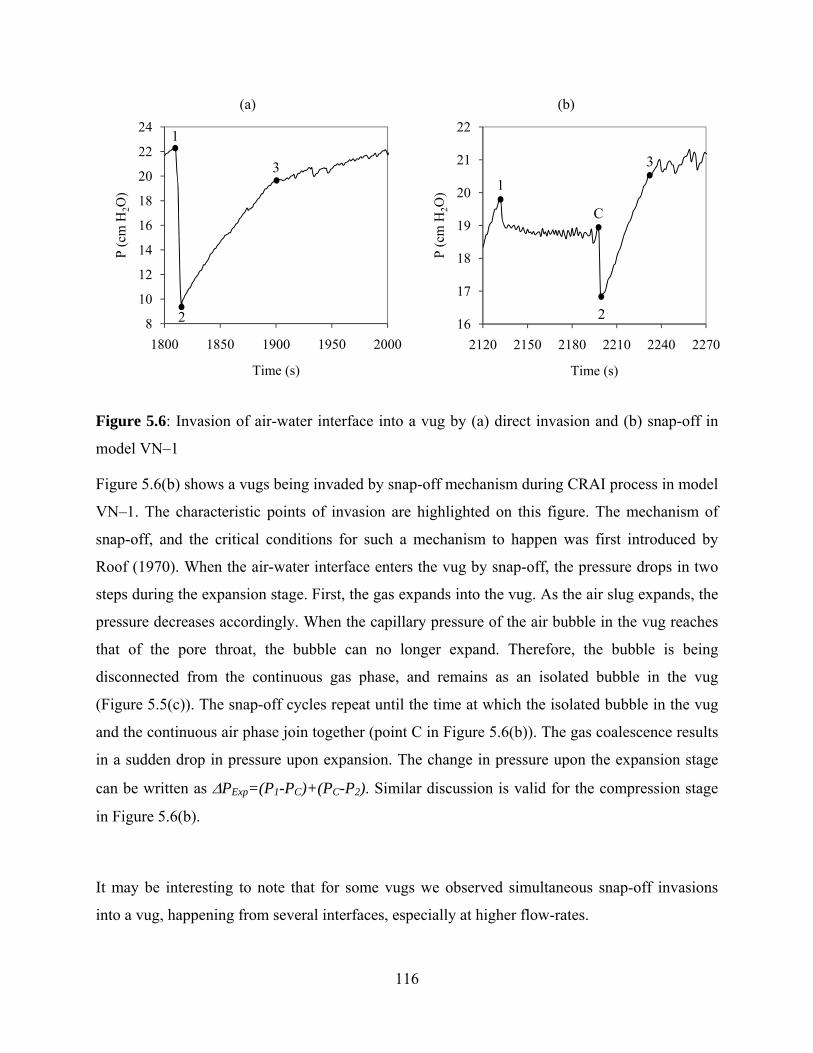
116
(a) (b)
Figure 5.6: Invasion of air-water interface into a vug by (a) direct invasion and (b) snap-off in
model VN–1
Figure 5.6(b) shows a vugs being invaded by snap-off mechanism during CRAI process in model
VN–1. The characteristic points of invasion are highlighted on this figure. The mechanism of
snap-off, and the critical conditions for such a mechanism to happen was first introduced by
Roof (1970). When the air-water interface enters the vug by snap-off, the pressure drops in two
steps during the expansion stage. First, the gas expands into the vug. As the air slug expands, the
pressure decreases accordingly. When the capillary pressure of the air bubble in the vug reaches
that of the pore throat, the bubble can no longer expand. Therefore, the bubble is being
disconnected from the continuous gas phase, and remains as an isolated bubble in the vug
(Figure 5.5(c)). The snap-off cycles repeat until the time at which the isolated bubble in the vug
and the continuous air phase join together (point C in Figure 5.6(b)). The gas coalescence results
in a sudden drop in pressure upon expansion. The change in pressure upon the expansion stage
can be written as PExp=(P1-PC)+(PC-P2). Similar discussion is valid for the compression stage
in Figure 5.6(b).
It may be interesting to note that for some vugs we observed simultaneous snap-off invasions
into a vug, happening from several interfaces, especially at higher flow-rates.
8
10
12
14
16
18
20
22
24
1800 1850 1900 1950 2000
P (
cm H
2O)
Time (s)
1
3
2 16
17
18
19
20
21
22
2120 2150 2180 2210 2240 2270
P (
cm H
2O)
Time (s)
1
C
2
3

117
Figure 5.7: A vug is being invaded by the combination of direct invasion and snap-off, in model VN–1.
Figure 5.7 demonstrates the invasion of a single vug in model VN–1 by direct invasion, followed
by and snap-off mechanisms—defined as combined invasion mechanism. In this particular
experiment the injection flow rate was adjusted at 1.6 cm3/h. Similarly, at point 1 the vug was
invaded by the air-water interface. The pressure significantly dropped, in a short period of time
through a direct invasion mechanism from point 1 to point B. At this point the critical condition
of snap-off was attained; PB on this figure corresponds to the threshold capillary pressure of the
largest pore throat attached to the vug. Consequently, the air bubble could not grow in the vug
anymore, and the bubble inside the vug became disconnected from the bulk of air through a film
of liquid. Thereafter, the intrusion of air into the vug occurred through repeated cycles of snap-
off. At point C the isolated bubble of air inside the vug became connected with the continuous air
slug, and this collapse resulted in a sudden pressure drop toward point 2 because of the volume
expansion. From then on, the interface remained stationary, and the continuous phase was being
pressurized until point 3 was reached. By passing a straight line (shown by dash line on Figure
5.7) from the proximity of point 2 to the compression segment of the plot it was possible to
identify point 3. The penetration of air into adjacent matrix started at point 3 and stopped at point
4, after which the air interface invaded another vug at the downstream end of the vug.
10
12
14
16
18
20
22
24
2350 2380 2410 2440 2470 2500 2530
P (
cm H
2O)
Time (s)
14
3
BC
2

118
Sometimes, the capillary pressure is locally high, due to local heterogeneities. In that case the
pressure for invasion into this high capillary pressure region has to substantially increase. If the
size of this heterogeneity is small in the direction of flow, then invasion into a vug connected
through small throat would be a spontaneous one, which is not controlled by pumping, but rather
the sharp gradient in the capillary pressure. We observed that even if the pump was shut down,
the invasion into the vug and the adjacent pores would have taken place in this spontaneous
invasion. Another case of the uncontrolled invasion happened in the interconnected vugs—the
vugs which are connected to each other through a short pore neck.
In Equation ( 5.4) a dimensionless number, Fso, was defined. This number was later used in
detecting the mechanism of invasion. The inherent characteristics of the snap-off mechanism
dictate the invasion of the non-wetting phase to be progressed by single bubbles; therefore, it
takes more time to empty a vug because of the repeated cycles of invasion-and-disconnection
processes. The time duration of the expansion phase depends on the flow-rate of pumping, aspect
ratio and interfacial tension of the pair fluids. The higher the pumping rate is the faster is the
filling of a pore by the snap-off process. The aspect ratio is also important for snap off to happen.
Higher aspect ratios lead to more snap-off cycles before the isolated and continuous non-wetting
phases collapse. The effect of interfacial tension also affects the size of the air bubbles created
during the snap-off process, when capillary instability occurs. For example, if the porous
medium was saturated with acetone instead of water, the size of air bubbles (during a snap-off
invasion) would have been significantly decreased because of the lower surface tension of
acetone and the time duration of expansion stage would have increased accordingly.
A very slow snap-off mechanism happens when a vug is repeatedly invaded by single and small
bubbles of air, for a long period of time (large tExp). As a result, the pressure drop associated
with the expansion phase of the intrusion into the vug will be relatively small (P1-P2, and
therefore, V2-V1 are small). On contrast, a fast direct invasion is characterized by a significantly
larger pressure drop, occurring in a shorter period of time. So, a slow snap-off can be recognized
by a large Fso while an uncontrolled invasion is identified by a very small Fso.
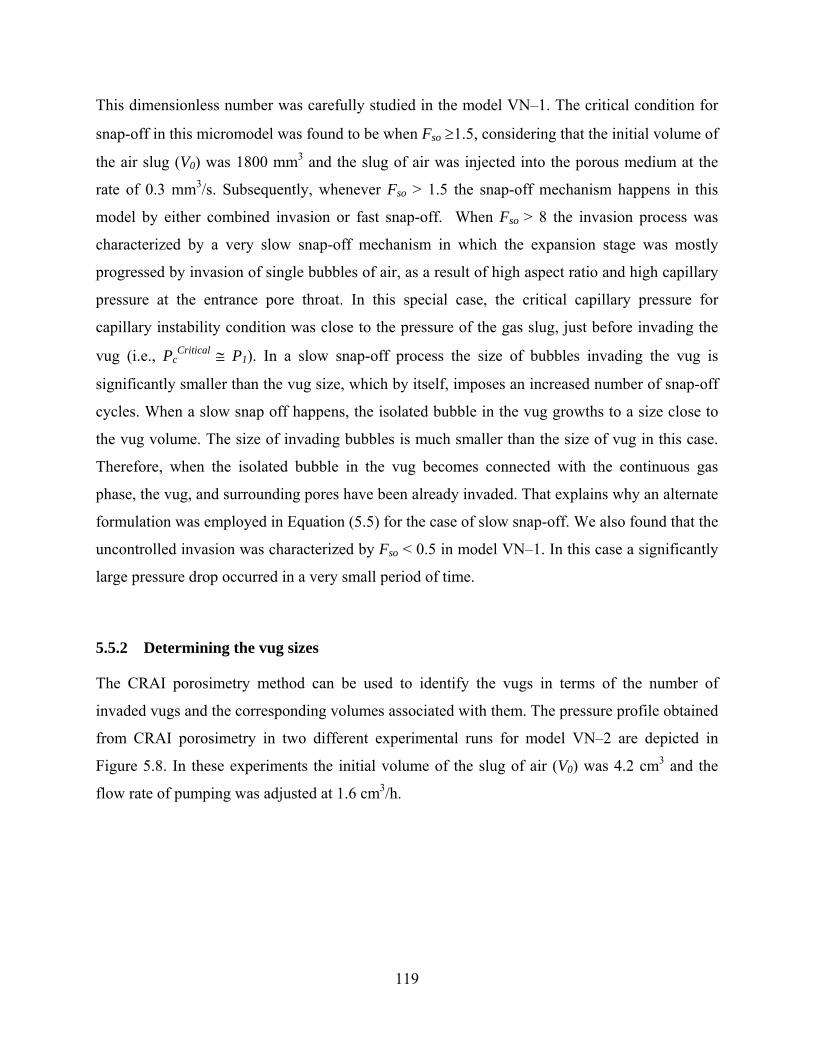
119
This dimensionless number was carefully studied in the model VN–1. The critical condition for
snap-off in this micromodel was found to be when Fso1.5, considering that the initial volume of
the air slug (V0) was 1800 mm3 and the slug of air was injected into the porous medium at the
rate of 0.3 mm3/s. Subsequently, whenever Fso > 1.5 the snap-off mechanism happens in this
model by either combined invasion or fast snap-off. When Fso > 8 the invasion process was
characterized by a very slow snap-off mechanism in which the expansion stage was mostly
progressed by invasion of single bubbles of air, as a result of high aspect ratio and high capillary
pressure at the entrance pore throat. In this special case, the critical capillary pressure for
capillary instability condition was close to the pressure of the gas slug, just before invading the
vug (i.e., PcCritical P1). In a slow snap-off process the size of bubbles invading the vug is
significantly smaller than the vug size, which by itself, imposes an increased number of snap-off
cycles. When a slow snap off happens, the isolated bubble in the vug growths to a size close to
the vug volume. The size of invading bubbles is much smaller than the size of vug in this case.
Therefore, when the isolated bubble in the vug becomes connected with the continuous gas
phase, the vug, and surrounding pores have been already invaded. That explains why an alternate
formulation was employed in Equation ( 5.5) for the case of slow snap-off. We also found that the
uncontrolled invasion was characterized by Fso < 0.5 in model VN–1. In this case a significantly
large pressure drop occurred in a very small period of time.
5.5.2 Determining the vug sizes
The CRAI porosimetry method can be used to identify the vugs in terms of the number of
invaded vugs and the corresponding volumes associated with them. The pressure profile obtained
from CRAI porosimetry in two different experimental runs for model VN–2 are depicted in
Figure 5.8. In these experiments the initial volume of the slug of air (V0) was 4.2 cm3 and the
flow rate of pumping was adjusted at 1.6 cm3/h.

120
(a)
(b)
Figure 5.8: Qualitative repeatability results for the pressure trace experiments in model VN–
2: (a)- Run1 and (b)- Run2.
This figure illustrates that the pressure trace in CRAI porosimetry is very repeatable when the
sequence of vugs invaded remains the same. The repeatability tests were also performed in the
other models as well and good repeatability obtained between the replicates. However, some
minor inconsistencies observed between the replicates occasionally. For example, the vugs
shown by A, B, C and D, in this Figure 5.8, were invaded by a different mechanism in Run 1 and
Run 2. Vug A has been invaded by a slower snap-off mechanism in Run 1 compared to the same
vug in Run 2. The capillary pressure at the time of invasion into this vug was approximately 8.5
cm H2O in Run 1 compared to 10.5 cm H2O in Run 2. It reveals that this vug has been invaded
from two different throats with different magnitudes of the threshold capillary pressures. On the
other hand, vug C has been invaded by a slower snap-off in Run 2. For the vug labeled as B, the
intrusion mechanism is different in Run 1 and Run 2. In Run 1 the gas slug had the time to build
4
8
12
16
20
0 400 800 1200 1600 2000 2400 2800 3200
P (
cm H
2O)
Time (s)
D
A
B
C
4
8
12
16
20
0 400 800 1200 1600 2000 2400 2800 3200
P (
cm H
2O)
Time (s)
A
BC D

121
up the pressure in the compression stage, before invading the nearby vug B, while this is not the
case in Run 2. Vug D, which was a small one, was more clearly detected in Run 2, while it was
not identified as clearly in the first run.
One of the most important factors contributing to these minor dissimilarities in the signature of
air invasion into a vug, or in the sequence of invasion between the replicates is originated from
the inconsistency in the level of initial water saturation in the porous medium. This inconsistency
will impose the selected pathways by the invading air to be different at the pore scale, between
the replicate runs. The pathway of big pore spaces in such a synthetic heterogeneous porous
model has the highest likelihood for entrapping the air during the saturation stage. The isolated
trapped air in the vugs would leave less volume of water to be displaced by the invading air
during the CRAI porosimetry. Moreover, the trapped air decreases the required number of snap-
off cycles when the invasion is carried out through snap-off mechanism. The trapped air in the
vug also changes the signature of expansion stage in a direct invasion. So, the performance of
CRAI porosimetry will be significantly affected by the magnitude of initial water saturation. The
higher the level of initial water saturation is, the more accurate will be the estimated vug
volumes by the porosimetry process.
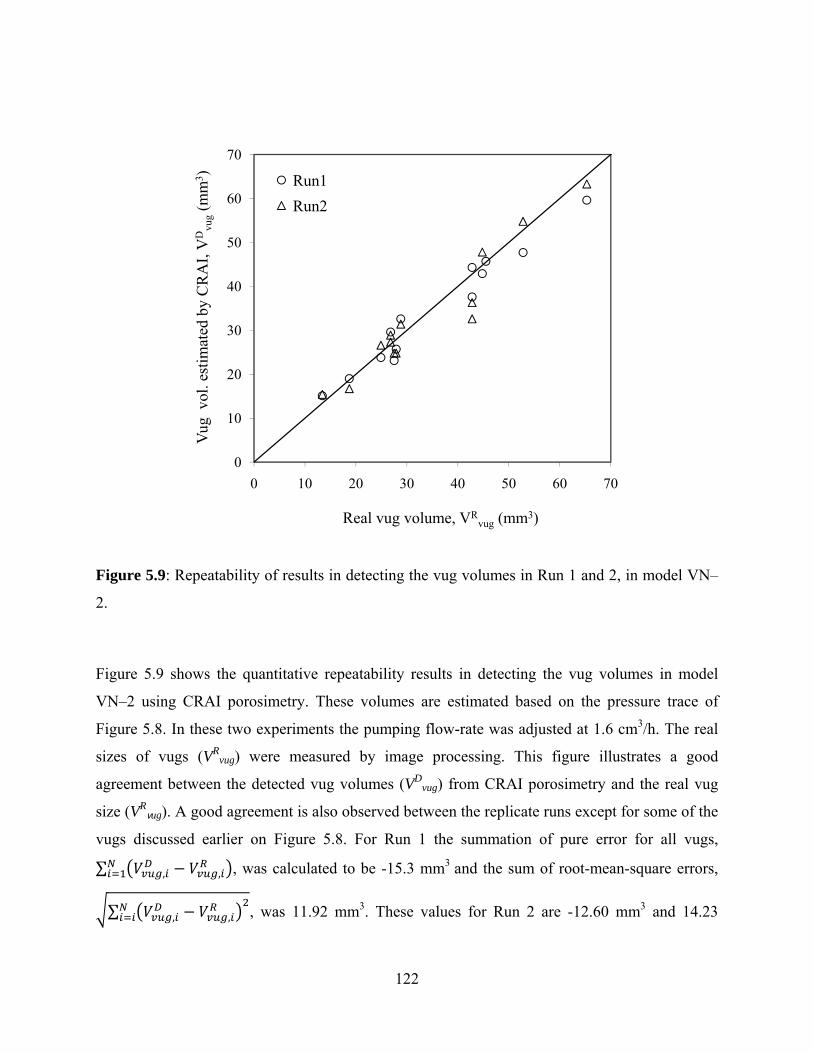
122
Figure 5.9: Repeatability of results in detecting the vug volumes in Run 1 and 2, in model VN–
2.
Figure 5.9 shows the quantitative repeatability results in detecting the vug volumes in model
VN–2 using CRAI porosimetry. These volumes are estimated based on the pressure trace of
Figure 5.8. In these two experiments the pumping flow-rate was adjusted at 1.6 cm3/h. The real
sizes of vugs (VRvug) were measured by image processing. This figure illustrates a good
agreement between the detected vug volumes (VDvug) from CRAI porosimetry and the real vug
size (VRvug). A good agreement is also observed between the replicate runs except for some of the
vugs discussed earlier on Figure 5.8. For Run 1 the summation of pure error for all vugs,
∑ , , , was calculated to be -15.3 mm3 and the sum of root-mean-square errors,
∑ , , , was 11.92 mm3. These values for Run 2 are -12.60 mm3 and 14.23
0
10
20
30
40
50
60
70
0 10 20 30 40 50 60 70
Vug
vol
. est
imat
ed b
y C
RA
I, V
Dvu
g(m
m3 )
Real vug volume, VRvug (mm3)
Run1
Run2

123
mm3, for pure and SRMS errors, respectively. The results confirm similar performance in the
estimation of vug volumes from both runs.
Figure 5.10 demonstrates a comparison between the results of CRAI porosimetry and results of
mercury porosimetry when they are employed to identify the vugs. In this figure, the detected (or
calculated) vug volumes, VDvug have been plotted against the real vug volumes, VR
vug. The former
was estimated through porosimetry while the later was obtained from the image processing. It
follows that CRAI and mercury porosimetry methods can both predict the vug volumes,
satisfactorily. However, the CRAI porosimetry method provides an improved performance. The
repeatability of results confirmed a higher precision for the CRAI method over the mercury
porosimetry method. The summation of pure error and the SRMS error for detecting the real vug
volumes from mercury porosimetry was found to be 40.40 mm3 and 14.59 mm3, respectively.
These errors were reduced to 1.50 mm3 (summation of pure error) and 5.31 mm3 (RMS error) for
CRAI porosimetry which shows a considerable enhancement in the performance of porosimetry.

124
Figure 5.10: Identification of vugs in model VN–1 by: 1) CRAI porosimetry and 2) mercury
porosimetry.
One of the objectives of the porosimetry methods (CRAI or APEX) is to estimate the fraction of
pore volume occupied by vugs. In model VN–1 vugs contributed to 13.4% of the total pore
volume. The total pore volume in this model was measured to be 1.8 cm3 which was measured
by saturation method. For this specific model the CRAI porosimetry estimated the vuggy fraction
of the total pore spaces at 13.5 % while the mercury porosimetry method approximated this value
at 15.6 %. Even though both methods were fairly accurate in estimating the fraction of pore
spaces taken by vugs, the CRAI porosimetry was estimating this value better.
0
5
10
15
20
25
30
0 5 10 15 20 25 30
Vug
vol
. est
imat
ed b
y po
rosi
met
ry, V
Dvu
g(m
m3 )
Real vug volume, VRvug (mm3)
Hg-Water
Air-Water

125
5.5.3 Quantifying the vug size distribution
A physical model VN–5 was fabricated to investigate the potential of CRAI porosimetry method
in determining the vug size distribution. In this physical model we had included a relatively
larger number of vugs (48 vugs) compared to the other models. The vug sizes were in the range
of 8-116 mm3, and the vugs were embedded in a matrix of 718 μm glass beads. The injection rate
of water (for pressurization of the slug of air) was set to 2 cm3/h in this experiment. The real vug
volumes were measured by weighing the embedded calcium carbonate particles, and by taking
into account the bulk density of this material. The vugs were classified into the size intervals
shown in the histogram of Figure 5.11. This figure shows the number frequency of vugs, being
classified into 5 different size categories. All of the 48 vugs in this model were accessed and
identified at breakthrough capillary pressure, by the CRAI method. The detected vug size
distribution was in good agreement with the real vug size distribution and proved the capability
of this method in identifying the size distribution of vugs in a heterogeneous porous medium.
More tests are in progress in our laboratory with the vuggy carbonate rock samples. It was found
that CRAI porosimetry can be successfully used in vug identification and vug-size measurement
in core samples with a pore volume less than 10 cm3.
Figure 5.11: Number frequency of the real vug size distribution and detected vug size
distribution by the CRAI porosimetry in model VN–5.
0
13
22
85
2
10
22
95
0
5
10
15
20
25
30
0-8 8-16 16-32 32-64 64-128
Num
ber
Size (mm3)
Real Detected

126
5.5.4 Investigating the effect of matrix permeability on pressure trace signal
The models VN–9 and VN–10 were fabricated to investigate the effect of matrix permeability on
the performance of the CRAI porosimetry. While model VN–10 had a matrix of small glass
beads (213 μm), model VN–9, on contrast, had a matrix of relatively large beads (1125 μm) as
the continuum and accommodating a total number of 13 vugs. The concern was whether or not
the CRAI porosimetry is applicable in the case of vugs surrounded by a matrix of large pores.
Figure 5.12 shows the pressure trace obtained using CRAI porosimetry in model VN–9,
employing an injection flow rate of 2 cm3/h. This figure demonstrates that although the
fluctuations in the pressure of air slug are significantly larger, compared to other models—
because of the alteration in capillary pressure of pore throats and pore bodies in the matrix—the
vugs present are still detectable. In this model a 1 cm layer of very low permeability glass bead
(213 μm diameter) was fused at the exit end of the matrix, because in such a high permeability
matrix the possibility of bypassing the vugs was very high, especially at higher injection flow
rates. The pressure profile in Figure 5.12 is truncated after 5000 seconds for visibility
enhancement purposes. After this time the pressure of air slug increased to approximately 60 cm
H2O as the capillary barrier was being invaded by the air at this pressure. This relatively high
pressure corresponds to the threshold capillary pressure of this low permeability layer. The
increased capillary pressure at the exit end of the model promises a full access to the pore space
of the porous model prior to the breakthrough time; therefore, it eliminates the risk of bypassing
the vugs in the porous medium of interest.
Although the vugs are detectable in Figure 5.12 the low signal-to-noise ratio, however, interferes
with accurately identifying the vug volumes. We will discuss signal processing techniques which
facilitate the detectability of the vugs or the clusters of big pores embedded in a matrix of
relatively smaller particles in the CRAI porosimetry pressure trace.

127
Figure 5.12: Pressure trace in model VN–9 using a pumping flow rate of 2 cm3/hr.
Model VN–10 included a continuum of very small particles, containing 15 vugs embedded in a
continuum of 213 μm beads. Figure 5.13 shows the pressure trace for this model. It is clear that
the fluctuation in the matrix portion of the plot is less noisy which makes it much easier to detect
and to identify the vugs by the CRAI porosimetry method. Therefore, it is favorable to have the
vugs embedded in a continuum of finer matrix.
Figure 5.13: Pressure trace in model VN–10, using a pumping flow rate of 4 cm3/hr
5.5.5 Identifying the Pore space of clusters of larger particles in a continuum of smaller
particles
The CRAI porosimetry method can also be applied in detecting heterogeneities in the form of the
clusters of large particles embedded in a fine matrix. Figure 5.14 shows a photo of model VN–7
9
10
11
12
1000 1500 2000 2500 3000 3500 4000 4500 5000
P (c
m H
2O)
Time (s)
45
47
49
51
53
55
2000 2500 3000 3500 4000 4500 5000 5500 6000
P (c
m H
2O)
Time (s)
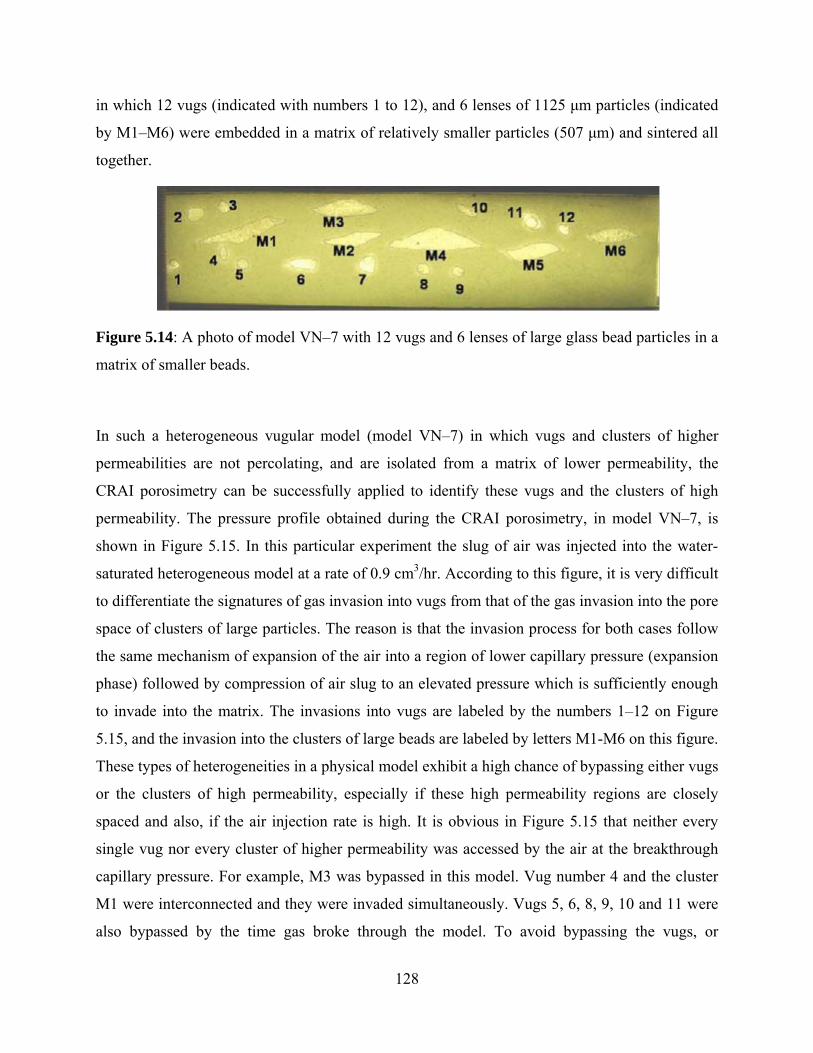
128
in which 12 vugs (indicated with numbers 1 to 12), and 6 lenses of 1125 μm particles (indicated
by M1–M6) were embedded in a matrix of relatively smaller particles (507 μm) and sintered all
together.
Figure 5.14: A photo of model VN–7 with 12 vugs and 6 lenses of large glass bead particles in a
matrix of smaller beads.
In such a heterogeneous vugular model (model VN–7) in which vugs and clusters of higher
permeabilities are not percolating, and are isolated from a matrix of lower permeability, the
CRAI porosimetry can be successfully applied to identify these vugs and the clusters of high
permeability. The pressure profile obtained during the CRAI porosimetry, in model VN–7, is
shown in Figure 5.15. In this particular experiment the slug of air was injected into the water-
saturated heterogeneous model at a rate of 0.9 cm3/hr. According to this figure, it is very difficult
to differentiate the signatures of gas invasion into vugs from that of the gas invasion into the pore
space of clusters of large particles. The reason is that the invasion process for both cases follow
the same mechanism of expansion of the air into a region of lower capillary pressure (expansion
phase) followed by compression of air slug to an elevated pressure which is sufficiently enough
to invade into the matrix. The invasions into vugs are labeled by the numbers 1–12 on Figure
5.15, and the invasion into the clusters of large beads are labeled by letters M1-M6 on this figure.
These types of heterogeneities in a physical model exhibit a high chance of bypassing either vugs
or the clusters of high permeability, especially if these high permeability regions are closely
spaced and also, if the air injection rate is high. It is obvious in Figure 5.15 that neither every
single vug nor every cluster of higher permeability was accessed by the air at the breakthrough
capillary pressure. For example, M3 was bypassed in this model. Vug number 4 and the cluster
M1 were interconnected and they were invaded simultaneously. Vugs 5, 6, 8, 9, 10 and 11 were
also bypassed by the time gas broke through the model. To avoid bypassing the vugs, or
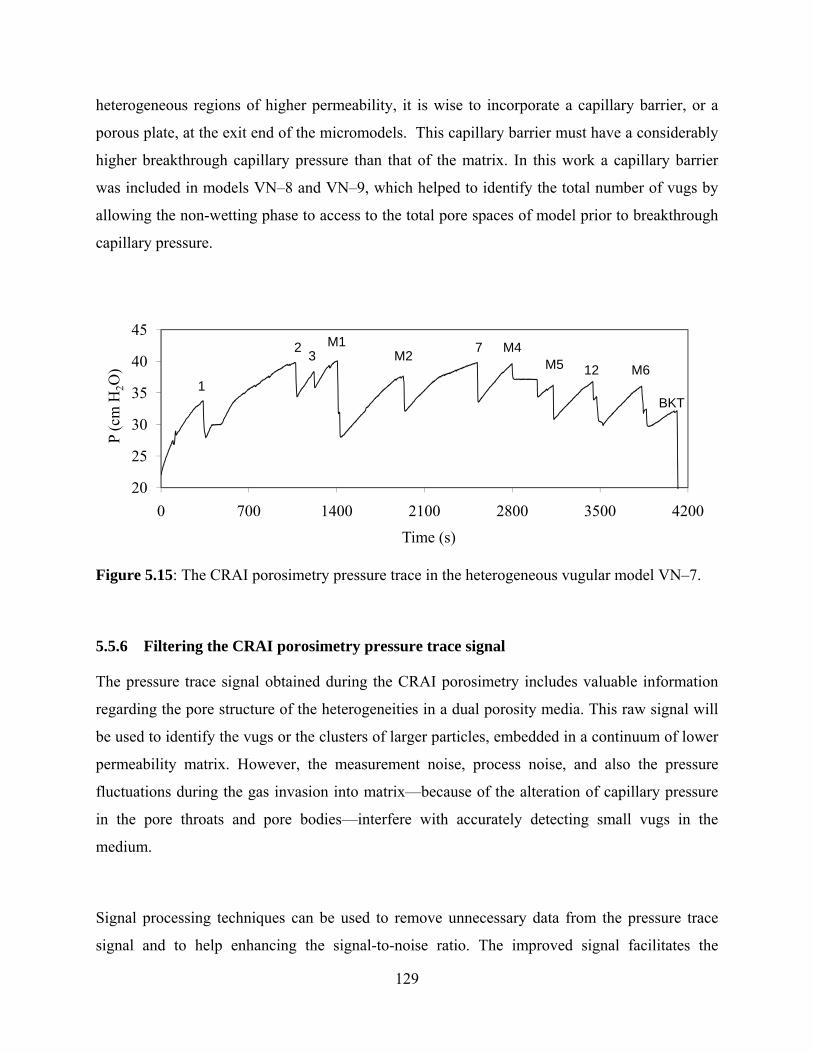
129
heterogeneous regions of higher permeability, it is wise to incorporate a capillary barrier, or a
porous plate, at the exit end of the micromodels. This capillary barrier must have a considerably
higher breakthrough capillary pressure than that of the matrix. In this work a capillary barrier
was included in models VN–8 and VN–9, which helped to identify the total number of vugs by
allowing the non-wetting phase to access to the total pore spaces of model prior to breakthrough
capillary pressure.
Figure 5.15: The CRAI porosimetry pressure trace in the heterogeneous vugular model VN–7.
5.5.6 Filtering the CRAI porosimetry pressure trace signal
The pressure trace signal obtained during the CRAI porosimetry includes valuable information
regarding the pore structure of the heterogeneities in a dual porosity media. This raw signal will
be used to identify the vugs or the clusters of larger particles, embedded in a continuum of lower
permeability matrix. However, the measurement noise, process noise, and also the pressure
fluctuations during the gas invasion into matrix—because of the alteration of capillary pressure
in the pore throats and pore bodies—interfere with accurately detecting small vugs in the
medium.
Signal processing techniques can be used to remove unnecessary data from the pressure trace
signal and to help enhancing the signal-to-noise ratio. The improved signal facilitates the
20
25
30
35
40
45
0 700 1400 2100 2800 3500 4200
P (c
m H
2O)
Time (s)
1
23
M1M2
7 M4M5 12 M6
BKT

130
identification of vugs or heterogeneities, consisting of regions of large particles in a continuum
of fine matrix. Therefore, the objective is to propose a filtering process for treating the raw
pressure trace without distorting the locations of peaks and valleys corresponding to the vug
invasion.
Second-derivative filters have been frequently used for the purpose of detail-enhancement
(Gonzalez and Woods 2002). These filters can be particularly applied to the case of CRAI signal
to highlight the peaks and valleys corresponding to the invasion of air-water interface into a vug,
or region of high permeability. However, the second derivative filters amplify the noise at the
same time. Therefore, the presence of even a modest noise may make the derivative spectrum
unstable (Mather and Koch 2004). The pressure fluctuations in pore throats and pore bodies
generate a lot of peaks and valleys on the pressure trace signal which will result in big spikes
after applying a second derivative filter. Therefore, it is inevitable to smooth the pressure trace
data before applying the second-derivative filter. This smoothing step has to be performed very
carefully to preserve the location of peaks and valleys corresponding to air invasion into vugs.
Savitzky–Golay filters have been widely used to remove the noise from a high-span frequency
signal (Savitzky and Golay 1964; Orfanidis 1995). The smoothing is performed by fitting
optimal low-order local polynomials to the data series using a moving window technique
(Mather and Koch 2004). Savitzky–Golay filters are believed to be more effective in preserving
the pertinent high frequency components of the signal, compared to simple moving average
smoothing techniques (Orfanidis 1995); an important feature in the case of the CRAI
porosimetry signal.

131
Figure 5.16: The baseline signal obtained during CRAI porosimetry in model VN–1
Figure 5.16 shows the baseline signal in an experiment conducted in model VN–1. This model
incorporated 19 vugs in a continuum of 718 μm glass beads; all the vugs were accessed by the
non-wetting phase at the breakthrough capillary pressure.
The Savitzky–Golay smoothing filter was applied to the baseline signal (shown in Figure 5.16)
by fitting second order polynomials to frames of 5 different samples. The number of frames was
obtained by trial and error. This filter successfully smoothed the original signal with lowest
extent of distortion in the position of peaks and valleys corresponding to a vug, as shown in
Figure 5.17. The number of frames was manually adjusted, to obtain minimal level of distortion
in the position of peaks and valleys. It is clear that the filter has been successful in removing
unnecessary noisy segments of the baseline signal which was of minor interest during the process
of identification of the heterogeneities.
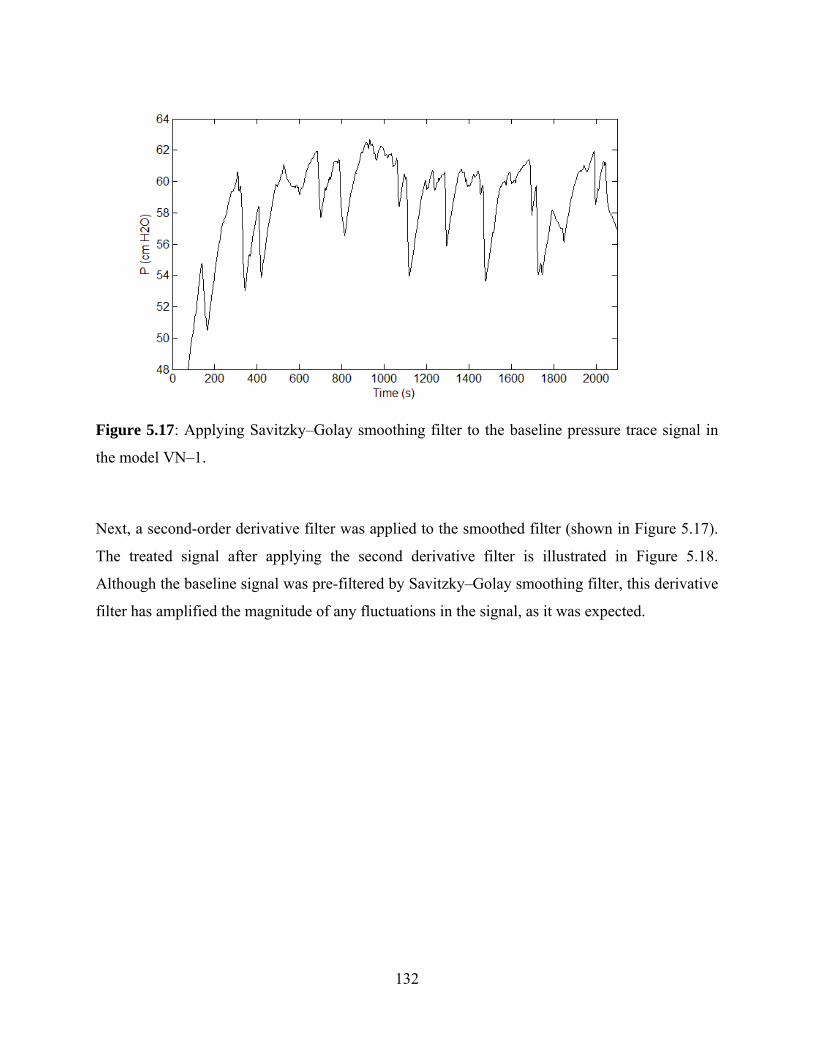
132
Figure 5.17: Applying Savitzky–Golay smoothing filter to the baseline pressure trace signal in
the model VN–1.
Next, a second-order derivative filter was applied to the smoothed filter (shown in Figure 5.17).
The treated signal after applying the second derivative filter is illustrated in Figure 5.18.
Although the baseline signal was pre-filtered by Savitzky–Golay smoothing filter, this derivative
filter has amplified the magnitude of any fluctuations in the signal, as it was expected.
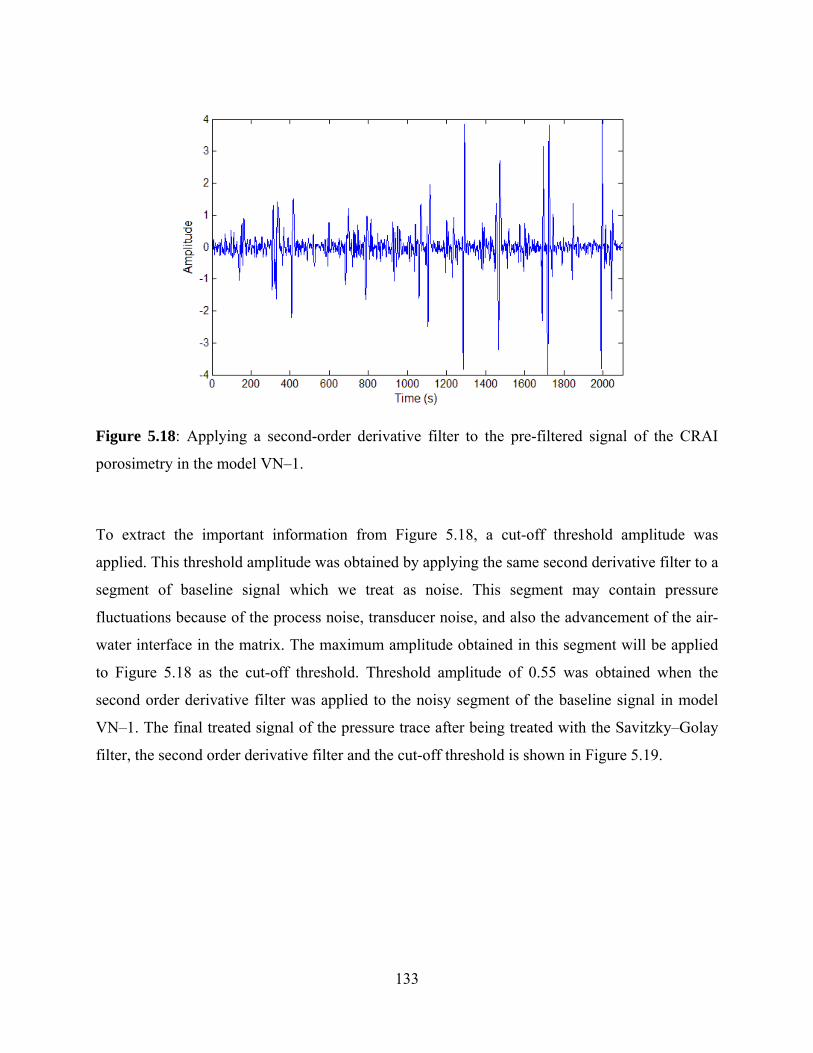
133
Figure 5.18: Applying a second-order derivative filter to the pre-filtered signal of the CRAI
porosimetry in the model VN–1.
To extract the important information from Figure 5.18, a cut-off threshold amplitude was
applied. This threshold amplitude was obtained by applying the same second derivative filter to a
segment of baseline signal which we treat as noise. This segment may contain pressure
fluctuations because of the process noise, transducer noise, and also the advancement of the air-
water interface in the matrix. The maximum amplitude obtained in this segment will be applied
to Figure 5.18 as the cut-off threshold. Threshold amplitude of 0.55 was obtained when the
second order derivative filter was applied to the noisy segment of the baseline signal in model
VN–1. The final treated signal of the pressure trace after being treated with the Savitzky–Golay
filter, the second order derivative filter and the cut-off threshold is shown in Figure 5.19.
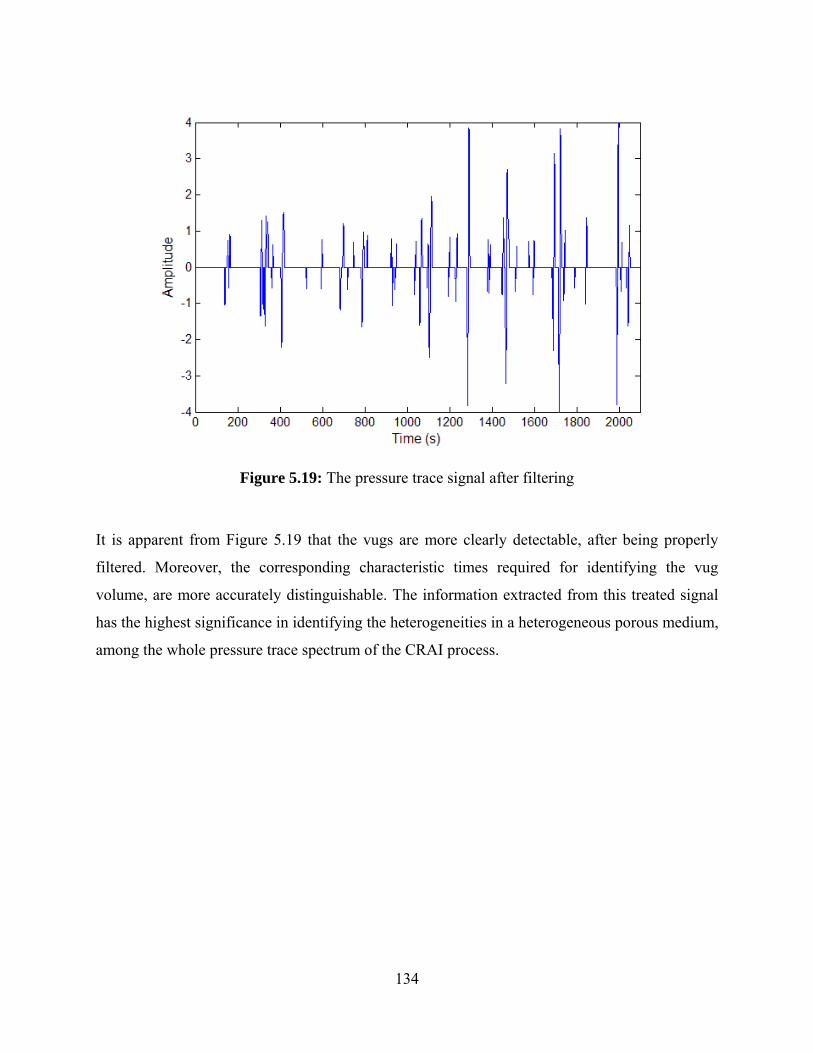
134
Figure 5.19: The pressure trace signal after filtering
It is apparent from Figure 5.19 that the vugs are more clearly detectable, after being properly
filtered. Moreover, the corresponding characteristic times required for identifying the vug
volume, are more accurately distinguishable. The information extracted from this treated signal
has the highest significance in identifying the heterogeneities in a heterogeneous porous medium,
among the whole pressure trace spectrum of the CRAI process.
135
5.6 Conclusions
Based on the experimental evidences, the CRAI porosimetry method was successfully
utilized for identifying the vugs or regions of high permeability embedded in a matrix
composed of smaller particles, such as vugular carbonate porous medium.
Vugs with volumes greater than 1 mm3 were accurately identified when a precise
pressure transducer and a low injection-rate of air (i.e., less than 0.5 mm3/s) into the
porous medium were employed.
The reparability tests verified a good agreement between the replicates in terms of
estimated vug volumes. Considering similar operating conditions, the invading sequence
of vugs was also found to be the same provided no initial non-wetting phase saturation
present in the model.
By employing a capillary barrier at the exit end of the sample, it was possible to access
the entire pore space of the porous medium prior to attaining the breakthrough capillary
pressure of the barrier.
The analysis of the porosimeter pressure trace was modified based on the deficiencies
found in the literature regarding the mercury porosimetry analysis. Different pore-scale
invasion mechanisms of the non-wetting phase into vuggy spaces were differentiated
based on the attributed pressure trace signature of the vug invasion.
The volume of vugs and clusters of higher permeability was precisely determined based
on the associated pressure trace during the CRAI porosimetry test.
It was extremely difficult to differentiate between the pressure trace signatures of gas
invasion into a vug from those of the gas invasion into a region of higher permeability.
The pressure signal obtained during the CRAI porosimetry was improved by applying the
Savitzky–Golay smoothing method. A second-order derivative filter was then applied to
the smoothed pressure signal, and finally, a cut-off threshold was applied to this filtered
pressure signal. The resulting signal processing procedure facilitates identifying the
vugular pore space in a vuggy porous medium.

136
Recommendations
There are several research opportunities to be followed for investigating the process of vapor
extraction of heavy oil and bitumen.
In the warm VAPEX experiments, it is worthwhile to operate the process at higher operating
pressures. Therefore, the combined effect of pressure and superheat may be investigated in a
high pressure cell to examine if economical oil production rate is achievable. The process may
also be optimized considering finer temperature levels, with the economy of process as the
objective function to be minimized.
The application of VAPEX process in a fractionally wet media may also be implemented in the
presence of connate water saturation to observe how the system behaves in the presence of a
third phase. Furthermore, the process of warm VAPEX may be more promising for an oil-wet
medium because of the improved film flow mechanism combined with improved mass transfer
upon drainage of solvent condensate on the bitumen interface.
There are a lot of research opportunities available for the application of VAPEX process in the
vuggy porosity media. The process was only investigated with a fixed matrix size and fixed vug
size. Factors such as the contrast in matrix and vug sizes, vug size distribution, vuggy-to-total
porosity (in a wider range) and the contrast in matrix-to-overall permeability will significantly
affect the process of extraction.

137
References
Aguilera, R.: Analysis of naturally fractured reservoirs from conventional well logs. J. Pet. Tech.
28, 764-772 (1976).
Alboudwarej, H., Akbarzadeh, K., Beck, J., Svreck, W.Y. and Yarranton, W.H.: Regular
solution model for asphaltene precipitation from bitumens and solvents. AICHE J. 49(1), 2948-
2956 (2003).
Allen, J.C., Redford, A.D.: Combination solvent-noncondensable gas injection method for
recovering petroleum from viscous petroleum-containing formations including tar sad deposits.
United States Patent No. 4109720, Texaco, New York, August 29, 1978, US application No.
740281, November 9 (1976).
Allen, J.C.: Gaseous solvent heavy oil recovery. Canadian Patent No. 446874, February 28
(1974).
Alley, E.R.: Water quality handbook. 2nd Edn., McGraw-Hill, (2006).
Anderson, W.G.: Wettability Literature Survey- Part 1: Rock/oil/brine interactions and the
effects of core handling on wettability. J. Pet. Tech. (October), 1125-1144 (1986).
Arns, C.H., Bauget, F., Limaye, A., Sakellariou, A., Senden, T.J., Sheppard, A.P., Sok, R.M.,
Pinczewski, W.V., Bakke, S., Berge, L.I., Øren P.-E., Knackstedt, M.A.: Pore-scale
characterization of carbonates using X-Ray microtomography. SPE J. 4, 475-484 (2005).
AspenPlus, Aspen Technology, Inc., Burlington, MA, USA (2006).
Ausbrooks, R.L., Hurley, N.F., May A., Neese, D.G.: Pore-size distribution in vuggy carbonates
from core Image, NMR and capillary pressure. Paper SPE 56506 presented at 1999 SPE Annual
Technical Conference and Exhibition in Houston, Texas, October 3-6 (1999).
Berenson, P.J.: Transition boiling heat transfer from a horizontal surface. Ph.D. Thesis,
Massachusetts Institute of Technology (MIT), (1960).

138
Bertrand, M.A., Kyte, J.R., Prikel, K.: Porosity and Lithology from logs in carbonate reservoirs,
42nd. Ann. SPE of AIME -Pall Meeting 10/1 -4.67, Preprint SPE 1867, 8 Esso Production Res.
Co. (1867).
Bradford, S.A., Leij, F.J.: Fractional wettability effects on two-and three-fluid capillary pressure-
saturation relations. Journal of Contaminant Hydrology 20, 89-109 (1995).
Brown, R.J.S., Fat, I.: Measurements of fractional wettability of oil field rocks by the nuclear
magnetic relaxation method. Trans. AIME 207, 262-264 (1956).
Buschkuehle, B.E., Hein F.J., Grobe, M.: An Overview of the Geology of the Upper Devonian
Grosmont Carbonate Bitumen Deposit, Northern Alberta, Canada. Natural Resources Research,
16(1), 3-15 (March 2007).
Butler, R.M., Mokrys, I.J.: Closed-loop extraction method for the recovery of heavy oils and
bitumens underlain by aquifers: the VAPEX process. JCPT 37(4), 41-50 (1998).
Butler, R.M., Mokrys, I.J.: Solvent analogue model of steam-assisted gravity drainage, AOSTRA
Journal of Research 5, 17-32 (1989).
Buza, J.W.: An overview of heavy and extra heavy oil carbonate reservoirs in the Middle East.
IPTC 1426, Presented at the International Petroleum Technology Conference, Malaysia, 3-5
December (2008).
Camacho-Velázquez, R., Vásquez-Cruz, M., Castrejón-Aivar, R., Arana-Ortiz, V.: Pressure-
transient and decline-curve behavior in naturally fractured vuggy carbonate reservoir. Paper SPE
77689 presented at the 2002 SPE Annual Technical Conference and Exhibition in San Antonio,
Texas, 29 September-2 October, 95-112 (2002).
Carey, Van P. Liquid vapor phase change phenomena: an introduction to thermodynamics of
vaporization and condensation processes in heat transfer equipment, 2nd Ed., Taylor & Francis,
(2007).
Chatzis, I.: A network approach to analyze and model capillary and transport phenomena in
porous media. Ph.D. thesis, University of Waterloo, Waterloo, Ontario, Canada (1980).

139
Chatzis, I.: Pore scale mechanisms of heavy oil recovery using the VAPEX process. Paper 2002-
198, presented at the Petroleum Society’s Canadian International Petroleum Conference 2002,
Calgary, Alberta, Canada, 11-13 June, (2002).
Cornell, J.A.: Experiments with mixtures: Designs, models and the analysis of mixture data. 2nd
ed., New York: John Wiley (1990).
Craig, F.F.: The reservoir engineering aspects of waterflooding. Henry L. Doherty series
Monograph, Society of Petroleum Engineers of AIME, 3 (1971).
Das, S.: Application of thermal recovery processes in heavy oil carbonate reservoirs. Paper SPE
105392, Presented at the 15th SPE Middle East Oil & Gas Show and Conference, held in Bahrain
International Exhibition, Kingdom of Bahrain, 11-17 March (2007).
Das, S.K., Butler, R.M.: Mechanism of the vapor extraction process for heavy oil and bitumen.
Journal of Petroleum Science and Engineering 21, 43-59 (1998).
Das, S.K.: VAPEX: an efficient process for the recovery of heavy oil and bitumen. SPE J. 50941
232-237 (1998).
Desbrandes, R.: Théorie et interprétation des diagraphies, Technip, 250-254 et 269-275 (1968).
DiCarlo, D.A., Sahni, A., Blunt, M.J.: Three-Phase Relative Permeability of Water-Wet, Oil-
Wet, and Mixed-Wet Sandpacks. SPE J. 5(1), 82-91 (2000).
Dixit, A.B., McDougall, S.R., Sorbie, K.S.: Analysis of Relative Permeability Hysteresis Trends
in Mixed-wet Porous Media Using Network Models. SPE paper 39656, presented at the 1998
SPE/DOE Improved Oil Recovery Symposium, 19-22 April 1998, Tulsa, Oklahoma (1998).
Dunn, S.G., Nenniger, E.H. Rajan, V.S.V.: A study of bitumen recovery by gravity drainage
using low-temperature soluble-gas injection. Cadn. J. Chem. Eng. 67, 978-991 (1989).
Dusseault, M.B., Shafiei, A.: Ullmann's Encyclopedia of Industrial Chemistry, Wiley-VCH, to
appear (2010).
140
Fahes, M., Firoozabadi, A.: Wettability alteration to intermediate gas-wetting in gas-condensate
reservoirs at high temperature. SPE J., (December), 397-407 (2007).
Firoozabadi, A.: Thermodynamics of hydrocarbon reservoirs. McGraw Hill (1999).
Focke, J.W., Munn, D.: Cementation exponents in Middle Eastern carbonate reservoirs. SPE
Formation Evaluation 2, 155-167 (1987).
Frauenfeld, T, Deng, X. and Jossy, C.: Economic analysis of thermal solvent processes.
Canadian International Petroleum Conference (CIPC), 57th Annual Technical Meeting, Paper
2006-164, Calgary, Alberta, 13-15 June (2006).
Frauenfeld, T., Jossy, C. and Wang, X.: Experimental studies of thermals solvent oil recovery
process for live heavy oil. Canadian International Petroleum Conference (CIPC), 56th Annual
Technical Meeting, Paper 2005-151, Calgary, Alberta, 7-9 June (2005).
Frauenfeld, T., Jossy, C., Bleile, J., Krispin, D., Ivory, J.: Experimental and economic analysis of
thermal solvent and hybrid solvent processes. Canadian International Petroleum Conference
(CIPC)/SPE Gas Technology Symposium Joint Conference (The Petroleum Society’s 59th
Annual Technical Meeting), Paper 2008-149, Calgary, Alberta, 17-19 June (2008).
Friedrich, K.: The effect of non-condensable gas on VAPEX process. M.A.Sc. Thesis, University
of Waterloo, Waterloo, Ontario, Canada (2006).
Gaulier, C.: Studying vugular rocks by constant-rate mercury injection, paper SPE 3612
presented at the 1971 SPE Annual Meeting, New Orleans, Oct. 3-6 (1971).
Gonzalez, R.C., Woods, R.E.: Digital image processing. Prentice Hall, (2002).
Guyer, E.C.: Handbook of applied thermal design. 1st Ed., CRC Press, (1999).
Hair, M.L., Tripp, C.P.: Alkylchlorsilane reactions at the silica surface. Colloids and Surfaces A:
Physiochemical and Engineering Aspects 105, 95-103 (1995).
Hidajat, I., Mohanty, K.K., Flaum, M., Hirasaki, G.: Study of vuggy carbonates using NMR and
X-Ray CT scanning. J. SPE Res. Eval. and Eng,. 7 (5), 365-377 (2004).

141
Holbrook, O.C., Bernard, G.G.: Determination of wettability by dye adsorption. SPE 896-G
Petroleum Transactions, AIME 213, 261-264 (1958).
Hurley, N.F., Zimmermann, R.A., Pantoja, D.: Quantification of vuggy porosity in a dolomite
reservoir from borehole images and core, Dagger Draw field. New Mexico paper SPE 49323
presented at the 1998 SPE Annual Technical Convention and Exhibition New Orleans,
Louisiana, September 23-26 (1998).
Ivory, J., Frauenfeld, T. and Jossy, C.: Thermal solvent reflux and thermal solvent hybrid
experiments. Canadian International Petroleum Conference (CIPC), 58th Annual Technical
Meeting, Paper 2007-067, Calgary, Alberta, 12-14 June (2007).
Iwere, F.O., Moreno, J.E., Apaydin, O.G., León Ventura, R., Garcia, J.L.: Vug characterization
and pore volume compressibility for numerical simulation of vuggy and fractured carbonate
reservoirs. Paper SPE 74341 presented at the 2002 SPE International Petroleum Conference and
Exhibition in Mexico, Villahermosa, Mexico, February 10-12 (2002).
Jaeger, H.M., Nagel, S.R.: Physics of granular states. Science 255, 1523-1531 (1992).
James, L., Chatzis, I.: Details of gravity drainage of heavy oil during vapor extraction. Presented
at the International Society of Core Analysis, held in Abu Dhabi, UAE, 5-9 October, (2004).
James, L.A., Rezaei, N., Chatzis, I.: VAPEX, Warm VAPEX, and Hybrid VAPEX–The state of
enhanced oil recovery for in-situ heavy oils in Canada. J. Cadn. Pet. Tech., 47 (4), 12-18 (2008).
James, L.A.: A closer look at VAPEX. M.Sc. thesis, University of Waterloo, Waterloo, Ontario,
Canada (2003).
James, L.A.: Mass transfer mechanisms during the solvent recovery of heavy oil. Ph.D. Thesis,
University of Waterloo, Waterloo, Ontario, Canada, (2009).
Jorgensen, D.G.: Estimating permeability in water-saturating formations. The Log Analyst 29
401-409 (1988).

142
Knackstedt, M.A., Arns, C. H., Sheppard, A.P., Senden, T.J., Sok, R.M., Cinar, Y., Pinczewski,
W.V., Ioannidis , M., Padhly, G.S.: Archie’s exponents in complex lithologies derived from 3D
digital core analysis. Presented at the SPWLA 48th Annual Logging Symposium held in Austin,
Texas, United States, June 3-6, (2007a).
Knackstedt, M.A., Arns, C.H., Sheppard, A.P., Senden, T.J., Sok, R.M., Cinar, Y., Olafuyi, A.
O., Pinczewski, W.V., Padhy, G., Ioannidis, M.: Pore scale analysis of electrical resistivity in
complex core material. Presented at the International Symposium of the Society of Core Analysts
held in Calgary, Canada, 10-12 September (2007b).
Kniaź, K.: Influence of size and shape effects on the solubility of hydrocarbons: the role of
combinatorial entropy. Fluid Phase Equilibria. 68, 35-46 (1991).
Kontogeorgis, G.M., Nikolopoulos, G.I., Fredenslund, A., and Tassios, D.P.: Improved models
for the prediction of activity coefficients in nearly athermal mixtures. Part II. A theoretically-
based GE-model based on the van der Waals partition function, Fluid Phase Equilibria, 127, 103-
121 (1997).
Laroche, C., Vizika, O., Kalaydjian, F.: Wettability Heterogeneities in Gas Injection:
Experiments and Modeling. Petroleum Geoscience, 5, 65-69 (1999).
Lederer, E.L.: Proceeding, World Petroleum Congress, London, 2, 526-528 (1933).
Leroy, P., Revil, A., Kemna, A., Cosenza, P., Ghorbani, A.: Complex conductivity of water-
saturated packs of glass beads. J. Col. and Int. Sci. 321, 103-117 (2008).
Lucia, F.: Petrophysical parameters estimated from visual descriptions of carbonate rocks: A
field classification of carbonate pore space. J. Pet. Tech. 35, 629-637 (March 1983).
Mather, P.M., Koch, M.: Computer processing of remotely-sensed images. 3rd Edition, John
Wiley (2004).
Melrose, J.C.: Interfacial phenomena as related to oil recovery mechanisms. Can. J. Chem.Eng.
48, 638-644 (1970).

143
Melrose, J.C.: Wettability as related to capillary action in porous media. SPEJ, 259-263 (1965).
Mirzaei, M., DiCarlo, D., Ashouripashaki, M., Dehghanpour, H., Aminzadeh, B.: Prediction of
three-phase gravity drainage from two-phase capillary pressure curves. SPE paper 129945,
presented at the 2010 SPE Improved Oil Recovery Symposium, 24-28 April 2010, Tulsa,
Oklahoma (2010).
Moghadam, S., Nobakht, M., Gu, Y.: Theoretical and physical modeling of a solvent vapuor
extraction process (VAPEX) process for heavy oil recovery. J. Pet. Sci. Eng. 65, 93-104 (2009).
Mokrys, I.J. and Butler, R.M.: In-situ upgrading of heavy oil and bitumen by propane
deasphalting: the VAPEX process. SPE-25452 (1993).
Morgan, W.B., Pirson, S. J.: The effect of fractional wettability on the Archie saturation
exponent. Trans. SPWLA, Fifth Annual Logging Symposium, 13-15 May, 1964, Midland, TX,
USA, (1964).
Morrow, N.R.: Physics and thermodynamics of capillary action in porous media. Ind. and Eng.
Chem. 63, 32-56 (1970).
Morrow, N.R.: Wettability and its effect on oil recovery. JPT, SPE Distinguished Authors Series,
(December), 1476-1484 (1990).
Motealleh, S.: Mechanistic study of menisci motion within homogeneously and heterogeneously
wet porous media. Ph.D. Thesis, The University of Texas at Austin, Austin, TX, USA (2009).
Nenniger, E.H.: Hydrocarbon recovery. Canadian Patent No. 1059432, Hatch Associates, July 31
(1979).
Nenniger, J., Nenniger, E.: Method and apparatus for stimulating heavy oil production. U.S.
Patent No. 6883607 B2, Issued April (2005).
Nenniger, J.E., Dunn, S.G. How fast is solvent based gravity drainage? Canadian International
Petroleum Conference (CIPC)/SPE Gas Technology Symposium Joint Conference (The

144
Petroleum Society’s 59th Annual Technical Meeting), Paper 2008-139, Calgary, Alberta, 17-19
June (2008).
Nenniger, J.E., Gunneweik, L.: Dew point vs. bubble point: A misunderstood constraint on
gravity drainage processes. Canadian International Petroleum Conference (CIPC), 60th Annual
Technical Meeting, Paper 2009-065, Calgary, Alberta, 16-18 June (2009).
Nettelblad, B.: Electrical and dielectric properties of systems of porous solids and salt containing
nonpolar liquids. J. Appl. Phys. 79 (9), 1 May (1996).
Noh, M., Firoozabadi, A.: Wettability alteration in gas condensate reservoirs to mitigate well
deliverability loss by water blockage. SPE Res. Eval. and Eng. (August), 676-685 (2008).
Nutting, P.G.: Some physical and chemical properties of reservoir rocks bearing on the
accumulation and discharge of oil. In: Problems of Petroleum Geology, Wrather, W.E., and
Lahee, F.H., (eds.), AAPG, Tulsa, (1934)
Oduntan, A.R.: Heavy oil recovery using the VAPEX process: scale-up and the mass transfer
issues. M.A.Sc. Thesis, University of Waterloo, Waterloo, Ontario, Canada (2001).
Oishi, T., Prausnitz, J.M.: Estimation of solvent activities in polymer solution using group-
contribution method. Ind. Eng. Chem. Proc. Des. Dev. 17(3), 333-339 (1978).
Orfanidis, S.J.: An introduction to signal processing. Prentice Hall (1995).
Padhy, G. S., Lemaire, C., Ioannidis, M.A.: Magnetic resonance methods for the characterization
of the pore space in vuggy carbonates. Proceedings of the Annual Symposium of the Society of
Core Analysts, SCA2006-30, Trondheim, Norway 12-16 September (2006).
Padhy, G.S., Ioannidis, M.A., Lemaire, C., and Coniglio, M.: Measurement and interpretation of
non-archie resistivity behavior in model and real vuggy carbonates. SCA 2006: Improved Core
Analysis driven by Field Development Needs, SCA2006–11 (September 2006).

145
Parcher, J.F., Weiner, P.H., Hussey, C.L., Westlake, T.N.: Specific retention volumes sand
limiting activity coefficients of C4-C8 alkane solute in C22-C36 n-alkane solvents. J. of Chem.
and Eng. Data, 20(2), 145-151 (1975).
Parsaei, R., Chatzis, I.: The effect of macroscopic heterogeneities in wettability on tertiary oil
recovery using the gas-assisted gravity drainage process. Presented at the 10th International
wettability symposium, held in Abu Dhabi, UAE, 26-28 October, (2008).
Peng, D.-Y., Robinson, D.B.: A new two-constant equation of state. Ind. Eng. Chem. Fund. 15,
59-64 (1976).
Peramanu, S., Pruden, B.B., Rahimi, P.: Molecular weight and specific gravity distributions for
Athabasca and Cold Lake bitumens and their saturate, aromatic, resin and asphaltene fractions.
Ind. Eng. Chem. Res., 38, 3121-3130 (1999).
Perry R.H., Green, D.W.: Perry’s chemical engineering handbook. 8th Edn., McGraw-Hill,
(2007).
Prausnitz, J.M., Lichtenthaler, R.N. Azevedo, E.G.: Molecular thermodynamics of fluid-phase
Equilibria. 3rd Edn, Prentice-Hall Inc., Englewood Cliffs, NJ (1998).
Ramakrishnan, V.: In-situ recovery of heavy oil by VAPEX using propane. M.Sc. Thesis,
University of Waterloo, Waterloo, Ontario, Canada (2003).
Rao, A.V., Latthe, S.S., Dhere, S.L., Pawar, S.S., Imai, H., Ganesan V., Gupta S.C., Wagh, P.B.:
Control on wetting properties of spin-deposited silica films by surface silylation method. Applied
Surface Science 256, 2115–2121 (2010).
Rezaei, N., Chatzis, I.: Identification of heterogeneities in vugular porous media using constant-
rate air injection porosimetry. J. Pet. Sci. Eng. Submitted (2009).
Rezaei, N., Mohammadzadeh, O., Chatzis, I.: Warm VAPEX: a thermally improved vapor
extraction process for recovery of heavy oil and bitumen. Energy & Fuels, Submitted (2010a)
146
Rezaei, N., Mohammadzadeh, O., Parsaei, R., Chatzis, I.: The effect of reservoir wettability on
the production characteristics of the VAPEX process. Transport in Porous Media, submitted
(2010b)
Roof, J.G.: Snap-off of oil droplet in water-wet pored. SPE J. 10, 85-90 (1970).
Roth, A.: Vacuum technology. 3rd Ed., North–Holland, (1990).
Rousseau, R.W.: Handbook of separation process technology. John Wiley and Sons Inc., (1987)
Salathiel, R.A.: Oil recovery by surface film drainage in mixed-wettability rocks. J. Pet. Tech.,
25(10), 1216-1224 (1973)
Salem, H.S., Chilingarian, G.V.: The cementation factor of Archie’s equation for shaly sandstone
Reservoirs. J. Pet. Sci. Eng. 23, 83-93 (1999).
Sanchez, I.C., Lacombe, R.H.: An elementary molecular theory classical fluids. J. Phys. Chem.
80(21), 2352-2362 (1976).
Savitzky, A., Golay, M.J.E.: Smoothing and Differentiation of Data by Simplified Least Squares
Procedures. Analytical Chemistry, 36, 1627-1639 (1964).
Scheffé, H.: Experiments with mixtures. J. R. Stat. Soc., B, 20(2), 344-360 (1958).
Sedaee Sola, B., Rashidi, F.: Application of the SAGD to an Iranian carbonate heavy-oil
reservoir. SPE 100533 (2006).
Shahizadeh, N., Bertrand, E., Dauplait, J.P., Borgetti, J.C., Vié, P., Bonn, D.: Effect of wetting
on gravity drainage in porous media. Transport in Porous Media, 52, 213-227 (2003).
Sharma, M.M., Garrouch, A., Dunlap, H.F.: Effect of wettability, pore geometryand stress on
electrical conduction in fluid-saturated rocks. The Log Analyst, 32, 511-526 (1991).
Shu, W.R.: A viscosity correlation for mixtures of heavy oil, bitumen and petroleum fractions.
SPE J. 277-287 (June 1984).

147
Smith, J.D., Chatzis, I., Ioannidis, M.A.: A new technique to measure the breakthrough capillary
pressure. JCPT, 44 (11), 1-7 (2005).
Song, C., Wang, P., Makse, H.A.: A phase diagram for jammed matter. Nature, 453, 629-632
(2008).
Speight, J.G.: Handbook of petroleum analysis. John Wiley and Sons Inc., (2001).
STATISTICA Release 8. 2009, StatSoft® Inc., Tulsa, OK, USA, http://www.statsoft.com/
Toledo, P.G., Scriven, L.E., Davis, H.T.: Pore-space statistics and capillary pressure curves from
volume-controlled. SPE, 61-65 (1994).
Vizika, O., Lombard J.M.: Wettability and spreading: two key parameters in oil recovery with
three-phase gravity drainage. SPE Res. Eng., 11(1), 54-60 (1996).
Voutsas, E.C., Kalospiros, N.S., Tassios, D.P.: A combinatorial activity coefficient model for
symmetric and asymmetric mixtures. Fluid Phase Equilibria, 109, 1-15 (1995).
Washburn, E.W.: Note on a method of determining the distribution of pore sizes in porous
materials. Proc. Natl. Acad. Sci. 7, 115-116 (1921).
Wong, P., Koplik, J., Tomanic, J.P.: Conductivity and permeability of rocks. Phys. Rev. B 30
(11), 6606-6614 (1984).
Wu, S., Firoozabadi, A.: Permanent alteration of porous media wettability from liquid-wetting to
intermediate gas-wetting. Transp Porous Med., in Press (2010).
Yarranton, W.H. and Masliyah, J.H.: Molar mass distribution and solubility modeling of
asphaltenes. AICHE J., 42(12), 3533-3543 (1996).
Yaws, C.L.: Yaws’ handbook of thermodynamic and physical properties of chemical
compounds. Knovel, (2003).
Yazdani, A., Maini, B.: Effect of drainage height and grain size on production rates in the
VAPEX process: Experimental study. SPE 89409, SPE Res. Eval. and Eng. 205-213 (2005).

148
Yuan, H.H., Swanson, B.F.: Resolving pore-space characteristics by rate-controlled porosimetry.
SPE Form. Eval., 17-24 (1989).
Copyright © 2022 FDOKUMEN