Title: Experimental investigations and seismic analysis for ...
32
XA9952705 Title: Experimental investigations and seismic analysis for benchmark study of 1000 Mw WWER type units Contributor: S. Sachanski Date: November 1995
-
Upload
khangminh22 -
Category
Documents
-
view
1 -
download
0
Transcript of Title: Experimental investigations and seismic analysis for ...

XA9952705
Title: Experimental investigations andseismic analysis for benchmarkstudy of 1000 Mw WWER typeunits
Contributor: S. Sachanski
Date: November 1995

FINAL REPORT
ON RESEARCH CONTRACT No 7438/Rl/EN
EXPERIMENTAL INVESTIGATIONS AND SEISMIC
ANALYSIS FOR BENCHMARK STUDY
OF 1000 MW WWER TYPE UNITS
(Water-Cooled and Moderated Reactor)
NUCLEAR POWER PLANT "KOZLODUY"
Part of Coordinated Program
"Benchmark Study for Seismic Analysis and Testing
of WWER- Type Nuclear Power Plants"
BUILDING RESEARCH INSTITUTE (NISI)
Sofia, Bulgaria
Chef Scientific Investigator :
Prof. Dr. S. Sachanski
1 November 1994-31 October 1995

F I N A L R E P O R T
ON RESEARCH CONTRACT NO 7438/R1/EN
1 November 1994-31 October 1995
1. INTRODUCTION
In this contract final report are summarized the carried out researches and obtained results
presented in :
* First progress report [1] for the period 1 November - 30 April 1995 - sent to IAEA on 20
April 1995;
* Second progress report [2] (1 May - 1 August 1995) sent to IAEA on 4 August 1995;
* Third progress report (2 August - 31 October 1995) - The obtained results are summarized
in this report and are presented to NPP Kozloduy and Swiss partners.
The circumstances in alternation the contract program concerning the testing were discussed
with Mr. A. Gurpinar (IAEA) and are explained in [1] part 1. The experimental investigations
for verification of the obtained results were discusses in St. Petersburg Benchmark RCM (19 -
23 June 1995) and shall start in November 1995 - continuing in 1996.
Some problems for upgrading of the reactor containment prestressing which are related with
large laboratory and technological testing, iniciated in this contract, are realized by separate
contract between NPP Kozloduy and the Building Research Institute - Sofia.
2. DESCRIPTION OF RESEARCH CARRIED OUT
The present investigations were carried out in close cooperation with Switzerland research
team : Stussi & Partner, Basler & Hofmann and Resonance SA. The general coordination was
in the frame of the IAEA Benchmark Research program.
The following analyses were parformed:
2.1. Defining terms of references, criteria, design parameters and methods for analysis
* 1000 MW units 5 and 6 containment presterssing - load combination;
* Steel and concrete characteristics of the structures;
* Containment loads;
* Conceptions and parameters for defining the additional prestress losses in containment at
LOCA;
* 1000 MW veltilation steel chimney - 102.5 m
FINAL REPORT BENCMARK STUDY OF 1000 MW WWER TYPE UNITS

2.2. Developement of 3D and 2D mathematical models for diesei generator stations
one, two and three cases :
* Criteria and desing parameters
* Seismic analyses
2.3. Supports and anchorages analyses and seismic capacity estimation for :
* Main loop puping - supports of the steam generators SG 1 - SG4
and main coolant pumps MCP1 - MCP4 (fig. 1)
* Main loop piping - snubbers of SGI - SG4 and MCP1 - MCP4 (fig.2)
* Pressurized loop 1 piping - hangers, snubbers, shafts and supports (fig-3)
* Hydroacumulator piping - hangers (fig.4)
* TQ 22 piping system - hangers, snubbers and transitions (fig-5)
* TQ 23 piping system - hangers, snubbers and transitions (fig-6)
2.4. Methodology for verification of component anchorages
2.4.1. General principles
* For seismic capacity estimation are applied the principles and methodology proposed in [6];
* Failure modes evaluation and inelastic capacity demand ration, Fu and the corresponding
ductility ratio u. are interpreated only for ela stic stage - for higher safety;
* The strenght of the concrete B40 and steel are guaratied from the Bulgarina standarts and
laboratory control testing. The concrete in situ is with higher strenght, but in analyses are
applied the code design characteristics;
* The static capacity is based on code specified yeild capacity with reduction factors for
flexure, tension, compresion and respective combinations;
* For higher safety, the 1.7 times increase of the allowable normal stresses was not applied.
2.4.2. Methodology for verification of component anchorage
The component anchorage is of great importance for the seismic response and safety of
equipment systems and components. The equipment anchorages were verified for adequate
strenght and base stiffness.
FINAL REPORT BENCMARK STUDY OF 1000 MW WWER TYPE UNITS

The anchorages of the support plates in concrete, as well as the fixing of the snubbers and
other element to the support plates were verified by analyses of the weldings. The seismic
adequacy of the equipment anchorage has been defined by:
a.) Inspections of anchorages by analyses of drawings, walkdown and detailed inspections for
defining :
* type of anchorages (RT), size and location;
* visual check of instalation adequacy and quality;
* embedment lenght (RL) and gaps between plate and concrete;
* spacing - bolt to bolt and between anchorages (RS);
* concrete strenght (RF) and conditions - cracks (RC);
* equipment base stiffness and strenght, anchorage and structural load path.
b.) Determination the allowable capacity (Pall) of the anchors from the nominal (Pnom) and
reduction factors defined in a.)
Pall = 0.5 Pnom (2.1)
c.) Determination the seismic anchor loads for each direction of motion
This is done by Stussi & Partner [4,5].
d.) Calculation of the combined seismic load (CSL) on each anchor for the three directions by
SRSS rule,
e.) Combination of the loads (CL) for each anchorage in the three direction
CL= 1.0 W + 1.0 T°+ 1.0 CSL (2.2)
where: W - weight; T° - tempeture; CSL - combined seismic load,
f.) Calculations of the combined seismic loads by SRSS for each direction,
g.) Comparision of the seismic capacity loads of the anchores to the total anchore loads.
These comparisions have been performed by two methods [6] and [8] as follows :
According to [6]:
conservative V / Vail + P / Pall <= 1.0 (2.3)
unconservative(V / Vail)2 + (P / Pall)2 <=1.0 (2.4)
more realistic P/Pall<=1.0 V/Vall<=0.3 (2.5)
and 0.7 P /Pall + V/Vall<=1.0 for 0.3 <= V/Vall<=1.0 (2.6)
For welds: (P/Fw)2 + (V/Fw)2 <= 1.0 (2.7)
Fw - allowable load for the weld
FINAL REPORT BENCMARK STUDY OF 1000 MW WWER TYPE UNITS
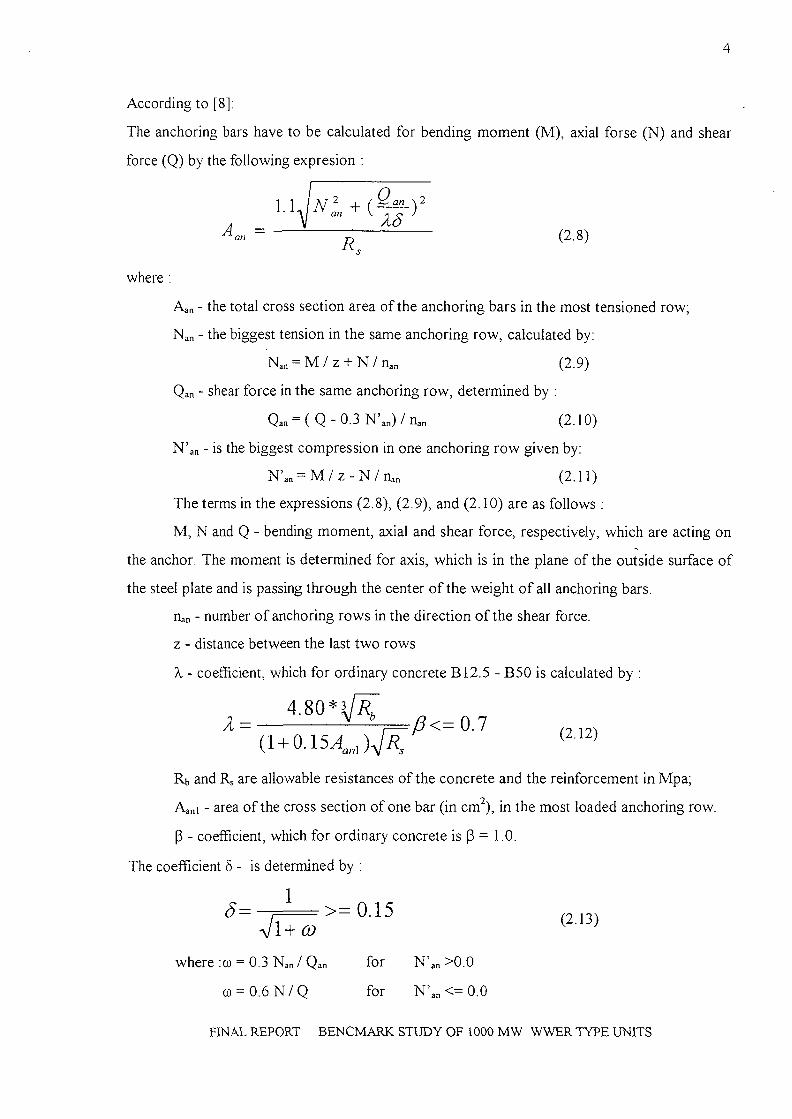
According to [8]:
The anchoring bars have to be calculated for bending moment (M), axial forse (N) and shear
force (Q) by the following expresion :
A - V .A a n - (2.8)
where :
Aan - the total cross section area of the anchoring bars in the most tensioned row,
Nan - the biggest tension in the same anchoring row, calculated by:
Nan = M / z + N/n a n (2.9)
Qan - shear force in the same anchoring row, determined by :
Qan = (Q-0 .3N' 3 n ) /n a n (2.10)
N'an - is the biggest compression in one anchoring row given by:
N'an = M / z - N / n a n (2.11)
The terms in the expressions (2.8), (2.9), and (2.10) are as follows :
M, N and Q - bending moment, axial and shear force, respectively, which are acting on
the anchor. The moment is determined for axis, which is in the plane of the outside surface of
the steel plate and is passing through the center of the weight of all anchoring bars.
nan - number of anchoring rows in the direction of the shear force.
z - distance between the last two rows
X - coefficient, which for ordinary concrete B12.5 - B50 is calculated by :
4 . 8 0 * ^(212)0.15^)^
Rb and Rs are allowable resistances of the concrete and the reinforcement in Mpa;
Aani - area of the cross section of one bar (in cm2), in the most loaded anchoring row.
P - coefficient, which for ordinary concrete is p = 1.0.
The coefficient 5 - is determined by :
5 > = 0 A 5 ( 213)
where :co = 0.3 Nan / Qan for N'an >0.0
co = 0 .6N/Q for N'an<=0.0
FINAL REPORT BENCMARK STUDY OF 1000 MW WWER TYPE UNITS

If in the anchoring bars there is not tension, 5 =1.0
The cross section area of all rows is taken equal to those, in the most loaded one.
In expressions (2.9), (2.10) and (2.11) the axial force is possitive (tension), if it is directed
outside of the concrete.
If the forces Nan, N'an and Qan, determined by (2.9), (2.10) and (2.11) are negative (<0.0), than
in expressions (2.8), (2.10) and (2.13) they are taken as zero. Besides, if Nan is negative, in
experession (2.10) instead of "N'an" is taken "N".
When the anchor is placed on the upper surface of the element, the coefficient A, is reduced
with 20 % and "N V is taken equal to zero.
FINAL REPORT BENCMARK STUDY OF 1000 MW WWER TYPE UNITS

12= b2
'Loop-&J
6
Fig.1

Bl-JUN-1995 12:5c; STUSSI STUDER STblNtK
(10ti&tn - todj>- ftpim
7
Fig. 2.

/
L'
O
s
Fig- 3.

ic
Fig. 4.

•\0
21 -'/ion o-/

25 -
o
Fig..6

12
3. RESULTS OBTAINED
For analyses of structures were prepared term of reference, criteria, design parameters and
methods for analysis of:
* Containment prestressing;
* Ventilation steel chimney;
* Diesel generator buildings (DGB)
The seismic safety of DGB was investigated by 3D and 2D mathematical models.
3.1. Terms of reference, criteria, design parameters and methods for analysis of
containment prestressing NPP Kozloduy 1000 MW units 5 and 6
3.1.1. Containment prestressing
a.) Load combination (LC)
al.) Load - normal operation (LCI):
LCI = DL + 0.8 LL + CrDW + 0.95 Sw + 0.9 WL (3.1)
a2.) Additional loads - operational occurences (LC2) :
LC2 = CrDW + 0.30 CrLL (3.2)
where :DL - dead load; LL - live load; WL - wind load Sw-snow load
CrDW = 600 t (crane dead weight)
CrLL = 700 t (crane live load)
a3.) Additional loads - accident conditions (LOCA) :
LC3= Ip + T °C (3.3)
Ip = 50 t/m^ (internal pressure);
T = 150° C - internal temperature for 10 hours.
a4.) Sesmic load combination (SLC)
SLC1 =L1 +SL_2
= DL + 0.8 LL + CrDW+ O 8 S w + A l W L + SL_2 (3.4)
SLC2 =L1 +L2 + SL_2
= DL + 0.8 LL + CrDW + 03 CrLL + 08 Sw +_O3. WL + SL_2 (3.5)
SL + LOCA = S L C l + I p + T ° C
- DL + 0.8 LL + CrDW + 0.8 Sw + 0.3 WL + SL_2 + Ip + T °C (3.6)
FINAL REPORT BENCMARK STUDY OF 1000 MW WWER TYPE UNITS

13
3.1.2. Steel and concrete characteristics
a.) Steel :
steel bars, plates and angles AI : Rsn = fy = 235 Mpa, Rs = fa = 225 Mpa
Rsn = fy = 410MPa Rs = fa = 375 Mpa
Ro.i = 0.86 Rsn Ro.2 =0.88 Rsn
Rsn =1360 Mpa Rs = 1110 Mpa
Rsn = 14000 kN Rs=10 000kN
Ro.i = 0.61 Rsn Ro.2 = O.7Rsn
steel bars class A III :
Es=210 000Mpa
steel 6 5 mm class B II :
cables (450 05) :
Reduction : Rs = 0.85 x 10 000 = 8500 kN E = 0.85 x 2.0 106 = 1.7 106 Mpa
b.) Concrete B40 :
compresion : Rbn = fu = 29 MPa
tension : Rbtn = fu = 2.10 Mpa
Rb = fa = 22 Mpa
Rbt = fa= 1.4 Mpa
3.1.3. Containment loads
a.) Dead load: DL + prestressing from tendons at Rs = 10 000 kN
b.) Crane loads :
CrDW = 700 t - two horizontal and vertical components
CrLL = 600 t ,
CrLL = 0.0 for horizontal seismic components (Flexible hanging)
CrLL = 0.3 x 600 for vertical component only
c.) Snow load (Sw) :
Sw=0.7 kN/m2
d.) Wind load :
Wn=Wm AzCel, (3.7)
where : Wm = 0.48 kN/m2 - loading for NPP Kozloduy region
Az is factor for wind velocity 40<h<60 m : Az=1.6;
Cel =K1 CP (fig.3.1 -3.3)
dl.) For cilindrical part (level 41.40 - 67.45)
h l / D = 0.4 forCp>0 Kl=1.0
for 0° < 'p' < 35 o (fig.3.3) CP go down from 1.0 to 0.0 Wn=0.768 kN/m2
FINAL REPORT BENCMARK STUDY OF 1000 MW WWER TYPE UNITS

14
for 35 o < ' p ' < H5 o (flg.3.3) C|3 go down from 0.0 to -1.2 Wn= -0.805 kN/m2
for 115 ° < 'p' < 180 0 (fig.3.3) Cp = - 0.4 Wn= -0.266 kN/m2
d2. For dome of the containment
Az=1.7 for 60 < h < 70 Ce2 = -0.5 for f / d = 1/6 from fig.3.3
Wn = 0.48 x 1.7 x -0.5 = -0,404 kN/m2
e.) LOCA conditions - temperature 150 °C for 10 hours
3.1.4. Conceptions and parameters for defining the additional prestress losses
in containment at LOCA
a.) LOCA conditions :
Preasure increase for one hour to 50 t/m2
Temperature increase from 20 °C to 150 °C for 10 hours
Crane is not in operation
b.) Additional prestress losses in the tendons should be calculated [9] from :
bl.) brief shrinkage in concrete 40 MPa
b2.) creep in concrete 15 % reduction 0.85 <3bP
b3.) steel relaxation :
BII 0.0012 AtsoSp A III 0.0010 AtsaSp
b4.) differences of the deformation
in steel and concrete ( as t - a.bt ) Ats Es ps
a s l 10 "6 C "' = 12.5 for AIII = 12.0 for B II
a * 10"6C"' = 9.75; Es= 200 000 Mpa; ps=0.95
b5.) y, = 1.1 - load coefficient for °T
b6.) Rigidity of cross section at reversable bending moment (simplified)
(3.8)
M1 _ M 0.95 0_9 Nlol
r hoz AsEs (q>f + 0.9)bh0Eb v h0EsAs
z = 0.97^,0, = 0.97 M/N t o t (3.9)
FINAL REPORT BENCMARK STUDY OF 1000 MW WWER TYPE UNITS

15
Kot - total normal force with prestressing
(Pbi = 0.85 - short duration creeping in concrete
cp b2 = 1-0 short duration temp effect
(3 b = 0.9 for t=70 °C in the cross section center of gravity
v = 0.65 for short duration °T effects
EM = 0.9 Eb = 0.9 x 35 000 MPa
Est = 0.7 Es - 0.7 x 190000 Mpa at t=70 °C; v = 0.4
c.) Lenghtening of the axis in each zone should be calculated by computer
or bv simplified analysis with reduced cross section rigidity (Bred)
Bred = B + (Bl - B) cpm (3.9)
B - rigidity with cracks from (3) and (4)
Bl - rigidity without cracks
(pm = exp(- (M-Mcr)/ (1.25 Mcr)) (3.10)
atM>=2.5Mcr : q>m = 0; Bred = B;
Sred,t = £ti; (l/r)red,t = ( l / r )u
M, Mcr - max M and M in perpendicular direction
The relative lenghtening of the axis :
Sred,t = SU + (8 t2 - SU) (pm (3.11)
8t2 and 8U - lenghtening without and with cracks respectively
3.1.5. Ventilation steel chimney (102.5 m)
a.) Load combination
LC1= LI = DL + 0.8 LL + 0.95 Sw + 0.9WL + 0.95 T°C (3.12)
-30 °C < T°C <+40 °C
SLC2 = DL + 0.8 LL + 0.90 Sw + 0.3WL + 0.95 T°C + SL-2 (3.13)
b.) Loads specification
* Dead load (DL) - weight of the structure should be determined from the drawings
* Live loads LL = 2.0 kN/m2 for chimney platform
* Snow load (Sw) Sw = 0.7 kN/m2 for the region of NPP Kozloduy
* Wind load (WL) - WL = Wn + Wp,n , and wind resonance W res
bl.) Wn = mean (static) wind component
Wn = Wm SRz C - similar to containment 2.1.3.d
FINAL REPORT BENCMARK STUDY OF 1000 MW WWER TYPE UNITS

16
b2.) Wp,n = wind pulsation (dynamic) component
Wp,n = m £, r\ y
£, = dynamic coefficient determined by fig.3.5, depending of 8 :
\AWm( 3 l 4 )
where :
m - mass; Wm = 0.48 kN/m2; fl - first mode of natural vibration
y - horizontal displacement at level "z" in modes of natural vibration (fig.3.4)
r\ - coefficient, defined after deviding of the chimney on to "r" parts, with constant
wind loading as follows :
- — (3.15)tk = 1
Wpn,k = Wn q v (3.16)
Wn is determined for "k" -th part; q - coefficient of pulsation f(h) - from table;
v - coeficient for pulsation space correlation; f(s)- from table
c.) Wind resonance if fl < fl = 4.3 Hz
Intensity of the aerodynamic force:
F(y,t) = F(y) sin cot (3.17)
F(y) = Focc(y) (3.18)
Fo = amplitude of the aerodynamic force on the top of the chimney
Fo = 0.0002 Va2dl (3.19)
a(y) = relative ordinate for first mode of natural vibration
co = 27r/Tl [rads"1]
V a = 5 d l / T l [ m / s ]
Yres(y) = 0.8 (71 / 5) Yst(y) (3.20)
Mres(y) = 0.8(7r/5)Mst(y) (3.21)
FINAL REPORT BENCMARK STUDY OF 1000 MW WWER TYPE UNITS

17
Design Y(y), M(y)
Tlr~X • r T ^ / - A ' T ' / " A l 2 (3.22)
(3.23)
(3.24)
(.y) = J Z [ M , - . ^ ( ^ ) ] 2
3.2. Developement of 3D and 2D mathematical models for Diesel Generator Stations
On the basis of the drawings and a walkdown of the building, was defined a detailed "AS
BUILT" space (3D) mathematical model of the structure.
The model consists of:
756 nodes with 6 degree of freedom;
641 shell elements for modelling of walls;
493 shell elements for modelling of foundation, floor and roof slabs;
42 frame elements for modelling of steel columns and reiforced concrete beams;
18 solid elements for modelling of the three DG foundations.
On fig.3.7 is shown the complete model of the structure. The mesh of one of the floor slabs is
shown on fig.3.8.
The mass of the elements is lumped in thier nodes automatically by the program. The mass of
the cranes and other technological loads is modelled by concentrated masses in the respective
joins.
Soil-structure interaction and embedment are represented in two variants - finit elements and
spring constants.
From the computing analyses was defined, that the stresses in the steel and concrete are 3 - 4
times smaller than the alowable. This fact can be explained by original design of the DGB for
powerfull explosions in the air.
3.3. Seismic safety of the reactor containment and ventilation steel chimney
a.) Reactor containment
FINAL REPORT BENCMARK STUDY OF 1000 MW WWER TYPE UNITS

18
Building Research Institute (BRI), in cooperation with NPP Kozloduy, after laboratory and 'in
situ" testing of the containment prestressing tendons, components and elements established,
that the prestressing force for each tendon is 10 000 kN, and the calculated rupture force is
14000 kN. During construction and control prestressing of the tendons in units 5 and 6, it was
found, that the controlled forces in some tendons are smaller than the design (10 000 kN), or 2
times less than the calculated rupture forces. This is due to technological circumstances.
Detailed analitical investigations were needed for capacity assessment and improving of the
prestressing technology.
The investigations carried out by NPP Kozloduy, BRI and Swiss partners are coordinated in
the frame of the IAEA Benchmark Program.
BRI has prepared term of referencrs, criteria, design parameters and methods for analyses
given in part 2 of this report.
Swiss partners performed the containment capacity assessment and monitoring system for
prestress controlling.
Improvement of the prestressing tendons and step by step replacement the existing tendons is
in progress and will continue in the future cooperation between the three organizations in the
IAEA Benchmark program.
b.) Ventilation steel chimney
The steel velntilation chimney of unit 5 and 6 are not safety related structures, but they might
fall over the containment, the turbine hall of diesel generator buildings if they have not
resistance capacity.
From the analyses of the chimney [4] is shown, that for OBE level without wind effects, the
safety coefficient is about 1.3, but for SSE level the upper most truss bars would buckle first,
because the stress values are 1.6 times the buckling stress for these bars. This should produce
buckling in the chimney pipe, and can be assumed, that a large part of the chimney could fall
down over some of the neighbouring building.
Before to take a decision for preventive measures, the calculations have to be verified by
experiments, which are planned by IAEA and ISMES - Italy.
3.4. Seismic capacity estimation and verification of the support anchorages
The adequate anchorage is one of the most important problems for the seismic safety of the
technological systems and components. If the equipment and systems are not properly
FINAL REPORT BENCMARK STUDY OF 1000 MW WWER TYPE UNITS

19
anchoraged, they should slide, overturn or move with significant damages, which can produce
accidents.
More than 130 anchorages of the main equipment (steam generators, main cooling pumps),
piping systems (supports, snubbers, hangers, shafts, transitions) were analyzed and verified by
the methodology described in part 2 of this report, usihg the reaction forces from weight,
temperature and seismic excitation (table 1) calculated from Swiss partners [5].
Some of the final results for seismic safety of snubber anchorages in main coolant pumps and
steam generators are given in tables 2 and 3, for support anchorages - in table 4 and 5.
From the last two columns of tables 2 - 5 is obvious, that the seismic safety coefficient (ratio
between the real capacity of the anchorage and the calculated from expected maximal
earthquake) for the anchorages are very high - more than 7 times for the snubbers and more
than 2.8 times for the supports. Those results are due to the following factors:
* The equipment and supports are unified and calculated for a maximum seismic excitation
corresponding to 0.40 g (I = IX - MSK scale). The seismic loadings are calculated for seismic
excitation refered to 0.20 g peak ground acceleration (I = VIII - MSK scale).
* The supports and anchorages for given type are also unified and designed for the max
expected loadings (weight, thermal, seismic). The respective calculated loadings are smaller
than the maximum ones (table 1).
The less seismic safety coefficient, of the main coolant pumps supports (min 2.8 times - table
5), compared with those, of the steam generator supports (min 5.2 times - table 4) can be
explained by complicated temperature effects, which are modelled at some assumptions, which
need additional investigations - taking into consideration the processes of deformations and
displacements during temperature changes.
FINAL REPORT BENCMARK STUDY OF 1000 MW WWER TYPE UNITS

12-JUN-1995 14=50 STUSSI STUDER STEINER 1 01 2*2 42 28 P.03
IAEA Benchmark Kododuy, Task 2 Appendix A 12.5.95 page A49
Table .1.
main loop-piping: max. support reaction forces and moments (N /.Km)* + •****•*•*» 1
SI /25 .04 .95
support_sg4 013: -Fz Seismic Max. 0.3082E+06 (12.83 s) Min. -0.2709E+06 (20.79 s)Thermal D.5202E+05Weigth -0.2381E+07
-Mx Seismic Max. 0.1863E+06 ( 7.61 s) Win. -0.1920E+06 (20.46 s)Thermal -0.1955E+Q5
[ Weigth 0.1555E+07-My Seismic Max. 0.39S3E+06 (12.84 $) Min. -0.3652E+06 (20.78 s)
Thermal 0.7 440E+06 %-0.27 51E+07
support_sg4_0l4: -Fz Seismic Max. 0.3102E+0S (12.83 s> Min. -0.2740E+06 (17.28 s)Thermal 0.4654E+06Weigth -0.2366E+07
-Mx Seismic Max, 0.3630E+06 ( 5.34 s) Min. -0.3454E+06 ( 7.43 s)Thoxmal O.tOHSiOflWeigth -0.1429E+07
-My Seismic Max. 0.2244E+06 ( 3.85 s) Min. -0.3286E+06 (12.83 s)Therroal -0.4235E+06Weigth •? 0.2803E+07
support_mcp4_031: -Fz Seismic Max. 0.9132E+05 (21.06 s) Min. -0.1045E+06 (20.27 s)Thermal 0.6535E+0 5Weigth 0.5545E+06
-Mx Seismic Max. 0.1037E+06 (20.27 s) Min. -0.9588E.+05 (21.06 S)Thermal -0.6861E+06Weigth -0.5822E+06
-My Seismic Max. 0.552SE-07 (11.21 s) Min. -0.7087E-07 ( 5.87 s)•Eh«tmsi O.00O0E+00W 0.OQOOE+00
support_mcp4_032: -Fz Seismic Max. 0.1776E+06 (20.20 s) Min. -0.1882E+06 ( 4.79 5)Thermal -O.S500E+06Weigth -0.6924E+06
-Mx Seismic Max. 0.19765+06 ( 4.79 s> Min. ~0.}865E+Q6 (2.0.20 s)Thermal 0.8927E+06Weigth ? 0.7272E+06
-My Seismic Max. 0.5016E-07 ( 3.75 s) Min. -0.7762E-07 ( 3.77 s)S O.COOOE+00
o.ccoos+oo
support_ir,c;.-4_033; -Fz Seismic Max. 0.1S4.6E+06 ,.49 s) Min. -0.2206E+06 ( 4.83 s)Thermal -0.77 62E+06Weigth 0.3893E+06
-Mx Seismic Max. 0.231"E-C6 ( 4.8S s) Min. -0.1938E+05 ( 4.49 S)Thermal 0.813 IE--Weigth -0.4G93E-^vo
-My Seismic Max. C.S-"" ';>C7 ( 4.34 s) Min. -0.9999E-07 ( 5.46 s)
3) Min. -0.2815E+06 (20.79 r.
wan. -O.2526E+06 (21.27 s)
Min. -0.3128E+06 (20.79 S)
support_sgl_085: -Fz Seismic Max. 0.353~'Thermal 0.52C:-Weigth -o.23r._
-Mx Eciofflie Ite. 0.3020'- •Thermal C.49~3i-'Weigth -0.1360E+C:
-My Seismic Max. 0.4005E+05

21
Table 2 Seismic safety of the SNUBBER ANCHORAGES in 1000 MW units 5 and 6
No
1
2
3
4
5
6
7
8
9
10
11
12
13
14
15
16
17
18
19
20
M A I
Elem
No
37
38
39
40
41
109
110
111
112
113
181
182
183
184
185
253
254
255
256
257
N C O O L A N T P
Snubber
name
MCP4
MCP4
MCP4
MCP4
MCP4
MCP1
MCP1
MCP1
MCP1
MCP1
MCP2
MCP2
MCP2
MCP2
MCP2
MCP3
MCP3
MCP3
MCP3
MCP3
Max
Axial
Force
[kN]
201
201
296
193
115
191
213
320
143
117
202
206
299
190
117
186
213
312
170
117
Force
ang'e
[°]
76
37.5
45
—
—
76
37.5
45
—
—
76
37.5
45
—
—
76
37.5
45
—
—
U M P i5 (MCP)
Design Forces
Nd
[kN]
195
122.6
210
193
115
185
130
227
143
117
196
126
212
190
117
181
130
222
170
117
Qd
[kN]
48.2
159
210
—
—
46
168
227
—
—
48.5
163
212
—
—
44.6
168
222
—
—
Md
[kNm]
7.23
23.82
31.52
—
—
6.88
25.24
34.08
—
—
7.27
24.41
31.84
—
6.70
25.24
33.23
—
—
needed
reinforcement
per row in
direction
X-X
[cm2]
1.96
3.67
5.07
0.944
0.562
1.86
3.88
5.48
0.70
0.57
1.97
3.76
5.14
0.929
0.572
1.815
3.88
5.36
0.831
0.572
Y-Y
[cm2]
2.31
4.25
5.90
1.13
0.675
2.18
4.49
6.38
0.84
0.69
2.32
4.36
5.98
1.12
0.69
2.135
4.49
6.23
1.00
0.69
Safety
Coefficient in
direction
X-X
times
20.47
10.95
7.93
42.61
71.52
21.66
10.36
7.33
57.71
70.29
20.41
10.69
7.82
43.29
70.30
22.15
10.36
7.50
48.38
70.30
Y-Y
times
20.88
11.35
8.18
42.61
71.52
22.10
10.74
7.57
57.72
70.29
20.82
11.08
8.07
43.29
70.30
22.60
10.74
7.74
48.38
70.30
FINAL REPORT BENCMARK STUDY OF 1000 MW WWER TYPE UNITS

22
Table 3 Seismic safety of the SNUBBER ANCHORAGES in 1000 MW units 5 and 6
No
21
22
23
24
25
26
27
28
29
30
31
32
33
34
35
36
S T E
Elem
No
19
20
21
22
91
92
93
94
163
164
165
166
235
236
237
238
A M G E N E R
Snubber
name
SG4
SG4
SG4
SG4
SGI
SGI
SGI
SGI
SG2
SG2
SG2
SG2
SG3
SG3
SG3
SG3
Max
Axial
Force
[kN]
317
447
428
350
383
455
454
424
321
446
429
359
385
359
441
424
A T O R S (SG)
Needed
Reinforcement per
row in direction
X-X
[cm2]
1.86
2.62
2.51
2.05
2.25
2.67
2.67
2.49
1.88
2.62
2.51
2.11
2.26
2.11
2.59
2.49
Y-Y
[cm2]
0.93
1.31
1.25
1.03
1.12
1.33
1.33
1.24
0.94
1.31
1.26
1.05
1.13
1.05
1.29
1.25
Seismic Safety
Coefficient
in direction
X-X
times
43.24
30.67
32.03
39.17
35.80
30.13
30.19
32.33
42.71
30.74
31.95
38.18
35.61
38.18
31.08
32.33
Y-Y
times
43.24
30.67
32.03
39.17
35.80
30.13
30.19
32.33
42.71
30.74
31.95
38.18
35.61
38.18
31.08
32.33
FINAL REPORT BENCMARK STUDY OF 1000 MW WWER TYPE UNITS

23
Table 4 Seismic safety of the SUPPORT ANCHORAGES in 1000 MW units 5 and 6
S T E A M G E N E R A T O R S U P P O R T S (SGS)
No
37
38
39
40
41
42
43
44
ElemNo
13
14
85
86
157
158
229
230
Supportname
SG4S
SG4S
SG1S
SG1S
SG2S
SG2S
SG3S
SG3S
Applied forces
N[kNl
-1553
-1591
-1507
-1567
-1538
-1612
-1561
-1615
Mx-x[kNm]1942
2293
2159
1825
1952
2265
2141
1797
My-y[kNm]3894
3554
3838
3881
3870
3561
3771
3789
neededreinforcement perrow in directionX-X
L [cm2]48.11
59.18
55.63
44.16
48.53
58.06
54.52
42.78
Y-Y[cm2]8.52
5.23
8.74
8.21
8.55
4.98
7.41
6.76
SafetyCoefficient in
directionX-Xtimes6.40
5.20
5.53
6.97
6.33
5.30
5.64
7.19
Y-Ytime54.2
88.3
52.8
56.2
54.0
92.8
62.3
68.2
Table 5 Seismic safety of the SUPPORT ANCHORAGES in 1000 MW units 5 and 6M A I N C O O L A N T P U M P S
No
45
46
47
48
49
50
51
52
53
54
55
56
ElemNo
31
32
33
103
104
105
175
176
177
247
248
249
Supportname
MCP4S
MCP4S
MCP4S
MCP1S
MCP1S
MCP1S
MCP2S
MCP2S
MCP2S
MCP3S
MCP3S
MCP3S
MaxAxialForce
[kN]104
188
220
86
184
209
119
193
216
110
167
208
NeededReinforcement perrow in direction
X-X[cm2]0.763
1.379
1.613
0.631
1.349
1.533
0.873
1.415
1.584
0.807
1.225
1.525
Y-Y[cm2T0.763
1.379
1.613
0.631
1.349
1.533
0.873
1.415
1.584
0.807
1.225
1.525
Seismic SafetyCoefficientin direction
X-Xtimes5.93
3.28
2.80
7.17
3.35
2.95
5.18
3.19
2.85
5.60
3.69
2.96
Y-Ytimes5.93
3.28
2.80
7.17
3.35
2.95
5.18
3.19
2.85
5.60
3.69
2.96
FINAL REPORT BENCMARK STUDY OF 1000 MW WWER TYPE UNITS

A MM-EX A,
12 6STR.UaUP.65 \W\TV\ C\P.CULAR
CbOPb>KEHHFI C KPbTOBO-UMJIUHnPHMHA
^67,45
\pO°
Z.'??.tiH.fi3_.Hl_CMMeTpMH
fig.3.1
3
npu c,10, a riFOR
(hjd
k, npuCp < 0
>J
I0
CP
,0,8
koecjjuuue< 0 —
c
0
SMmbm /f ce npueMano rna6nuua 1
<ll TABLED
2
1,0
; s |II
paOeH Ha
10
1,15
CB npueina (npu fle > 4.104) no epacf>ukama:
Cfl
o
0.8
-1.2
30 _ . 6 O _ . 9 O 120 150.
fig.3.3
na npunootcenue 8
CmoOHOcmume Ha koe<{>uuueHma c,2 ce npueMam noma6nuua 2.
Bug Ha nokpuBa
rirtOCbk, kOHUM6H— npu a S 5°,abepuMeH- npu Vd <, 0,1
• • G i ?
1/6
\-0,5
•\hjp-: ••••:.
1/3
-0,6
•-V-;.-;.'OJ--T
> 1
-0,8
fig.3.2

VO
' * y1
n
\
\\
\V
\
"1
o
inCO
o &
o"
<r
tt
O
(J
CD.o
CD
CO
WA
1oO
of
u
ou
O
CO

CO

554 555 556 -55? SS8 55? £60M K K m H
63a.
UL
'3L
ZL
R4FK
52^
541
525
42_
J26_
543
£27
E44
c?£
561
54C
H
M
i62 £63
i
K
I
47
31
564 SS5 566 £67 S6&K M M K K
541
£32
'49
921H « M K M « M M M K
53<i
SSI
£35
i2_
^3A.M M M H
5&6 567 4SB 508 MB \ \tJ1H 511 532467 513\ \
14 \ \Ki.q 516 517 476 513 -.19 \ ''\520_M M M M H M M K M
315316 3174M "«S3l3aW
327328329491 "®&32$m
7A\ 3393403414?B
w m K MM
L&dbUaB Us/^i
56Pi
553I
537
521i
505
5383W K M W MM
fig-3.8
X
DIZ1UNDEFORMEDSHAPE
OPTIONSJOINT IDSALL JOINTSSHRUNKENWIRE FRAME
LEVEL 0.00
SAP90

28
4. CONCLUSIONS DRAWN
4.1. The joint research program carried out by Swiss team (Stussi & Partner, Basler &
Hofmann, Resonance SA), NPP Kozloduy and Building Research Institute Sofia is coordinated
in the IAEA Benchmark program and is founded on :
a.) Investigations of the most important safety related structures, systems and components;
b.) Investigations of the seismic safety problems, which are not investigated from other
organizations;
c.) Coordination of the research with other participants in Benchmark program and using their
data:
* floor response spectra from Siemens (Mr, N. Krutzick) and CLSMEE ( Mr. Kostov);
* additional data for systems from Atomenergoproject - Moskow;
* Data and clasifications form Westinghouse, Stevenson & Ass, EQE.
4.2. Terms of references, criteria, design parameters and methods of analysis are based on:
a.) IAEA and Benchmark program recomendations;
b.) Russian and Bulgarian normes and regulations applied during the design, construction and
exploatation of the units.
4.3. The following main conclusions related within the seismic safety of 1000 MW units 5 and
6 are drawn:
a.) From the laboratory and "in situ" testing of containment prestressing tendons, was defined,
that the bearing capacity in some tendons are reduced 50 %, because of technological
circumstances. Neverless the reduced capacity, the analyses caried out by Basler & Hormann
(Switzerland) [4] have demonstrated, that the seismic safety of the containment correspond to
the reqirements. New technology and tendons should be developed by separate program
between NPP Kozloduy and Building Research Institute.
b.) The monitoring system for controlling tendons prestressing have to be improved.
c.) According to Resonanse AC (Switzerland) analyses, the ventilation steel chimney [4] is safe
for seismic level OBE = SL1 = 0.10 g, but the chimney could be destroyed at SSE = SL2 =
0.20 g and can damage some of the neighbouring buildings.
d.) The seismic safety analyses af the Diesel Generator Buildings (DGB) carried out by
Building Research Institute shows high resistance capacity, and even the impact of the
colapsed chimney should not destroy DGB roof.
FINAL REPORT BENCMARK STUDY OF 1000 MW WWER TYPE UNITS

29
The terms of references, criteria and methods for analyses of the chimney, prepared by BRI are
very conservative and decision for eventual upgrading of the chimney should be discusses after
experimental verification planned form IAEA and ISMES - Italy.
e.) The safety coefficient for the equipment supports anchorages in the concrete are higher
than 5.0, only in some main cooling pump supports this coefficient is around 2.5. In those
cases, the support reactions from load combinations with temperature effects need more
datailed investigations.
f.) Some of the analytical results will be verified in 1996 by the results from the experiments
planned from IAEA and ISMES.
g.) NPP Kozloduy and BRI will propose additional program for experiments paralel with
ISMES experiments.
31 October 1995
Sofia
Principal Investigator i .^-^ .^Ah^.W^. \
/Prof. S. Sachanski/
FINAL REPORT BENCMARK STUDY OF 1000 MW WWER TYPE UNITS

30
REFERENCES:
1. First Progress Report on Research Contract 7438/RI/N (01.11.1994 - 30.04.1995)
2. Second Progress Report on Research Contract 7438/RI/N (01.05.1995 - 01.08.1995)
3. IAEA Safety Gujde 50-SG-D15
4. Stussi & Partner, Swiss Contribution in Stage 2, Report R2, Section 2 Task 2 "Analyses of
Piping Sytems", June 26, 1995
5. Appendices to Swiss Contribution in Stage 2 "Pyping Systems", Task 2, Appendices A, B,
C,D, June 26 1995
6. Stevenson & Associates "Suggested Unified Criteria to be Used in Seismic Evaluation and
Potential Design Fixes for the VVER NPP", Draft edition, June 10 1994
7. Russian Building Norms and Regulations 2.03.01-84"Concrete and Reinforced Concrete
Structures", Gosstroy, USSR, Moskow 1984
8. Bulgarian "Norms for Design of Concrete and Reinforced Concrete Structures", KTCY
2.04.01, Sofia 1988
9. Basler & Hofmann "Prestressing of Reactor Building", Final Report, Stage 2 of Task 3,
Zurich, June 26 1995
10. Resonanse SA - Analyses of the Steel Ventilation Chimney", Task 4, Swiss Contribution in
Stage 2, Report R2, Zurich, June 26, 1995