Experimental and Numerical investigations into AKR generation processes
14
1 2 Review article 4 Experimental and numerical investigations into the effect 5 of heterogeneities on the recovery of heavy oil b Q1 y VAPour 6 EXtraction (VAPEX) 7 8 9 Munira M. Al-Hadhrami Q2 a,⇑ , Abdullah. S. Alkindi b , Ann H. Muggeridge a 10 a Dep. of Earth Science and Engineering, Imperial College London, London SW7 2AZ, UK Q3 11 b Petroleum Development Oman, Oman Q4 12 13 15 highlights 16 17 VAPE Q5 X (VAPour EXtraction of heavy oil). 18 Stabilised oil rates (i.e. which is the stage in time when the oil rates are anticipated to be (in theory) nearly constant, as the gravity head is preserved 19 constant during this time). 20 Laboratory experiments. 21 Numerical simulations (with very fine grid to reduce the effect of numerical dispersion and ensure that the subsequent gravity drainage is being 22 captured by the simulator). 23 Permeability macroscopic heterogeneity. 24 Layered system. 25 Shale barriers. 26 Gravity stable injection rates. 27 Analogue fluids. 28 Numerical simulations. 29 Single shale barriers. 30 By-pass in low permeability layers. 31 Change the vapour chamber. 32 Oil rates correlates better with k Arithmetic . 33 35 article info 36 Article history: 37 Received 21 December 2013 38 Received in revised form 23 June 2014 39 Accepted 25 June 2014 40 Available online xxxx 41 Keywords: 42 VAPEX 43 Stabilised oil drainage rates 44 Heterogeneity 45 Layered structure 46 Single discontinuous shale 47 48 abstract 49 We used a combination of experimental, analytical and numerical approaches to examine the oil drainage 50 rate obtained from the VAPour EXtraction (VAPEX) process to recover heavy oil. In particular we inves- 51 tigated the influence of macroscopic scale heterogeneities through a series of experiments. These heter- 52 ogeneities comprised layers, a quadrant model and two cases with discontinuous shale barriers above the 53 injection well. All experiments were performed in well-characterised glass bead packs using glycerol and 54 ethanol as analogues of heavy oil and solvent respectively. All the porous medium and fluid properties 55 (including permeability, porosity, viscosity, density, diffusion and dispersion) were measured indepen- 56 dently. The experimentally measured rates were compared to the estimates derived from the Butler– 57 Mokrys analytical model. Numerical simulations were validated using the experimental observations 58 from the homogenous and heterogeneous systems. 59 The findings confirmed the square root dependency of the oil rate on permeability (at least for the 60 range of permeabilities used here) which is consistent with findings from previous studies. Despite that, 61 the results indicated that the Butler–Mokrys derived expression under-predicts the physical oil rate, even 62 when the effects of convective dispersion and end-point density difference (as suggested by other works) 63 were factored in. Results from the heterogeneous models suggest that layering may not reduce VAPEX oil 64 drainage rates significantly. They also showed that oil was not recovered from the lower permeability 65 layers. For models with discontinuous shale barriers, the simulations tended to over-predict the oil rate 66 compared with the experiments. http://dx.doi.org/10.1016/j.fuel.2014.06.065 0016-2361/Ó 2014 The Authors. Published by Elsevier Ltd. This is an open access article under the CC BY license (http://creativecommons.org/licenses/by/3.0/). ⇑ Corresponding author. Tel.: +968 96964949. E-mail address: [email protected] (M.M. Al-Hadhrami Q2 ). Fuel xxx (2014) xxx–xxx Contents lists available at ScienceDirect Fuel journal homepage: www.elsevier.com/locate/fuel JFUE 8249 No. of Pages 14, Model 5G 18 July 2014 Please cite this article in press as: Al-Hadhrami Q2 MM et al. Experimental and numerical investigations into the effect of heterogeneities on the recovery of heavy oil b Q1 y VAPour EXtraction (VAPEX). Fuel (2014), http://dx.doi.org/10.1016/j.fuel.2014.06.065
-
Upload
st-andrews -
Category
Documents
-
view
3 -
download
0
Transcript of Experimental and Numerical investigations into AKR generation processes
1
2
4
5 Q1
6
7
8
9 Q2
10 Q311 Q4
1213
1 51617 Q5
181920212223242526272829303132
33
3 5
3637383940
41424344454647
4 8
Q2
Fuel xxx (2014) xxxndashxxx
JFUE 8249 No of Pages 14 Model 5G
18 July 2014
Q2
Q1
Contents lists available at ScienceDirect
Fuel
journal homepage wwwelsevier comlocate fuel
Review article
Experimental and numerical investigations into the effectof heterogeneities on the recovery of heavy oil by VAPourEXtraction (VAPEX)
httpdxdoiorg101016jfuel2014060650016-2361 2014 The Authors Published by Elsevier LtdThis is an open access article under the CC BY license (httpcreativecommonsorglicensesby30)
uArr Corresponding author Tel +968 96964949E-mail address mal-hadhrami10imperialacuk (MM Al-Hadhrami)
Please cite this article in press as Al-Hadhrami MM et al Experimental and numerical investigations into the effect of heterogeneities on the recoheavy oil by VAPour EXtraction (VAPEX) Fuel (2014) httpdxdoiorg101016jfuel201406065
Munira M Al-Hadhrami auArr Abdullah S Alkindi b Ann H Muggeridge a
a Dep of Earth Science and Engineering Imperial College London London SW7 2AZ UKb Petroleum Development Oman Oman
h i g h l i g h t s
VAPEX (VAPour EXtraction of heavy oil) Stabilised oil rates (ie which is the stage in time when the oil rates are anticipated to be (in theory) nearly constant as the gravity head is preserved
constant during this time) Laboratory experiments Numerical simulations (with very fine grid to reduce the effect of numerical dispersion and ensure that the subsequent gravity drainage is being
captured by the simulator) Permeability macroscopic heterogeneity Layered system Shale barriers Gravity stable injection rates Analogue fluids Numerical simulations Single shale barriers By-pass in low permeability layers Change the vapour chamber Oil rates correlates better with kArithmetic
495051525354555657585960
a r t i c l e i n f o
Article historyReceived 21 December 2013Received in revised form 23 June 2014Accepted 25 June 2014Available online xxxx
KeywordsVAPEXStabilised oil drainage ratesHeterogeneityLayered structureSingle discontinuous shale
616263646566
a b s t r a c t
We used a combination of experimental analytical and numerical approaches to examine the oil drainagerate obtained from the VAPour EXtraction (VAPEX) process to recover heavy oil In particular we inves-tigated the influence of macroscopic scale heterogeneities through a series of experiments These heter-ogeneities comprised layers a quadrant model and two cases with discontinuous shale barriers above theinjection well All experiments were performed in well-characterised glass bead packs using glycerol andethanol as analogues of heavy oil and solvent respectively All the porous medium and fluid properties(including permeability porosity viscosity density diffusion and dispersion) were measured indepen-dently The experimentally measured rates were compared to the estimates derived from the ButlerndashMokrys analytical model Numerical simulations were validated using the experimental observationsfrom the homogenous and heterogeneous systems
The findings confirmed the square root dependency of the oil rate on permeability (at least for therange of permeabilities used here) which is consistent with findings from previous studies Despite thatthe results indicated that the ButlerndashMokrys derived expression under-predicts the physical oil rate evenwhen the effects of convective dispersion and end-point density difference (as suggested by other works)were factored in Results from the heterogeneous models suggest that layering may not reduce VAPEX oildrainage rates significantly They also showed that oil was not recovered from the lower permeabilitylayers For models with discontinuous shale barriers the simulations tended to over-predict the oil ratecompared with the experiments
very of
6768697071
7475
767778798081828384858687888990
91
92
93
94
95
96
97
98
99
100
101
102
103
104
105
106
107
108
109
110
111
112
113
114
115
116
117
118
119
120
121
122
123
124
125
126
127
128
2 MM Al-HadhramiQ2 et al Fuel xxx (2014) xxxndashxxx
JFUE 8249 No of Pages 14 Model 5G
18 July 2014
Please cite this article in press as Al-HadhramiQ2
heavy oil bQ1 y VAPour EXtraction (VAPEX) Fuel (
Overall the rates estimated from the simulations were more comparable to the physical rates thanthose estimated from the original ButlerndashMokrys analytical derivation Moreover the simulator was ableto capture the pattern of solventndashoil distribution for both homogeneous models and heterogeneous mod-els This would suggest that the ButlerndashMokrys model does not properly describe all the physical pro-cesses that are controlling the oil drainage rate even in homogeneous models 2014 The Authors Published by Elsevier Ltd This is an open access article under the CC BY license (http
creativecommonsorglicensesby30)
Contents
1 Introduction 002 Material and methods 00
21 Experimental approach 00
211 Bead pack design 00212 Analogue fluids 00213 Petro-physical properties 00214 Experimental investigations of VAPEX 00
22 Numerical simulation 00
3 Results and discussion 00
31 Homogenous systems 00
311 Impact of layering 00
32 Impact of discontinuous shale barriers 00
4 Summary and conclusions 00
Acknowledgements 00References 00
129
130
131132
134134
135
136
137
138139
141141
142
143
144
145
146
147
148
149
150
151
152
153
154
155
156
157
158
159
160
161
162
163
164
165
1 Introduction
The VAPour EXtraction (VAPEX) of heavy oil by solvents is con-sidered to be one of the most energy efficient economically attrac-tive and pollution-free alternatives to thermal extraction methods[1ndash28] VAPEX is suitable for thin shallow low permeability reser-voirs or those underlain by aquifers since these can result in exces-sive heat loss and thus poor recovery efficiency for thermalEnhanced Oil Recovery (EOR) methods [14162930] CO2 basedsolvents have been shown experimentally to be more productivethan methane and ethane based solvents [1731] VAPEX maytherefore be a way of improving oil recovery whilst simultaneouslystoring excess CO2 in the subsurface and thus reducing greenhousegas emissions
The mechanism was first proposed by Butler and Mokrys [9] asan analogue of Steam Assisted Gravity Drainage (SAGD) in that dif-fusion driven mass transfer between the solventndashheavy oil reducesoil viscosity in a similar way to the heat diffusion between thesteam and oil Two long horizontal wells are drilled parallel to eachother (as in SAGD) in order to maximise the exposure to thereservoir Solvent is then injected into the upper well while thediluted oil from the solventndashoil diffusion layer drains under gravityto the lower well (see Fig 1)
The main uncertainty limiting the field application of thisprocess is the oil drainage rate and the effect of reservoir het-erogeneity on the rate Oil drainage rates are much lower thanin SAGD because the oil viscosity is reduced via mass diffusionand dispersion rather thermal diffusion and it is unclearwhether these low rates will be economic It is very difficultto perform accurate numerical simulations of the process dueto the levels of grid refinement needed to resolve the diffusionand drainage processes occurring at the solventndashoil interface Tocircumvent this issue Butler and Mokrys [9] derived a semi-analytical equation to estimate oil drainage rate without theneed for simulation Their analysis assumed that the mixingbetween the solvent and the heavy oil driven by molecular dif-fusion acts to reduce the viscosity of the oil in a similar way to
MM et al Experimental and nu2014) httpdxdoiorg10101
the way that thermal diffusion reduces the viscosity of oil dur-ing SAGD The oil drainage rate during VAPEX can then be esti-mated from
Q frac14ffiffiffiffiffiffiffiffiffiffiffiffiffiffiffiffiffiffiffiffiffiffiffiffiffiffiffi2kgDSohNs
peth1THORN
where k is permeability g is the acceleration due to gravity h is thereservoir thickness is the porosity and DSo is the initial mobile oilsaturation The constant Ns in Eq (1) is determined from the fluidproperties as
Ns frac14Z cmax
cmin
Dqeth1 CsTHORNDm
lCsdCs eth2THORN
where Dq is the density difference between the diluted oilndashsolventmixture and vapour Dm is the molecular diffusion coefficientbetween the vapour and the oil Cs is the concentration of the sol-vent lethcsTHORN is the viscosity of the solventndashoil mixture cmax is themaximum solvent concentration at the outermost boundary of thediffusion layer and cmin is the minimum solvent concentration atthe innermost boundary of the diffusion layer This analysisassumes first contact miscibility between the oil and the vapourThis is clearly much simpler than performing a fine grid simulationto predict VAPEX performance but unfortunately seems to system-atically underpredict the drainage rate seen in laboratory experi-ments [1ndash8131416ndash1820ndash28] In contrast the only publishedfield pilot (in Soda Lake Saskatchewan) obtained oil productionrates a factor of 10 lower than predicted
A further uncertainty in the field scale application of VAPEX isthe impact of geological heterogeneity Small (mm to cm) scaleheterogeneities may be expected to increase dispersive mixingand thus the oil drainage rate Larger scale heterogeneities (greaterthan 10 m) may alter the shape of the solvent cone and thus eitherimprove or more likely reduce the oil drainage rate depending onthe nature of the heterogeneity
Worldwide most extra-heavy oil reservoirs exhibit consider-able geological heterogeneity at different scales (bearing in mindthe additional fluid heterogeneities which are beyond the scope
merical investigations into the effect of heterogeneities on the recovery of6jfuel201406065
166
167
168
169
170
171
172
173
174
175
176
177
178
179
180
181
182
183
184
185
186
187
188
189
190
191
192
193
194
195
196
197
198
199
200
201
202
203
204
205
206
207
208
209
210
211
212
213
214
215
216
217
218
219
220
221
222
223
224
225
226
227
228
229
230
231
232
233
Nomenclature
Cmin lower limit of solvent concentration (fraction)Cmax maximum limit of solvent concentration (fraction)Cs solvent concentration in the oil (fraction)Dm effective molecular diffusion for solvent in oil phase (L2
T m2s)g acceleration due to gravity (LT2 ms2)h reservoir drainage height (L m)K absolute permeability (L2 m2)KL longitudinal dispersion (L2T m2s)KT transverse dispersion (L2T m2s)Ktotal total dispersion compressing both molecular diffusion
and convective dispersion (L2T m2s)
Ns VAPEX dimensionless number (fraction)q stabilised oil drainage rate per unit of thickness (L2T
m2s)v is the pore or interstitial velocity (LT ms) porosity (fraction)l mixture viscosity (M(L T) cp)DSoi initial mobile oil saturation (fraction)Dqso density difference between pure solvent and oilndashsolvent
mixture with a concentration c (ML3 kgm3)
MM Al-HadhramiQ2 et al Fuel xxx (2014) xxxndashxxx 3
JFUE 8249 No of Pages 14 Model 5G
18 July 2014
Q2
Q1
of this study) In commercial SAGD projects reservoir geologicalfeatures and associated petro-physical properties are the maininfluences on successful heavy oil extraction[32] For instancethe McMurray Formation within the Athabasca oil sand depositin Canada is considered to be one of the most complicatedextra-heavy oil (more than 106 m Pa s) and low gravity (4ndash8API) geological deposits It is made up of a continental sequenceof unconsolidated sands and shales overlaying an unconformitysurface of Devonian limestone The Lower McMurray zone is a flu-vial dominated succession consisting of highly braided channelsand sand bars of clean blocky sands associated with intraclastmudstone breccias whereas the Upper McMurray zone is a highlychannelized mixed fluvialndashtidal estuarine deposit The scale andstyle of these channels varies wildly so that lateral continuitybetween wells is almost impossible (even for short distances oflt50 m) The channel sands in this unit grade upwards into inclinedheterolithic stratified units of rippled sandstones and are heavilyburrowed with silty mudstone and clays This zone is very finegrained and argillaceous with often very low vertical permeabilityas a result of the widely dispersed shale lenses formed from claysand low permeability siltstones [3334]
There is a significant literature in SAGD investigating the impactof discontinuous shales on oil recovery [35ndash38] using either phys-ical or numerical heterogonous models The shales disrupt theideal V shape of the steam chamber but do not always changethe oil rates andor recovery Chen et al showed that the growthof the steam chamber and the resulting oil drainage were highlysensitive to shales between the injection and production wells[35] The growth of the steam chamber was adversely affected bydiscontinuous shales above the injection well but this did not seemto affect the oil drainage rate The expansion of the steam chamberto the top of the reservoir however was reported to be adverselyaffected in cases where the shale barriers in the above well regionwere either continuous or small but with high density Similarly
234
235
236
237
238
239
240
241
242
243
244
245
246
247
248
249Fig 1 Vertical cross section of a heavy oil reservoir illustrating key features of theVAPEX process
Please cite this article in press as Al-Hadhrami MM et al Experimental and nuheavy oil by VAPour EXtraction (VAPEX) Fuel (2014) httpdxdoiorg10101
Yang and Butlerrsquos SAGD experiments suggested that models witha high permeability layer at the top of the reservoir provided bettervertical communication and hence more production [38] They alsoobserved that heat was still able to penetrate by conductionthrough the shale barriers although the heated oil was not drainedto the producer and was trapped due to the pressure build-up ofundiluted oil underneath the shale
It is likely that VAPEX performance will respond differently toheterogeneity from SAGD This is because the rate of mixingbetween the solvent and the oil will be reduced by the tortuosityof the pore space of the rock (which is affected by pore connectiv-ity the porosity and connate water saturation) whereas heat diffu-sivity depends only upon the conductivity and specific heatcapacity of the rock (which is controlled by the mineralogy ofthe rock as well as the porosity and connate water saturation) Thisis exemplified by shale barriers There will be minimal moleculardiffusion through a shale barrier because of the low porosity lowpermeability and the fact that the pore space of many shales isfilled with water In contrast thin shales may allow heat to be con-ducted through them because water has a relatively high conduc-tivity but thicker shales will result in a higher heat loss because ofthe thermal heat capacity of the shale and the water containedwithin the shale The influence of permeability variations on theVAPEX solvent chamber however is likely to be very similar totheir influence on SAGD
A limited amount of research has been performed to investigateexperimentally the effect of vertical and lateral variations in per-meability and of barriers on VAPEX mechanisms An experimentalstudy was carried by Jiang and Butler [39] in a 2D (356 216 32) cm pack where physical systems with thin low permeabilitycontinuous layers low permeability discontinuous layers and highpermeability sand lenses were investigated In this study the lowpermeability sand was nearly 435D while the high permeabilitysand was 217D As would be expected the homogeneous low per-meability packs produced at a lower oil drainage rate than systemswith high permeabilities It was also observed that continuousshalelow permeability barriers prevented the formation of the sol-vent-vapour chamber above these barriers (as might be expected)and therefore reduced the VAPEX performance significantly Differ-ent patterns of vertical and horizontal fractures were also investi-gated in Jiang and Butler study Similar to SAGD it was observedthat vertical fractures tended to improve the recovery especiallyin layered systems
In a different study performed using numerical simulations toevaluate the impact of reservoir permeability distributions onVAPEX Zeng et al concluded that a random permeability distribu-tion had a very minor effect on overall VAPEX performance com-pared to homogeneous cases [40] It was also noted that thehighest oil drainage rates were obtained for models with a highpermeability layer close to the producer
merical investigations into the effect of heterogeneities on the recovery of6jfuel201406065
250
251
252
253
254
255
256
257
258
259
260
261
262
263
264
265
266
267
268
269
270
271
272
273
274
275
276
277
278
279
280
281
282
283
284
285
286
287
288
289
290
291
292
293
294
295
296
297
298
299
300
301
302
303
304
305
Fig 2 Schematic of the physical model used in VAPEX experiments
4 MM Al-HadhramiQ2 et al Fuel xxx (2014) xxxndashxxx
JFUE 8249 No of Pages 14 Model 5G
18 July 2014
Q2
Q1
Frauenfeld et al meanwhile tested the impact of sand lensesand layering as well as bottom aquifers [29] Their physical modelwas constructed from a field scale reservoir model applying Pujoland Bobergrsquos gravity and diffusion scaling criteria [41] The modelsimulated a 30 m thick reservoir underlain by a 10 m thick aquiferwith a geometric ratio of 1001 (ie 30 cm reservoir thickness10 cm bottom water zone and 25 cm horizontal well offset) Inthese experiments Kerrobert oil (50000 mPa s) was used withbutane as the solvent It was observed that oil drainage rates werelower in layered systems compared to homogeneous models withuniform permeabilities and that the layering resulted in the for-mation of mini-vapour chambers above the injectors Interestinglyit was noticed that low permeability lenses did not severely inhibitthe oil rate as the solvent was diverted sideways and around thesefeatures
In this paper we investigate the influence of macroscopic orreservoir scale heterogeneities on VAPEX processes in order tounderstand the likely influence of heterogeneity on VAPEX perfor-mance and to test the ability of commercial simulations to predictthese outcomes We achieve this by using a combination of wellcharacterised laboratory experiments and numerical simulationWe examine the impact of idealised permeability heterogeneitiesrepresentative of those encountered in real fields on both oil drain-age rate and cumulative oil recovery and compare these resultswith those obtained from homogeneous models The fluid and por-ous media properties were independently characterised in all thelaboratory experiments so that the results could be compareddirectly with the predictions of a commercial reservoir simulatorwithout the need for history matching
Fig 3 The four different layered packs used in the investigation
Please cite this article in press as Al-Hadhrami MM et al Experimental and nuheavy oil by VAPour EXtraction (VAPEX) Fuel (2014) httpdxdoiorg10101
2 Material and methods
21 Experimental approach
211 Bead pack designThe experiments were all performed in a 2D bead pack con-
structed from clear glass Perspex with internal dimensions40 cm 20 cm 06 cm The length (40 cm) and height (20 cm)of the pack were chosen to be large enough to capture the influ-ence of macroscopic heterogeneity (keeping the aspect ratio at21) but small enough to ensure uniform packing The thicknessof the pack (06 cm) was chosen to be thick enough to allow multi-ple beads across the dimension but thin enough to ensure that thefluids were uniformly distributed across this thickness bydiffusion
The material of the pack was selected to permit visualisation ofthe fluid flow and to be strong enough to withstand experimentalconditions (20C 10132 kPa) The pack represented a symmetryelement of a vertical cross-section through a reservoir undergoingVAPEX orientated perpendicular to the horizontal injection andproduction wells The producer was located at the lower cornerof the model while the injector was directly above it halfwaybetween the producer and the top of the model reservoir (seeFig 2)
The top cover of the model was designed to be removable so asto allow the beads to be packed and removed The internal surfacesand edges of the pack were coated with a thin layer of soft siliconesealant material to mitigate as far as possible edge effect problemsand any lack of consolidation of the packing near the boundaries
s into the impact of heterogeneity on VAPEX performance
merical investigations into the effect of heterogeneities on the recovery of6jfuel201406065
306
307
308
309
310
311
312
313
314
315
316
317
318
319
320
321
322
323
324
325
326
327
328
329
330
331
332
333
334
335
336
337
338
339
340
341
342
343
344
345
346
347
348
349
350
351
352
353
354355
356
357
358359
360
361
362
363
364
365366
368368
369
370
371
372
373
374
375
Fig 4 Glycerol saturation of the bead packs with a single discontinuous shale barrier just above the injector at the side with both injector and producer (left hand side of themodel) (a) High permeability with a 20 cm single shale barrier (b) High permeability with a 10 cm single shale barrier
Fig 5 Experimentally measured oil viscosities with solvent concentration com-pared to the estimated viscosities using the ideal-mixing rule (after Alkindi et al[3])
MM Al-HadhramiQ2 et al Fuel xxx (2014) xxxndashxxx 5
JFUE 8249 No of Pages 14 Model 5G
18 July 2014
Q2
Q1
A number of different permeability patterns were createdwithin this pack using different sized beads (Grades 6 and 11)These are shown in (Fig 3) Three of these patterns were formedof layers of contrasting permeabilities The aim was to investigatethe impact of layer ordering on oil rate and recovery The fourthpermeability pattern investigated was that of a quadrant Thiswas chosen as it is both geologically relevant (eg when a faultcauses an offset between layers) and particularly challenging tomodel flow in this pattern using conventional reservoir simulators[42] The low permeability layer was formed from the very smallbeads (Grade 11) while the high permeability layer was formedfrom coarser glass beads (Grade 6) This resulted in a 115 perme-ability ratio between the layers
Two packs were also constructed to investigate the impact ofthe length of a discontinuous shale just above the injection wellon rate and recovery (Fig 4) The shale lengths and location wereselected based on some preliminary numerical simulationsAccording to the simulations the chosen shale location wouldinterrupt the segregation of the V-chamber to the top of the reser-voir and would have most effect on oil rate and recovery The firstmodel consisted of a homogenous high permeability pack with asingle discontinuous shale barrier that was 25 of the total reser-voir length (10 cm) while in the second model the length ofthe barrier was 50 of the reservoir length (20 cm)
In order to generate these various patterns very thin sections ofglass Perspex with a thickness equal to the internal thickness of themodel were positioned gently into the pack (avoiding scratchingthe surface) Beads were then gradually loaded into the verticallyclamped pack using the method described by Caruana and Dawe[43] We ensured the beads were closely packed by tapping thepack gently with a plastic hammer at intervals during packingEach layer was packed individually while sealing the other layersfrom the open side so as to avoid any mixing between the beadslayers The Perspex sections were then slowly removed again whiletapping the pack to re-distribute the beads and fill all the emptyspaces A compressible rubber strip was used to model the shaleIn each case the strip was slightly wider than the modelrsquos internalthickness to ensure a complete sealing at the edges and to avoidmovement either of beads or of the barrier during the experiment
212 Analogue fluidsFollowing Alkindi et al [56] we used glycerol to represent the
oil and ethanol to represent the vapour These analogue fluids werechosen so that
Table 1Fluid physical properties of glycerol and ethanol measured at 20 C
Fluids Densitykgm3a
ViscosityPa sa
Pc
kPabTc Cb
Ethanol (C2H5OH) 790 120 6140 2408Glycerol (C3H8O8) 1260 1390 6680 453
a Alkindi et al [3]b Reid et al [44]c Tominaga and Matsumoto [45]
Please cite this article in press as Al-Hadhrami MM et al Experimental and nuheavy oil by VAPour EXtraction (VAPEX) Fuel (2014) httpdxdoiorg10101
(a) Their properties were representative of the real fluids usedin previous experimental studies [11] In particular we needed toensure that the viscosity ratio was such that the model oil wasessentially immobile compared with the solvent and that the den-sity difference between the model oil and model solvent were typ-ical of real fluids
(b) The fluids were first contact miscible as assumed by Butlerand Mokrys [9] in deriving their analytical expression for oil drain-age rate (Eq (1))
(c) We were able to fully characterise the fluid properties forinput into the simulator to avoid the need for history matchingThe fluid properties are given in Table 1 The effect of ethanol con-centration on glycerol viscosity and density has been determinedpreviously by Alkindi et al [3] and can be determined using theempirical correlations
l frac14 137 expeth00715cTHORN eth3THORNq frac14 93 103 c2 39c thorn 12664 eth4THORN
As shown in Fig 5 below the experimentally measured oilndashsolventmixture viscosities as a function of solvent concentration were wellrepresented by the ideal mixing rule used in the simulator
The concentration of ethanol and glycerol in the produced fluidsfrom the experiments was determined from the refractive index ofthese fluids and a calibration curve of concentration of ethanol as a
Density differenceDq kgm3
Viscosity ratio lo=ls
fractionDiffusionethDmTHORNmc =s2c
470 1160 6
merical investigations into the effect of heterogeneities on the recovery of6jfuel201406065
376
377
378
379
380
381
382
383
384
385
386
387
388
389
390
391
392
393
394
395
396
397
398
399
400
401
402
403
404 Q6
405
406
407
408
409
410
411
412
413
414
415
416
417
418
419
420
421
422
423
424
425
426
427
428
429
430
431
432
433
434
435
436
437
438
439
440
441
442
443
444
445446
448448
449
450
451
452
453
454
455
456
457
458
459
460
461
462
463
464
465
466
467
468
469
470
471
472
473
474
475
Table 2Measured porosity permeability and longitudinal dispersion associated with the different beads sizes
Bead grades US mesh standards Bead size (lm) Porosity (fraction) Permeability (Darcy) Longitudinal dispersion (m2s)
Grade 6 700ndash850 400 plusmn 1 150 plusmn 5 16 109
Grade 9 300ndash400 387 plusmn 1 43 plusmn 2 86 1010
Grade 11 212ndash250 376 plusmn 1 10 plusmn 2 69 1010
Table 3Values of gravity to viscous ratios calculated using Eq (5) for the 3 differenthomogeneous experiments
Experiment Ng=v fraction
High permeability model (Grade 6) 065Average permeability model (Grade 9) 019Low permeability model (Grade 11) 004
6 MM Al-HadhramiQ2 et al Fuel xxx (2014) xxxndashxxx
JFUE 8249 No of Pages 14 Model 5G
18 July 2014
Q2
Q1
function of refractive index The calibration curve was determinedby measuring the refractive indices of 32 different known ethanolndashglycerol concentrations using a digital refractometer (Stanley AbbeRefractometer model 60ED) This has an accuracy of plusmn00002accuracy The prism of the refractometer was carefully rinsed witheither ethanol or acetone The refractometer was first calibratedusing pure samples of water ethanol and glycerol and the mea-sured values at room conditions compared well with the valuesin literature [46] During the sample preparation the volumes ofthe ethanol and glycerol were gently controlled using a one milli-litre syringe To eliminate experimental errors the measurementsfor each concentration were repeated at least three times
213 Petro-physical propertiesThe values of the porosities permeabilities and longitudinal dis-
persion associated with each gradesize of beads were measuredusing a smaller bead pack that was 173 06 9 cm This minipack had an inlet and an outlet along opposite sides (to representa line drive)
The porosity permeability and longitudinal dispersion associ-ated with each bead size are given in Table 2 The porosity of eachsize of bead was measured by weighing the pack before and afterfully saturating it with a liquid and dividing the pore volume bythe total internal bulk volume (assuming that the inlet and outletlost fluid volumes was negligible) The absolute permeability ofthe different beads meanwhile was simply calculated from DarcyrsquoLaw by measuring the pressure difference across the inlet and out-let of the pack using pressure transducers while varying the injec-tion rates The longitudinal dispersion coefficient for each bead sizewas determined using the method of Brigham et al (1961) fromeffluent profiles resulting from vertical upwards glycerolndashethanoldisplacements in the mini-pack [47] These displacements wereperformed at the same injection rates as used in the VAPEX exper-iments This flow configuration with glycerol displacing ethanolwas chosen in order to eliminate viscous fingering (see discussionin [348]) Transverse dispersion was not measured as previouswork by Alkindi et al [5] has shown that its effect in these exper-iments is negligible
214 Experimental investigations of VAPEXBefore starting an experiment CO2 was injected at a very low
rate into one side of the pack whilst leaving the outlet on the oppo-site side of the pack open (see Fig 4) in order to remove any airwithin the pack The pack was then saturated with glycerol Thiswas achieved by mounting the pack vertically an injection portat the bottom and an outlet port at the top (ie in a line drive con-figuration) and injecting glycerol very slowly through the inletwhilst allowing the displaced CO2 to escape from the outlet portOnce the pack was saturated with glycerol (note than any remain-ing CO2 would have dissolved in glycerol) then this outlet port wassealed and the outlet port underneath the inlet port was opened (torepresent the cross-section through the injection and productionwell) Finally the pack was orientated so the inlet and outlet portwere both on one side
During all the analogue VAPEX experiments ethanol wasinjected at a constant rate using a lsquolsquoSeries 12 6 HPLCrsquorsquo pump (flowrate precision of plusmn2) while the producer was held at atmospheric
Please cite this article in press as Al-Hadhrami MM et al Experimental and nuheavy oil by VAPour EXtraction (VAPEX) Fuel (2014) httpdxdoiorg10101
pressure Simulations have previously shown that this results in aconstant pressure drop between the injector and producer as isrequired for a VAPEX process [6] The ethanol was dyed with Liss-amine green (C27H25N2NaO7S2) in very small concentrations(003 g400 cc) in order to be able to observe the solvent chambersegregation This allowed images to be taken of the fluid distribu-tions and then analysed This dye was chosen because it does notaffect the measured refractive index and unlike methylene bluedoes not bleach over time once in contact with glycerol [6] Theeffluent produced was collected using 1 ml measuring cylindersfor accuracy in measuring the production volumes The solventinjection rates were chosen so that all flows within the packs weregravity dominated (one of the requirements of the VAPEX process)This was achieved by calculating the viscous to gravity number forhorizontal flow using Fayers and Muggeridge [49] expression
Ng=v frac14Dq
lref eth1lsloTHORN
kgLH
eth5THORN
where lref is the viscosity of the fluid being displaced (glycerol inour experiments)The flow is gravity influenced if Ng=v gt 01 andgravity dominated if Ng=v gt 10 The velocity v is the horizontalDarcy velocity given by v frac14 Q Hw
where Q is the injection rate His the height of the pack w is the internal thickness and is theeffective porosity of the pack
Based on these calculations and also bearing in mind the min-imum rates that could be achieved by our pump the solvent injec-tion rate was set to 011 cm3min in the homogeneous experimentsand 007 cm3min in the heterogeneous experiments These resultin gravity numbers (see Table 3) that are less than 10 but stillgreater than 01 except for the very lowest permeability packBased on Eq (5) these results suggest that flows in our experimentswill be influenced both by gravity and viscous effects Preliminaryscreening experiments with these rates showed that a V shapedsolventndashoil interface (as is expected in VAPEX gravity dominatedflows) formed even in the lowest permeability experiment Theseexperiments suggest all our experiments were gravity dominateddespite the fact that our calculations give Ng=v lt 10 We note thatthis number was derived for line drives in horizontal or slightlytilted beds and thus may not be applicable to VAPEX flows
22 Numerical simulation
The experiments were simulated using the semi-compositionalnumerical simulator CMG-STARS (Computer Modelling Group Can-ada) A 2D (xndashz) Cartesian grid was used with the same dimensionsas the experimental physical model We used a 200 160 1 gridin x z and y directions respectively This was selected after a grid
merical investigations into the effect of heterogeneities on the recovery of6jfuel201406065
476
477
478
479
480
481
482
483
484
485
486
487
488
489
490
491
492
493
494
495
496
497
498
499
500
501
502
503
504
505
506
507
508
509
510
511
512
Fig 6 Comparison of experimentQ8 ally measured (a) cumulative oil produced (b) oil drainage rates and (c) solvent oil ratios (SOR) with time for homogenous packs formedfrom the three different bead grades The standard deviation in the measured oil rates were (r plusmn 041 065 and 034 cm3h) for grades 11 9 and 6 respectively
MM Al-HadhramiQ2 et al Fuel xxx (2014) xxxndashxxx 7
JFUE 8249 No of Pages 14 Model 5G
18 July 2014
Q2
Q1
refinement study to ensure that physical dispersion dominated thenumerical dispersion and that the gravity dominated flow particu-larly at the leading edge of the vapour chamber
The porous medium and fluid properties were used directly asinput data so that there was no history matching involved Theonly exception to this was that we increased the permeability ofthe top five rows of grid blocks by a factor of 1000 in order to prop-erly capture the advance of the leading edge of the vapour cham-ber The oil and solvent were modelled as two components andno water or gas phases were included in the simulation The idealmixing rule was used to calculate the viscosity of solventndashoil mix-tures The vapourndashoil relative permeabilities were entered asstraight lines with zero capillary pressures as ethanol and glycerolare first contact miscible The reference pressure was chosen to beatmospheric (101 kPa) and the reservoir temperature was set to beroom temperature (20 C) STARS does not have velocity dependentdispersion at the time of writing so the physical dispersion of eth-anol in glycerol was modelled by (a) finding the maximum sol-ventndashoil frontal advance rate (b) calculating the correspondinglongitudinal dispersion and then (c) using that value for the diffu-sivity in the simulation
Table 4Analytically calculated and experimentally measured VAPEX oil drainage rates for homogeButler and Mokrys original equation but with different assumptions of Ns values
InputsOil drainage rates Grade 6 (Coarse beads s
Porosity (fraction) 040Permeability k (Darcy) 150Ktotal (m2s) 220 109
Ns (Based on Dm) 346 106
Ns (based on Ktotal + density end point difference) 310 105
Q (based on Dm) (cm3h) 0619Q (based on Ktotal + end point difference) (cm3h) 185Avg experimental rate (cm3h) 42 plusmn 034
Please cite this article in press as Al-Hadhrami MM et al Experimental and nuheavy oil by VAPour EXtraction (VAPEX) Fuel (2014) httpdxdoiorg10101
The injector and producer were operated under constant rateand constant bottom-hole-pressure (BHP) respectively as in theexperiments The injection well was located in the centre of oneface of the model and the production well was located in the cornerof the model directly underneath the injection well in order to rep-licate the locations of inlet and outlet in the experiment
3 Results and discussion
We first discuss the results from our homogeneous experimentsas we can only really evaluate the impact of heterogeneity onVAPEX if we compare the results with those obtained from thehomogeneous models
31 Homogenous systems
The physical cumulative oil production oil drainage rates andsolvent oil ratios (SORs) as a function of time for the three differenthomogeneous packs are shown in Fig 6 Based on these data theaverage stabilised oil drainage rates were estimated to be
nous bead packs (high average and low permeability) The calculations are based on
ize) Grade 9 (AVG beads size) Grade 11 (fine beads size)
0387 0376429 10
160 109 800 1010
346 106 346 106
219 106 110 106
0325 01550818 027629 plusmn 047 12 plusmn 051
merical investigations into the effect of heterogeneities on the recovery of6jfuel201406065
513
514
515
516
517
518
519
520
521
522
523
524
525
526
527
528
529
530
531
532
533
534
535
536
537
538
539
540
541
542
543
544
545
546
547
548
549
550
551
552
553
554
555
556
557
558
559
560
Fig 7 The asymptotic underestimation of oil rates observed in both Das and Butler[14] experiments and this work
8 MM Al-HadhramiQ2 et al Fuel xxx (2014) xxxndashxxx
JFUE 8249 No of Pages 14 Model 5G
18 July 2014
Q2
Q1
120 plusmn 051 290 plusmn 047 and 42 plusmn 034 cm3h for the models withgrade 11 9 and 6 beads respectively As expected the highestdrainage rate highest recovery and lowest SOR is obtained fromthe highest permeability pack
The measured oil drainage rates were compared with the ana-lytically predicted rates estimated from the Butler and Mokrys[9] equation (Eq (1)) It is well known that this equation correctlypredicts the oil rates obtained from experiments performed inHelendashShaw cells but underpredicts the oil drainage rate obtainedfrom experiments in porous media [1ndash8121315ndash1720ndash2325ndash285051] Various modifications have been proposed to the Butlerand Mokrys [9] to improve its predictions including replacing themolecular diffusion coefficient with the longitudinal dispersioncoefficient [2ndash6] and using the end point density difference instead
Fig 8 Comparison of solventndashoil distributions for both physical and numerical models olowest permeability (formed from grade 11) However the solvent injection rates were
Please cite this article in press as Al-Hadhrami MM et al Experimental and nuheavy oil by VAPour EXtraction (VAPEX) Fuel (2014) httpdxdoiorg10101
of the concentration weighted density difference ([52]) in the cal-culation of Ns (Eq (2))
Table 4 compares the oil drainage rates calculated from Eq (1)using the molecular diffusion the longitudinal dispersion and thelongitudinal dispersion + endpoint density difference in the calcu-lation of Ns The table also gives the values of Ns used (Cmin was001 and Cmax was 1) These values of Ns are comparable with thoseobtained in a range of other studies (eg [89])
It can be seen that all the experimental oil drainage rates aresystematically higher than those obtained from the ButlerndashMokrys[9] equation even when using longitudinal dispersion and the end-point density difference This difference is similar to that seen byDas and Butler as can be seen from fig6 where we have plottedthe observed and predicted oil drainage rates as a function of thesquare root of permeability [16] This discrepancy has also beenobserved by other workers [1ndash8121315ndash1720ndash2325ndash285051]and suggests that there is some problem with the ButlerndashMokrysequation
Various explanations for this underprediction of oil rate havebeen proposed including higher than expected mixing This haslead many authors to suggest that the mixing between solventand oil is not driven purely by molecular diffusion Various pro-cesses by which mixing may be increased have been proposedincluding convective dispersion and increased surface areabetween the fluids due to the formation of oil films on the porewalls caused by capillary imbibition In contrast other authors havesuggested that the dependency of oil rate on reservoir thickness isgreater than the square root proposed by Butler and Mokrys [9]Alternatively Zainee et al [52] suggested that the gravity drainagerate was higher than expected because it depends upon the endpoint density difference beetle the solvent and oil rather than theconcentration dependent difference suggested by Butler andMokrys Our results show that including convective dispersionand the endpoint density difference improve our estimates of
f homogeneous packs (a) highest permeability model (formed from grade 6) and (b)different in these experiments
merical investigations into the effect of heterogeneities on the recovery of6jfuel201406065
561
562
563
564
565
566
567
568
569
570
571
572
573
574
575
576
577Q7
578
579
580
581
582
583
584
585
586
587
588
589
590
591
592
593
594
595
596
597
598
599
600
601
602
603
604
605
Fig 9 Comparison of experimentally measured and numerically simulated oil rates for highest permeability model (left) and lowest permeability model (right)
Table 5Average oil drainage rates for high and low permeability packs obtained experimentally and predicted by simulation The simulator underpredicts oil rate but not as badly as theButlerndashMokrys model
Model description Q experimental (cch) Q simulation (cch) D (Qexp Qsim)(Qexp) ()
High permeability case (injection rate of 11 ccmin) 42 328 2200Low permeability case (injection rate of 007 ccmin) 1 057 4339
Fig 10 Experimentally measured cumulative oil recovery measured for homoge-nous and heterogeneous systems
Fig 11 Experimentally measured oil drainage rates with time for the homogenousand heterogeneous packs
MM Al-HadhramiQ2 et al Fuel xxx (2014) xxxndashxxx 9
JFUE 8249 No of Pages 14 Model 5G
18 July 2014
Q2
Q1
drainage rate but they are still a factor of 4 too small Capillarypressure cannot be an explanation in our experiments as our fluidsare first contact miscible Fig 7 does at least confirm that oildrainage rate does depend on the square root of permeability aspredicted by the ButlerndashMokrys equation
Please cite this article in press as Al-Hadhrami MM et al Experimental and nuheavy oil by VAPour EXtraction (VAPEX) Fuel (2014) httpdxdoiorg10101
The experimental results were also compared to the predictionsobtained using the semi-compositional numerical simulator fromComputer Modelling Group (CMG) STARS Fig 8 compares the sol-ventndashoil distributions predicted by the simulator (second andfourth rows) with the observed saturation profiles (first and thirdrows) for the highest permeability and lowest permeabilityhomogenous packs It can be seen that overall the simulations cap-tured the pattern of the solvent segregation and the physical diffu-sion boundaries observed in the experiments Looking morecarefully at these figures it can be seen that the gravity overrideof the solvent chamber in the experiments is more advanced thanthat observed in the simulations (see Fig 9)
Fig 8 compares the simulated oil drainage rates and the exper-imental values for the highest and lowest permeability modelsThese simulations included both longitudinal dispersions andtransverse dispersion The stabilised oil rates shown here are givenin Table 5 It can be seen that the agreement between the numer-ical simulations and the experiments is much better than theagreement between the ButlerndashMokrys estimates and the experi-ments but that the simulation still under-predicted the oil ratesby at least 22 This contrasts with the findings of Alkindiet al [56] who found an excellent match between the experimen-tal and simulation results when using the same fluid system but ina smaller pack and applying lower injection rates
It is possible that the more advanced gravity over-ride in theexperiments (compared with the simulations) could be due tothe edge effect despite our use of silicone sealant Alternativelythis could be due to the way in which gravity is treated in all thesimulator STARS in common with most commercial simulatorsuses upstream weighting to determine fluxes into and out of gridcells Standard upstream weighting can lead to errors when flowis gravity dominated as stagnant points or sonic points can occur[53] Similar problems in the modelling of gravity dominated flowsin vertical miscible displacements through a system with a singleshale have been observed by [54] Methods to improve the model-ling of gravity dominated have been discussed by [55]
311 Impact of layeringFigs 10 and 11 compare the measured oil drainage rates and
cumulative recoveries as a function of time for the homogenousand layered systems The highest oil rates and recovery were
merical investigations into the effect of heterogeneities on the recovery of6jfuel201406065
606
607
608
609
610
611
Fig 12 Comparison between ethanolndashglycerol distributions for (a) the two layer model with high permeability at the top of the reservoir (b) the two layer model with highpermeability at the bottom of the reservoir (c) the three layer model injecting into the high permeability layer and (d) the quadrant system No further local grid refinementhas been applied here
Table 6The effective arithmetic and harmonic average calculated permeabilities for each bead pack scenario
Model description Average experimental oil rate (cm3h) Average simulated oil rate (cm3h) Underestimation of oil rate qsimqexp
qexp
2 Layers higher permeability layer at the top 367 plusmn 023 0552 902 Layers higher permeability layer at the bottom 292 plusmn 025 174 313 Layers (injecting into the higher permeability) 341 plusmn 001 156 54Quadrant system 334 plusmn 038 175 46
10 MM Al-HadhramiQ2 et al Fuel xxx (2014) xxxndashxxx
JFUE 8249 No of Pages 14 Model 5G
18 July 2014
Q2
Q1
observed in the homogenous model formed from the highestpermeability beads (Grade 6) The lowest oil rates and recoverywere observed in the homogenous model formed of the lowest
Please cite this article in press as Al-Hadhrami MM et al Experimental and nuheavy oil by VAPour EXtraction (VAPEX) Fuel (2014) httpdxdoiorg10101
permeability beads (Grade 11) The oil rates for the homogeneousmodel with intermediate permeability (Grade 9) were betweenthese two The interesting observation here is that the oil rate
merical investigations into the effect of heterogeneities on the recovery of6jfuel201406065
612
613
614
615
616
617
618
619
620
621
622
623
624
625
626
627
628
629
630
631
632
633
634
635
636
637
638
639
640
641
642
643
644
645
646
Table 7The arithmetic and harmonic average calculated permeabilities for the layered andquadrant bead packs
Model description kArithmetic kHarmonic
2 Layer system high permeability layer at the bottom 94 2273 Layer system injecting into high permeability layer 87 2062 Layer system high permeability layer at the top 94 227Quadrant systemfrasl 94 227
Fig 14 Comparison of cumulative oil produced as a function of time for thehomogenous high permeability model high permeability with 10 cm discontinuousshale and 20 cm discontinuous shale models
Fig 15 Comparison of oil drainage rates versus time for the high permeability casehigh permeability with 10 cm discontinuous shale and 20 cm discontinuous shaleThe standard deviation in the measured oil rates were (r plusmn 032 021 and 016cm3h) for the high permeability without shale high permeability with 20 cm shaleand high permeability with 10 cm shale models respectively
MM Al-HadhramiQ2 et al Fuel xxx (2014) xxxndashxxx 11
JFUE 8249 No of Pages 14 Model 5G
18 July 2014
Q2
Q1
and recoveries for the various layered models were also justbetween the low and high case and exceeded the recoveriesobtained from the intermediate permeability pack for some sys-tems We also note that a higher oil drainage rate and oil recoveryare obtained when the higher permeability layer is above the lowerpermeability layer
Fig 12 compares the solventndashoil distributions seen in the exper-iments with those predicted at the same times by simulation It canbe seen that in both simulation and experiments the solvent cham-ber grows preferentially in the higher permeability layer regard-less of the position of that high permeability layer This isparticularly obvious in the quadrant model where the juxtaposi-tion of a lower permeability quadrant with the higher permeabilityquadrant prevents spreading of the vapour chamber that has beengrowing in the higher permeability quadrant This is despite thefact that the lower permeability layers has a permeability of 10DClearly the flow is controlled by the permeability contrast betweenthe layers rather than the absolute permeability The cumulativeoil recovered from these layered systems is still higher than thatobtained from the lowest permeability homogeneous model(Fig 11) despite this bypassing of oil in the lower permeabilitylayers
The simulator is less successful at predicting the experimentalflows in layered systems than in the homogeneous systems Onceagain the simulated flows appear to be less gravity dominated thanin the experiments although the difference appears to be worse inthese layered systems Table 6 compares the oil drainage ratesobtained experimentally with those predicted by the simulator Itis possible this is due to there being a higher permeability streakalong the top of the bead pack due to inconsistent packing how-ever as noted in the method section the permeability of the topfew rows of grid blocks in the simulation has been increased toreplicate this Again the simulator underpredicts oil drainage ratebut the difference is much larger than in the homogeneous sys-tems Moreover this also occurs in the case of the higher perme-
647
648
649
650
651
652
653
654
655
656
657
658
659
660
661
662
663
664
665
666
667
Fig 13 Stabilised measured oil drainage rates for the layered and quadrant modelsplotted as a function of the square root of the effective permeabilities usingarithmetic and harmonic averaging methods and also using a scaling based ondrainage height As can be seen the correlation of the oil rate with the square rootof permeability times scaled drainage height is most consistent with the resultsfrom the homogeneous packs
Please cite this article in press as Al-Hadhrami MM et al Experimental and nuheavy oil by VAPour EXtraction (VAPEX) Fuel (2014) httpdxdoiorg10101
ability layer underneath the lower permeability layer whichsuggests that it is not caused by the edge effect
One challenge in the modelling of VAPEX in heterogeneous res-ervoirs is how best to upscale the absolute permeability Jiang andButler [39] proposed that this should be the arithmetic mean per-meability This would be consistent with the recovery being drivenby the horizontal expansion of the vapour chamber Alternatively itcould be argued that the most appropriate upscaled permeabilityshould be something between the harmonic mean permeability(appropriate for vertical flow) and the arithmetic mean (horizontalflow) as the oil is draining diagonally downwards along the inter-face between the oil and solvent chamber Table 7 lists the arith-metic and harmonic mean permeabilities for each of the modelsFor the quadrant model we also calculated the geometric meanpermeability (387D) and the effective permeability using renor-malization (232D see equation in [56])
In Fig 13 we plot the observed oil drainage rate against thesquare root of the arithmetic and the harmonic average permeabil-ity for each of the heterogeneous packs It can be seen that the oildrainage rates seen in the layered models fall very close to thestraight line formed by plotting the oil drainage rate versus square
merical investigations into the effect of heterogeneities on the recovery of6jfuel201406065
668
669
670
671
672
673
674
675
676
677
678
679
680
681
682
683
684
685
686
687
688
689
690
691
692
693
694
695
Table 8The experimentally measured average drainage rates for the cases with a shale barrier
Model description Average experimental oil rate (cm3h) Drop in oil rate ethqExpqHomog THORNethqHomog THORN
High permeability homogenous without shale 420 00High permeability with a 10 cm single shale barrier 348 171High permeability with a 20 cm single shale barrier 370 119
Fig 16 Predicted glycerolndashethanol distributions based on the simulation model using STARS for the single 10 cm discontinuous shale
Fig 17 Predicted glycerolndashethanol distributions based on the simulation model using STARS for the single 20 cm discontinuous shale
Table 9The oil drainage rates predicted for the shale systems by numerical simulation
Model description Simulations predicted rate KL (cm3h) Drop in oil rate ethqexpqhomog THORNethqhomog THORN
High permeability homogenous without shale 297 0High permeability with a 10 cm single shale barrier 293 150High permeability with a 20 cm single shale barrier 288 325
12 MM Al-HadhramiQ2 et al Fuel xxx (2014) xxxndashxxx
JFUE 8249 No of Pages 14 Model 5G
18 July 2014
Q2
Q1
root of permeability for the homogeneous models when the arith-metic mean permeability is used The rates do not fall on this linewhen the harmonic mean permeability is used This indicates thatas suggested by Jiang and Butler [39] the arithmetic mean is amore appropriate way to upscale absolute permeability in layeredsystems We do note however that lower oil drainage rates wereobtained when the lower permeability layer was above the higherpermeability layer than when the higher permeability layer was ontop but both cases have the same arithmetic mean permeabilityWe also note that the solvent does not reach the top of the modelwhen the low permeability layer is on top In this case (which alsoapplies to the three layer and quadrant models) the effective per-meability must be calculated for the region of the reservoiraccessed by the solvent and the drainage height is also reduced
According to Eq (1) the oil rate would be reduced byffiffiffihH
qwhere
Please cite this article in press as Al-Hadhrami MM et al Experimental and nuheavy oil by VAPour EXtraction (VAPEX) Fuel (2014) httpdxdoiorg10101
h is the thickness of the high permeability layer and H is the overallreservoir thickness These results are also plotted Fig 13 andare most consistent with the results from the homogeneouspacks
32 Impact of discontinuous shale barriers
Figs 14 and 15 compares the cumulative oil recovery and oildrainage rates obtained from the bead packs containing a singlediscontinuous shale with those obtained from the homogeneouspack using the same Grade 6 beads The averaged stabilised drain-age rates for the three systems are given in Table 8 Again thiscould be due to an edge effect along the shale bottom as the beadswill be less densely packed here but it may also be due to the waygravity is modelled in the simulator as discussed earlier
merical investigations into the effect of heterogeneities on the recovery of6jfuel201406065
696
697
698
699
700
701
702
703
704
705
706
707
708
709
710
711
712
713
714
715
716
717
718
719
720
721
722
723
724
725
726
727
728
729
730
731
732
733
734
735
736
737
738
739
740
741
742
743
744
745
746
747
748
749
750
751
752
753
754
755
756
757
758
759
760
761
762
763
764
765
766
767
768
769
770
771
772
773
774
775
776
777
778
779
780
781
782
783
784
785
786
787
788
789
790
791
792
793
794
795
796
797798799800801802803804805806807808809810811812813814815816817818819820821822823824825826827
MM Al-HadhramiQ2 et al Fuel xxx (2014) xxxndashxxx 13
JFUE 8249 No of Pages 14 Model 5G
18 July 2014
Q2
Q1
As expected the oil rates for models with the shale wereslightly lower than those seen in homogenous packs The interest-ing result here is the slight improvement in oil drainage rates as aresult of increasing the length of the shale It should be noted how-ever that this difference is close to the uncertainty in the measure-ments considering the error margin of plusmn021 and plusmn016 cm3hrespectively for the two scenarios It is also interesting to note thatthe effect of the shale on cumulative oil recovery is much lessoccurs when there are layers in the system This is because the onlythat is bypassed is just above the shale whereas in layered systemscomplete layers remain unswept especially if the top layer is alower permeability than the layer associated with the injectionwell
Figs 16 and 17 shows the solventndashoil distributions seen in theexperiments with those predicted by simulations while Table 9compares the average oil drainage rates seen experimentally andobtained from the simulations The agreement between experi-ments and simulations is reasonable in both cases although onceagain the simulations seem to predict less gravity dominated flowsthan the experiments It can also be seen that the simulation pre-dicts very little change in oil rate when there is a shale in the sys-tem whilst there is a significant drop in oil drainage rate seen in theexperiments
The numerical simulation models were able to capture the sol-ventndashoil distributions and the basic flow behaviour seen in theexperiments although as noted in previous sections the level ofgravity segregation was higher in the experiments than in the sim-ulations Again the experiments gave a higher oil drainage ratethan was predicted by the simulations (see Table 9) This couldbe due to an lsquolsquoedge effectrsquorsquo along the shale bottom as the beads willbe less densely packed here but it may also be due to the waygravity is modelled in the simulator as discussed earlier
4 Summary and conclusions
We have investigated the impact of simple macroscopic heter-ogeneities on the performance of VAPEX using a mixture of exper-iments and very fine grid numerical simulations The fine grid wasneeded to capture the development of the vapour chamber and theensuing drainage of the diluted oil under gravity as well as toensure that physical diffusion dominated the solvent oil mixingrather than numerical diffusion The experiments used well-characterised glass bead packs and the analogue fluid system ofglycerol and ethanol previously used by [2ndash6] These experimen-tally measured data were assigned in all the simulations so thatthe predictions could be compared directly with the experimentalresults without the need for history matching
The laboratory measurements of oil rate obtained from homo-geneous bead packs were consistently higher than estimatesobtained from the ButlerndashMokrys analytical expression althoughthe drainage rate did vary linearly with the square root of perme-ability as predicted by this expression Incorporating the effect ofconvective dispersion (as suggested by earlier works) and usingthe end-point density difference instead of the concentration-dependent density difference slightly improved the estimatedrates The stabilised oil rates predicted by simulations were closerto those obtained experimentally but still were slightly lower thanthe measured oil rates in both homogeneous and heterogeneoussystems It appeared that the discrepancy between the predicatedand the physically measured rates was more marked for the modelwith higher permeability (in which flow was more gravity domi-nated) whilst a better agreement was obtained for low permeabil-ity models
Comparisons between the observed and predicted solventndashoildistributions suggested that flow was less gravity dominated inthe simulations than in the experiments It is possible that the
Please cite this article in press as Al-Hadhrami MM et al Experimental and nuheavy oil by VAPour EXtraction (VAPEX) Fuel (2014) httpdxdoiorg10101
horizontal growth of the vapour chamber in the experiments wasdue to higher permeabilities at the top of the pack howeverincreasing the permeability in the top few rows of grid blocks inthe simulation did not improve the match It seems possible thatthis discrepancy is due to the fact that simple upstream weightingdoes not capture flows properly around the sonic point Improvednumerical methods such as those described by [55] may be neededto improve predictions of gravity dominated flow
These results indicate that VAPEX is most likely to be adverselyaffected by layering in reservoirs This effect of this layering can beapproximated by using an arithmetic mean of the layer permeabil-ities although it does not capture the impact of layer ordering onoil drainage rate and recovery Upscaling is improved if the arith-metic mean permeability (or absolute permeability of the upperlayer does not contribute to the oil recovery) is multiplied by theeffective drainage height It would appear that permeability con-trast is most important in determining whether a layer will beswept rather than its absolute permeability A single discontinuousshale just above the injection well will have a slight impact on oildrainage rate and oil recovery
Further work needs to be done to determine the exact cause ofthe discrepancies between the simulation and the experimentsUntil this is resolved the quantitative results from even fine gridsimulations of the VAPEX process should be treated with cautionalthough the qualitative differences in recovery between differentrealizations of geological heterogeneity are probably correct Theimpact of smaller scale heterogeneities on VAPEX also needs tobe investigated especially those that reduce the vertical perme-ability of reservoirs as we expect that these will significantly affectthe oil drainage rate
Acknowledgements
We would like to gratefully thank Petroleum DevelopmentOman (PDO) for funding Munirarsquos PhD and the Computer Model-ling Group (CMG) for providing the software license We wouldalso like to thank Graham Nash for constructing the Perspex boxesused in the experiments and his ongoing helpful advice
References
[1] Abukhalifeh H Upreti SR Lohi A Effect of drainage height on concentration-dependent propane dispersion in VAPEX Can J Chem Eng 201290(2)336ndash41doihttpdxdoiorg101002cjce21612
[2] Alkindi A Muggeridge A Al-Wahaibi Y The influence of diffusion anddispersion on heavy oil recovery by VAPEX In International thermaloperations and heavy oil symposium 2008 doihttpdxdoiorg102118117555-MS
[3] Alkindi MA S A Al-Wahaibi Y Physical properties (density excess molarvolume viscosity surface tension and refractive index) of ethanol + glycerol JChem Eng Data 53 2008(12)2793ndash6 lthttphttpdxdoiorghttppubsacsorgdoiabs101021je8004479gt doihttppubsacsorgdoiabs101021je8004479
[4] Abdullah A Experimental investigation of the vapour extraction (VAPEX)process for heavy oil recovery PhD thesis Imperial College London May2009
[5] Alkindi A Al-Wahaibi Y Bijeljic B Muggeridge A Investigation of longitudinaland transverse dispersion in stable displacements with a high viscosity anddensity contrast between the fluids J Contam Hydrol 2011120170ndash83doihttpdxdoiorg10106jconhyd201006006
[6] Alkindi A Al-Wahaibi Y Muggeridge A Experimental and numericalinvestigations into oil-drainage rates during vapor extraction of heavy oilsSPE J 201116(2)343ndash57 doihttpdxdoiorg102118141053-PA
[7] Ahmadloo F Asghari K Henni A Freitag N Interplay of capillarity drainageheight and aqueous phase saturation on mass transfer rate of solvent vaporinto heavy oil In Canadian unconventional resources conference 2011doihttpdxdoiorg102118148682-MS
[8] Boustani A Maini B The role of diffusion and convective dispersion in vapourextraction process J Can Petrol Technol 40(4) doihttpdxdoiorg10211801-04-05
[9] Butler RM Mokrys IJ Solvent analog model of steam-assisted gravity drainageAOSTRA J Res 19895(1)17ndash32
merical investigations into the effect of heterogeneities on the recovery of6jfuel201406065
828829830831832833834835836837838839840841842843844845846847848849850851852853854855856857858859860861862863864865866867868869870871872873874875876877878879880881882883884885886887888889890891892893894
895896897898899900901902903904905906907908909910911912913914915916917918919920921922923924925926927928929930931932933934935936937938939940941942943944945946947948949950951952953954955956957958959960
961
14 MM Al-HadhramiQ2 et al Fuel xxx (2014) xxxndashxxx
JFUE 8249 No of Pages 14 Model 5G
18 July 2014
Q2
Q1
[10] Butler R Mokrys I A new process (VAPEX) for recovering heavy oils using hotwater and hydrocarbon vapour J Can Petrol Technol 30(1) doihttpdxdoiorg10211891-01-09
[11] Butler RM Mokrys IJ et al Recovery of heavy oils using vapourizedhydrocarbon solvents further development of the VAPEX process J CanPetrol Technol 199332 56ndash56
[12] Cuthiell D McCarthy C Kissel G Cameron S The role of capillarity in VAPEXIn Canadian international petroleum conference 2006 doihttpdxdoiorg1021182006-073
[13] Cuthiell D Edmunds N Thoughts on simulating the VAPEX process J CanPetrol Technol 201352(3)192ndash203 doihttpdxdoiorg102118158499-MS
[14] Das SK VAPEX an efficient process for the recovery of heavy oil and bitumenSPE J 19983(3)232ndash7 doihttpdxdoiorg10211850941-PA
[15] Das S Butler R Extraction of heavy oil and bitumen using solvents at reservoirpressure In Technical meetingpetroleum conference of the SouthSaskatchewan section 1995 doihttpdxdoiorg10211895-118
[16] Das SK Butler RM Mechanism of the vapor extraction process for heavy oiland bitumen J Petrol Sci Eng 199821(1)43ndash59 doihttpdxdoiorg101016S0920-4105(98)00002-3
[17] Dunn S Nenniger E Rajan V A study of bitumen recovery by gravity drainageusing low temperature soluble gas injection Can J Chem Eng198967(6)978ndash91 doihttpdxdoiorg101002cjce5450670617
[18] Etminan SR Haghighat P Maini B Chen ZJ Molecular diffusion and dispersioncoefficient in a propane-bitumen system case of vapour extraction (VAPEX)process In SPE EuropecEAGE annual conference and exhibition 2011doihttpdxdoiorg102118143633-MS
[19] Jia X Zeng F Gu Y One-dimensional mathematical modelling of vapourextraction (VAPEX) In SPE heavy oil conference Canada 2012 doihttpdxdoiorg102118157938-MS
[20] Kapadia RA Upreti SR Lohi A Chatzis I Determination of gas dispersion invapor extraction of heavy oil and bitumen J Petrol Sci Eng 200651(3)214ndash22doihttpdxdoiorg101016jpetrol200601001
[21] Kulada K Maini B Experimental investigation of oil drainage rates in theVAPEX process for heavy oil and bitumen reservoirs In SPE annual technicalconference and exhibition 2003 doihttpdxdoiorg10211884199-MS
[22] Lim G Kry R Harker B Jha K Three-dimensional scaled physical modelling ofsolvent vapour extraction of cold lake bitumen J Can Petrol Technol 35 (4)doihttpdxdoiorg10211896-04-03
[23] Moghadam S Nobakht M Gu Y Theoretical and physical modeling of a solventvapour extraction (VAPEX) process for heavy oil recovery J Petrol Sci Eng200965(1)93ndash104 doihttpdxdoiorg101016jpetrol200705011
[24] Rezaei N Mohammadzadeh O Chatzis I Experimental investigation of vaporextraction process in the recovery of bitumen from vuggy porous media InCanadian unconventional resources and international petroleum conference2010 doihttpdxdoiorg102118137829-MS
[25] Tam S VAPEX experiments in an annular packing of glass beads and thenumerical simulation of VAPEX using comsol Masterrsquos thesis ChemicalEngineering University of Waterloo 2007
[26] Yazdani A Maini B Effect of height and grain size on the production rates inthe VAPEX process experimental study SPE Reserv Eval Eng20058(3)205ndash13 doihttpdxdoiorg10211889409-PA
[27] Yazdani A Maini B Further investigation of drainage height effect on oilproduction rate in VAPEX In SPE annual technical conference and exhibition2006 doihttpdxdoiorg102118101684-MS
[28] Yazdani A Maini B The effective diffusiondispersion coefficient in vaporextraction of heavy oil Petrol Sci Technol 200927(8)817ndash35
[29] Frauenfeld T Jossy C Rispler K Kissel G Evaluation of the bottom waterreservoir VAPEX process J Can Petrol Technol 200645(9)29ndash35
[30] Nghiem LX Kohse B Sammon P Compositional simulation of the VAPEXprocess J Can Petrol Technol 40(8) doihttpdxdoiorg10211801-08-05
[31] Talbi K Maini B Evaluation of CO2 based VAPEX process for the recovery ofbitumen from tar sand reservoirs In SPE international improved oil recoveryconference in Asia Pacific 2003 doihttpdxdoiorg10211808-04-29
[32] Jimenez J The field performance of SAGD projects in Canada In Internationalpetroleum technology conference 2008 doihttpdxdoiorg10252312860-MS
Please cite this article in press as Al-Hadhrami MM et al Experimental and nuheavy oil by VAPour EXtraction (VAPEX) Fuel (2014) httpdxdoiorg10101
[33] Badiozamani K Roghani F Hawes G Application of variable zone modeling tomodeling and mapping of Canadian oil sands Comp Model Geol Surf Vol1992235ndash49
[34] Redford D AOSTRA heavy oil and bitumen in situ pilots In ChinandashCanadaheavy oil technology symposium proceedings Zhuo Zhou China AOSTRA1987
[35] Chen Q Gerritsen M Kovscek A Effects of reservoir heterogeneities on thesteam-assisted gravity-drainage process SPE Reserv Eval Eng200811(5)921ndash32 doihttpdxdoiorg102118109873-PA
[36] Farouq-Ali S Is there life after SAGD J Can Petrol Technol 36(6) doihttpdxdoiorg10211806-09-02
[37] Ito Y Suzuki S Numerical simulation of the SAGD process in the Hangingstoneoil sands reservoir J Can Petrol Technol 199938(9)27ndash35 doihttpdxdoiorg10211804-01-05
[38] Yang G Butler R Effects of reservoir heterogeneities on heavy oil recovery bysteam-assisted gravity drainage J Can Petrol Technol 199231(8)37ndash43doihttpdxdoiorg10211892-08-03
[39] Jiang Q Butler R Experimental studies on effects of reservoir heterogeneity onthe Vapex process J Can Petrol Technol 199635(10)46ndash54 doihttpdxdoiorg10211896-10-04
[40] Zeng F Knorr K Wilton R Post-cold production solvent vapor extraction (SVX)process performance evaluation by numerical simulation In Canadianinternational petroleum conference 2008
[41] Pujol L Boberg T Scaling accuracy of laboratory steam flooding models In SPECalifornia regional meeting 1972 doihttpdxdoiorg1021184191-MS
[42] Dawe RA Caruana A Grattoni CA Immiscible displacement in cross-beddedheterogeneous porous media Transp Porous Media 201187(1)335ndash53
[43] Caruana A Dawe RA Flow behaviour in the presence of wettabilityheterogeneities Transp Porous Media 199625(2)217ndash33 doihttpdxdoiorg101007BF00135857
[44] Reid RC Prausnitz JM Poling BE The properties of gases and liquids NewYork McGraw Hill Book 1987
[45] Tominaga T Matsumoto S Diffusion of polar and nonpolar molecules in waterand ethanol Bullet Chem Soc Jpn 199063(2)533ndash7
[46] Budwig R Refractive index matching methods for liquid flow investigationsExperim Fluids 199417(5)350ndash5
[47] Darcy H Les fontaines publiques de la ville de Dijon exposition et applicationVictor Dalmont 1856
[48] Alkindi AS Muggeridge A Al-Wahaibi YM et al The influence of diffusion anddispersion on heavy oil recovery by VAPEX In International thermaloperations and heavy oil symposium Society of Petroleum Engineers 2008doihttpdxdoiorg102118117555-MS
[49] Fayers F Muggeridge A Extensions to Dietz theory and behavior of gravitytongues in slightly tilted reservoirs SPE Reserv Eng 19905(4)487ndash94doihttpdxdoiorg10211818438-PA
[50] Das SK In situ recovery of heavy oil and bitumin using vaporized hydrocarbonsolvents chemical and petroleum engineering University of Calgary 1995
[51] Etminan SR Haghighat P Maini BB Chen ZJ et al Molecular diffusion anddispersion coefficient in a propane-bitumen system case of vapour extraction(VAPEX) process In SPE EuropecEAGE annual conference and exhibitionSociety of Petroleum Engineers 2011 doihttpdxdoiorg102118143633-MS
[52] Zainee A Alkindi A Muggeridge A Investigations into oil recovery anddrainage rates during vapour extraction (VAPEX) of heavy oils In IOR 20112011
[53] LeVeque RJ Le Veque RJ Numerical methods for conservation laws vol132 Springer 1992
[54] Muggeridge A Jackson M Agbehi O Al-Shuraiqi H Grattoni C Quantifyingbypassed oil in the vicinity of discontinuous shales during gravity dominatedflow (SPE94134) In 67th EAGE conference amp exhibition 2005
[55] Edwards MG Non-upwind versus upwind schemes for hyperbolicconservation laws in porous media In SPE reservoir simulation symposiumSociety of Petroleum Engineers 2005 doihttpdxdoiorg10211893691-MS
[56] King P The use of renormalization for calculating effective permeabilityTransp Porous Media 19894(1)37ndash58
merical investigations into the effect of heterogeneities on the recovery of6jfuel201406065
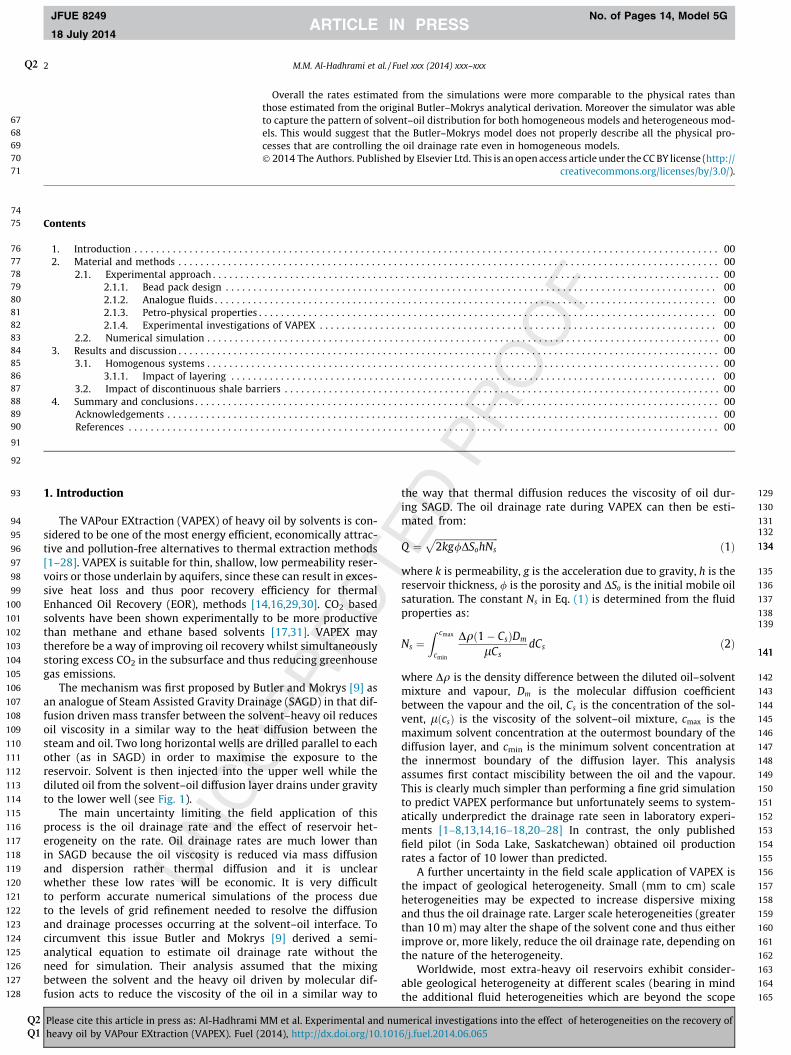
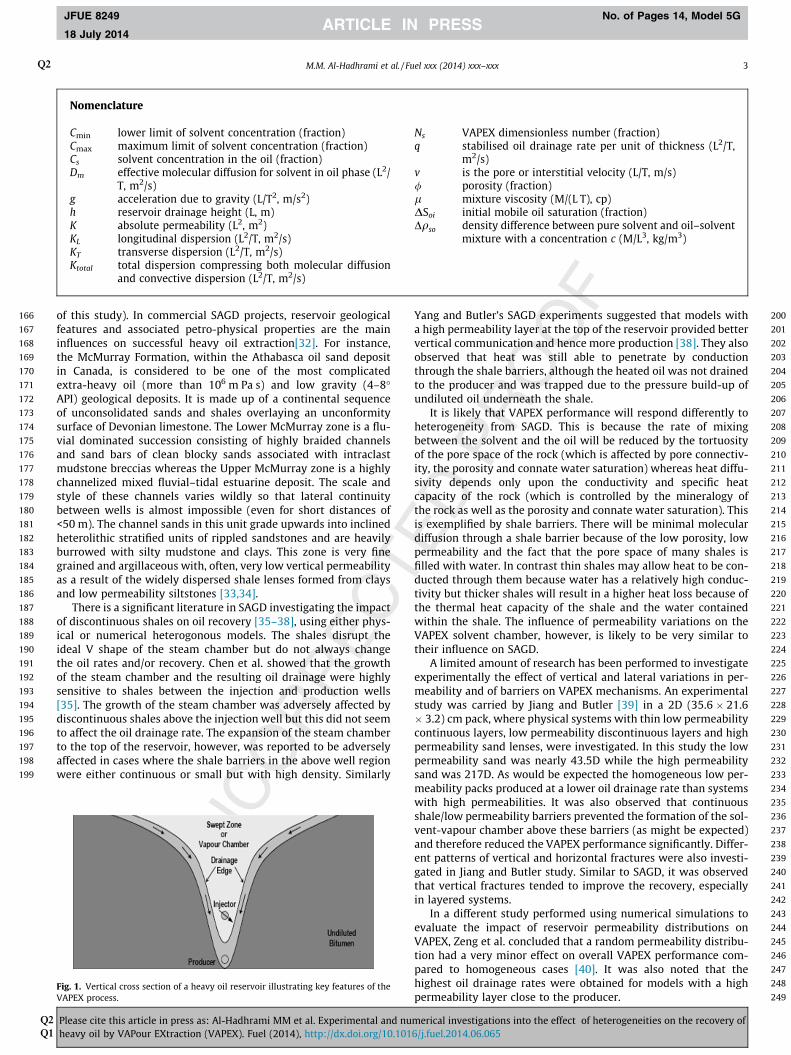
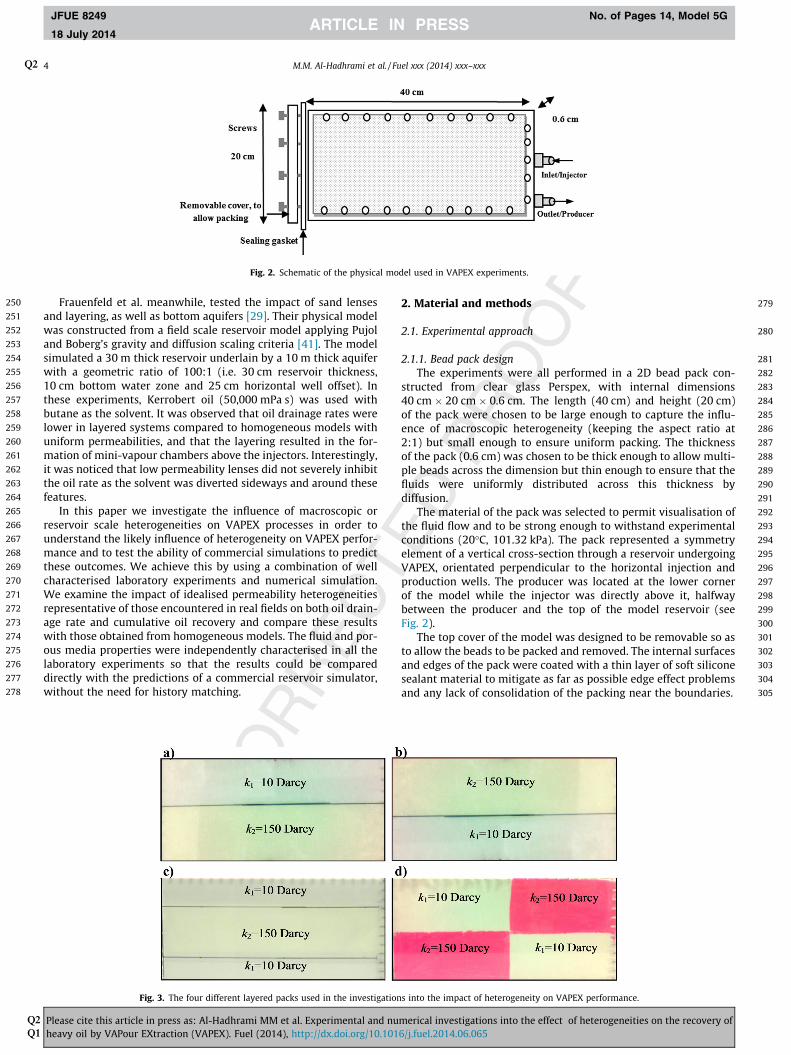
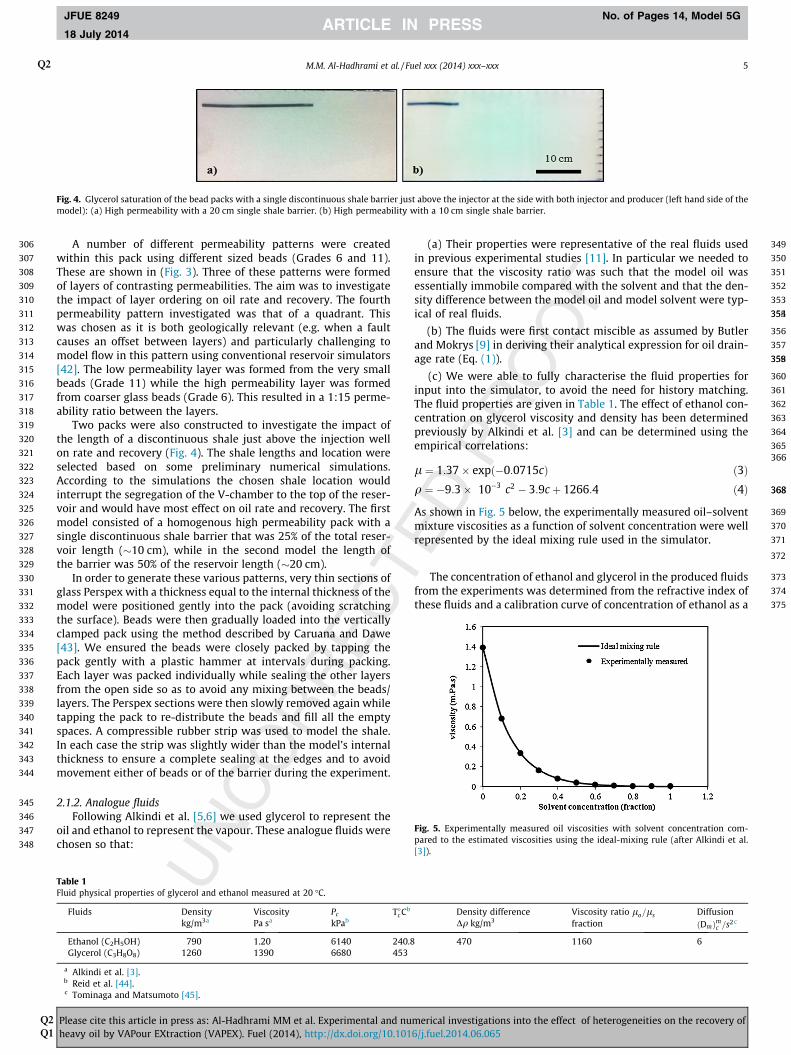
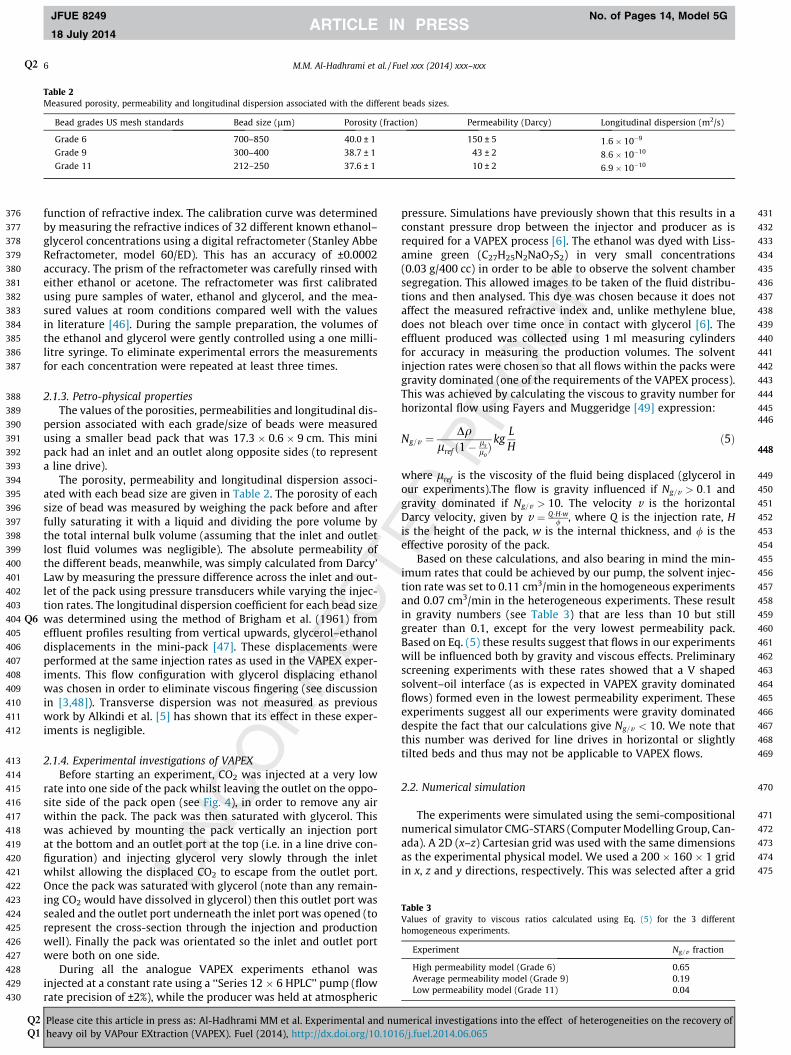
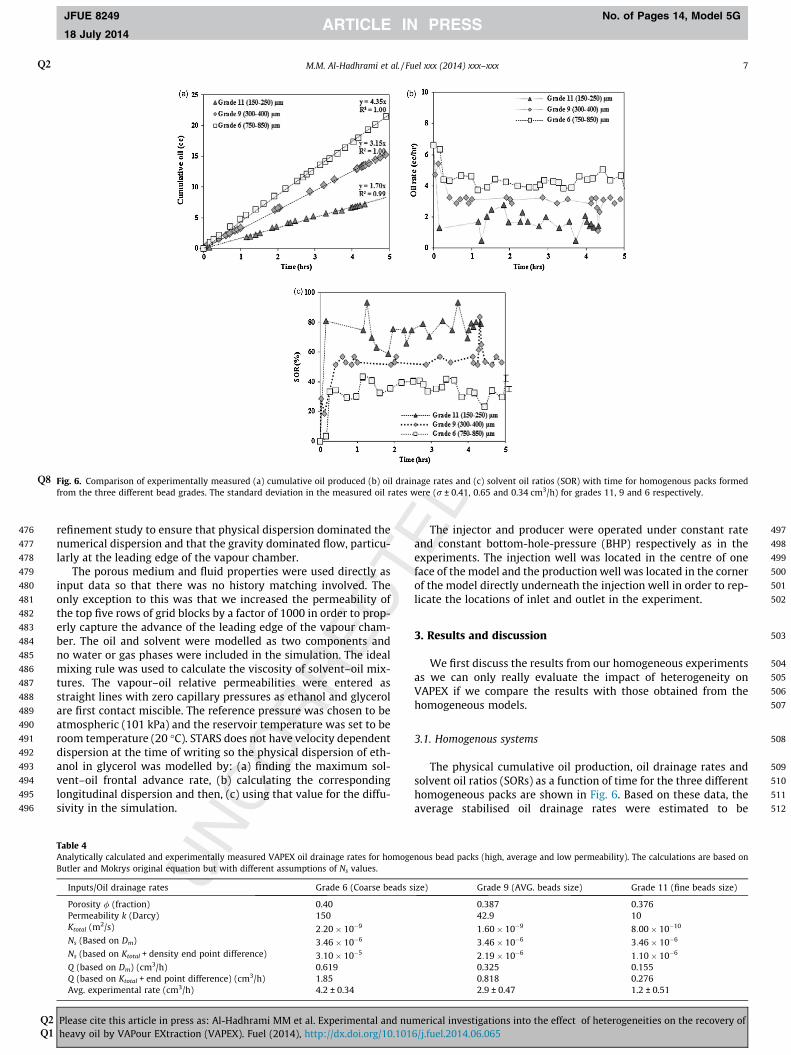
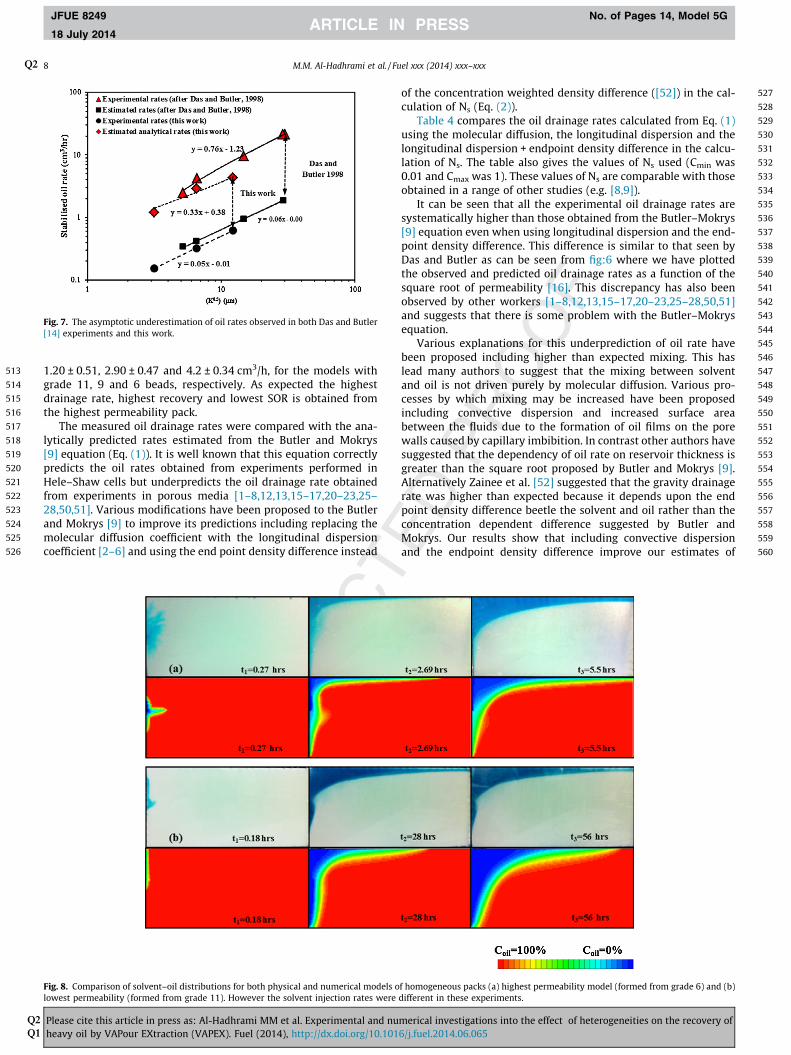
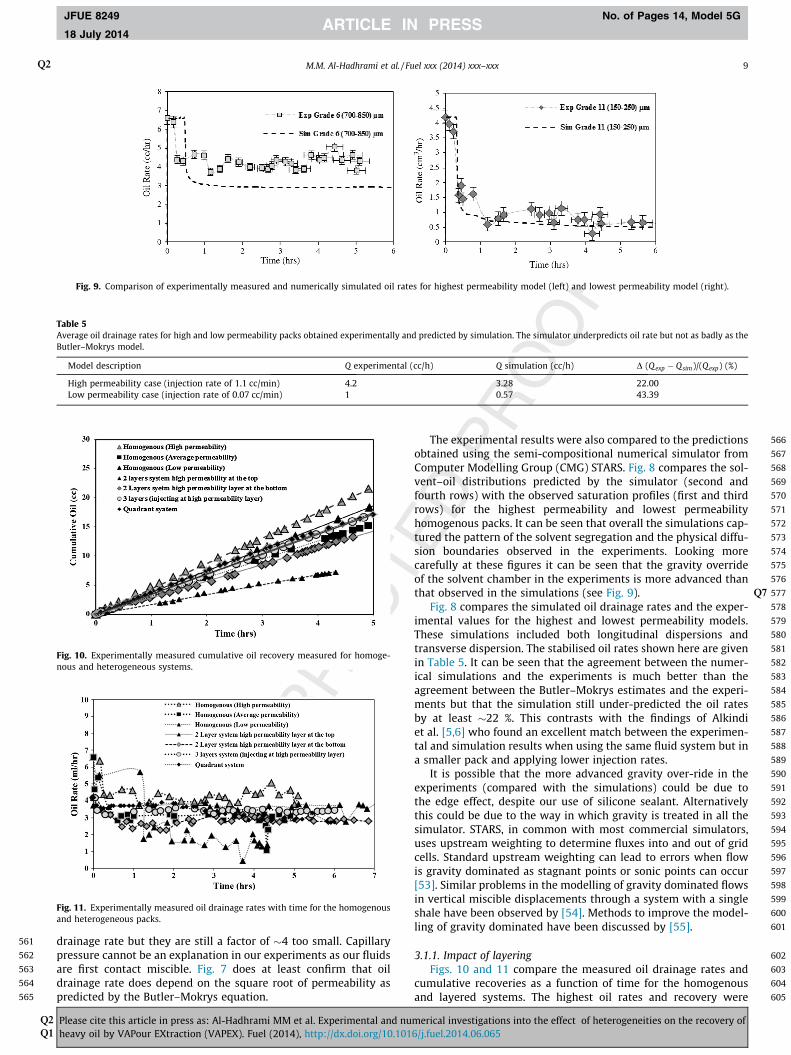
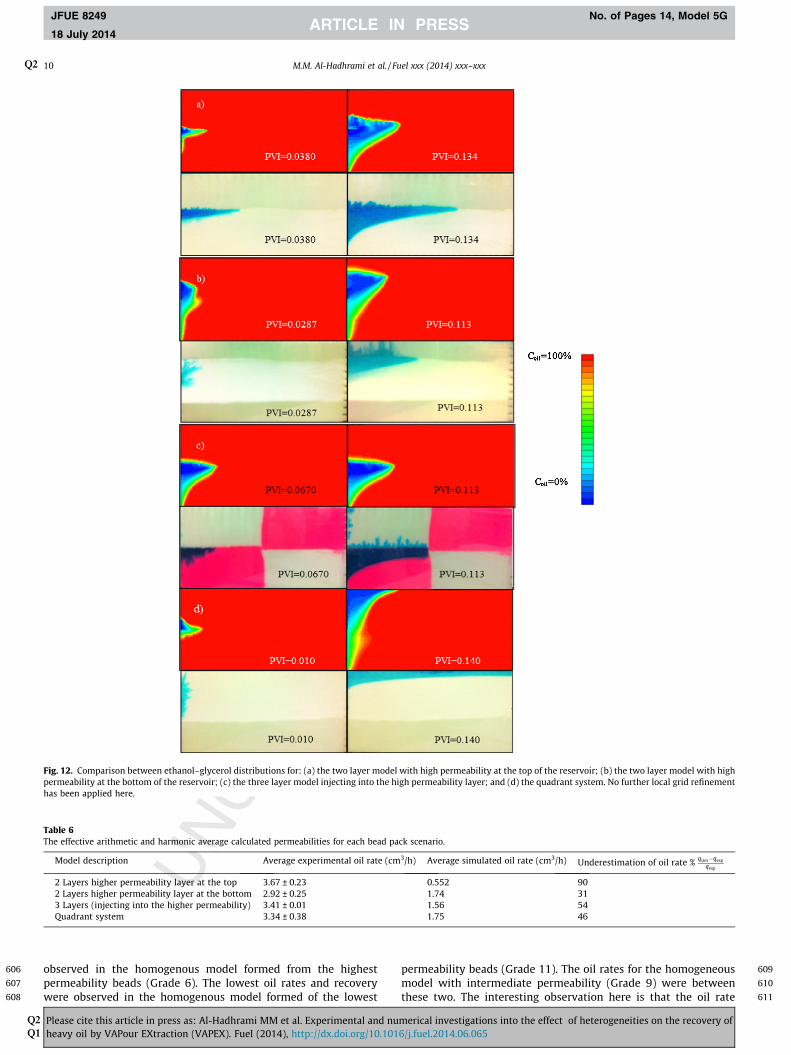