Compaction Generators, Welders, Lighting Solutions Pumps ...

INTERNATIONAL JOURNAL FOR NUMERICAL AND ANALYTICAL METHODS IN GEOMECHANICSInt. J. Numer. Anal. Meth. Geomech. (2014)Published online in Wiley Online Library (wileyonlinelibrary.com). DOI: 10.1002/nag.2241
A distinct element method numerical investigation of compactionprocesses in highly porous cemented granular materials
G. Dattola1, C. di Prisco2, I. Redaelli2 and S. Utili3,*,†
1Department of Civil, Energetical, Environmental and Material Engineering, Università “Mediterranea” di ReggioCalabria, Reggio Calabria, Italy
2Department of Civil and Environmental Engineering, Politecnico di Milano, Milan, Italy3School of Engineering, University of Warwick, U.K. formerly at University of Oxford, U.K.
SUMMARY
In this paper, the results of an oedometric numerical test campaign, performed by means of a 3D Discrete Ele-ment Code on idealised cemented granular cylindrical specimens, are illustrated. The idealised microstructuretaken into account is characterised by the following: (i) rigid grains bonded to one another; (ii) a high void ratio;and (iii) two different families of voids: the micro and the macro-voids.
The compaction process developing within the specimens, as well as the localization along tabular zones ofpure compressive deformation (compaction banding) that in some cases takes place, are discussed. The influ-ence on the evolution of this peculiar strain localization process of many microstructural/numerical parameterslike material porosity, macro-void size, the constitutive relationship adopted for the bonds and the bond damagerate is analysed.
Tests for different values of porosity were run. Below a certain porosity threshold value, the onset ofmixed modes of localisation was detected whereas the increase in the macro-void size is observed to favourthe onset of instability. Copyright © 2014 John Wiley & Sons, Ltd.
Received 17 November 2011; Revised 5 October 2013; Accepted 11 October 2013
KEY WORDS: compaction bands; microstructure; discrete element analyses; instability; snap-back
1. INTRODUCTION
Natural porous rocks are quite common in many regions of the world, especially in Italy, where thesematerials have been used in the past for the construction of buildings and monuments. We refer forinstance to calcarenite [1] and tuffs (de’ Gennaro et al., 2000), in which the porosity often reachesvalues larger than 0.6 [2]. Analogously, in nature it is not rare to find pumice stones with porosities aslarge as 0.73 and conchyliates with porosities of around 0.65 [3]. Up to now, the mechanical responseof these materials has been mainly studied both experimentally and numerically (Nova et al., 2003) bytaking into account their shear strength; in contrast, in some engineering problems like, for instance, thedesign of deep foundations of structures placed on underground cavities (piles/micropiles) the study ofcompaction banding is quite crucial. An original study of this topic, via small scale experimental testson shallow foundations, is Nova and Parma [4].
In the last decades, very porous artificial conglomerates are also becoming rather common in thegeotechnical practise: they are used for instance in special engineering applications in tunnelling andobtained as by-products of waste soil treatment. As was reported by Cucino et al. [5], very porousartificial conglomerates are employed in the construction of tunnels within swelling rocks to reduce
*Correspondence to: S. Utili, School of Engineering, University of Warwick, U.K. formerly at University of Oxford, U.K.†E-mail: [email protected]
Copyright © 2014 John Wiley & Sons, Ltd.
G. DATTOLA ET AL.
the actions on the tunnel lining. Moreover, very porous artificial materials are often the result of thecementation of soils and waste materials [6], which are engineered to improve their physical/chemical properties using a large variety of binding agents (lime, cement, fly ash, etc.). Jarofix, forinstance, characterised by a porosity of about 70%, is obtained by mixing sodium jarosite withPortland cement and lime [7]. Cement admixed clays are very common cemented soils, by-productsof ground improvement measures undertaken by cement stabilisation. The porosities of thesematerials are very high, with values of void ratio up to 5 [8, 9] and the presence of a bimodal porestructure with large spherical macro-voids along with inter-particle voids [10, 11]. The compactionprocesses within these natural/artificial materials are frequently characterised by the onset ofcompaction bands: Arroyo et al. [7] observed them in Jarofix and artificial conchyliades andCastellanza et al.[3] in Gasbeton.
This paper aims to investigate compaction processes taking place within very porous rocks eithernatural or artificial where a large decrease in void ratio is associated with the failure of bonds bindinggrains rather than grain crushing, which instead is observed at very large confining pressures on rockscharacterised by lower porosities [12–21].
Arroyo et al. [7] and Castellanza et al. [3] observed that under oedometric conditions in bothhighly porous cemented soils and soft rocks like calcarenites: (i) compaction bands can take placeat low vertical pressures (4–10MPa); (ii) the mechanical response is markedly affected by thepresence of large voids within the porous matrix; and (iii) damage mainly takes place in thebonds, these latter ones being weakness points in the microstructure. For all these reasons,the authors have decided to numerically analyse the compaction phenomenon by starting froma simplified description of the microstructure and by employing a numerical strategy based onthe distinct element method (DEM) capable of taking into account the microstructure of thistype of materials. Until now, few authors have employed DEM to investigate compactionprocesses in cemented porous materials. Katsman et al. [22] conducted numerical simulationson an ideal two-dimensional porous material made up of a regular network of linear springswithout modelling each rock/soil grain individually. Wang et al. [23] ran more realistic two-dimensional DEM analyses, but 2D analyses imply that the real porosity and the 3D kinematicsof the motion of grains cannot be replicated. In the authors’ opinion, this is a fundamentallimitation on the study of compaction bands because both porosity of the material andkinematics of the motion of the soil grains play a crucial role. Finally, more recently, Marketosand Bolton [24] investigated the occurrence of compaction bands triggered by grain crushingvia 3D DEM analyses.
Hereafter, an idealised highly porous geomaterial, made of bonded spherical grains, rather than aspecific geomaterial, is considered. No quantitative agreement between numerical results andavailable experimental data is thus expected. The numerical results that will be illustrated in thispaper highlight how the microstructural variables govern the mechanical response of the system. Forinstance, it will be shown that, when compaction bands occur, the internal length of the material ismainly related to the size of the macro-voids, whereas, when shear bands take place, thecharacteristic length is mainly related to the grain size distribution [25, 26]. Moreover, it will beshown that the fragility/ductility of the mechanical behaviour of bonds, together with the materialporosity, rules the occurrence of localization at the macro-level.
2. NUMERICAL PROCEDURE
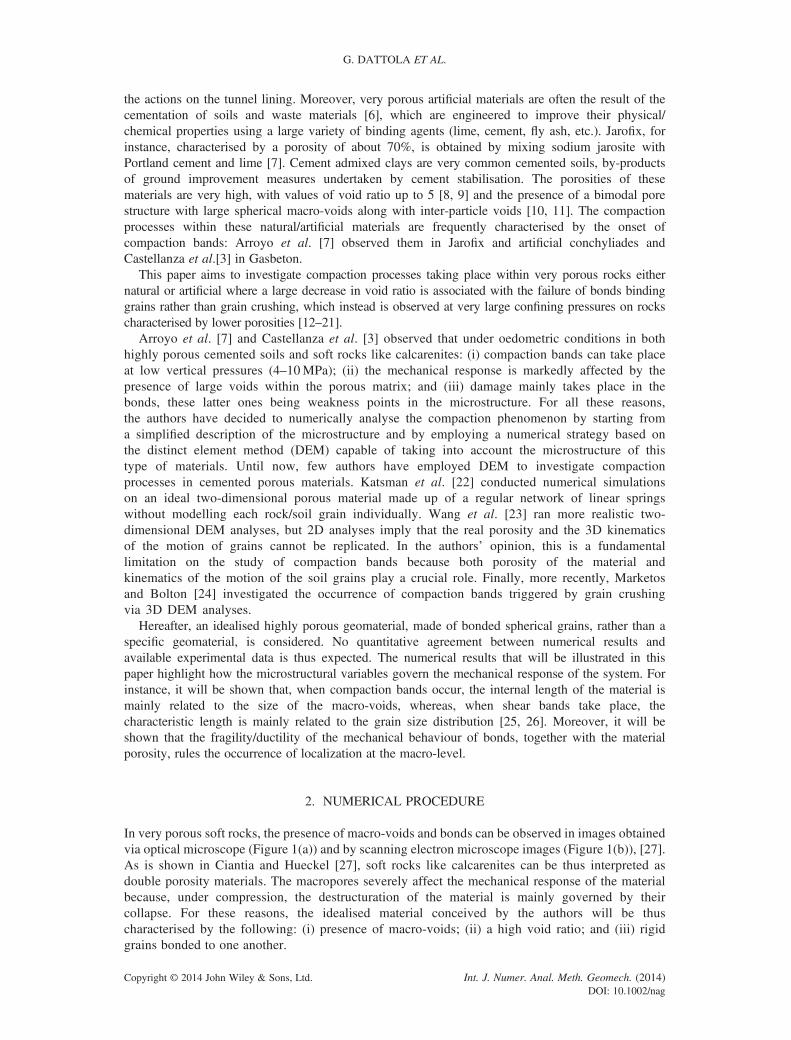
In very porous soft rocks, the presence of macro-voids and bonds can be observed in images obtainedvia optical microscope (Figure 1(a)) and by scanning electron microscope images (Figure 1(b)), [27].As is shown in Ciantia and Hueckel [27], soft rocks like calcarenites can be thus interpreted asdouble porosity materials. The macropores severely affect the mechanical response of the materialbecause, under compression, the destructuration of the material is mainly governed by theircollapse. For these reasons, the idealised material conceived by the authors will be thuscharacterised by the following: (i) presence of macro-voids; (ii) a high void ratio; and (iii) rigidgrains bonded to one another.
Copyright © 2014 John Wiley & Sons, Ltd. Int. J. Numer. Anal. Meth. Geomech. (2014)DOI: 10.1002/nag

(a) (b)
Figure 1. (a) Macropores in calcarenite observed via polarised light microscope. (b) Macropores in calcareniteobserved via scanning electron microscope (SEM). The arrows indicate the presence of bonds [27].
A DEM NUMERICAL INVESTIGATION OF COMPACTION PROCESSES
2.1. Sample generation
The numerical campaign consisted of 16 oedometric tests on cylindrical specimens. In all thesimulations, gravity was absent because geostatic stresses were assumed to be negligible incomparison with the applied axial stress. The initial height H0 and diameter Δ of specimens weredetermined after assigning the following: (i) the initial porosity n (the majority of the samples beingcharacterised by an initial porosity equal to 0.7); (ii) the total number of grains Np (this was keptapproximately constant and equal to 16 000 for all the generated specimens (Table II)); (iii) thegrain size distribution; and (iv) the specimen slenderness, α=H0/Δ, which was kept constant andequal to 2.
For a cylindrical specimen, Vt, the total specimen volume is related to the cylinder diameter as
Vt ¼ H0πΔ2
4¼ παΔ3
4(1)
Moreover,
Vt ¼ Vs
1� n(2)
with Vs being the volume of the solid fraction. From Eqns (1) and (2), the size of the sample diameterwas calculated as
Δ ¼ffiffiffiffiffiffiffiffiffiffiffiffiffiffiffiffiffiffiffiffi
4Vs
1� nð Þαπ3
s(3)
with the volume of the solid fraction, Vs , calculated as:
Vs ¼ ∑Np
i¼1
43π
ϕpi
2
� �3
(4)
where ϕpi is the diameter of the i-th grain.An additional goal of the procedure has been the generation of a specimen with a set of macro-voids
homogeneously distributed in space to generate specimens with both large void ratios and non-negligible coordination number. The main geometrical parameters of the introduced microstructureare as follows: (i) the ratio of macro-void size over the average grain size; and (ii) the number ofmacro-voids per unit volume.
To obtain a random distribution of pseudo-spherical macro-voids within the specimen, the followingnumerical procedure was employed:
Copyright © 2014 John Wiley & Sons, Ltd. Int. J. Numer. Anal. Meth. Geomech. (2014)DOI: 10.1002/nag

G. DATTOLA ET AL.
• Initially, two different groups of particles were generated within the cylinder: (i) ‘micro-particles’with linearly varying diameters and (ii) ‘macro-particles’ with a constant diameter ϕm.
• The method employed to generate the samples is the so-called radius expansion method [28]. Thistechnique allows for the generation of a spatially random grain size distribution with a homogeneousnetwork of contacts and low lock-in forces (so that specimens with negligible initial self-stresses aregenerated). In order to investigate the influence on the material mechanical response of the macro-voids size, simulations were run for two sizes of the macro-void diameter: ϕ1 = 2.5mm andϕ2 = 6.13mm. On the other hand, the final distribution of the micro-particle (grain) size diametersadopted is the same in all the tests. This is a uniform distribution with the grain diameter ranging fromϕp,min = 0.98mm to ϕp,max = 1.47mm.
• After generation, (Figure 2), the macro-particles are deleted to attain the desired macro-voids andbonds are assigned to all the pairs of particles in contact. Bonds were simulated in PFC3D byemploying the so-called ‘parallel bonds’: beam elements with circular cross section, whose constitu-tive law is described in the following. The adopted parallel bondwas assigned a radius,R, of 0.7 timesthe minimum radius of the two grains in contact. Given the adopted particle size distribution, the areaof the parallel bonds ranged from Amin = 0.37mm2 to Amax = 0.83mm2.
The number of macro-particles/macro-voids was determined by trial and error. Specimens withdifferent numbers of macro-voids and the same overall porosity were generated. The authors observedthat when the number of macro-voids was above a threshold value, stresses were present at the end ofthe generation procedure (i.e. the end of particle radii expansion); whereas when the number of macro-voids was below the threshold, no stresses were present. Because the overall porosity is fixed (e.g.n=0.7), the lower the number of macro-voids is, the lower the number of contacts among particles isand consequently the number of bonds. In order to generate a sample free from lock-in forces but at thesame time with a complete network of bonded particles, that is without any unbonded particles beingpresent, the sample with the largest possible number of macro-particles but with negligible stresses onthe boundaries at the end of the generation procedure (i.e. less than 1 kPa) was adopted. In Table II,
both the obtained standard coordination numbers, cpbN , defined as the number of contact per particle, and
the mechanical coordination number [29], CpbN , which excludes floating particles and rattlers (particles
with only one contact), are reported. Although the values of coordination number are quite small,nevertheless, the obtained microstructure is mechanically stable because of the presence of bondsholding particles together.
2.2. Contact laws and micromechanical parameters
In DEM, the simplest contact law, governing the mechanical interaction between two unbonded particles,is a linear spring together with a divider along the normal direction and a linear spring together with a
Figure 2. Cylindrical sample after the generation procedure, with micro-particles (rock/soil grains) in blueand macro-particles (to become macro-voids) in red.
Copyright © 2014 John Wiley & Sons, Ltd. Int. J. Numer. Anal. Meth. Geomech. (2014)DOI: 10.1002/nag
A DEM NUMERICAL INVESTIGATION OF COMPACTION PROCESSES
frictional slider along the tangential direction. The contact stiffness is defined by both the normal and shearstiffness of the two contacting entities (either particle or wall). The values of the particle normal and shearstiffnesses (kpn,k
ps) and the intergranular friction coefficient (μ
p) employed are reported in Table I. These aretypical values selected in DEM simulations for granular materials when the linear contact law is employed[30–32]. Top and bottom platens and lateral walls were set to be frictionless and much stiffer than theparticles (Table I). The grain density ρp was set equal to 2650kg/m3.
To simulate the action of cementitious bonds, two different bond models, herein called standardparallel bond (SPB) model and damage parallel bond (DPB) model, respectively, were employedand are described in the following sections. The SPB model was obtained by activating at the sametime two bond models already available in PFC3D [33]: the so-called ‘contact’ and ‘parallel’ bondmodels. The ‘contact bond’ between two particles prevents tangential irrecoverable slippage whilstthe ‘parallel bond’ transmits both elastic forces and moments between the two bonded particles. TheDPB model instead was implemented by the authors in the code via an ad-hoc routine.
Two different regularising damping approaches are commonly employed in DEM analyses: the so-called local damping and viscous damping. The former type of damping consists of increasingdecelerations and decreasing accelerations of particles of a fixed fraction, δ, [34]. In the latter caseinstead, two dashpots, one along the normal direction, ruled by parameter βn, and the other one alongthe tangential direction, ruled by parameter βs, are added to the contact model, so that a damping forceopposing the relative particle motion and proportional to the relative particle velocities is active. Thedimensionless parameters βn and βs represent the ratio between the applied damping and the criticaldamping coefficients.
Calibration of physically meaningful values of damping is very difficult because the current lack ofexperimental measurements on the dissipative phenomena taking place at the microscopic level (e.g.asperity shearing off, grain fracturing, etc.). For this reason, it is desirable to introduce a damagemodel (DPB) able to directly control the fragility/ductility of the bonds. Herein in the following,both approaches are employed and critically discussed.
2.2.1. Standard parallel bond model. In this model, bonds behave elastically until brittle failureoccurs. The default PFC3D ‘parallel bond’ is defined as a function of two stiffness coefficients andof the ratio of the bond radius over the minimum grain radius of the bonded particles. The parallelbond can be interpreted as a set of elastic springs uniformly distributed over a circular cross section.The normal and shear ‘distributed’ stiffnesses were taken as k
n ¼ 5� 1012 Pa/m and ks ¼ 2:5� 1012
Pa/m. These parameters were selected according to Marketos and Bolton [24] and Potyondy andCundall [28]. Failure takes place when either the maximum tensile stress exceeds the normal bondstrength (σc) or the maximum shear stress exceeds the bond shear strength (τc) (Table II). At failure,the entire elastic energy stored in the bond is released instantaneously. The maximum tensile andshear stresses acting on the parallel bond periphery can be calculated via beam theory.
2.2.2. Damage parallel bond model. For the reasons previously mentioned, the authors have chosento implement a damage rheological model dealing with a set of generalised stress–strain variables.
A similar approach has been proposed by Potyondy [35] to investigate damage occurring at bondlevel due to stress-corrosion reactions. Differently from that approach, in which the damage reducesthe diameter of bonds, here the damage process is simulated as a progressive reduction in themechanical properties of bonds.
In the DPB model conceived by the authors the process leading to the breakage of bonds is gradual.Bond failure is assumed to occur at the end of a progressive reduction in the mechanical properties(stiffness and strength) of the bond. The adopted DPB model is herein illustrated by employinggeneralised variables in terms of forces, Q, and displacements, q, defined as it follows:
Table I. Micromechanical parameters of particles and walls.
kpn [N/m] kps [N/m] μp kwn [N/m] kws [N/m] μw
4 × 10⁶ 2 × 10⁶ 0.5 4 × 10⁸ 2 × 10⁸ 0
Copyright © 2014 John Wiley & Sons, Ltd. Int. J. Numer. Anal. Meth. Geomech. (2014)DOI: 10.1002/nag

Table II. Parameters used for the simulations with elasto-brittle and elasto-damage contact model.
Test Np Nm
ϕm
[mm] κ cpbN CpbN βn=βs δ ω
σc
[Mpa]τc
[Mpa]σ0
[Mpa]τ0
[Mpa] ν [Hz]
SPBl07κ2_1 16492 2244 2.5 2 2.35 3.18 0.0 0.3 — 130 130 — — 0.76SPBl07κ2_2 16492 2244 2.5 2 2.35 3.18 0.0 0.7 — 130 130 — — 0.76SPBl07κ2_3 16492 2244 2.5 2 2.35 3.18 0.0 0.9 — 130 130 — — 0.76SPBv07κ2_1 16492 2244 2.5 2 2.35 3.18 0.0 0.0 — 130 130 — — 0.76SPBv07κ2_2 16492 2244 2.5 2 2.35 3.18 0.3 0.0 — 130 130 — — 0.76SPBv07κ2_3 16492 2244 2.5 2 2.35 3.18 0.6 0.0 — 130 130 — — 0.76SPBv07κ2_4 16492 2244 2.5 2 2.35 3.18 0.3 0.0 — 130 130 — — 0.61SPBv07κ2_5 16492 2244 2.5 2 2.35 3.18 0.3 0.0 — 130 130 — — 0.38SPBv07κ2_6 16492 2244 2.5 2 2.35 3.18 0.3 0.0 — 130 130 — — 0.19DPB07κ2_1 16492 2244 2.5 2 2.35 3.18 0.0 0.0 0.8 — — 250 250 2.75DPB07κ2_2 16492 2244 2.5 2 2.35 3.18 0.0 0.0 0.6 — — 250 250 2.75DPB07κ2_3 16492 2244 2.5 2 2.35 3.18 0.0 0.0 0.4 — — 250 250 2.75DPB07κ5_1 16491 181 6.13 5 2.34 3.41 0.0 0.0 0.6 — — 250 250 2.75DPB05κ2_1 16490 520 2.50 2 4.61 4.79 0.0 0.0 0.6 — — 250 250 2.75DPB05κ2_2 16490 520 2.50 2 4.61 4.79 0.0 0.0 0.8 — — 250 250 2.75
G. DATTOLA ET AL.
Q ¼
N
V
M
Mt
2666437775 (5)
with N ¼ Fn�n, V ¼ F
s�s,M ¼ Ms�r andMt ¼ M
n�n. Fn and Fs represent the axial and the shear forceacting on the parallel bond, respectively, and M
nand M
sthe torque and bending moments. s is a unit
shear vector, and r a unit moment vector parallel to the shear force and the bending moment,respectively. The corresponding displacements and rotations can be grouped in a vector, q:
q ¼
Un
Us
θs
θn
2666437775 (6)
with Us =Us � r and θs= θs � r. Un and θn represent the axial relative displacement and rotation,respectively, between two bonded particles, whilst Us and θs, the tangential relative displacementand rotation.
The adopted elasto-damage model is based on the following assumptions: (i) damage occursisotropically; and (ii) no irreversible displacements and rotations take place, that is, the elasticstiffness during unloading is lower than the stiffness exhibited during the first loading. Because ofthe first hypothesis, the amount of damage is expressed by means of only a scalar state variable, D,ranging from 0, for intact bonds, to 1, for fully damaged bonds. With the progression of damage, Dincreases according to a prescribed damage law. The constitutive relationship introduced in thefollowing is formulated in the framework of standard damage models [36]. According to the so-called equivalence principle,
eQ ¼ Deq (7)
where eQ is the associated effective force vector and De is the elastic stiffness matrix. eQ is defined as
Copyright © 2014 John Wiley & Sons, Ltd. Int. J. Numer. Anal. Meth. Geomech. (2014)DOI: 10.1002/nag

A DEM NUMERICAL INVESTIGATION OF COMPACTION PROCESSES
eQ ¼ Q1� D
(8)
The elastic stiffness De has the following form:
De ¼
knA 0 0 0
0 ksA 0 0
0 0 knI 0
0 0 0 ksJ
266664377775 (9)
with A, I and J being the area, moment and polar moment of inertia of the parallel bond cross section,respectively. From Eqns (7) and (8), the vector of the generalised forces can be obtained
Q ¼ 1� Dð ÞDeq (10)
This equation defines the constitutive relationship in terms of generalised variables once the evolutionlaw of the damage variable D is assigned. The activation of damage is ruled by a threshold functiondefined in the space of the generalised load variables (N, V, M and Mt):
g ¼ g Q; χ Dð Þð Þ (11)
where χ(D) is the vector of internal variables. The threshold function is analogous to the yield function inclassical plasticity theory: if g< 0, the material behaves elastically and D ¼ 0 so that χ is constant,whereas for g ¼ g ¼ 0; damage occurs, D > 0, so that χ reduces and as a consequence the thresholdsurface (g=0) shrinks omothetically.
For the sake of simplicity, the influence of torque on the threshold function was neglected; hence,the activation of damage process is exclusively governed by N, V and M. The threshold functionadopted is a modification of the mathematical expression first proposed by Neal [37]:
g Q; χ Dð Þð Þ ¼����M—M—
����ξ1 þ �N—N—
�2
þV—V—
� �4
1��N—N—
�2� 1 (12)
where the vector of the internal variables, χ, is defined as follows:
χ ¼N
V
M
264375 (13)
with N , V and M are the coordinates in the space of the generalised forces of the intersection pointsbetween the current threshold surface and the coordinate axes (N, V and M), respectively. The shapeof the threshold surface is shown in Figure 3.
Because the Newton–Raphson algorithm adopted to compute the damage model equations(Appendix) requires differentiability of the threshold function in all the points of its domain, anextra parameter, ξ1, was added to the original Neal’s formulation to make it differentiable. Whenξ1 = 1, the original Neal’s expression is obtained. If a value of ξ1 just slightly larger than 1 is chosen(for instance ξ1 = 1.001), differentiability of the function is ensured, and the difference between theoriginal shape of the Neal’s threshold surface and the one here adopted is practically negligible.
Copyright © 2014 John Wiley & Sons, Ltd. Int. J. Numer. Anal. Meth. Geomech. (2014)DOI: 10.1002/nag

Figure 3. The adopted threshold surface (Eqn (12)) in the N-V-M space.
G. DATTOLA ET AL.
The evolution of the internal variable vector χ was assumed as follows:
χ ¼N
V
M
264375 ¼
eN0
V0
M0
264375 1� Dð Þω with ω < 1 (14)
with
eN0 ¼N0 for N < 0
ξ2N0 for N≥0
�(15)
with ξ2 >1. ω is a parameter governing the ductility of the mechanical response, that is, the rate ofshrinkage of the threshold surface. The larger ω is, the higher is the rate of damage (Appendix).Because the damage parameter D reaches 1 only asymptotically, we assumed that bond breakageoccurs at D=0.99, with bonds being deleted as soon as D=0.99. Note that unlike the original surfaceproposed by Neal, our threshold surface is non-symmetrical, because of the introduced parameter ξ2representing the ratio of purely compressive strength over purely tensile strength (Figure 3). Here, acompressive strength 10 times the tensile one was assumed so that ξ2 = 10.
Analogously to the elasto-brittle bond model, the onset of damage is related to the maximum normalstress σ0 and the maximum tangential stress τ0 of the bond:
N0 ¼ σ0A ¼ σ0�π�R2
V0 ¼ τ0A ¼ τ0�π�R2
M0 ¼ σ0I—R— ¼ 1
4σ0�π�R3
(16)
where R, A and I are the radius, the area and the moment of inertia of the parallel bond, respectively.In the Appendix, the detailed implementation of the elasto-damage bond model into the code is
illustrated. In summary, the DPB model is a function of five parameters (σ0, τ0, ξ2, ω and R), thefirst three are related to the bond strength, ω to the bond ductility and R to the bond geometry. Thekey feature of the bond model here introduced is that the parameters employed are clearly related toeither the geometry or the material properties of the bond.
Copyright © 2014 John Wiley & Sons, Ltd. Int. J. Numer. Anal. Meth. Geomech. (2014)DOI: 10.1002/nag

A DEM NUMERICAL INVESTIGATION OF COMPACTION PROCESSES
2.3. Determination of the representative elementary volume
The results of any either numerical or experimental test are reliable if and only if the tested specimensare big enough to be representative of the material analysed, nevertheless, in many publications onDEM, the question whether the adopted volume is a representative elementary volume (REV) is onlyrarely tackled (e.g. see [38]). For the material here investigated, the size of the REV is a function ofthe following: (1) the size of particles; (2) the size of macro-voids; and (3) the average distanceamong macro-voids, which was calculated as the average distance between the centres of twoadjacent macro-voids minus the macro-void radius.
To identify a suitable REV, we considered the mechanical response of specimens before anybreakage of bonds (no localisation has yet occurred) until their mechanical response is linear elastic.The specimens were loaded by moving the top platen downwards with the bottom platen fixed. Inthe initial loading phase, the global stiffness of the specimens can be conveniently expressed interms of the oedometric Young modulus, Eoed, defined as the ratio between the axial stress σa,calculated as the axial force acting on the upper platen over the platen area and the nominal axialstrain, as the vertical displacement Δz of the upper platen over H0.
Both particle size distribution and initial porosity of specimens were kept unchanged in the majorityof the simulations so that the REV size depends exclusively on the size of the macro-voids. As isevident from Figure 4, by increasing the specimen size, the variation in Eoed becomes progressivelysmaller until a horizontal asymptote is reached, implying that in case of κ = 2 (Figure 4(a)),specimens with H0/ϕp,mean> 45.2, corresponding to Np> 10 000 can be taken as a REV and,analogously (Figure 4(b)), specimens with κ = 5 and average distance between macro-voids equal to4mm turn out to be representative for the material.
2.4. Detection of compaction bands
Compaction banding is a localization process causing the loss of uniformity in both the strain and stressfields within the specimens. Compaction bands are commonly classified as tabular zones of purecompressive deformation aligned orthogonally to the direction of the maximum compressive stress.To detect the formation of compaction bands, the authors employed two different strategies. Thefirst is based on detecting broken and damaged bonds (see Figures 15, 16, 18, 10, 21, 22 and 26).According to this approach, the development of zones of higher concentration of damage signals thepresence of compaction bands. This is the default approach to capture the onset of compactionbands in experimental tests (Olsson and Holcomb [17] and Baud et al. [21]). However, the presenceof zones of higher concentration of bond breakages is not sufficient to prove the development of acompaction band. To this end, a second strategy, based on the analysis of the strain field, wasemployed. This requires the calculation of a reliable local measure of strains, which is a particularlychallenging problem in case of discrete element simulations. To evaluate the field of vertical strain,
(a) (b)
Figure 4. Oedometric Young elastic modulus, Eoed, versus sample height, H0, normalised by the meanparticle size, ϕp,mean, for samples with different number of macro-voids: (a) κ = 2 and (b) κ = 5.
Copyright © 2014 John Wiley & Sons, Ltd. Int. J. Numer. Anal. Meth. Geomech. (2014)DOI: 10.1002/nag

G. DATTOLA ET AL.
two techniques were adopted: the first one being based on mesh-free interpolants and the second oneon a simplified method to measure the variation of void ratio within the sample [39].
In recent years, several kinematic homogenization techniques have been proposed in the literature tocalculate strains in particulate media. All these techniques rely on the calculation of averagedisplacement gradients from the displacements and rotations of single particles. O’Sullivan et al. [40]showed that mesh-free interpolants are particularly effective in detecting strain localisation. Theyemployed the so-called moving least square reproducing kernel (MLSRK) interpolant, first proposed byLiu et al. [41] which was employed in this paper, too. This method requires the selection of a value forthe so-called dilation parameter, ρ, that represents the size of the window function, which is amathematical function used as interpolant for the displacement field achieved from the displacementsrecorded for the particles.
The second technique is based on the subdivision of the sample into a number of equal size layers [42].At each step, the subdivision is repeated. The number of layers is kept constant with each layer beingof the same size. The void ratio of each layer, eL, was calculated from the total volume of the layer andthe volume of solids, VsL. The average volumetric strain εvolL, that is, the average vertical strain εzL perlayer, is calculated as follows:
εzL ¼ εvolL ¼ ΔVvL
V0L¼ ΔeL�Vs0L
V0L(17)
with ΔeL the variation of void ratio in the layer, V0L the initial volume of the L-th layer and Vs0L theinitial volume of solids belonging to the L-th layer.
3. RESULTS
Numerical tests were performed by employing both SPB and DPB models. In Table II, a summary ofthe values of the parameters employed is provided. Each test is denoted by the acronym ‘xPByzκw_i’where x indicates the type of bond model: S for SPB and D for DPB; y indicates the type of dampingemployed: l for local and v for viscous; z indicates the initial porosity of the specimen; w represents thevalue of the parameter κ; and i represents the identification number of the test.
All the specimens were loaded by moving downwards the upper platen with the bottom platen keptfixed. The imposed nominal axial strain rate ˙ν is reported in Table II. The difference between the forceacting on the upper platen and the reaction force on the lower platen was constantly monitored andresulted to be negligible throughout all the tests (Figure 5). As long as no localization due to thecollapse of macro-voids occurs, the specimen continues to be homogeneous; therefore, if the granularassembly is considered as a continuum body, the presence of equal reaction forces at the boundaries
(a) (b)
Figure 5. Graphs relative to test SPBl07κ2_2. During the test, the lower plate is fixed, whereas the upperplate moves downwards. (a) Forces acting on the upper Fup and lower Fdw platen against the nominal axial
strain. (b) Total Kinetic energy Ek of the granular system against the nominal axial strain.
Copyright © 2014 John Wiley & Sons, Ltd. Int. J. Numer. Anal. Meth. Geomech. (2014)DOI: 10.1002/nag

A DEM NUMERICAL INVESTIGATION OF COMPACTION PROCESSES
implies a uniform stress state. Now, according to the equilibrium equations of continuum mechanics(conservation of linear momentum), inertial body forces are equal to the gradient of the stress tensor,which is nil in this case because no body forces are present (gravity is absent) and no pressuredifferential is applied on the boundaries (equal reaction forces from the platens); hence, it can beconcluded that the specimen is under quasi-static conditions, that is, the inertial forces present arevery small in comparison with the static forces. Note that had both platens been moving (e.g. bottomplaten moving upwards and upper platen moving downwards), the presence of equal reaction forceswould not imply the uniformity of the stress field in the specimen because a symmetrical stressgradient could develop with the line of symmetry located at half the sample height. Once localizationoccurs because of the collapse of macro-voids, quasi-static conditions are no longer in place even ifthe reaction forces on the platens remain equal (Figure 5(a)) so that spikes of kinetic energy arise inthe specimen due to the accelerations experienced by the particles involved in the collapse of macro-voids (Figure 5(b)). The occurrence of localization implies that the sample is no longer homogeneousso that the aforementioned considerations on quasi-staticity of the sample are no longer valid and thestress field inside the region(s) where compaction band(s) develop may be different from the field inthe rest of the sample.
In Figure 6 the stress–strain curves of several tests for the same specimen size (H0 = 6.54 cm,Δ= 3.27 cm) but for different bond models and damping types are plotted: it emerges that themechanical response of the system is significantly affected by both the constitutive model of thebonds and the type of damping adopted. In the following sections, the influence of each factor onthe mechanical response of the system is investigated.
3.1. Influence of the damping law (SPB model)
The mechanical response of the tested specimen was investigated for various values of δ for local damping(δ=0.0; δ=0.3; δ=0.7; δ =0.9) and of βn, βs for viscous damping (βn= βs=0.0; βn= βs=0.3;βn= βs=0.6) with the obtained stress–strain curves plotted in Figure 7. From the graphs in the figure,two stages of the test can be identified: the first one being the part where the trend is linear and thesecond one the part where it is nonlinear. In the first stage, the specimen exhibits a linear elasticbehaviour and deforms under quasi-static conditions, and all the curves coincide because of the fact thatunder quasi-static conditions damping does not affect the mechanical response of the material [43]. In
Figure 6. Comparison between the σa�Δz/H0 curves obtained in different tests with different values ofparameters (Table II).
Copyright © 2014 John Wiley & Sons, Ltd. Int. J. Numer. Anal. Meth. Geomech. (2014)DOI: 10.1002/nag

(a) (b)
Figure 7. Comparison between the σa�Δz/H0 curves obtained for different values of (a) the local dampingcoefficient δ and of (b) the critical damping ratios βs = βn.
G. DATTOLA ET AL.
the second phase instead, specimens experience inertial forces due to the movement of particles let free bythe failures of the bonds binding them. It emerges that the local damping is significantly more effective inreducing the material fragility than the viscous damping.Moreover, it can be observed that the peak of the axial stress is highly affected by the value adopted for thelocal damping (Figure 7(a)) in contrast with the negligible influence exerted by the viscous damping(Figure 7(b)). The observed trend can be explained considering that when the stress peak is reached,collapse of several macro-voids has taken place allowing the previously bonded particles freedom ofmovement. Now local damping acts directly on particle accelerations reducing them, whereas theviscous damping acts only when particles come into contact, therefore unlike the viscous damping,local damping is effective at reducing the speed of the collapse of the macro-voids, which in turnaffects the dynamic equilibrium established in the specimen and therefore the stress peak.
In Figure 8, the dependence of the mechanical response on the loading rate applied is illustrated for testsrun with viscous damping of βn= βs=0.3. Because all the curves coincide during the initial elastic phase, it
Figure 8. Comparison between the σa�Δz/H0 curves obtained for different values of the nominal axialstrain rate ν.
Copyright © 2014 John Wiley & Sons, Ltd. Int. J. Numer. Anal. Meth. Geomech. (2014)DOI: 10.1002/nag
A DEM NUMERICAL INVESTIGATION OF COMPACTION PROCESSES
can be concluded that the loading rate does not affect the mechanical response of the specimens as long asthey remain homogeneous. Also, the values of peak stress, reached after localization has taken place, arethe same. The only noticeable difference in the plotted stress–strain curves is about the value of axialdisplacement (Δz/H0) when a significant stress drop occurs. This value is not correlated by anytrend (e.g. proportionality) with the loading rate applied but appears to be random.
3.2. Detection of compaction band propagation
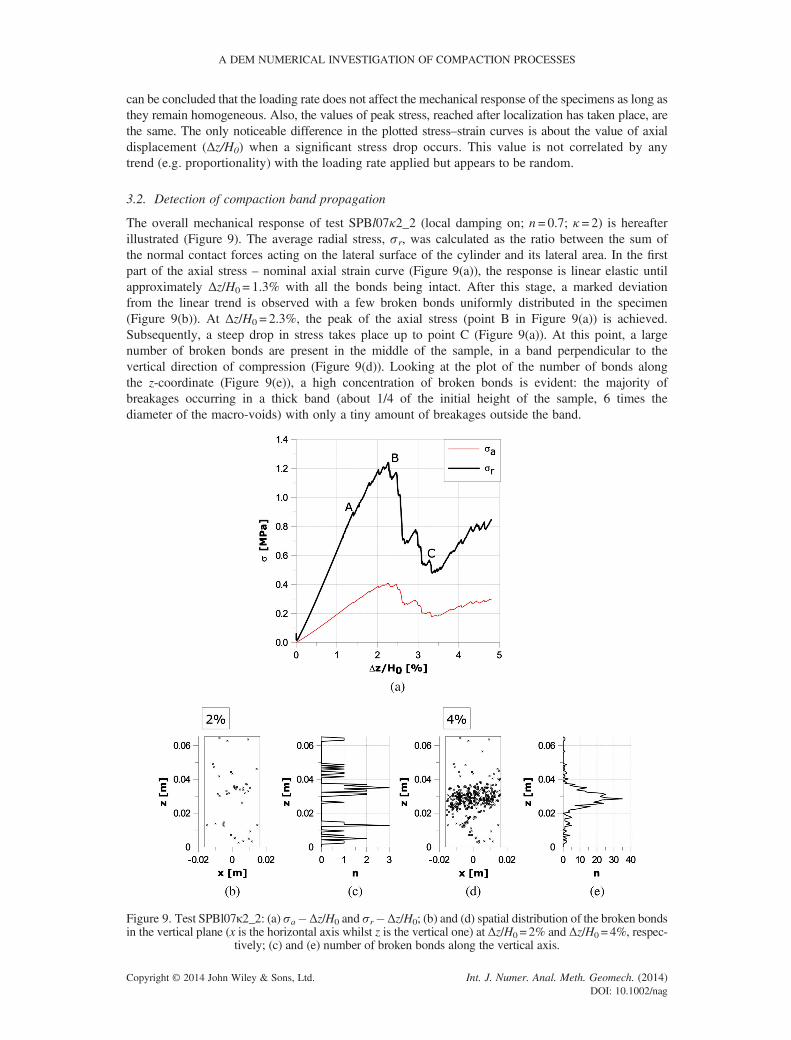
The overall mechanical response of test SPBl07κ2_2 (local damping on; n = 0.7; κ = 2) is hereafterillustrated (Figure 9). The average radial stress, σr, was calculated as the ratio between the sum ofthe normal contact forces acting on the lateral surface of the cylinder and its lateral area. In the firstpart of the axial stress – nominal axial strain curve (Figure 9(a)), the response is linear elastic untilapproximately Δz/H0 = 1.3% with all the bonds being intact. After this stage, a marked deviationfrom the linear trend is observed with a few broken bonds uniformly distributed in the specimen(Figure 9(b)). At Δz/H0 = 2.3%, the peak of the axial stress (point B in Figure 9(a)) is achieved.Subsequently, a steep drop in stress takes place up to point C (Figure 9(a)). At this point, a largenumber of broken bonds are present in the middle of the sample, in a band perpendicular to thevertical direction of compression (Figure 9(d)). Looking at the plot of the number of bonds alongthe z-coordinate (Figure 9(e)), a high concentration of broken bonds is evident: the majority ofbreakages occurring in a thick band (about 1/4 of the initial height of the sample, 6 times thediameter of the macro-voids) with only a tiny amount of breakages outside the band.
Figure 9. Test SPBl07κ2_2: (a) σa�Δz/H0 and σr�Δz/H0; (b) and (d) spatial distribution of the broken bondsin the vertical plane (x is the horizontal axis whilst z is the vertical one) at Δz/H0 = 2% and Δz/H0 = 4%, respec-
tively; (c) and (e) number of broken bonds along the vertical axis.
Copyright © 2014 John Wiley & Sons, Ltd. Int. J. Numer. Anal. Meth. Geomech. (2014)DOI: 10.1002/nag

G. DATTOLA ET AL.
In Figure 10, the strain field within the sample, calculated by employing the MLSRK mesh-freemethod, is plotted at Δz/H0 = 2% and Δz/H0 = 4%. The value adopted for the so-called dilationparameter, ρ (see [40]), was determined by trial and error (ρ=8). For too low values of ρ, the numberof particles within the window is too small and unrealistically irregular strain fields appear. On thecontrary, for too large values of ρ, the window region becomes too large to detect any strainlocalization. From Figure 10(a), it emerges that at Δz/H0 = 2%, the local variation of axial strain fromthe value of the nominal strain is small, and the strain field of the specimen is still uniform. Conversely,after the drop of axial stress has taken place, (Figure 10(b)), a compaction band perpendicular to thedirection of compression is visible in the middle of the sample with the strain field being clearlynonuniform. Experimental tests from the literature usually show compaction bands starting in thevicinity of the platens, because of the presence of tangential stresses caused by friction [3]. However, inour numerical simulations, all the boundary walls are frictionless, so that the onset of the compactionbands is governed only by the heterogeneities initially present in the samples which, owing to theadopted procedure of particle and bond generation, are randomly distributed in space.
Local axial strains were also calculated bymeans of a secondmethod. The sample was subdivided into 26layers of thickness approximately equal to one macro-void diameter. The thickness adopted for the layerswas determined by trial and error: for higher values of thickness the compaction band could be missed,whereas for lower values an unrealistically irregular strain field would be obtained. In Figure 11, theaverage axial strains calculated for each layer are plotted before the stress peak (at Δz/H0 = 2%) andafterwards (at Δz/H0 = 4%). It can be observed that inside the compaction band, the axial strainincreases sharply to values significantly higher than the imposed nominal strain. In fact, because of theirreversible rearrangements of several unbonded particles, irrecoverable (plastic) deformations takeplace, whereas outside the band, particles are still bonded, so that the material undergoes elasticunloading. Looking at Figures 10 and 11, it emerges that the fields of axial strain determined by thetwo different methods, both inside and outside the compaction band, are in a very good agreementregarding both the value of calculated strain and the position of the borders of the compaction band.
3.3. Influence of the damage parameter ω (damage parallel bond model)
From the results of paragraph 3.1, it can be concluded that viscous damping is not effective inregularising the post-peak regime, whereas local damping is. These forms of damping were originallyintroduced in the DEM with the purpose of either speed up computations or regularising themechanical response of the sample (e.g. dampening oscillations) but without a direct physical relationto any micromechanical phenomenon causing energy dissipation, hence, calibration of their values isperformed on the basis of the desired overall mechanical response of the specimen of granularmaterial rather than to reproduce any experimental measurement, however, currently unavailable, of
(a) (b)
Figure 10. Plots of the vertical strain field within the sample (test SPBl07κ2_2) calculated on a planar slice,xz plane, of the cylindrical sample for: (a) Δz/H0 = 2% and (b) Δz/H0 = 4%.
Copyright © 2014 John Wiley & Sons, Ltd. Int. J. Numer. Anal. Meth. Geomech. (2014)DOI: 10.1002/nag

Figure 11. Vertical strain within the samples for different values of Δz/H0 in test SPBl07κ2_2. The samplewas subdivided into 26 layers. Each symbol represents the average vertical strain within a layer.
A DEM NUMERICAL INVESTIGATION OF COMPACTION PROCESSES
dissipative phenomena occurring at the level of grain interaction. Therefore, although dampingparameters affect the ductility of the system, they are not related to the ductility of the bonds and donot possess a clear physical meaning. Conversely, in case of the DPB model, the ductility of thebonds is directly controlled by the parameter ω, which possesses a clear physical meaning as the rateof bond damage progression (see par. 2.2). The ability of the DPB model to replicate in a realisticway, the damage process occurring in the bonds, is a key advantage over the SPB model. Moreover,progressive damage of the bonds causes irreversible energy dissipation hence having the effect ofregularising the mechanical response of the system although in a different way than the two forms ofdamping employed in the SPB model do. In this section, simulations run with the DPB model, andno damping are presented with the purpose of assessing the capability of the DPB model to capturethe main features relative to the onset and propagation of compaction bands in highly porous rocksand cemented soils.
In Figure 12, the typical σa�Δz/H0 and σr�Δz/H0 responses exhibited by specimens with bondsof the DPB model are plotted. For the sake of analysis of the mechanical behaviour exhibited by thespecimens, three stages phases for the mechanical response can be identified. In the first stage, bondsremain intact so that the response is linear elastic. The second stage starts with a gradual butprogressive deviation of the response from linearity because of the progressive damage undergone bybonds in the specimen. In the following, it will be shown that depending on the value of ω, the branchof the curves in the second stage can exhibit either hardening or softening. During this second stage, aprogressive collapse of macro-voids occurs with the material changing its structure from a high porositymaterial to a low porosity one and therefore its mechanical properties, that is, stiffness and strength.Finally, the third stage starts where a sharp increase in the slope takes place: there, all macro-voids havecollapsed and the material stiffness increases (Figure 12). These three phases are also observed inexperimental tests on highly porous rocks [3].
Copyright © 2014 John Wiley & Sons, Ltd. Int. J. Numer. Anal. Meth. Geomech. (2014)DOI: 10.1002/nag

Figure 12. σa�Δz/H0 and σr�Δz/H0 curves obtained for the DPB model (test DPB07κ2_2). The approx-imate borders of the stages of the mechanical response are marked by dashed grey vertical lines.
G. DATTOLA ET AL.
The force–displacement relationship obtained for a single bond tested under uniaxial compression isplotted in Figure 13(a), for three values of ω: ω =0.8, ω=0.6 and ω=0.4 (tests DPB07κ2_1,DPB07κ2_2 and DPB07κ2_3). An analogous force–displacement curve scaled down of 10 times invalue is obtained in case of uniaxial tension. Note that ω does not affect the strength but only the post-peak strain softening phase of the mechanical response of the bond with the highest ductility forω =1.0, that is, relative displacements occurring with the contact force being constant, and the lowestductility for ω=0.0, that is, elasto-fragile behaviour without any softening. In Figure 13(b), the curvesof axial stress versus nominal axial strain, for samples featured by the aforementioned values of ω(ω=0.8; ω=0.6; ω=0.4), are plotted. In all the curves, a progressive loss of stiffness is noticeable. Thedeviation of the curve from linearity reflects the fact that bonds start to undergo damage: in all thecurves stress drops are visible. The magnitude of the observed drops is highly affected by the amountof ductility adopted for the bonds: the higher the ductility (i.e. the lower the value of ω) is, the lowerthe stress drops turn out to be and the more ductile the global mechanical response of the systembecomes. It is remarkable to note that in case of high ductility of the bonds (ω =0.4), an overall ductilebranch of the curve is obtained with very small stress drops. This shows that the onset of thecompaction band can take place even in the presence of an overall ductile behaviour. This is due to the
(b)
(a)
Figure 13. (a) Constitutive relationship of the parallel bond in the normal direction and (b) comparisonbetween the σa�Δz/H0 curves obtained in test DPB07κ2_1, DPB07κ2_2, DPB07k2_3.
Copyright © 2014 John Wiley & Sons, Ltd. Int. J. Numer. Anal. Meth. Geomech. (2014)DOI: 10.1002/nag

A DEM NUMERICAL INVESTIGATION OF COMPACTION PROCESSES
fact that the collapse of the macro-voids occurs gradually with the grains in the forming compaction bandthat are moving away from each other and at the same time being held together by damaged but still intactbonds. Later on (see par 4.3), the influence of the size of the macro-voids is also investigated. It will beshown that in case of larger sizes, the macro-voids are so big that their collapse cannot take placewithout full detachment of the grains taking place (i.e. bond breakage occurring), which leads tosignificant accelerations on the grains and in turn to a drop of the axial stress.
From Figure 13, it also emerges that the value of ω is strongly related to the amount of the observedstress drops. Intuitively, it can be expected that the ductility of the bonds is related to the globalductility exhibited by the sample, so that the more fragile the bonds (the higher ω), the more fragileis the mechanical response of the specimen. So the amplitude of the observed stress drops increaseswith ω increasing, that is, with the fragility of the bonds increasing, because the more fragile thebonds the less energy is dissipated by bond damaging and the higher is the portion of energyinputted in the system, via the motion applied to the platens, that is transferred in the form of kineticenergy to the debonded particles whose inertial forces give rise to the drop of nominal axial stress inthe specimen. A theoretical analysis on the ductility/brittleness of the system will follow in Section 4.Finally, from Figure 13, we can also note that the difference in terms of nominal axial strain betweentwo consecutive stress drops decreases with ω decreasing, that is, with the ductility of the bondsincreasing, which implies an increase in the capability of the system to redistribute contact forcesleading to an overall hardening behaviour.
The curve obtained for ω= 0.6 (test DPB07κ2_2) is qualitatively the most similar to theexperimental axial stress – axial strain curve reported in Castellanza, et al. [3] for a Pumice stone(Figure 14) providing an indication of a realistic value for the damage progression parameter. Aquantitative match with the experimental curve could be easily obtained by calibrating the othermicromechanical parameters ruling the contact law (Table I). However, fine-tuning of the values ofthe micromechanical parameters to reproduce a particular experimental curve is not the aim of thepaper, which is rather to run a parametric investigation of the influence of the main micromechanicalquantities on the formation of compaction bands in cemented granular geomaterials to come up witha deeper understanding of the phenomenon and a theoretical analysis of it. So, it has been shownthat the DPB model is a suitable bond model to capture the behaviour of very porous rocks andcemented soils subject to compaction banding having the advantage of being ruled by only oneparameter of clear physical meaning whose value can be ascertained by running an oedometric test.For this reason, this model was chosen to perform the parametric analysis presented in Section 4.
In order to investigate the relationship between the onset of compaction bands and the progression ofdamage in the bonds, in Figure 15, the spatial distribution of broken and damaged bonds is plotted forthe three tests run at different values of nominal axial strain (DPB07κ2_3, DPB07κ2_1 andDPB07κ2_2). The cross symbols refer to severely damaged bonds, with the damage variable beingD> 0.5, whilst the dots refer to broken bonds. First, let us compare simulations for low and high valuesof ω, that is, ω =0.4 and ω =0.8, respectively. At any stage of the test run for low ω values (Figure 15(a), (b) and (c)), the number of severely damaged bonds is largely greater than the number of brokenbonds. The contrary holds true for the test run for high ω (Figure 15(d), (e) and (f)) where the number
Figure 14. Experimental results obtained on a pumice stone (porosity 70 %) after Castellanza et al. [3].
Copyright © 2014 John Wiley & Sons, Ltd. Int. J. Numer. Anal. Meth. Geomech. (2014)DOI: 10.1002/nag

Figure 15. Spatial distribution of damaged and broken bonds within the specimens for various values of ωat different times: (a) Δz/H0 = 6% for ω= 0.4; (b) Δz/H0 = 9% for ω= 0.4; (c) Δz/H0 = 10% for ω= 0.4; (d)Δz/H0 = 5% for ω= 0.8; (e) Δz/H0 = 8% for ω= 0.8; (f) Δz/H0 = 18% for ω= 0.8; (g) Δz/H0 = 15% for
ω= 0.6; (h) Δz/H0 = 21% for ω= 0.6; and (i) Δz/H0 = 31% for ω= 0.6.
G. DATTOLA ET AL.
of severely damaged bonds is negligible in comparison with the number of broken bonds. In theintermediate case of ω =0.6 (Figure 15(g), (h) and (i)), the number of severely damaged and brokenbonds is approximately of the same magnitude, which is consistent with the behaviour observed in theother two cases of high and low ω values. Moreover, it can be derived that the thickness of thecompaction band is related to the value of ω with compaction bands being thinner at low values of ω.
Concerning the sequence of formation of the compaction bands, it can be noted that localizations arisein several zones of the specimen until full compaction is reached (Figure 15(g)). In all the tests, thepresence of a second band just above the first one can be observed (Figure 15(a), (d) and (g)).Subsequently, at higher nominal average axial strains, a third and fourth band develop near the topand bottom boundaries, respectively (Figure 15(f) and (h)).
4. PARAMETRIC ANALYSIS
In the previous section, it has been shown that the DPB model is a suitable bond model to qualitativelycapture the mechanical behaviour of very porous rocks and cemented soils subject to compactionbanding due to bond destructuration. The DPB model has the advantage of being ruled by only one
Copyright © 2014 John Wiley & Sons, Ltd. Int. J. Numer. Anal. Meth. Geomech. (2014)DOI: 10.1002/nag

A DEM NUMERICAL INVESTIGATION OF COMPACTION PROCESSES
parameter, ω, of clear physical meaning (i.e. the bond damage rate). In the following, the main factorsaffecting the mechanical response of the studied geomaterials are investigated, in particular:
(i) the influence of initial porosity on the inclination of compaction bands;(ii) the occurrence of phenomena of global instability; and(iii) the influence of the size of macro-voids.
4.1. Influence of porosity
In order to assess the influence of porosity on the mechanical response of the system, numerical testsfor a value of initial porosity lower than the value adopted in the previous section, n = 0.5 and n= 0.6,were run. The grain size distribution and the size of macro-voids, κ = 2, were the same as in theprevious tests. Because of the lower porosity, fewer macro-voids (e.g. Nm = 520) were generated inthese tests. For these lower values of porosity, localization is observed only if high enough values ofω are adopted (no localisation for ω = 0.6 and localisation for ω= 0.8). This can be explainedconsidering that lower porosity implies a higher number of bonds per grain, hence, an overall morestable structure so that the structure becomes unstable only in case of high fragility of the bonds.
From the simulations, the existence of a threshold value of porosity, around n=0.6, below which thereis the formation of a band of localised damaged whose inclination is no longer horizontal but oblique. Thelower the porosity is, the more inclined the band is. In Figure 16(a), the σa�Δz/H0 and σr�Δz/H0 curvesof test DPBv05κ2_2, with n=0.5, are plotted. The occurrence of instability is signalled by a sharp drop inthe monitored stresses taking place at Δz/H0 = 9%. In Figure 16(b), the spatial distribution of the brokenbonds at Δz/H0 = 9% is plotted. Unlike previous tests run for n=0.7, the region where the broken bondsare concentrated in a band whose normal is inclined of 45 over the x-axis and 34 over the y-axis. Theband propagates vertically; therefore, the direction of propagation does not coincide with the normal tothe plane of the band as in the case of pure mode compaction bands.
The mechanical coordination number relative to the specimen here considered (CpbN ¼ 4:72 ) is
significantly higher than that relative to tests in SPBl07κ2_2 and SPBv07κ2_2, leading to aspecimen with higher stiffness and strength, owing to the presence of a larger number of bonds. Asa consequence, at the onset of localisation, the stress ratio, η= q/p, with q =σa�σr, the deviatoricstress and p= (σa+ 2σr)/3, the mean effective pressure, is 10% higher (η = 1.3 in test SPBv07κ2_2and η= 1.45 in test SPBv05κ2_1) than in tests SPBv07κ2_2 and SPBv05κ2_1. This observationfurther corroborates what was already stated by Rudnicki [44], about the effect of stress anisotropyon the onset of mixed modes of localisation (mixed between compaction and shear bands): ‘the
0 2.5 5 7.5 10
Δz/H0 [%]
0
20
40
60
80
100
σ[M
Pa]
(b)(a)
-0.02 -0.01 0 0.01 0.02
x[m]
0
0.02
0.04
0.06
z[m
]
Compactedzone
(c)
Figure 16. Test DPBv05κ2_2 for n= 0.5: (a) σa�Δz/H0 and σr�Δz/H0 curves; (b) 3D view of the locationof the broken bonds (test DPBv05κ2_2); and (c) velocity vectors of some balls belonging to a planar slice
(plane xz) of the sample.
Copyright © 2014 John Wiley & Sons, Ltd. Int. J. Numer. Anal. Meth. Geomech. (2014)DOI: 10.1002/nag

G. DATTOLA ET AL.
analyses of Issen and Rudinicki [45, 46] suggest that small variations in material parameters mayfavour the appearance of either shear or compaction bands. Bésuellle [47] has shown that the resultsof Rudinicki and Riece (1975) predict that the mode of deformation in the localised (shear versusdilatation or compression) varies continuously between pure compaction and pure dilatation’. Infact, a sample of lower porosity is featured by more bonds at generation, hence, higher strength;therefore, the loss of linearity in the stress–strain curve (yield point) corresponding to the occurrenceof irreversible deformations takes place for a higher value of the stress ratio, η. This value is higherthan the stress ratio marking the transition between fragile and ductile behaviour but lower than thethreshold value required for the occurrence of pure shear bands. Therefore, for η in this range,mixed modes of localisation take place [44].
4.2. Brittleness of the system
Figures 16(a) and 17(a), referring to tests DPBv07κ5_1 and DPB05κ2_2, respectively, show theoccurrence of a globally unstable behaviour, that is, a vertical drop in the nominal axial stress. In theprevious section, it has been shown that the amount of stress drop is related to how quickly acompaction band develops and propagates within the specimen. To investigate the phenomenon further,the specimen of test DPBv07κ2_2 (Figure 17(a)) was subdivided into 9 layers. Axial and radial stresseswere calculated for each layer. The radial stress of each layer was determined as the sum of the normalcontact forces against the cylindrical wall divided by the lateral area of the layer. The vertical stress ofeach layer instead was calculated as the average between the stresses acting at its top and bottominterface. In order to determine the vertical stress acting on the boundary of each layer, first, the inertialforce acting on each layer was calculated as the sum of the inertial forces acting on the particles of thelayer; second, vertical dynamic equilibrium was imposed for each layer in succession starting from theuppermost layer with the stress at the upper boundary given by the reaction force exerted by the topplaten divided by the platen area. Axial and radial stresses were evaluated at regular discrete intervalsof nominal axial strains of the sample (see the markers in Figure 17(a)).
In Figure 18, σa� εz and σr� εz curves calculated for three representative layers are plotted. The layersconsidered are the following: layers 8 and 9 where the specimen undergoes localisation and layer 2representative of the part of the sample outside the localised region. All the curves exhibit the initiallinear trend typical of the elastic stage of the material when all bonds are intact. However, taking the
(1)
(2)
(3)
(4)
(5)
(6)
(7)
(9)
(8)
Δεz[-]
0.00
0.01
0.02
0.03
0.04
0.05
0.06
0.07
z[m
]
(1)
(2)
(3)
(4)
(5)
(6)
(7)
(9)
(8)
εz [-]
0.00
0.02
0.04
0.05
0.07
z[m
]
Δz/H 0 = 3%
Δz/H 0 = 5%
-0.10 0.00 0.10 0.20 0.30 0.40 -0.10 0.00 0.10 0.20 0.30 0.400 2 4 6 8 10
Δz/H0 [%]
0
1
2
3
4
5
σ[M
Pa]
(c)(b)(a)
D
E
F
Figure 17. Test DPBv07κ5_1: (a) σa�Δz/H0 and σr�Δz/H0 curves; (b) axial strains calculated per eachlayer at the end of the linear elastic stage (Δz/H0 = 3%) and after the snap-back (Δz/H0 = 5%); and (c) incre-
ment of axial strain per layer between Δz/H0 = 3% and Δz/H0 = 5%.
Copyright © 2014 John Wiley & Sons, Ltd. Int. J. Numer. Anal. Meth. Geomech. (2014)DOI: 10.1002/nag

0
0.4
0.8
1.2
1.6
σ r[M
Pa]
σ a[M
Pa]
layer02 layer08 layer09
(b)
0 0.05 0.1 0.15 0.2 0.25 0 0.05 0.1 0.15 0.2 0.25
εz [-] εz [-]
0
1
2
3
4
5
layer02 layer08 layer09
(a)
Figure 18. Test DPBv07κ5_1: stresses versus axial deformation calculated in layer 2 (squares), representa-tive of the non-localised part of the sample, and layers 8 and 9 (crosses and full circles, respectively), whichare subject to localization: (a) layer axial stress, σa, versus layer axial strain, εz; and ( b) layer radial stress,
σr, versus layer axial strain, εz.
A DEM NUMERICAL INVESTIGATION OF COMPACTION PROCESSES
initial slope of the curves into consideration, a slight difference is apparent. This is probably because of thefact that the layer size is significantly smaller than the specimen size (around one-tenth); hence, it is smallerthan the REV size calculated in Section 2 (Figure 4). The recorded value of the stress peak is the same forall the curves and coincides with the value measured at the specimen boundaries (Figure 17(a)). After thestress peak is reached, layers 1, 2, 3, 4, 5, 6 and 7 (Figure 18(a) and (b)) undergo elastic unloading duringthe development of the compaction band. Conversely, the stress paths computed for layers 8 and 9, wherethe compaction band develops, show that a sort of strain softening occurs (Figure 18(b)). The fall in theaxial stress observed for layers 8 and 9 can be explained with the fact that the unloading of the elasticdomain outside the compaction band is not large enough to compensate for the displacement generatedby the compaction band. After the compaction band has formed (Δz/H0 =5%), all layers undergofurther elastic loading from Δz/H0 = 5% to Δz/H0 = 6% (see the upward linear trends in the final part ofall the axial stress–axial strain curves in Figure 18(a) and radial stress–axial strain curves in Figure 18(b)).
4.3. Influence of the macro-void size
So far, it has been shown that compaction banding is due to the collapse of macro-voids; hence, in thissection, we want to investigate the influence of the macro-void size on the formation of compactionbands. To this end, tests relative to two specimens with different macro-voids sizes but with similarcoordination number (Table II) were run with all micromechanical parameters for the two specimensbeing equal apart from parameter κ, indicating the size of macro-voids. The σa�Δz/H0 curves of testDPB07κ5_1 (ϕm=6.13mm, κ =5) and test DPB07κ2_2 (ϕm=ϕ1 = 2.5mm, κ =2) are compared inFigure 19. It emerges that the increase in the diameter of the macro-voids implies (i) an increase in theinitial oedometric modulus, Eoed, of 49%; (ii) an increase in the axial peak stress of 39%; and (iii) anoverall marked increase in the global brittleness because the drop of axial is far more abrupt. Instead,the value of Δz/H0 at the occurrence of the first peak is similar. The second phase of the σa�Δz/H0
curve is featured by less frequent but more pronounced oscillations of the axial stress, which are due tothe larger size of the macro-voids employed.
Because the two artificial materials are characterised by the same density, grain size distribution andmicromechanical constitutive parameters, the different mechanical behaviour exhibited by the twonumerical specimens has to be ascribed to the difference in the two internal microstructures. The poresize distribution of the DEM cylindrical samples is a bimodal distribution with two dominant poremodes: the first is relative to the macro and the second to the micro-pores, respectively. Because the
Copyright © 2014 John Wiley & Sons, Ltd. Int. J. Numer. Anal. Meth. Geomech. (2014)DOI: 10.1002/nag

Figure 19. σa�Δz/H0 curves obtained for test DPB07κ2_2 and test DPB07κ5_1.
G. DATTOLA ET AL.
global porosities of the two samples coincide, this implies that their pore size distributions differ. Given thereduction in micro-porosity, relative to specimens DPB07κ5_1, the regions of specimen around macro-voids are denser: this causes the observed global increase in strength, stiffness and brittleness of thesystem.
Now, each localization phenomenon can be related to a characteristic length for the material,which governs the extension of the localization taking place. Hence, it is desirable to identify thecharacteristic length for the bond breakage induced compaction bands taking place in the porousmaterials, featured by a bimodal distribution of pores, here investigated. To this end, theincrement of axial deformation along the vertical axis, between pre localization and postlocalization for the two tests, here examined (κ = 2 and κ = 5) were calculated via the methodillustrated in Section 2 and plotted in Figure 20. Hatched bands were drawn to highlight the
-0.12 -0.06 0 0.06 0.12 0.18 0.24
Δεz [-]
0.00
0.02
0.04
0.06
0.08
z [m
]
SPBv07k2_1
DPB07k5_1
Figure 20. Increment of axial deformation occurring during localization, between 3% and 21%, along thespecimen for test DPB07k2_2, with k = 2 and test DPB07k5_1, with k = 5. Each symbol, triangles or squares,indicates the value of incremental deformation calculated in a layer via the simplified method (20 layers were
used for this purpose). The hatched regions indicate the location of the compaction bands.
Copyright © 2014 John Wiley & Sons, Ltd. Int. J. Numer. Anal. Meth. Geomech. (2014)DOI: 10.1002/nag

A DEM NUMERICAL INVESTIGATION OF COMPACTION PROCESSES
regions where compaction banding took place: the darker band indicates the presence of thecompaction band for the sample with smaller macro-void (κ = 2) whilst the lighter band for thesample with larger macro-voids (κ = 5). Comparing the sizes of the two bands, it emerges that theyare roughly in the same proportion as the size of their macro-voids, that is, there is a ratio ofroughly 2.5 times. This observation indicates that the size of the macro-void could be taken as anapproximate measure of the characteristic length of the material for the occurrence of compressivecompaction bands. Moreover, from Figure 19 emerges that the brittleness of the global mechanicalresponse is affected by the characteristic length of the material.
5. CONCLUDING REMARKS
This paper investigated both the onset and the propagation of compressive compaction bands in anideal highly porous material under oedometric conditions via 3D DEM analyses carried out oncylindrical samples. The material has been modelled as a collection of bonded grains with severalmacro-voids randomly distributed. This ideal material is evidently inspired by a large class ofnatural/artificial porous geomaterials (e.g. natural cemented soils and artificial conglomerates) where(i) a granular structure can be recognised and (ii) the bridges sticking the grains together act aspredefined points of weakness.
Two different bond models were employed to describe the process: an elasto-brittle model based onPFC current bond models, and a more sophisticated elasto-damage model conceived by the authors tosimulate more realistically the process of bond degradation. The obtained results show that compactionbands can be triggered by the breakage of bonds, leading to the collapse of several macro-voids in thespecimen, without any grain crushing taking place.
Moreover, it was shown that if the elasto-brittle model is employed, the observed mechanicalbehaviour of the specimens, in terms of peak strength, brittleness and onset and propagation oflocalisation, depends on the values of damping adopted even in case of tests run under quasi-staticconditions. Calibration of meaningful values of damping is very difficult because currently thereare no experimental measurements able to link bond properties (e.g. ductility) to values ofdamping coefficients. In the elasto-damage model introduced by the authors instead, no dampingis employed but the progression of bond failure, that is, bond ductility, is controlled by aparameter of clear physical meaning: the rate of bond damage progression, ω. Then, the DPBmodel has shown to be a suitable model to qualitatively capture the behaviour of very porousweak rocks and cemented soils. The rate of bond damage progression has been found to affectboth the onset and extension of compaction bands and the overall brittleness/ductility of thenumerical specimens.
Oedometric tests for different values of porosity were run. Below a certain threshold of porosity, theonset of mixed modes of localisation, between a shear and a compaction band, was observed. In thiscase, the direction of propagation of the band is no longer orthogonal to the band boundariesbecause of the presence of both axial and shear strains. The state of stress calculated in the samplesshowed to be in qualitative agreement with the theoretical conditions for the onset of mixed modesunder axial-symmetric conditions established by [44].
Tests for the different values of macro-void size were performed with the overall density of thematerial, grain size distribution and all the micromechanical constitutive parameters kept constant:stiffness, strength and ductility exhibited a dramatic change. When the size of the macro-voids isincreased, it was observed that snap-back is favoured because the ratio between the materialcharacteristic length and the specimen height is decreased. This conclusion supports the ideathat, when such a phenomenon takes place, the rate of propagation of the compaction band canno longer be controlled by the displacement of the specimen platens. It was also shown that,in case of double porosity materials and in the absence of grain crushing, the characteristiclength of the material with regard to the occurrence of compaction bands seems to be relatedto the size of the macro-voids. However, there is no sufficient evidence to exclude that grainsize or some other material properties may have a stronger influence on the characteristiclength of the material.
Copyright © 2014 John Wiley & Sons, Ltd. Int. J. Numer. Anal. Meth. Geomech. (2014)DOI: 10.1002/nag

G. DATTOLA ET AL.
6. NOTATION
SCALARS
A
Copyright © 201
parallel bond area
Amin minimum parallel bond area Amax maximum parallel bond area CpbN mechanical coordination numberD
damage variable Ek kinetic energy Eoed oedometric modulus Fup modulus of the vertical force acting on the upper platen Fdw modulus of the vertical force acting on the lower platen H0 initial height of the sample I parallel bond moment of inertia J parallel bond polar moment of inertia Kn normal secant contact stiffness M generalised bending moment M third internal variable M0 initial value of the third internal variable Mt generalised torque moment N generalised axial force N first internal variable N0 initial value of the first internal variable under traction eN0 initial value of the first internal variable Nm number of macro-voids Np number of micro-particles R parallel bond radius V generalised shear force Un component of the normal relative displacement between two particles along the unit vec-tor normal to the contact plane
Us component of the shear relative displacement between two particles along the unit vectortangent to the contact plane
V second internal variable V0 initial value of the second internal variable V0L initial volume of a layer VsL volume of solids in a layer Vs0L initial volume of solids in a layer Vt volume of the specimen Vs solid fraction of volume VvL volume of voids in a layer cpbN standard coordination number eL void index of a layer g(Q,χ,D)g(Q,χ,D)threshold function
kn
normal parallel bond stiffness
kpn normal particle stiffness kwn normal wall stiffness ks tangential contact stiffness kps tangential particle stiffness kws tangential wall stiffness kstangential parallel bond stiffness
n porosity of the sample p mean effective pressure4 John Wiley & Sons, Ltd. Int. J. Numer. Anal. Meth. Geomech. (2014)DOI: 10.1002/nag

A DEM NUMERICAL INVESTIGATION OF COMPACTION PROCESSES
q
Copyright © 201
deviatoric stress
Δz vertical displacement of the upper platen of the sample α ratio between the height and diameter of the sample βn normal critical damping ratio βs shear critical damping ratio δ coefficient of Cundall’s damping εvolL average volumetric strain of a layer εz vertical strain εzL average vertical strain of a layer η ratio between deviatoric stress and mean effective pressure θn component of the normal relative rotation between two particles along the unit vectornormal to the contact plane
θn component of the shear relative rotation between two particles along the unit vector tan-gent to the contact plane
ν nominal axial strain rate ξ1 parameter of DPB model ξ2 parameter of DPB model ϕm diameter of macro-voids ϕ1, ϕ2 diameters of macro-voids used in the simulations ϕp diameter of a particle ϕp,max maximum diameter of micro-particles ϕp,min minimum diameter of micro-particles ϕp,mean mean radius of micro-particles Δ diameter of the sample κ ratio between macro-voids diameter and mean micro-particle diameter μ friction coefficient at the contact μp inter-particle friction coefficient μw wall friction coefficient ρp density of the particles ρ dilatation parameter for MLSRK mesh-free method σ0 maximum value of normal stress (DPB model) σa axial stress σc normal strength of the parallel bond (SPB model) σr radial stress τc shear strength of the parallel bond (SPB model) τ0 maximum value of shear stress (DPB model) ω parameter governing the rate of damageVECTORS
Fn
axial force acting on a parallel bond
Fsshear force acting on a parallel bond
Ms
torque moment acting on a parallel bondMn
bending moment acting on a parallel bond
Q vector collecting the generalised forces and moments on the parallel bond eQ effective generalised forces and moments vector Us shear relative displacement between two particles gi unit vector defining the direction of the discontinuity of the strain rate field n unit vector normal to the contact plane between two particles ni unit vector perpendicular to the localization plane q vector collecting the generalised relative displacement and rotations between two particles r unit moment vector tangent to the contact plane between two particles s unit shear vector tangent to the contact plane between two particles4 John Wiley & Sons, Ltd. Int. J. Numer. Anal. Meth. Geomech. (2014)DOI: 10.1002/nag

G. DATTOLA ET AL.
θs
Copyright
shear relative rotation between two particles
χ vector of internal variablesTENSOR
De
elastic tensor in the damage modelAPPENDIX
Implementation of the elastic-damage bond model
In this section, the implementation of the elasto-damage bond model in PFC is presented. At everytimestep, forces and moments acting on each bond are calculated by PFC from the relative displace-ments and rotations of the two bonded particles according to the ‘parallel bond’ routine. The calculatedforces and moments were then adjusted to the values predicted by the law of the elasto-damage bondmodel presented in Section 2.2 via an ad-hoc routine written by the authors. Referring to Figure A1, theimplemented algorithm can be summarised as follows:
1. For each parallel bond at timestep i, the generalised loads Qi acting on the bond and the damagevariable Di are retrieved from external variables.
2. The new forces acting on each bond, just computed by PFC, are set to zero.3. Defining Q as the vector of the generalised loads computed according to the linear elastic force–
displacement law, the increment of Q in the timestep would amount to
ΔQ ¼ Q-Qi (A:1)
4. Being qi, the vector of the generalised displacement and rotations
qi ¼ De�1 Qi
1� Dið Þ (A:2)
the corresponding increments in the timestep according to the linear elastic law are as follows:
Δq ¼ De-1ΔQ (A:3)
with De given by Eqn (9).
5. Hence, displacement and rotations at the new timestep, i+ 1, can be calculated as
Figure A1. Schematic representation of the damage algorithm.
© 2014 John Wiley & Sons, Ltd. Int. J. Numer. Anal. Meth. Geomech. (2014)DOI: 10.1002/nag

A DEM NUMERICAL INVESTIGATION OF COMPACTION PROCESSES
qiþ1 ¼ qi þ Δq (A:4)
6. The actions on the parallel bond computed considering the damage variable at the previoustimestep i
Q’ ¼ 1� Dið ÞDeqiþ1 (A:5)
7. The vector Q’ just computed is correct only if the damage has not increased during the timestep.
This means that
g Q’ Dið Þ; χ Dið Þð Þ≤0 (A:6)
On the contrary, if g> 0, the damage has increased during the timestep, and the new damage variableDi+1 has to be determined so that the new load point lies on the threshold surface. Thus, the followingequation gives the new damage Di+1:
g Q’’ Diþ1ð Þ; χ Diþ1ð Þð Þ ¼ 0 (A:7)
Equation (A.6) is an implicit one and can be solved by adopting the Newton–Raphson algotithm. If Di
+1 is higher than 0.99, the breakage of the bond is imposed.
8. If Di+1 is lower than 0.99, the new actions Q” on the parallel bond are
Q’’ ¼ qiþ1De 1� Diþ1ð Þ (A:8)
9. The variables Q” and Di+1 are recorded in the array of variables describing the bond state so thatthey can be retrieved at the following timestep.
VALIDATION OF THE ELASTO-DAMAGE CONTACT MODEL
In the following, the process of validation for the adopted elasto-damage contact model is provided.Let us consider two particles with ϕp = 1m joined together by both a parallel and a contact bond. Inthis test, the parallel bond between the particles cannot break, even when the damage variable Dexceeds the limit value D= 0.99. The two particles are free to move in the (x, z) plane so each ballhas three DOF. The DOF of the left ball are fixed. Forces and moments can be applied on the right ball,in order to cause its motion with actions on the parallel bond arising as a consequence.
The DEM parameters employed in these tests are reported in the following table III.Case of single loadA horizontal force Fx, directed opposite to the x-direction, was applied to the right ball. The force
was applied gradually and linearly over time:
Fx tð Þ ¼ �0:25t (A:9)
with t being the time. The consequent motion of the right ball produces an axial force (compression) onthe parallel bond. In particular, we want to check the behaviour of the bond for the three differentvalues of ω: 0.3, 0.6 and 0.8. The number of timesteps in the three tests was the same.
Table III. Parameters used for the validation test of the damage model.
ρp [kg/m3] kn [kN/m] ks/kn k
n[kN/m3] k
s=k
nσ0 [kPa] τ0 [kPa]
2650 1 E+ 6 1 1 E+ 6 1 1.0 1.0
Copyright © 2014 John Wiley & Sons, Ltd. Int. J. Numer. Anal. Meth. Geomech. (2014)DOI: 10.1002/nag

(a) (b)
(c) (d)
Figure A2. Validation test of the damage model: (a) load history; (b) evolution of the damage variable withthe normal displacement; (c) evolution of the internal variable eN0 with the normal displacement; and (d)
normal force-normal displacement curves.
G. DATTOLA ET AL.
In all the cases, when t= 51s, the displacement Un was equal to 1 × 10� 5m with the force N actingon the parallel bond reaching the limit value eN0 = 7.85 kN, the bond begins to undergo damage. Duringthe subsequent damage process, the value of the threshold function g remains equal to 0 (Figure A2(a))
The graphs in Figure A2(b) show the evolution of the damage variable with the normal displacement.Both the rate of damage and the accumulated displacement Un increase with ω. When ω =0.8, the dam-age is almost complete and D is very close to 1 but this limit value can only be reached asymptotically.
The parameter eN0 defines the size of the threshold surface (Figure A2(c)). When the critical displacement
is reached, the parameter eN0 decreases with the progress of the damage. The velocity of the shrinkage isas much higher as ω is closer to 1. Finally, the force–displacement graph is plotted in Figure A2(d). After
the elastic phase, N ¼ eN0, a softening phase, clearly controlled by ω, follows. The slope of the softeningpart increases with the increasing of ω, and the softening is more pronounced.
Case of combined loadA vertical and a horizontal force directed opposite to the z-axis and x-axis are applied to the right
ball. The relative rotation, in the y-direction, between the two balls is constrained in order to avoidthe arising of the bending moment on the parallel bond and to study only the interaction betweenN and V.
The following loading–unloading histories are relative to the horizontal and vertical force, respectively.
Fx tð Þ ¼ �0:18t t≤60s
�10:8þ 0:18 t � 60sð Þ t > 60s
�(A:10)
Copyright © 2014 John Wiley & Sons, Ltd. Int. J. Numer. Anal. Meth. Geomech. (2014)DOI: 10.1002/nag

A DEM NUMERICAL INVESTIGATION OF COMPACTION PROCESSES
Fz tð Þ ¼�0:00751t t≤60s
�0:4506þ 0:00751 t � 60sð Þ t > 60s
�(A:11)
REFERENCES
1. Andriani GF, Walsh N. Petrophysical and mechanical properties of soft and porous building rocks used in Apulianmonuments (south Italy). Geological society, London, Special Publications 2010; 333:129–141.
2. Ciantia MO. Multiscale hydro-chemo-mechanical modeling of the weathering of calcareous rocks: an experimentaland numerical study. PhD thesis, Politecnico di Milano, Milan, Italy 2013.
3. Castellanza R, Gerolymatou E, Nova R. Experimental observation and modelling of compaction bands in oedometrictests on high porosity rocks. Strain 2009; 475:1–14.
4. De Gennaro M, Cappelletti P, Langella A, Scarpati C. Genesis of zeolites in the Neapolitan Yiellow Tuffs: geological,volcanological and mineralogical evidence. Contribution to Mineralogy and Petrology. Springer: 2002; 139:17–35.
5. Nova R, Parma M. Effects of bond crushing on the settlements of shallow foundations on soft rocks. Geotechnique2011; 61(3):247–261.
6. Cucino P, Eccher G, Castellanza R, Parpajola A, Di Prisco C. Expanded clay in deep mechanised tunnel boring.Proc. ITA-AITES World Tunnel Congress Bangkok, 2012.
7. Porbaha A. State of the art in deep mixing technology: part I. Basic concepts and overview. Ground Improvement1998; 2:81–92.
8. Arroyo M, Castellanza R, Nova R. Compaction bands and oedometric testing in cemented soils. Soils and Founda-tions 2005; 45(2):181–194.
9. Horpibulsuk S, Bergado DT, Lorenzo GA. Compressibility of cement admixed clays at high water content.Geotechnique 2004; 54:151–154.
10. Lorenzo GA, Bergado DT. Fundamental characteristics of cement-admixed clay in deep mixing. Journal of materialsin civil engineering ASCE 2006; 18:161–174.
11. Nagaraj TS, Pandian NS, Narasimha Raju PSR. Compressibility behaviour of soft cemented soils. Geotechnique1998; 48:281–287.
12. Horpibulsuk S, Miuara N, Nagaraj TS. Assessment of strength development in cement-admixed high water contentclays with Abram’s law as a basis. Geotechnique 2003; 53:439–444.
13. Mollema PN, Antonellini MA. Compaction bands: a structural analog for anti-mode I cracks in aeolian sandstone.Tectonophysic 1996; 267:209–228.
14. Eichhubl P, Taylor WL, Pollard DD, Aydin A. Paleo-fluid flow and deformation in the Aztec Sandstone at the Valleyof Fire, Nevada-Evidence for the coupling of hydrogeological, diagenetic and tectonic processes. Geological Societyof America Bulletin 2004; 116(9–10):1120–1136.
15. Sternlof KR, Pollard D. Numerical modeling of compactive deformation bands as granular “anti-cracks”. Eos, Trans-actions American Geophysical Union 2002; 83(47):T11F–10.
16. Sternlof KR, Rudnicki JW, Pollard DD. Anticrack-inclusion model for compaction bands in sandstone. Journal ofGeophysical Research – Solid earth 2005; 110:B11403.
17. Olsson WA. Theoretical and experimental investigation of compaction bands in porous rock. Journal of GeophysicalResearch 1999; 104(B4):7219–7228.
18. Olsson WA, Holcomb DJ. Compaction localization in porous rock. Geophysical Research Letters 2000;27(21):3537–3540.
19. Wong T, Baud P, Klein E. Localized failure modes in a compactant porous rock. Geophysical Research Letters 2001;28(13):2521–2524.
20. Klein E, Baud P, Reuschle T, Wong T. Mechanical behaviour and failure mode of Bentheim sandstone under triaxialcompression. Physics and Chemistry of the Earth 2001; 26(1–2):21–25.
21. Vajdova V, Wong T. Incremental propagation of discrete compaction bands: acoustic emission and microstruc-tural observations on circumferentially notched samples of Bentheim sandstone. Geophysical Research Letters2003; 30(14):1175.
22. Baud P, Klein E, Wong T. Compaction localization in porous sandstones: spatial evolution of damage and acousticemission activity. Journal of Structural Geology 2004; 26:603–624.
23. Katsman R, Aharonov E, Scher H. Numerical simulation of compaction bands in high porosity sedimentary rock.Mechanics of materials 2005; 37:143–162.
24. Wang B, Chen Y, Wong T. A discrete element model for the development of compaction localization in granularrock. Journal of Geophysical Research – Solid earth 2008; 113(B3): B03202.
25. Marketos G, Bolton MD. Compaction bands simulated in discrete element models. Journal of Structural Geology2009; 31:479–490.
26. Roscoe KH. Tenth rankine lecture: the influence of strains in soil mechanics. Geotechnique 1970; 20:129–170.27. Mühlhaus HB, Vardoulakis I. The thickness of shear bands in granular materials. Geotechnique 1987;
37:271–283.
Copyright © 2014 John Wiley & Sons, Ltd. Int. J. Numer. Anal. Meth. Geomech. (2014)DOI: 10.1002/nag
G. DATTOLA ET AL.
28. Ciantia MO, Hueckel T. Weathering of submerged stressed calcarenites: chemo-mechanical coupling mechanisms. Inpress, Géotechnique, 2013.
29. Potyondy DO, Cundall PA. A bonded particle model for rock. International Journal of Rock Mechanics and MiningScience 2004; 41:1329–1364.
30. Thornton C. Numerical simulations of deviatoric shear deformation of granular media. Geotechnique 2000;50(1):43–53.
31. Utili S, Nova R. DEM analysis of bonded granular geomaterials. International Journal for Numerical and AnalyticalMethods in Geomechanics 2008; 32(17):1997–2031.
32. Utili S, Crosta GB. Modelling the evolution of natural slopes subject to weathering: Part I. Limit analysis approach.Journal of Geophysical Research - Earth Surface 2011a; 116:F01016.
33. Utili S, Crosta GB. Modelling the evolution of natural slopes subject to weathering: Part II. Discrete elementapproach. Journal of Geophysical Research - Earth Surface 2011b; 116:F01017.
34. Itasca Consulting Group, Inc. PFC3D: Particle Flow Code in 3 Dimension, Version 4.0. Itasca consulting Group Inc.,Minneapolis, USA, 2008.
35. Cundall PA. Distinct element models of rock and soil structure. In Analytical and Computational Methods inEngineering Rock Mechanics, Brown T (ed.). Allen & Unwin: London, 1987; 129–163.
36. Potyondy DO. Simulating stress corrosion with a bonded-particle model for rock. International Journal of RockMechanics and Mining Sciences 2007; 44(5):677–691.
37. Rudinick J.W., Riece J.R. Conditions for the localization of deformation in pressure-sensitive dilatants materials.Journal of Mechanics Physics Solids 1975; 23:371–394.
38. Lemaitre J, Chaboche JL. Mècanique des Matèriaux Solides. Duond-Bordas: Paris, 1985.39. Neal BG. The effect of shear and normal forces on the fully plastic moment of a beam of rectangular cross section.
Journal of Applied Mechanics 1961; 28:269–274.40. Koyama T, Jing L. Effects of model scale and particle size on micro-mechanical properties and failure processes of
rocks – a particle mechanics approach. Engineering Analysis with Boundary Elements 2007; 31:458–472.41. Jiang MJ, Konrad JM, Leroueil S. An efficient technique for generating homogeneous specimens for DEM studies.
Computers and geotechnics 2005; 30:579–597.42. O’Sullivan C, Bray JD, Li S. A new approach for calculating strain for particulate media. International Journal for
Numerical and Analytical Methods in Geomechanics 2003; 27:859–877.43. Liu WK, Li S, Belytschko T. Moving least square kernel Galerkin method.1: methodology and convergence.
Computer Methods in Applied Mechanics and Engineering 1997; 143:113–154.44. Jiang MJ, Yan HB, Zhu HH, Utili S. Modelling shear behaviour and strain localisation in cemented sands by two
dimensional distinct element method analyses. Computers and Geotechnics 2011; 38(1):14–29.45. Radjai F, Dubois F (eds.), Discrete Numerical Modeling of Granular Materials. vol. ISBN: 978-1-84821-260-2 (Wi-
ley-ISTE, 2011).46. Rudnicki JW. Conditions for compaction and shear bands in a transversally isotropic material. International Journal
of Solid and Structures 2002; 39:3741–3756.47. Issen KA, Rudnicki JW. Conditions for compaction bands in porous rock. Jounal of Geophysical Research 2000;
105:21529–2153.48. Issen KA, Rudnicki JW. Theory of compaction bands in porous rock. Physics and Chemistry of the Earth 2001;
26(1–2):95–100.49. Bésuelle P. Compacting and dilating shear bands in porous rock: theoretical and experimental conditions. Journal of
Geophysical research – Solid Earth 2000; 106(B7):13435–13442.50. Nova R, Castellanza R, Tamagnini C. A constitutive model for bonded geomaterials subject to mechanical and/or
chemical degradation. International Journal for Numerical and Analytical Methods in Geomechanics 2003;27:705–732.
Copyright © 2014 John Wiley & Sons, Ltd. Int. J. Numer. Anal. Meth. Geomech. (2014)DOI: 10.1002/nag
Copyright © 2022 FDOKUMEN