
Experimental and Numerical Investigations of Cement ... - MDPI
14
materials Article Experimental and Numerical Investigations of Cement Bonding Properties Ionut Lambrescu 1 , Catalin Teodoriu 2, * and Mahmood Amani 3 Citation: Lambrescu, I.; Teodoriu, C.; Amani, M. Experimental and Numerical Investigations of Cement Bonding Properties. Materials 2021, 14, 7235. https://doi.org/10.3390/ ma14237235 Academic Editor: Michele Bacciocchi Received: 12 October 2021 Accepted: 18 November 2021 Published: 26 November 2021 Publisher’s Note: MDPI stays neutral with regard to jurisdictional claims in published maps and institutional affil- iations. Copyright: © 2021 by the authors. Licensee MDPI, Basel, Switzerland. This article is an open access article distributed under the terms and conditions of the Creative Commons Attribution (CC BY) license (https:// creativecommons.org/licenses/by/ 4.0/). 1 Department ITIMF, Petroleum-Gas University Ploiesti, 100680 Ploiesti, Romania; [email protected] 2 Mewbourne School of Petroleum and Geological Engineering, The University of Oklahoma, Norman, OK 73019, USA 3 Petroleum Engineering Program, Texas A&M University at Qatar, Doha P.O. Box 23874, Qatar; [email protected] * Correspondence: [email protected]; Tel.: +1-405-325-6821 Abstract: Well integrity is of high importance during the entire well life span especially when renewable energy resources such as geothermal are designed to cover the increasing world energy demand. Many studies have documented the importance of the casing–cement interfacial bonding to ensure critical well integrity achievements; however, laboratory experiments and field data are not always aligned. Furthermore, Finite Element Analysis shows relatively high discrepancies compared with the results of various scholarly published works. The limitations in the FEA are most probably generated by the casing–cement interaction modeling parameters. Typically, the contact between casing and cement is modeled using the so-called CZM method, which includes the shear debonding process into the FEA. Several setups have been used in the past to determine the interfacial casing– cement bonding shear strength. Some of these setups are briefly summarized herein. The novelty of this paper consists in the combination of a relatively simple experimental setup with the finite element modeling of the experiment itself to demonstrate that it is important to acquire accurate laboratory data for debonding simulations and, thus, to improve the well integrity prediction. The aim of this paper is to better understand the limitations of the finite element method when modeling shear bonding of the cement and, in the same, to verify that the proposed experimental setup can be modelled using numerical approaches. The successful numerical simulation can later be used for upscaled models. The results confirm the experimental push down setup and aid engineers to further understand and validate CZM models and optimize the well design to achieve maximum well integrity potential. Our results are within 1% error from the average field data. Keywords: well construction; well integrity; well cementing; interfacial bonding strength of cement 1. Introduction Wellbore integrity has many facets, but the main element of failure remains the system casing–cement. Wellbore cement is commonly used to seal the annular space between casing and formation through mechanical and hydraulic seals [1]. The ability of the cement to maintain good properties during the life of the well is very important and has been strongly documented by various authors [1–4]. The very first documentation of cement bonding shear strength was provided by Evans [5], who reported experimental results of so-called bonding strength and hydraulic bonding strength. While the hydraulic bonding strength is a much more complex property of the cement that shows the casing–cement system’s ability to seal, the mechanical bonding strength or the Interfacial Bonding Shear Strength (IBSS, as it will be referred to in this paper, is a measure of how strong the casing and the cement are stuck together (bonded)). This bond can fail under two specific load types: perpendicular to the bonded surface (tensile bonding) and along the bonded surface (shear bonding). The recent literature overview shows an intensive focus on the casing–cement–formation interaction. Geothermal wells, Materials 2021, 14, 7235. https://doi.org/10.3390/ma14237235 https://www.mdpi.com/journal/materials
-
Upload
khangminh22 -
Category
Documents
-
view
0 -
download
0
Transcript of Experimental and Numerical Investigations of Cement ... - MDPI
materials
Article
Experimental and Numerical Investigations of CementBonding Properties
Ionut Lambrescu 1, Catalin Teodoriu 2,* and Mahmood Amani 3
�����������������
Citation: Lambrescu, I.; Teodoriu, C.;
Amani, M. Experimental and
Numerical Investigations of Cement
Bonding Properties. Materials 2021,
14, 7235. https://doi.org/10.3390/
ma14237235
Academic Editor: Michele Bacciocchi
Received: 12 October 2021
Accepted: 18 November 2021
Published: 26 November 2021
Publisher’s Note: MDPI stays neutral
with regard to jurisdictional claims in
published maps and institutional affil-
iations.
Copyright: © 2021 by the authors.
Licensee MDPI, Basel, Switzerland.
This article is an open access article
distributed under the terms and
conditions of the Creative Commons
Attribution (CC BY) license (https://
creativecommons.org/licenses/by/
4.0/).
1 Department ITIMF, Petroleum-Gas University Ploiesti, 100680 Ploiesti, Romania; [email protected] Mewbourne School of Petroleum and Geological Engineering, The University of Oklahoma,
Norman, OK 73019, USA3 Petroleum Engineering Program, Texas A&M University at Qatar, Doha P.O. Box 23874, Qatar;
[email protected]* Correspondence: [email protected]; Tel.: +1-405-325-6821
Abstract: Well integrity is of high importance during the entire well life span especially whenrenewable energy resources such as geothermal are designed to cover the increasing world energydemand. Many studies have documented the importance of the casing–cement interfacial bonding toensure critical well integrity achievements; however, laboratory experiments and field data are notalways aligned. Furthermore, Finite Element Analysis shows relatively high discrepancies comparedwith the results of various scholarly published works. The limitations in the FEA are most probablygenerated by the casing–cement interaction modeling parameters. Typically, the contact betweencasing and cement is modeled using the so-called CZM method, which includes the shear debondingprocess into the FEA. Several setups have been used in the past to determine the interfacial casing–cement bonding shear strength. Some of these setups are briefly summarized herein. The noveltyof this paper consists in the combination of a relatively simple experimental setup with the finiteelement modeling of the experiment itself to demonstrate that it is important to acquire accuratelaboratory data for debonding simulations and, thus, to improve the well integrity prediction. Theaim of this paper is to better understand the limitations of the finite element method when modelingshear bonding of the cement and, in the same, to verify that the proposed experimental setup canbe modelled using numerical approaches. The successful numerical simulation can later be usedfor upscaled models. The results confirm the experimental push down setup and aid engineers tofurther understand and validate CZM models and optimize the well design to achieve maximumwell integrity potential. Our results are within 1% error from the average field data.
Keywords: well construction; well integrity; well cementing; interfacial bonding strength of cement
1. Introduction
Wellbore integrity has many facets, but the main element of failure remains the systemcasing–cement. Wellbore cement is commonly used to seal the annular space betweencasing and formation through mechanical and hydraulic seals [1]. The ability of the cementto maintain good properties during the life of the well is very important and has beenstrongly documented by various authors [1–4].
The very first documentation of cement bonding shear strength was provided byEvans [5], who reported experimental results of so-called bonding strength and hydraulicbonding strength. While the hydraulic bonding strength is a much more complex propertyof the cement that shows the casing–cement system’s ability to seal, the mechanical bondingstrength or the Interfacial Bonding Shear Strength (IBSS, as it will be referred to in this paper,is a measure of how strong the casing and the cement are stuck together (bonded)). Thisbond can fail under two specific load types: perpendicular to the bonded surface (tensilebonding) and along the bonded surface (shear bonding). The recent literature overviewshows an intensive focus on the casing–cement–formation interaction. Geothermal wells,
Materials 2021, 14, 7235. https://doi.org/10.3390/ma14237235 https://www.mdpi.com/journal/materials

Materials 2021, 14, 7235 2 of 14
for example, are critically impacted by the relative casing–cement motion that requires adetailed understanding of the cement IBSS [6,7]. Long-term cement properties also playan important role since these properties suffer continuous changes. The lack of accurateinformation about long-term cement properties makes the finite element study of a wellsituation very difficult [8]. The IBSS is also affected by the cement ageing [9].
Typical IBSS testing consists of two methods: push-out and rotational disk. The push-out is the most commonly used version, and it is a development based on Evan’s [5] initialexperimental work. [9–11] have also shown the importance of proper testing methods and dataevaluation in order to perform finite element studies. Several authors have published resultsobtained using push out setup or variations of it [9,12–18]. A different approach was takenby [10], which uses a modified Brazilian test to measure the mixed-mode interfacial strength.
Previously published data on the casing–cement interfacial bonding shear strengthvary from author to author [12–18]. This variation is mainly due to the testing methodused to record the bonding shear strength but also to the sample curing time and cementslurry composition. However, the published data is limited and allows only a qualitativecomparison. For example, it seems to be very common to measure the interfacial bondingshear strength after one day (24 h) of curing. Table 1 shows some of the reported 1-daybonding shear strength at room temperature.
Table 1. Comparison and validation of the preliminary results of this work with values in published literature.
AuthorSalehiet al.
2016 [13]
Lavrovand
Torsaer2016 [14]
Zhao et al.2015 [12]
Zhao et al.2015 [12]
Teodoriuet al. 2018
[9]
Tabatabeiet al. 2020
[10]
Comment After 24 h -
After 5days
differenttemp.
Addedsand tocasing
After 24 h After 24 h
Interfacial BondingShear Strength (PSI) 81 14.5 to 145 14.5 to 362 362 to
1090 68–300 40
Interfacial BondingShear Strength
(MPa)0.56 0.1 to 1.0 1.0 to 2.5 2.5 to 7.5 0.47–1.94 0.271
Given the scarcity of finite element studies that involved real experimental data forIBSS, this paper proposes investigating how far and accurately the CZM method can modelexperimental tests for cement IBSS. Our main hypothesis is that by using the measuredexperimental shear strength, the numerical solution should lead to the same push-out forceas for the experimental results. Furthermore, our aim is to investigate CZM parameters’sensitivity to the proposed simulation.
2. Experimental Approach
This paper shows the numerical and experimental results performed in order to betterunderstand the casing–cement bonding behavior and especially to what extent modernnumerical simulators allow the mimicking of experimental work. Firstly, we describe theexperimental methodology used in this work, starting with sample preparation and a fulldescription of the sample geometry. Secondly, we present the numerical approach used tomodel the experiment. The specimen size and type used for this work are similar to thoseproposed by [9].
2.1. Sample Preparation
For this work, we used Class H neat cement with micro silica as an additive. Thecement mixing was performed according to [19,20]. The entire equipment used for mixingis API certified and was explained in detail by Teodoriu et al. [9]. Water and cementwith a specific ratio of 0.38 have been mixed using a certified API mixer for 50 s. Theresulted slurry was poured into cube molds (for UCS measurements) and the cylindrical
Materials 2021, 14, 7235 3 of 14
cement shear bonding specimens. All shear bonding specimens are manufactured from304 Stainless Steel, and the inner surface was fully polished with 400-grid sandpaper. Thepouring took about one minute, after which all samples were gently immersed in the waterbath. All tests presented in this paper were performed at room temperature. Therefore, thewater bath was not started. Distilled water was used for mixing and curing the samples.No pressure was applied on the samples; hence, all tests were performed at atmosphericpressure. The samples were cured for 1, 3 and 7 days. The samples were tested immediatelyafter being extracted from the water bath.
2.2. Experimental Setup
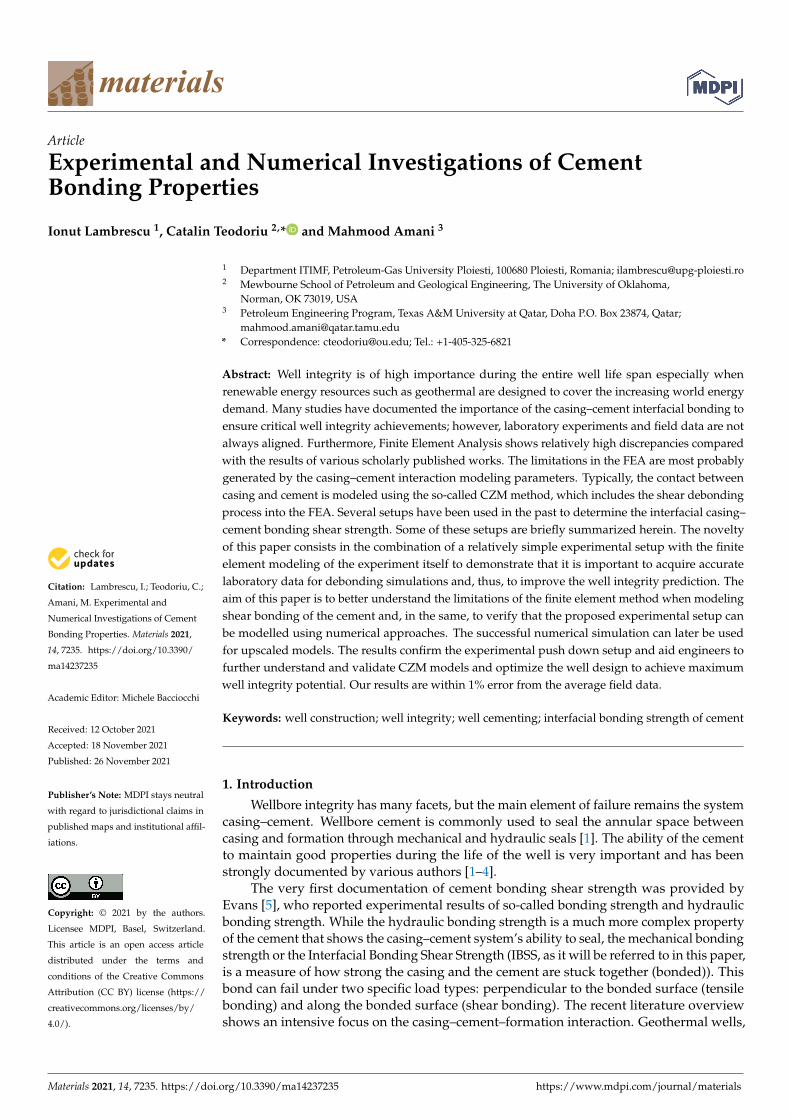
A detailed description of the experimental setup used for this work can be foundin [9]. The cells (molds) utilized for the bonding experiments presented in this paper areshown in Figure 1.
Figure 1. Cement shear bonding cell used for this work.
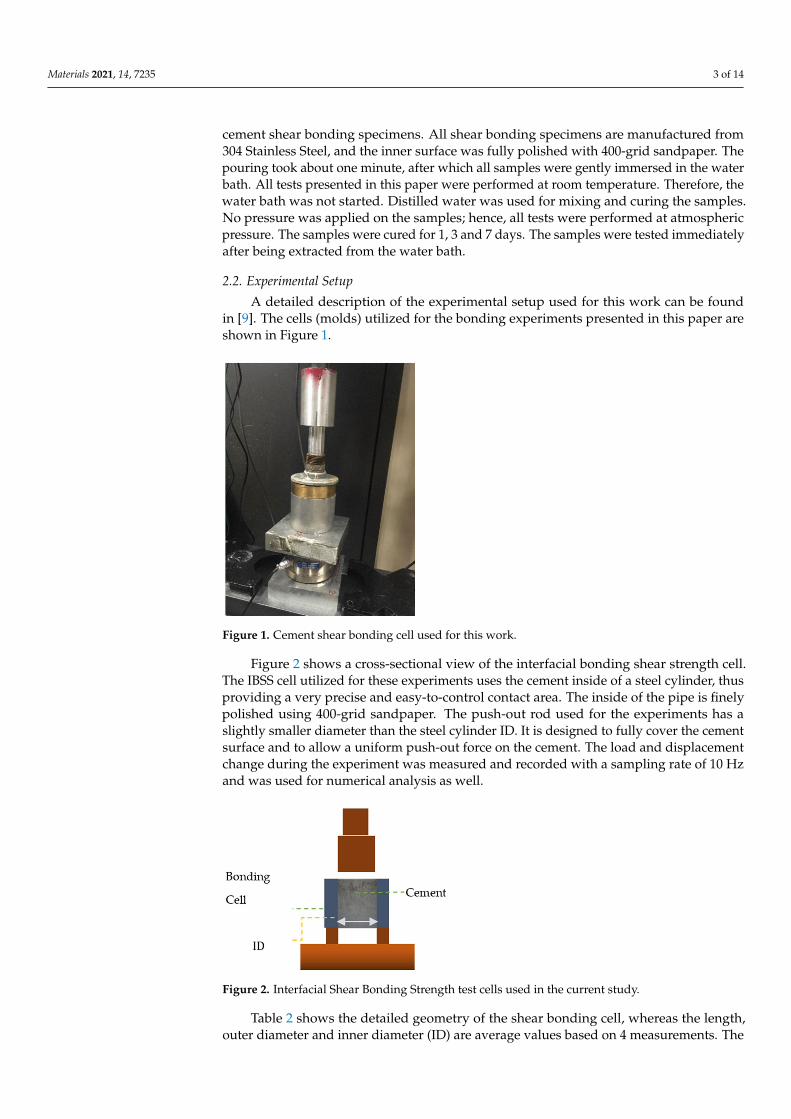
Figure 2 shows a cross-sectional view of the interfacial bonding shear strength cell.The IBSS cell utilized for these experiments uses the cement inside of a steel cylinder, thusproviding a very precise and easy-to-control contact area. The inside of the pipe is finelypolished using 400-grid sandpaper. The push-out rod used for the experiments has aslightly smaller diameter than the steel cylinder ID. It is designed to fully cover the cementsurface and to allow a uniform push-out force on the cement. The load and displacementchange during the experiment was measured and recorded with a sampling rate of 10 Hzand was used for numerical analysis as well.
Figure 2. Interfacial Shear Bonding Strength test cells used in the current study.
Table 2 shows the detailed geometry of the shear bonding cell, whereas the length,outer diameter and inner diameter (ID) are average values based on 4 measurements. The
Materials 2021, 14, 7235 4 of 14
values presented in Table 2 are used for the numerical study, as described in the nextsection, and to calculate the interfacial bonding shear strength using Equation (1).
Table 2. Geometries of the shear and bonding cells.
Item Cell Length(mm)
Outer Diameter(mm)
Inner Diameter(IDA)(mm)
Bonding Cell 50 40 35.1
The interfacial bonding shear strength (measured in MPa) is calculated as:
σ =Fmax
2π ∗ IDA ∗ CL(1)
where
Fmax is the maximum recorded force, N;IDA is the inner diameter of the cell, m;CL is the interfacial bonding shear strength cell length, m.
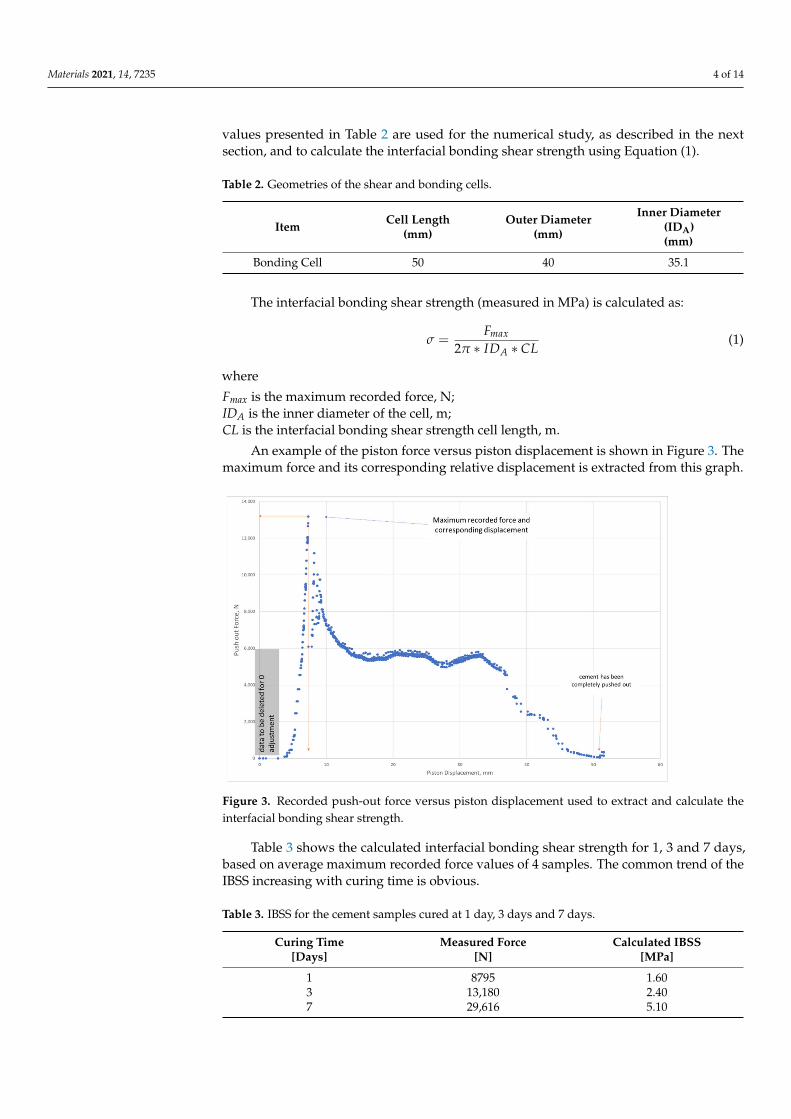
An example of the piston force versus piston displacement is shown in Figure 3. Themaximum force and its corresponding relative displacement is extracted from this graph.
Figure 3. Recorded push-out force versus piston displacement used to extract and calculate theinterfacial bonding shear strength.
Table 3 shows the calculated interfacial bonding shear strength for 1, 3 and 7 days,based on average maximum recorded force values of 4 samples. The common trend of theIBSS increasing with curing time is obvious.
Table 3. IBSS for the cement samples cured at 1 day, 3 days and 7 days.
Curing Time[Days]
Measured Force[N]
Calculated IBSS[MPa]
1 8795 1.603 13,180 2.407 29,616 5.10

Materials 2021, 14, 7235 5 of 14
3. Numerical Approach
The numerical study was carried out using the 2021 R2 ANSYS version. In order toconduct this study, we created an axis symmetric model of the interfacial shear bondingcell using the average geometry data shown in Table 2. Figure 4 shows the model used forthis study.
Figure 4. Model used for the study.
3.1. Element Selection and Definition of Contact
Nonlinear mechanical, quadratic axisymmetric elements with three or four edgeswere used for the whole cell in order to obtain better results. Figure 5 presents the meshedassembly. As it can be seen, the mesh is strongly refined in the contact areas using edgesizing conditions. The average element size is 2 mm (imposed by a face sizing condition).In the cement–pipe contact area, the average element size is 0.05 mm, while in the piston–cement contact area, the average element size is 0.5 mm. This refinement allows an accuratecontact force and contact process simulation.
Figure 5. Meshed assembly of the experimental cell, showing the element density near to bonded surface.
The model exhibits two contact zones: one between the piston and the cement andanother one between the cement and the pipe interior wall. Both were modeled as bonded,but for different reasons.
Materials 2021, 14, 7235 6 of 14
The contact between piston and cement is not rigorously bonded since this area is notvery important for our study, and for simplifying the model, the authors reckoned that abonded contact will be enough.
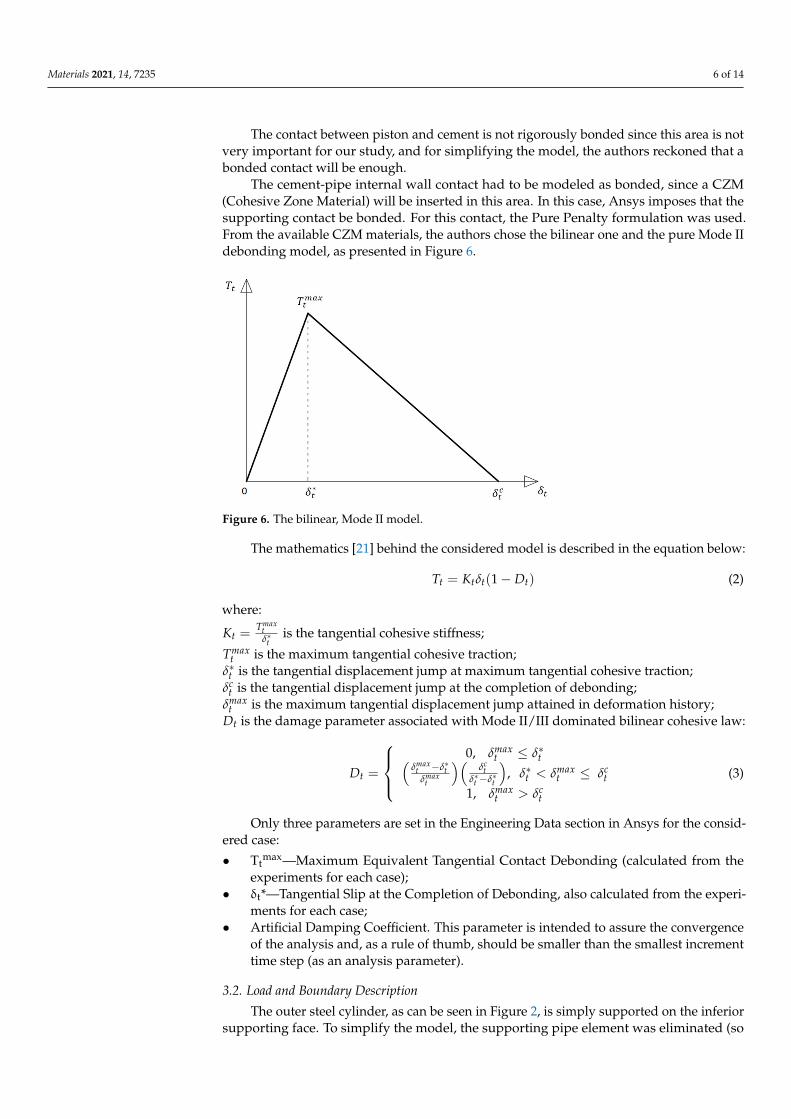
The cement-pipe internal wall contact had to be modeled as bonded, since a CZM(Cohesive Zone Material) will be inserted in this area. In this case, Ansys imposes that thesupporting contact be bonded. For this contact, the Pure Penalty formulation was used.From the available CZM materials, the authors chose the bilinear one and the pure Mode IIdebonding model, as presented in Figure 6.
Figure 6. The bilinear, Mode II model.
The mathematics [21] behind the considered model is described in the equation below:
Tt = Ktδt(1 − Dt) (2)
where:
Kt =Tmax
tδ∗t
is the tangential cohesive stiffness;
Tmaxt is the maximum tangential cohesive traction;
δ∗t is the tangential displacement jump at maximum tangential cohesive traction;δc
t is the tangential displacement jump at the completion of debonding;δmax
t is the maximum tangential displacement jump attained in deformation history;Dt is the damage parameter associated with Mode II/III dominated bilinear cohesive law:
Dt =
0, δmax
t ≤ δ∗t(δmax
t −δ∗tδmax
t
)(δc
tδ∗t −δ∗t
), δ∗t < δmax
t ≤ δct
1, δmaxt > δc
t
(3)
Only three parameters are set in the Engineering Data section in Ansys for the consid-ered case:
• Ttmax—Maximum Equivalent Tangential Contact Debonding (calculated from the
experiments for each case);• δt*—Tangential Slip at the Completion of Debonding, also calculated from the experi-
ments for each case;• Artificial Damping Coefficient. This parameter is intended to assure the convergence
of the analysis and, as a rule of thumb, should be smaller than the smallest incrementtime step (as an analysis parameter).
3.2. Load and Boundary Description
The outer steel cylinder, as can be seen in Figure 2, is simply supported on the inferiorsupporting face. To simplify the model, the supporting pipe element was eliminated (so
Materials 2021, 14, 7235 7 of 14
there is no need for another contact region), and the inferior horizontal face of the pipewas blocked (fixed). As already mentioned, the contact between the push-out rod andcement was selected as fully bonded, but this option does not have any effect on the results.The load is ramped applied in a manner that mimics the way the force varied during theexperiment up to values large enough to induce instability in the model (that becomesunstable) and thus allows detecting when the debonding process initiates. This will bedescribed in detail in the next chapter.
The cement and steel relevant properties used for this numerical analysis are shownin Table 4. Analyses for different values for the Young’s modulus, respectively, and Poissonratio of the cement were performed, and the results will be presented later in this paper.
Table 4. Cement and steel properties.
Material Young’s Modulus(MPa) Poisson Ratio
Cement 4137–21,000 0.2–0.4Steel 210,000 0.3
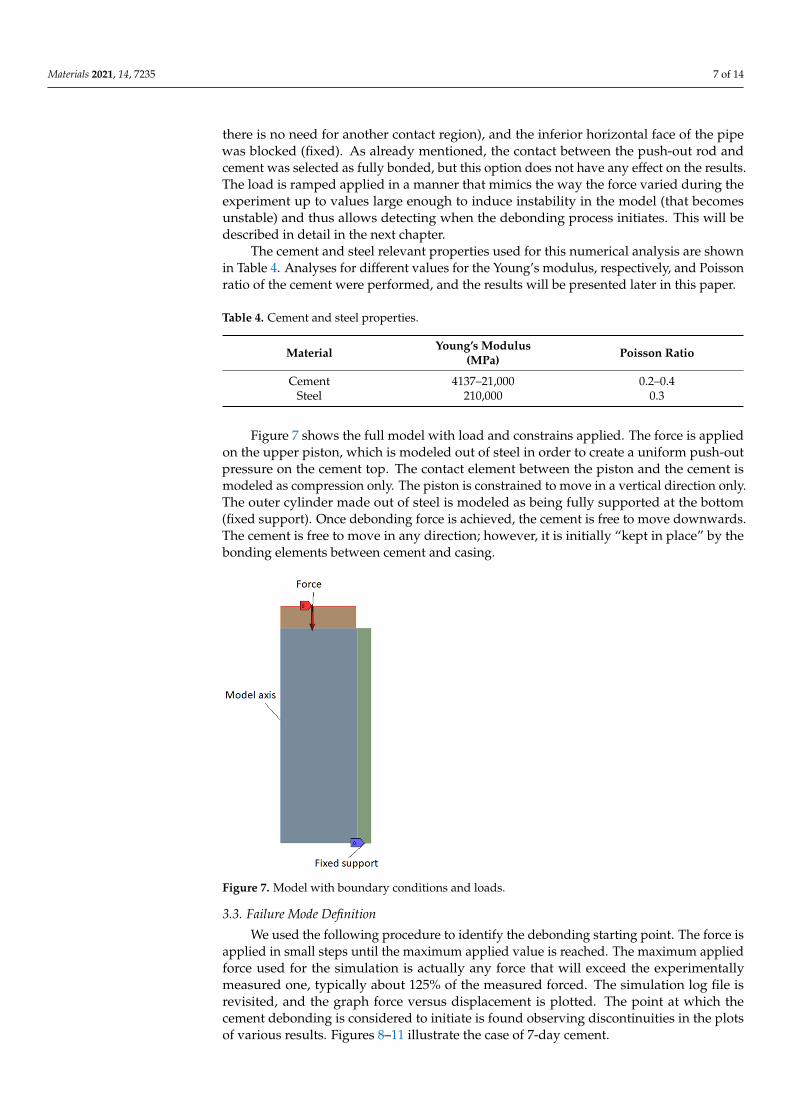
Figure 7 shows the full model with load and constrains applied. The force is appliedon the upper piston, which is modeled out of steel in order to create a uniform push-outpressure on the cement top. The contact element between the piston and the cement ismodeled as compression only. The piston is constrained to move in a vertical direction only.The outer cylinder made out of steel is modeled as being fully supported at the bottom(fixed support). Once debonding force is achieved, the cement is free to move downwards.The cement is free to move in any direction; however, it is initially “kept in place” by thebonding elements between cement and casing.
Figure 7. Model with boundary conditions and loads.
3.3. Failure Mode Definition
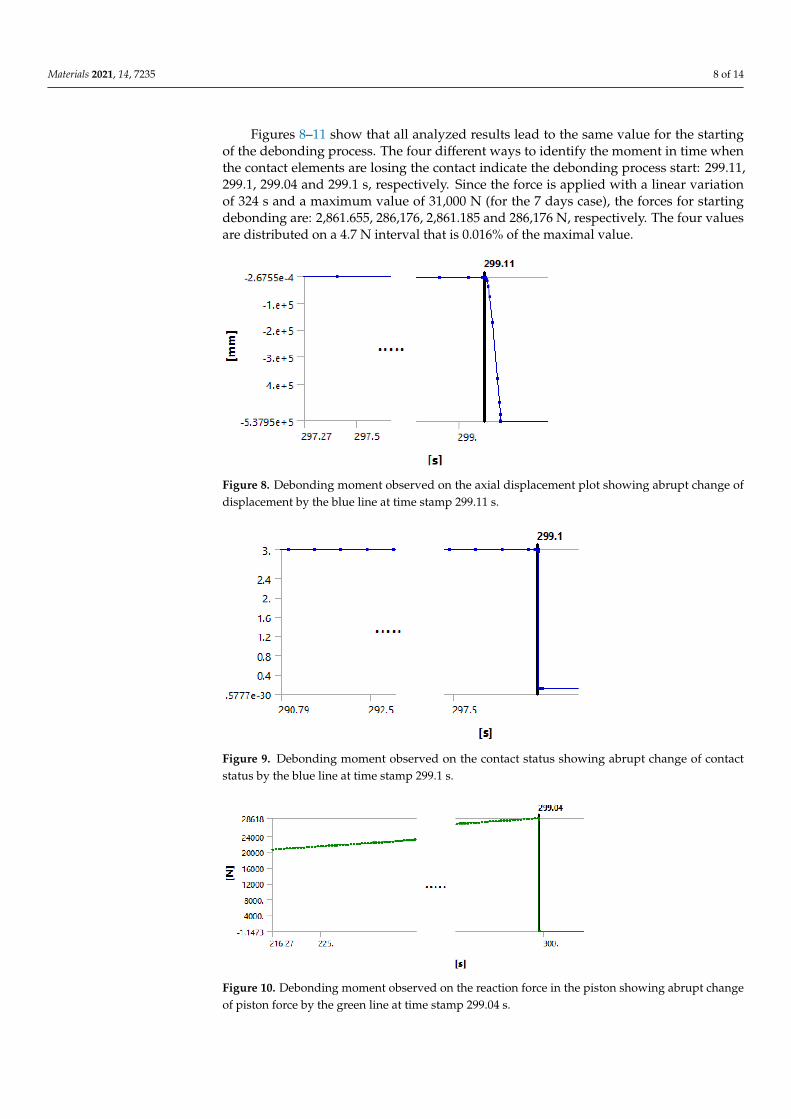
We used the following procedure to identify the debonding starting point. The force isapplied in small steps until the maximum applied value is reached. The maximum appliedforce used for the simulation is actually any force that will exceed the experimentallymeasured one, typically about 125% of the measured forced. The simulation log file isrevisited, and the graph force versus displacement is plotted. The point at which thecement debonding is considered to initiate is found observing discontinuities in the plotsof various results. Figures 8–11 illustrate the case of 7-day cement.
Materials 2021, 14, 7235 8 of 14
Figures 8–11 show that all analyzed results lead to the same value for the startingof the debonding process. The four different ways to identify the moment in time whenthe contact elements are losing the contact indicate the debonding process start: 299.11,299.1, 299.04 and 299.1 s, respectively. Since the force is applied with a linear variationof 324 s and a maximum value of 31,000 N (for the 7 days case), the forces for startingdebonding are: 2,861.655, 286,176, 2,861.185 and 286,176 N, respectively. The four valuesare distributed on a 4.7 N interval that is 0.016% of the maximal value.
Figure 8. Debonding moment observed on the axial displacement plot showing abrupt change ofdisplacement by the blue line at time stamp 299.11 s.
Figure 9. Debonding moment observed on the contact status showing abrupt change of contactstatus by the blue line at time stamp 299.1 s.
Figure 10. Debonding moment observed on the reaction force in the piston showing abrupt changeof piston force by the green line at time stamp 299.04 s.
Materials 2021, 14, 7235 9 of 14
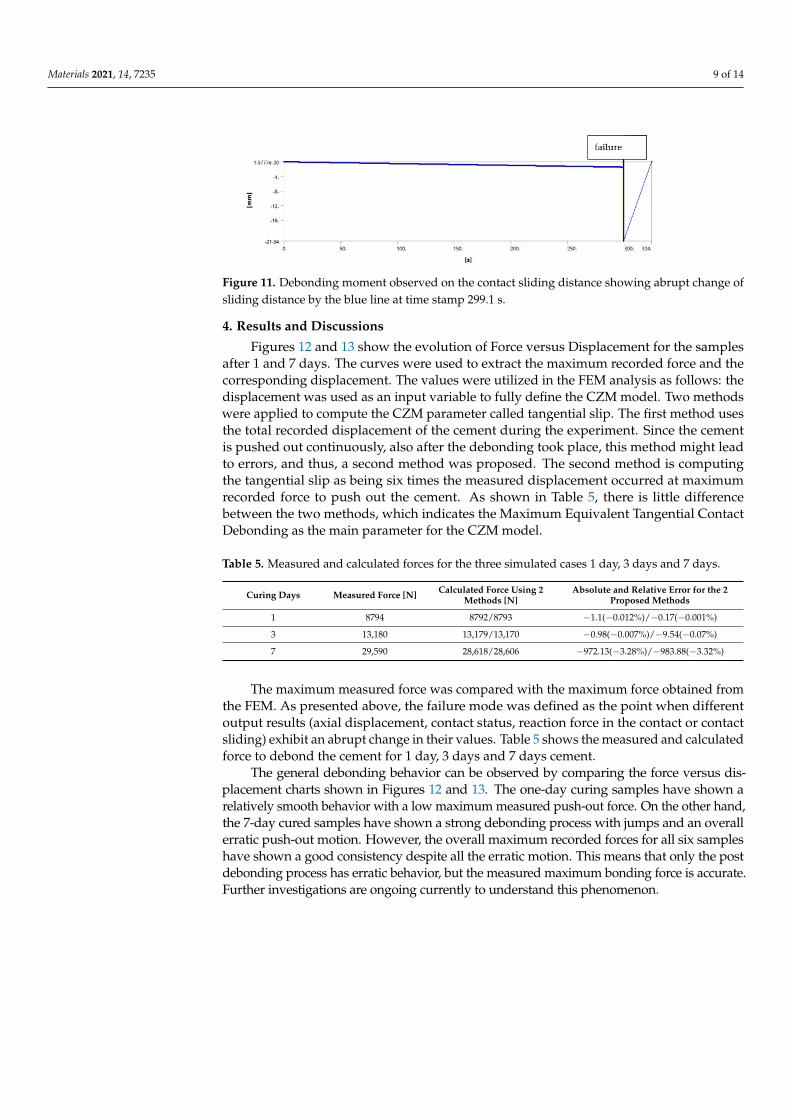
Figure 11. Debonding moment observed on the contact sliding distance showing abrupt change ofsliding distance by the blue line at time stamp 299.1 s.
4. Results and Discussions
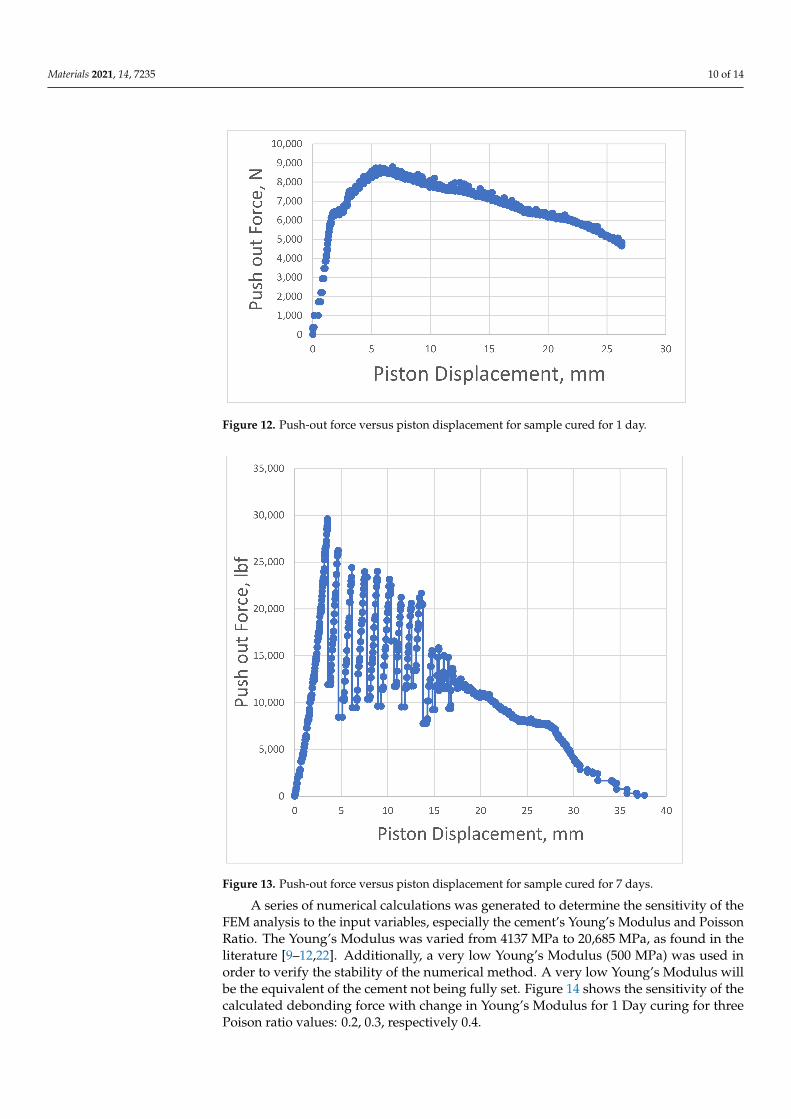
Figures 12 and 13 show the evolution of Force versus Displacement for the samplesafter 1 and 7 days. The curves were used to extract the maximum recorded force and thecorresponding displacement. The values were utilized in the FEM analysis as follows: thedisplacement was used as an input variable to fully define the CZM model. Two methodswere applied to compute the CZM parameter called tangential slip. The first method usesthe total recorded displacement of the cement during the experiment. Since the cementis pushed out continuously, also after the debonding took place, this method might leadto errors, and thus, a second method was proposed. The second method is computingthe tangential slip as being six times the measured displacement occurred at maximumrecorded force to push out the cement. As shown in Table 5, there is little differencebetween the two methods, which indicates the Maximum Equivalent Tangential ContactDebonding as the main parameter for the CZM model.
Table 5. Measured and calculated forces for the three simulated cases 1 day, 3 days and 7 days.
Curing Days Measured Force [N] Calculated Force Using 2Methods [N]
Absolute and Relative Error for the 2Proposed Methods
1 8794 8792/8793 −1.1(−0.012%)/−0.17(−0.001%)
3 13,180 13,179/13,170 −0.98(−0.007%)/−9.54(−0.07%)
7 29,590 28,618/28,606 −972.13(−3.28%)/−983.88(−3.32%)
The maximum measured force was compared with the maximum force obtained fromthe FEM. As presented above, the failure mode was defined as the point when differentoutput results (axial displacement, contact status, reaction force in the contact or contactsliding) exhibit an abrupt change in their values. Table 5 shows the measured and calculatedforce to debond the cement for 1 day, 3 days and 7 days cement.
The general debonding behavior can be observed by comparing the force versus dis-placement charts shown in Figures 12 and 13. The one-day curing samples have shown arelatively smooth behavior with a low maximum measured push-out force. On the other hand,the 7-day cured samples have shown a strong debonding process with jumps and an overallerratic push-out motion. However, the overall maximum recorded forces for all six sampleshave shown a good consistency despite all the erratic motion. This means that only the postdebonding process has erratic behavior, but the measured maximum bonding force is accurate.Further investigations are ongoing currently to understand this phenomenon.
Materials 2021, 14, 7235 10 of 14
Figure 12. Push-out force versus piston displacement for sample cured for 1 day.
Figure 13. Push-out force versus piston displacement for sample cured for 7 days.
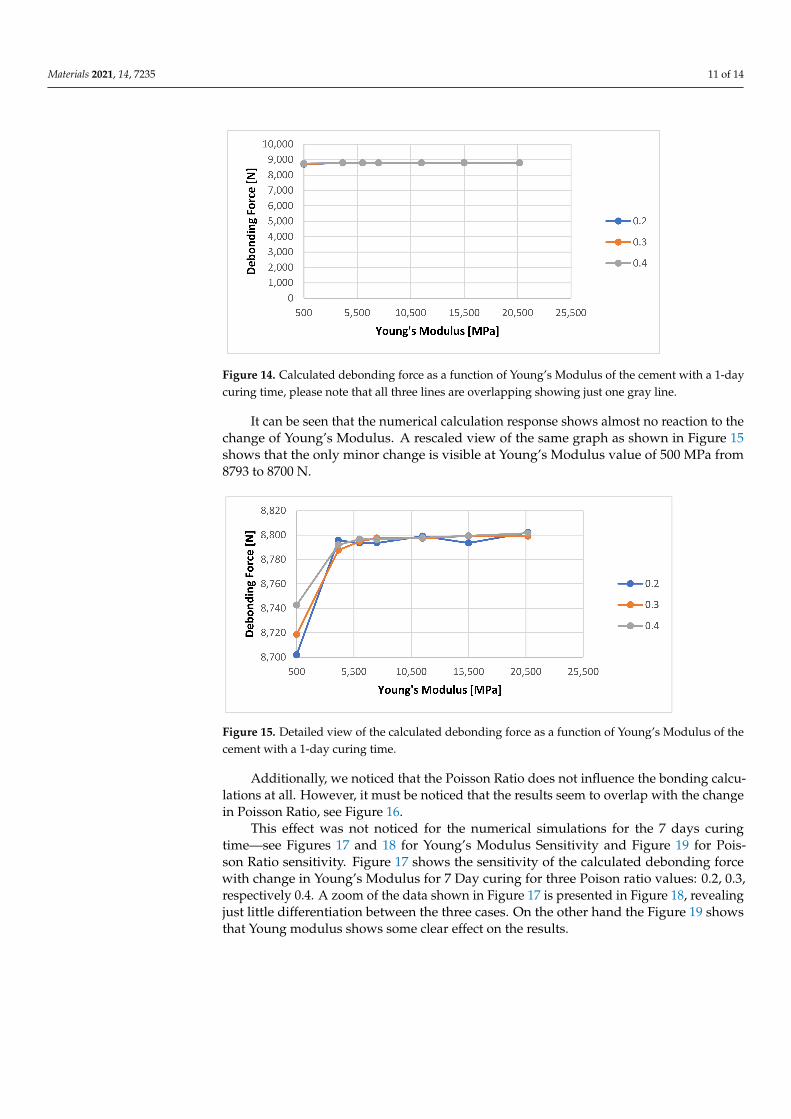
A series of numerical calculations was generated to determine the sensitivity of theFEM analysis to the input variables, especially the cement’s Young’s Modulus and PoissonRatio. The Young’s Modulus was varied from 4137 MPa to 20,685 MPa, as found in theliterature [9–12,22]. Additionally, a very low Young’s Modulus (500 MPa) was used inorder to verify the stability of the numerical method. A very low Young’s Modulus willbe the equivalent of the cement not being fully set. Figure 14 shows the sensitivity of thecalculated debonding force with change in Young’s Modulus for 1 Day curing for threePoison ratio values: 0.2, 0.3, respectively 0.4.
Materials 2021, 14, 7235 11 of 14
Figure 14. Calculated debonding force as a function of Young’s Modulus of the cement with a 1-daycuring time, please note that all three lines are overlapping showing just one gray line.
It can be seen that the numerical calculation response shows almost no reaction to thechange of Young’s Modulus. A rescaled view of the same graph as shown in Figure 15shows that the only minor change is visible at Young’s Modulus value of 500 MPa from8793 to 8700 N.
Figure 15. Detailed view of the calculated debonding force as a function of Young’s Modulus of thecement with a 1-day curing time.
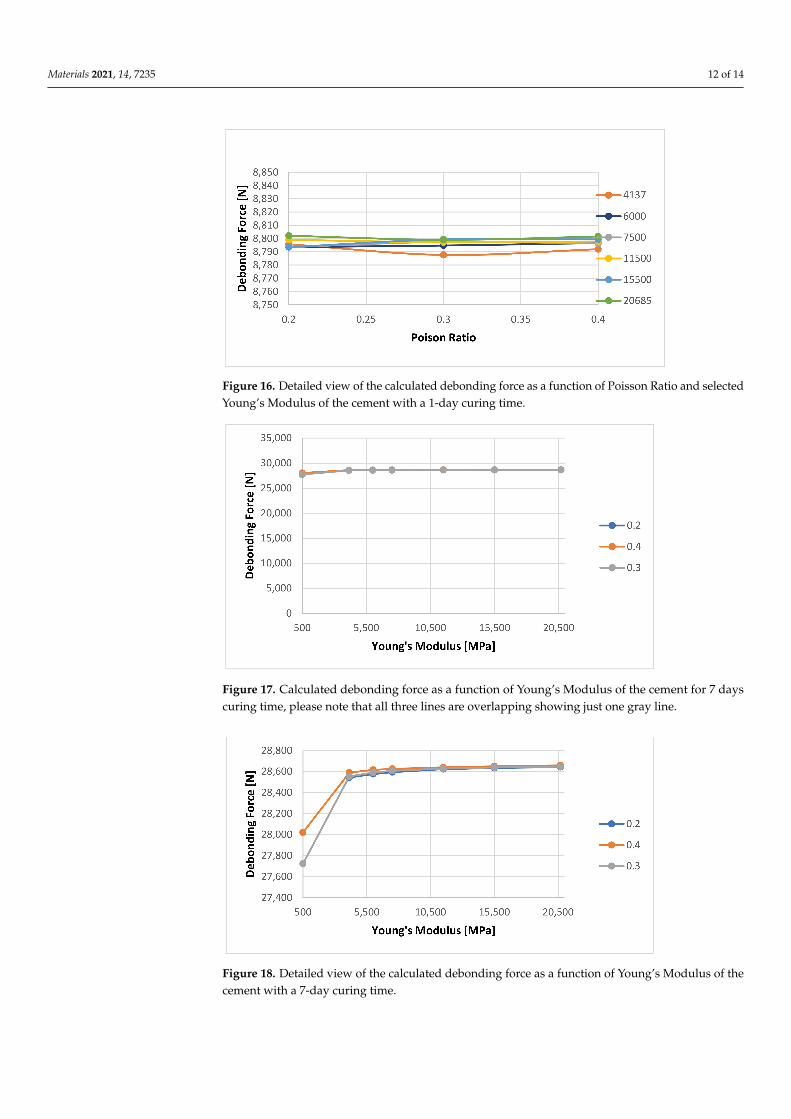
Additionally, we noticed that the Poisson Ratio does not influence the bonding calcu-lations at all. However, it must be noticed that the results seem to overlap with the changein Poisson Ratio, see Figure 16.
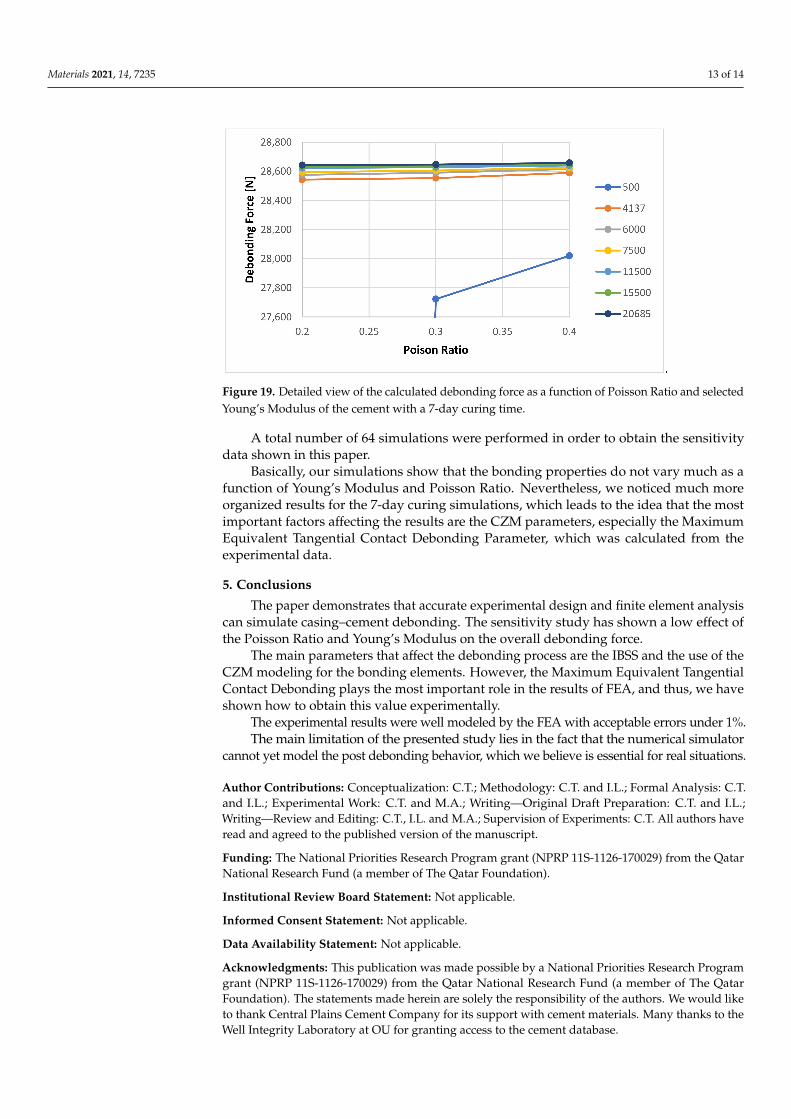
This effect was not noticed for the numerical simulations for the 7 days curingtime—see Figures 17 and 18 for Young’s Modulus Sensitivity and Figure 19 for Pois-son Ratio sensitivity. Figure 17 shows the sensitivity of the calculated debonding forcewith change in Young’s Modulus for 7 Day curing for three Poison ratio values: 0.2, 0.3,respectively 0.4. A zoom of the data shown in Figure 17 is presented in Figure 18, revealingjust little differentiation between the three cases. On the other hand the Figure 19 showsthat Young modulus shows some clear effect on the results.
Materials 2021, 14, 7235 12 of 14
Figure 16. Detailed view of the calculated debonding force as a function of Poisson Ratio and selectedYoung’s Modulus of the cement with a 1-day curing time.
Figure 17. Calculated debonding force as a function of Young’s Modulus of the cement for 7 dayscuring time, please note that all three lines are overlapping showing just one gray line.
Figure 18. Detailed view of the calculated debonding force as a function of Young’s Modulus of thecement with a 7-day curing time.
Materials 2021, 14, 7235 13 of 14
Figure 19. Detailed view of the calculated debonding force as a function of Poisson Ratio and selectedYoung’s Modulus of the cement with a 7-day curing time.
A total number of 64 simulations were performed in order to obtain the sensitivitydata shown in this paper.
Basically, our simulations show that the bonding properties do not vary much as afunction of Young’s Modulus and Poisson Ratio. Nevertheless, we noticed much moreorganized results for the 7-day curing simulations, which leads to the idea that the mostimportant factors affecting the results are the CZM parameters, especially the MaximumEquivalent Tangential Contact Debonding Parameter, which was calculated from theexperimental data.
5. Conclusions
The paper demonstrates that accurate experimental design and finite element analysiscan simulate casing–cement debonding. The sensitivity study has shown a low effect ofthe Poisson Ratio and Young’s Modulus on the overall debonding force.
The main parameters that affect the debonding process are the IBSS and the use of theCZM modeling for the bonding elements. However, the Maximum Equivalent TangentialContact Debonding plays the most important role in the results of FEA, and thus, we haveshown how to obtain this value experimentally.
The experimental results were well modeled by the FEA with acceptable errors under 1%.The main limitation of the presented study lies in the fact that the numerical simulator
cannot yet model the post debonding behavior, which we believe is essential for real situations.
Author Contributions: Conceptualization: C.T.; Methodology: C.T. and I.L.; Formal Analysis: C.T.and I.L.; Experimental Work: C.T. and M.A.; Writing—Original Draft Preparation: C.T. and I.L.;Writing—Review and Editing: C.T., I.L. and M.A.; Supervision of Experiments: C.T. All authors haveread and agreed to the published version of the manuscript.
Funding: The National Priorities Research Program grant (NPRP 11S-1126-170029) from the QatarNational Research Fund (a member of The Qatar Foundation).
Institutional Review Board Statement: Not applicable.
Informed Consent Statement: Not applicable.
Data Availability Statement: Not applicable.
Acknowledgments: This publication was made possible by a National Priorities Research Programgrant (NPRP 11S-1126-170029) from the Qatar National Research Fund (a member of The QatarFoundation). The statements made herein are solely the responsibility of the authors. We would liketo thank Central Plains Cement Company for its support with cement materials. Many thanks to theWell Integrity Laboratory at OU for granting access to the cement database.
Materials 2021, 14, 7235 14 of 14
Conflicts of Interest: The authors declare no conflict of interest.
References1. Nelson, E.B. Well Cementing; Elsevier: Amsterdam, The Netherlands, 1990.2. Alber, M.; Ehringhausen, N. Petrophysical properties of casing cement while curing. Int. Soc. Rock Mech. Rock Eng. 2017, 191,
164–171. [CrossRef]3. Wehling, P. Wellbore Cement Integrity Testing. Master’s Thesis, TU-Clausthal, Clausthal-Zellerfeld, Germany, 2008.4. Teodoriu, C.; Reinicke, K.M.; Fichter, C.; Wehling, P. Investigations on casing-cement interaction with application to gas and CO2
storage wells. In Proceedings of the SPE EUROPEC/EAGE Annual Conference and Exhibition, Barcelona, Spain, 14–17 June 2010.5. Evans, G.W.; Carter, L.G. Bonding Studies of Cementing Compositions to Pipe and Formations; American Petroleum Institute:
Washington, DC, USA, 1962.6. Teodoriu, C. Why and When Does Casing Fail in Geothermal Wells: A Surprising Question? In Proceedings of the World
Geothermal Congress 2015, Melbourne, Australia, 19–25 April 2015.7. Philippacopoulos, J.A.; Berndt, L.M. Structural analysis of geothermal well cements. Geothermics 2002, 31, 657–676. [CrossRef]8. Ichim, A.C.; Teodoriu, C. Development of a cement repository to improve the understanding of well integrity behavior with time.
In Proceedings of the SPE Oklahoma City Oil and Gas Symposium, Oklahoma City, OK, USA, 27–31 March 2017.9. Teodoriu, C.; Yi, M.C.; Ichim, A.C.; Salehi, S. A novel view of cement failure with application to geothermal well construction. In
Proceedings of the 43rd Workshop on Geothermal Reservoir Engineering, Stanford, CA, USA, 12–14 February 2018.10. Tabatabaei, M.; Taleghani, A.D.; Alem, N. Measurement of mixed mode interfacial strengths with cementitious materials. Eng.
Fract. Mech. 2020, 223, 106739, ISSN 0013-7944. [CrossRef]11. Bejar, L.A.; Rushing, T.S. Computational shear strength of ultrahigh-performance api class h cement-silica-fume paste cylinders
via direct shear tests. J. Mater. Civ. Eng. 2017, 29, 04017113. [CrossRef]12. Zhao, X.; Guan, Z.; Xu, M.; Shi, Y.; Liao, H.; Sun, J. The Influence of casing-sand adhesion on cementing bond strength. PLoS ONE
2015, 10, e0130892. [CrossRef] [PubMed]13. Salehi, S.; Khattak, M.J.; Ali, N. Development of geopolymer-based cement slurries with enhanced thickening time, compressive
and shear bond strength and durability. In Proceedings of the IADC/SPE Drilling Conference and Exhibition, Fort Worth, TX,USA, 1–3 March 2016.
14. Lavrov, A.; Torsæter, M. Physics and Mechanics of Primary Well Cementing; Springer: Berlin/Heidelberg, Germany, 2016.15. Won, J.; Lee, D.; Na, K.; Lee, I.M.; Choi, H. Physical properties of G-class cement for geothermal well cementing in South Korea.
Renev. Energy 2015, 80, 123–131. [CrossRef]16. Miranda, C.R.; Toledo Filho, R.D.; Fairbairn, E.M.R.; Thaumaturgo, C.; Vargas, A.A.; Oliveira, G.M.B.; Teixeira, K.C. New
design of high-performance cement systems for zonal isolation: Influence of porosity, rheological parameters and chemical andmechanical resistance. In Proceedings of the SPE Latin American and Caribbean Petroleum Engineering Conference, Lima, Peru,1–3 December 2010.
17. Jimenez, W.C.; Pang, X.; Urdaneta, J.A.; Sørensen, E.; Lende, G.; Nimane, S. Thermo-mechanical properties of annular sealants—Apath to optimized wellbore integrity and economics. In Proceedings of the SPE Kuwait Oil & Gas Show and Conference, KuwaitCity, Kuwait, 15–18 October 2017.
18. Bwala, A.H. Experimental Investigation of Shear Bond Strength and Microstructure of Fly Ash Geopolymer Cement for Oil andGas Industry. Master’s Thesis, University of Louisiana at Lafayette, Lafayette, LA, USA, August 2015.
19. API (American Petroleum Institute). Recommended Practice for Testing Well Cements; American Petroleum Institute: Washington,DC, USA, 2013.
20. API (American Petroleum Institute). Specification for Cements and Materials for Well Cementing; American Petroleum Institute:Washington, DC, USA, 2002.
21. ANSYS—Online Manual, Ansys Academic Support | Tutorials & Training Materials, reviewed 25th July 2021.22. Kosinowski, C.; Teodoriu, C. Study of class G cement fatigue using experimental investigations. In Proceedings of the SPE/EAGE
European Unconventional Resources Conference & Exhibition–From Potential to Production, Vienna, Austria, 19–22 March 2012.