Experimental framework for evaluating the mechanical behavior of dry and wet crushable granular...
12
ARTICLE Experimental framework for evaluating the mechanical behavior of dry and wet crushable granular materials based on the particle breakage ratio Carlos Ovalle, Christophe Dano, Pierre-Yves Hicher, and Mónica Cisternas Abstract: It has been widely shown that particle crushing increases the compressibility of granular materials. For a particular crushable material and given test conditions, an empirical relation can be established between the breakage ratio and the plastic work. Along these lines, constitutive models have been developed based on the effect of grading evolution during crushing. In parallel, due to corrosive attacks of the humid environment at the tip of microcracks within solid grains, the mechanical behavior of crushable granular materials depends also on the water content: the higher the material humidity, the higher the particle crushing. However, the experimental data on the relation between loading–wetting conditions and the breakage ratio are still quite scarce. In this paper, we present experimental results on crushable sand to study the effect of flooding under isotropic, oedometric, and triaxial stress paths. The main objective of this study is to obtain a consistent framework for the effect of water based on the breakage ratio. Our results have shown that, for a given initial density and stress path, the dry material after flooding reaches the equivalent behavior of the initially wetted material in terms of compression curve, particle crushing, and creep compressibility index, regardless of the point of flooding. Moreover, the relation between the breakage ratio and the final void ratio is unique and depends neither on the stress path, the water content, the point of flooding, nor the loading condition (time of creep or relaxation), but exclusively on the initial density and on intrinsic parameters. These findings could improve the prediction of the effect of water and time on the mechanical response of crushable granular materials through constitutive models based on grading evolution. Key words: crushable granular materials, compressibility, grain-size distribution, creep, stress relaxation. Résumé : Il est reconnu que la rupture des grains augmente la compressibilité des matériaux granulaires. Pour des conditions d’essai données, une relation empirique peut être établie entre le taux de rupture des grains et le travail plastique. Ainsi, des modèles constitutifs ont été développés sur la base de l’évolution de la granulométrie liée a ` cette rupture des grains. Parallèle- ment, du fait des attaques corrosives de l’environnement humide en pointe des micro-fissures dans les grains solides, le comportement mécanique des matériaux granulaires broyables dépend également de la teneur en eau: plus l’humidité du matériau est élevée, plus la rupture semble favorisée. Toutefois, les données expérimentales sur la relation entre les conditions de chargement, les conditions hydriques et le taux de rupture sont encore très rares. Dans cet article, on présente des résultats expérimentaux sur un sable affecté par la rupture des grains pour étudier l’effet de l’imbibition sur des chemins de contraintes isotropes, œdométriques, et triaxiales. L’objectif principal de cette étude est d’obtenir un schéma de comportement cohérent décrivant l’effet de l’eau sur le taux de rupture des grains. Les résultats montrent que, pour une densité initiale et un chemin de contraintes donné, après l’imbibition d’un échantillon sec, il suit un comportement identique a ` celui d’un échantillon saturé dès le début du chargement en termes de compressibilité, ruptures des grains et d’indice de compressibilité au fluage, quel que soit le point d’imbibition. Par ailleurs, la relation entre le taux de rupture et l’indice des vides final est unique et ne dépend pas du chemin de contraintes, ni de la teneur en eau, ni du point initial de l’imbibition, ni des conditions de chargement (temps de fluage ou de relaxation), mais uniquement de la densité initiale et de paramètres intrinsèques. Ces résultats pourraient amé- liorer la prédiction de l’effet de l’eau et du temps sur la réponse mécanique des matériaux granulaires broyables a ` l’aide des modèles constitutifs basés sur la granulométrie. Mots-clés : matériaux granulaires broyables, compressibilité, granulométrie, fluage, relaxation des contraintes. Introduction Granular materials are present in many civil engineering prob- lems, such as foundations on sands or gravels, railway ballasts and rockfills embankments. It is well known that their mechanical behavior is a function of the properties of the granular packing and its water content, as well as of the mechanical and geometri- cal characteristics of individual grains. Under given conditions, intergranular contact forces can exceed particle strength and a fraction of the particles will crush, changing the grain-size distri- bution (GSD) towards a more polydisperse packing, which creates a denser arrangement for a given stress condition (Biarez and Hicher 1997; Li et al. 2013). After crushing, consequently compress- ibility will increase and dilatancy under shear become reduced, as well as the peak shear strength (Vesic and Clough 1968; Marachi Received 3 March 2014. Accepted 7 September 2014. C. Ovalle. Department of Structural and Geotechnical Engineering, Pontificia Universidad Católica de Chile, Avda. Vicuña Mackenna 4860, Macul, Santiago, Chile. C. Dano, P.-Y. Hicher, and M. Cisternas. LUNAM University, Ecole Centrale de Nantes, CNRS UMR 6183, 1 rue de la Noë BP 92101 44321 Nantes Cedex 3, France. Corresponding author: Carlos Ovalle (e-mail: [email protected]). 587 Can. Geotech. J. 52: 587–598 (2015) dx.doi.org/10.1139/cgj-2014-0079 Published at www.nrcresearchpress.com/cgj on 18 September 2014. Can. Geotech. J. Downloaded from www.nrcresearchpress.com by KLOHN CRIPPEN BERGER LTD on 05/28/15 For personal use only.
-
Upload
independent -
Category
Documents
-
view
6 -
download
0
Transcript of Experimental framework for evaluating the mechanical behavior of dry and wet crushable granular...
ARTICLE
Experimental framework for evaluating the mechanicalbehavior of dry and wet crushable granular materials based onthe particle breakage ratioCarlos Ovalle, Christophe Dano, Pierre-Yves Hicher, and Mónica Cisternas
Abstract: It has been widely shown that particle crushing increases the compressibility of granular materials. For a particularcrushable material and given test conditions, an empirical relation can be established between the breakage ratio and the plasticwork. Along these lines, constitutive models have been developed based on the effect of grading evolution during crushing. Inparallel, due to corrosive attacks of the humid environment at the tip of microcracks within solid grains, the mechanicalbehavior of crushable granular materials depends also on the water content: the higher the material humidity, the higher theparticle crushing. However, the experimental data on the relation between loading–wetting conditions and the breakage ratioare still quite scarce. In this paper, we present experimental results on crushable sand to study the effect of flooding underisotropic, oedometric, and triaxial stress paths. The main objective of this study is to obtain a consistent framework for the effectof water based on the breakage ratio. Our results have shown that, for a given initial density and stress path, the dry materialafter flooding reaches the equivalent behavior of the initially wetted material in terms of compression curve, particle crushing,and creep compressibility index, regardless of the point of flooding. Moreover, the relation between the breakage ratio and thefinal void ratio is unique and depends neither on the stress path, the water content, the point of flooding, nor the loadingcondition (time of creep or relaxation), but exclusively on the initial density and on intrinsic parameters. These findings couldimprove the prediction of the effect of water and time on the mechanical response of crushable granular materials throughconstitutive models based on grading evolution.
Key words: crushable granular materials, compressibility, grain-size distribution, creep, stress relaxation.
Résumé : Il est reconnu que la rupture des grains augmente la compressibilité des matériaux granulaires. Pour des conditionsd’essai données, une relation empirique peut être établie entre le taux de rupture des grains et le travail plastique. Ainsi, desmodèles constitutifs ont été développés sur la base de l’évolution de la granulométrie liée a cette rupture des grains. Parallèle-ment, du fait des attaques corrosives de l’environnement humide en pointe des micro-fissures dans les grains solides, lecomportement mécanique des matériaux granulaires broyables dépend également de la teneur en eau: plus l’humidité dumatériau est élevée, plus la rupture semble favorisée. Toutefois, les données expérimentales sur la relation entre les conditionsde chargement, les conditions hydriques et le taux de rupture sont encore très rares. Dans cet article, on présente des résultatsexpérimentaux sur un sable affecté par la rupture des grains pour étudier l’effet de l’imbibition sur des chemins de contraintesisotropes, œdométriques, et triaxiales. L’objectif principal de cette étude est d’obtenir un schéma de comportement cohérentdécrivant l’effet de l’eau sur le taux de rupture des grains. Les résultats montrent que, pour une densité initiale et un chemin decontraintes donné, après l’imbibition d’un échantillon sec, il suit un comportement identique a celui d’un échantillon saturé dèsle début du chargement en termes de compressibilité, ruptures des grains et d’indice de compressibilité au fluage, quel que soitle point d’imbibition. Par ailleurs, la relation entre le taux de rupture et l’indice des vides final est unique et ne dépend pas duchemin de contraintes, ni de la teneur en eau, ni du point initial de l’imbibition, ni des conditions de chargement (temps defluage ou de relaxation), mais uniquement de la densité initiale et de paramètres intrinsèques. Ces résultats pourraient amé-liorer la prédiction de l’effet de l’eau et du temps sur la réponse mécanique des matériaux granulaires broyables a l’aide desmodèles constitutifs basés sur la granulométrie.
Mots-clés : matériaux granulaires broyables, compressibilité, granulométrie, fluage, relaxation des contraintes.
IntroductionGranular materials are present in many civil engineering prob-
lems, such as foundations on sands or gravels, railway ballasts androckfills embankments. It is well known that their mechanicalbehavior is a function of the properties of the granular packingand its water content, as well as of the mechanical and geometri-cal characteristics of individual grains. Under given conditions,
intergranular contact forces can exceed particle strength and afraction of the particles will crush, changing the grain-size distri-bution (GSD) towards a more polydisperse packing, which createsa denser arrangement for a given stress condition (Biarez andHicher 1997; Li et al. 2013). After crushing, consequently compress-ibility will increase and dilatancy under shear become reduced, aswell as the peak shear strength (Vesic and Clough 1968; Marachi
Received 3 March 2014. Accepted 7 September 2014.
C. Ovalle. Department of Structural and Geotechnical Engineering, Pontificia Universidad Católica de Chile, Avda. Vicuña Mackenna 4860, Macul,Santiago, Chile.C. Dano, P.-Y. Hicher, and M. Cisternas. LUNAM University, Ecole Centrale de Nantes, CNRS UMR 6183, 1 rue de la Noë BP 92101 44321 Nantes Cedex 3,France.Corresponding author: Carlos Ovalle (e-mail: [email protected]).
587
Can. Geotech. J. 52: 587–598 (2015) dx.doi.org/10.1139/cgj-2014-0079 Published at www.nrcresearchpress.com/cgj on 18 September 2014.
Can
. Geo
tech
. J. D
ownl
oade
d fr
om w
ww
.nrc
rese
arch
pres
s.co
m b
y K
LO
HN
CR
IPPE
N B
ER
GE
R L
TD
on
05/2
8/15
For
pers
onal
use
onl
y.

et al. 1972; Marsal 1973; Coop and Lee 1995; Lee and Coop 1995;Lade et al. 1996; Ovalle et al. 2013b). In general, grain crushingoccurs under high stresses, e.g., at pile tips or at the base of highdams, or under quite lower stresses in materials composed ofrelatively weak grains. The amount of grain crushing is normallyanalyzed in terms of the breakage ratio Br (Marsal 1973; Hardin1985; Lade et al. 1996; Einav 2007a). In this work, we use a recent Brdefinition proposed by Einav (2007a), obtained as the ratio be-tween (i) the area flanked by the initial GSD and any intermediateGSD after crushing (Bt in Fig. 1) and (ii) the initial GSD and anassumed ultimate fractal GSD (Bp in Fig. 1, assuming a fractaldimension D = 2.5 for a cumulated GSD given by G(d) = (d/dmax)3−D,where d is the grain diameter and dmax is the maximum graindiameter).
The experiments by Miura and O-Hara (1979), Hu et al. (2011),and Ovalle et al. (2013a) have shown that the amount of graincrushing is related to the total amount of plastic work. Thesefindings have led to developing phenomenological constitutivemodels based on the general framework of uncrushable soils (i.e.,the critical state theory). Accordingly, extra plastic strain aftercrushing is given by an inverse relation between the critical voidratio and the breakage ratio (Daouadji et al. 2001; Russell andKhalili 2004; Muir Wood et al. 2009; Daouadji and Hicher 2010; Huet al. 2011). The alternative method proposed by McDowell andBolton (1998) linking the plastic work to the increment of thesurface fracture energy on crushed grains has been confrontedwith experiments by Russell (2011) and Ovalle et al. (2013a). On theother hand, Einav (2007a, 2007b) used the breakage ratio as aninternal energy parameter, which opened the way to the predic-tion of grading and its link to the mechanical response.
In fact, the source of grain crushing comes from the breakagemechanics of individual grains at the micromechanical scale. Inother words, it depends on the mechanical properties of grainsand their loading conditions at intergranular contacts. Therefore,multi-scale links are conducive to predict the response of thegranular assembly. Recently, the multi-scale approaches devel-oped take into account physical parameters such as the tensileparticle strength, grain-size effects, and the fracture surface en-ergy of brittle solid grains (McDowell and Bolton 1998; Frossardet al. 2012; Ovalle 2013; Ovalle et al. 2013c). A close look at themicroscopic scale (i.e., microcracks or flaws inside individual par-ticles) gives a physical explanation of this phenomenon, asdescribed by classical brittle fracture mechanics. Griffith (1921)proposed that fracture in perfectly linear elastic brittle materialsoccurs through the propagation of existing cracks. He demon-strated that the induced tensile stress (�) depends only on the sizeof the crack (a) and on intrinsic parameters. Later, Irwin (1957)developed the notion of stress intensity factor under uniformaxial stress (KI = ��(�a)) and fracture toughness (KIC for fracturein mode I). The term KIC can be defined as the material resistanceto fracture by crack propagation. Hence, a crack begins to growwhen KI reaches the limit KIC.
Exposed to rain or dam leakage, for instance, granular soilsundergo significant changes in water content, from an almost drystate to complete saturation. For crushable materials, an increasein relative humidity will cause more particle crushing for a givenstress condition (Marsal 1973; Lee and Coop 1995; Oldecop andAlonso 2003; Ovalle et al. 2013a). Consequently, the mechanicalbehavior of the granular material is affected as explained before.At the micromechanical scale, variations in the material watercontent will affect the KIC (Oldecop and Alonso 2007). This issuehas been discussed by many authors who found that the value ofKIC depends on the degree of saturation and on the physico-chemical composition of both solid material and liquid. Westwood(1974), Atkinson (1979, 1982), and Dunning et al. (1984), for exam-ple, consider that the problem is quite complex because the deg-radation of the structural integrity of geological materials ismainly due to the corrosive attacks of the environment. The ef-
fects are essentially the adsorption of elements and mineral dilu-tion from the environment around the microcrack tip, whichcauses a modification of the fracture surface energy, and the elec-trostatic interaction between the humid environment and thematerial. Moreover, if the material water content increases, thecapillary suction will decrease at the microcrack tips withinthe grains. Therefore, the effective stress against crack openingalso decreases and the mechanism is affected: crack propagationvelocity increases and both particle strength and KIC decrease(Oldecop and Alonso 2007). Therefore, the higher the water con-tent in the material voids, the lower the KIC value and the higherthe particle crushing. However, rather than the material porewater into the entire assembly, what is relevant is how muchwater is retained inside rock microcracks forming the grains.
A number of models for crushable granular materials includingthe effect of the water content have been suggested. For instance,by using the results of compression tests on rockfills underrelative humidity control, Oldecop and Alonso (2001, 2003) andChávez and Alonso (2003) developed a phenomenological consti-tutive model based on work hardening plasticity and critical statetheory, which incorporated the effect of suction. Considering theloading collapse curve concept from unsaturated soil mechanics,their model gives numerical results based on the role of suctionthat is related to the relative humidity in the material voids. Sim-ilarly, Oldecop and Alonso (2007) suggested a conceptual model toexplain the creep behavior in rockfills based on the influence ofsuction on KIC and on an inverse relation between KIC and thecrack propagation velocity. On the other hand, Buscarnera andEinav (2012) proposed a model based on the thermo-mechanicalapproach proposed by Einav (2007a, 2007b), where the loadingcollapse curve is linked to the energy balance. The model links theassumption of energy dissipation by particle breakage and thecapillary theory for solid–fluid interaction. Finally, Bauer (2009)developed a hypoplastic model based on a solid hardness conceptwhere the mechanical response is simply enclosed between acompression curve for the dry condition and a more compressibleone for the saturated material.
Despite the many advances made in understanding the phe-nomenon of grain crushing, the role of the breakage ratio as agoverning parameter for the effect of the water content on crush-able soils is still not very clear. Experimental data on the subjectare generally not available. We, therefore, carried out an exten-sive experimental program of the effects of flooding in crushablegranular material by running a series of tests including differentstress paths, stress magnitudes, with stages of stress relaxationand creep, and by checking test repeatability to obtain a consis-
Fig. 1. Definition of the breakage ratio Br (modified from Einav2007a, with permission from Elsevier).
588 Can. Geotech. J. Vol. 52, 2015
Published by NRC Research Press
Can
. Geo
tech
. J. D
ownl
oade
d fr
om w
ww
.nrc
rese
arch
pres
s.co
m b
y K
LO
HN
CR
IPPE
N B
ER
GE
R L
TD
on
05/2
8/15
For
pers
onal
use
onl
y.

tent framework based on grading evolution. The main objectivesare to study the influence of stress path, water content and time,as well as the link between the mechanical behavior and theevolution of the breakage ratio. Then, based on experimental ev-idences, we suggest an integrated analysis of the material behav-ior with the perspective of enhancing constitutive models basedon grading, including the effects of water content and time.
Tested materialThe granular material tested is an angular sand obtained from
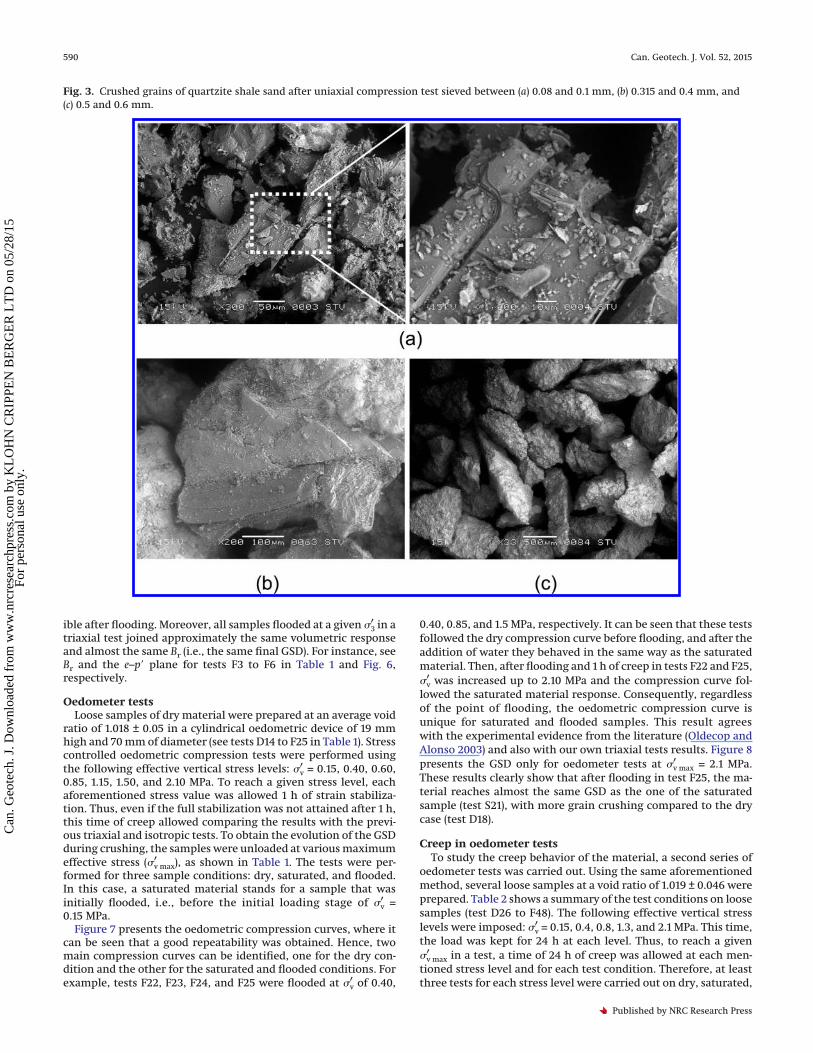
the grinding of a quartzite shale rock from the Trois Valléesquarry, in the north of France. Samples were prepared with aninitial uniform GSD sieved between 2 and 2.5 mm. Figure 2 pres-ents a photo of the material before the test. It can be seen that theparticles are mainly angular and flat, which makes them vulner-able to crushing. Solid grains have a volumetric weight of 27 kN/m3.Figure 3 presents electron microscope scans of fine fractions ofcrushed grain fragments sieved after a test. For finer grains inFig. 3a, it clearly appears that the shale rock is composed of thinsheets. Once crushing occurs, a significant amount of fines isproduced essentially by small pieces of detached sheets. The anal-ysis of X-ray diffraction (XRD) of a fine fraction of the material(grain sizes finer than 0.08 mm) shows that the powder is com-posed mainly of oxygen and silicon, with also significant amountsof aluminum and iron. The XRD measurement results show thepresence of three main phases: 64% of quartz (SiO2), 26% of albite(NaAlSi3O8), and 10% of sodium aluminium silicate (Na6Al6Si10O32).
To avoid crushing during the preparation, loose samples of drymaterial were prepared in cylindrical moulds by pluviation at lowheight. The material was previously air dried for at least 1 week ina constant clime chamber at 20 °C and 60% of relative humidity,where all tests were finally carried out. Here, we consider thematerial as dry after air drying, even if a water content of 0.5% wasmeasured (obtained by weight changes after 24 h of oven drying at105 °C). Under this condition, no capillary bonds were observedbetween particles and the apparent cohesion was negligible. Asexplained below, some samples were saturated or flooded withdemineralized water after a phase of compression. Water wasslowly added to dry samples through a pipe connected to its base,a constant water level being maintained slightly above the upperlevel of the sample. Due to the low water content of the specimenafter drying, we simply used the notation of “dry” and “saturated”for the two opposite initial states of the specimens prior to load-ing. However, such observation applies to the entire sand sample,rather than into microcrack within the grains. After saturation orflooding, no chemical reaction or mineral dilution of wetted sandgrains was observed. After each test, the samples were dried for24 h in a 105 °C oven and then accurately sieved between 2.5 and0.08 mm.
Experimental results
Triaxial and isotropic compression testsLoose samples of dry material were prepared at an average void
ratio (volume of voids/volume of solids) of 0.937 ± 0.035 in a cylin-drical mould 110 mm high and 70 mm in diameter, using a 1 mmthick latex membrane. See tests D1 to F8 in Table 1, where code Dstands for dry, S for saturated, and F for flooded. Strain controlledisotropically consolidated drained triaxial compression tests ateffective confining pressures (�3
′ ) of 0.4 and 0.8 MPa were per-formed using a vertical displacement rate of 0.2 mm/min (i.e., avertical strain rate of about 2%/min). Since we considered dry andsaturated cases (i.e., referring to macropores between grains) anddrained tests on rather coarse uniform sand, no suction or excesspore pressure were measured during testing and the definitionof the effective stress used here coincides with the classicalTerzaghi’s principle. The volume changes of the samples weremeasured through the confinement water volume control system.
Thus, the triaxial cell deformation under isotropic water pressurewas firstly calibrated without the sand sample to isolate the volu-metric strain of the cell from the sample one.
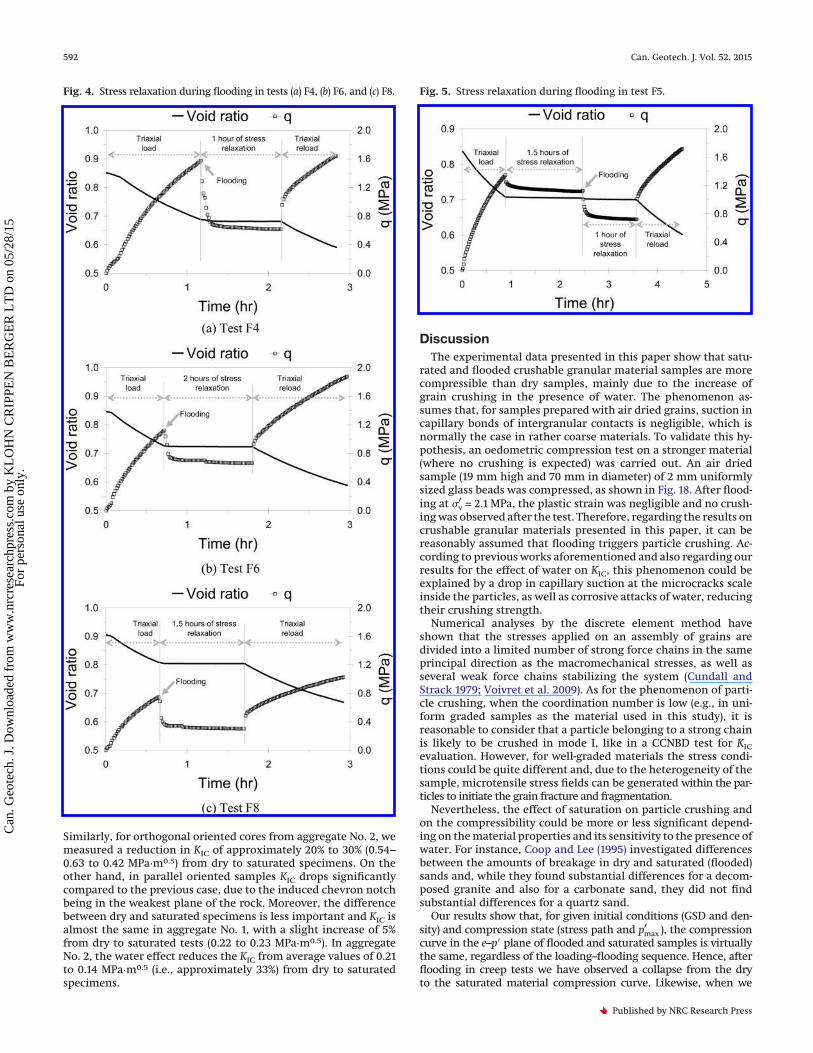
Some tests were flooded after the isotropic consolidation phaseand others after a triaxial compression up to 7% to 12% of axialstrain (�a) (see tests F4, F5, F6, and F8 in Table 1). First, the verticalstrain was stopped at a given level and then flooding was carriedout by imposing a water flow through the sample from the bottomto the top face by using a volume pressure controlled system. Backpressure was carefully maintained lower than the water level be-tween the device and the top of the sample to avoid any change inthe confining pressure. Once water started to appear on the toppipe connection of the sample, the water flow was stopped. Thisprocess took approximately 5 min. Then, a period of deviatoricstress (q = �1 − �3) relaxation of 1–2 h was applied (i.e., at bothconstant �a and �3
′ ), before a further increase of the axial strainwas imposed. The final �a for all triaxial tests was 20%. Figure 4shows the time evolution of the void ratio, e, and of the deviatoricstress, q, during the tests. It can be seen in tests F4, F6, and F8 thatthe relaxation phase leads to a significant drop of q. Similarly,there is also a slight decrease in the void ratio during the relax-ation phase, due to creep at constant �3
′ .To study separately the deviatoric stress relaxation in the dry
material and the effect of flooding, two stages of relaxation wereapplied in test F5. Firstly, the test was conducted up to �a = 10% andthen stopped for 1.5 h of stress relaxation. Then, the sample wasflooded and an extra hour of relaxation was applied. Figure 5shows the evolution in time of the void ratio and of the deviatoricstress for test F5. It can be seen that the relaxation of the drymaterial is in the order of �q = −0.23 MPa and, after the stabiliza-tion of q in the dry condition, a further decrease of q of about0.4 MPa occurred once the sample was flooded. That is to say, 1/3 of�q corresponds to the behavior of the dry material and the rest isadded after flooding, possibly because grain crushing was trig-gered in the presence of water.
Similarly, dry and flooded drained isotropic compression testsat �3
′ of 0.4 and 0.8 MPa were carried out using the same samplepreparation method as for the triaxial tests. The average void ratiowas 0.980 ± 0.088 (see tests D9 to F13 in Table 1). Isotropic testswere performed under stress controlled conditions. For a given �3
′ ,the dry sample was firstly compressed and then allowed to creepfor 1 h at constant stress (tests D9 and D10). In tests F11, F12, andF13, the samples were flooded and kept for an extra hour of creep.
Figure 6 shows the stress–strain response after the triaxial testsin terms of the stress ratio q/p= (where p= = (�1
′ + 2�3′ )/3) and the void
ratio, and Table 1 presents the breakage ratio. It can be seen that,regardless of the point of flooding, the material is more compress-
Fig. 2. 2 to 2.5 mm grains of shale quartzite sand from Trois Vallées.
Ovalle et al. 589
Published by NRC Research Press
Can
. Geo
tech
. J. D
ownl
oade
d fr
om w
ww
.nrc
rese
arch
pres
s.co
m b
y K
LO
HN
CR
IPPE
N B
ER
GE
R L
TD
on
05/2
8/15
For
pers
onal
use
onl
y.
ible after flooding. Moreover, all samples flooded at a given �3′ in a
triaxial test joined approximately the same volumetric responseand almost the same Br (i.e., the same final GSD). For instance, seeBr and the e–p= plane for tests F3 to F6 in Table 1 and Fig. 6,respectively.
Oedometer testsLoose samples of dry material were prepared at an average void
ratio of 1.018 ± 0.05 in a cylindrical oedometric device of 19 mmhigh and 70 mm of diameter (see tests D14 to F25 in Table 1). Stresscontrolled oedometric compression tests were performed usingthe following effective vertical stress levels: �v
′ = 0.15, 0.40, 0.60,0.85, 1.15, 1.50, and 2.10 MPa. To reach a given stress level, eachaforementioned stress value was allowed 1 h of strain stabiliza-tion. Thus, even if the full stabilization was not attained after 1 h,this time of creep allowed comparing the results with the previ-ous triaxial and isotropic tests. To obtain the evolution of the GSDduring crushing, the samples were unloaded at various maximumeffective stress (�v max
′ ), as shown in Table 1. The tests were per-formed for three sample conditions: dry, saturated, and flooded.In this case, a saturated material stands for a sample that wasinitially flooded, i.e., before the initial loading stage of �v
′ =0.15 MPa.
Figure 7 presents the oedometric compression curves, where itcan be seen that a good repeatability was obtained. Hence, twomain compression curves can be identified, one for the dry con-dition and the other for the saturated and flooded conditions. Forexample, tests F22, F23, F24, and F25 were flooded at �v
′ of 0.40,
0.40, 0.85, and 1.5 MPa, respectively. It can be seen that these testsfollowed the dry compression curve before flooding, and after theaddition of water they behaved in the same way as the saturatedmaterial. Then, after flooding and 1 h of creep in tests F22 and F25,�v
′ was increased up to 2.10 MPa and the compression curve fol-lowed the saturated material response. Consequently, regardlessof the point of flooding, the oedometric compression curve isunique for saturated and flooded samples. This result agreeswith the experimental evidence from the literature (Oldecop andAlonso 2003) and also with our own triaxial tests results. Figure 8presents the GSD only for oedometer tests at �v max
′ = 2.1 MPa.These results clearly show that after flooding in test F25, the ma-terial reaches almost the same GSD as the one of the saturatedsample (test S21), with more grain crushing compared to the drycase (test D18).
Creep in oedometer testsTo study the creep behavior of the material, a second series of
oedometer tests was carried out. Using the same aforementionedmethod, several loose samples at a void ratio of 1.019 ± 0.046 wereprepared. Table 2 shows a summary of the test conditions on loosesamples (test D26 to F48). The following effective vertical stresslevels were imposed: �v
′ = 0.15, 0.4, 0.8, 1.3, and 2.1 MPa. This time,the load was kept for 24 h at each level. Thus, to reach a given�v max
′ in a test, a time of 24 h of creep was allowed at each men-tioned stress level and for each test condition. Therefore, at leastthree tests for each stress level were carried out on dry, saturated,
Fig. 3. Crushed grains of quartzite shale sand after uniaxial compression test sieved between (a) 0.08 and 0.1 mm, (b) 0.315 and 0.4 mm, and(c) 0.5 and 0.6 mm.
590 Can. Geotech. J. Vol. 52, 2015
Published by NRC Research Press
Can
. Geo
tech
. J. D
ownl
oade
d fr
om w
ww
.nrc
rese
arch
pres
s.co
m b
y K
LO
HN
CR
IPPE
N B
ER
GE
R L
TD
on
05/2
8/15
For
pers
onal
use
onl
y.

and flooded samples. Moreover, some tests were repeated tocheck the repeatability of the results.
Figure 9 shows the compression curves for tests D26 to F48.Thus, the same conclusions drawn for 1 h of creep in oedometriccompression can be obtained in this case. Namely, the existenceof two separated compression curves, one for the dry material andthe other for both saturated and flooded samples, resulting in amore compressible behavior in the presence of water. Moreover,the same final GSD for saturated and flooded samples was at-tained for a given �v max
′ , as shown in Fig. 10 for �v max′ = 2.1 MPa.
This finding is consistent with our results in triaxial and previousoedometer tests results and, as far as we know, has not beenreported in the literature to this day.
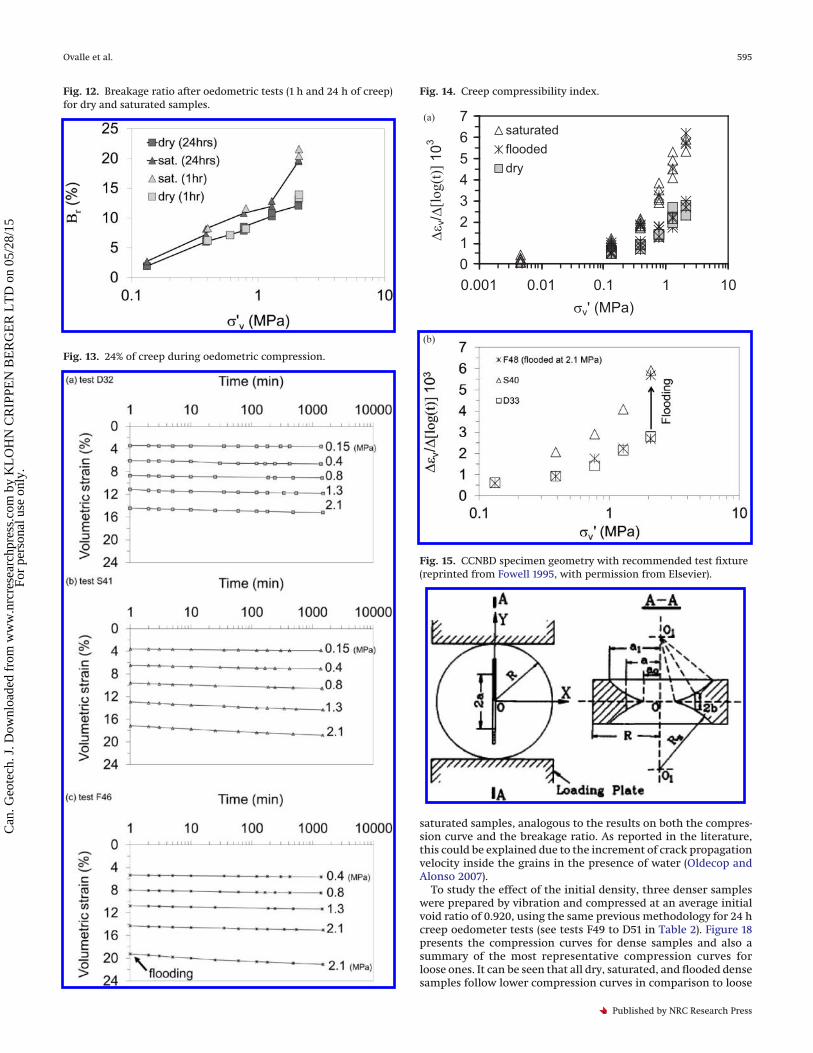
Figure 11 presents the compression curves on effective stresslog-scale for selected oedometric tests D18, S20, F22, and F25. Itcan be seen that a yielding point, normally associated to the onsetof crushing, cannot be clearly identified. In fact, as shown inFig. 12, breakage starts occurring even at the lowest stress valueused here, which means that the material behaves in an inelasticregime almost from the beginning of the test.
Figure 13 presents the volumetric strain evolution for 24 h ofcreep for (a) dry, (b) saturated, and (c) flooded samples, for everystress increment. Figure 14a presents the time dependent com-pressibility index defined as ��v/�[log(t)] (where t is time inminutes, measured from 1 min to 24 h). As shown previously byOldecop and Alonso (2007), it is clear that the dry samples have alower index and the flooded ones joined the index of the saturatedsamples after flooding. This last statement can be clearly appreci-ated in Fig. 14b for three representative tests at �v max
′ = 2.1 MPa.
Effect of water on the fracture toughness of rock samplesTo study the water effect at the source of the particle crushing
phenomenon (i.e., at the individual grain scale), we performedcrushing tests on core rock samples. We used the cracked chevronnotched Brazilian disc (CCNBD) method to obtain KIC, as sug-gested by the International Society for Rock Mechanics (Fowell
1995). This method gives consistent fracture toughness values andallows testing rock anisotropy since the crack orientations can beeasily arranged. The geometry of the CCNBD samples is shown inFig. 15, where the chevron or V-shaped notch was cut using acircular diamond saw. The notch cut along the core diametercauses crack propagation to start at the tip of the V alignment andto proceed radially outwards in a stable mode until the pointwhere the fracture toughness is evaluated (Fowell 1995).
For the quartzite shale rock tested in this study, we machinedrock cores of D = 52 mm in diameter from large rock aggregates.The cores had both parallel and orthogonal orientations with re-spect to the rock anisotropies composed by the sheeted structureof the shale rock (see Fig. 16). Rock samples with thickness of B =21.5 mm were cut from the cores. As shown in Fig. 15, the notchcharacteristic dimensions were ao = 6.53 mm, a1 = 19 mm, and Rs =19.25 mm. The fracture toughness tests were carried out using aloading frame of 50 kN of maximum capacity, driven by con-trolled displacement at 0.1 mm/s. Figure 17 shows the setup of thesample for testing, with vertical displacement sensors and forcemeasurements. The tests were performed in the same clime con-ditioned chamber used for the compression tests on granular ma-terial. We conducted tests on air-dried samples, as well as onsamples submerged in water for 24 h before testing. The coresamples were machined from two coarse rock aggregates (seeaggregate No. 2 in Fig. 16). Due to the heterogeneity of the shalerock and to clearly identify the effect of water in KIC, we compareonly the cores coming from the same aggregate.
Tables 3 and 4 present KIC values measured for orthogonal andparallel core orientations, respectively. Our tests results are in thesame order of magnitude as typical values of KIC for shale rocksreported in the literature of approximately 0.5–1.0 MPa·m0.5
(Whittaker et al. 1992; Ashby and Jones 2006). In particular, for dryorthogonal oriented cores coming from aggregate No. 1 we ob-tained KIC ≈ 1.5 MPa·m0.5 and an average reduction of approxi-mately 60% in saturated specimens with KIC ≈ 0.6 MPa·m0.5.
Table 1. Summary of triaxial, isotropic, and oedometric compression tests.
TestTestNo.
Initialvoid ratio
�v max′ or
�3′ (MPa)*
Br
(%)Wp
(MPa) Test conditions
Triaxial D1 0.933 0.80 22 0.372 DryF2 0.929 0.40 25 0.361 Flooded after isotropic consolidationF3 0.935 0.80 25 0.345 Flooded after isotropic consolidationF4 0.945 0.80 23 0.338 Flooded at �a = 12%F5 0.903 0.80 24 0.335 Flooded at �a = 10%F6 0.948 0.80 26 0.359 Flooded at �a = 8%D7 0.949 0.40 17 0.199 DryF8 0.957 0.40 18 0.195 Flooded at �a = 7%
Isotropic D9 1.069 0.40 4 0.010 DryD10 0.955 0.80 6 0.019 DryF11 0.991 0.40 4 0.009 Flooded after 1 h of creep at �3
′ = 0.4 MPaF12 0.952 0.80 8 0.018 Flooded after 1 h of creep at �3
′ = 0.8 MPaF13 0.967 0.80 7 0.025 Flooded after 1 h of creep at �3
′ = 0.8 MPaOedometric† D14 1.066 0.40 6 0.033 Dry
D15 1.015 0.60 7 0.032 DryD16 0.995 0.85 8 0.040 DryD17 1.014 2.10 13 0.118 DryD18 0.990 2.10 14 0.123 DryS19 1.035 0.40 8 0.016 Saturated (or initially flooded)S20 1.029 0.85 12 0.046 SaturatedS21 1.051 2.10 22 0.174 SaturatedF22 1.008 2.10 21 0.173 Flooded at �v
′ = 0.40 MPa and reloaded to 2.1 MPaF23 1.009 0.40 8 0.018 Flooded at �v
′ = 0.40 MPaF24 1.000 0.85 12 0.052 Flooded at �v
′ = 0.85 MPaF25 1.003 2.10 21 0.201 Flooded at �v
′ = 1.50 MPa and reloaded to 2.1 MPa
Note: Wp, plastic work.*�v max
′ for oedometric tests and �3′ for triaxial and isotropic tests.
†1 h of creep at each stress level.
Ovalle et al. 591
Published by NRC Research Press
Can
. Geo
tech
. J. D
ownl
oade
d fr
om w
ww
.nrc
rese
arch
pres
s.co
m b
y K
LO
HN
CR
IPPE
N B
ER
GE
R L
TD
on
05/2
8/15
For
pers
onal
use
onl
y.
Similarly, for orthogonal oriented cores from aggregate No. 2, wemeasured a reduction in KIC of approximately 20% to 30% (0.54–0.63 to 0.42 MPa·m0.5) from dry to saturated specimens. On theother hand, in parallel oriented samples KIC drops significantlycompared to the previous case, due to the induced chevron notchbeing in the weakest plane of the rock. Moreover, the differencebetween dry and saturated specimens is less important and KIC isalmost the same in aggregate No. 1, with a slight increase of 5%from dry to saturated tests (0.22 to 0.23 MPa·m0.5). In aggregateNo. 2, the water effect reduces the KIC from average values of 0.21to 0.14 MPa·m0.5 (i.e., approximately 33%) from dry to saturatedspecimens.
DiscussionThe experimental data presented in this paper show that satu-
rated and flooded crushable granular material samples are morecompressible than dry samples, mainly due to the increase ofgrain crushing in the presence of water. The phenomenon as-sumes that, for samples prepared with air dried grains, suction incapillary bonds of intergranular contacts is negligible, which isnormally the case in rather coarse materials. To validate this hy-pothesis, an oedometric compression test on a stronger material(where no crushing is expected) was carried out. An air driedsample (19 mm high and 70 mm in diameter) of 2 mm uniformlysized glass beads was compressed, as shown in Fig. 18. After flood-ing at �v
′ = 2.1 MPa, the plastic strain was negligible and no crush-ing was observed after the test. Therefore, regarding the results oncrushable granular materials presented in this paper, it can bereasonably assumed that flooding triggers particle crushing. Ac-cording to previous works aforementioned and also regarding ourresults for the effect of water on KIC, this phenomenon could beexplained by a drop in capillary suction at the microcracks scaleinside the particles, as well as corrosive attacks of water, reducingtheir crushing strength.
Numerical analyses by the discrete element method haveshown that the stresses applied on an assembly of grains aredivided into a limited number of strong force chains in the sameprincipal direction as the macromechanical stresses, as well asseveral weak force chains stabilizing the system (Cundall andStrack 1979; Voivret et al. 2009). As for the phenomenon of parti-cle crushing, when the coordination number is low (e.g., in uni-form graded samples as the material used in this study), it isreasonable to consider that a particle belonging to a strong chainis likely to be crushed in mode I, like in a CCNBD test for KICevaluation. However, for well-graded materials the stress condi-tions could be quite different and, due to the heterogeneity of thesample, microtensile stress fields can be generated within the par-ticles to initiate the grain fracture and fragmentation.
Nevertheless, the effect of saturation on particle crushing andon the compressibility could be more or less significant depend-ing on the material properties and its sensitivity to the presence ofwater. For instance, Coop and Lee (1995) investigated differencesbetween the amounts of breakage in dry and saturated (flooded)sands and, while they found substantial differences for a decom-posed granite and also for a carbonate sand, they did not findsubstantial differences for a quartz sand.
Our results show that, for given initial conditions (GSD and den-sity) and compression state (stress path and pmax
′ ), the compressioncurve in the e–p= plane of flooded and saturated samples is virtuallythe same, regardless of the loading–flooding sequence. Hence, afterflooding in creep tests we have observed a collapse from the dryto the saturated material compression curve. Likewise, when we
Fig. 4. Stress relaxation during flooding in tests (a) F4, (b) F6, and (c) F8. Fig. 5. Stress relaxation during flooding in test F5.
592 Can. Geotech. J. Vol. 52, 2015
Published by NRC Research Press
Can
. Geo
tech
. J. D
ownl
oade
d fr
om w
ww
.nrc
rese
arch
pres
s.co
m b
y K
LO
HN
CR
IPPE
N B
ER
GE
R L
TD
on
05/2
8/15
For
pers
onal
use
onl
y.
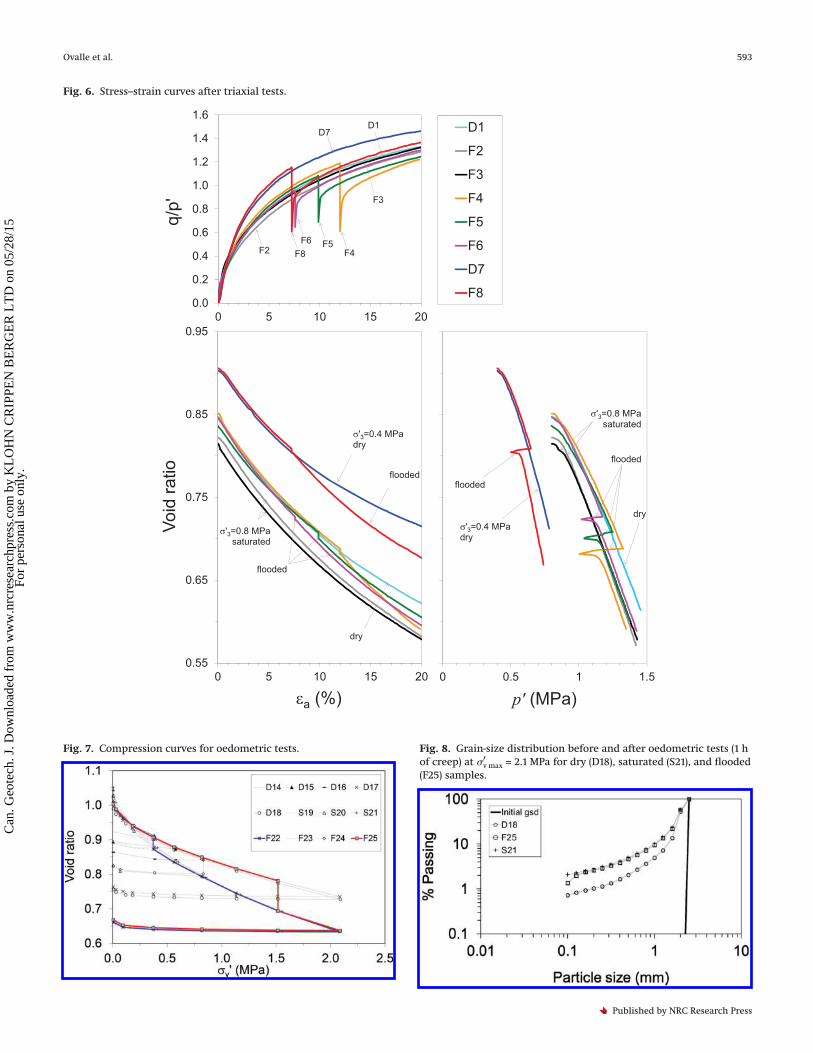
Fig. 6. Stress–strain curves after triaxial tests.
0 0.5 1 1.5
p' (MPa)
σ'3=0.8 MPa saturated
flooded
σ'3=0.4 MPa dry
flooded
dry
0.55
0.65
0.75
0.85
0.95
0 5 10 15 20
Void
ratio
εa (%)
σ'3=0.8 MPa saturated
flooded
σ'3=0.4 MPa dry
flooded
dry
0.0
0.2
0.4
0.6
0.8
1.0
1.2
1.4
1.6
0 5 10 15 20
q/p'
D1
F2
F3
F4
F5
F6
D7
F8
D7
F8F6 F5
F4F2
F3
D1
Fig. 7. Compression curves for oedometric tests. Fig. 8. Grain-size distribution before and after oedometric tests (1 hof creep) at �v max
′ = 2.1 MPa for dry (D18), saturated (S21), and flooded(F25) samples.
Ovalle et al. 593
Published by NRC Research Press
Can
. Geo
tech
. J. D
ownl
oade
d fr
om w
ww
.nrc
rese
arch
pres
s.co
m b
y K
LO
HN
CR
IPPE
N B
ER
GE
R L
TD
on
05/2
8/15
For
pers
onal
use
onl
y.

reloaded a sample previously flooded during a stress relaxationphase, the compression curves did not return to the earlier dry ma-terial response, but rather followed the one of the saturated mate-rial. As shown experimentally by Biarez and Hicher (1997) andnumerically by Voivret et al. (2007), the void ratio attained at a givenstress state is linked to the GSD: the more polydisperse the GSD is,the higher the packing density will be. Therefore, the uniqueness ofthe compression curve of saturated and flooded sand tests can beexplained because they have reached the same GSD, which wasmade possible due to grain crushing.
Moreover, the uniqueness of the mechanical response forflooded and saturated samples for a given stress path is also ob-served in the behavior under creep. The creep compressibilityindex increases with the mean stress, and, for a given stress, itsmagnitude is higher for saturated samples compared to dry ones.After flooding, this index increases to the same value obtained in
Table 2. Summary of creep tests under oedometric compression.
TestNo.
Initialvoid ratio �v max
′ (MPa) Br (%) Wp (MPa) WE/WT (%) Cs Test conditions
D26 0.998 0.15 2 0.003 0.9 0.004 DryD27 1.010 0.40 6 0.014 0.3 0.005 DryD28 1.034 0.80 8 0.037 1.1 0.004 DryD29 1.065 0.80 9 0.043 1.2 0.005 DryD30 1.014 1.30 10 0.076 1.2 0.006 DryD31 1.011 1.30 11 0.077 1.1 0.005 DryD32 1.037 2.10 12 0.000 0.1 0.006 DryD33 1.010 2.10 13 0.129 1.3 — DryS34 0.994 0.15 3 0.005 0.7 0.004 SaturatedS35 1.005 0.40 7 0.017 0.3 0.005 SaturatedS36 1.010 0.40 8 0.018 0.2 0.004 SaturatedS37 1.026 0.80 11 0.000 0.1 0.006 SaturatedS38 1.016 1.30 12 0.000 1.4 0.006 SaturatedS39 1.020 1.30 13 0.105 1.5 0.006 SaturatedS40 0.994 2.10 20 0.191 0.9 0.006 SaturatedS41 0.995 2.10 20 0.189 0.0 0.006 SaturatedF42 1.010 0.15 — 0.006 0.6 0.005 Flooded at �v
′ = 0.15 MPaF43 1.007 0.40 8 0.021 0.2 0.005 Flooded at �v
′ = 0.40 MPaF44 1.036 0.80 12 0.064 0.7 0.005 Flooded at �v
′ = 0.80 MPaF45 1.006 1.30 14 0.118 0.9 0.006 Flooded at �v
′ = 1.30 MPaF46 1.045 2.10 21 0.286 0.0 0.007 Flooded at �v
′ = 2.10 MPaF47 1.062 2.10 17 0.257 1.1 0.006 Flooded at �v
′ = 2.10 MPaF48 1.029 2.10 8 0.248 1.2 0.007 Flooded at �v
′ = 2.10 MPaF49 0.920 2.10 20 0.216 1.9 0.006 Flooded at �v
′ = 2.10 MPaS50 0.906 2.10 18 0.163 1.4 0.007 SaturatedD51 0.934 2.10 13 0.123 1.4 0.006 Dry
Note: Cs, unloading stiffness (= ��v/log(�v max′ /�v min
′ )); WE, elastic work; WT, total work.
Fig. 9. Oedometric compression curves for 24 h of creep.
Fig. 10. Grain-size distribution before and after oedometric tests(24 h of creep) at �v max
′ = 2.1 MPa for dry (D32), saturated (S40), andflooded (F47) samples.
Fig. 11. Compression curves for selected oedometric tests on log-scale.
594 Can. Geotech. J. Vol. 52, 2015
Published by NRC Research Press
Can
. Geo
tech
. J. D
ownl
oade
d fr
om w
ww
.nrc
rese
arch
pres
s.co
m b
y K
LO
HN
CR
IPPE
N B
ER
GE
R L
TD
on
05/2
8/15
For
pers
onal
use
onl
y.
saturated samples, analogous to the results on both the compres-sion curve and the breakage ratio. As reported in the literature,this could be explained due to the increment of crack propagationvelocity inside the grains in the presence of water (Oldecop andAlonso 2007).
To study the effect of the initial density, three denser sampleswere prepared by vibration and compressed at an average initialvoid ratio of 0.920, using the same previous methodology for 24 hcreep oedometer tests (see tests F49 to D51 in Table 2). Figure 18presents the compression curves for dense samples and also asummary of the most representative compression curves forloose ones. It can be seen that all dry, saturated, and flooded densesamples follow lower compression curves in comparison to loose
Fig. 12. Breakage ratio after oedometric tests (1 h and 24 h of creep)for dry and saturated samples.
Fig. 13. 24% of creep during oedometric compression.
Fig. 14. Creep compressibility index.
01234567
0.001 0.01 0.1 1 10σv' (MPa)
Δεv/ Δ[log(t)]
103
saturatedfloodeddry
(a)
(b)
Fig. 15. CCNBD specimen geometry with recommended test fixture(reprinted from Fowell 1995, with permission from Elsevier).
Ovalle et al. 595
Published by NRC Research Press
Can
. Geo
tech
. J. D
ownl
oade
d fr
om w
ww
.nrc
rese
arch
pres
s.co
m b
y K
LO
HN
CR
IPPE
N B
ER
GE
R L
TD
on
05/2
8/15
For
pers
onal
use
onl
y.
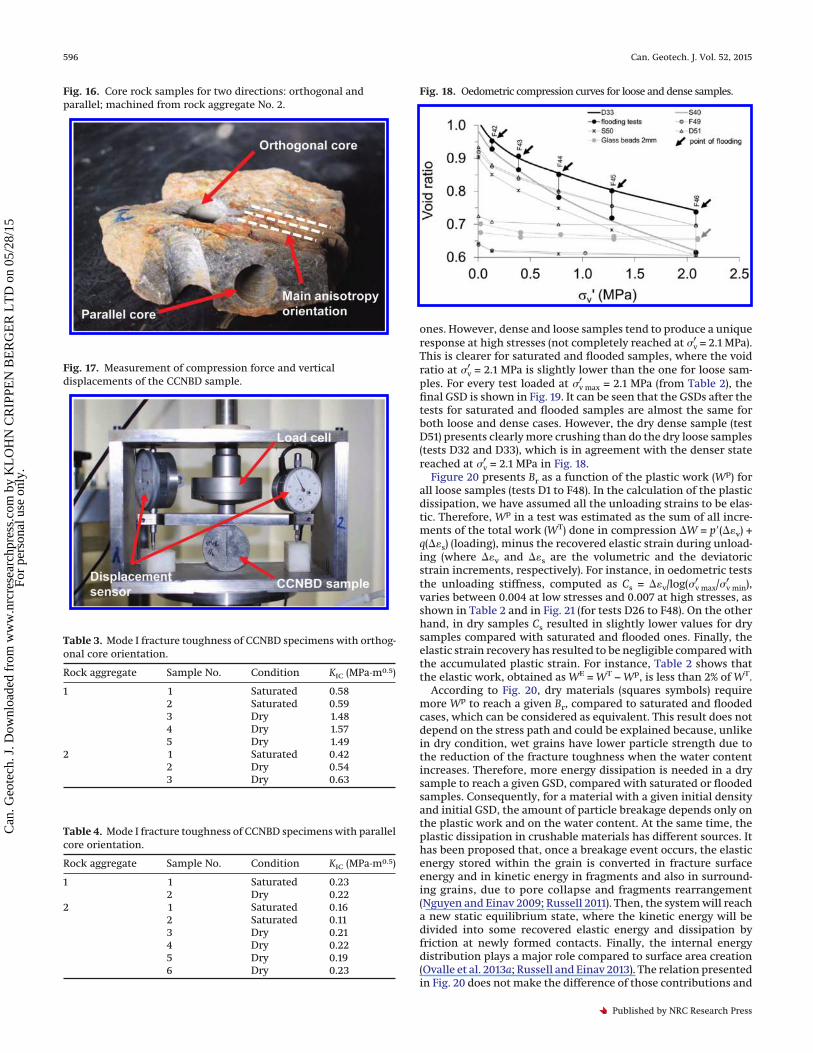
ones. However, dense and loose samples tend to produce a uniqueresponse at high stresses (not completely reached at �v
′ = 2.1 MPa).This is clearer for saturated and flooded samples, where the voidratio at �v
′ = 2.1 MPa is slightly lower than the one for loose sam-ples. For every test loaded at �v max
′ = 2.1 MPa (from Table 2), thefinal GSD is shown in Fig. 19. It can be seen that the GSDs after thetests for saturated and flooded samples are almost the same forboth loose and dense cases. However, the dry dense sample (testD51) presents clearly more crushing than do the dry loose samples(tests D32 and D33), which is in agreement with the denser statereached at �v
′ = 2.1 MPa in Fig. 18.Figure 20 presents Br as a function of the plastic work (Wp) for
all loose samples (tests D1 to F48). In the calculation of the plasticdissipation, we have assumed all the unloading strains to be elas-tic. Therefore, Wp in a test was estimated as the sum of all incre-ments of the total work (WT) done in compression �W = p=(��v) +q(��s) (loading), minus the recovered elastic strain during unload-ing (where ��v and ��s are the volumetric and the deviatoricstrain increments, respectively). For instance, in oedometric teststhe unloading stiffness, computed as Cs = ��v/log(�v max
′ /�v min′ ),
varies between 0.004 at low stresses and 0.007 at high stresses, asshown in Table 2 and in Fig. 21 (for tests D26 to F48). On the otherhand, in dry samples Cs resulted in slightly lower values for drysamples compared with saturated and flooded ones. Finally, theelastic strain recovery has resulted to be negligible compared withthe accumulated plastic strain. For instance, Table 2 shows thatthe elastic work, obtained as WE = WT − Wp, is less than 2% of WT.
According to Fig. 20, dry materials (squares symbols) requiremore Wp to reach a given Br, compared to saturated and floodedcases, which can be considered as equivalent. This result does notdepend on the stress path and could be explained because, unlikein dry condition, wet grains have lower particle strength due tothe reduction of the fracture toughness when the water contentincreases. Therefore, more energy dissipation is needed in a drysample to reach a given GSD, compared with saturated or floodedsamples. Consequently, for a material with a given initial densityand initial GSD, the amount of particle breakage depends only onthe plastic work and on the water content. At the same time, theplastic dissipation in crushable materials has different sources. Ithas been proposed that, once a breakage event occurs, the elasticenergy stored within the grain is converted in fracture surfaceenergy and in kinetic energy in fragments and also in surround-ing grains, due to pore collapse and fragments rearrangement(Nguyen and Einav 2009; Russell 2011). Then, the system will reacha new static equilibrium state, where the kinetic energy will bedivided into some recovered elastic energy and dissipation byfriction at newly formed contacts. Finally, the internal energydistribution plays a major role compared to surface area creation(Ovalle et al. 2013a; Russell and Einav 2013). The relation presentedin Fig. 20 does not make the difference of those contributions and
Fig. 16. Core rock samples for two directions: orthogonal andparallel; machined from rock aggregate No. 2.
Fig. 17. Measurement of compression force and verticaldisplacements of the CCNBD sample.
Table 3. Mode I fracture toughness of CCNBD specimens with orthog-onal core orientation.
Rock aggregate Sample No. Condition KIC (MPa·m0.5)
1 1 Saturated 0.582 Saturated 0.593 Dry 1.484 Dry 1.575 Dry 1.49
2 1 Saturated 0.422 Dry 0.543 Dry 0.63
Table 4. Mode I fracture toughness of CCNBD specimens with parallelcore orientation.
Rock aggregate Sample No. Condition KIC (MPa·m0.5)
1 1 Saturated 0.232 Dry 0.22
2 1 Saturated 0.162 Saturated 0.113 Dry 0.214 Dry 0.225 Dry 0.196 Dry 0.23
Fig. 18. Oedometric compression curves for loose and dense samples.
596 Can. Geotech. J. Vol. 52, 2015
Published by NRC Research Press
Can
. Geo
tech
. J. D
ownl
oade
d fr
om w
ww
.nrc
rese
arch
pres
s.co
m b
y K
LO
HN
CR
IPPE
N B
ER
GE
R L
TD
on
05/2
8/15
For
pers
onal
use
onl
y.

simply suggests that there is coupling between breakage dissipa-tion and plastic dissipation, since both phenomena evolve simul-taneously.
Figure 22 presents the relation between Br and the lowest voidratio attained for each test presented here (tests D1 to D51). For thematerial used here, this relation can be regarded as unique and doesnot depend on the loading condition (stress path, creep, or relax-ation) or on the test particular condition (dry, saturated or flooded).However, it should depend on the initial density and on intrinsicparameters such as the particle shape and the initial GSD. This find-ing means that, irrespective of the stress path and the water content,the granular packing at static equilibrium only depends on its GSD.
Analogically, Biarez and Hicher (1997) have shown that, for a givengrain shape, reference void ratios emax and emin are linked with theuniformity coefficient. Moreover, they stated that, to highlight theinfluence of grain crushing, it appears that the most significant pa-rameter, for a given mineralogy and grain shape, is the GSD, withnoticeable effects on the volume change amplitudes during com-pression. This evidence can be useful for constitutive modeling, sincethe prediction of the final GSD could be based on calibration testsalong only one given stress path. Moreover, constitutive modelsbased on a critical void ratio function of the amount of grain crush-ing, as in the pioneering work of Daouadji et al. (2001), could beenhanced to model the effect of water on grain crushing. Neverthe-less, only three dense samples were tested in this study. Therefore,more results are needed to assess the effect of the initial packing onthis material. For instance, Altuhafi and Coop (2010) have shown thatthe denser the initial packing is, the less amount of breakage willresult (for silica sand, carbonate sand, and basaltic sand tested inoedometric compression up to �v
′ = 30 MPa). On the other hand, theexperimental assessment of initial density effects is a complex prob-lem because during dense sample preparation some crushing even-tually occurs. Therefore, both grading and density effects could bemixed.
The results provided in this paper concern stress magnitudesthat could be of interest in civil engineering. However, for highstresses and (or) large strains, grading evolves to an ultimate dis-tribution that might be defined by a given uniformity coefficient(Bard 1993; Biarez and Hicher 1994, 1997) or by a fractal exponentof approximately D = 2.5 (Sammis et al. 1986; Coop et al. 2004).Therefore, the results shown in Figs. 20 and 22 should not beextrapolated to outlying range values.
ConclusionsWith the aim to explore and discuss the effect of water on the
mechanical behavior of crushable granular materials, we have pre-sented the results of a series of compression tests under isotropic,oedometric, and triaxial stress paths. We have compared the data ofdry, saturated, and flooded samples, to establish an empirical frame-work based on the breakage ratio. Our results show that the amountof particle crushing increases in the presence of water and, as aconsequence, the material becomes more compressible. Further-more, for a given initial density and stress path, a dry sample whenflooded reaches the equivalent behavior of an initially saturated onein terms of the compression curve, the breakage ratio and the creepcompressibility index, regardless of the point of flooding. We havealso found a unique relation between the breakage ratio and thelowest void ratio in a compression test at a given initial density,regardless of the stress path, the water content, the point of flooding,nor the time of creep or stress relaxation.
These findings could enhance future constitutive models basedon grading to predict the influence of the water content on parti-
Fig. 19. Grain-size distribution before and after oedometric tests ofloose and dense samples at �v max
′ = 2.1 MPa.
Fig. 20. Breakage ratio versus plastic work for all tests.
Fig. 21. Unloading stiffness Cs in oedometric tests.
Fig. 22. Breakage ratio versus the minimal void ratio for all tests.
Ovalle et al. 597
Published by NRC Research Press
Can
. Geo
tech
. J. D
ownl
oade
d fr
om w
ww
.nrc
rese
arch
pres
s.co
m b
y K
LO
HN
CR
IPPE
N B
ER
GE
R L
TD
on
05/2
8/15
For
pers
onal
use
onl
y.

cle breakage and time effects. This work could also be used forfurther study on water and time effects on the micromechanics ofgranular media and a better understanding of the corrosive attackof water in microcracks as a coupled phenomenon of (i) a decreaseof KIC and (ii) an increase of crack propagation velocity could beattained. The focus could be the effect of the rock mineralogy,the chemical composition of the water, and other factors of influ-ence. Moreover, it would be interesting to have a general frame-work based on measurements of the humidity retained into solidgrains. Such results could be a base for physical-based modelsdepending on suction in microcracks.
AcknowledgementsThe authors express their appreciation for the scientific collabora-
tion with Erich Bauer from Graz University of Technology. His usefulcomments and encouragement to publish our results have contrib-uted to the writing of this article. Carlos Ovalle gratefully acknowl-edges CONICYT Chile, the Embassy of France in Chile, and the financialsupportof theVicerrectoríade InvestigaciónVRI,PontificiaUniversidadCatólica de Chile, through projects PIA 2014 3519-301 and INICIO 7/2014.
ReferencesAltuhafi, F.N., and Coop, M.R. 2010. Changes to particle characteristics associ-
ated with the compression of sands. Géotechnique, 61(6): 459–471. doi:10.1680/geot.9.P.114.
Ashby, M., and Jones, D. 2006. Engineering materials 1. 3rd ed. Elsevier, Oxford.Atkinson, B.K. 1979. A fracture mechanics study of subcritical tensile cracking of
quartz in wet environments. Pure and Applied Geophysics, 117: 1011–1024.doi:10.1007/BF00876082.
Atkinson, B.K. 1982. Subcritical crack propagation in rocks: theory, experimen-tal results and applications. Journal of Structural Geology, 4(1): 41–56. doi:10.1016/0191-8141(82)90005-0.
Bard, E. 1993. Comportement des matériaux granulaires secs et a liant hy-drocarboné. Doctoral thesis, Ecole Centrale de Paris, France.
Bauer, E. 2009. Hypoplastic modelling of moisture-sensitive weathered rockfillmaterials. Acta Geotechnica, 4: 261–272. doi:10.1007/s11440-009-0099-y.
Biarez, J., and Hicher, P.Y. 1994. Elementary mechanics of soil behaviour.Balkema, Rotterdam.
Biarez, J., and Hicher, P.Y. 1997. Influence de la granulométrie et de son évolu-tion par ruptures de grains sur le comportement mécanique de matériauxgranulaires. Revue Française de Génie Civil, 1(4): 607–631.
Buscarnera, G., and Einav, I. 2012. The yielding of brittle unsaturated granularsoils. Géotechnique, 62(2): 147–160. doi:10.1680/geot.10.P.118.
Chávez, C., and Alonso, E.E. 2003. A constitutive model for crushed granularaggregates which includes suction effects. Soils and Foundations, 43(4): 215–227. doi:10.3208/sandf.43.4_215.
Coop, M.R., and Lee, I.K. 1995. The influence of pore water on the mechanics ofgranular soils. In Proceedings of the XI European Conference on Soil Mechan-ics and Foundation Engineering, Copenhagen, Danish Geotechnical Society.pp. 1.63–1.72.
Coop, M.R., Sorensen, K.K., Bodas Freitas, T., and Georgoutsos, G. 2004. Particlebreakage during shearing of a carbonate sand. Géotechnique, 54(3): 157–163.doi:10.1680/geot.2004.54.3.157.
Cundall, P., and Strack, O. 1979. A discrete numerical model for granular assem-blies. Géotechnique, 29(1): 47–65. doi:10.1680/geot.1979.29.1.47.
Daouadji, A., and Hicher, P.-Y. 2010. An enhanced constitutive model for crush-able granular materials. International Journal for Numerical and AnalyticalMethods in Geomechanics, 34(6): 555–580. doi:10.1002/nag.815.
Daouadji, A., Hicher, P.-Y., and Rahma, A. 2001. An elastoplastic model for gran-ular materials taking into account grain breakage. European Journal of Me-chanics A Solids, 20: 113–137. doi:10.1016/S0997-7538(00)01130-X.
Dunning, J.D., Petrovski, D., Schuyler, J., and Owens, A. 1984. The effects ofaqueous chemical environments on crack propagation in quartz. Journal ofGeophysical Research, 89(B6): 4115–4123. doi:10.1029/JB089iB06p04115.
Einav, I. 2007a. Breakage mechanics. Part I: Theory. Journal of the Mechanicsand Physics of Solids, 55(6): 1274–1297. doi:10.1016/j.jmps.2006.11.003.
Einav, I. 2007b. Breakage mechanics. Part II: Modelling granular materials. Jour-nal of the Mechanics and Physics of Solids, 55(6): 1298–1320. doi:10.1016/j.jmps.2006.11.004.
Fowell, R.J. 1995. Suggested method for determining mode I fracture toughnessusing Cracked Chevron Notched Brazilian disc (CCNBD) specimens. Interna-tional Journal of Rock Mechanics and Mining Sciences & Geomechanics Ab-stracts, 32(1): 57–64. doi:10.1016/0148-9062(94)00015-U.
Frossard, E., Hu, W., Dano, C., and Hicher, P.-Y. 2012. Rockfill shear strengthevaluation: a rational method based on size effects. Géotechnique, 62(5):415–428. doi:10.1680/geot.10.P.079.
Griffith, A.A. 1921. The phenomena of rupture and flow in solids. Philosophical
Transactions of the Royal Society A: Mathematical, Physical and EngineeringSciences, 221: 163–198. doi:10.1098/rsta.1921.0006.
Hardin, B.O. 1985. Crushing of soil particles. Journal of Geotechnical Engineer-ing, 111(10): 1177–1192. doi:10.1061/(ASCE)0733-9410(1985)111:10(1177).
Hu, W., Yin, Z., Dano, C., and Hicher, P.-Y. 2011. A constitutive model for granularmaterials considering grain breakage. Science China Technological Sciences,54: 2188–2196. doi:10.1007/s11431-011-4491-0.
Irwin, G. 1957. Analysis of stresses and strains near the end of a crack traversinga plate. Journal of Applied Mechanics, 24: 361–364.
Lade, P.V., Yamamuro, J.A., and Bopp, P.A. 1996. Significance of particle crushingin granular materials. Journal of Geotechnical Engineering, 122(4): 309–316.doi:10.1061/(ASCE)0733-9410(1996)122:4(309).
Lee, I.K., and Coop, M.R. 1995. The intrinsic behaviour of a decomposed granitesoil. Géotechnique, 45(1): 117–130. doi:10.1680/geot.1995.45.1.117.
Li, G., Ovalle, C., Dano, C., and Hicher, P.-Y. 2013. Influence of grain size distri-bution on critical states of granular materials. In Constitutive modeling ofgeomaterials. Edited by Q. Yang, J.-M. Zhang, H. Zheng, and Y. Yao. SpringerSeries in Geomechanics and Geoengineering. Springer, Berlin. pp. 207–210.doi:10.1007/978-3-642-32814-5_25.
Marachi, N.D., Chan, C.K., and Seed, H.B. 1972. Evaluation of properties of rock-fill materials. Journal of the Soil Mechanics and Foundation Division, ASCE,98(1): 95–114.
Marsal, R. 1973. Mechanical properties of rockfill dams. In Embankment-damengineering: Casagrande Volume. Edited by R.C. Hirschfeld and S.J. Poulos.Wiley, New York, 454 p.
McDowell, G.R., and Bolton, M.D. 1998. On the micromechanics of crushableaggregates. Géotechnique, 48(5): 667–679. doi:10.1680/geot.1998.48.5.667.
Miura, N., and O-Hara, S. 1979. Particle-crushing of a decomposed granite soilunder shear stresses. Soils and Foundations, 19(3): l–14. doi:10.3208/sandf1972.19.3_1.
Muir Wood, D., Kikumoto, M., and Russell, A.R. 2009. Particle crushing anddeformation behaviour. In Prediction and simulation methods for geohazardmitigation. Edited by F. Oka, A. Murakami, and S. Kimoto. CRC Press, London.
Nguyen., G.D., and Einav, I. 2009. The energetics of cataclasis based on breakagemechanics. Pure and Applied Geophysics, 166: 1693–1724. doi:10.1007/s00024-009-0518-x.
Oldecop, L., and Alonso, E. 2001. A model for rockfill compressibility. Géotech-nique, 51(2): 127–139. doi:10.1680/geot.2001.51.2.127.
Oldecop, L., and Alonso, E. 2003. Suction effects on rockfill compressibility.Géotechnique, 53(2): 289–292. doi:10.1680/geot.2003.53.2.289.
Oldecop, L., and Alonso, E. 2007. Theoretical investigation of the time dependentbehavior of rockfill. Géotechnique, 57(3): 289–301. doi:10.1680/geot.2007.57.3.289.
Ovalle, C. 2013. Contribution a l’étude de la rupture des grains dans les matéri-aux granulaires. Doctoral thesis, Ecole Centrale de Nantes, France. Availableat https://tel.archives-ouvertes.fr/tel-00979827 (accessed 16 January 2015).
Ovalle, C., Dano, C., and Hicher, P.-Y. 2013a. Experimental data highlighting therole of surface fracture energy in quasi-static confined comminution. Inter-national Journal of Fracture, 182(1): 123–130. doi:10.1007/s10704-013-9833-4.
Ovalle, C., Frossard, E., Dano, C., Hu, W., Maiolino, S., and Hicher, P.-Y. 2013b.The effect of size on the strength of coarse rock aggregates and large rockfillsamples through experimental data. Acta Mechanica, 225(8): 2199–2216. doi:10.1007/s00707-014-1127-z.
Ovalle, C., Voivret, C., Dano, C., and Hicher, P.-Y. 2013c. A probabilistic approachof confined comminution in polydisperse granular materials. Powders andGrains, July 8–12 2013, Sydney, Australia. AIP Conference Proceedings, 1542:903–906. doi:10.1063/1.4812078.
Russell, A.R. 2011. A compression line for soils with evolving particle and poresize distributions due to particle crushing. Géotechnique Letters, 1: 5–9.doi:10.1680/geolett.10.00003.
Russell, A.R., and Einav, I. 2013. Energy dissipation from particulate systemsundergoing a single particle crushing event. Granular Matter, 15(3): 299–314.doi:10.1007/s10035-013-0408-x.
Russell, A.R., and Khalili, N. 2004. A bounding surface plasticity model for sandsexhibiting particle crushing. Canadian Geotechnical Journal, 41(6): 1179–1192. doi:10.1139/t04-065.
Sammis, C.G., Osborne, R.H., Anderson, J.L., Banerdt, M., and White, P. 1986.Self-similar cataclasis in the formation of fault gouge. Pure and AppliedGeophysics, 124(1–2): 53–78. doi:10.1007/BF00875719.
Vesic, A.S., and Clough, G.W. 1968. Behaviour of granular materials under highstresses. Journal of the Soil Mechanics and Foundations Division, ASCE, 94(3):661–688.
Voivret, C., Radjaï, F., Delenne, J.-Y., and El Youssoufi, M.S. 2007. Space-fillingproperties of polydisperse granular media. Physical Review E, 76: 021301.doi:10.1103/PhysRevE.76.021301.
Voivret, C., Radjaï, F., Delenne, J.-Y., and El Youssoufi, M.S. 2009. Multiscale forcenetworks in highly polydisperse granular media. Physical Review Letters,102: 178001. doi:10.1103/PhysRevLett.102.178001.
Westwood, A.R.C. 1974. Tewksbury lecture: Control and application of environment-sensitive fracture processes. Journal of Materials Science, 9: 1871–1895. doi:10.1007/BF00541760.
Whittaker, B.N., Singh, R.N., and Sun, G. 1992. Rock fracture mechanics princi-ples, design and applications. Elsevier, Amsterdam.
598 Can. Geotech. J. Vol. 52, 2015
Published by NRC Research Press
Can
. Geo
tech
. J. D
ownl
oade
d fr
om w
ww
.nrc
rese
arch
pres
s.co
m b
y K
LO
HN
CR
IPPE
N B
ER
GE
R L
TD
on
05/2
8/15
For
pers
onal
use
onl
y.