Ore breakage characterisation of UG2 deposits using the JK ...
137
University of Cape Town Ore breakage characterisation of UG2 deposits using the JK RBT Christopher Chikochi A dissertation submitted to the Faculty of Engineering and the Built Environment, University of Cape Town in fulfilment of the requirements for the degree of Master of Science in Chemical Engineering. June 2017
-
Upload
khangminh22 -
Category
Documents
-
view
0 -
download
0
Transcript of Ore breakage characterisation of UG2 deposits using the JK ...
Univers
ity of
Cap
e Tow
n
Ore breakage characterisation of
UG2 deposits using the JK RBT
Christopher Chikochi
A dissertation submitted to the Faculty of Engineering and the Built Environment,
University of Cape Town in fulfilment of the requirements for the degree of Master of
Science in Chemical Engineering.
June 2017
The copyright of this thesis vests in the author. No quotation from it or information derived from it is to be published without full acknowledgement of the source. The thesis is to be used for private study or non-commercial research purposes only.
Published by the University of Cape Town (UCT) in terms of the non-exclusive license granted to UCT by the author.
Univers
ity of
Cap
e Tow
n
i | P a g e
ABSTRACT Ore breakage characterisation is a methodology that is used to determine the ore
hardness, or resistance to breakage which can be compared across a database of
different rock types. It thus develops a relationship between specific energy input and
degree of breakage which can be applied to impact breakage in comminution devices.
The present study is focussed on investigating the breakage properties of UG2
chromitite, pyroxenite, spotted anorthosite and mottled anorthosite grab samples from
run-of-mine (RoM) ore stockpile (particle selection method) and cut drill core particles
(cut core method).
A mineralogical analysis of UG2 chromitite, pyroxenite, spotted anorthosite and
mottled anorthosite was performed using Leica EZ4D optical microscope and
QEMSCAN 650F to determine their mineral composition and texture. The presence of
cracks in chromitite stockpile and cut drill core samples was also explored using a
Nikon XTH 225 ST micro-focus X-ray system. RoM ore stockpile and cut drill core
particles of each of these rock types were subjected to impact breakage in the JK
Rotary Breakage Tester (RBT). The progeny particle size distributions and degrees
of breakage of UG2 rock types obtained via the particle selection and cut core methods
were compared. Standard breakage characterization models were fitted to the
breakage data of different rock types and the relative hardness parameters compared.
It was found that UG2 chromitite comprised mainly fine, isolated, round chromite
grains in a plagioclase matrix. Pyroxenite samples were found to be made up of
granular orthopyroxene, interstitial plagioclase and clinopyroxene. The mineralogical
analysis also revealed that spotted anorthosite primarily contains plagioclase with
orthopyroxene crystals forming isolated “spots” creating a poikilitic texture. Mottled
anorthosite is made up of mainly plagioclase.
Results from breakage tests showed that the progeny particle size distributions and
the degrees of breakage for particles sourced from the RoM ore stockpile breaks into
a finer product compared to cut drill core samples. This was attributed to the presence
of cracks in the RoM ore particles as revealed by the tomographic scans. No visible
cracks were found in the cut core particle.
The ore hardness parameters were determined from fitting the breakage data to
standard impact breakage characterisation models (t10 breakage and size dependent
ii | P a g e
breakage model). Samples obtained via the particle selection method were
consistently found to offer less resistance to impact breakage as shown by the higher
Axb values compared to the cut drill core samples. Using the ore hardness classes
presented by Napier-Munn et al (1999), UG2 chromitite, spotted anorthosite, mottled
anorthosite and pyroxenite were thus classified as very soft, soft to very soft, soft to
very soft and medium to soft respectively.
The hardness indicator, 3600.M.fmat.x, for each size class determined using the
parameters obtained from the size dependent breakage model decrease with an
increase in the parent particle size. This shows that particles become more resistant
to impact breakage as the initial particle size increases. However, for pyroxenite,
spotted and mottled anorthosite, the indicator decreases between the particle sizes 14
to 28.6 mm but then increases for 41.1 mm.

iii | P a g e
PLAGIARISM DECLARATION I declare that this dissertation, submitted for the degree of Master of Science in
Chemical Engineering at the University of Cape Town is my own work, and has not
been submitted prior to this for any degree at this university or any other institution.
I know the meaning of plagiarism and declare that all the work in the document, save
for that which is properly acknowledged, is my own.
This thesis/dissertation has been submitted to the Turnitin module (or equivalent
similarity and originality checking software) and I confirm that my supervisor has seen
my report and any concerns revealed by such have been resolved with my supervisor.
Signature:
Date: 03th of April 2017
Signature Removed
iv | P a g e
TABLE OF CONTENTS ABSTRACT ................................................................................................................. i
PLAGIARISM DECLARATION ................................................................................... iii
ACKNOWLEDGEMENTS ........................................................................................ viii
List of Figures ............................................................................................................. ix
List of Tables ............................................................................................................ xiii
List of Abbreviations .................................................................................................. xv
Symbols and Nomenclature ..................................................................................... xvi
1. Introduction ......................................................................................................... 1
1.1 Background of the research .......................................................................... 1
1.2 Research objectives ...................................................................................... 3
1.3 Scope of project ............................................................................................ 3
1.4 Thesis Structure ............................................................................................ 4
2. Literature Review ................................................................................................ 5
2.1 Brief background to comminution research ................................................... 5
2.2 Particle breakage .......................................................................................... 6
2.2.1 Rock mechanics ..................................................................................... 7
2.2.2 Fracture mechanics ................................................................................ 8
2.3 Mechanisms of particle breakage ................................................................ 10
2.3.1 Patterns in particle breakage ................................................................ 11
2.3.2 Rock breakage in AG/SAG mills ........................................................... 12
2.4 Single particle breakage tests ..................................................................... 14
2.4.1 Drop weight tester ................................................................................ 16
2.4.2 Split Hopkinson pressure bars .............................................................. 17
2.4.3 Impact load cell ..................................................................................... 18
2.4.4 JK Rotary Breakage Tester .................................................................. 19
2.5 Ore breakage characterisation .................................................................... 22
v | P a g e
2.5.1 Effect of input energy on the resultant breakage .................................. 22
2.5.2 Effect of particle size on the resultant breakage ................................... 23
2.6 Standard impact breakage characterisation models ................................... 24
2.6.1 t10 breakage model ............................................................................... 24
2.6.2 Size dependent breakage model .......................................................... 28
2.7 Process mineralogy ..................................................................................... 30
2.7.1 Ore texture ............................................................................................ 30
2.7.2 Characterisation of ore bodies .............................................................. 31
2.7.3 Common devices employed in process mineralogy .............................. 31
2.8 Mineralogy of the Bushveld Complex ores .................................................. 32
2.9 Summary of literature and hypothesis ......................................................... 36
3. EXPERIMENTAL PROGRAMME ...................................................................... 37
3.1 Introduction ................................................................................................. 37
3.2 Materials and sample preparation for RBT tests ......................................... 38
3.2.1 Experimental apparatus ........................................................................ 38
3.2.2 Type of ores .......................................................................................... 39
3.2.3 Sourcing the ore ................................................................................... 39
3.2.4 Sizing particles for RBT tests ................................................................ 41
3.3 Experimental Procedure .............................................................................. 44
3.3.1 Single impact breakage tests using the RBT ........................................ 44
3.3.2 Product Analysis: Screening ................................................................. 47
3.4 Mineralogical Analysis ................................................................................. 48
3.4.1 Sample preparation .............................................................................. 48
3.4.2 Optical microscope ............................................................................... 49
3.4.3 QEMSCAN Analysis ............................................................................. 49
3.4.4 X-ray computed tomography (XCT) analysis ........................................ 50
4. RESULTS AND DISCUSSION .......................................................................... 53
vi | P a g e
4.1 Introduction ................................................................................................. 53
4.2 Mineralogical analysis of the rock tested ..................................................... 54
4.2.1 UG2 Chromitite ..................................................................................... 54
4.2.2 UG2 Pyroxenite .................................................................................... 55
4.2.3 UG2 Spotted Anorthosite ...................................................................... 57
4.2.4 UG2 Mottled Anorthosite ...................................................................... 58
4.3 Progeny particles ........................................................................................ 60
4.4 Progeny particle size distributions ............................................................... 60
4.4.1 Progeny particle size distribution for particle selection method (PSM) and
cut core method (CCM) ..................................................................................... 61
4.4.2 Progeny particle size distributions of the main rock types .................... 65
4.4.3 Effect of energy input on progeny particle size distributions ................. 68
4.5 Degree of breakage (t10) ............................................................................. 68
4.5.1 Comparison of the t10 for particle selection and cut core methods........ 68
4.5.2 Comparison of the t10 for the main rock types....................................... 71
4.5.3 Effect of energy input on the degree of breakage ................................. 73
4.6 Energy – size relationships ......................................................................... 75
4.6.1. t10 breakage model ............................................................................... 75
4.6.2. Size dependent breakage model .......................................................... 80
4.7 Summary of the key findings ....................................................................... 85
5. CONCLUSIONS AND RECOMMENDATIONS ................................................. 87
5.1 Conclusions................................................................................................. 87
5.1.1 Mineralogical composition and texture of UG2 samples ....................... 87
5.1.2 Progeny particle size distributions and the degrees of breakage .......... 88
5.1.3 Relative hardness parameters of the different rock types ..................... 89
5.2 Recommendations ...................................................................................... 90
REFERENCES ......................................................................................................... 91
vii | P a g e
A. APPENDIX A..................................................................................................... 99
1.1 Raw Data .................................................................................................... 99
B. APPENDIX B................................................................................................... 110
2.1 Calculations............................................................................................... 110
C. APPENDIX C .................................................................................................. 112
3.1 Particle size distributions ........................................................................... 112
3.1.1 UG2 Chromitite ................................................................................... 112
3.1.2 UG2 Pyroxenite .................................................................................. 113
3.1.3 UG2 Spotted Anorthosite .................................................................... 114
3.1.4 UG2 Mottled Anorthosite .................................................................... 115
D. APPENDIX D .................................................................................................. 116
4.1 Degree of breakage (t10 parameters) ........................................................ 116
E. APPENDIX E................................................................................................... 118
5.1 UG2 Spotted anorthosite ........................................................................... 118
5.2 UG2 Mottled anorthosite ........................................................................... 119

viii | P a g e
ACKNOWLEDGEMENTS I would like to express my sincere gratitude to my supervisors, Dr Lawrence Bbosa
and Professor Aubrey Mainza for their unparalleled supervision, support,
encouragement, suggestions and advice throughout the study.
I would also like to thank the Department of Chemical Engineering (University of Cape
Town) for their financial support. This project would not have been a success without
them.
My sincere appreciation is extended to Lonmin Platinum for their support and providing
the facility, equipment and material for a large part of the test work. Special mention
goes to Phil Mostert, Kaja Tshimanga, Victor Ross, Nomonde Solomon and the team
at the Concentrator's Technical Centre.
To Dr Megan Becker, Lunga Bam, Gaynor Yorath and Silvio Elias, I am really grateful
for your assistance and support with the mineralogical studies of this work. I would
also like to thank CMR for the support throughout my experimental work
My utmost gratitude goes to my parents (Mr & Mrs Chikochi), siblings (Tendai,
Ozasala, David and Bridget) and family members for the continuous support and
believing in me always. I would also like to thank my friends for their moral support
and encouragement. A special mention goes to Tafadzwa Marozva, Thembeka
Ncube, Veronica Munyongani and Wonder Chimonyo. To Stacey (Ruvimbo), may you
be a source of happiness in our lives forever. To my lovely wife, Patience, thank you
for being patient and supportive throughout this work.
Above all I would like to thank God Almighty for making all things possible.
“Tinongoti Ebenezer, Jehovah matisvitsa pano”
ix | P a g e
List of Figures Figure 2-1: Idealised stress-strain relationship for a cylindrical sample of rock under
uniaxial compression (Napier-Munn et al., 1996). ...................................................... 7
Figure 2-2: Lines of force and local stress variation from a body with sharp crack
(Ashby, Shercliff & Cebon, 2007) ............................................................................... 9
Figure 2-3: Principal breakage mechanism (adapted from Napier-Munn et al., 1996;
King, 2001) ............................................................................................................... 10
Figure 2-4: Fracture pattern in a two phase ore (adapted from Vassiliev et al (2008))
................................................................................................................................. 11
Figure 2-5: Schematic diagram of AG/SAG mill process mechanisms (Morrell et al.,
1996) ........................................................................................................................ 12
Figure 2-6: Different modes of single particle breakage tests (Tavares, 2007) ........ 14
Figure 2-7: Schematic diagram of the drop weight tester (Tavares, 2007). .............. 16
Figure 2-8: Schematic diagram of the Split Hopkinson pressure bars (adapted from
Huang et al., 2014) ................................................................................................... 17
Figure 2-9: A schematic diagram of the impact load cell (Tavares, 2007). ............... 18
Figure 2-10: A labelled systematic diagram of the JK Rotary Breakage Tester
prototype (adapted from Shi et al., 2006) ................................................................. 19
Figure 2-11: Sketch of the velocity components of a particle being ejected from the
rotor (adapted from (Shi & Kojovic, 2011) ................................................................ 20
Figure 2-12: Relationship between the product of parameters A and b and the particle
size for materials without regular size effect (redrawn by Shi and Kojovic (2007) after
Banini (2000)). .......................................................................................................... 24
Figure 2-13: Relationship between the parameter t10 and specific input energy (Ecs or
Eis) (adapted from Tavares, 2007). ........................................................................... 25
Figure 2-14: Example of (a) t10 against Ecs and (b) t10 against fmat.x.k (Ecs-Emin) curves
(Shi & Kojovic, 2007). ............................................................................................... 29
Figure 2-15: Map of the Bushveld Complex in South Africa (centre), showing the
different mining operations in the northern, western and eastern limbs (exploded
views) (Cawthorn, 1999) .......................................................................................... 33
Figure 2-16: Stratigraphy of Karee mine in the Western limb of the Bushveld Complex
................................................................................................................................. 35
x | P a g e
Figure 3-1: Schematic design for the impact breakage experiments ........................ 37
Figure 3-2: Images showing (a) run-of-mine ore from Karee 3 UG2 mine being
deposited on the stockpile (b) sample collection from Karee 3 stockpile. ................. 39
Figure 3-3: Gilson vibrating screen shaker used in sizing of particle for breakage in the
RBT .......................................................................................................................... 40
Figure 3-4: Images of (a) -16.0 +13.2 mm and (b) -31.5 + 26.5 mm size classes for
chromitite samples collected via the cut core method .............................................. 40
Figure 3-5: Rotary divider used to split particles ...................................................... 41
Figure 3-6: Trays containing sets of particles of different size fraction ..................... 42
Figure 3-7: JK RBT sample preparation and testing protocol (adapted from JKMRC
Rotary Breakage Tester, 2012) ................................................................................ 43
Figure 3-8: JK Rotary Breakage Tester (RBT) installed at the Lonmin Concentrators
Technical Centre in Marikana with the lid in closed (a) and open (b) positions ........ 44
Figure 3-9: Touch screen control panel for the JK RBT ........................................... 45
Figure 3-10: Operator feeding ore samples to the RBT through a hand driven feeder
................................................................................................................................. 46
Figure 3-11: Brushing down the anvils, around the rotor into the collection bin ....... 46
Figure 3-12: Endecells D50 vibrating sieve shaker packed with a deck of root 2 series
of screens ................................................................................................................. 47
Figure 3-13: Leica EZ4 D optical microscope ........................................................... 49
Figure 3-14: (a) QEMSCAN 650F installed at the University of Cape Town (UCT) (b)
Sample block holder with 30 mm sample disks ........................................................ 50
Figure 3-15: Micro-focus X-ray machine at the MIXRAD facility at Necsa (Hoffman &
Beer, 2011) .............................................................................................................. 51
Figure 3-16: The basic layout of the XCT system .................................................... 51
Figure 4-1: Optical microscope (a) and QEMSCAN false colour images (b) for a UG2
chromitite .................................................................................................................. 54
Figure 4-2: Bulk mineralogy of a UG2 chromitite specimen ..................................... 55
Figure 4-3: Optical microscope (a) and QEMSCAN false colour images (b) for a UG2
pyroxenite ................................................................................................................. 56
Figure 4-4: Bulk mineralogy of a UG2 pyroxenite specimen .................................... 56
Figure 4-5: Optical microscope (a) and QEMSCAN false colour images (b) for a UG2
spotted anorthosite ................................................................................................... 57
Figure 4-6: Bulk mineralogy of a UG2 spotted anorthosite specimen ...................... 58
xi | P a g e
Figure 4-7: Optical microscope (a) and QEMSCAN false colour images (b) for a UG2
mottled anorthosite ................................................................................................... 58
Figure 4-8: Bulk mineralogy of a UG2 mottled anorthosite specimen ...................... 59
Figure 4-9: Parent (a) and progeny (b) particles of UG2 chromitite .......................... 60
Figure 4-10: Progeny particle size distributions for small (-16.0 + 13.2 mm) and large
(-31.5 + 26.5 mm) UG2 chromitite ............................................................................ 61
Figure 4-11: Progeny particle size distributions for small (-16.0 + 13.2 mm) and large
(-31.5 + 26.5 mm) UG2 pyroxenite ........................................................................... 62
Figure 4-12: 3D tomography images for (a) RoM and (b) cut drill core UG2 chromitite
-31.5 + 26.5 mm specimens ..................................................................................... 63
Figure 4-13: 2D tomography images for (a) RoM and (b) cut drill core UG2 chromitite
-31.5 + 26.5 mm specimens ..................................................................................... 63
Figure 4-14: 3D tomography images for (a) RoM and (b) cut drill core UG2 chromitite
- 16 + 13.2 mm specimens ....................................................................................... 64
Figure 4-15: 2D tomography images for (a) RoM and (b) cut drill core UG2 chromitite
- 16 + 13.2 mm specimens ....................................................................................... 64
Figure 4-16: Progeny particle size distributions of the UG2 abundant rock types .... 66
Figure 4-17: Comparison of the t10 for UG2 chromitite obtained using the particle
selection and cut core method ................................................................................. 70
Figure 4-18: Comparison of the t10 for UG2 pyroxenite obtained using the particle
selection and cut core method ................................................................................. 70
Figure 4-19: Effect of input energy on the degree of breakage of various UG2 rock
deposits for small (-16.0 + 13.2 mm) particles.......................................................... 73
Figure 4-20: Effect of input energy on the degree of breakage of various UG2 rock
deposits for large (-31.5 + 26.5 mm) particles. ......................................................... 74
Figure 4-21: t10 breakage model fitting to the t10-Ecs data for UG2 chromitite rock
particles .................................................................................................................... 76
Figure 4-22: t10 breakage model fitting to the t10-Ecs data for UG2 pyroxenite rock
particles .................................................................................................................... 76
Figure 4-23: Measured vs predicted t10 values for the RBT products of UG2 chromitite
particles from RoM ore stockpile using the t10 breakage model ............................... 79
Figure 4-24: Size dependent breakage model fitting to the particle selection and cut
core breakage data for UG2 chromitite ................................................................... 81
xii | P a g e
Figure 4-25: Size dependent breakage model fitting to the particle selection and cut
core breakage data for UG2 pyroxenite .................................................................. 81
Figure 4-26: Predicted vs measured t10 values for the RBT products of UG2 chromitite
particles from RoM ore stockpile using the size dependent breakage model ........... 83
Figure B-1: Schematic diagram showing the mass retained on each screen ......... 110
Figure C-1: Product size distribution for small and large chromitite particles ......... 112
Figure C-2: Product size distribution for small and large UG2 pyroxenite particles 113
Figure C-3: Product size distribution for small and large UG2 spotted anorthosite
particles .................................................................................................................. 114
Figure C-4: Product size distribution for small and large UG2 mottled anorthosite
particles .................................................................................................................. 115
Figure E-1: t10 breakage model fitting to the t10-Ecs data for UG2 spotted anorthosite
rock particles .......................................................................................................... 118
Figure E-2: Size dependent breakage model fitting to the particle selection and cut
core breakage data for UG2 spotted anorthosite .................................................. 118
Figure E-3: t10 breakage model fitting to the t10-Ecs data for UG2 mottled anorthosite
rock particles .......................................................................................................... 119
Figure E-4: Size dependent breakage model fitting to the particle selection and cut
core breakage data for UG2 mottled anorthosite .................................................. 119
xiii | P a g e
List of Tables Table 2-1: Reported ranges of Axb values impact breakage parameters (Napier-Munn
et al., 1999). ............................................................................................................. 26
Table 2-2: Typical breakage parameters for the main platinum ores from the Bushveld
complex (Mainza & Powell, 2006) ............................................................................ 34
Table 3-1: Impact breakage tests at different energy levels ..................................... 44
Table 3-2: RBT rotor speeds for standard breakage energies ................................. 45
Table 3-3: Scanning parameters for the mineralogical analysis using the QEMSCAN
................................................................................................................................. 50
Table 3-4: Experimental conditions used for XCT measurements ........................... 52
Table 4-1: t10 values obtained for the UG2 main rock types ..................................... 72
Table 4-2: Ore hardness parameters, A , b and Axb for the UG2 chromitite, pyroxenite,
spotted anorthosite and mottled anorthosite determined using the t10 model ........... 77
Table 4-3: Ore breakage parameters for the tested UG2 rock types determined by
fitting the breakage data to the size dependent model ............................................. 82
Table 4-4: Ore breakage parameters for the tested UG2 rock types determined by
fitting the breakage data to the size dependent model ............................................. 84
Table A-1: Breakage data for UG2 Chromitite RoM ore sample run 1 showing the mass
retained on the standard screens ............................................................................. 99
Table A-2: Breakage data for UG2 Chromitite RoM ore sample run 2 showing the mass
retained on the standard screens ........................................................................... 100
Table A-3: Breakage data for UG2 Chromitite RoM ore sample run 3 showing the mass
retained on the standard screens ........................................................................... 101
Table A-4: Breakage data for UG2 Chromitite drill core sample run 1 showing the mass
retained on the standard screens ........................................................................... 102
Table A-5: Breakage data for UG2 pyroxenite RoM ore sample run 1 showing the mass
retained on the standard screens ........................................................................... 103
Table A-6: Breakage data for UG2 pyroxenite RoM ore sample run 2 showing the mass
retained on the standard screens ........................................................................... 104
Table A-7: Breakage data for UG2 pyroxenite drill core sample run 1 showing the mass
retained on the standard screens ........................................................................... 105
Table A-8: Breakage data for UG2 spotted anorthosite RoM ore sample showing the
mass retained on standard screens ....................................................................... 106

xiv | P a g e
Table A-9: Breakage data for UG2 spotted anorthosite drill core sample showing the
mass retained on standard screens ....................................................................... 107
Table A-10: Breakage data for UG2 mottled anorthosite RoM ore sample showing the
mass retained on standard screens ....................................................................... 108
Table A-11: Breakage data for UG2 mottled anorthosite drill core sample showing the
mass retained on standard screens ....................................................................... 109

xv | P a g e
List of Abbreviations DWT Drop Weight Tester
SHPB Split Hopkinson Pressure Bars
UFLC Ultrafast Load Cell
RBT Rotary Breakage Tester
XRD X-ray Diffractometry
SEM Scanning Electrons Microscope
EDX Energy Dispersive X-ray
BSE Back Scattered Electron
QEMSCAN Quantitative Evaluation of Minerals with Scanning
Electron Microscopy
MLA Mineral Liberation Analyser
UCT University of Cape Town
CSIRO Commonwealth Scientific and Industrial Research
Organisation
JKMRC Julius Kruttschnitt Mineral Research Centre
RBT Julius Kruttschnitt Rotary Breakage Tester
PSM Particle Selection Method
CCM Cut Core Method
UG2 Upper Group 2
PGM Platinum Group Mineral
BMS Base Metal Sulphides

xvi | P a g e
Symbols and Nomenclature Ek kinetic energy
m mass of the particle
Vi velocity of the particle prior to impact
Ecs specific input energy (kWh/t)
r rotor radius (m)
N rotor speed (rpm)
C velocity constant
t10 size distribution ‘fineness’ index
A and b impact breakage parameters
Esv volumetric specific input energy (kWh/m3)
d particle size (mm)
α∞, βm and n three model parameters fitted to the drop weight test data
fmat material breakage property (kg J−1 m−1)
x initial particle size(m)
Wm,kin mass-specific kinetic impact energy (J kg−1)
Wm,min threshold energy below which breakage does not occur(J
kg−1)
k successive number of impacts with the single impact
energy
M maximum t10 for a material subject to breakage (%)
Emin threshold energy (J kg−1)
Dn∗ “damage” or fractional reduction in particle
γ specific strain energy absorbed by particle
En−1 energy required to disintegrate particle
Chapter 1: Introduction
1 | P a g e
1. INTRODUCTION
1.1 Background of the research
In most mineral processing circuits, comminution devices such as crushers, tumbling
mills and grinding rolls are employed in the size reduction of run-of-mine (RoM) ore to
liberate valuable minerals (Wills & Napier-Munn, 2006). Particulate materials in these
devices are fractured primarily by impact (Kapur et al., 1997; Crabtree et al., 1964).
This mode of breakage determines the throughput for circuits which employ these
devices (Napier-Munn et al., 1996). Impact breakage is induced through rapid
application of compressive stress as normal forces to the particle surface resulting in
disintegrative fracture (body breakage) (King, 2001).
It has been well established by many authors that comminution devices consumes
relatively high amounts of energy (Fuerstenau & Abouzeid, 2002; Napier-Munn et
al., 1996; Schoenert, 1986). Cohen (1983) estimated that 30-50% of the total power
draw of most mineral processing plants is consumed by comminution devices. As a
consequence, the power costs associated with the comminution process usually forms
more than half of many mineral processing plants’ capital and operating cost (Morrell
at al., 1991).
The principal reason for the high energy consumption is that comminution devices are
typically inefficient in their use of energy (Umucu et al., 2013; Napier-Munn et al.,
1996). Considerably more energy is consumed in driving and operating the equipment
rather than in the breakage of the particles (Tavares & King, 1998). The energy that is
used in size reduction is estimated to be the range of 0.1 to 5% of the supplied energy
(Cleary, 1998). Napier-Munn et al (1996) also pointed out that ore particles must be
heavily stressed to break into smaller fragments and this process requires large
amounts of energy.
In addition, Bueno et al (2013) and Hahne et al (2003) reported that run-of-mine ore
composition strongly affects the performance (energy consumption and target grind)
in the comminution circuits. One of the key factors influencing the performance that
can be achieved with respect to each ore type in comminution devices is its hardness
or resistance to breakage (Napier-Munn et al., 1996).
Chapter 1: Introduction
2 | P a g e
Ore hardness, which results from the mineralogy and the minerals grain structure of
the ore body, largely affects the time ore particles spend (residence time) in the
comminution devices. Hard ores typically limit the mill throughput, due to slower
breakdown characteristics. This consequently results in material build-up in the mill
which detrimentally impacts the mill power (Bueno et al., 2013). Softer ores affect the
product size distribution because they comminute readily to generate more fines.
The Bushveld complex in South Africa is the world’s largest source of Platinum Group
Minerals (PGMs). It contains approximately 80% of the world’s reserves of PGMs
(Liddell et al., 1986). There are three distinct PGMs bearing ore bodies within the
Bushveld complex namely the Merensky reef, Upper Group 2 (UG2) reef and Platreef
(Cramer, 2001).
Ore breakage characterisation is one of the fundamental areas in comminution
research in optimising the energy available for breakage (Bourgeois & Banini, 2002).
It aims to establish the relationship between specific energy input and resultant
product size through various types of laboratory tests on a given ore (Napier-Munn et
al., 1996). Rock breakage devices such as the drop weight tester (Napier-Munn et al.,
1996), impact load cell (Bourgeois & Banini, 2002), split Hopkinson pressure bars
(Hopkinson, 1914) and rotary breakage tester (Shi et al., 2009) have been developed
to conduct single-particle breakage tests.
Of relevance to this study is the Julius Kruttschnitt Rotary Breakage Tester (RBT). The
RBT was developed as part of an AMIRA P9N project by the JKTech to complement
the drop weight tester as an ore breakage characterisation device (Shi et al., 2006). It
can be used to assess the amenability of ores to breakage via impact (Shi et al., 2009)
The RBT overcomes several noted limitations of the drop weight tester, such as the
lengthy time required to conduct tests and the limited range of input energies
attainable (Kojovic et al., 2008)..
As pointed out by Bueno et al (2013), that ore composition to the comminution circuits
strongly affects the energy consumption and target grind, there have been attempts
by researchers such as Van Eck (2007), Mainza & Powell (2006) to develop a
relationship between specific energy input and resultant product of UG2 ore using the
drop weight tester. However, these studies did not conduct tests per rock type from
the UG2 deposit thus a need to characterise the rock types found in the UG2 ore.
Chapter 1: Introduction
3 | P a g e
Based on the aforementioned background, this study seeks to investigate the ore
breakage behaviour of UG2 abundant rock types sourced from RoM stockpile and cut
drill core particles. The RBT is used as a characterisation device based on the
standard breakage testing procedure.
1.2 Research objectives
The main objectives of this project are to:
• Select and group the abundant rock types (chromitite, pyroxenite, spotted
anorthosite and mottled anorthosite) from the UG2 RoM ore and drill core
samples on the bases of visible physical characteristics such as colour, texture,
grain size and composition (lithology).
• Determine and compare the mineralogical composition and texture of UG2
chromitite, pyroxenite, spotted anorthosite and mottled anorthosite.
• Conduct standard impact breakage characterisation tests using a Rotary
Breakage Tester for the abundant UG2 rock types collected from the RoM ore
stockpile (particle selection method) and cut drill core samples (cut core
method).
• Determine and compare the product size distribution and the degree of
breakage of UG2 chromitite, pyroxenite, spotted anorthosite and mottled
anorthosite obtained via the particle selection and cut core methods.
• Fit standard impact breakage characterization models to the breakage data of
the abundant rock types.
• Compare the relative hardness parameters of the different rock types, as
determined by the fitted models.
1.3 Scope of project
This research project will be limited to ore breakage characterisation of UG2 rock types
via impact. The work will characterize different UG2 rock types in terms of their
amenability to impact breakage using the RBT. It is well known that run-of-mine ore
composition affect the mill power draw and the resultant product distributions.
Mineralogical analysis will be done to establish a link between the mineralogical
properties of the rocks and their breakage characteristics. Ore hardness parameters
will be determined from fitting the breakage data for the different rock types in the UG2
ore to standard impact breakage characterisation models. A comparison of ore
Chapter 1: Introduction
4 | P a g e
hardness parameters showing the responsiveness to breakage of samples collected
from the RoM ore stockpile and cut drill core particles will be made.
1.4 Thesis Structure
This thesis is structured into five chapters followed by references and appendices. An
overview of each chapter is presented in this section.
Chapter One: Introduction
An introduction to comminution research is presented highlighting the energy
inefficiencies in comminution devices and how ore breakage characterisation is useful
in the optimisation of the available energy for breakage. The research objectives and
the scope of the study are also outlined in this chapter.
Chapter Two: Literature Review
Chapter two gives a review of the literature pertinent to this study. It concludes by
presenting the key findings of the literature review and the proposed hypothesis.
Chapter Three: Experimental Methods
The experimental methodology used to test the validity of the proposed hypothesis is
given in this chapter. A description of the materials used, types of ores, sampling
methods and equipment used in the study are also given in detail. The conditions and
operating procedures are also outlined in this chapter.
Chapter Four: Results and Discussion
Chapter four presents and discusses the results of the experimental work. The
mineralogy of the main rock types from the UG2 deposit is presented. The progeny
particle size distributions resulting from impact breakage in the RBT and energy-size
relationships for each rock type obtained using the two sampling techniques are also
presented and discussed.
Chapter Five: Conclusions and Recommendations
This chapter summarises the key findings of this research as well as the
recommendations for future studies. The objectives of the study presented in chapter
one are revisited as well as the hypothesis proposed to determine if they were
addressed.
Chapter 2: Literature Review
5 | P a g e
2. LITERATURE REVIEW Overview
A review of the literature relevant to the research is presented in this section. Particle
breakage research, single particle breakage tests and experimental techniques
developed to carry out impact breakage characterisation experiments are briefly
reviewed. Also, the standard hardness characterisation models that have been put
forward are explored. A review of the mineralisation for the Bushveld Complex
specifically for UG2 will also be made. This chapter concludes with summarising the
key findings from the literature and presenting the proposed hypothesis.
2.1 Brief background to comminution research
Comminution is the progressive reduction of solid materials from one average particle
size to a smaller one (Tavares & King, 1998). In minerals processing, the comminution
of rocks that contain valuable minerals (ore) is accomplished through blasting,
crushing and grinding. Blasting is achieved via ignition of explosives to remove ores
from their natural beds and reduces the in situ rock to a size that is readily
transportable (Yahyaei et al., n.d.). Also, blasting usually pre-weakens rock particles,
probably due to increase in micro-crack intensity (Napier-Munn, 2014). Alternative
mining methods such as rock cutting technology are being sought to replace
conventional drilling and blasting (Van Den Berg, 2014). Rock cutting technology
involves excavating ore along the reef containing valuable mineral from the rock bed.
This will result in less gangue material being processed thus increasing productivity
(Pickering & Ebner, 2001).
Most minerals are finely scattered in an ore body and are primarily separated from
gangue (liberated) by crushing and grinding (Wills & Napier-Munn, 2006). Crushing
and grinding rely on mechanical techniques to comminute the run-of-mine ore (ore
entering the mill from the mine).
Industrial comminution processes are well known to be energy inefficient (Umucu et
al., 2013). Devices such as crushers, tumbling mills and grinding rolls are installed in
many comminution circuits for the size reduction of the extracted ore. Cohen (1983)
estimated that 30-50% of the total power draw of most mineral processing plants, and
up to 70% for hard ores (Fuerstenau et al., 1999), is consumed in such devices. The
major source for the high energy consumption is that most of the energy supplied is
Chapter 2: Literature Review
6 | P a g e
dissipated in powering the equipment than is actually used to break the particles
(Tavares & King, 1998). Cleary (1998) reported that 0.1 to 5% of the supplied energy
is typically used in actual breakage of particles.
Ore breakage characterisation is one of the major fields in comminution research. Its
key aim is to derive the relationship between specific energy input and resultant
progeny particles through various types of laboratory testing on a given ore (Napier-
Munn et al., 1996). A detailed review on ore breakage characterisation is presented in
section 2.5.
A number of studies have been done successfully employing and improving the
concepts of ore breakage characterisation (Narayanan, 1985; Leung, 1987; Napier-
Munn et al., 1996; Banini, 2000; Bbosa, 2007; Shi & Kojovic, 2007; Larbi-Bram, 2009:
Zuo & Shi, 2016).
2.2 Particle breakage
Particle breakage or fracture is the separation of one particulate body into two or more
progeny fragments under the action of stress (force per unit cross sectional area)
(King, 2001). It is the elementary process that governs comminution (Tavares & King,
1998) as particle sizes are reduced to smaller ones required for further concentration
processes like flotation.
The nature of how particulate materials break is governed by the material
characteristics, nature of stress fields around and within individual particles (stressing
conditions) and the environment (Umucu et al., 2013). Material characteristics relevant
to particle breakage include the fracture strength (energy required to cause breakage)
and the deformation behaviour (Tavares, 2007). Stressing conditions can be classified
by the type of stress applied (compressive, tensile or shear), number of loading points,
stressing intensity and stress rate (Wills & Napier-Munn, 2006). Contributions of the
environment are generally associated with the presence of moisture or chemical
additives which adsorb onto the particle (Hartley et al., 1978).
The fracture of particles depends on their behaviour under applied load. Rock particles
exhibit macro measures of response and microfracture mechanisms when placed
under an applied force. The macro measures of response are elucidated through

Chapter 2: Literature Review
7 | P a g e
classic rock mechanics whilst microfracture mechanisms can be explained using
fracture mechanics.
2.2.1 Rock mechanics
Particle fracture is caused by stress fields which result from applying a force leading
to disintegration (Schönert, 2004). The applied force to a particle can be plotted
against relative deformation to get a stress–strain relationship that can be analysed to
understand single particle breakage phenomena (Sahoo, 2006). The behaviour of a
cylindrical rock sample under uniaxial loading can be described by a stress–strain
curve shown in Figure 2-1.
Figure 2-1: Idealised stress-strain relationship for a cylindrical sample of rock under uniaxial compression (Napier-Munn et al., 1996).
A rock sample under compressive loading undergoes elastic deformation (ability to
sustain stress without permanent deformation) depicted by the elastic zone in Figure
2-1. The ratio of stress to strain in this region gives the Young’s modulus which is a
measure of material’s ability to return to original shape after deformation (elasticity).
The rock sample continues to deform without losing its ability to resist load in the
ductile zone illustrated by region between A and B. Point B is the maximum stress a
material can undergo before it breaks (Ultimate Compressive Stress). It denotes the
transition from ductile to brittle behaviour.
Chapter 2: Literature Review
8 | P a g e
Except for very small particle sizes, most ore particles are considered to behave as
brittle materials (Garcia et al., 2009). As a result, industrial comminution processes
deal with the breakage of brittle particles under conditions of applied compressive
stress (Umucu et al., 2013). Sudden catastrophic fracture of material occurs in the
region between B and C in Figure 2-1. The response of the particulate material to the
stress field is largely elastic but significant non-elastic behaviour occurs, particularly
at the tips of growing cracks where large quantities of energy are dissipated when the
criteria for fracture are met (Umucu et al., 2013).
2.2.2 Fracture mechanics
Fracture mechanics is the field of applied mathematics concerned with the study of
the formation and propagation of cracks in materials (Anderson, 2005). The fracture
of brittle particles can be considered to take place in two steps i.e. crack initiation and
propagation (Garcia et al., 2009). Propagation of cracks break chemical bonds and
eventually lead to particle fracture (Anderson, 2005).
A theory of brittle fracture was developed by Griffith (1921). He examined the low
tensile strength of glass assuming that small penny-shaped cracks existed throughout
the fabric material. He postulated that the low observed strengths of brittle material
were due to the presence of internal cracks and flaws which played an important role
in the fracture of the material (King, 2001). According to Wills and Napier-Munn
(2006), distribution of stress depends upon the mechanical properties of a material,
but more importantly upon the presence of cracks or flaws in the matrix. The presence
of cracks act as sites for stress concentration (stress raisers) when the particle is under
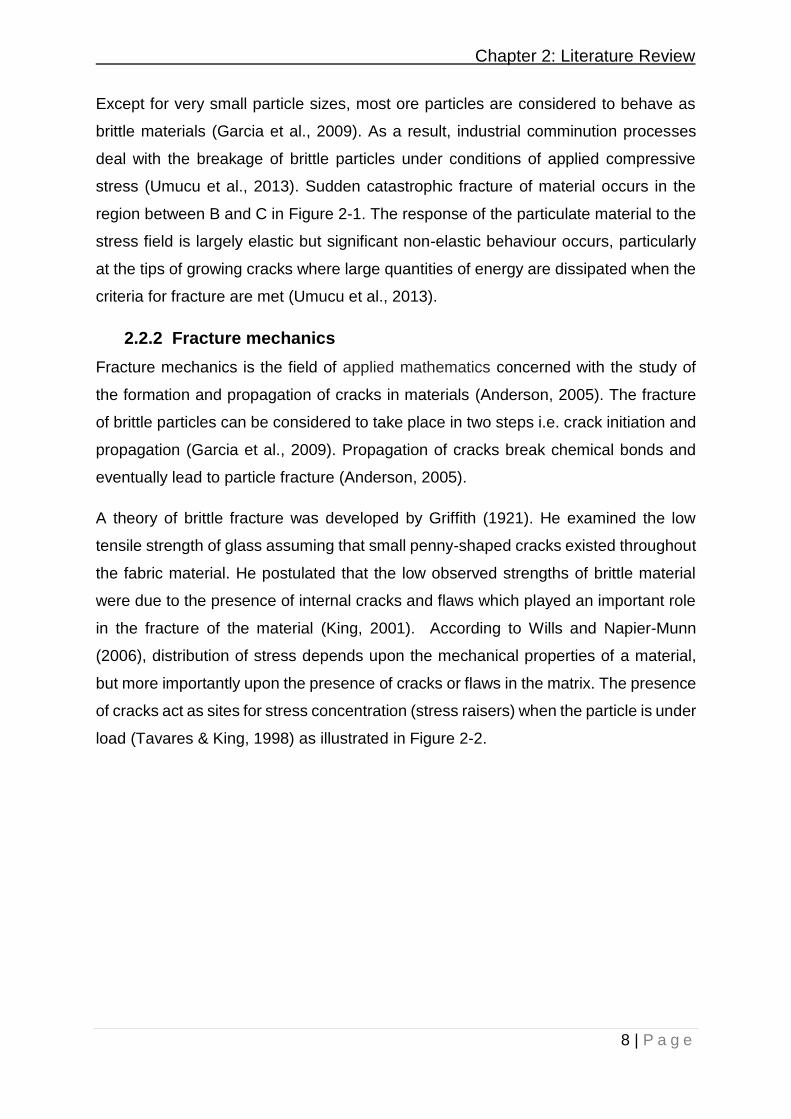
load (Tavares & King, 1998) as illustrated in Figure 2-2.
Chapter 2: Literature Review
9 | P a g e
Figure 2-2: Lines of force and local stress variation from a body with sharp crack (Ashby, Shercliff & Cebon, 2007)
The stress at a crack tip was shown by Inglis (1913) to be proportional to the square
root of the length of the crack perpendicular to the stress direction. Therefore, there is
a critical value for the crack length at any particular level of stress at which the
increased stress level at the crack tip is sufficient to break the atomic bond at that
point. Such rupture of the bond will increase the crack length, thus increasing the
stress concentration and causing a rapid propagation of the crack through the material,
resulting in fracture (Wills & Napier-Munn, 2006). Crack growth will occur when there
is enough energy to generate new crack surface. This ultimately led to the
development of modern theory of fracture mechanics, specifically Linear Elastic
Fracture Mechanics (Anderson, 2005).
The theory of Linear Elastic Fracture Mechanics (LEFM) assumes that at the edge of
every crack within a loaded material, there is a stress intensity factor (KI) (Napier-Munn
et al., 1996). Furthermore, for every material there exists a critical stress intensity
factor (KIC), also known as fracture toughness, which is a measure of the material's
resistance to brittle fracture when a crack is present. According to LEFM, for a crack
in a material to propagate, KI should be greater than or equal KIC (Anderson, 2005).
Chapter 2: Literature Review
10 | P a g e
2.3 Mechanisms of particle breakage
Particle size reduction in industrial comminution devices such as tumbling mills occur
through three basic mechanisms namely impact, abrasion and attrition (Wills & Napier-
Munn, 2006). The three breakage mechanisms are described in Figure 2-3.
Progeny
particles Progeny
particles
Progeny
particles
Parent
particle
Parent
particles
Weight
(Source of
impact force)
(i) Impact (ii) Abrasion (iii) Attrition
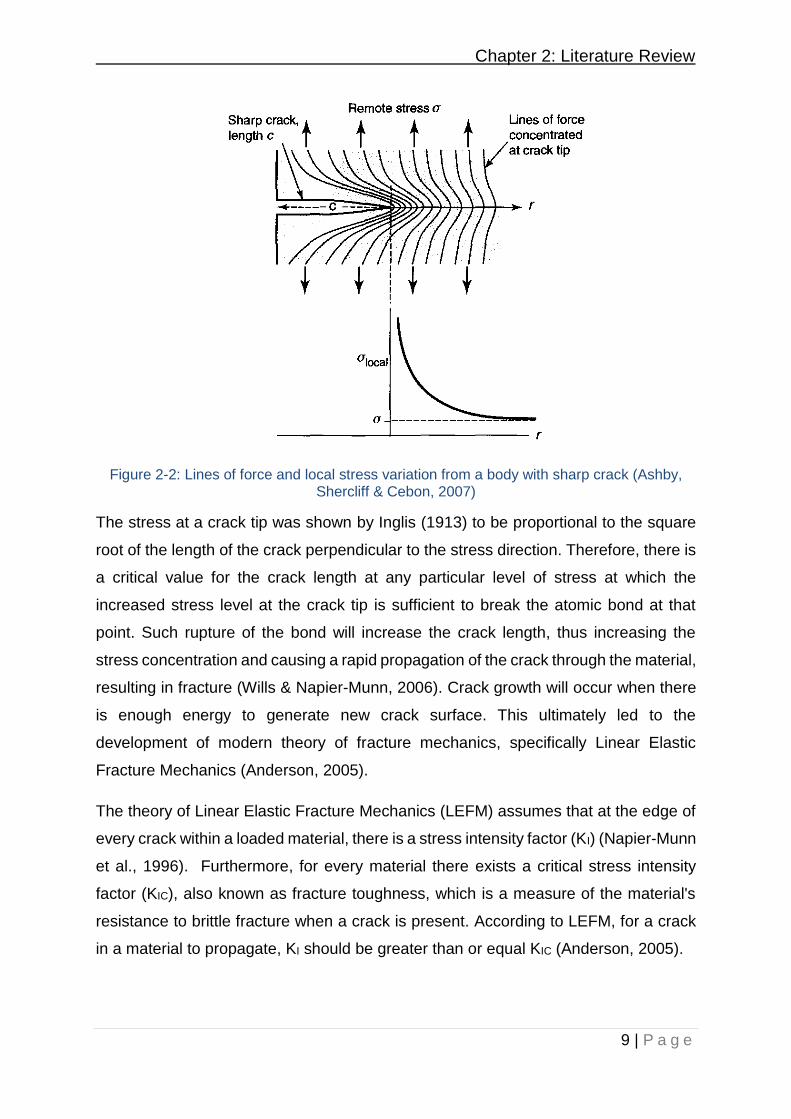
Figure 2-3: Principal breakage mechanism (adapted from Napier-Munn et al., 1996; King, 2001)
Particulate materials are fractured principally by impact (Kapur et al., 1997) shown as
(i) in Figure 2-3. This mechanism is induced through rapid application of compressive
stress (King, 2001). These are applied as normal forces to the particle surface
resulting in disintegrative fracture (body breakage) (Tavares, 2007). A broad spectrum
of product sizes is produced. This may occur in form of single particle fracture or bed
breakage when the cataracting charge in a tumbling mill impacts the base of the mill
(Cleary, 1998).
Subsidiary fracture of particles is produced by high shearing stress resulting from force
acting parallel at the surface of the particle (King, 2001). Abrasion and attrition, shown
as (ii) and (iii) in Figure 2-3, are surface breakage mechanisms (Wills & Napier-Munn,
2006). The particle suffers gradual wearing of its surface leaving the parent particle
largely intact but usually more rounded (King, 2001).
Abrasion occurs when the particle grinds against other particles, gradually wearing it
down and reducing it in size as shown in Figure 2-3 (ii). This is usually a characteristic
of ore behaviour at the base of mills (Wills & Napier-Munn, 2006). Small pieces of
each particle are broken from the surface, leaving the parent particles largely intact.
Chapter 2: Literature Review
11 | P a g e
Attrition takes place when a relatively small particle is trapped and rubbed between
two much larger particles as illustrated in Figure 2-3 (iii) or between the mill shell and
a particle. The small particle is subsequently broken in preference to the larger ones.
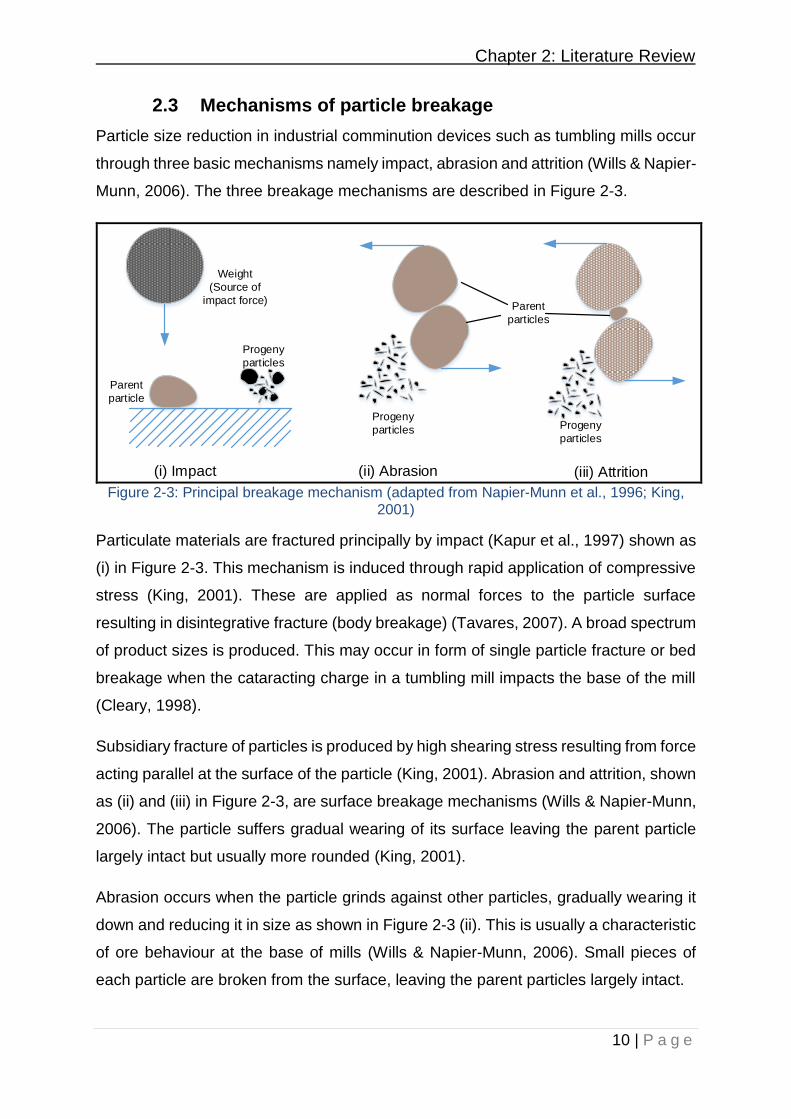
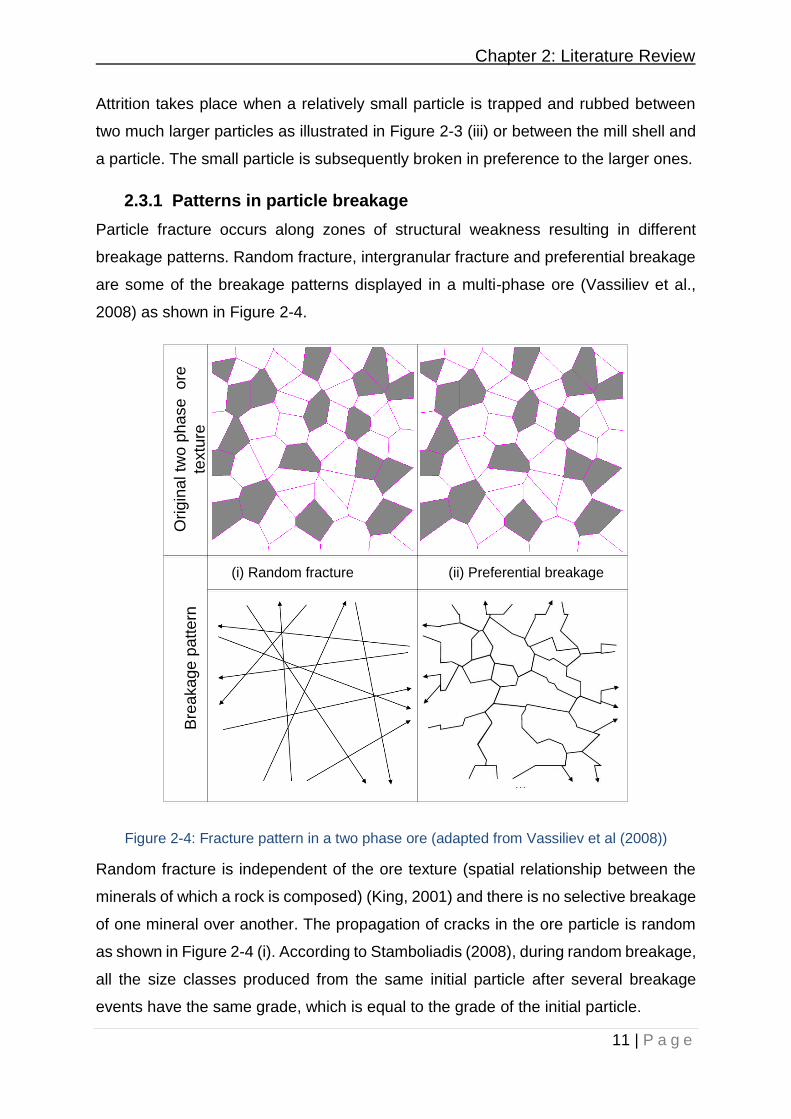
2.3.1 Patterns in particle breakage
Particle fracture occurs along zones of structural weakness resulting in different
breakage patterns. Random fracture, intergranular fracture and preferential breakage
are some of the breakage patterns displayed in a multi-phase ore (Vassiliev et al.,
2008) as shown in Figure 2-4.
Orig
ina
l tw
o p
ha
se
o
re
textu
reB
rea
ka
ge
pa
tte
rn
(i) Random fracture (ii) Preferential breakage
Figure 2-4: Fracture pattern in a two phase ore (adapted from Vassiliev et al (2008))
Random fracture is independent of the ore texture (spatial relationship between the
minerals of which a rock is composed) (King, 2001) and there is no selective breakage
of one mineral over another. The propagation of cracks in the ore particle is random
as shown in Figure 2-4 (i). According to Stamboliadis (2008), during random breakage,
all the size classes produced from the same initial particle after several breakage
events have the same grade, which is equal to the grade of the initial particle.
Chapter 2: Literature Review
12 | P a g e
When fracture patterns are dependent on the mineralogical texture, the breakage
process is considered a non-random fracture (King, 2001). Preferential breakage is
one of the non-random fracture patterns identified when multiphase particles are
broken (King, 2001). As shown in Figure 2-4 (ii), during preferential breakage,
propagation of cracks in an ore particle occur along grain boundaries, resulting in
separation of different mineral phases. (Xu et al., 2013). Significant grain boundary
fracture will enhance the exposure of minerals during comminution. However, there is
no convincing experimental evidence to describe the extent to which this actually
occurs in practice or to indicate what processes can be employed to enhance
preferential breakage (Garcia et al., 2009). In addition Garcia et al (2009) pointed out
that there is a lack of clear fundamental understanding of initiation and propagation of
cracks along grain boundary during brittle fracture of multiphase ore particles.
Conditions that are favourable for preferential breakage have not yet been identified
(Xu et al., 2013).
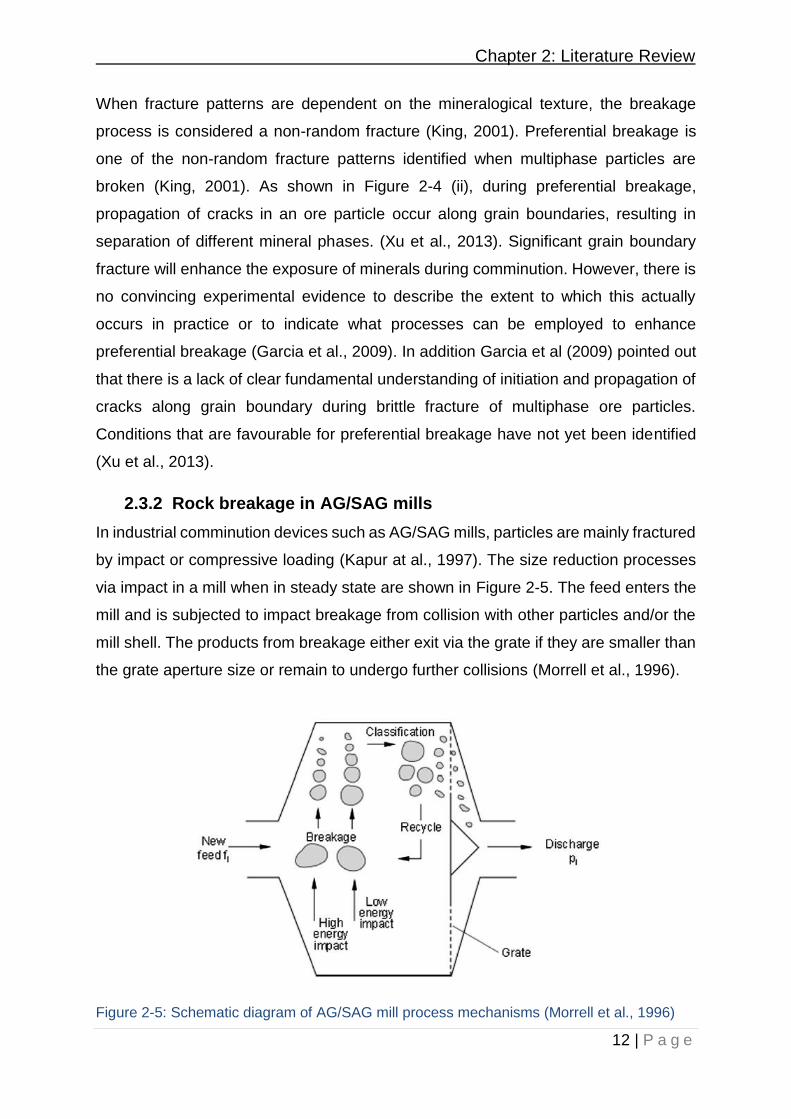
2.3.2 Rock breakage in AG/SAG mills
In industrial comminution devices such as AG/SAG mills, particles are mainly fractured
by impact or compressive loading (Kapur at al., 1997). The size reduction processes
via impact in a mill when in steady state are shown in Figure 2-5. The feed enters the
mill and is subjected to impact breakage from collision with other particles and/or the
mill shell. The products from breakage either exit via the grate if they are smaller than
the grate aperture size or remain to undergo further collisions (Morrell et al., 1996).
Figure 2-5: Schematic diagram of AG/SAG mill process mechanisms (Morrell et al., 1996)
Chapter 2: Literature Review
13 | P a g e
Morrell et al (1996) showed that rock particles that are fed to the mill are subjected to
high and low impact energy. At high impact energy, size reduction of rock particles
occur primarily by brittle fracture and crushing producing a broad spectrum of product
particle sizes (King, 2001). These energies are mimicked in the JK ore breakage
characterisation method for AG/SAG mill modelling (Larbi-Bram, 2009). The specific
impact breakage energies used in the characterisation method are in the range 0.1 to
2.5 kWh/t (Napier-Munn et al.. 1996). These impact energies are usually sufficient to
cause the particles to fracture in a single impact (Larbi-Bram, 2009).
Some of the rock particles may survive the first cycle and are recycled back to the
impact zone. The unbroken particles are progressively weakened by repeated low
energy impacts and eventually are comminuted (Kapur et al., 1997).
The feed ore to the comminution circuit often contains various rocks with different
mineralogical composition and texture thus different breakage characteristics.
Fluctuations in run-of-mine ore composition strongly affect the performance in the
comminution devices (Esen et al., 2007) especially in the AG/SAG mills which derives
the grinding media from the feed ore (Hahne, Pålsson & Samskog, 2003). The hard
components usually limit the mill throughput, due to its slower breakdown
characteristics. As a result, the material preferentially accumulates in the mill contents
adversely impacting the mill power (Bueno et al., 2013). Softer ores affect the product
size distribution as they comminute readily to generate more fines.
The fundamental properties of the fracture process of particulate materials can be
studied most effectively by well-controlled experiments on single particles (Tavares &
King, 1998). The subsequent section will thus explore the single particle breakage
tests.

Chapter 2: Literature Review
14 | P a g e
2.4 Single particle breakage tests
Single particle breakage is the most efficient size reduction method as energy losses
by friction and unsuccessful impact events are minimized or avoided altogether and
losses due to particle–particle interactions do not exist (Tavares, 2004) Single particle
breakage tests have been used to elucidate a number of phenomena in particle
breakage, including:
• energy utilization in the comminution process and a measure of the different
types of losses (Tavares, 1999),
• effect of particle size, shape, material physical properties and modes of loading
on particle breakage characteristics (Tavares & King, 1998),
• energy-size reduction relationships (Vogel & Peukert, 2004),
• breakage characteristics of materials for modelling comminution and
degradation processes (Napier Munn et al., 1996),
• material deformation response under applied stress (Tavares & King, 2004).
Various testing methods have been used to measure the breakage characteristics of
single particles subjected to compression, each allowing investigation over a restricted
range of deformation rates. These tests can be classified according to the mode of
application of stresses and the number of contact points as shown in Figure 2-6.
Figure 2-6: Different modes of single particle breakage tests (Tavares, 2007)
Chapter 2: Literature Review
15 | P a g e
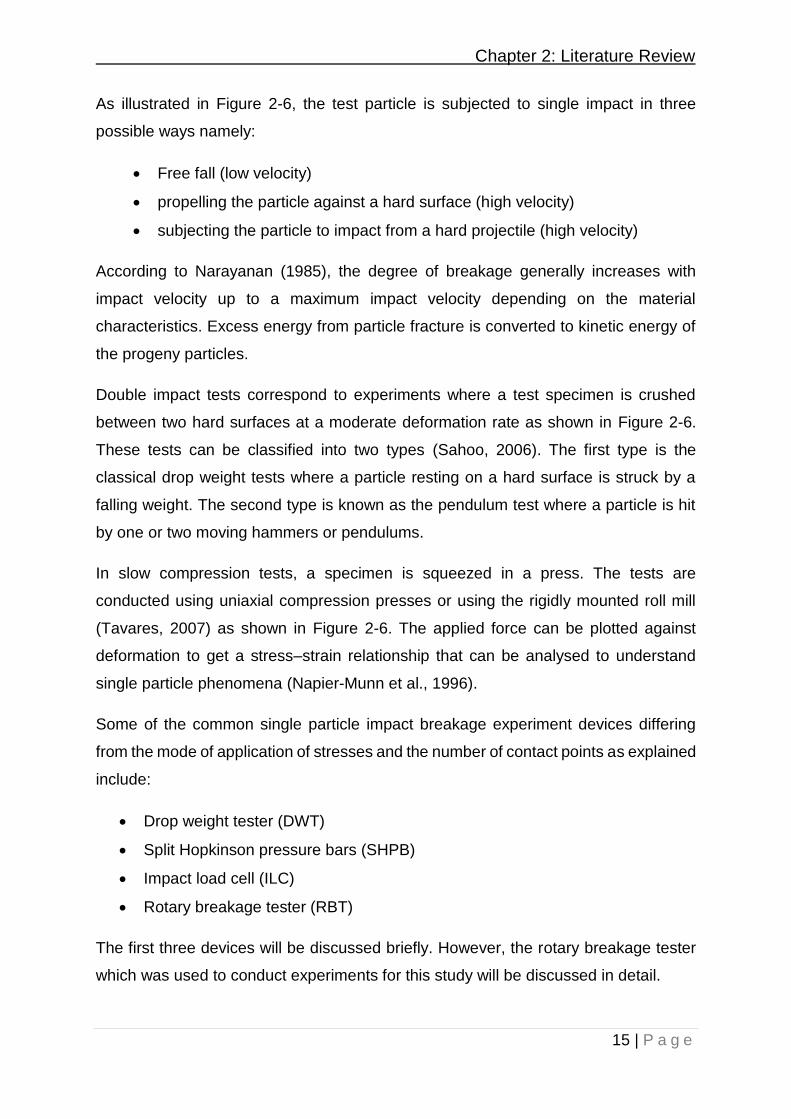
As illustrated in Figure 2-6, the test particle is subjected to single impact in three
possible ways namely:
• Free fall (low velocity)
• propelling the particle against a hard surface (high velocity)
• subjecting the particle to impact from a hard projectile (high velocity)
According to Narayanan (1985), the degree of breakage generally increases with
impact velocity up to a maximum impact velocity depending on the material
characteristics. Excess energy from particle fracture is converted to kinetic energy of
the progeny particles.
Double impact tests correspond to experiments where a test specimen is crushed
between two hard surfaces at a moderate deformation rate as shown in Figure 2-6.
These tests can be classified into two types (Sahoo, 2006). The first type is the
classical drop weight tests where a particle resting on a hard surface is struck by a
falling weight. The second type is known as the pendulum test where a particle is hit
by one or two moving hammers or pendulums.
In slow compression tests, a specimen is squeezed in a press. The tests are
conducted using uniaxial compression presses or using the rigidly mounted roll mill
(Tavares, 2007) as shown in Figure 2-6. The applied force can be plotted against
deformation to get a stress–strain relationship that can be analysed to understand
single particle phenomena (Napier-Munn et al., 1996).
Some of the common single particle impact breakage experiment devices differing
from the mode of application of stresses and the number of contact points as explained
include:
• Drop weight tester (DWT)
• Split Hopkinson pressure bars (SHPB)
• Impact load cell (ILC)
• Rotary breakage tester (RBT)
The first three devices will be discussed briefly. However, the rotary breakage tester
which was used to conduct experiments for this study will be discussed in detail.
Chapter 2: Literature Review
16 | P a g e
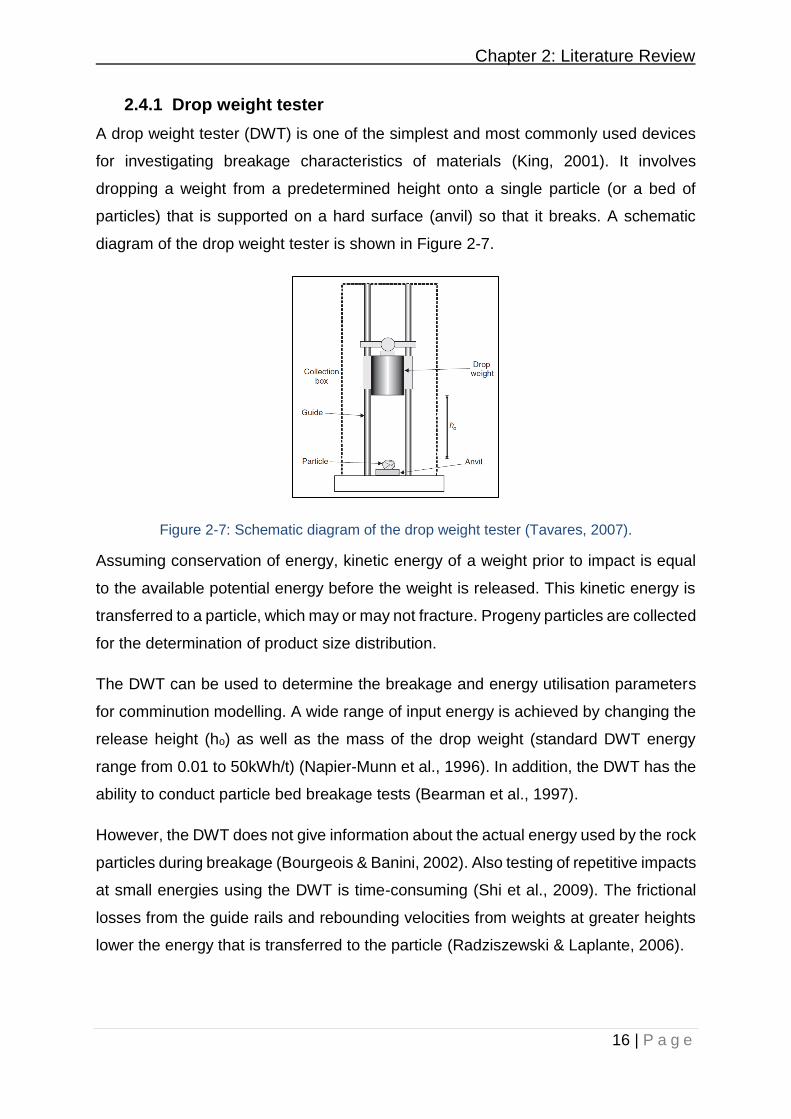
2.4.1 Drop weight tester
A drop weight tester (DWT) is one of the simplest and most commonly used devices
for investigating breakage characteristics of materials (King, 2001). It involves
dropping a weight from a predetermined height onto a single particle (or a bed of
particles) that is supported on a hard surface (anvil) so that it breaks. A schematic
diagram of the drop weight tester is shown in Figure 2-7.
Figure 2-7: Schematic diagram of the drop weight tester (Tavares, 2007).
Assuming conservation of energy, kinetic energy of a weight prior to impact is equal
to the available potential energy before the weight is released. This kinetic energy is
transferred to a particle, which may or may not fracture. Progeny particles are collected
for the determination of product size distribution.
The DWT can be used to determine the breakage and energy utilisation parameters
for comminution modelling. A wide range of input energy is achieved by changing the
release height (ho) as well as the mass of the drop weight (standard DWT energy
range from 0.01 to 50kWh/t) (Napier-Munn et al., 1996). In addition, the DWT has the
ability to conduct particle bed breakage tests (Bearman et al., 1997).
However, the DWT does not give information about the actual energy used by the rock
particles during breakage (Bourgeois & Banini, 2002). Also testing of repetitive impacts
at small energies using the DWT is time-consuming (Shi et al., 2009). The frictional
losses from the guide rails and rebounding velocities from weights at greater heights
lower the energy that is transferred to the particle (Radziszewski & Laplante, 2006).
Chapter 2: Literature Review
17 | P a g e
2.4.2 Split Hopkinson pressure bars
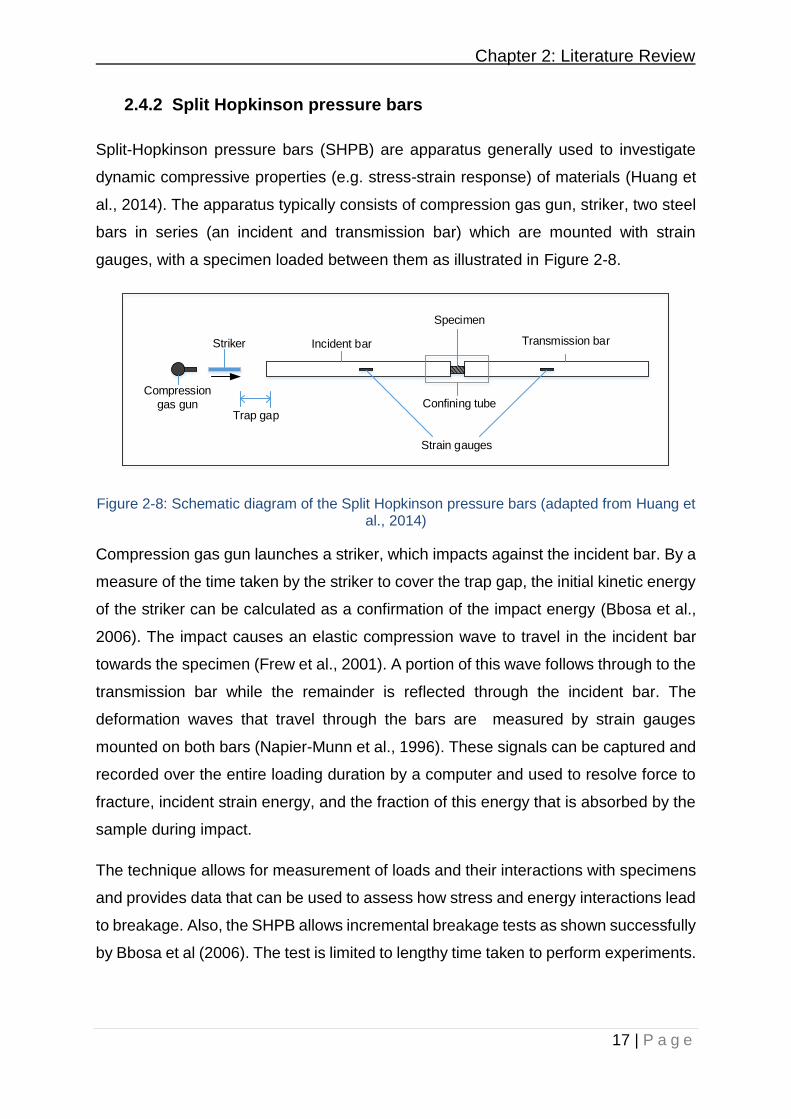
Split-Hopkinson pressure bars (SHPB) are apparatus generally used to investigate
dynamic compressive properties (e.g. stress-strain response) of materials (Huang et
al., 2014). The apparatus typically consists of compression gas gun, striker, two steel
bars in series (an incident and transmission bar) which are mounted with strain
gauges, with a specimen loaded between them as illustrated in Figure 2-8.
Specimen
Transmission barIncident bar
Confining tube
Strain gauges
Trap gap
Striker
Compression
gas gun
Figure 2-8: Schematic diagram of the Split Hopkinson pressure bars (adapted from Huang et al., 2014)
Compression gas gun launches a striker, which impacts against the incident bar. By a
measure of the time taken by the striker to cover the trap gap, the initial kinetic energy
of the striker can be calculated as a confirmation of the impact energy (Bbosa et al.,
2006). The impact causes an elastic compression wave to travel in the incident bar
towards the specimen (Frew et al., 2001). A portion of this wave follows through to the
transmission bar while the remainder is reflected through the incident bar. The
deformation waves that travel through the bars are measured by strain gauges
mounted on both bars (Napier-Munn et al., 1996). These signals can be captured and
recorded over the entire loading duration by a computer and used to resolve force to
fracture, incident strain energy, and the fraction of this energy that is absorbed by the
sample during impact.
The technique allows for measurement of loads and their interactions with specimens
and provides data that can be used to assess how stress and energy interactions lead
to breakage. Also, the SHPB allows incremental breakage tests as shown successfully
by Bbosa et al (2006). The test is limited to lengthy time taken to perform experiments.
Chapter 2: Literature Review
18 | P a g e
2.4.3 Impact load cell
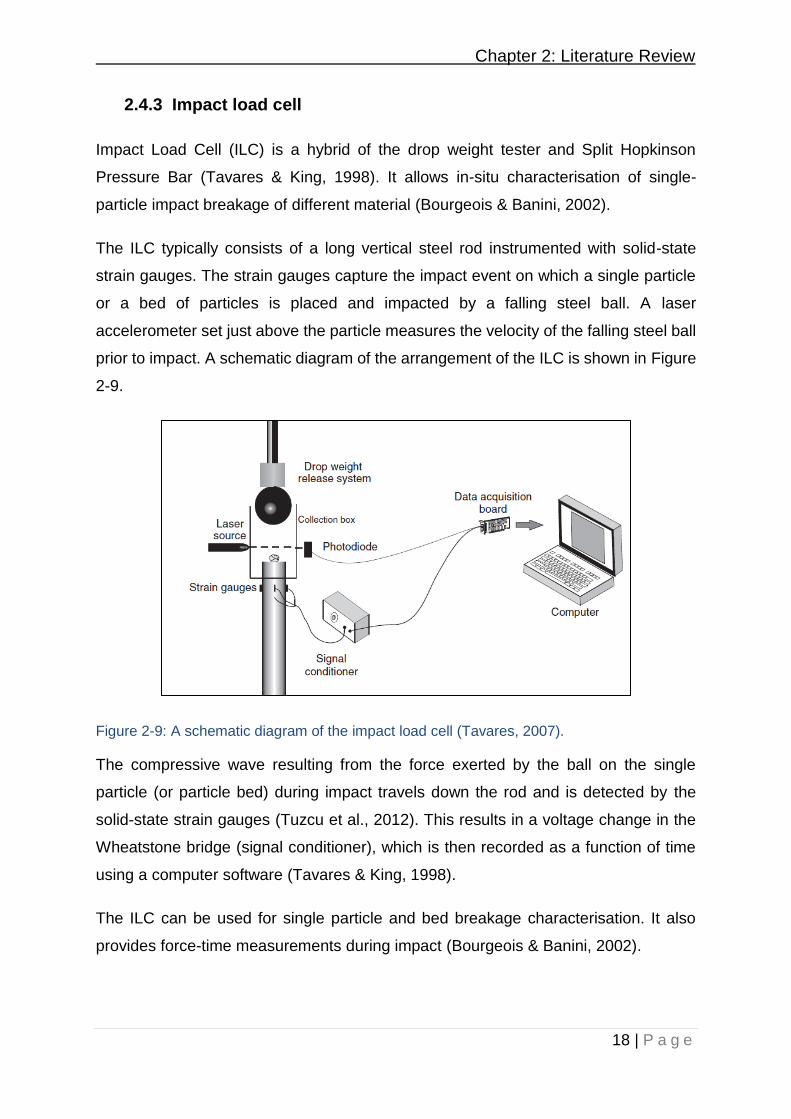
Impact Load Cell (ILC) is a hybrid of the drop weight tester and Split Hopkinson
Pressure Bar (Tavares & King, 1998). It allows in-situ characterisation of single-
particle impact breakage of different material (Bourgeois & Banini, 2002).
The ILC typically consists of a long vertical steel rod instrumented with solid-state
strain gauges. The strain gauges capture the impact event on which a single particle
or a bed of particles is placed and impacted by a falling steel ball. A laser
accelerometer set just above the particle measures the velocity of the falling steel ball
prior to impact. A schematic diagram of the arrangement of the ILC is shown in Figure
2-9.
Figure 2-9: A schematic diagram of the impact load cell (Tavares, 2007).
The compressive wave resulting from the force exerted by the ball on the single
particle (or particle bed) during impact travels down the rod and is detected by the
solid-state strain gauges (Tuzcu et al., 2012). This results in a voltage change in the
Wheatstone bridge (signal conditioner), which is then recorded as a function of time
using a computer software (Tavares & King, 1998).
The ILC can be used for single particle and bed breakage characterisation. It also
provides force-time measurements during impact (Bourgeois & Banini, 2002).
Chapter 2: Literature Review
19 | P a g e
2.4.4 JK Rotary Breakage Tester
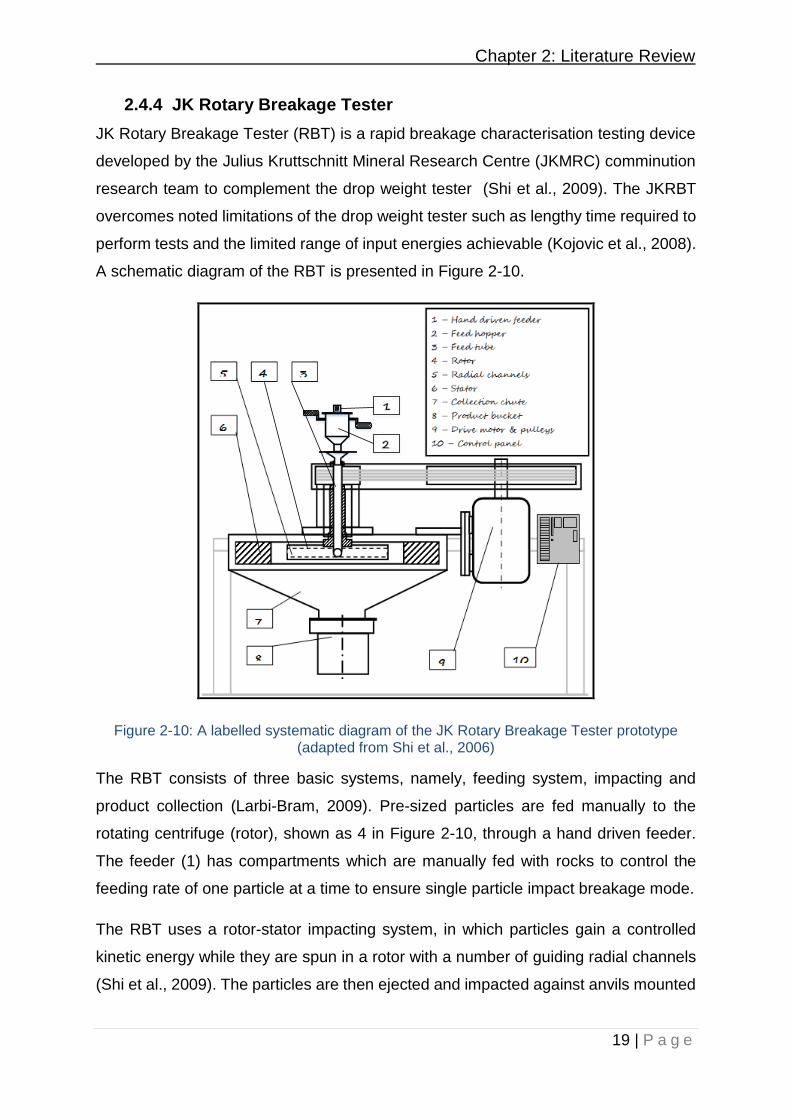
JK Rotary Breakage Tester (RBT) is a rapid breakage characterisation testing device
developed by the Julius Kruttschnitt Mineral Research Centre (JKMRC) comminution
research team to complement the drop weight tester (Shi et al., 2009). The JKRBT
overcomes noted limitations of the drop weight tester such as lengthy time required to
perform tests and the limited range of input energies achievable (Kojovic et al., 2008).
A schematic diagram of the RBT is presented in Figure 2-10.
Figure 2-10: A labelled systematic diagram of the JK Rotary Breakage Tester prototype (adapted from Shi et al., 2006)
The RBT consists of three basic systems, namely, feeding system, impacting and
product collection (Larbi-Bram, 2009). Pre-sized particles are fed manually to the
rotating centrifuge (rotor), shown as 4 in Figure 2-10, through a hand driven feeder.
The feeder (1) has compartments which are manually fed with rocks to control the
feeding rate of one particle at a time to ensure single particle impact breakage mode.
The RBT uses a rotor-stator impacting system, in which particles gain a controlled
kinetic energy while they are spun in a rotor with a number of guiding radial channels
(Shi et al., 2009). The particles are then ejected and impacted against anvils mounted
Chapter 2: Literature Review
20 | P a g e
in a surrounding stator (6) causing the particles to break. The rotor speed is controlled
and displayed on the control panel.
The broken product drops onto a collecting chute which is radially inclined (7) and
reports to a product collection bucket (8) by gravity. A vacuum automatically switches
on when the rotor is stopped to suck finer material into the product bucket.
The particles are broken under impact at the required specific input energy using the
RBT. The specific input energy of each impact, Ecs, is the kinetic energy per particle
mass and is related to the particle velocity through equation 2 -1.
𝐸𝐶𝑆 = 𝐸𝐾
𝑚=
0.5 ×𝑚 × 𝑉𝑖2
𝑚= 0.5 ×𝑉𝑖
2 … … . … … … … (2 − 1)
where Ek is the kinetic energy, m is the mass of the particle and Vi is the velocity
of the particle prior to impact
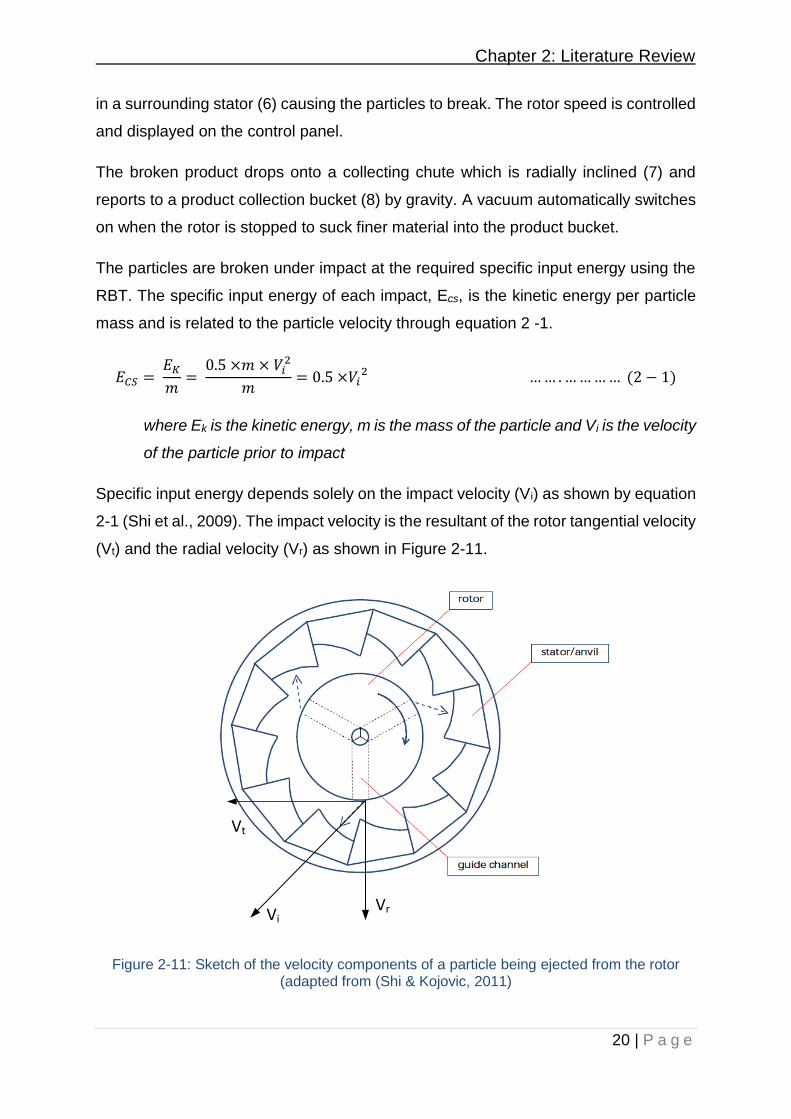
Specific input energy depends solely on the impact velocity (Vi) as shown by equation
2-1 (Shi et al., 2009). The impact velocity is the resultant of the rotor tangential velocity
(Vt) and the radial velocity (Vr) as shown in Figure 2-11.
Vt
VrVi
Figure 2-11: Sketch of the velocity components of a particle being ejected from the rotor (adapted from (Shi & Kojovic, 2011)

Chapter 2: Literature Review
21 | P a g e
The velocity the particle possesses as it is ejected from the rotor is given by equation
2-2:
𝑉𝑖2 = 𝑉𝑟
2 + 𝑉𝑡2 … … … … … … … … 2 − 2
It can be assumed that the velocity at which the particle is ejected is the same as the
impact velocity at the stator (Bbosa, 2007). This is because the rotor spins at constant
velocity and the particle travel relatively a short distance after leaving the radial
channels to the stator. If the two velocity components (Vr and Vt) are assumed to be
equal, Vi is given by:
𝑉𝑖 = √2 𝑉𝑡 … … … … … … … … 2 − 3
The actual impact velocity of a particle is smaller due to frictional losses in the guide
channel. Hence, a constant C is introduced to account for the efficiency of a given
design is in transferring the kinetic energy from the rotor to the particle fed into the
machine (Shi et al., 2009). The specific input energy is then determined from equation
2-4:
𝐸𝐶𝑆 = 0.5 × [𝐶×√2×
2×𝜋 ×𝑁×𝑟60 ]
2
3600= 3.046×10⁻⁶𝐶2𝑁2𝑟2 … … … … … (2 − 4)
where Ecs is the specific input energy (kWh/t), r is the rotor radius (m), N is the
rotor speed (rpm), and C is the velocity constant (Shi et al, 2009).
The RBT allows rapid characterization of particle impact breakage properties. One
RBT test (equivalent to one standard DWT) can be completed in approximately 1/8th
to 1/10th of the time it takes to complete a DWT test (Larbi-Bram, 2009). The RBT can
be used for both single impact and incremental breakage as demonstrated in work
such as Bbosa (2007), Bonfils and Powell (2013). The ability to test a large number of
particles offers statistically more reliable results. Although the RBT predicts the impact
velocity and thus available impact energy to test particles, it cannot quantify how much
of this is actually utilized to cause breakage.
Chapter 2: Literature Review
22 | P a g e
2.5 Ore breakage characterisation
Ore breakage characterisation is a process of assessing how particulate materials
fracture in comminution devices, such as crushers or tumbling mills (Napier-Munn et
al., 1996). It generates parameters that are used to describe the resistance of particles
to breakage (hardness). Ore feed supplied to the comminution circuit is composed of
various rock types with different characteristics (Hahne et al., 2003). Ore breakage
characterisation therefore allows the mapping of the different rock types, in terms of
their hardness, within the feed being supplied to the comminution circuit.
Variations in ore characteristics or blending of different rock types mined from different
deposits result in throughput fluctuations in comminution devices (Williams &
Holtzhausen, 2001). These fluctuations consequently affect the estimation of the
energy requirements and product characteristics in these devices (Hahne et al., 2003).
This has led to the increasing significance of ore breakage characterisation (Bourgeois
& Banini, 2002) particularly in optimising comminution processes.
2.5.1 Effect of input energy on the resultant breakage
The input energy in comminution processes has been identified as the most significant
variable controlling the progeny size distribution from single-particle breakage
(Tavares, 2007).
Kick (1885) observed that input energy was proportional to the volume of material
broken and proposed another energy-size reduction relationship. He formulated a "law
of comminution" based on the assumption that energy supplied to a body increases
the level of strain within the body to propagate its internal micro-cracks and that the
strain energy of the body is proportional to its volume. Tavares (2007) also pointed out
that increasing the input energy, increases the stressing intensity which will inturn
intensifies the propagation of cracks in a material.
As a consequence of the increase input energy, the degree of breakage generally
increases (Narayanan, 1985; Kapur et al., 1997; Banini, 2000; Shi & Kojovic, 2007).
However, particles of infinite fineness are not produced in a single loading event by
increasing indefinitely the stressing energy, so that a maximum progeny size
distribution is reached (Napier-Munn et al., 1996). The maximum product size
distribution depends on the spatial distribution of fragments from the first few fracture
Chapter 2: Literature Review
23 | P a g e
events, loading geometry, loading rate and on the material’s amenability to
agglomerate (Tavares, 2007).
Bonfils and Powell (2013) highlighted that a particle that survives an impact becomes
increasingly weaker with repeated impact cycles and eventually breaks if the energy
supplied is above energy threshold (See Section 2.6.2). Krogh (1980) demonstrated
that anorthosite particles become increasingly weaker after receiving multiple impacts.
A similar trend was reported by Pauw and Maré (1988) who found that after repeated
impacts at a very low energy level, quartzite particles were eventually broken.
Furthermore, Tavares and King (2002) showed that particle weakening from repeated
impacts is the result of the growth of crack-like damage
2.5.2 Effect of particle size on the resultant breakage
The effect of the particle size on the resultant has been investigated extensively in
work such as Tavares and King (1998), Banini (2000), Shi and Kojovic (2007). Tavares
and King (1998) observed that the ability of a particle to withstand a force without
fracturing (particle strength) increases with a decrease in particle size. In view of this,
bigger particles tend to offer less resistance to breakage (weaker) and therefore easier
to break than smaller particles. These findings were also confirmed by Banini (2000)
as well as Shi and Kojovic (2007). This trend is because the crack density of larger
particles is much greater than that for smaller particles (Tavares & King, 1998). As
pointed out in Section 2.2.2, the presence of internal cracks and flaws plays an
important role in the fracture of the material.
However, Banini (2000) fitted the A and b parameters (see Section 2.6.1) to all the
materials tested. He observed that for some materials the fitted parameters varied
irregularly with particle size as illustrated in Figure 2-12.
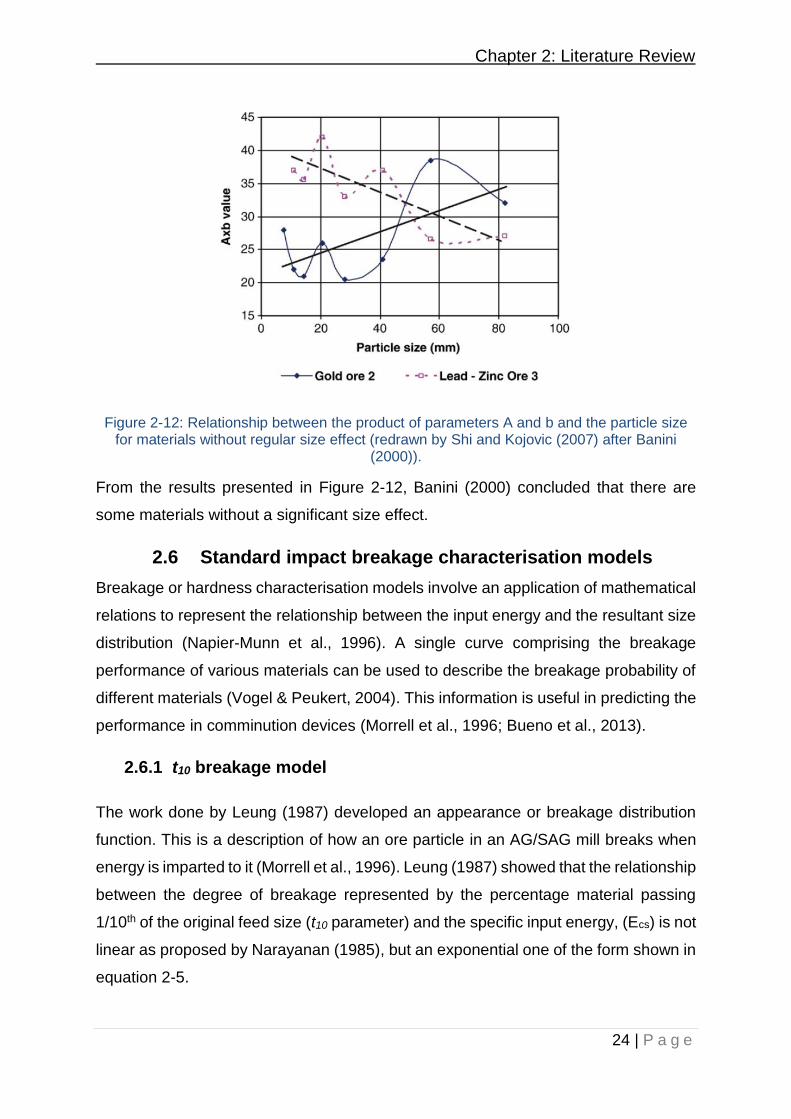
Chapter 2: Literature Review
24 | P a g e
Figure 2-12: Relationship between the product of parameters A and b and the particle size for materials without regular size effect (redrawn by Shi and Kojovic (2007) after Banini
(2000)).
From the results presented in Figure 2-12, Banini (2000) concluded that there are
some materials without a significant size effect.
2.6 Standard impact breakage characterisation models
Breakage or hardness characterisation models involve an application of mathematical
relations to represent the relationship between the input energy and the resultant size
distribution (Napier-Munn et al., 1996). A single curve comprising the breakage
performance of various materials can be used to describe the breakage probability of
different materials (Vogel & Peukert, 2004). This information is useful in predicting the
performance in comminution devices (Morrell et al., 1996; Bueno et al., 2013).
2.6.1 t10 breakage model
The work done by Leung (1987) developed an appearance or breakage distribution
function. This is a description of how an ore particle in an AG/SAG mill breaks when
energy is imparted to it (Morrell et al., 1996). Leung (1987) showed that the relationship
between the degree of breakage represented by the percentage material passing
1/10th of the original feed size (t10 parameter) and the specific input energy, (Ecs) is not
linear as proposed by Narayanan (1985), but an exponential one of the form shown in
equation 2-5.
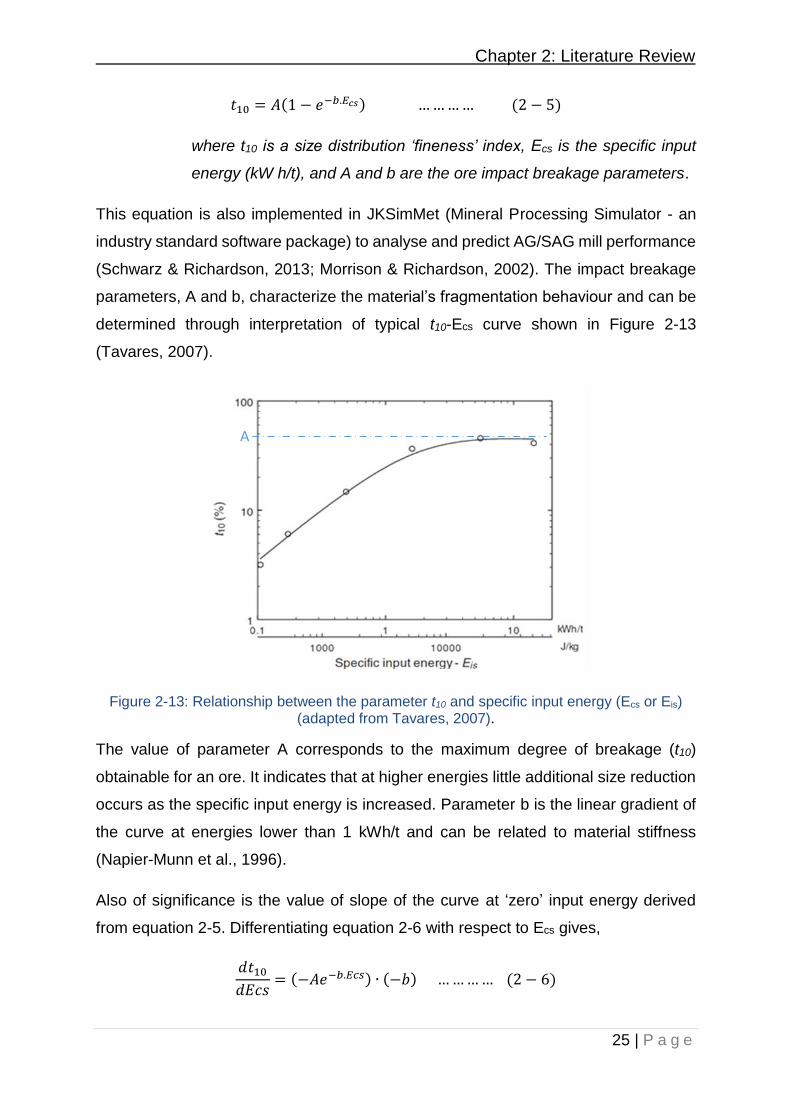
Chapter 2: Literature Review
25 | P a g e
𝑡10 = 𝐴(1 − 𝑒−𝑏.𝐸𝑐𝑠) … … … … (2 − 5)
where t10 is a size distribution ‘fineness’ index, Ecs is the specific input
energy (kW h/t), and A and b are the ore impact breakage parameters.
This equation is also implemented in JKSimMet (Mineral Processing Simulator - an
industry standard software package) to analyse and predict AG/SAG mill performance
(Schwarz & Richardson, 2013; Morrison & Richardson, 2002). The impact breakage
parameters, A and b, characterize the material’s fragmentation behaviour and can be
determined through interpretation of typical t10-Ecs curve shown in Figure 2-13
(Tavares, 2007).
A
Figure 2-13: Relationship between the parameter t10 and specific input energy (Ecs or Eis) (adapted from Tavares, 2007).
The value of parameter A corresponds to the maximum degree of breakage (t10)
obtainable for an ore. It indicates that at higher energies little additional size reduction
occurs as the specific input energy is increased. Parameter b is the linear gradient of
the curve at energies lower than 1 kWh/t and can be related to material stiffness
(Napier-Munn et al., 1996).
Also of significance is the value of slope of the curve at ‘zero’ input energy derived
from equation 2-5. Differentiating equation 2-6 with respect to Ecs gives,
𝑑𝑡10
𝑑𝐸𝑐𝑠= (−𝐴𝑒−𝑏.𝐸𝑐𝑠) ∙ (−𝑏) … … … … (2 − 6)
Chapter 2: Literature Review
26 | P a g e
Letting Ecs in equation 2-6 to approach zero results in:
lim𝐸𝑐𝑠→0
(𝑑𝑡10
𝑑𝐸𝑐𝑠) = 𝐴𝑥𝑏 … … … … (2 − 7)
Equation 2-7 illustrates that Axb is the slope of the curve at ‘zero’ input energy. It
represents material’s amenability to fragmentation via impact (ore hardness indicator)
(Shi & Kojovic, 2007). A lower Axb value shows that the ore has a high resistance to
impact breakage whilst a higher Axb indicates a readiness to fracture of the ore type
(Hahne et al., 2003).
Typical ore hardness classes reported in Table 2-1 were determined using the JK Drop
weight tester at the JKMRC.
Table 2-1: Reported ranges of Axb values impact breakage parameters (Napier-Munn et al., 1999).
Ore particles can be classified by comparing the hardness parameters as presented
in Table 2-1.
A comparisons of breakage mechanisms and characterisation data between the
JKRBT and the Drop Weight Tester was made by Shi and Kojovic (2011). It was noted
that the JKRBT produces a finer product. This is attributable to the differences in
breakage modes between the DWT and the JKRBT. As discussed in section 2.4, there
are two points of contact in the DWT test when a force is loaded on a particle, while in
the JKRBT test, there is only one contact point (Tavares, 2007). Shi and Kojovic (2011)
pointed out that 2-point breakage is less efficient than 1-point breakage at the same
specific applied energy. Shi and Kojovic (2011) also discussed the difference in the
specific energy, strain rate and the potential for secondary breakage for the two
breakage characterisation devices.
Despite the differences in the breakage modes, the JKRBT can provide statistically
similar A*b parameters, by using a data reduction procedure which takes into account
the difference in the number of contact points, strain rate and potential for secondary
Chapter 2: Literature Review
27 | P a g e
breakage. However, no publication has been made which explains the data reduction
procedure.
Some of the limitation of Leung’s approach as noted by Larbi-Bram (2009) and Banini
(2000) are:
• The method assumes that the size of the particle does not affect the
breakage process and thus the mass and the particle size are not factored
in resultant breakage model. The study conducted by Banini (2000) to model
the particle size effect on ore breakage demonstrated that A and b are
usually not constant over all particle size.
• The model does not account for material properties. Work done by Vogel
and Peukert showed that the breakage probability is related to material
properties (Vogel & Peukert, 2003, 2004, 2005).
• Leung’s approach does not consider the effect of particle interaction
associated with different number of particles. Banini (2000) showed that the
number of particles inside a mill can significantly influence the abrasion
index.
As a result, Shi and Kojovic (2007) modified the breakage probability model published
by Vogel and Peukert (2004) to develop a size-dependent model shown in equation
2-9 (in section 2.6.2) to describe the degree of breakage.
Chapter 2: Literature Review
28 | P a g e
2.6.2 Size dependent breakage model
Vogel and Peukert developed a breakage probability which depends on the mass-
specific impact energy, a minimum energy required to cause any particle fracture, the
initial particle size and a material parameter which describes the material-specific
breakage behaviour (Vogel and Peukert, 2004). The model expresses breakage
probability (S) in terms of a series of parameters given in equation 2-8.
𝑆 = 1 − exp{−𝑓𝑚𝑎𝑡 . 𝑥. 𝑘 (𝑊𝑚,𝑘𝑖𝑛 − 𝑊𝑚,𝑚𝑖𝑛)} … … … … … … (2 − 8)
where fmat (kg J−1 m−1) is the material breakage property, x (m) the initial particle
size, Wm,kin (J kg−1) the mass-specific kinetic impact energy, Wm,min (J kg−1) the
threshold energy below which breakage does not occur, and k the successive
number of impacts with the single impact energy (Vogel and Peukert, 2004).
Shi and Kojovic (2007) argued that the qualitative description of the breakage function
to know whether a particle will break (breakage probability) presented by Vogel and
Peukert (2004) is only a part of the process. It is more important to know the particle
progeny size distribution subject to breakage. A modification to the Vogel and
Peukert’s breakage probability model to describe the degree of breakage, t10 (%), in
relation to material property, particle size and net cumulative impact energy, is given
as follows:
𝑡10 = 𝑀{1 − 𝑒𝑥𝑝[−𝑓𝑚𝑎𝑡 . 𝑥. 𝑘 (𝐸𝑐𝑠 − 𝐸𝑚𝑖𝑛)]} … … … … … … (2 − 9)
where M (%) represents the maximum t10 for a material subject to breakage,
Ecs (J kg−1) the mass-specific impact energy, and Emin (J kg−1) the threshold
energy (Shi & Kojovic, 2007).
The modified model directly correlates to the t10 breakage model (equation 2-5) such
that the value of A would be replaced by M, while b replaced by fmat.x, and Ecs replaced
by k(Ecs-Emin). Shi and Kojovic (2007) fitted both the t10 breakage model (equation 2-
5) and the size dependent model (equation 2-9) to the data of Mt Coot-tha quarry
material as shown in Figure 2-14.
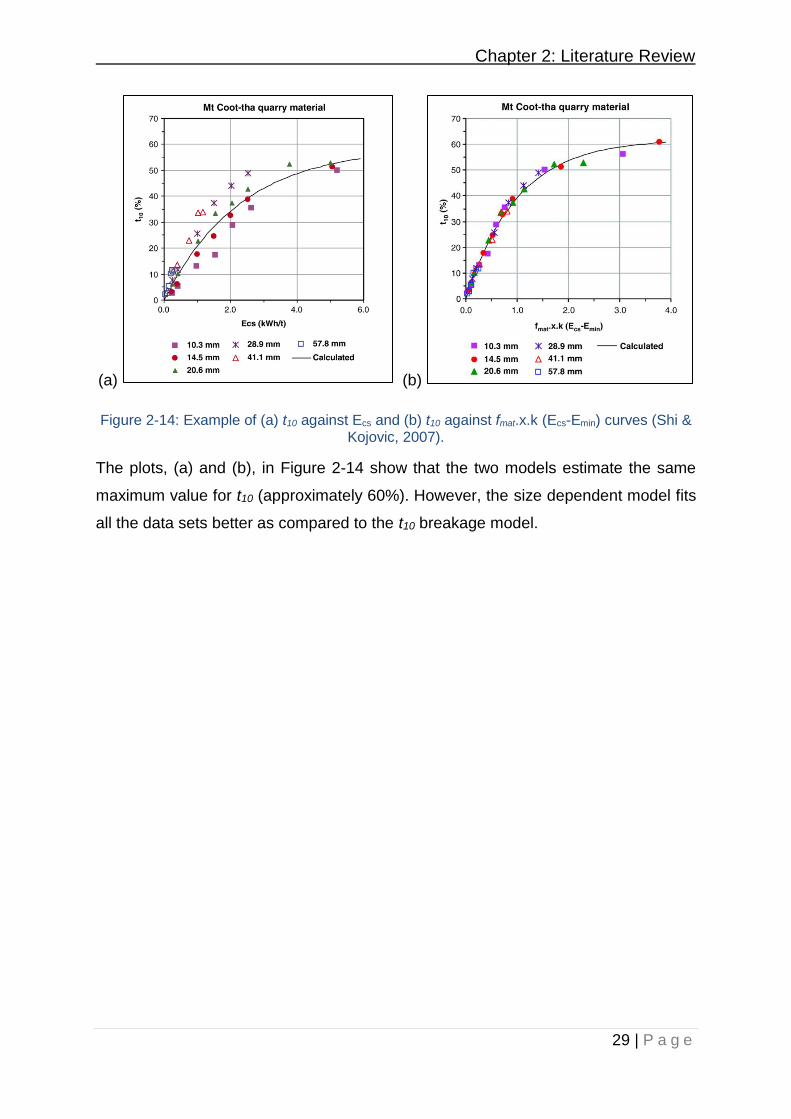
Chapter 2: Literature Review
29 | P a g e
(a) (b)
Figure 2-14: Example of (a) t10 against Ecs and (b) t10 against fmat.x.k (Ecs-Emin) curves (Shi & Kojovic, 2007).
The plots, (a) and (b), in Figure 2-14 show that the two models estimate the same
maximum value for t10 (approximately 60%). However, the size dependent model fits
all the data sets better as compared to the t10 breakage model.
Chapter 2: Literature Review
30 | P a g e
2.7 Process mineralogy
Process mineralogy in the mining industry is the application of scientific study of
minerals to understand and solve problems encountered during processing of ores,
concentrates and smelter product (Petruk, 2000). According to Xiao and Laplante
(2004), process mineralogy can also be viewed as an integration of mineral processing
and the study of minerals (mineralogy). Its salient characteristics as presented by
Baum (2013) include:
• Representative ore sampling
• Characterisation (quantitative mineralogy)
• Interpretation and understanding (including metallurgical tests)
• Prediction of the location of ore bodies, behaviour of ores during processing
and potential recovery of certain minerals, metals or elements.
Cropp and Goodall (2013) highlighted that continuous deterioration of ore quality
regarding grade, hardness, finer particle sizes and increase of metallurgical
complexities has made process mineralogy an integral part of new project
development. Mineralogical studies provide information on the ore variability and
behaviour of various mineral components during processing by assessing internal
structures, compositions, physical, chemical and optical properties of ore bodies
(Schouwstra & Smit, 2011). These mineralogical studies also provide information on
mineral classification, mode of formation and occurrence (Petruk, 2000). Information
obtained from mineralogical studies allow for better planning, plant design and plant
optimisation (Rule & Schouwstra, 2011).
2.7.1 Ore texture
Ore texture refers to the relationship between the minerals of which the rock is
composed. It includes the size, shape, distribution and association of the mineral
grains in the rock. The texture of an ore defines several factors that have a major
influence throughout an operation, from mining strategy through to blending,
processing, target grade and recovery, and tailings management. According to Cropp
and Goodall (2013) some of these factors include:
• grain size distribution(s) and target grind size
• grindability of the ore
Chapter 2: Literature Review
31 | P a g e
• degree of liberation of the target minerals
• phase specific surface area of the target minerals
• amount of fines
• number of coarse composite particles.
All textures, including crystallinity, grain boundary relations, grain orientations,
fractures and veinlets have a bearing on processing ores. However, the sizes of the
mineral grains and the bonding between the grains are the main characteristics that
influence ore breakage and mineral liberation (Petruk, 2000).
2.7.2 Characterisation of ore bodies
Ore characteristics such as mineral identities, grain size, mineral associations, degree
of liberation and the distribution of the minerals present can be determined from
mineralogical studies. These characteristics can be explained by the relationship
between minerals present in the ore (ore texture). Understanding the ore texture leads
to identification of the minerals present in an ore body and their proportions. This is
essential for the prediction of their response to various treatment processes and
optimising the existing circuits (Schouwstra & Smit, 2011).
2.7.3 Common devices employed in process mineralogy
Many devices have been developed for determining mineralogical characteristics. The
most common ones are:
• Optical microscope - It is used in the identification of many minerals, observing
mineral textures and determining mineral quantities by point counting.
• X-ray diffractometer (XRD) – It is used to identify many minerals with a high
degree of certainty, and to qualitatively determine mineral contents in powdered
materials.
• Quantitative Evaluation of Minerals with Scanning Electron Microscopy
(QEMSCAN) – It produces mineral maps (colour coded by mineral) which
describe texture and mineral association in each sample. In addition to the
coloured map, the output of the QEMSCAN measurement includes a
quantitative measure of modal mineralogy, mineral grain size, mineral liberation
and element deportment by mineral.
Chapter 2: Literature Review
32 | P a g e
• Mineral Liberation Analyser (MLA) - It is an automated mineral analysis system
that can quantify a wide range of mineral characteristics, such as mineral
abundance, grain size and liberation.
2.8 Mineralogy of the Bushveld Complex ores
The Bushveld Complex is the largest known layered intrusion in the world (Clarke et
al., 2005) which consists contains about 50 and 75% of the world’s reserves of
palladium and platinum respectively (Cawthorn, 1999). The layered intrusion consists
of rocks which cooled slowly from molten magma, deep within the earth (Schouwstra
et al., 2000). The Bushveld Complex consists of northern, western and eastern limbs
(Cawthorn, 1999) as presented in Figure 2-15.
There are three distinct ore bodies within the Bushveld complex namely the Merensky
reef, Upper Group 2 (UG2) reef and Platreef (Cramer, 2001). The total platinum group
element (PGE) abundance of these reefs ranges between 4 and 10 g/t (Schouwstra
et al., 2000). Merensky reef is the most abundant in PGM content followed by UG2
and then Platreef (Lee, 1996). Merensky and UG2 reefs outcrop on both the eastern
and western limbs. Generally, UG2 lies below the Merensky reef by anywhere from 15
meters to 330 meters (Cramer, 2001). The northern limb of the Bushveld complex
contains Platreef.
Merensky reef which is mainly pyroxenite rock type largely consists of the silicates,
orthopyroxene (70 – 90%) and up to 30% of plagioclase (Xiao & Laplante, 2004). UG2
reef is made up of chromitite which consists predominantly of rounded chromite grains
(60 to 90 percent by volume) cemented mainly by plagioclase (Schouwstra et al.,
2000; Mathez & Mey, 2005). Platreef on the other hand consists of a complex
assemblage of pyroxenites, serpentinites and calc-silicates (Schouwstra at al., 2000).
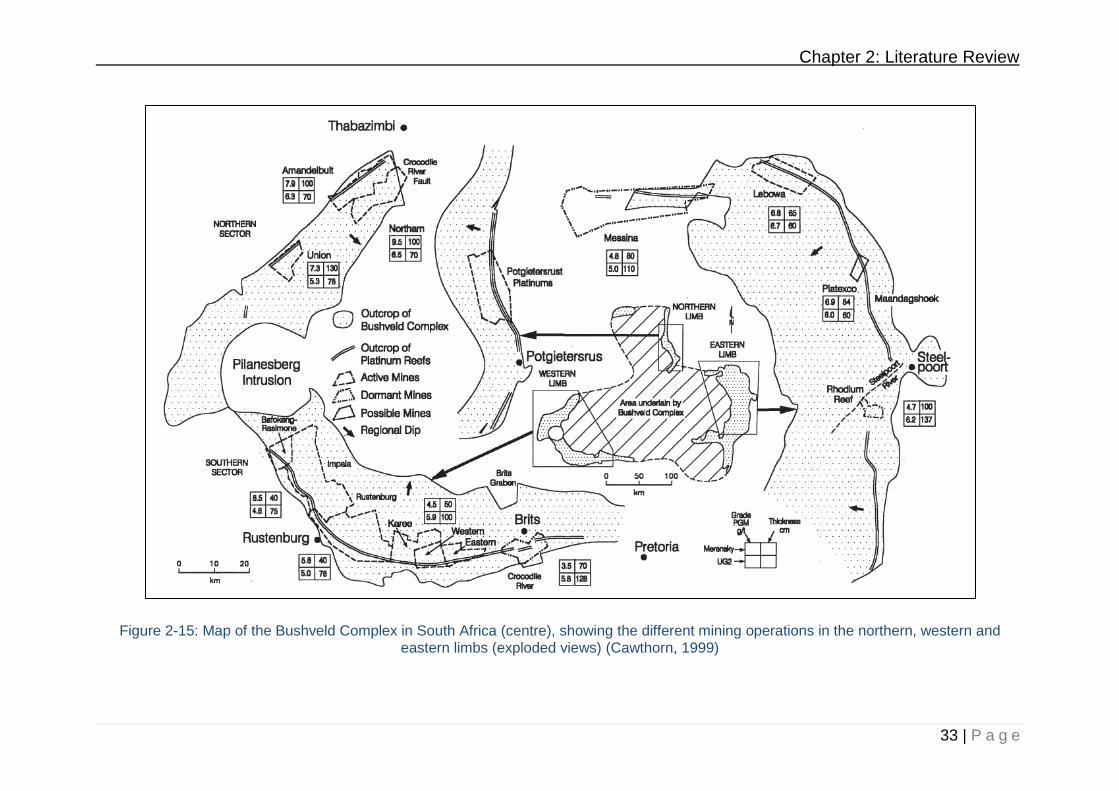
Chapter 2: Literature Review
33 | P a g e
Figure 2-15: Map of the Bushveld Complex in South Africa (centre), showing the different mining operations in the northern, western and eastern limbs (exploded views) (Cawthorn, 1999)
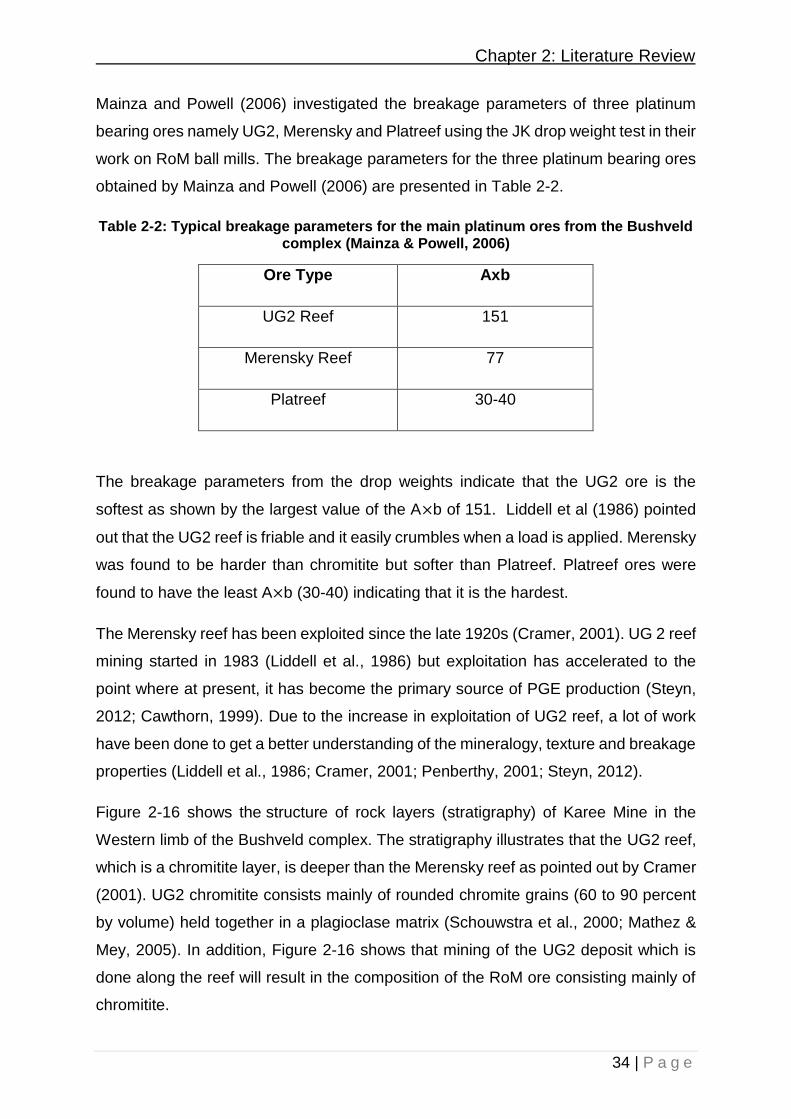
Chapter 2: Literature Review
34 | P a g e
Mainza and Powell (2006) investigated the breakage parameters of three platinum
bearing ores namely UG2, Merensky and Platreef using the JK drop weight test in their
work on RoM ball mills. The breakage parameters for the three platinum bearing ores
obtained by Mainza and Powell (2006) are presented in Table 2-2.
Table 2-2: Typical breakage parameters for the main platinum ores from the Bushveld complex (Mainza & Powell, 2006)
Ore Type Axb
UG2 Reef 151
Merensky Reef 77
Platreef 30-40
The breakage parameters from the drop weights indicate that the UG2 ore is the
softest as shown by the largest value of the A×b of 151. Liddell et al (1986) pointed
out that the UG2 reef is friable and it easily crumbles when a load is applied. Merensky
was found to be harder than chromitite but softer than Platreef. Platreef ores were
found to have the least A×b (30-40) indicating that it is the hardest.
The Merensky reef has been exploited since the late 1920s (Cramer, 2001). UG 2 reef
mining started in 1983 (Liddell et al., 1986) but exploitation has accelerated to the
point where at present, it has become the primary source of PGE production (Steyn,
2012; Cawthorn, 1999). Due to the increase in exploitation of UG2 reef, a lot of work
have been done to get a better understanding of the mineralogy, texture and breakage
properties (Liddell et al., 1986; Cramer, 2001; Penberthy, 2001; Steyn, 2012).
Figure 2-16 shows the structure of rock layers (stratigraphy) of Karee Mine in the
Western limb of the Bushveld complex. The stratigraphy illustrates that the UG2 reef,
which is a chromitite layer, is deeper than the Merensky reef as pointed out by Cramer
(2001). UG2 chromitite consists mainly of rounded chromite grains (60 to 90 percent
by volume) held together in a plagioclase matrix (Schouwstra et al., 2000; Mathez &
Mey, 2005). In addition, Figure 2-16 shows that mining of the UG2 deposit which is
done along the reef will result in the composition of the RoM ore consisting mainly of
chromitite.
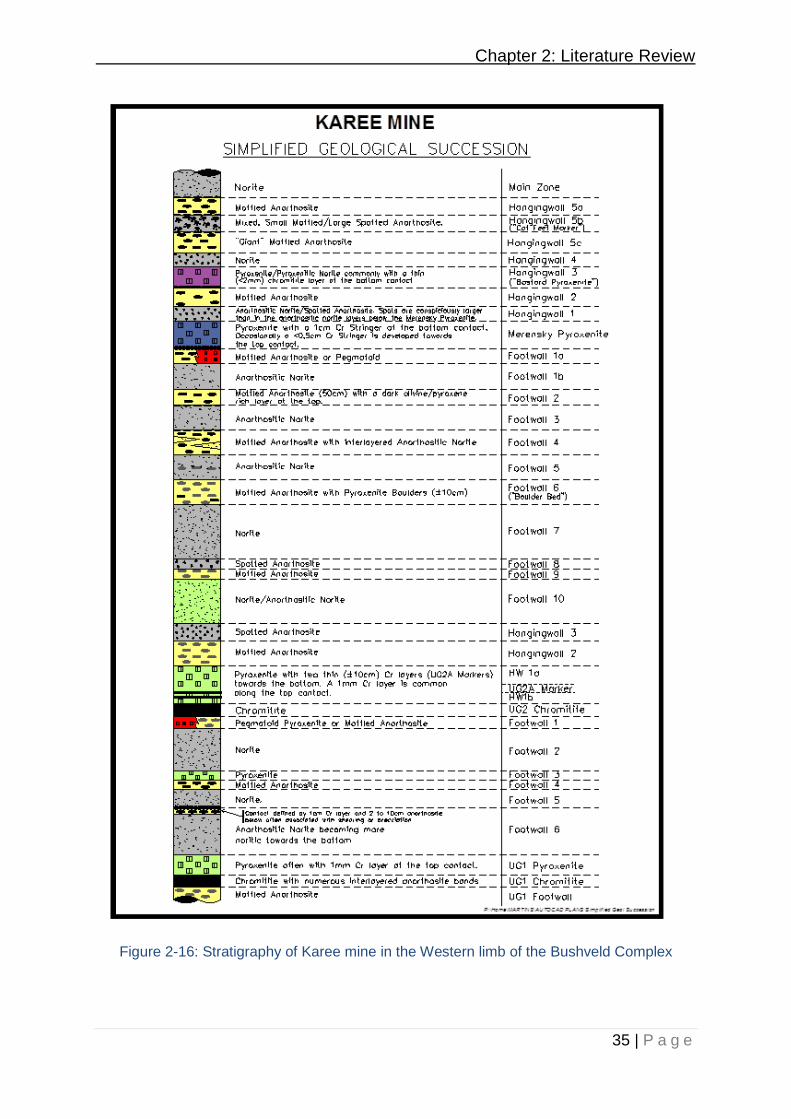
Chapter 2: Literature Review
35 | P a g e
Figure 2-16: Stratigraphy of Karee mine in the Western limb of the Bushveld Complex
Chapter 2: Literature Review
36 | P a g e
Other rock types that are likely to report to the stockpile include pyroxenite, norite,
spotted anorthosite and mottled anorthosite. Pyroxenite consists of granular
orthopyroxene, interstitial plagioclase and clinopyroxene (Mondal & Mathez, 2006).
Norite is a mafic intrusive igneous rock composed largely of the calcium-rich
plagioclase labradorite and hypersthene with olivine. Mottled anorthosite spotted
anorthosite. Mottled and spotted anorthosite are coarse-grained igneous rocks
consisting mainly of plagioclase feldspar (60 – 100%) with minimal orthopyroxene (0
– 30%) (Klerk, 1995; Ashwal, 1993). Orthopyroxene fills the interstices between the
plagioclase crystals creating cumulus to poikilitic textures (Ashwal, 1993). In mottled
anorthosite, the pyroxene mineral creates grey mottles giving a blotched appearance
(Klerk, 1995). Spotted anorthosite has speckling of dark orthopyroxene minerals giving
it a “spotted” appearance (Condie, 1992).
2.9 Summary of literature and hypothesis
The composition of run-of-mine ore strongly affects the target grind and energy
consumption in the comminution circuits. One of the key factors influencing the
performance that can be achieved with respect to each ore type in these devices is its
hardness or resistance to breakage (Napier-Munn et al., 1996). In particular, RoM ore
from the UG2 deposit contains different rock types namely chromitite, pyroxenite,
norite, spotted and mottled anorthosite.
RoM ore particles have been reported to be exposed to pre-weakening during blasting
and transportation to stockpile (Napier-Munn, 2014; Hahne et al. 2003). In addition,
weathering of rock particles also occurs on the stockpile. These processes induce
microflaws in the particles which act as stress raisers when the particle is under load
(Tavares & King, 1998). The presence of cracks thus makes the particle less resistant
to breakage and generates fine fragments (Schönert, 2004).
Therefore, it is hypothesized in the current study that:
➢ UG2 rock particles sourced from a run-of-mine ore stockpile break more readily
to produce a finer product than cut drill core samples from the shaft supplying
the same stockpile.
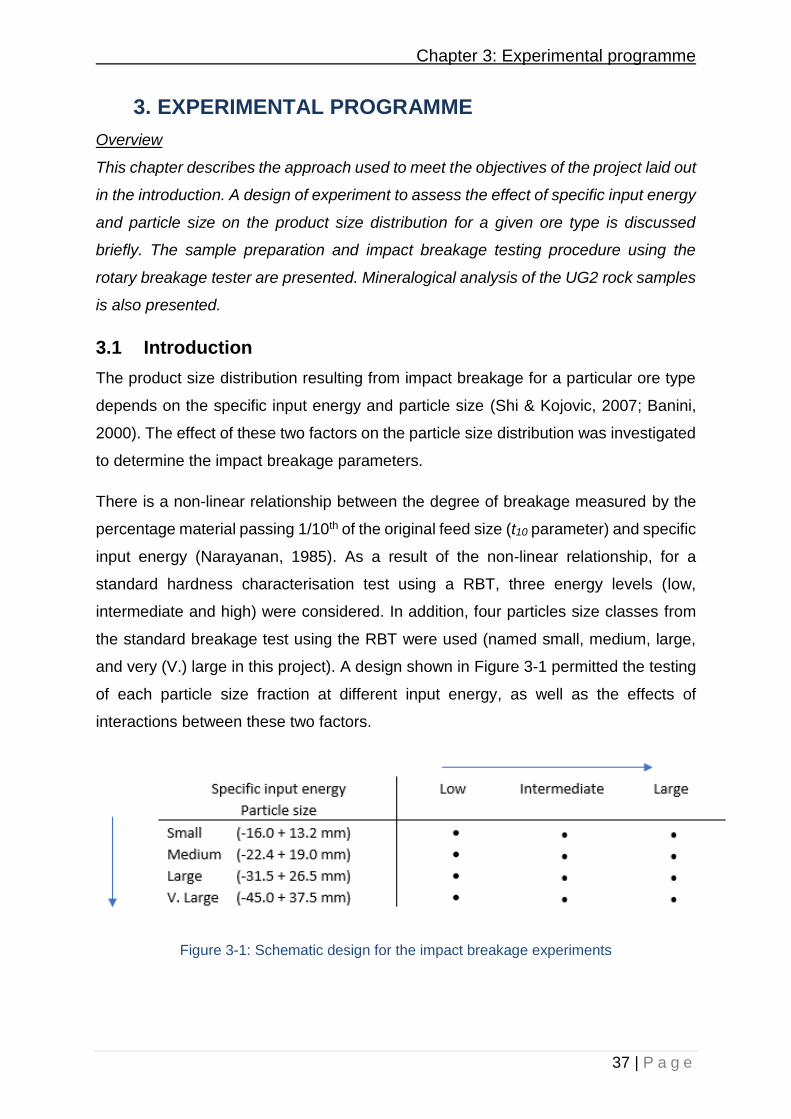
Chapter 3: Experimental programme
37 | P a g e
3. EXPERIMENTAL PROGRAMME
Overview
This chapter describes the approach used to meet the objectives of the project laid out
in the introduction. A design of experiment to assess the effect of specific input energy
and particle size on the product size distribution for a given ore type is discussed
briefly. The sample preparation and impact breakage testing procedure using the
rotary breakage tester are presented. Mineralogical analysis of the UG2 rock samples
is also presented.
3.1 Introduction
The product size distribution resulting from impact breakage for a particular ore type
depends on the specific input energy and particle size (Shi & Kojovic, 2007; Banini,
2000). The effect of these two factors on the particle size distribution was investigated
to determine the impact breakage parameters.
There is a non-linear relationship between the degree of breakage measured by the
percentage material passing 1/10th of the original feed size (t10 parameter) and specific
input energy (Narayanan, 1985). As a result of the non-linear relationship, for a
standard hardness characterisation test using a RBT, three energy levels (low,
intermediate and high) were considered. In addition, four particles size classes from
the standard breakage test using the RBT were used (named small, medium, large,
and very (V.) large in this project). A design shown in Figure 3-1 permitted the testing
of each particle size fraction at different input energy, as well as the effects of
interactions between these two factors.
Figure 3-1: Schematic design for the impact breakage experiments
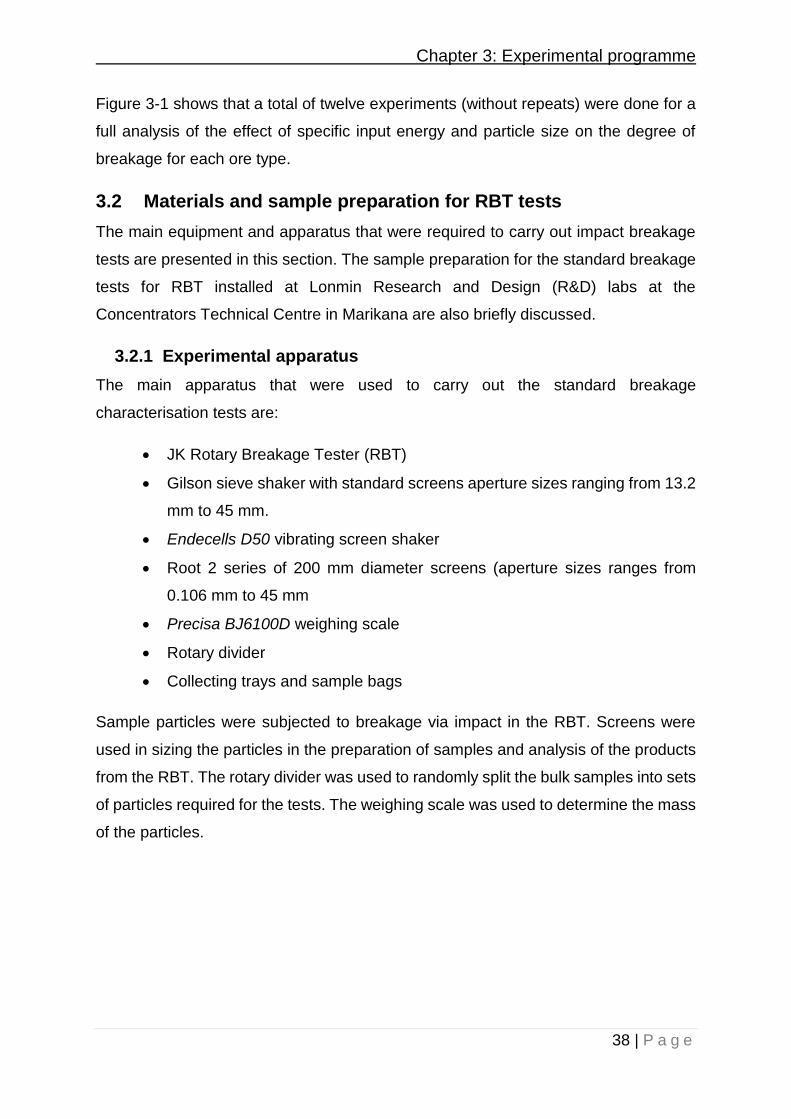
Chapter 3: Experimental programme
38 | P a g e
Figure 3-1 shows that a total of twelve experiments (without repeats) were done for a
full analysis of the effect of specific input energy and particle size on the degree of
breakage for each ore type.
3.2 Materials and sample preparation for RBT tests
The main equipment and apparatus that were required to carry out impact breakage
tests are presented in this section. The sample preparation for the standard breakage
tests for RBT installed at Lonmin Research and Design (R&D) labs at the
Concentrators Technical Centre in Marikana are also briefly discussed.
3.2.1 Experimental apparatus
The main apparatus that were used to carry out the standard breakage
characterisation tests are:
• JK Rotary Breakage Tester (RBT)
• Gilson sieve shaker with standard screens aperture sizes ranging from 13.2
mm to 45 mm.
• Endecells D50 vibrating screen shaker
• Root 2 series of 200 mm diameter screens (aperture sizes ranges from
0.106 mm to 45 mm
• Precisa BJ6100D weighing scale
• Rotary divider
• Collecting trays and sample bags
Sample particles were subjected to breakage via impact in the RBT. Screens were
used in sizing the particles in the preparation of samples and analysis of the products
from the RBT. The rotary divider was used to randomly split the bulk samples into sets
of particles required for the tests. The weighing scale was used to determine the mass
of the particles.
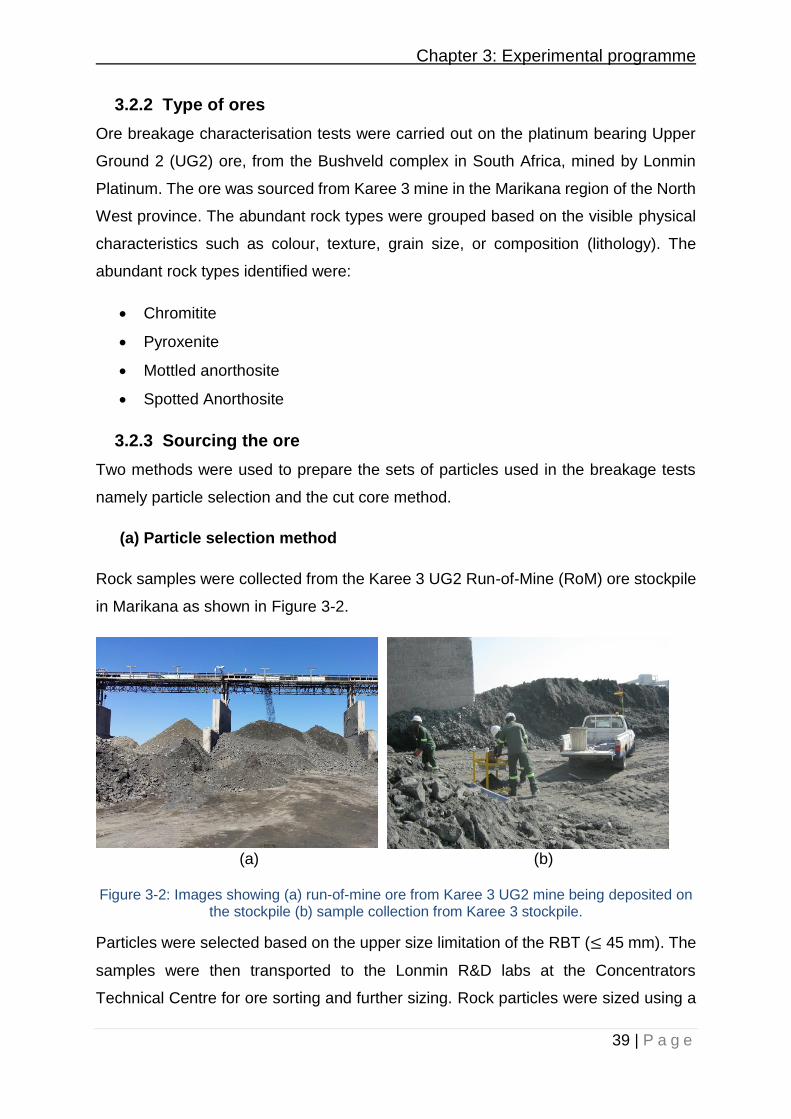
Chapter 3: Experimental programme
39 | P a g e
3.2.2 Type of ores
Ore breakage characterisation tests were carried out on the platinum bearing Upper
Ground 2 (UG2) ore, from the Bushveld complex in South Africa, mined by Lonmin
Platinum. The ore was sourced from Karee 3 mine in the Marikana region of the North
West province. The abundant rock types were grouped based on the visible physical
characteristics such as colour, texture, grain size, or composition (lithology). The
abundant rock types identified were:
• Chromitite
• Pyroxenite
• Mottled anorthosite
• Spotted Anorthosite
3.2.3 Sourcing the ore
Two methods were used to prepare the sets of particles used in the breakage tests
namely particle selection and the cut core method.
(a) Particle selection method
Rock samples were collected from the Karee 3 UG2 Run-of-Mine (RoM) ore stockpile
in Marikana as shown in Figure 3-2.
(a) (b)
Figure 3-2: Images showing (a) run-of-mine ore from Karee 3 UG2 mine being deposited on the stockpile (b) sample collection from Karee 3 stockpile.
Particles were selected based on the upper size limitation of the RBT (≤ 45 mm). The
samples were then transported to the Lonmin R&D labs at the Concentrators
Technical Centre for ore sorting and further sizing. Rock particles were sized using a
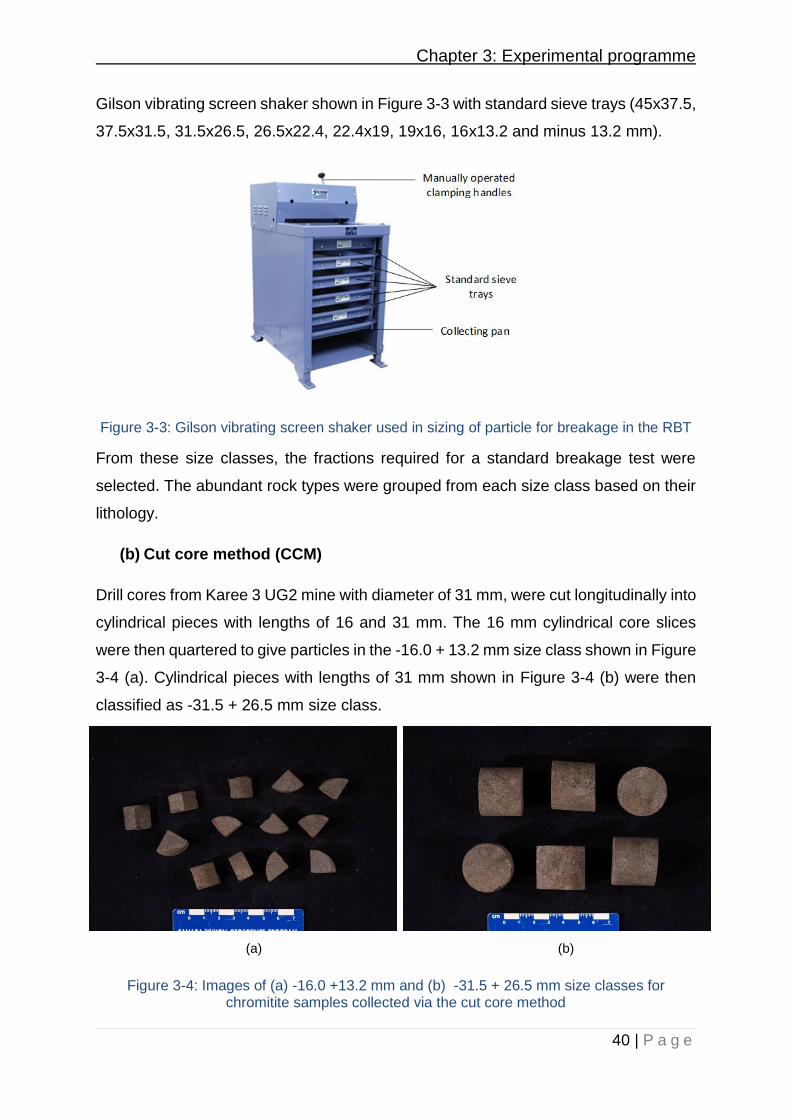
Chapter 3: Experimental programme
40 | P a g e
Gilson vibrating screen shaker shown in Figure 3-3 with standard sieve trays (45x37.5,
37.5x31.5, 31.5x26.5, 26.5x22.4, 22.4x19, 19x16, 16x13.2 and minus 13.2 mm).
Figure 3-3: Gilson vibrating screen shaker used in sizing of particle for breakage in the RBT
From these size classes, the fractions required for a standard breakage test were
selected. The abundant rock types were grouped from each size class based on their
lithology.
(b) Cut core method (CCM)
Drill cores from Karee 3 UG2 mine with diameter of 31 mm, were cut longitudinally into
cylindrical pieces with lengths of 16 and 31 mm. The 16 mm cylindrical core slices
were then quartered to give particles in the -16.0 + 13.2 mm size class shown in Figure
3-4 (a). Cylindrical pieces with lengths of 31 mm shown in Figure 3-4 (b) were then
classified as -31.5 + 26.5 mm size class.
(a) (b)
Figure 3-4: Images of (a) -16.0 +13.2 mm and (b) -31.5 + 26.5 mm size classes for chromitite samples collected via the cut core method

Chapter 3: Experimental programme
41 | P a g e
3.2.4 Sizing particles for RBT tests
Four size classes were required for a standard test using the RBT. These size classes
were named small (-16 + 13.2 mm), medium (-22.4 + 19 mm), large (-31.5 + 26.5 mm)
and very large (-45 + 37.5 mm).
For a standard test, 3 sets of 30 particles for each size class were required. To ensure
that samples were representative, a rotary divider in Figure 3-5 was used to randomly
split the finer fractions (small and medium) into the splitter containers.
Figure 3-5: Rotary divider used to split particles
The bulk samples were fed into the feed hopper. The samples were channelled down
the vibrating feed chute into different splitter containers on a rotating table shown in
Figure 3-5.
The particles in the splitter containers were sub divided into sets of 30 particles for
each size fraction as shown in Figure 3-6. The large and very large size fractions were
randomly hand-picked into different sets because of the size limitation of the rotary
splitter.
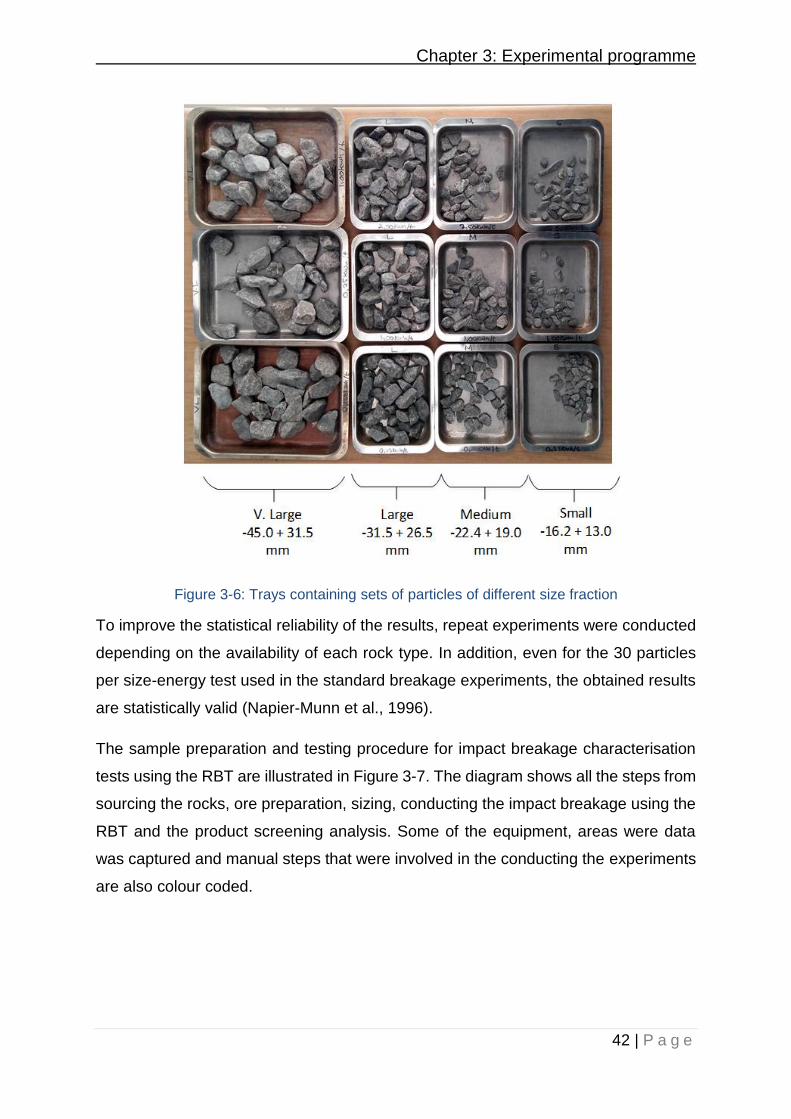
Chapter 3: Experimental programme
42 | P a g e
Figure 3-6: Trays containing sets of particles of different size fraction
To improve the statistical reliability of the results, repeat experiments were conducted
depending on the availability of each rock type. In addition, even for the 30 particles
per size-energy test used in the standard breakage experiments, the obtained results
are statistically valid (Napier-Munn et al., 1996).
The sample preparation and testing procedure for impact breakage characterisation
tests using the RBT are illustrated in Figure 3-7. The diagram shows all the steps from
sourcing the rocks, ore preparation, sizing, conducting the impact breakage using the
RBT and the product screening analysis. Some of the equipment, areas were data
was captured and manual steps that were involved in the conducting the experiments
are also colour coded.

Chapter 3: Experimental programme
43 | P a g e
Figure 3-7: JK RBT sample preparation and testing protocol (adapted from JKMRC Rotary Breakage Tester, 2012)
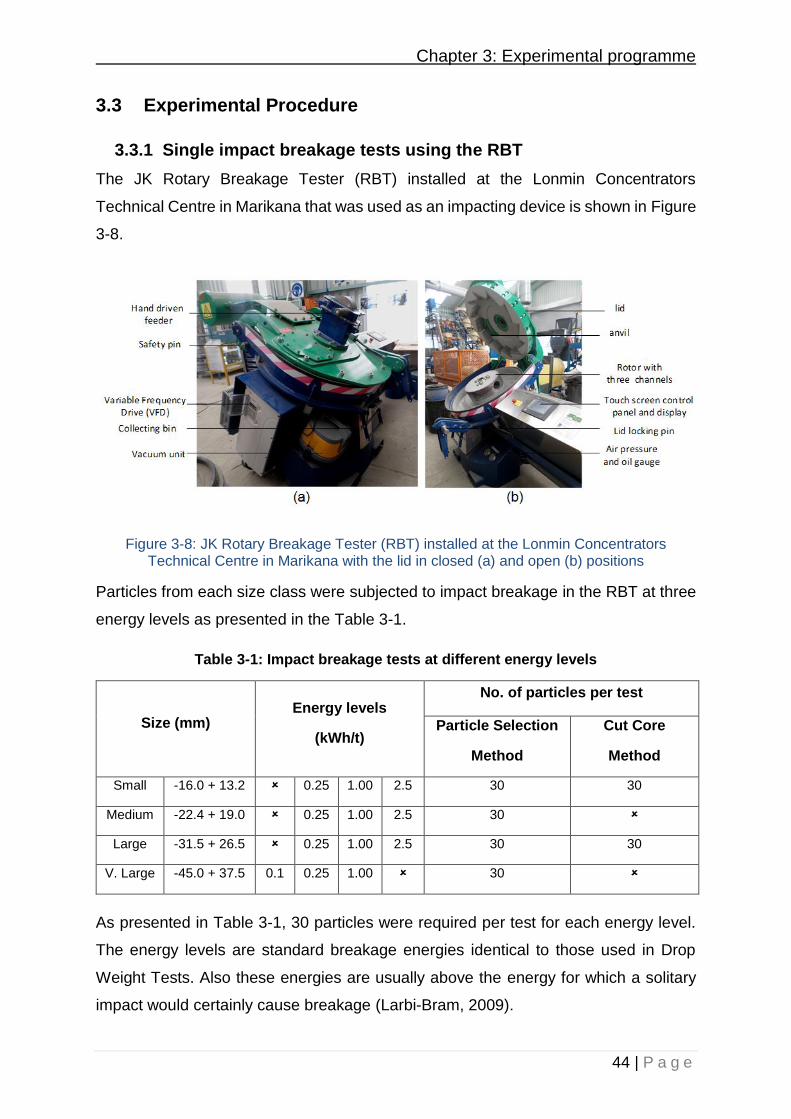
Chapter 3: Experimental programme
44 | P a g e
3.3 Experimental Procedure
3.3.1 Single impact breakage tests using the RBT
The JK Rotary Breakage Tester (RBT) installed at the Lonmin Concentrators
Technical Centre in Marikana that was used as an impacting device is shown in Figure
3-8.
Figure 3-8: JK Rotary Breakage Tester (RBT) installed at the Lonmin Concentrators Technical Centre in Marikana with the lid in closed (a) and open (b) positions
Particles from each size class were subjected to impact breakage in the RBT at three
energy levels as presented in the Table 3-1.
Table 3-1: Impact breakage tests at different energy levels
Size (mm) Energy levels
(kWh/t)
No. of particles per test
Particle Selection
Method
Cut Core
Method
Small -16.0 + 13.2 0.25 1.00 2.5 30 30
Medium -22.4 + 19.0 0.25 1.00 2.5 30
Large -31.5 + 26.5 0.25 1.00 2.5 30 30
V. Large -45.0 + 37.5 0.1 0.25 1.00 30
As presented in Table 3-1, 30 particles were required per test for each energy level.
The energy levels are standard breakage energies identical to those used in Drop
Weight Tests. Also these energies are usually above the energy for which a solitary
impact would certainly cause breakage (Larbi-Bram, 2009).
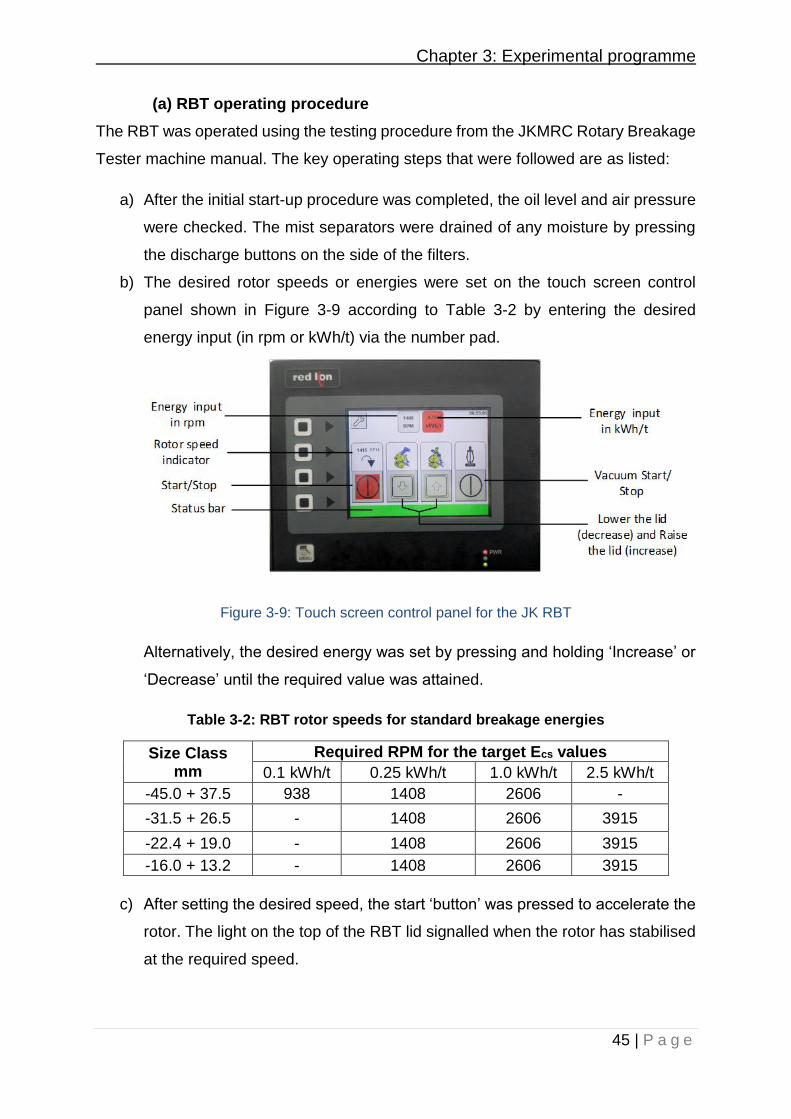
Chapter 3: Experimental programme
45 | P a g e
(a) RBT operating procedure
The RBT was operated using the testing procedure from the JKMRC Rotary Breakage
Tester machine manual. The key operating steps that were followed are as listed:
a) After the initial start-up procedure was completed, the oil level and air pressure
were checked. The mist separators were drained of any moisture by pressing
the discharge buttons on the side of the filters.
b) The desired rotor speeds or energies were set on the touch screen control
panel shown in Figure 3-9 according to Table 3-2 by entering the desired
energy input (in rpm or kWh/t) via the number pad.
Figure 3-9: Touch screen control panel for the JK RBT
Alternatively, the desired energy was set by pressing and holding ‘Increase’ or
‘Decrease’ until the required value was attained.
Table 3-2: RBT rotor speeds for standard breakage energies
Size Class mm
Required RPM for the target Ecs values
0.1 kWh/t 0.25 kWh/t 1.0 kWh/t 2.5 kWh/t
-45.0 + 37.5 938 1408 2606 -
-31.5 + 26.5 - 1408 2606 3915
-22.4 + 19.0 - 1408 2606 3915
-16.0 + 13.2 - 1408 2606 3915
c) After setting the desired speed, the start ‘button’ was pressed to accelerate the
rotor. The light on the top of the RBT lid signalled when the rotor has stabilised
at the required speed.
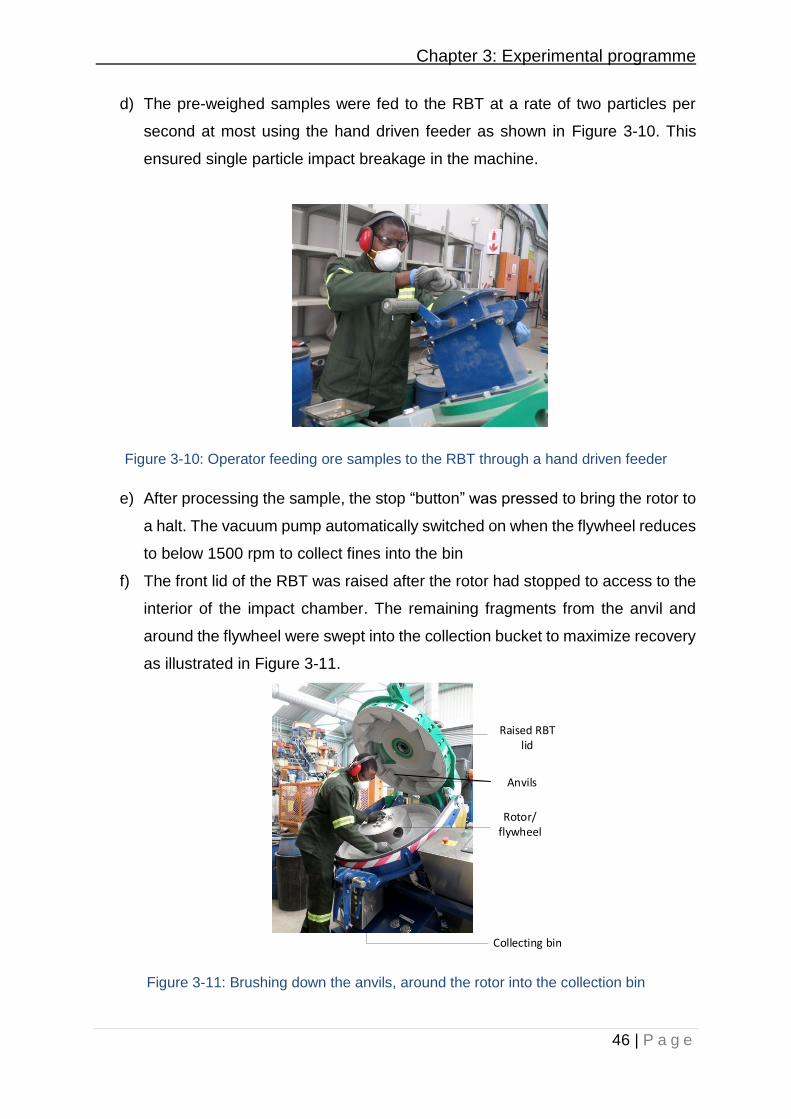
Chapter 3: Experimental programme
46 | P a g e
d) The pre-weighed samples were fed to the RBT at a rate of two particles per
second at most using the hand driven feeder as shown in Figure 3-10. This
ensured single particle impact breakage in the machine.
Figure 3-10: Operator feeding ore samples to the RBT through a hand driven feeder
e) After processing the sample, the stop “button” was pressed to bring the rotor to
a halt. The vacuum pump automatically switched on when the flywheel reduces
to below 1500 rpm to collect fines into the bin
f) The front lid of the RBT was raised after the rotor had stopped to access to the
interior of the impact chamber. The remaining fragments from the anvil and
around the flywheel were swept into the collection bucket to maximize recovery
as illustrated in Figure 3-11.
Raised RBT lid
Anvils
Rotor/ flywheel
Collecting bin
Figure 3-11: Brushing down the anvils, around the rotor into the collection bin
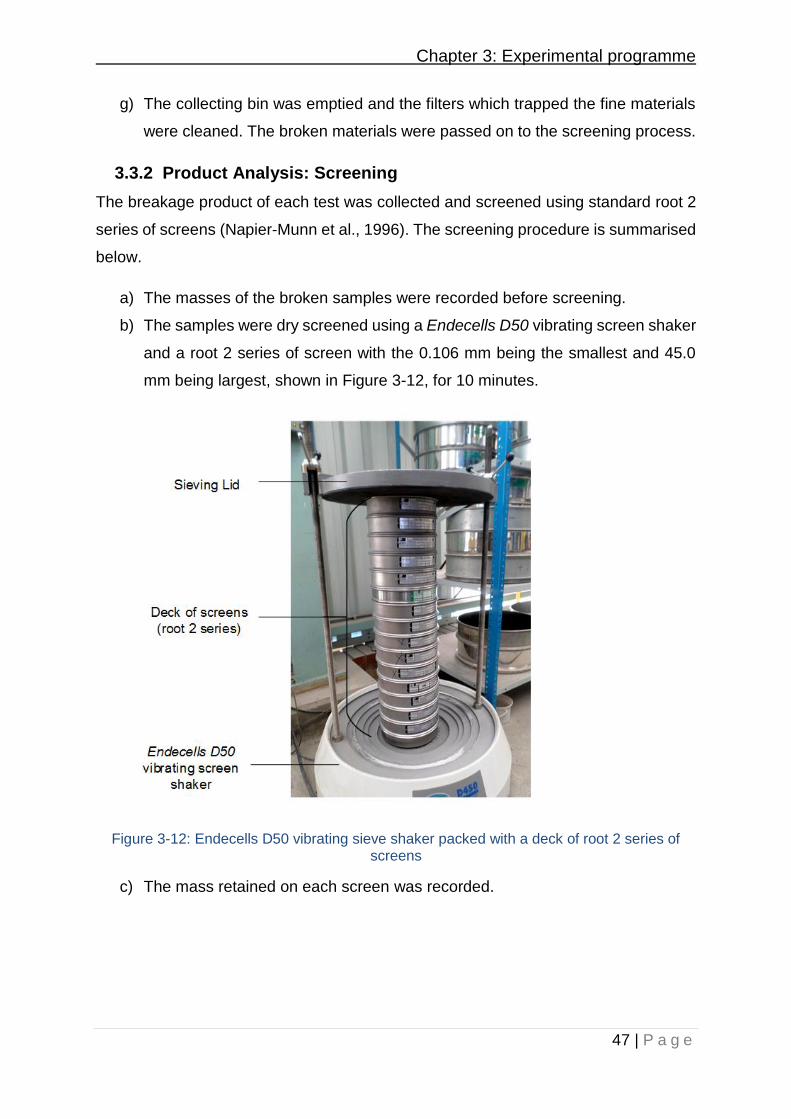
Chapter 3: Experimental programme
47 | P a g e
g) The collecting bin was emptied and the filters which trapped the fine materials
were cleaned. The broken materials were passed on to the screening process.
3.3.2 Product Analysis: Screening
The breakage product of each test was collected and screened using standard root 2
series of screens (Napier-Munn et al., 1996). The screening procedure is summarised
below.
a) The masses of the broken samples were recorded before screening.
b) The samples were dry screened using a Endecells D50 vibrating screen shaker
and a root 2 series of screen with the 0.106 mm being the smallest and 45.0
mm being largest, shown in Figure 3-12, for 10 minutes.
Figure 3-12: Endecells D50 vibrating sieve shaker packed with a deck of root 2 series of screens
c) The mass retained on each screen was recorded.
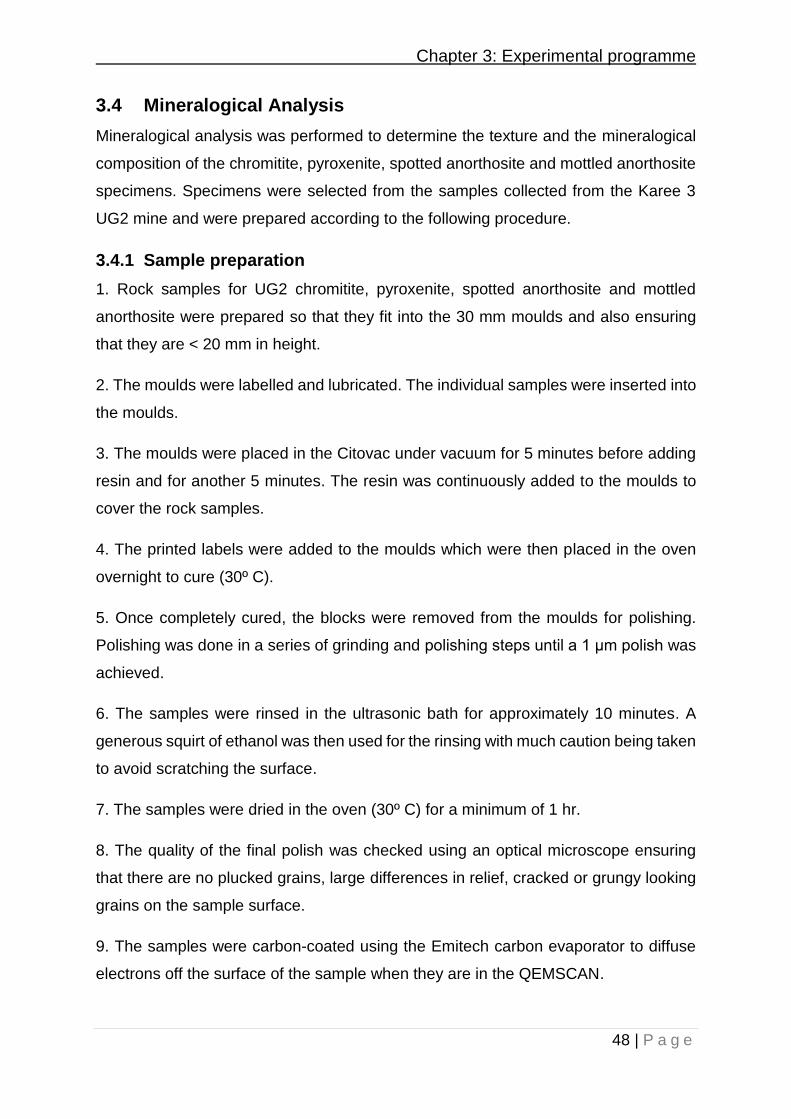
Chapter 3: Experimental programme
48 | P a g e
3.4 Mineralogical Analysis
Mineralogical analysis was performed to determine the texture and the mineralogical
composition of the chromitite, pyroxenite, spotted anorthosite and mottled anorthosite
specimens. Specimens were selected from the samples collected from the Karee 3
UG2 mine and were prepared according to the following procedure.
3.4.1 Sample preparation
1. Rock samples for UG2 chromitite, pyroxenite, spotted anorthosite and mottled
anorthosite were prepared so that they fit into the 30 mm moulds and also ensuring
that they are < 20 mm in height.
2. The moulds were labelled and lubricated. The individual samples were inserted into
the moulds.
3. The moulds were placed in the Citovac under vacuum for 5 minutes before adding
resin and for another 5 minutes. The resin was continuously added to the moulds to
cover the rock samples.
4. The printed labels were added to the moulds which were then placed in the oven
overnight to cure (30º C).
5. Once completely cured, the blocks were removed from the moulds for polishing.
Polishing was done in a series of grinding and polishing steps until a 1 μm polish was
achieved.
6. The samples were rinsed in the ultrasonic bath for approximately 10 minutes. A
generous squirt of ethanol was then used for the rinsing with much caution being taken
to avoid scratching the surface.
7. The samples were dried in the oven (30º C) for a minimum of 1 hr.
8. The quality of the final polish was checked using an optical microscope ensuring
that there are no plucked grains, large differences in relief, cracked or grungy looking
grains on the sample surface.
9. The samples were carbon-coated using the Emitech carbon evaporator to diffuse
electrons off the surface of the sample when they are in the QEMSCAN.
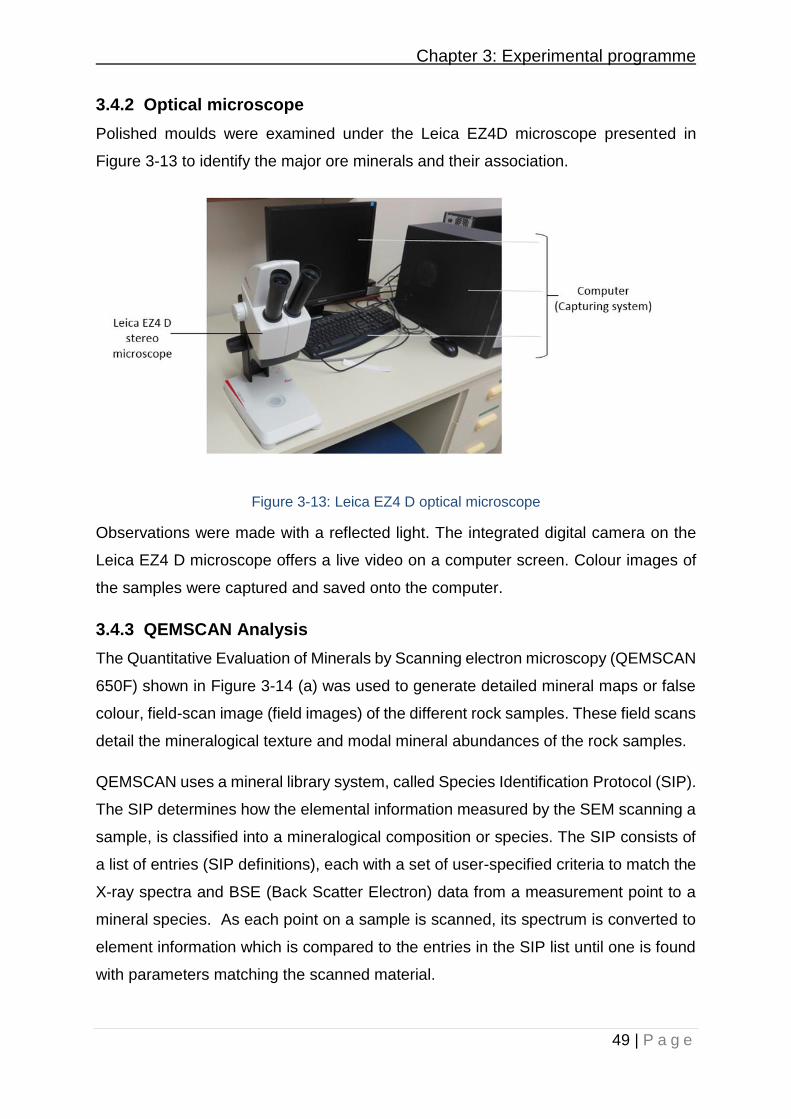
Chapter 3: Experimental programme
49 | P a g e
3.4.2 Optical microscope
Polished moulds were examined under the Leica EZ4D microscope presented in
Figure 3-13 to identify the major ore minerals and their association.
Figure 3-13: Leica EZ4 D optical microscope
Observations were made with a reflected light. The integrated digital camera on the
Leica EZ4 D microscope offers a live video on a computer screen. Colour images of
the samples were captured and saved onto the computer.
3.4.3 QEMSCAN Analysis
The Quantitative Evaluation of Minerals by Scanning electron microscopy (QEMSCAN
650F) shown in Figure 3-14 (a) was used to generate detailed mineral maps or false
colour, field-scan image (field images) of the different rock samples. These field scans
detail the mineralogical texture and modal mineral abundances of the rock samples.
QEMSCAN uses a mineral library system, called Species Identification Protocol (SIP).
The SIP determines how the elemental information measured by the SEM scanning a
sample, is classified into a mineralogical composition or species. The SIP consists of
a list of entries (SIP definitions), each with a set of user-specified criteria to match the
X-ray spectra and BSE (Back Scatter Electron) data from a measurement point to a
mineral species. As each point on a sample is scanned, its spectrum is converted to
element information which is compared to the entries in the SIP list until one is found
with parameters matching the scanned material.
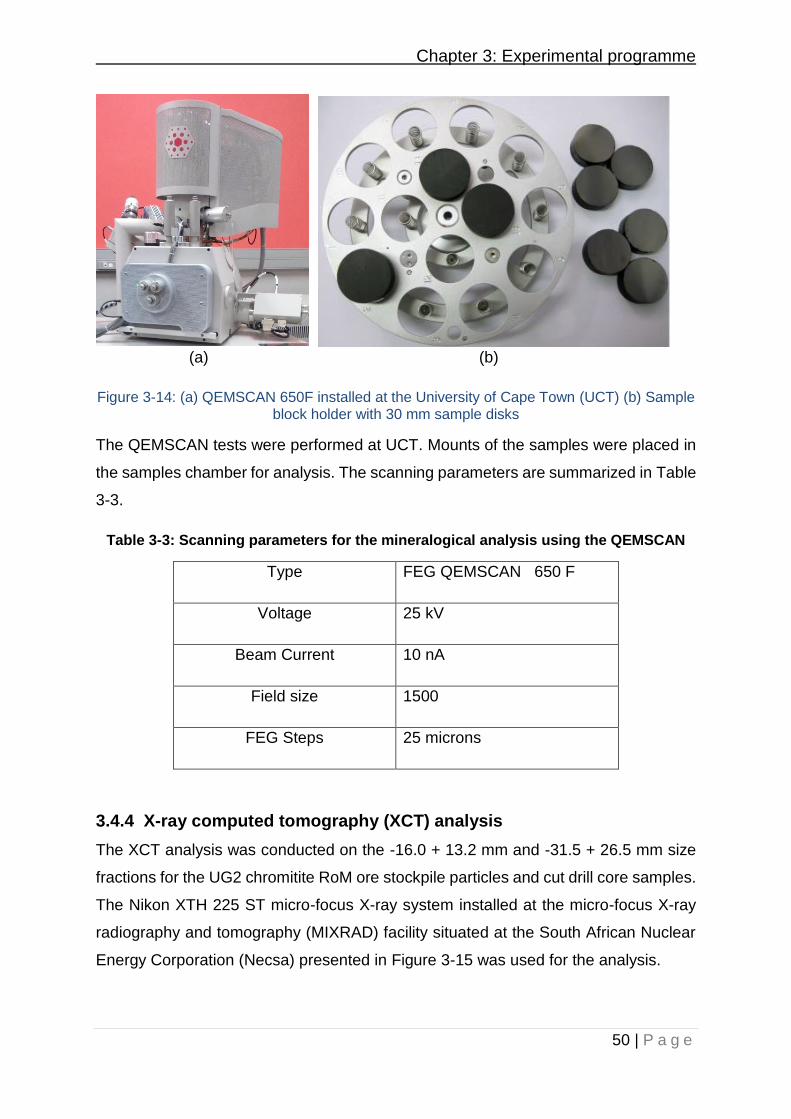
Chapter 3: Experimental programme
50 | P a g e
(a) (b)
Figure 3-14: (a) QEMSCAN 650F installed at the University of Cape Town (UCT) (b) Sample block holder with 30 mm sample disks
The QEMSCAN tests were performed at UCT. Mounts of the samples were placed in
the samples chamber for analysis. The scanning parameters are summarized in Table
3-3.
Table 3-3: Scanning parameters for the mineralogical analysis using the QEMSCAN
Type FEG QEMSCAN 650 F
Voltage 25 kV
Beam Current 10 nA
Field size 1500
FEG Steps 25 microns
3.4.4 X-ray computed tomography (XCT) analysis
The XCT analysis was conducted on the -16.0 + 13.2 mm and -31.5 + 26.5 mm size
fractions for the UG2 chromitite RoM ore stockpile particles and cut drill core samples.
The Nikon XTH 225 ST micro-focus X-ray system installed at the micro-focus X-ray
radiography and tomography (MIXRAD) facility situated at the South African Nuclear
Energy Corporation (Necsa) presented in Figure 3-15 was used for the analysis.
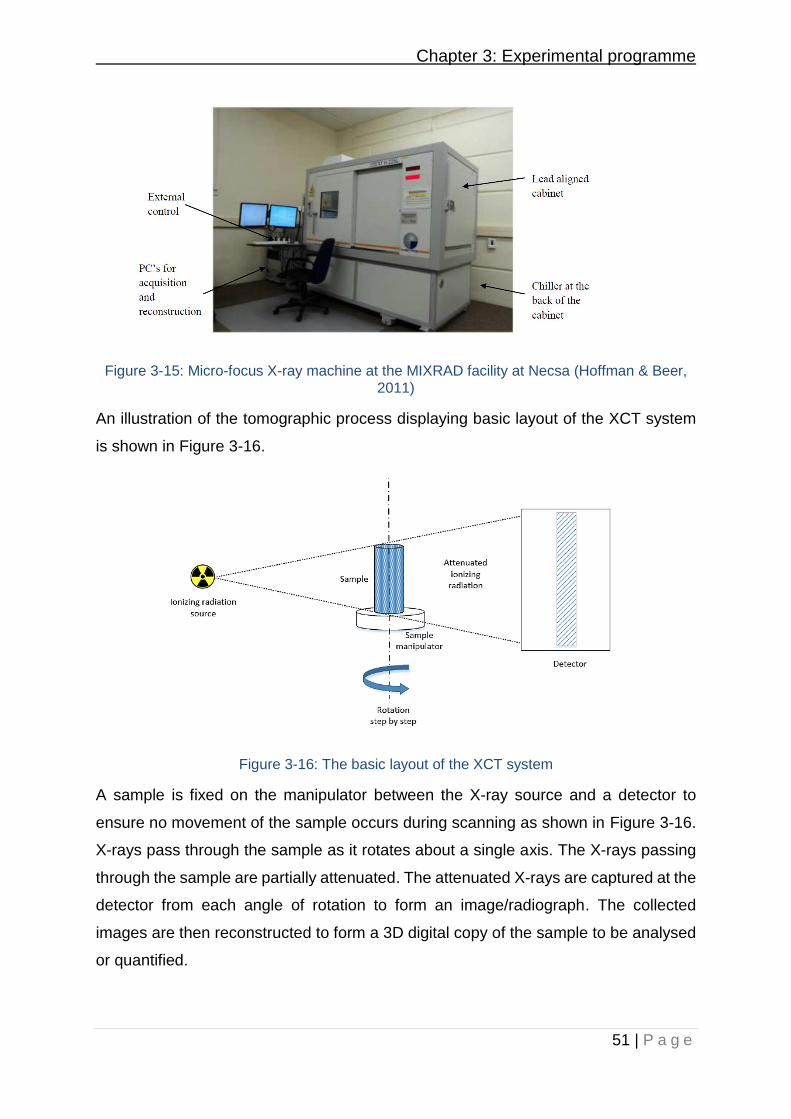
Chapter 3: Experimental programme
51 | P a g e
Figure 3-15: Micro-focus X-ray machine at the MIXRAD facility at Necsa (Hoffman & Beer, 2011)
An illustration of the tomographic process displaying basic layout of the XCT system
is shown in Figure 3-16.
Figure 3-16: The basic layout of the XCT system
A sample is fixed on the manipulator between the X-ray source and a detector to
ensure no movement of the sample occurs during scanning as shown in Figure 3-16.
X-rays pass through the sample as it rotates about a single axis. The X-rays passing
through the sample are partially attenuated. The attenuated X-rays are captured at the
detector from each angle of rotation to form an image/radiograph. The collected
images are then reconstructed to form a 3D digital copy of the sample to be analysed
or quantified.
Chapter 3: Experimental programme
52 | P a g e
The UG2 chromitite particles were scanned using the parameters summarised in
Table 3-4.
Table 3-4: Experimental conditions used for XCT measurements
Voltage 140 kV
Current 100 µA
Exposure time 2 seconds
Number of frames 1000 images
Resolution/pixel size 20 µm

Chapter 4: Results and Discussion
53 | P a g e
4. RESULTS AND DISCUSSIONOverview
This chapter presents and discusses the results obtained from the experimental work
performed to meet the objectives of this study. The breakage properties of different
rock types from the UG2 ore deposit obtained from the Marikana region in the North
West Province in South Africa were determined using the RBT as a characterisation
device.
4.1 Introduction
As summarized in section 3.2, run-of-mine (RoM) ore and drill core samples were
sourced from Karee 3 (K3) UG2 shaft mined by Lonmin Platinum in the Marikana
region. The RoM samples were screened into four size classes required for a standard
breakage test using the RBT namely; -16 + 13.2 mm, -22.4 + 19 mm, -31.5 + 26.5 mm
and -45 + 37.5 mm. In this thesis, these size classes were named small, medium,
large and very large respectively. The available drill cores of diameter 30 mm were cut
into small and large particles.
Four main rock types namely; chromitite, pyroxenite, spotted anorthosite and mottled
anorthosite, were identified from the samples based on visible physical characteristics
such as colour, texture, grain size and composition. The mineralogical analysis of each
of these rock types was conducted using an optical microscope and a QEMSCAN.
This was done to establish a link between the mineralogical properties of the rocks
and their breakage properties.
To determine breakage characteristics of the main rock types sourced from UG2 ore
deposit, particles from each size class were subjected to impact breakage using the
RBT. Three energy levels were used as required for a standard breakage test
described in the previous chapter. For each full breakage characterization test, 12
product samples were thus generated. The effects of energy input on the progeny
particles were explored. The progeny particle size distribution and degree of breakage
attained for each rock type for a particular size class and specific energy input are
presented and discussed. An evaluation of energy-size relationships of each rock type
and breakage parameters obtained from fitting the standard hardness characterisation
models are presented in this chapter.
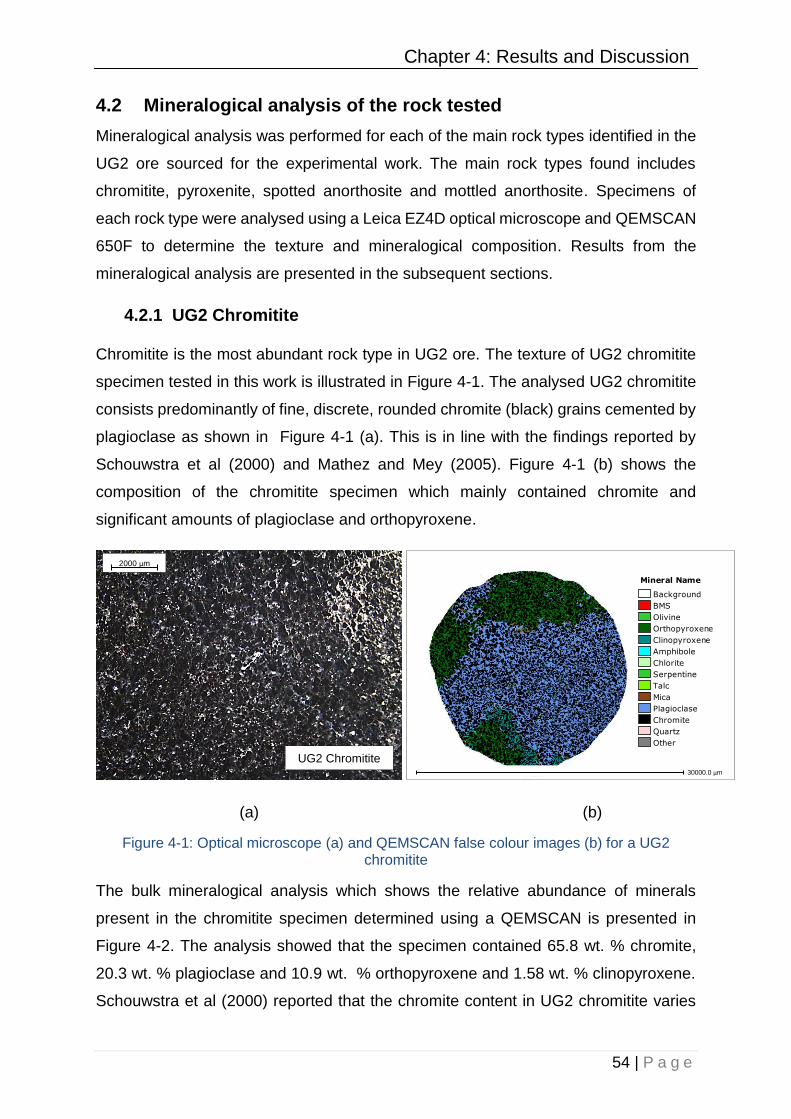
Chapter 4: Results and Discussion
54 | P a g e
4.2 Mineralogical analysis of the rock tested
Mineralogical analysis was performed for each of the main rock types identified in the
UG2 ore sourced for the experimental work. The main rock types found includes
chromitite, pyroxenite, spotted anorthosite and mottled anorthosite. Specimens of
each rock type were analysed using a Leica EZ4D optical microscope and QEMSCAN
650F to determine the texture and mineralogical composition. Results from the
mineralogical analysis are presented in the subsequent sections.
4.2.1 UG2 Chromitite
Chromitite is the most abundant rock type in UG2 ore. The texture of UG2 chromitite
specimen tested in this work is illustrated in Figure 4-1. The analysed UG2 chromitite
consists predominantly of fine, discrete, rounded chromite (black) grains cemented by
plagioclase as shown in Figure 4-1 (a). This is in line with the findings reported by
Schouwstra et al (2000) and Mathez and Mey (2005). Figure 4-1 (b) shows the
composition of the chromitite specimen which mainly contained chromite and
significant amounts of plagioclase and orthopyroxene.
(a) (b)
Figure 4-1: Optical microscope (a) and QEMSCAN false colour images (b) for a UG2 chromitite
The bulk mineralogical analysis which shows the relative abundance of minerals
present in the chromitite specimen determined using a QEMSCAN is presented in
Figure 4-2. The analysis showed that the specimen contained 65.8 wt. % chromite,
20.3 wt. % plagioclase and 10.9 wt. % orthopyroxene and 1.58 wt. % clinopyroxene.
Schouwstra et al (2000) reported that the chromite content in UG2 chromitite varies
Background 495 0
BMS 1035 0
Olivine 546 0
Orthopyroxene 80667 0
Clinopyroxene 13140 0
Amphibole 2251 0
Chlorite 3332 0
Serpentine 72 0
Talc 234 0
Mica 3849 0
Plagioclase 212522 0
Chromite 377755 0
Quartz 6 0
Other 2081 0
Mineral Name Shape fact…
UG2 Chromitite
2000 µm
30000.0 µm
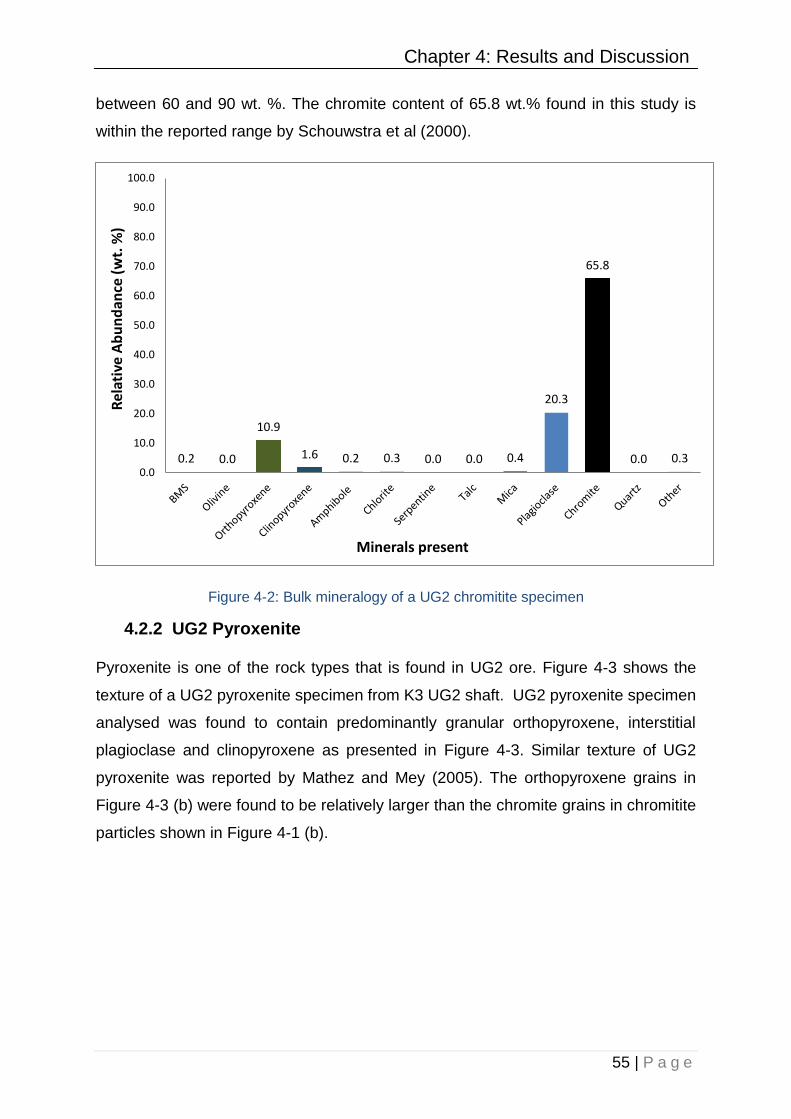
Chapter 4: Results and Discussion
55 | P a g e
between 60 and 90 wt. %. The chromite content of 65.8 wt.% found in this study is
within the reported range by Schouwstra et al (2000).
Figure 4-2: Bulk mineralogy of a UG2 chromitite specimen
4.2.2 UG2 Pyroxenite
Pyroxenite is one of the rock types that is found in UG2 ore. Figure 4-3 shows the
texture of a UG2 pyroxenite specimen from K3 UG2 shaft. UG2 pyroxenite specimen
analysed was found to contain predominantly granular orthopyroxene, interstitial
plagioclase and clinopyroxene as presented in Figure 4-3. Similar texture of UG2
pyroxenite was reported by Mathez and Mey (2005). The orthopyroxene grains in
Figure 4-3 (b) were found to be relatively larger than the chromite grains in chromitite
particles shown in Figure 4-1 (b).
0.2 0.0
10.9
1.6 0.2 0.3 0.0 0.0 0.4
20.3
65.8
0.0 0.30.0
10.0
20.0
30.0
40.0
50.0
60.0
70.0
80.0
90.0
100.0
Rel
ativ
e A
bu
nd
ance
(w
t. %
)
Minerals present
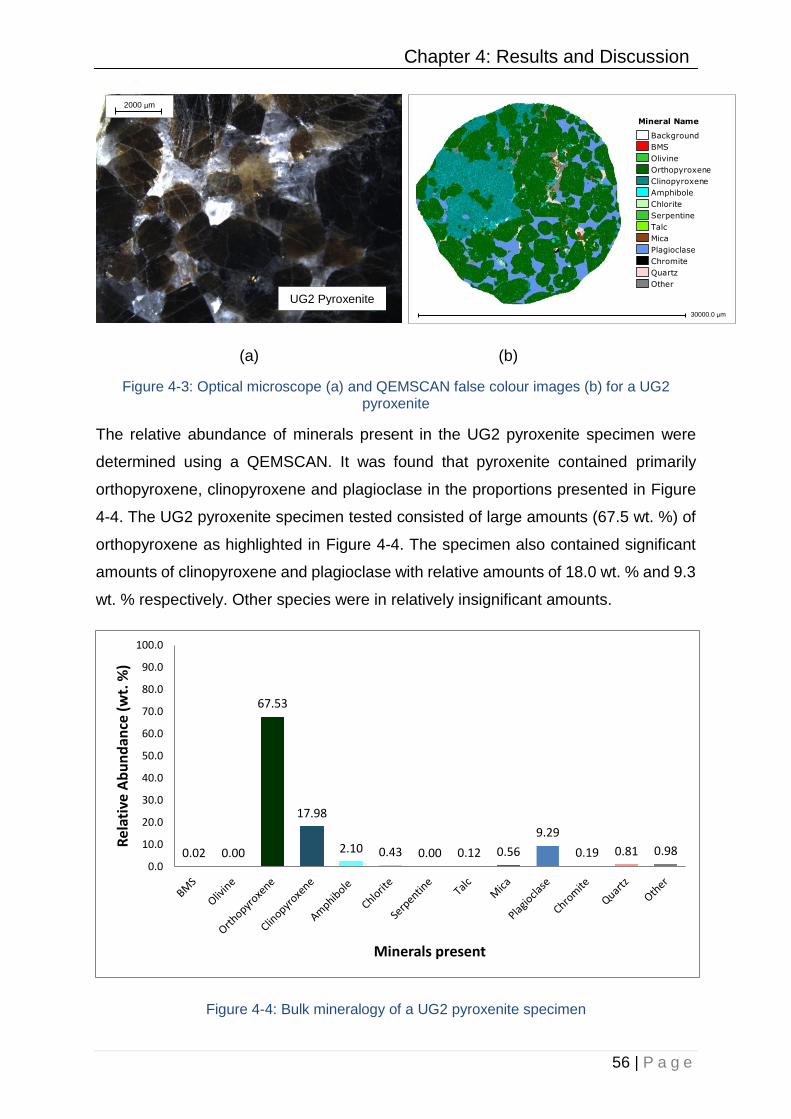
Chapter 4: Results and Discussion
56 | P a g e
(a) (b)
Figure 4-3: Optical microscope (a) and QEMSCAN false colour images (b) for a UG2 pyroxenite
The relative abundance of minerals present in the UG2 pyroxenite specimen were
determined using a QEMSCAN. It was found that pyroxenite contained primarily
orthopyroxene, clinopyroxene and plagioclase in the proportions presented in Figure
4-4. The UG2 pyroxenite specimen tested consisted of large amounts (67.5 wt. %) of
orthopyroxene as highlighted in Figure 4-4. The specimen also contained significant
amounts of clinopyroxene and plagioclase with relative amounts of 18.0 wt. % and 9.3
wt. % respectively. Other species were in relatively insignificant amounts.
Figure 4-4: Bulk mineralogy of a UG2 pyroxenite specimen
0.02 0.00
67.53
17.98
2.10 0.43 0.00 0.12 0.56
9.29
0.19 0.81 0.980.0
10.0
20.0
30.0
40.0
50.0
60.0
70.0
80.0
90.0
100.0
Rel
ativ
e A
bu
nd
ance
(w
t. %
)
Minerals present
Background 495 0
BMS 1035 0
Olivine 546 0
Orthopyroxene 80667 0
Clinopyroxene 13140 0
Amphibole 2251 0
Chlorite 3332 0
Serpentine 72 0
Talc 234 0
Mica 3849 0
Plagioclase 212522 0
Chromite 377755 0
Quartz 6 0
Other 2081 0
Mineral Name Shape fact…
UG2 Pyroxenite
2000 µm
30000.0 µm
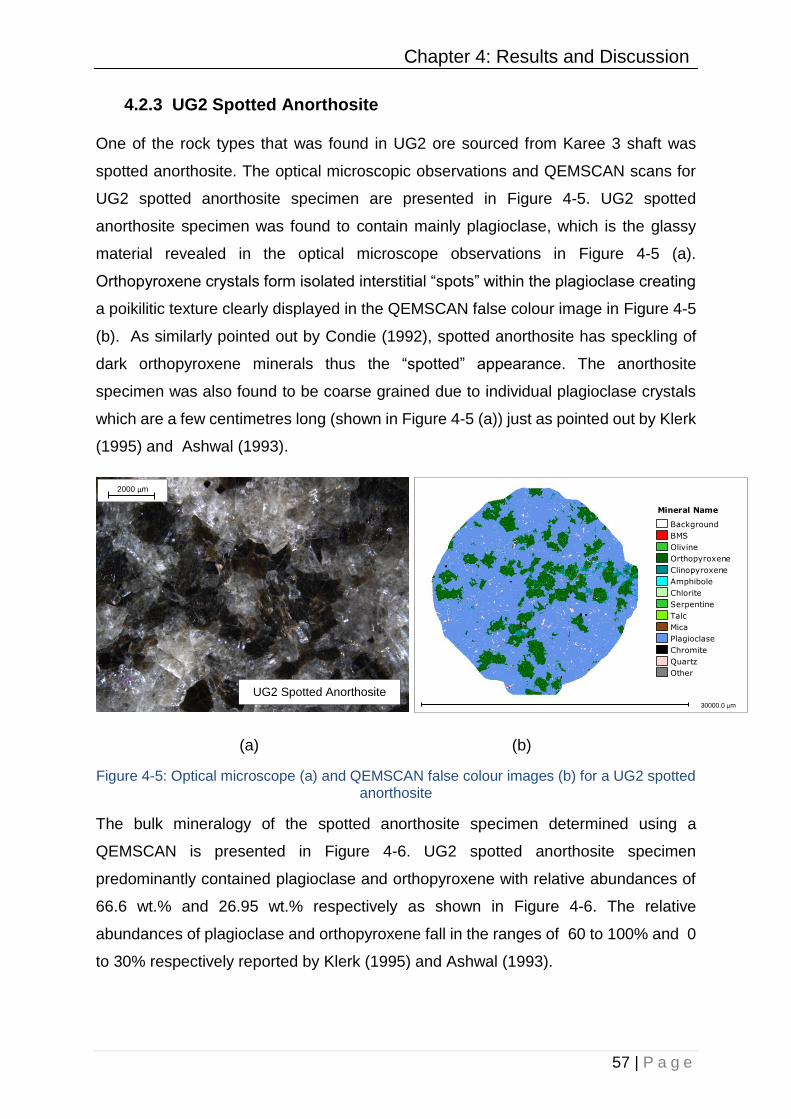
Chapter 4: Results and Discussion
57 | P a g e
4.2.3 UG2 Spotted Anorthosite
One of the rock types that was found in UG2 ore sourced from Karee 3 shaft was
spotted anorthosite. The optical microscopic observations and QEMSCAN scans for
UG2 spotted anorthosite specimen are presented in Figure 4-5. UG2 spotted
anorthosite specimen was found to contain mainly plagioclase, which is the glassy
material revealed in the optical microscope observations in Figure 4-5 (a).
Orthopyroxene crystals form isolated interstitial “spots” within the plagioclase creating
a poikilitic texture clearly displayed in the QEMSCAN false colour image in Figure 4-5
(b). As similarly pointed out by Condie (1992), spotted anorthosite has speckling of
dark orthopyroxene minerals thus the “spotted” appearance. The anorthosite
specimen was also found to be coarse grained due to individual plagioclase crystals
which are a few centimetres long (shown in Figure 4-5 (a)) just as pointed out by Klerk
(1995) and Ashwal (1993).
(a) (b)
Figure 4-5: Optical microscope (a) and QEMSCAN false colour images (b) for a UG2 spotted anorthosite
The bulk mineralogy of the spotted anorthosite specimen determined using a
QEMSCAN is presented in Figure 4-6. UG2 spotted anorthosite specimen
predominantly contained plagioclase and orthopyroxene with relative abundances of
66.6 wt.% and 26.95 wt.% respectively as shown in Figure 4-6. The relative
abundances of plagioclase and orthopyroxene fall in the ranges of 60 to 100% and 0
to 30% respectively reported by Klerk (1995) and Ashwal (1993).
Background 495 0
BMS 1035 0
Olivine 546 0
Orthopyroxene 80667 0
Clinopyroxene 13140 0
Amphibole 2251 0
Chlorite 3332 0
Serpentine 72 0
Talc 234 0
Mica 3849 0
Plagioclase 212522 0
Chromite 377755 0
Quartz 6 0
Other 2081 0
Mineral Name Shape fact…
UG2 Spotted Anorthosite
2000 µm
30000.0 µm

Chapter 4: Results and Discussion
58 | P a g e
Figure 4-6: Bulk mineralogy of a UG2 spotted anorthosite specimen
4.2.4 UG2 Mottled Anorthosite
Mottled anorthosite is another abundant rock type that was found in UG2 ore. The
texture of the UG2 mottled anorthosite specimen tested is illustrated in the optical
microscopic and QEMSCAN false colour images in Figure 4-7. UG2 mottled
anorthosite is dominated by plagioclase Figure 4-7 (b). Klerk (1995) found that in
mottled anorthosite, pyroxene minerals create grey mottles giving a blotched
appearance. However, the specimen tested did not display the blotched appearance
as described by Klerk (1995) because of negligible amounts of the pyroxene minerals.
(a) (b)
Figure 4-7: Optical microscope (a) and QEMSCAN false colour images (b) for a UG2 mottled anorthosite
0.08 0.00
26.95
2.69 0.63 0.27 0.00 0.17 0.49
66.64
0.55 1.24 0.300.0
10.0
20.0
30.0
40.0
50.0
60.0
70.0
80.0
90.0
100.0R
elat
ive
Ab
un
dan
ce (
wt.
%)
Minerals present
Background 495 0
BMS 1035 0
Olivine 546 0
Orthopyroxene 80667 0
Clinopyroxene 13140 0
Amphibole 2251 0
Chlorite 3332 0
Serpentine 72 0
Talc 234 0
Mica 3849 0
Plagioclase 212522 0
Chromite 377755 0
Quartz 6 0
Other 2081 0
Mineral Name Shape fact…
30000.0 µm UG2 Mottled Anorthosite
2000 µm
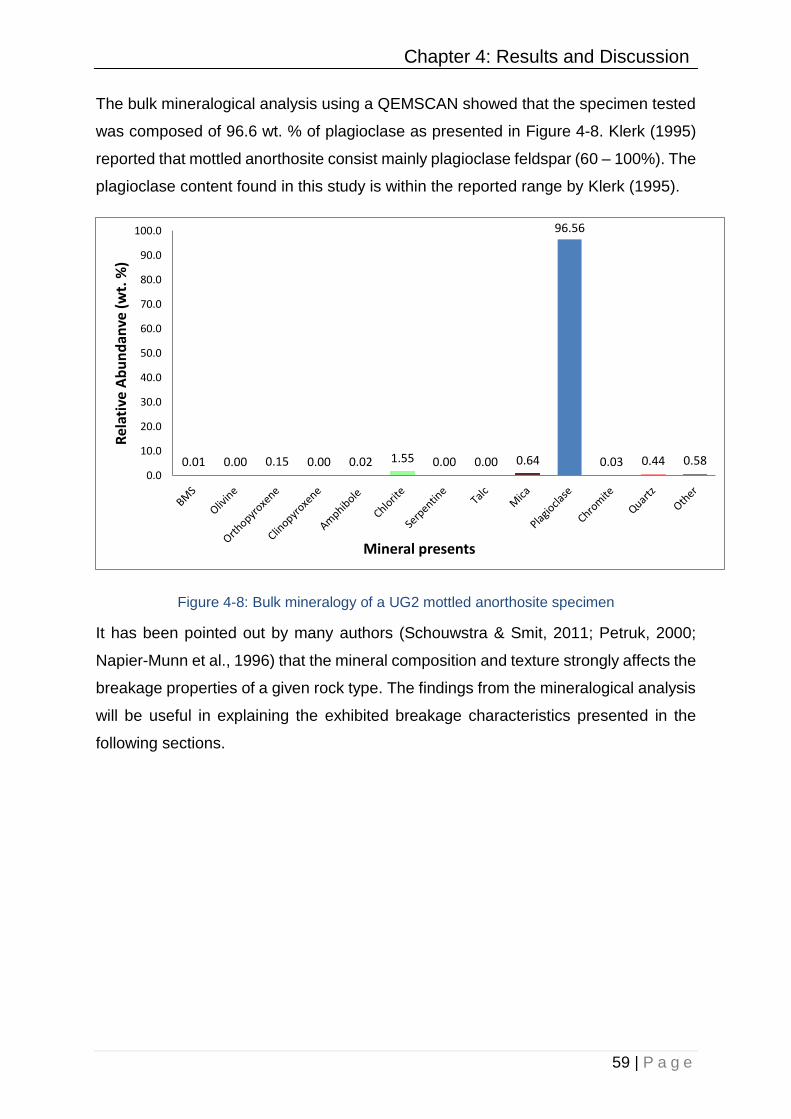
Chapter 4: Results and Discussion
59 | P a g e
The bulk mineralogical analysis using a QEMSCAN showed that the specimen tested
was composed of 96.6 wt. % of plagioclase as presented in Figure 4-8. Klerk (1995)
reported that mottled anorthosite consist mainly plagioclase feldspar (60 – 100%). The
plagioclase content found in this study is within the reported range by Klerk (1995).
Figure 4-8: Bulk mineralogy of a UG2 mottled anorthosite specimen
It has been pointed out by many authors (Schouwstra & Smit, 2011; Petruk, 2000;
Napier-Munn et al., 1996) that the mineral composition and texture strongly affects the
breakage properties of a given rock type. The findings from the mineralogical analysis
will be useful in explaining the exhibited breakage characteristics presented in the
following sections.
0.01 0.00 0.15 0.00 0.02 1.55 0.00 0.00 0.64
96.56
0.03 0.44 0.580.0
10.0
20.0
30.0
40.0
50.0
60.0
70.0
80.0
90.0
100.0
Rel
ativ
e A
bu
nd
anve
(w
t. %
)
Mineral presents

Chapter 4: Results and Discussion
60 | P a g e
4.3 Progeny particles
The selected rock types discussed in section 4.2 of various feed sizes were subjected
to impact breakage using the RBT at three energy levels. Progeny particles were
examined visually to assess the extent of damage caused to the particles by single
impact. Photographs of the parent and progeny particles of UG2 chromitite sourced
from K3 stockpile are presented in Figure 4-9 (a) and (b) respectively. It can be seen
from Figure 4-9 that for each size class, the progeny particles become finer with
increase in the specific input energy.
(a) (b)
Figure 4-9: Parent (a) and progeny (b) particles of UG2 chromitite
The trend exhibited in Figure 4-9 is well pronounced by the particle size distributions
of the RBT progeny particles presented in the following section. The progeny particle
size distributions were also used to compare the breakage charcteristics of samples
obtained from the RoM stock pile and cut drill core particles as well as evaluating the
main rock types identified in the Karee 3 UG2 ore.
4.4 Progeny particle size distributions
For each breakage test performed, particle size distributions of the progeny fragments
were obtained and used to assess the damage achieved after each primary fracture
in the RBT. The progeny particle size distributions were plotted in the form of
cumulative material passing a given particle size.
The initial assessment involved comparing the progeny particle size distributions
obtained from the two different sampling methods employed in this study. An
evaluation of the progeny particle size distributions of the main rock types identified in
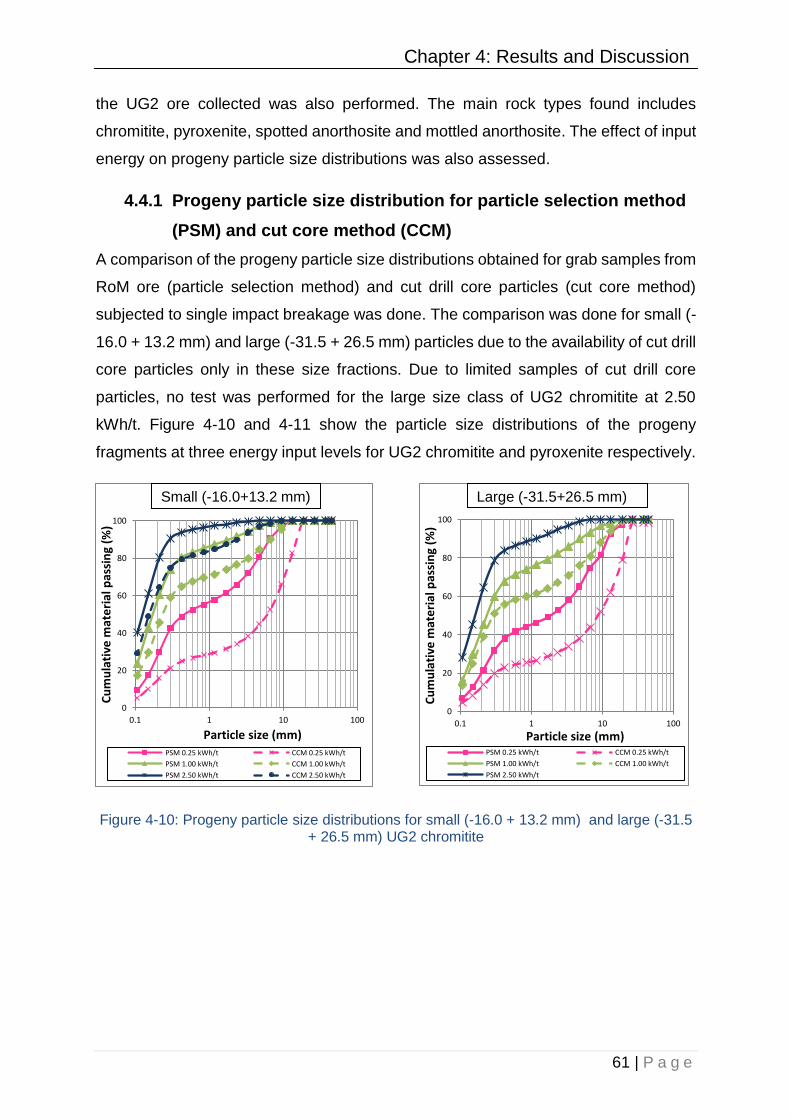
Chapter 4: Results and Discussion
61 | P a g e
the UG2 ore collected was also performed. The main rock types found includes
chromitite, pyroxenite, spotted anorthosite and mottled anorthosite. The effect of input
energy on progeny particle size distributions was also assessed.
4.4.1 Progeny particle size distribution for particle selection method
(PSM) and cut core method (CCM)
A comparison of the progeny particle size distributions obtained for grab samples from
RoM ore (particle selection method) and cut drill core particles (cut core method)
subjected to single impact breakage was done. The comparison was done for small (-
16.0 + 13.2 mm) and large (-31.5 + 26.5 mm) particles due to the availability of cut drill
core particles only in these size fractions. Due to limited samples of cut drill core
particles, no test was performed for the large size class of UG2 chromitite at 2.50
kWh/t. Figure 4-10 and 4-11 show the particle size distributions of the progeny
fragments at three energy input levels for UG2 chromitite and pyroxenite respectively.
Figure 4-10: Progeny particle size distributions for small (-16.0 + 13.2 mm) and large (-31.5 + 26.5 mm) UG2 chromitite
0
20
40
60
80
100
0.1 1 10 100
Cu
mu
lati
ve m
ate
rial
pas
sin
g (%
)
Particle size (mm)PSM 0.25 kWh/t CCM 0.25 kWh/t
PSM 1.00 kWh/t CCM 1.00 kWh/t
PSM 2.50 kWh/t CCM 2.50 kWh/t
Small (-16.0+13.2 mm)
0
20
40
60
80
100
0.1 1 10 100
Cu
mu
lati
ve m
ate
rial
pas
sin
g (%
)
Particle size (mm)PSM 0.25 kWh/t CCM 0.25 kWh/t
PSM 1.00 kWh/t CCM 1.00 kWh/t
PSM 2.50 kWh/t
Large (-31.5+26.5 mm)
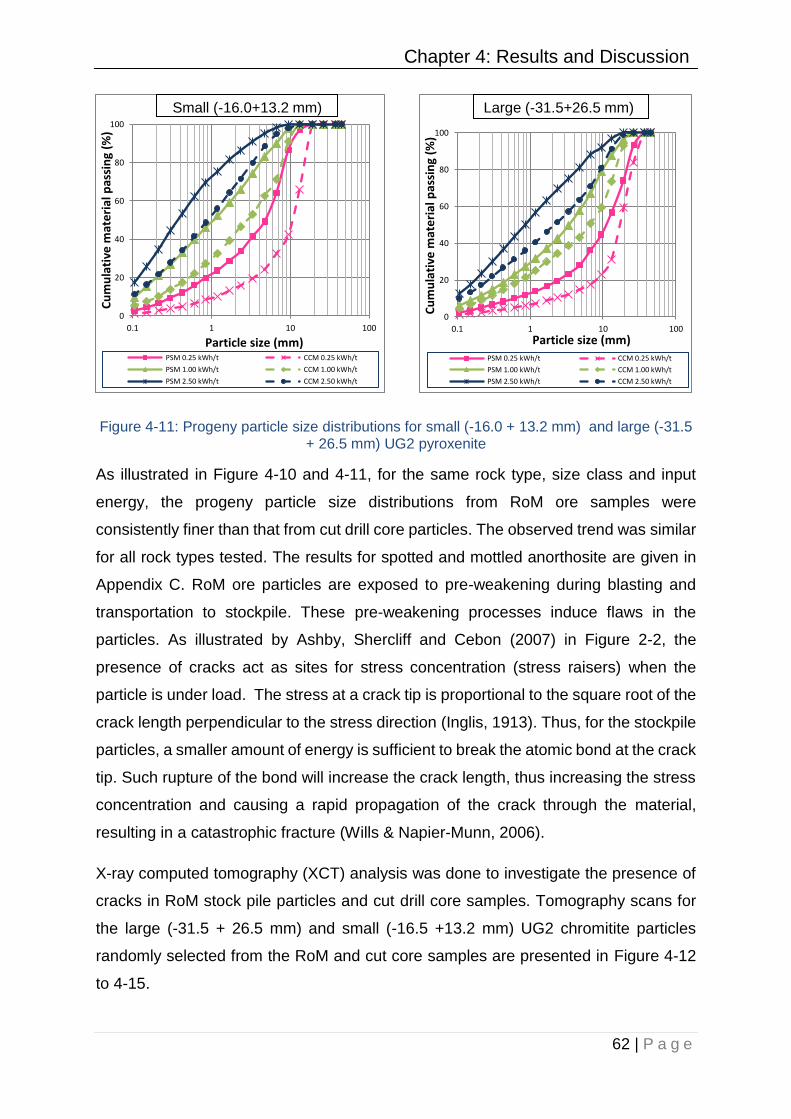
Chapter 4: Results and Discussion
62 | P a g e
Figure 4-11: Progeny particle size distributions for small (-16.0 + 13.2 mm) and large (-31.5 + 26.5 mm) UG2 pyroxenite
As illustrated in Figure 4-10 and 4-11, for the same rock type, size class and input
energy, the progeny particle size distributions from RoM ore samples were
consistently finer than that from cut drill core particles. The observed trend was similar
for all rock types tested. The results for spotted and mottled anorthosite are given in
Appendix C. RoM ore particles are exposed to pre-weakening during blasting and
transportation to stockpile. These pre-weakening processes induce flaws in the
particles. As illustrated by Ashby, Shercliff and Cebon (2007) in Figure 2-2, the
presence of cracks act as sites for stress concentration (stress raisers) when the
particle is under load. The stress at a crack tip is proportional to the square root of the
crack length perpendicular to the stress direction (Inglis, 1913). Thus, for the stockpile
particles, a smaller amount of energy is sufficient to break the atomic bond at the crack
tip. Such rupture of the bond will increase the crack length, thus increasing the stress
concentration and causing a rapid propagation of the crack through the material,
resulting in a catastrophic fracture (Wills & Napier-Munn, 2006).
X-ray computed tomography (XCT) analysis was done to investigate the presence of
cracks in RoM stock pile particles and cut drill core samples. Tomography scans for
the large (-31.5 + 26.5 mm) and small (-16.5 +13.2 mm) UG2 chromitite particles
randomly selected from the RoM and cut core samples are presented in Figure 4-12
to 4-15.
0
20
40
60
80
100
0.1 1 10 100
Cu
mu
lati
ve m
ate
rial
pas
sin
g (%
)
Particle size (mm)PSM 0.25 kWh/t CCM 0.25 kWh/t
PSM 1.00 kWh/t CCM 1.00 kWh/t
PSM 2.50 kWh/t CCM 2.50 kWh/t
Small (-16.0+13.2 mm)
0
20
40
60
80
100
0.1 1 10 100
Cu
mu
lati
ve m
ate
rial
pas
sin
g (%
)
Particle size (mm)PSM 0.25 kWh/t CCM 0.25 kWh/t
PSM 1.00 kWh/t CCM 1.00 kWh/t
PSM 2.50 kWh/t CCM 2.50 kWh/t
Large (-31.5+26.5 mm)
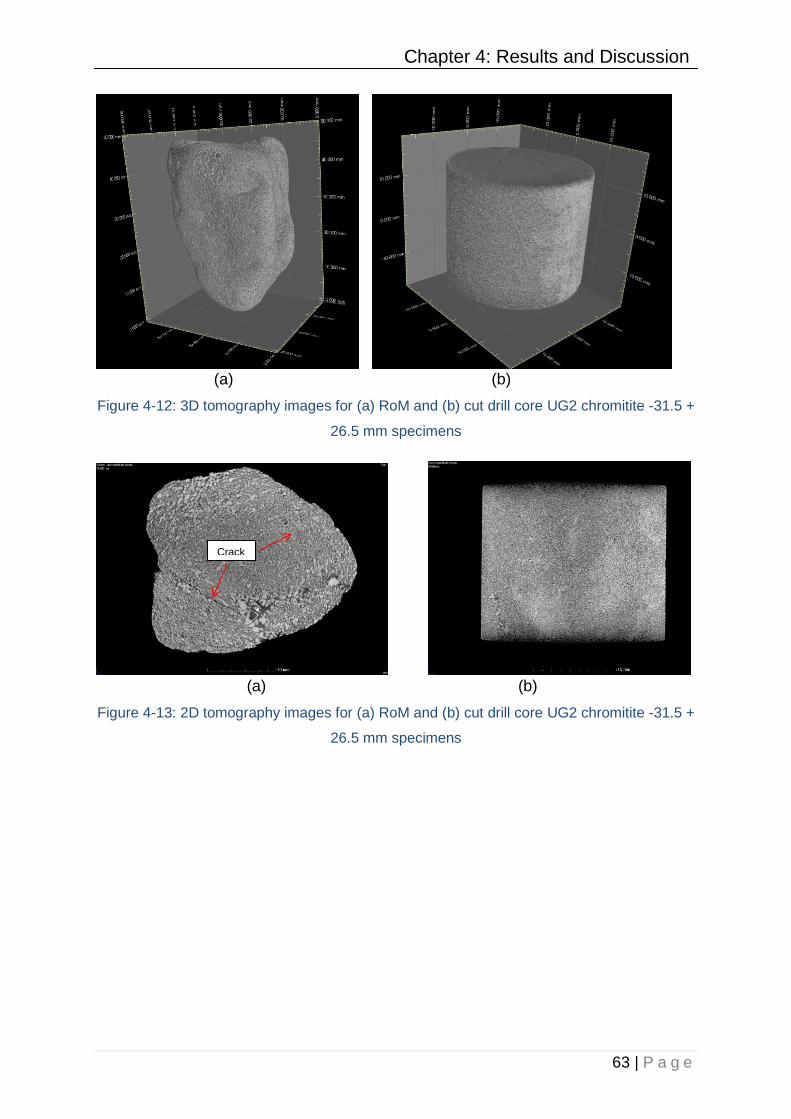
Chapter 4: Results and Discussion
63 | P a g e
(a) (b)
Figure 4-12: 3D tomography images for (a) RoM and (b) cut drill core UG2 chromitite -31.5 +
26.5 mm specimens
(a) (b)
Figure 4-13: 2D tomography images for (a) RoM and (b) cut drill core UG2 chromitite -31.5 +
26.5 mm specimens
Crack
s
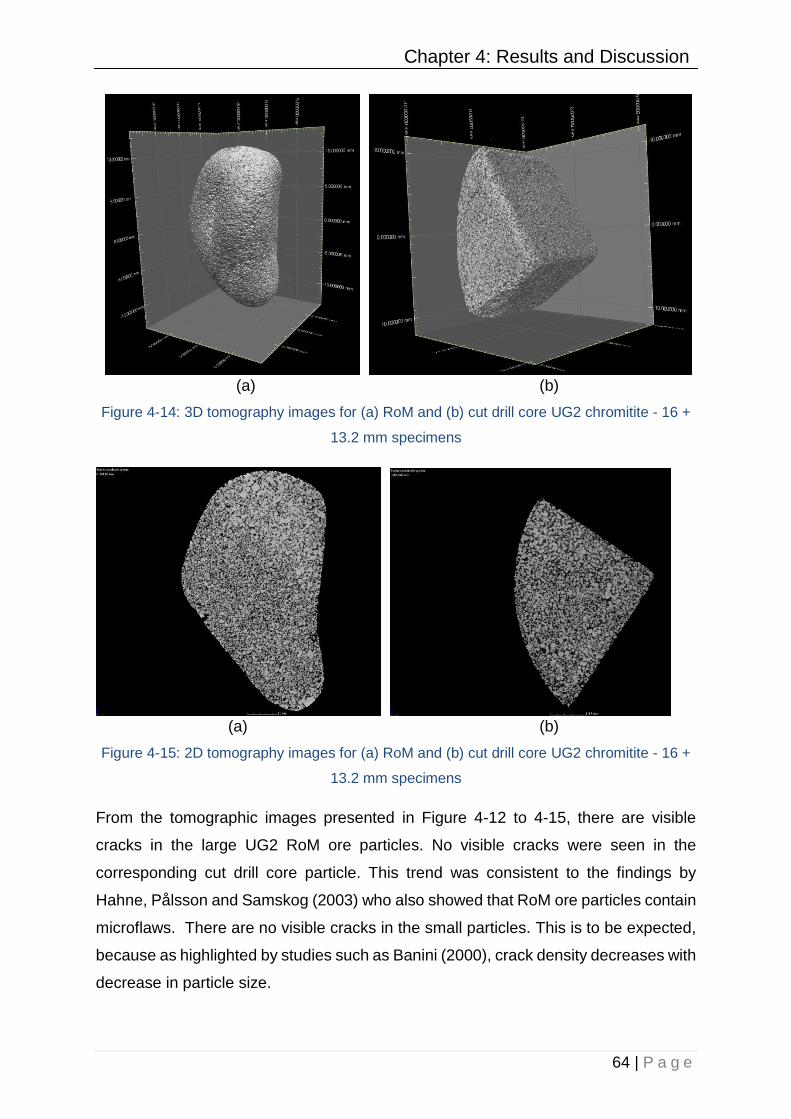
Chapter 4: Results and Discussion
64 | P a g e
(a) (b)
Figure 4-14: 3D tomography images for (a) RoM and (b) cut drill core UG2 chromitite - 16 +
13.2 mm specimens
(a) (b)
Figure 4-15: 2D tomography images for (a) RoM and (b) cut drill core UG2 chromitite - 16 +
13.2 mm specimens
From the tomographic images presented in Figure 4-12 to 4-15, there are visible
cracks in the large UG2 RoM ore particles. No visible cracks were seen in the
corresponding cut drill core particle. This trend was consistent to the findings by
Hahne, Pålsson and Samskog (2003) who also showed that RoM ore particles contain
microflaws. There are no visible cracks in the small particles. This is to be expected,
because as highlighted by studies such as Banini (2000), crack density decreases with
decrease in particle size.

Chapter 4: Results and Discussion
65 | P a g e
Characterisation of the abundant rock types in the subsequent sections is based on
results from breakage tests of samples obtained via particle selection method. The
reasons were twofold, the availability of RoM samples for experimental work permitting
repeats and similar trends observed between the particle selection and cut drill core
method results. Results obtained for the cut drill core particles are presented in
Appendix C.
4.4.2 Progeny particle size distributions of the main rock types
Progeny particles from breakage tests performed using the RBT of the main rock types
identified in the Karee 3 UG2 RoM stock pile were evaluated. Figure 4-16 presents
the progeny particle size distributions for small particles (-16.0 + 13.2 mm) of the UG2
chromitite, pyroxenite, spotted anorthosite and mottled anorthosite. Figure 4-16 (a),
(b) and (c) show the progeny particle distributions for the main rock types from single
impact breakage tests performed at 0.25, 1.0 and 2.5 kWh/t respectively.
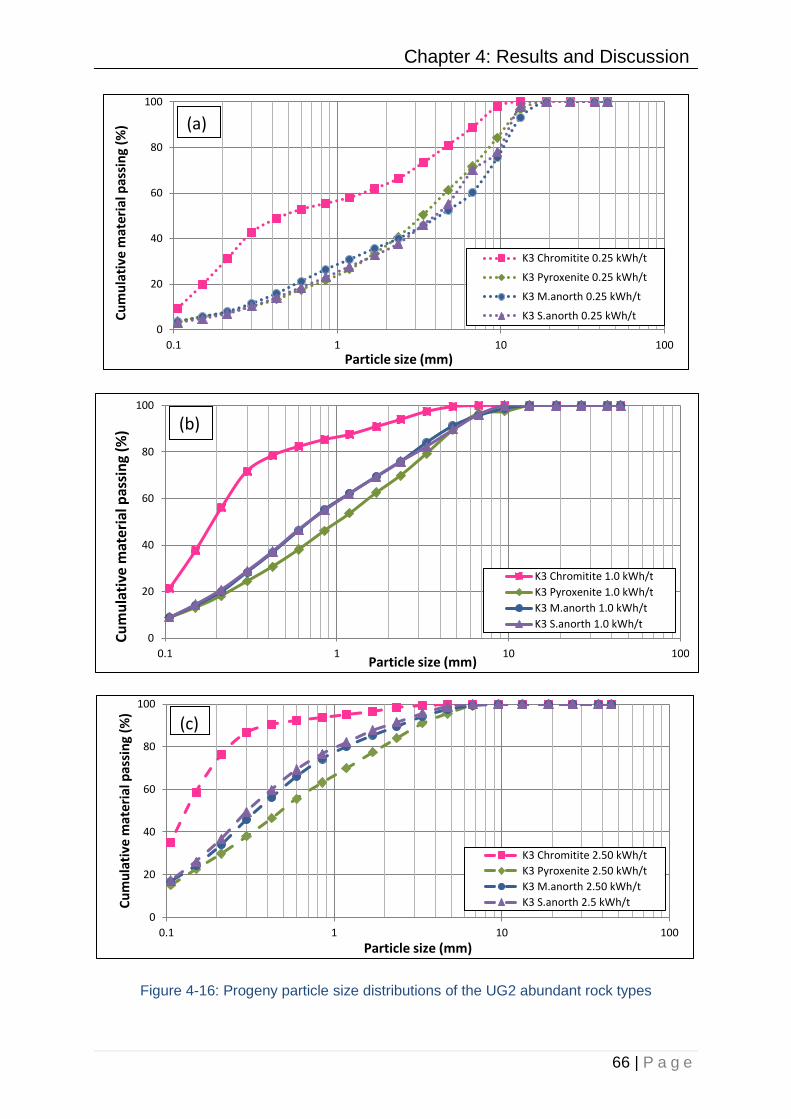
Chapter 4: Results and Discussion
66 | P a g e
Figure 4-16: Progeny particle size distributions of the UG2 abundant rock types
0
20
40
60
80
100
0.1 1 10 100
Cu
mu
lati
ve m
ater
ial p
assi
ng
(%)
Particle size (mm)
K3 Chromitite 0.25 kWh/t
K3 Pyroxenite 0.25 kWh/t
K3 M.anorth 0.25 kWh/t
K3 S.anorth 0.25 kWh/t
(a)
0
20
40
60
80
100
0.1 1 10 100
Cu
mu
lati
ve m
ater
ial p
assi
ng
(%)
Particle size (mm)
K3 Chromitite 1.0 kWh/t
K3 Pyroxenite 1.0 kWh/t
K3 M.anorth 1.0 kWh/t
K3 S.anorth 1.0 kWh/t
(b)
0
20
40
60
80
100
0.1 1 10 100
Cu
mu
lati
ve m
ater
ial p
assi
ng
(%)
Particle size (mm)
K3 Chromitite 2.50 kWh/t
K3 Pyroxenite 2.50 kWh/t
K3 M.anorth 2.50 kWh/t
K3 S.anorth 2.5 kWh/t
(c)
Chapter 4: Results and Discussion
67 | P a g e
For all the plots presented in Figure 4-16, the progeny particle size distribution for
chromitite were finer than the other rock types at each energy level tested. Similar
trends were exhibited for all sizes tested as presented in Appendix C. From the
mineralogical analysis presented in section 4.2.1, UG2 chromitite was found to consist
predominantly of fine‐grained chromite held together mainly by orthopyroxene and
plagioclase. Due to the small amounts of orthopyroxene and plagioclase which hold
chromite grains together, the particle easily fragments when stress is applied. From
their work on RoM ball mills, Mainza and Powell (2006) pointed out that UG2 chromitite
(reef) is friable. The friability of the chromitite was also witnessed during the ore sorting
stage of this study.
Mottled and spotted anorthosite produce less fines than chromitite as exhibited by the
lower cumulative material passing each particular size for all energies in Figure 4-16.
The mineralogical analysis presented in section 4.2.3 indicated that mottled and
spotted anorthosite are made up of plagioclase crystals which are few centimetres
long. These plagioclase crystals were found to be larger than the chromite grains in
chromitite thus mottled and spotted anorthosite break into a coarser progeny
compared to chromitite after a single impact. In addition, Figure 4-16 shows that there
is no significant difference between the progeny particle size distributions for mottled
and spotted anorthosite across all three energy input despite the rocks having different
textures as presented in sections 4.2.3 and 4.2.4. Both mottled and spotted
anorthosite progeny particle size distributions were finer than pyroxenite for all the
energies tested. Figure 4-16 also shows that pyroxenite had a coarser progeny
particlet size disributions compared to the other rocks. Pyroxenite was found to contain
predominantly granular orthopyroxene, interstitial plagioclase and clinopyroxene. This
texture tends to be complex as pointed out by Xiao and Laplante (2004), thus fracturing
into a coarser product than all the rock types tested.
The shape of progeny particle size distributions for UG2 chromitite presented in Figure
4-10 and 4-16 is bimodal. This is more visible at low energies especially at 0.25 kWh/t.
Similar particle size distributions were also obtained for UG2 ore by Van Eck (2007).
The observed point of inflection in Figure 4-10 and 4-16 falls in the - 425 + 300 µm
size fraction. This corresponds to the chromite grain size class which was found to be
in the - 425 + 300 µm size fraction as shown in the work by Daniel (2007). This tends

Chapter 4: Results and Discussion
68 | P a g e
to indicate that chromitite particles prefentially break along the chromite grain
boundaries as suggested by Chernet and Marmo (2003).
The shape of progeny particle size distributions for mottled anorthosite, spotted
anorthosite and pyroxenite are smooth curves without kinks. This tend to suggest that
random fracture occurs in the breakage process of these rock types and there is no
selective breakage of one mineral over another.
4.4.3 Effect of energy input on progeny particle size distributions
The effect of input energy on the progeny particle size distibutions of UG2 rock types
was also assessed. Figure 4-10, 4-11 and 4-16 showed that increasing the specific
input energy from 0.25 to 2.5 kWh/t results in finer progeny particle size distributions
for all rock types tested. This collaborates with the visual presentation in Figure 4-9
which showed that progeny particles become finer as the input energy is increased.
Increasing the input energy, increases the stressing intensity which inturn intensifies
the propagation of cracks in a material (Tavares, 2007). This results in fracturing of
the particle into smaller fragments (Kapur et al., 1997).
4.5 Degree of breakage (t10)
Degree of breakage represented by the parameter t10 defines the extent of breakage
or fineness of the progeny particle size distribution resulting from the applied energy.
t10 is defined as the progeny percentage passing one tenth of initial mean particle size
(Napier-Munn et al., 1996).
A tenth of the original particle geometric mean size (t10 screen size) for each of the
size fractions used in the standard impact breakage tests was calculated to aid in the
determination of t10. The t10 parameter was determined by interpolating the cumulative
percent passing data between the two closest sieve sizes to the t10 screen size (see
Appendix B).
4.5.1 Comparison of the t10 for particle selection and cut core
methods
The aim of this section was to assess the extent of breakage or fineness of the progeny
fragments for UG2 samples collected via particle selection and cut core method. A
comparison of the degree of breakage for progeny particles from breakage tests using
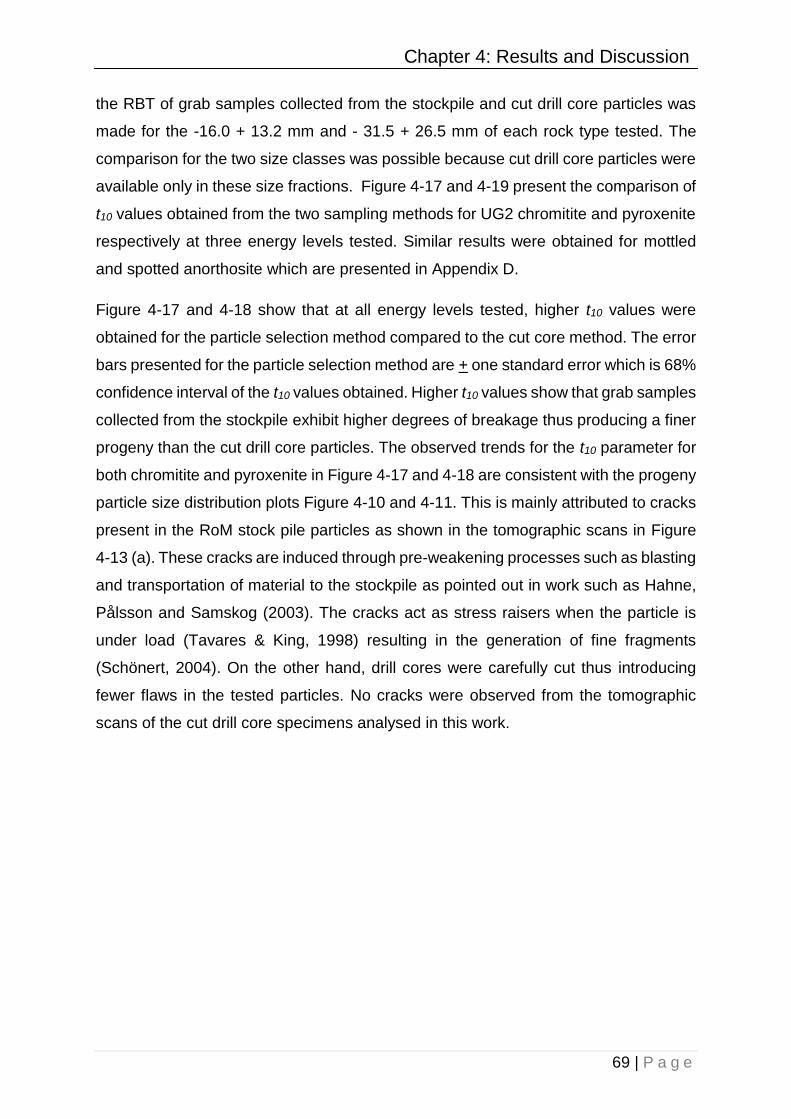
Chapter 4: Results and Discussion
69 | P a g e
the RBT of grab samples collected from the stockpile and cut drill core particles was
made for the -16.0 + 13.2 mm and - 31.5 + 26.5 mm of each rock type tested. The
comparison for the two size classes was possible because cut drill core particles were
available only in these size fractions. Figure 4-17 and 4-19 present the comparison of
t10 values obtained from the two sampling methods for UG2 chromitite and pyroxenite
respectively at three energy levels tested. Similar results were obtained for mottled
and spotted anorthosite which are presented in Appendix D.
Figure 4-17 and 4-18 show that at all energy levels tested, higher t10 values were
obtained for the particle selection method compared to the cut core method. The error
bars presented for the particle selection method are + one standard error which is 68%
confidence interval of the t10 values obtained. Higher t10 values show that grab samples
collected from the stockpile exhibit higher degrees of breakage thus producing a finer
progeny than the cut drill core particles. The observed trends for the t10 parameter for
both chromitite and pyroxenite in Figure 4-17 and 4-18 are consistent with the progeny
particle size distribution plots Figure 4-10 and 4-11. This is mainly attributed to cracks
present in the RoM stock pile particles as shown in the tomographic scans in Figure
4-13 (a). These cracks are induced through pre-weakening processes such as blasting
and transportation of material to the stockpile as pointed out in work such as Hahne,
Pålsson and Samskog (2003). The cracks act as stress raisers when the particle is
under load (Tavares & King, 1998) resulting in the generation of fine fragments
(Schönert, 2004). On the other hand, drill cores were carefully cut thus introducing
fewer flaws in the tested particles. No cracks were observed from the tomographic
scans of the cut drill core specimens analysed in this work.
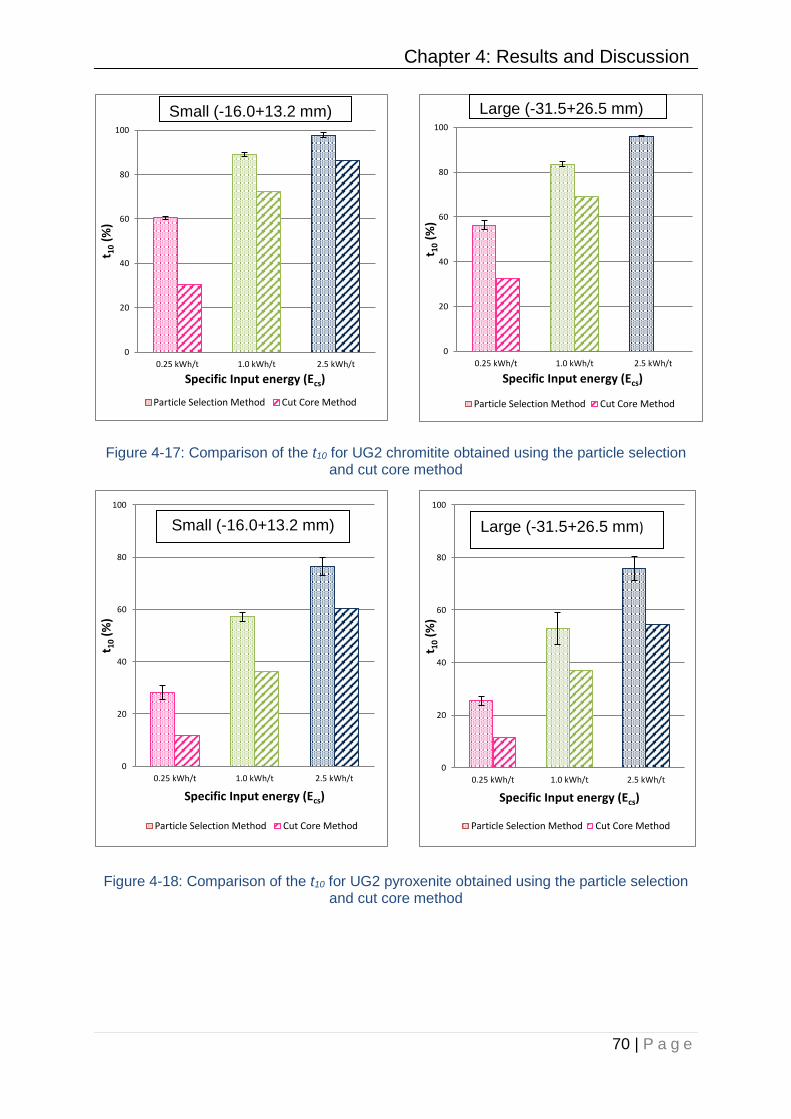
Chapter 4: Results and Discussion
70 | P a g e
Figure 4-17: Comparison of the t10 for UG2 chromitite obtained using the particle selection and cut core method
Figure 4-18: Comparison of the t10 for UG2 pyroxenite obtained using the particle selection and cut core method
0
20
40
60
80
100
0.25 kWh/t 1.0 kWh/t 2.5 kWh/t
t 10
(%)
Specific Input energy (Ecs)
Particle Selection Method Cut Core Method
Small (-16.0+13.2 mm)
0
20
40
60
80
100
0.25 kWh/t 1.0 kWh/t 2.5 kWh/t
t 10
(%)
Specific Input energy (Ecs)
Particle Selection Method Cut Core Method
Large (-31.5+26.5 mm)
0
20
40
60
80
100
0.25 kWh/t 1.0 kWh/t 2.5 kWh/t
t 10
(%)
Specific Input energy (Ecs)
Particle Selection Method Cut Core Method
0
20
40
60
80
100
0.25 kWh/t 1.0 kWh/t 2.5 kWh/t
t 10
(%)
Specific Input energy (Ecs)
Particle Selection Method Cut Core Method
Large (-31.5+26.5 mm)Small (-16.0+13.2 mm)

Chapter 4: Results and Discussion
71 | P a g e
4.5.2 Comparison of the t10 for the main rock types
The t10 values obtained from the impact breakage test using the RBT were used to
evaluate the fineness of the progeny fragments for the main rock types sourced from
UG2 RoM stock pile. Table 4-1 presents t10 values for UG2 chromitite, pyroxenite,
spotted anorthosite and mottled anorthosite particles at each energy-size combination
tested. At some energy-size combinations for pyroxenite, spotted and mottled
anorthosite, no standard error was calculated because no repeats were done due to
limited samples. This was acceptable because for each energy-size test in the
standard breakage experiments, 30 particles are used to give results that are
statistically valid (Napier-Munn et al., 1996). The results tabulated in Table 4-1 were
used to assess the effect of input energy on the degree of breakage (t10) of the main
rock types in the subsequent sections. The comparison of breakage properties of the
main types is well pronounced and discussed in the following section.

Chapter 4: Results and Discussion
72 | P a g e
Table 4-1: t10 values obtained for the UG2 main rock types
Rock type Size Energy Average t10
Std. error. Class Range (mm) (kWh/t) (%)
Chromitite
Small 16.0 x 13.2
0.25 60.4 0.46
1.00 89.1 0.43
2.50 97.8 0.65
Medium 22.4 x 19.0
0.25 56.9 0.42
1.00 85.2 1.11
2.50 96.4 0.57
Large 31.5 x 26.5
0.25 56.3 1.23
1.00 83.5 0.68
2.50 96.0 0.09
V.Large 45.0 x 37.5
0.10 28.6 1.04
0.25 46.3 1.66
1.00 81.4 0.90
Pyroxenite
Small 16.0 x 13.2
0.25 28.3 1.96
1.00 57.2 1.24
2.50 76.3 2.47
Medium 22.4 x 19.0
0.25 25.5 0.67
1.00 53.0 2.91
2.50 75.9 0.49
Large 31.5 x 26.5
0.25 22.8 1.20
1.00 50.7 4.22
2.50 75.9 3.26
V.Large 45.0 x 37.5
0.10 16.1 -
0.25 24.8 -
1.00 60.3 -
Spotted Anorthosite
Small 16.0 x 13.2
0.25 30.3 -
1.00 65.9 -
2.50 85.0 -
Medium 22.4 x 19.0
0.25 - -
1.00 73.3 -
2.50 - -
Large 31.5 x 26.5
0.25 23.5 -
1.00 65.5 -
2.50 - -
V.Large 45.0 x 37.5
0.10 11.7 -
0.25 - -
1.00 63.0 -
Mottled Anorthosite
Small 16.0 x 13.2
0.25 33.3 -
1.00 66.1 -
2.50 82.8 -
Medium 22.4 x 19.0
0.25 25.8 -
1.00 68.8 -
2.50 79.6 -
Large 31.5 x 26.5
0.25 20.6 -
1.00 51.5 -
2.50 85.3 -
V.Large 45.0 x 37.5
0.10 11.8 -
0.25 23.0 -
1.00 61.0 -
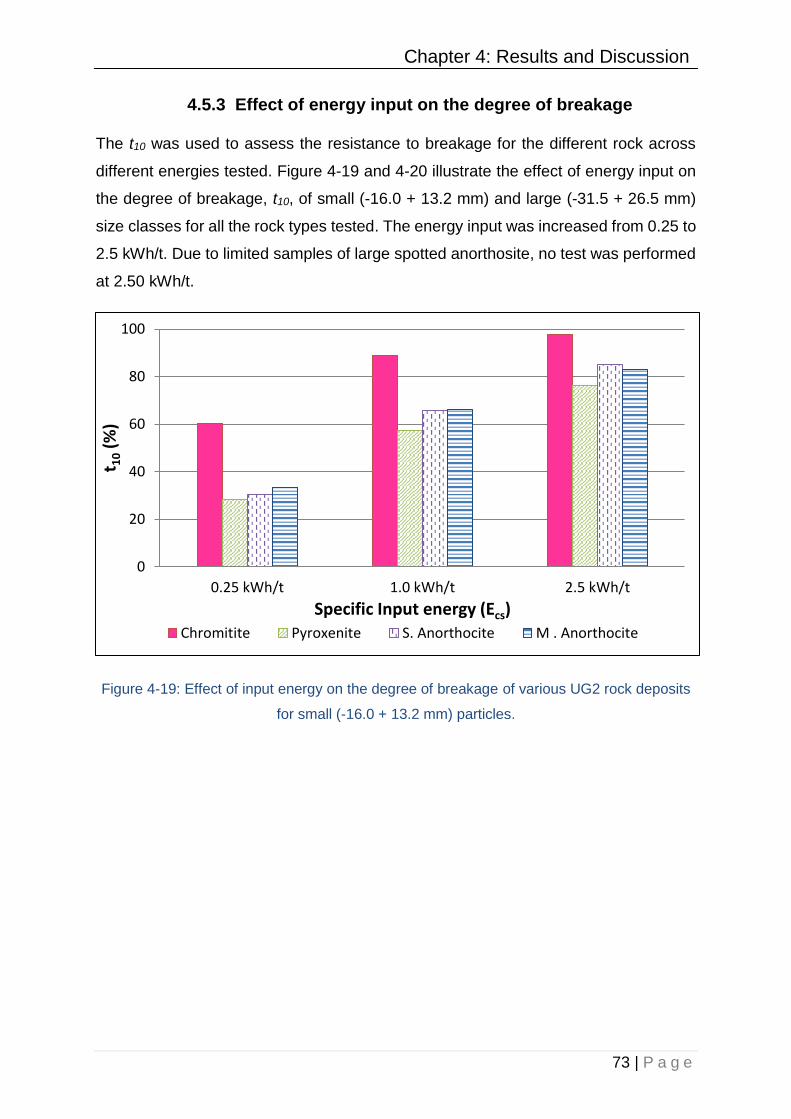
Chapter 4: Results and Discussion
73 | P a g e
4.5.3 Effect of energy input on the degree of breakage
The t10 was used to assess the resistance to breakage for the different rock across
different energies tested. Figure 4-19 and 4-20 illustrate the effect of energy input on
the degree of breakage, t10, of small (-16.0 + 13.2 mm) and large (-31.5 + 26.5 mm)
size classes for all the rock types tested. The energy input was increased from 0.25 to
2.5 kWh/t. Due to limited samples of large spotted anorthosite, no test was performed
at 2.50 kWh/t.
Figure 4-19: Effect of input energy on the degree of breakage of various UG2 rock deposits
for small (-16.0 + 13.2 mm) particles.
0
20
40
60
80
100
0.25 kWh/t 1.0 kWh/t 2.5 kWh/t
t 10
(%)
Specific Input energy (Ecs)Chromitite Pyroxenite S. Anorthocite M . Anorthocite
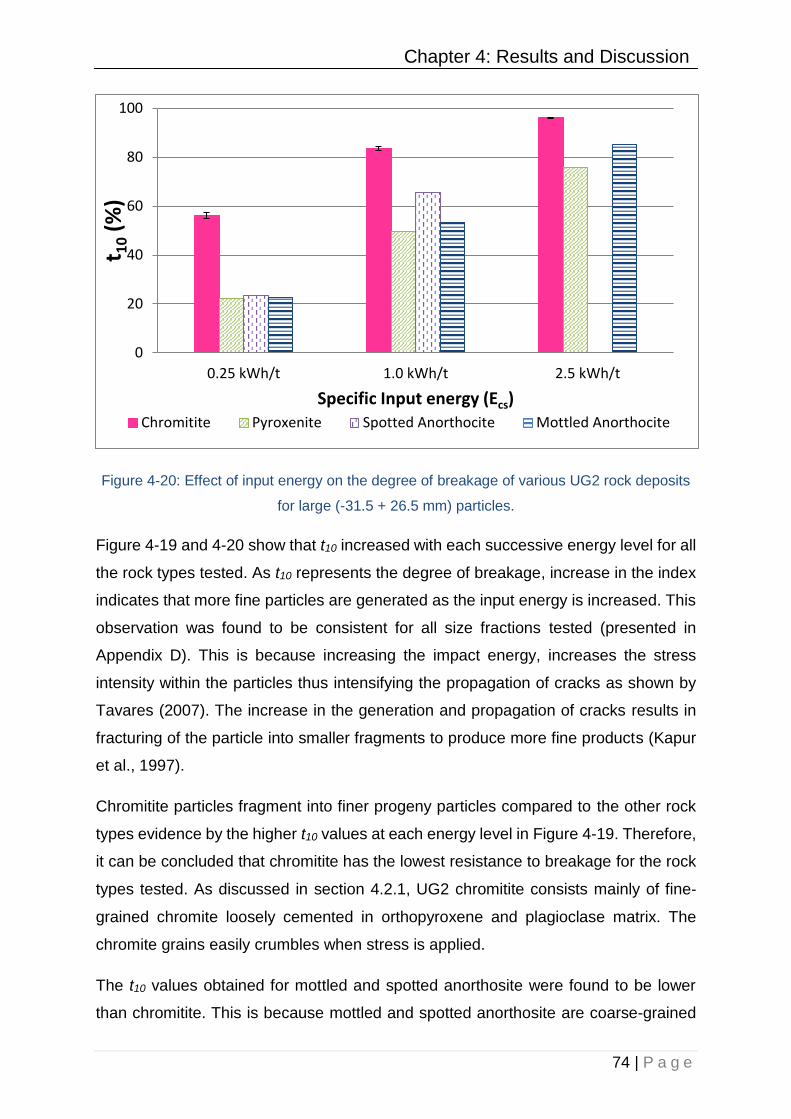
Chapter 4: Results and Discussion
74 | P a g e
Figure 4-20: Effect of input energy on the degree of breakage of various UG2 rock deposits
for large (-31.5 + 26.5 mm) particles.
Figure 4-19 and 4-20 show that t10 increased with each successive energy level for all
the rock types tested. As t10 represents the degree of breakage, increase in the index
indicates that more fine particles are generated as the input energy is increased. This
observation was found to be consistent for all size fractions tested (presented in
Appendix D). This is because increasing the impact energy, increases the stress
intensity within the particles thus intensifying the propagation of cracks as shown by
Tavares (2007). The increase in the generation and propagation of cracks results in
fracturing of the particle into smaller fragments to produce more fine products (Kapur
et al., 1997).
Chromitite particles fragment into finer progeny particles compared to the other rock
types evidence by the higher t10 values at each energy level in Figure 4-19. Therefore,
it can be concluded that chromitite has the lowest resistance to breakage for the rock
types tested. As discussed in section 4.2.1, UG2 chromitite consists mainly of fine‐
grained chromite loosely cemented in orthopyroxene and plagioclase matrix. The
chromite grains easily crumbles when stress is applied.
The t10 values obtained for mottled and spotted anorthosite were found to be lower
than chromitite. This is because mottled and spotted anorthosite are coarse-grained
0
20
40
60
80
100
0.25 kWh/t 1.0 kWh/t 2.5 kWh/t
t 10
(%)
Specific Input energy (Ecs)Chromitite Pyroxenite Spotted Anorthocite Mottled Anorthocite

Chapter 4: Results and Discussion
75 | P a g e
rocks as presented in the mineralogical analysis in section 4.2.3 and 4.2.4 thus they
break into coarser progeny fragments as compared to chromitite. In addition, there is
no significant difference between the t10 values obtained for mottled and spotted
anorthosite despite the textural difference for these anorthositic rocks. The textural
distinction between mottled and spotted anorthosite presented in section 4.2.3 and
4.2.4 illustrates that constituent pyroxene creates dark speckles giving a ‘’spotted’’
appearance in spotted anorthosite whilst mottled anorthosite was found to be mainly
plagioclase.
Figure 4-19 also shows that pyroxenite tended to have the least t10 across all energy
levels tested. As presented in section 4.2.2, UG2 pyroxenite specimen was found to
contain granular orthopyroxene, held together by plagioclase and clinopyroxene
similarly to what was reported by Mathez and Mey (2005). This texture tends to be
complex, thus fracturing into a coarser product than all the rock types tested. The
orthopyroxene grains were found to be relatively larger than the chromite grains in
chromitite particles thus a coarser product is expected resulting in a lower t10 values.
4.6 Energy – size relationships
The energy-size relationships were investigated using the standard impact breakage
characterisation models (equation 2-5 and 2-9) described in section 2.6. These models
relate the degree of breakage, t10, to specific input energy Ecs.
4.6.1. t10 breakage model
The t10 values obtained from cumulative material passing data for the progeny particles
of the different size fractions from impact breakage tests using the RBT for each rock
type were plotted against specific input energy, Ecs. The t10 breakage model (equation
2-5) was fitted to the breakage data of each rock type by non-linear regression
techniques.
Figure 4-21 and 4-22 show the relationship of the measured t10 versus the applied
specific energy for UG2 chromitite and pyroxenite rock particles collected from Karee
3 shaft. The breakage parameters, A and b, were fitted to provide the least root mean
square error (RMSE). The solid and broken black lines represent the model predictions
for the particle selection and cut core methods respectively.

Chapter 4: Results and Discussion
76 | P a g e
Figure 4-21: t10 breakage model fitting to the t10-Ecs data for UG2 chromitite rock particles
Figure 4-22: t10 breakage model fitting to the t10-Ecs data for UG2 pyroxenite rock particles
0.0
20.0
40.0
60.0
80.0
100.0
0 0.5 1 1.5 2 2.5 3
t 10
(%)
Ecs (kWh/t)
PSM_-16+13.2mm PSM_-22.4+19mm PSM_-31.5+26.5mmPSM_-45+37.5mm CCM_-16+13.2mm CCM_-31.5+26.5mmt10 model PSM t10 model CCM
0.0
20.0
40.0
60.0
80.0
100.0
0 0.5 1 1.5 2 2.5 3 3.5 4 4.5 5
t 10
(%)
Ecs (kWh/t)
PSM_-16+13.2mm PSM_-22.4+19mm PSM_-31.5+26.5mm
PSM_-45+37.5mm CCM_-16+13.2mm CCM_-31.5+26.5mm
t10 model PSM t10 model CCM
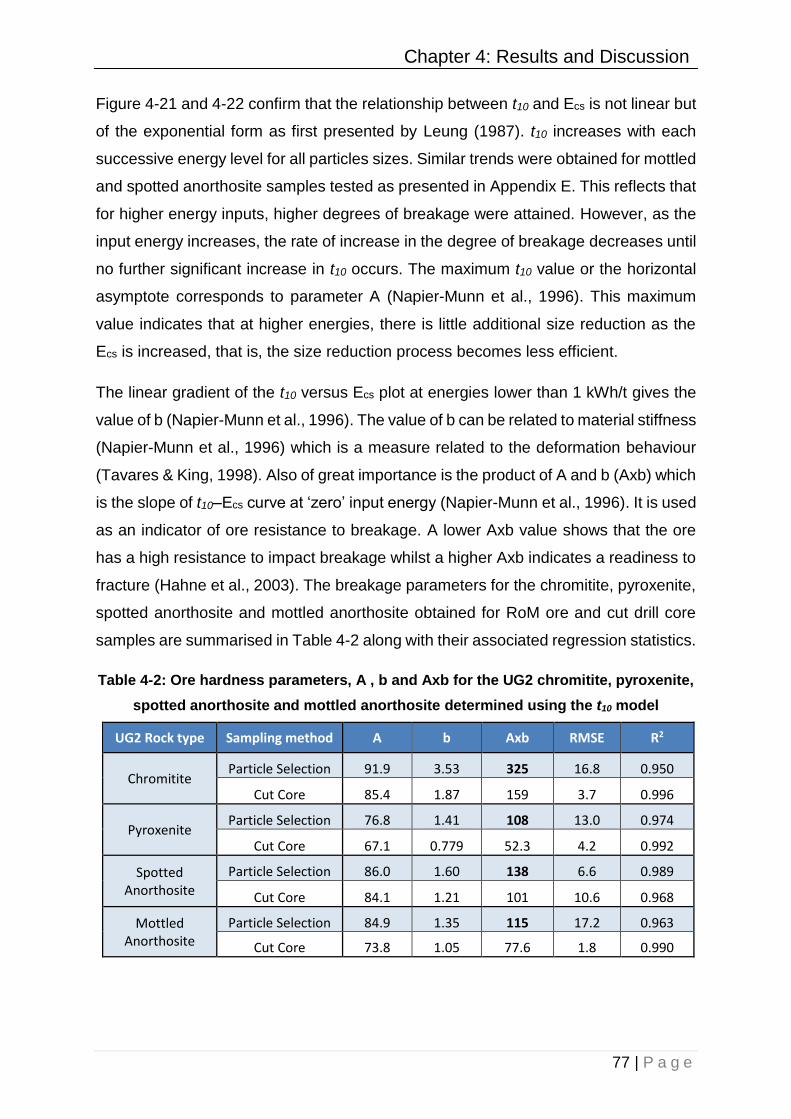
Chapter 4: Results and Discussion
77 | P a g e
Figure 4-21 and 4-22 confirm that the relationship between t10 and Ecs is not linear but
of the exponential form as first presented by Leung (1987). t10 increases with each
successive energy level for all particles sizes. Similar trends were obtained for mottled
and spotted anorthosite samples tested as presented in Appendix E. This reflects that
for higher energy inputs, higher degrees of breakage were attained. However, as the
input energy increases, the rate of increase in the degree of breakage decreases until
no further significant increase in t10 occurs. The maximum t10 value or the horizontal
asymptote corresponds to parameter A (Napier-Munn et al., 1996). This maximum
value indicates that at higher energies, there is little additional size reduction as the
Ecs is increased, that is, the size reduction process becomes less efficient.
The linear gradient of the t10 versus Ecs plot at energies lower than 1 kWh/t gives the
value of b (Napier-Munn et al., 1996). The value of b can be related to material stiffness
(Napier-Munn et al., 1996) which is a measure related to the deformation behaviour
(Tavares & King, 1998). Also of great importance is the product of A and b (Axb) which
is the slope of t10–Ecs curve at ‘zero’ input energy (Napier-Munn et al., 1996). It is used
as an indicator of ore resistance to breakage. A lower Axb value shows that the ore
has a high resistance to impact breakage whilst a higher Axb indicates a readiness to
fracture (Hahne et al., 2003). The breakage parameters for the chromitite, pyroxenite,
spotted anorthosite and mottled anorthosite obtained for RoM ore and cut drill core
samples are summarised in Table 4-2 along with their associated regression statistics.
Table 4-2: Ore hardness parameters, A , b and Axb for the UG2 chromitite, pyroxenite,
spotted anorthosite and mottled anorthosite determined using the t10 model
UG2 Rock type Sampling method A b Axb RMSE R2
Chromitite Particle Selection 91.9 3.53 325 16.8 0.950
Cut Core 85.4 1.87 159 3.7 0.996
Pyroxenite Particle Selection 76.8 1.41 108 13.0 0.974
Cut Core 67.1 0.779 52.3 4.2 0.992
Spotted Anorthosite
Particle Selection 86.0 1.60 138 6.6 0.989
Cut Core 84.1 1.21 101 10.6 0.968
Mottled Anorthosite
Particle Selection 84.9 1.35 115 17.2 0.963
Cut Core 73.8 1.05 77.6 1.8 0.990

Chapter 4: Results and Discussion
78 | P a g e
Table 4-2 shows that for each rock type tested, higher A values were obtained for
particle selection method. Higher A values meant that at higher energies, greater
degrees of breakage were achieved. Also, higher values of b were obtained for particle
selection method. Higher b values obtained for stockpile materials show a lesser
resistance to deformation prior to fracture than cut drill core particles.
Table 4-2 also shows that the samples from the particle selection method tend to have
a higher Axb value than cut core samples for all rock types tested. This shows that the
RoM ore particles offer less resistance to impact breakage. RoM ore particles contain
more microflaws as shown in the tomographic scans in section 4.4.1 induced through
pre-weakening processes (blasting and transportation) (Hahne, Pålsson & Samskog,
2003). As discussed in section 4.4.1, these flaws act as stress raisers when the particle
is under load thus making the particle less resistant to impact breakage.
Axb values for chromitite sourced via particle selection and cut core methods were
determined to be 325 and 159 respectively as presented in Table 4-2. According to
Napier-Munn et al (1999), UG2 chromitite tested was thus classified as very soft. Table
4-2 also indicates that Axb values for UG2 chromitite obtained using either particle
selection or cut core method were higher than respective breakage indicators obtained
for the other rocks. This highlights that chromitite exhibit the highest amenability to
fragmentation via impact. UG2 chromitite was found to consist predominantly of fine‐
grained chromite cemented mainly by orthopyroxene and plagioclase as presented in
section 4.2.1. Chromitite was found to be friable and easily fragments when stress was
applied due to the small amounts of orthopyroxene and plagioclase which hold the
chromite grains together.
Mottled and spotted anorthosite offer more resistance to impact breakage compared
to chromitite as indicated by lower Axb values in Table 4-2. The Axb values for both
rock types collected via the particle selection and cut core methods range from 77.6
to 138 hence mottled and spotted anorthosite are classified as soft to very soft. The
anorthositic rocks are coarse grained as illustrated in sections 4.2.3 and 4.2.4 resulting
in lower Axb values. Table 4-2 also shows that pyroxenite has the highest resistance
to impact breakage as revealed by the lowest Axb values. As discussed in 4.2.3, UG2
pyroxenite contained orthopyroxene grains that are relatively larger than the chromite
grains thus fracturing into a coarser product. In addition, the texture of the pyroxenite
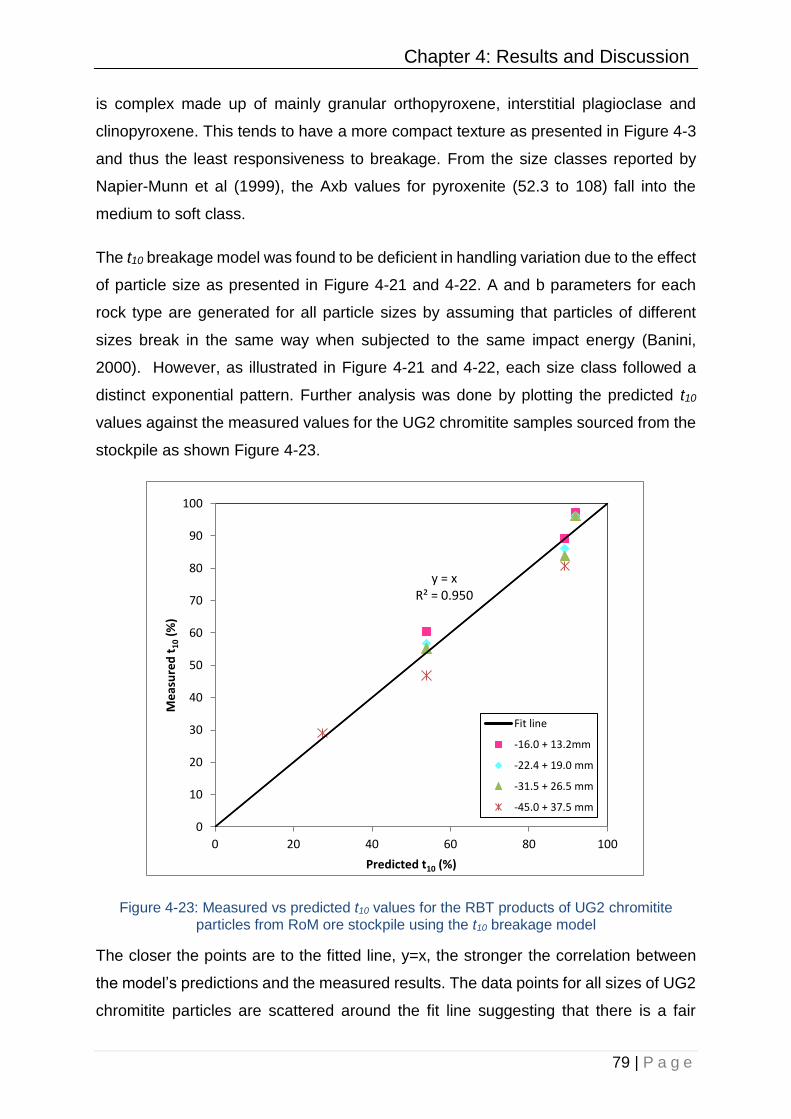
Chapter 4: Results and Discussion
79 | P a g e
is complex made up of mainly granular orthopyroxene, interstitial plagioclase and
clinopyroxene. This tends to have a more compact texture as presented in Figure 4-3
and thus the least responsiveness to breakage. From the size classes reported by
Napier-Munn et al (1999), the Axb values for pyroxenite (52.3 to 108) fall into the
medium to soft class.
The t10 breakage model was found to be deficient in handling variation due to the effect
of particle size as presented in Figure 4-21 and 4-22. A and b parameters for each
rock type are generated for all particle sizes by assuming that particles of different
sizes break in the same way when subjected to the same impact energy (Banini,
2000). However, as illustrated in Figure 4-21 and 4-22, each size class followed a
distinct exponential pattern. Further analysis was done by plotting the predicted t10
values against the measured values for the UG2 chromitite samples sourced from the
stockpile as shown Figure 4-23.
Figure 4-23: Measured vs predicted t10 values for the RBT products of UG2 chromitite particles from RoM ore stockpile using the t10 breakage model
The closer the points are to the fitted line, y=x, the stronger the correlation between
the model’s predictions and the measured results. The data points for all sizes of UG2
chromitite particles are scattered around the fit line suggesting that there is a fair
y = xR² = 0.950
0
10
20
30
40
50
60
70
80
90
100
0 20 40 60 80 100
Me
asu
red
t1
0(%
)
Predicted t10 (%)
Fit line
-16.0 + 13.2mm
-22.4 + 19.0 mm
-31.5 + 26.5 mm
-45.0 + 37.5 mm
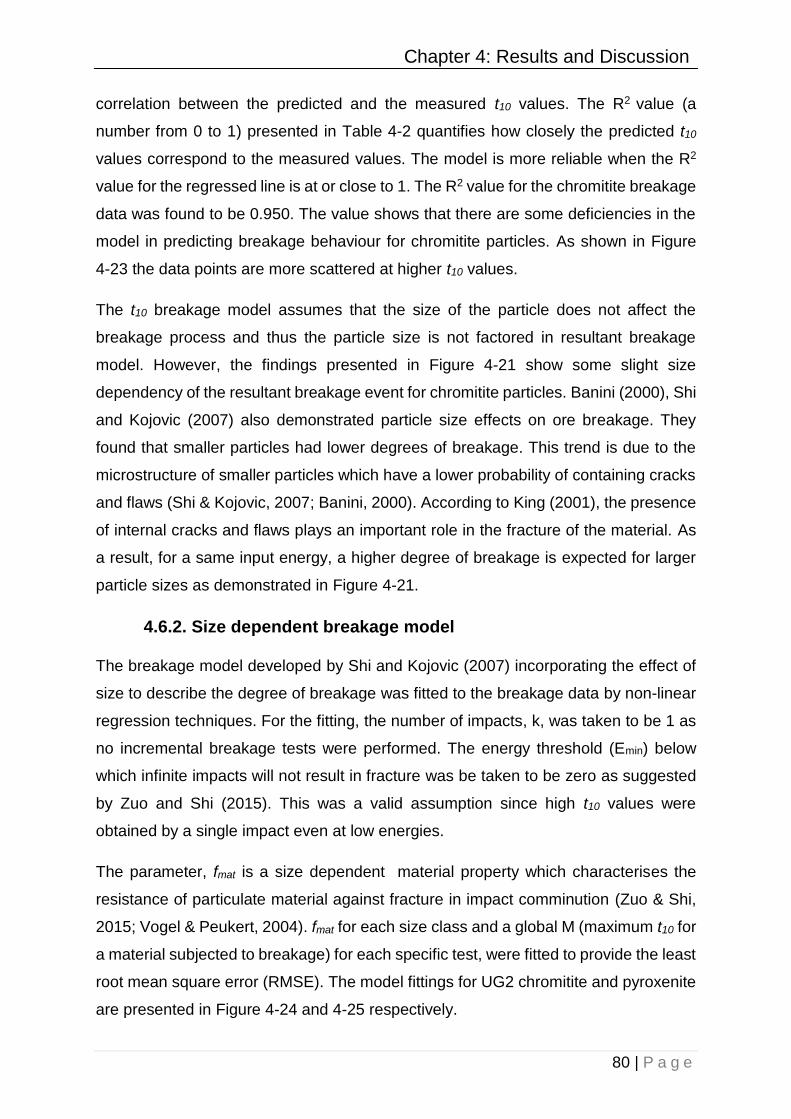
Chapter 4: Results and Discussion
80 | P a g e
correlation between the predicted and the measured t10 values. The R2 value (a
number from 0 to 1) presented in Table 4-2 quantifies how closely the predicted t10
values correspond to the measured values. The model is more reliable when the R2
value for the regressed line is at or close to 1. The R2 value for the chromitite breakage
data was found to be 0.950. The value shows that there are some deficiencies in the
model in predicting breakage behaviour for chromitite particles. As shown in Figure
4-23 the data points are more scattered at higher t10 values.
The t10 breakage model assumes that the size of the particle does not affect the
breakage process and thus the particle size is not factored in resultant breakage
model. However, the findings presented in Figure 4-21 show some slight size
dependency of the resultant breakage event for chromitite particles. Banini (2000), Shi
and Kojovic (2007) also demonstrated particle size effects on ore breakage. They
found that smaller particles had lower degrees of breakage. This trend is due to the
microstructure of smaller particles which have a lower probability of containing cracks
and flaws (Shi & Kojovic, 2007; Banini, 2000). According to King (2001), the presence
of internal cracks and flaws plays an important role in the fracture of the material. As
a result, for a same input energy, a higher degree of breakage is expected for larger
particle sizes as demonstrated in Figure 4-21.
4.6.2. Size dependent breakage model
The breakage model developed by Shi and Kojovic (2007) incorporating the effect of
size to describe the degree of breakage was fitted to the breakage data by non-linear
regression techniques. For the fitting, the number of impacts, k, was taken to be 1 as
no incremental breakage tests were performed. The energy threshold (Emin) below
which infinite impacts will not result in fracture was be taken to be zero as suggested
by Zuo and Shi (2015). This was a valid assumption since high t10 values were
obtained by a single impact even at low energies.
The parameter, fmat is a size dependent material property which characterises the
resistance of particulate material against fracture in impact comminution (Zuo & Shi,
2015; Vogel & Peukert, 2004). fmat for each size class and a global M (maximum t10 for
a material subjected to breakage) for each specific test, were fitted to provide the least
root mean square error (RMSE). The model fittings for UG2 chromitite and pyroxenite
are presented in Figure 4-24 and 4-25 respectively.
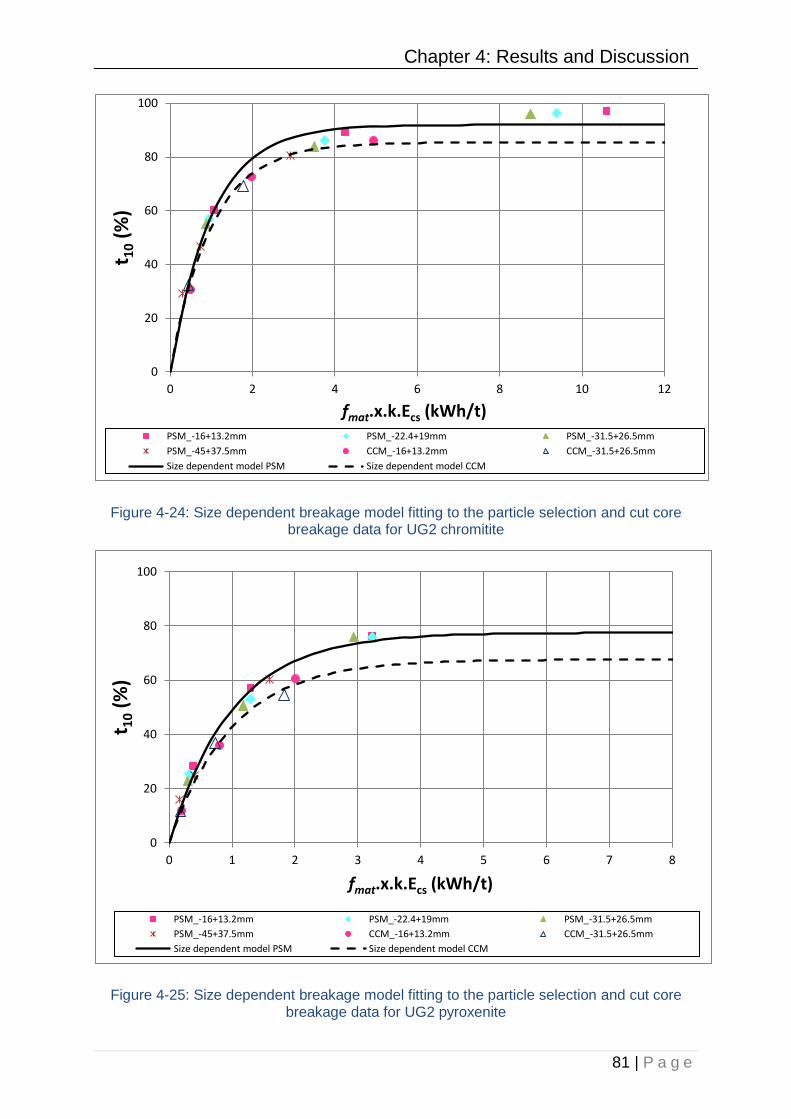
Chapter 4: Results and Discussion
81 | P a g e
Figure 4-24: Size dependent breakage model fitting to the particle selection and cut core breakage data for UG2 chromitite
Figure 4-25: Size dependent breakage model fitting to the particle selection and cut core breakage data for UG2 pyroxenite
0
20
40
60
80
100
0 2 4 6 8 10 12
t 10
(%)
fmat.x.k.Ecs (kWh/t)PSM_-16+13.2mm PSM_-22.4+19mm PSM_-31.5+26.5mm
PSM_-45+37.5mm CCM_-16+13.2mm CCM_-31.5+26.5mm
Size dependent model PSM Size dependent model CCM
0
20
40
60
80
100
0 1 2 3 4 5 6 7 8
t 10
(%)
fmat.x.k.Ecs (kWh/t)
PSM_-16+13.2mm PSM_-22.4+19mm PSM_-31.5+26.5mm
PSM_-45+37.5mm CCM_-16+13.2mm CCM_-31.5+26.5mm
Size dependent model PSM Size dependent model CCM
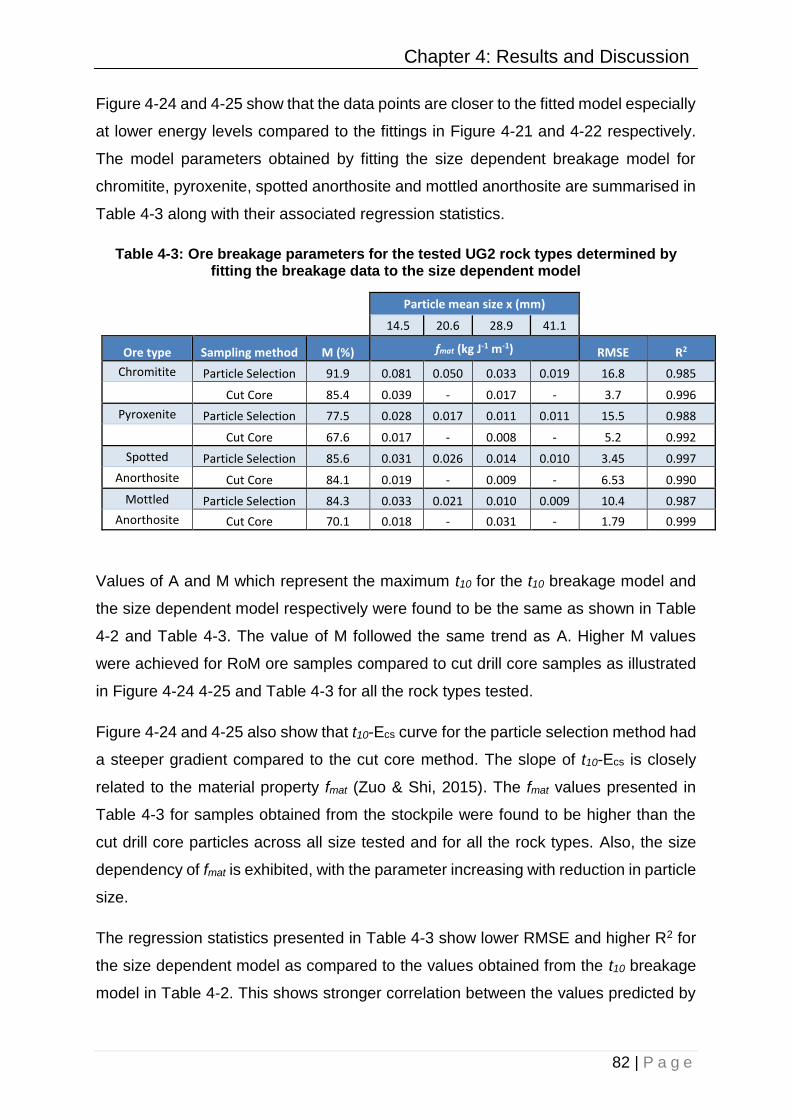
Chapter 4: Results and Discussion
82 | P a g e
Figure 4-24 and 4-25 show that the data points are closer to the fitted model especially
at lower energy levels compared to the fittings in Figure 4-21 and 4-22 respectively.
The model parameters obtained by fitting the size dependent breakage model for
chromitite, pyroxenite, spotted anorthosite and mottled anorthosite are summarised in
Table 4-3 along with their associated regression statistics.
Table 4-3: Ore breakage parameters for the tested UG2 rock types determined by fitting the breakage data to the size dependent model
Particle mean size x (mm)
14.5 20.6 28.9 41.1
Ore type Sampling method M (%) fmat (kg J-1 m-1) RMSE R2
Chromitite Particle Selection 91.9 0.081 0.050 0.033 0.019 16.8 0.985
Cut Core 85.4 0.039 - 0.017 - 3.7 0.996
Pyroxenite Particle Selection 77.5 0.028 0.017 0.011 0.011 15.5 0.988
Cut Core 67.6 0.017 - 0.008 - 5.2 0.992
Spotted Particle Selection 85.6 0.031 0.026 0.014 0.010 3.45 0.997
Anorthosite Cut Core 84.1 0.019 - 0.009 - 6.53 0.990
Mottled Particle Selection 84.3 0.033 0.021 0.010 0.009 10.4 0.987
Anorthosite Cut Core 70.1 0.018 - 0.031 - 1.79 0.999
Values of A and M which represent the maximum t10 for the t10 breakage model and
the size dependent model respectively were found to be the same as shown in Table
4-2 and Table 4-3. The value of M followed the same trend as A. Higher M values
were achieved for RoM ore samples compared to cut drill core samples as illustrated
in Figure 4-24 4-25 and Table 4-3 for all the rock types tested.
Figure 4-24 and 4-25 also show that t10-Ecs curve for the particle selection method had
a steeper gradient compared to the cut core method. The slope of t10-Ecs is closely
related to the material property fmat (Zuo & Shi, 2015). The fmat values presented in
Table 4-3 for samples obtained from the stockpile were found to be higher than the
cut drill core particles across all size tested and for all the rock types. Also, the size
dependency of fmat is exhibited, with the parameter increasing with reduction in particle
size.
The regression statistics presented in Table 4-3 show lower RMSE and higher R2 for
the size dependent model as compared to the values obtained from the t10 breakage
model in Table 4-2. This shows stronger correlation between the values predicted by
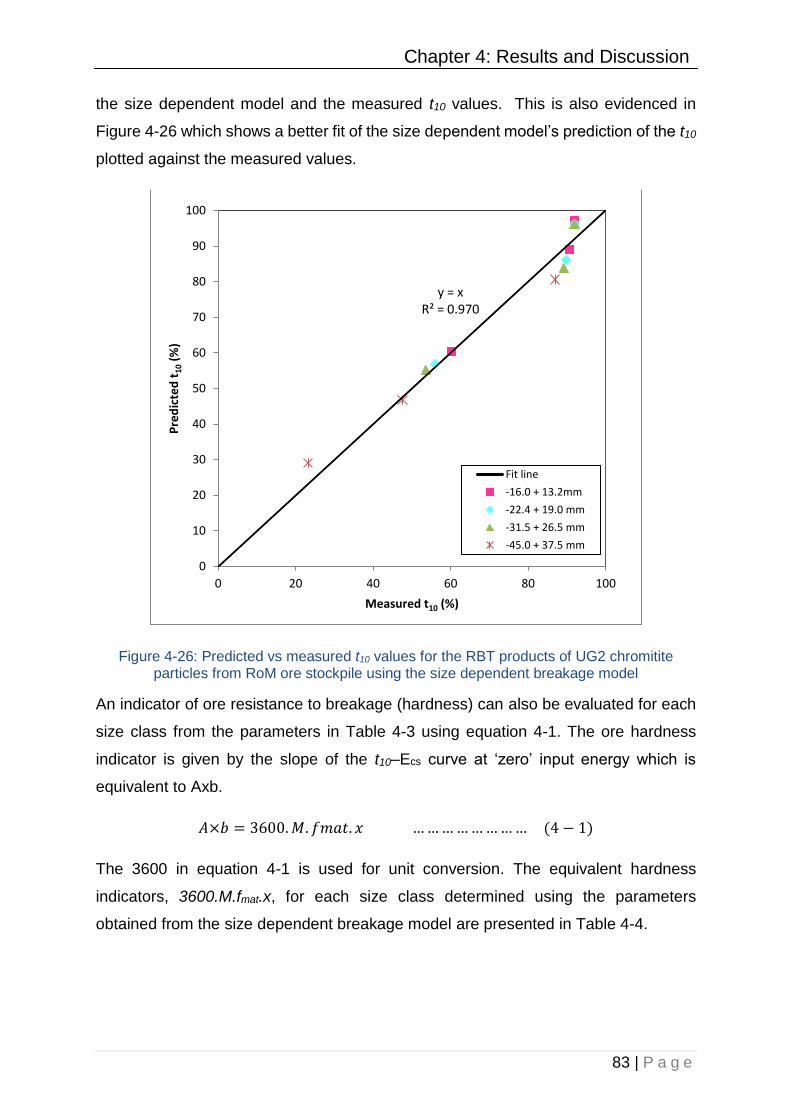
Chapter 4: Results and Discussion
83 | P a g e
the size dependent model and the measured t10 values. This is also evidenced in
Figure 4-26 which shows a better fit of the size dependent model’s prediction of the t10
plotted against the measured values.
Figure 4-26: Predicted vs measured t10 values for the RBT products of UG2 chromitite particles from RoM ore stockpile using the size dependent breakage model
An indicator of ore resistance to breakage (hardness) can also be evaluated for each
size class from the parameters in Table 4-3 using equation 4-1. The ore hardness
indicator is given by the slope of the t10–Ecs curve at ‘zero’ input energy which is
equivalent to Axb.
𝐴×𝑏 = 3600. 𝑀. 𝑓𝑚𝑎𝑡. 𝑥 … … … … … … … … (4 − 1)
The 3600 in equation 4-1 is used for unit conversion. The equivalent hardness
indicators, 3600.M.fmat.x, for each size class determined using the parameters
obtained from the size dependent breakage model are presented in Table 4-4.
y = xR² = 0.970
0
10
20
30
40
50
60
70
80
90
100
0 20 40 60 80 100
Pre
dic
ted
t1
0(%
)
Measured t10 (%)
Fit line
-16.0 + 13.2mm
-22.4 + 19.0 mm
-31.5 + 26.5 mm
-45.0 + 37.5 mm
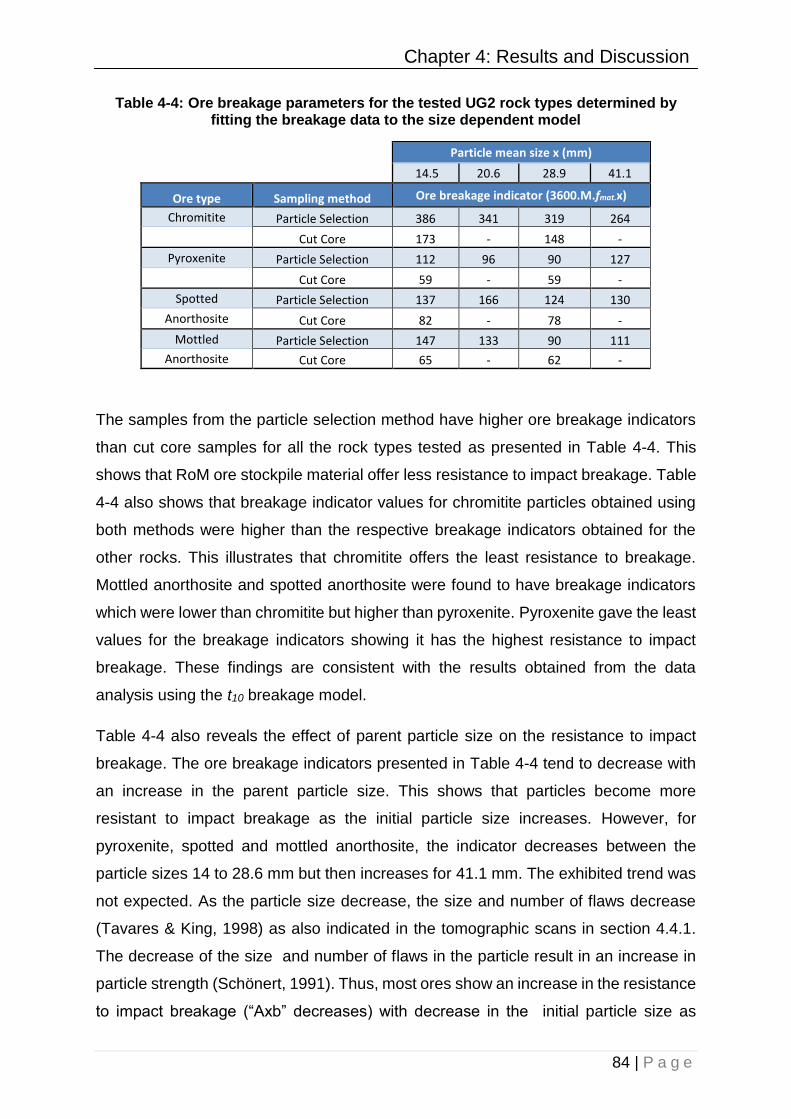
Chapter 4: Results and Discussion
84 | P a g e
Table 4-4: Ore breakage parameters for the tested UG2 rock types determined by fitting the breakage data to the size dependent model
Particle mean size x (mm)
14.5 20.6 28.9 41.1
Ore type Sampling method Ore breakage indicator (3600.M.fmat.x)
Chromitite Particle Selection 386 341 319 264
Cut Core 173 - 148 -
Pyroxenite Particle Selection 112 96 90 127
Cut Core 59 - 59 -
Spotted Particle Selection 137 166 124 130
Anorthosite Cut Core 82 - 78 -
Mottled Particle Selection 147 133 90 111
Anorthosite Cut Core 65 - 62 -
The samples from the particle selection method have higher ore breakage indicators
than cut core samples for all the rock types tested as presented in Table 4-4. This
shows that RoM ore stockpile material offer less resistance to impact breakage. Table
4-4 also shows that breakage indicator values for chromitite particles obtained using
both methods were higher than the respective breakage indicators obtained for the
other rocks. This illustrates that chromitite offers the least resistance to breakage.
Mottled anorthosite and spotted anorthosite were found to have breakage indicators
which were lower than chromitite but higher than pyroxenite. Pyroxenite gave the least
values for the breakage indicators showing it has the highest resistance to impact
breakage. These findings are consistent with the results obtained from the data
analysis using the t10 breakage model.
Table 4-4 also reveals the effect of parent particle size on the resistance to impact
breakage. The ore breakage indicators presented in Table 4-4 tend to decrease with
an increase in the parent particle size. This shows that particles become more
resistant to impact breakage as the initial particle size increases. However, for
pyroxenite, spotted and mottled anorthosite, the indicator decreases between the
particle sizes 14 to 28.6 mm but then increases for 41.1 mm. The exhibited trend was
not expected. As the particle size decrease, the size and number of flaws decrease
(Tavares & King, 1998) as also indicated in the tomographic scans in section 4.4.1.
The decrease of the size and number of flaws in the particle result in an increase in
particle strength (Schönert, 1991). Thus, most ores show an increase in the resistance
to impact breakage (“Axb” decreases) with decrease in the initial particle size as
Chapter 4: Results and Discussion
85 | P a g e
evidenced by Banini (2000). However, the findings in this study were similar to
observations by Shi and Kojovic (2007) presented in Figure 2-12. Shi and Kojovic
(2007) showed that for some ores such as lead ore in their work, the Axb values tend
to have a general decreasing trend with increase in initial particle size. Figure 2-12
also shows that although Axb values have a general trend, either increasing or
decreasing, the values fluctuates with an increase in parent particle size. This could
explain the observed trend in Table 4-4 as the tests were carried out at a narrow initial
particle size compared to the range tested by Shi and Kojovic (2007).
4.7 Summary of the key findings
The following is a summary of key results from the ore breakage characterisation of
UG2 RoM stockpile and cut drill core particles using the RBT:
• Mineralogical analysis of the UG2 samples revealed that chromitite tested
consisted predominantly of fine, discrete, rounded chromite grains cemented
together by small amounts of plagioclase. Pyroxenite specimens were found to
contain mainly granular orthopyroxene, interstitial plagioclase and
clinopyroxene. Spotted anorthosite specimens tested were composed primarily
of plagioclase with orthopyroxene crystals forming isolated interstitial “spots”
creating a poikilitic texture. The analysis of UG2 mottled anorthosite showed
that the particles were made up mainly of plagioclase.
• Particles sourced from the RoM ore stockpile were consistently found to break
into a finer progeny compared to cut drill core samples. This was demonstrated
by the finer progeny size distributions and higher degrees of breakage for the
stockpile material for all the rock types tested.
• Tomographic scans revealed the presence of cracks in large (-31.5 + 26.5 mm)
RoM ore particles. No visible cracks were seen in the large cut core particle. In
addition, there were no cracks observed in the small particles (-16.0 + 13.2 mm)
for both the grab samples from RoM ore and cut drill core particles.
• The ore hardness parameters were determined from fitting the breakage data
to standard impact breakage characterisation models (t10 breakage and size
dependent breakage model). The t10 breakage model fitted well to the breakage
data for all rock types tested with the least R2 value obtained of 0.950 for
chromitite RoM samples. The parameters, A and b, were extracted and used to
Chapter 4: Results and Discussion
86 | P a g e
determine the ore hardness indicator (Axb). Samples obtained via the particle
selection method were found to have higher Axb values thus less resistance to
breakage compared to the cut drill core samples. The Axb values for RoM
stockpile particles (in decreasing order) of chromitite, spotted anorthosite,
mottled anorthosite and pyroxenite were found to be 325, 138, 115 and 108
respectively. A similar trend was observed for the aforementioned rock types
tested sourced via the cut core method. Using the ore hardness classes
presented by Napier-Munn et al (1999), UG2 chromitite, spotted anorthosite,
mottled anorthosite and pyroxenite were thus classified as very soft, soft to very
soft, soft to very soft and medium to soft respectively.
• The size dependent breakage model fitted to the breakage data showed an
improved fit, compared to the t10 breakage model, with a minimum R2 value
obtained of 0.985 for chromitite RoM samples. An equivalent to the Axb for the
t10 breakage model, 3600.M.fmat.x, was determined for each size class for the
rock types tested. The breakage indicators for size classes tested showed
dependency on the initial particle size. The indicators decrease with an increase
in the parent particle size. However, for pyroxenite, spotted and mottled
anorthosite, the indicator decreases between the particle sizes 14 to 28.6 mm
but then increases for 41.1 mm

Chapter 5: Conclusions and Recommendations
87 | P a g e
5. CONCLUSIONS AND RECOMMENDATIONSOverview
In this chapter, the thesis objectives are assessed and appropriate conclusions are
drawn from the work. A number of recommendations for future work have also been
suggested.
5.1 Conclusions
The scope of work in this thesis was guided by the hypothesis which postulated that
UG2 rock particles sourced from a RoM ore stockpile break more readily to produce a
finer product than cut drill core samples from the shaft supplying the same stockpile
material.
To interrogate this hypothesis, ore breakage characterisation tests were conducted
using the RBT on the UG2 rock particles sourced from a RoM ore stockpile and cut
drill core samples. Mineralogical analyses were also done to determine the
mineralogical composition, texture and presence of cracks in the samples. The results
of this work support the proposed hypothesis as shown by the following conclusions
from the research objectives:
5.1.1 Mineralogical composition and texture of UG2 samples
The abundant rock types namely chromitite, pyroxenite, spotted anorthosite and
mottled anorthosite from the UG2 RoM ore and drill core samples from Karee 3 shaft
in the Marikana region were grouped based on the visible lithological characteristics
such as colour, texture, grain size and composition. The analysis done with Leica
EZ4D optical microscope and QEMSCAN 650F confirmed the mineralogical
differences in the UG2 chromitite, pyroxenite, spotted anorthosite and mottled
anorthosite samples. Chromitite comprised of predominantly fine, discrete, rounded
chromite grains cemented mainly by plagioclase whilst pyroxenite contained mostly
granular orthopyroxene, interstitial plagioclase and clinopyroxene. Spotted and
mottled anorthosite samples were found to be coarse grained consisting mainly of
plagioclase. In addition, spotted anorthosite was found to contain orthopyroxene
crystals forming isolated interstitial “spots” within the plagioclase. Mottled anorthosite
sample was found to have negligible amounts of pyroxene.
Chapter 5: Conclusions and Recommendations
88 | P a g e
5.1.2 Progeny particle size distributions and the degrees of breakage
The progeny particle size distributions and the degrees of breakage of UG2 chromitite,
pyroxenite, spotted anorthosite and mottled anorthosite sourced from RoM stockpile
and cut drill cores subjected to impact breakage using the RBT were compared and
the following conclusions were made:
(a) The particle selection and cut core methods
The samples obtained from RoM stockpile were found to break into a finer product
compared to cut drill core samples subjected to the same input energies for all the
rock types tested. Tomographic scans for RoM stockpile particles revealed the
presence of cracks induced through pre-weakening processes such as blasting and
transportation. These flaws act as stress raisers when the particle is under load
resulting in the generation of fine fragments. No cracks were visible in the tomographic
scans of cut drill core samples.
(b) Main UG2 rock types
It was found that UG2 chromitite particles fragment into finer progeny particles
compared to the other rock types evidenced at the energy levels tested. As shown
from the mineralogical analysis, chromitite consists mainly of fine‐grained chromite
loosely cemented in orthopyroxene and plagioclase matrix which easily fragments
when stress is applied. There is no significant difference between the fineness of the
breakage products for mottled and spotted anorthosite despite the textural differences
for the anorthositic rocks. Pyroxenite produced a coarser product compared to the
other rock types across all energy levels tested. This was attributed to a complex
texture found in the pyroxenite resulting from the granular orthopyroxene and
interstitial plagioclase and clinopyroxene. The orthopyroxene grains were also found
to be larger than the chromite grains in chromitite particles.
(c) Effect of energy input
For the energy levels tested, increasing the specific input energy resulted in finer
progeny particle size distributions and higher degrees of breakage for all rock types.
When the input energy is increased, the stressing intensity in the particles also
increases. This intensifies the propagation of cracks in the particles resulting in
fracturing into smaller fragments.
Chapter 5: Conclusions and Recommendations
89 | P a g e
5.1.3 Relative hardness parameters of the different rock types
The t10 breakage model and size dependent model were fitted to the breakage data of
the UG2 chromitite, pyroxenite, spotted anorthosite and mottled anorthosite particles
sourced from RoM ore stockpile and cut drill core particles. From the model fittings,
ore hardness parameters were determined. As expected, the breakage models
confirmed the exponential relationship between the degree of breakage and the input
energy. This reflects that increasing energy inputs results in higher degrees of
breakage until no further significant increase occurs. Furthermore, the following
conclusions were also drawn from the hardness parameters.
(a) The particle selection and cut core methods
The parameters, A and b, were extracted from the t10 breakage model fittings and used
to determine the ore hardness indicator (Axb). The maximum degree of breakage, A,
obtained from a single impact of the RoM stockpile particles were consistently found
to be higher than cut drill core samples for each rock type tested. Also, it was found
that RoM ore particles showed less resistance to deformation prior to fracture, b, than
cut drill core particles.
In addition, the RoM ore particles offered less resistance to impact breakage shown
by higher Axb values as compared to the cut drill core samples. As previously
mentioned, RoM ore particles contained more microflaws as shown in the tomographic
scans induced through pre-weakening processes which makes the particles breaks
more readily. Consequently, more energy is required to break the cut core particles to
a similar progeny size distribution as RoM ore particles. This highlights that this
consideration should be applied when designing comminution circuits to process ore
obtained using rock cutting technology to ensure that the devices are capable of
meeting grind and throughput targets.
The equivalent hardness indicators, 3600.M.fmat.x, for each size class determined
using the parameters obtained from the size dependent breakage model decrease
with an increase in the parent particle size. This shows that particles become more
resistant to impact breakage as the initial particle size increases. However, for
pyroxenite, spotted and mottled anorthosite, the indicator decreases between the
particle sizes 14 to 28.6 mm but then increases for 41.1 mm.
Chapter 5: Conclusions and Recommendations
90 | P a g e
(b) Main UG2 rock types
It was found that UG2 chromitite particles exhibit the highest amenability to
fragmentation via impact, followed by spotted and mottled anorthosite. Pyroxenite has
the highest resistance to impact breakage. UG2 chromitite, spotted anorthosite,
mottled anorthosite and pyroxenite were classified as very soft, soft to very soft, soft
to very soft and medium to soft respectively according to ore hardness classes
presented by Napier-Munn et al (1999). The differences in the breakage properties of
the main UG2 rock types were attributed to the mineralogical difference of the samples
tested.
5.2 Recommendations
The following recommendations are proposed for future test work based on the
outcomes of this study:
• The mineralogical analysis with the Leica EZ4D optical microscope and
QEMSCAN 650F was done on limited samples of UG2 chromitite, pyroxenite,
spotted anorthosite and mottled anorthosite particles. Further investigation on
a larger sample of each rock type is required including other waste rocks such
as norite, to conclusively confirm the observed mineralogical and textural
composition. This will be important in predicting and explaining the breakage
properties of the different rocks.
• Chromitite particles tend to break along the chromite grain boundaries as
shown by the bimodal progeny particle size distributions indicating preferential
breakage. Unlike for pyroxenite spotted anorthosite and mottled anorthosite,
the progeny particle size distributions were smooth curves without kinks
suggesting random fracture. Further analysis exploring the breakage
characteristics and the propagation of cracks for different mode of breakage in
these particles is required.
• Impact breakage tests and tomographic analyses should be done on crushed
rock particles of similar size classes to tested grab samples from RoM stock
pile. This enables the investigation of the amenability of crushed ore particles
to impact breakage and whether there is any significant change in crack density
from RoM samples.
References
91 | P a g e
REFERENCES Anderson, T.L., 2005. Fracture Mechanics: Fundamentals and Applications,CRC
press: 640 -641.
Ashby, M.F., Shercliff, H. & Cebon, D. 2007. Materials: engineering, science,
processing and design. Amsterdam: Elsevier: 166-167.
Ashwal, L.D. 1993. Anorthosites (Vol. 21). Springer Science & Business Media.
Banini, G.A. 2000. An integrated description of rock breakage in comminution
machines. PhD Thesis, JKMRC, University of Queensland, Australia.
Baum, W. 2013. Ore characterization, process mineralogy and lab automation a
roadmap for future mining. Minerals Engineering. 60: 69 -73.
Bbosa, L.S. 2007. Measurement of impact breakage properties of ore particles using
a series of devices. Postgraduate thesis, Centre for Minerals Research, Department
of Chemical Engineering, University of Cape Town.
Bbosa, L., Powell, M.S. & Cloete, T.J. 2006. An investigation of impact breakage of
rocks using the split Hopkinson pressure bar. Journal of the South African Institute of
Mining and Metallurgy, 106(4): 291-296.
Bearman, R.A., Briggs, C.A. & Kojovic, T. 1997. The application of rock mechanics
parameters to the prediction of comminution behaviour. Minerals Engineering, 1997.
10(3): 255-264.
Bonfils, B. & Powell, M.S. 2013. Developments in Incremental Rock Breakage Testing
Methodologies and Modelling. ESCC2013: 13th European Symposium on
Comminution and Classification: 165–168.
Bourgeois, F.S. & Banini, G. A. 2002. A portable load cell for in-situ ore impact
breakage testing. International Journal of Mineral Processing. 65(1):31–54.
Bueno, M.P., Kojovic, T., Powell, M.S. & Shi, F. 2013. Multi-component AG/SAG mill
model. Minerals Engineering. 43-44:12–21.
Cawthorn, R.G. 1999. The platinum and palladium resources of the Bushveld
Complex. South African Journal of Science. 95: 481–489.
References
92 | P a g e
Chernet, T. & Marmo, J. 2003. Direct comparison on mechanical and digital size
analyses of Kemi Chromite , Finland. Minerals Engineering. 16:1245–1249.
Clarke, B., Uken, R. & Reinhardt, J. 2005. Lithos Structural and compositional
constraints on the emplacement of the Bushveld Complex , South Africa. LITHOS.
111(1-2): 21–36.
Cleary, P.W. 1998. Predicting charge motion, power draw, segregation and wear in
ball mills using discrete element methods. Minerals Engineering. 11(11):1061–1080.
Cohen, H.E. 1983. Energy usage in mineral processing. Trans. I.M.M. 92:C160–C164.
Condie, K.C. 1992. Proterozoic crustal evolution. Elsevier Publishing Co., Amsterdam:
537.
Crabtree, D.D., Kinasevich, R.S., Mular, A.L., Meloy, T.P. & Fuerstenau, D.W. 1964.
Mechanisms of size reduction in comminution systems. Part I. Impact, abrasion and
chipping grinding. Transaction of the American Institute of Mining, Metallurgical, and
Petroleum Engineers. 229: 201–206.
Cramer, L.A. 2001. The Extractive Metallurgy of South Africa ’ s Platinum Ores. Jom,
53(10): 14-18.
Cropp, A. & Goodall, W. 2013. The influence of rock texture on mineral processing.
Min Assist: 1–9.
Van Eck, M. 2007. Investigating the products from different modes of particle breakage
testing. University of Cape Town, South Africa.
Esen, S., Rosa, D. La, Dance, A., Valery, W. & Jankovic, A. 2007. Integration and
Optimisation of Blasting and Comminution Processes. In EXPLO Conference.
Wollongong, NSW: The Australasian Institute of Mining and Metallurgy. 1–10.
Frew, D.J., Forrestal, M.J. & Chen, W. 2001. A split Hopkinson pressure bar technique
to determine compressive stress-strain data for rock materials. Experimental
Mechanics. 41(1):40–46.
Fuerstenau, D.W., Lutch, J.J. & De, A. 1999. The effect of ball size on the energy
efficiency of hybrid high-pressure roll mill/ball mill grinding. Powder Technology.
References
93 | P a g e
105(1-3): 199–204.
Garcia, D., Lin, C.L. & Miller, J.D. 2009. Quantitative analysis of grain boundary
fracture in the breakage of single multiphase particles using X-ray microtomography
procedures. Minerals Engineering. 22(3):236–243.
Hahne, R., Pålsson, B.I. & Samskog, P.O. 2003. Ore characterisation for––and
simulation of––primary autogenous grinding. Minerals Engineering. 16(1):13–19.
Hartley, J.., Prisbrey, K.. & Wick, O.J. 1978. Chemical additives for ore grinding: How
effective are they?. Engineering & Mining Journal. 105.
Hoffman, J.W. & Beer, F.C.D.E. 2011. Characteristics of the Micro-Focus X-ray
Tomography Facility ( MIXRAD ) at Necsa in South Africa. 18th World Conference on
Nondestructive Testing: 16–20.
Hopkinson, B. 1914. A method of measuring the pressure produced in the detonation
of high explosives or by the impact of bullets. Phil. Trans. R Soc. Lond. A213. 437-456
Huang, J., Xu, S. & Hu, S. 2014. Influence of particle breakage on the dynamic
compression responses of brittle granular materials. Mechanics of Materials. 68:15–
28.
Inglis, C.E. 1913. Stresses in a Plate Due to Presence of Cracks and Sharp Corners.
Transaction of the Institution of Naval Architects. 55: 219–230.
JKTech Rotary Breakage Tester. 2012. Breakage test procedure. Section 9 Machine
manual. Published by JKTech
Kapur, P.C., Pande, D. & Fuerstenau, D.W. 1997. Analysis of single-particle breakage
by impact grinding. 49: 223–236.
King, R.P. 2001. Modeling and Simulation of Mineral Processing Systems. Oxford:
Butterworth-Heinemann.
Klerk, W.J. de. 1995. Mineralogy Petrology Textures exhibited by feldspars in the
Giant Mottled Anorthosite ( GMA ) of the Bastard unit in the Upper Critical Zone ,
Western Bushveld Complex. Mineralogy and Petrology. 54: 25–34.
Kojovic, T., Shi, F., Larbi-Bram, S. & Manlapig, E. 2008. Julius Kruttschnitt rotary

References
94 | P a g e
breakage tester (JKRBT) – any ore, any mine. In MetPlant (The Australasian Institute
of Mining and Metallurgy: Melbourne): 91–104.
Krogh, S.R. 1980. Crushing characteristics. Powder Technology. 27(2): 171–181.
Larbi-Bram, S. 2009. A Study of Ore Breakage Characterization for AG/SAG Mill
Modelling. University of Queensland.
Lee, C.A. 1996. A review of Mineralization in the Bushveld Complex and some other
Layered Intrusions. Elseveir Science: 103–145.
Leung, K. 1987. An energy based ore specific model for autogenous aand semi-
autogenous grinding. University of Queensland, Brisbane, Australia.
Liddell, K.S., McRae, L.B. & Dunne, R.C. 1986. Process routes for the beneficiation of
Noble metals from Merensky and UG2 ores.
Mainza, A.N. & Powell, M.S. 2006. RoM Ball Mills - A comparison with AG/ SAG
Milling. In Proceedings of International Autogenous and Semi-Autogenous Grinding
Technology (2): 314–325.
Mathez, E.A. & Mey, J.L. 2005. Character of the UG2 Chromitite and Host Rocks and
Petrogenesis of Its Pegmatoidal Footwall, Northeastern Bushveld Complex. Economic
Geology. 100: 1617–1630.
Mondal, S.K. & Mathez, E.A. 2006. Origin of the UG2 chromitite layer , Bushveld
Complex. Journal of Petrology. 48(3): 495–510.
Morrell, S., Johnson, G. & Revy, T. 1991. A comparison through observation and
simulation of the Power Utilization and Perfomance of two Dissimilar Comminution
Plants. In Proc 4th Mill Operators Conference. Tasmania: Australasian Institute of
Mining and Metallurgy.
Morrell, S., Finch, W.M., Kojovic, T. & Jr, H.D. 1996. Modelling and simulation of large
diameter autogeneous and semi-autogeneous mills. 45: 289–300.
Morrison, R.D. & Richardson, J.M. 2002. JKSimMet: A simulator for analysis,
optimisation and design of comminution circuits. In Mineral Processing Plant Design
Practice and Control. A.L. Mular, D.N. Halbe, & D.J. Barratt, Eds. Vancouver, B.C.,
References
95 | P a g e
Canada: SME: Society for Mining, Metallurgy and Exploration. 442–460.
Napier-Munn, T. 2014. Is progress in energy-efficient comminution doomed? 73:1–6.
Napier-Munn, T.J., Morell, S., Morrison, R.D. & Kojovic, T. 1996. Minerals
Comminution Circuits: Their operation and optimization. JKMRC. Brisbane, Australia:
Narayanan, S.. 1985. Development of a Laboratory Single Particle Technique and its
Application to Ball Mill Modelling and Scaleup. University of Queensland, Brisbane,
Australia.
Pauw, O.G. & Maré, M.S. 1988. The determination of optimum impact-breakage
routes for an ore. Powder Technology. 54(1):3–13.
Penberthy, C.J. 2001. The effect of mineralogical variation in the UG2 chromitite on
recovery of platinumgroup elements. University of Pretoria.
Petruk, W. 2000. Applied Mineralogy in the Mining Industry. Oxford: Elsevier Science.
Radziszewski, P. & Laplante, A. 2006. Exploring the effect of friction losses on drop
weight breakage results. AMIRA Project P9N Mineral Processing 5th P9N Technical
Report. 42–49.
Rule, C. & Schouwstra, R.P. 2011. Process mineralogy delivering significant value at
Anglo Platinum concentrator operations. 10th International Congress for Applied
Mineralogy. (August):1–5.
Sahoo, R. 2006. Review: An investigation of single particle breakage tests for coal
handling system of the gladstone port. Powder Technology. 161(2):158–167.
Schönert, K. 2004. Breakage of spheres and circular discs. Powder Technology. 143-
144:2–18.
Schouwstra, R.P. & Smit, a. J. 2011. Developments in mineralogical techniques -
What about mineralogists? Minerals Engineering. 24(12):1224–1228.
Schouwstra, R.P., Kinloch, E.D. & Lee, C.A. 2000. A Short Geological Review of the
Bushveld Complex. Platinum Metals Review. 44(2):33–39.
Schwarz, S. & Richardson, J. 2013. Modelling and simulation of mineral processing
References
96 | P a g e
circuits using JKSimMet and JKSimFloat. 2013 SME Annual Meeting & Exhibit (SME
2013) and CMA 115th National Western Mining Conference. 615 – 622. Available:
http://www.ceecthefuture.org/wp-content/uploads/2013/12/Richardson-schwarz.pdf.
Shi, F. & Kojovic, T. 2007. Validation of a model for impact breakage incorporating
particle size effect. International Journal of Mineral Processing. 82(3):156–163.
Shi, F. & Kojovic, T. 2011. Comparison of impact breakage characterisation methods
between the JK Rotary Breakage Tester and drop weight tester. In SAG 2011
Conference. V. Paper 101. Vancouver, Canada.
Shi, F., Kojovic, T., Larbi-Bram, S. & Manlapig, E. 2006. Development of a new
breakage characterisation device. AMIRA Project P9N Mineral Processing:5th
technical report. 55–66.
Shi, F., Kojovic, T., Larbi-bram, S. & Manlapig, E. 2009. Development of a rapid
particle breakage characterisation device – The JKRBT. Minerals Engineering. 22(7-
8):602–612.
Stamboliadis, E.T. 2008. The evolution of a mineral liberation model by the repetition
of a simple random breakage pattern. Minerals Engineering. 21:213–223.
Steyn, J.J. 2012. Developing a framework for the design of the milling and rougher
circuits for a platinum-bearing UG2 ore. University of Cape Town.
Tavares, L.. 2004. Optimum routes for particle breakage by impact. Powder
Technology. 142(2-3):81–91.
Tavares, L.M. 2007. Breakage of Single Particles: Quasi-Static. In Particle Breakage:
Handbook of PowderTechnology. 12. A.D. Salman, M. Ghadiri, & M.J. Hounslow, Eds.
Amsterdam: Elsevier Science & Technology Books. 3–68.
Tavares, L.. & King, R.. 1998. Single-particle fracture under impact loading.
International Journal of Mineral Processing. 54(1):1–28.
Tavares, L.. & King, R.. 2002. Modeling of particle fracture by repeated impacts using
continuum damage mechanics. Powder Technology. 123(2-3):138–146.
Tavares, L.M. & King, R.P. 2004. Measurement of the load–deformation response
References
97 | P a g e
from impact-breakage of particles. International Journal of Mineral Processing.
74:S267–S277.
Tuzcu, E.T., Dhawan, N. & Rajamani, R.K. 2012. Coarse particle fracture with the
ultrafast load cell. 28(4).
Umucu, Y., Deniz, V. & Unal, N. 2013. An evaluation of a modified product size
distribution model based on t-family curves for three different crushers.
Physicochemical Problems of Mineral Processing. 49(2):473–480.
Vassiliev, P. V, Ledoux, H. & Gold, C. 2008. Modeling Ore Textures and Mineral
Liberation Using 3D Voronoi Diagrams. In International conference on Numerical
geometry, grid generation and scientific computing. V.A. Garanzha, Y.G. Evtushenko,
B.K. Soni, & N.P. Weatherhill, Eds. Moscow. 220–225.
Vogel, L. & Peukert, W. 2003. Breakage behaviour of different materials—construction
of a mastercurve for the breakage probability. Powder Technology. 129(1-3):101–110.
Vogel, L. & Peukert, W. 2004. Determination of material properties relevant to grinding
by practicable labscale milling tests. International Journal of Mineral Processing.
74:S329–S338.
Vogel, L. & Peukert, W. 2005. From single particle impact behaviour to modelling of
impact mills. Chemical Engineering Science. 60(18):5164–5176.
Williams, N.R. & Holtzhausen, S. 2001. The impact of ore characterization and
blending on metallurgical plant performance:437–446.
Wills, B.A. & Napier-Munn, T. 2006. Mineral Processing Technology. 7th Edition.
Elsevier Science & Technology Books.
Xiao, Z. & Laplante, a. R. 2004. Characterizing and recovering the platinum group
minerals - A review. Minerals Engineering. 17:961–979.
Xu, W., Dhawan, N., Lin, C.L. & Miller, J.D. 2013. Further study of grain boundary
fracture in the breakage of single multiphase particles using X-ray microtomography
procedures. Minerals Engineering. 46-47(3):89–94.
Yahyaei, M., Hilden, M., Shi, F., Liu, L., Ballatyne, G. & Palaniandy, S. n.d.
References
98 | P a g e
Comminution. In Production, Handling and Characterization of Particulate Materials.
157–200.
Zuo, W. & Shi, F. 2015. A t 10 -based method for evaluation of ore pre-weakening and
energy reduction. Minerals Engineering. 79:212–219.
Zuo, W. & Shi, F. 2016. Ore impact breakage characterisation using mixed particles
in wide size range. Minerals Engineering. 86(2016):96–103.

Appendix A
99 | P a g e
A. APPENDIX A
1.1 Raw Data
Table A-1: Breakage data for UG2 Chromitite RoM ore sample run 1 showing the mass retained on the standard screens
Size (mm) 45.0 x 37.5 31.5 x 26.5 22.4 x 19.0 16.0 x13.2
rpm 938 1408 2606 1408 2606 3915 1408 2606 3915 1408 2606 3915
Ecs (kWh/t) 0.10 0.25 1.00 0.25 1.00 2.50 0.25 1.00 2.50 0.25 1.00 2.50 No. of particles 30 30 30 30
Initial mass 5416.1 5193.6 5024.1 1909.7 1758.3 1891.1 624.6 726.1 678.3 212.1 237.1 189
After breakage 5396.2 5086.7 4885.3 1899.8 1750.4 1855.3 620.7 711.6 665.2 211.2 236.8 186.2
45.0 0 0 0 0 0 0 0 0 0 0.0 0.0 0.0
37.5 132.4 0 0 0 0 0 0 0 0 0.0 0.0 0.0
26.5 502.2 72.7 0 0 0 0 0 0 0 0.0 0.0 0.0
19.0 970.5 328.3 27.2 64.8 0 0 0 0 0 0.0 0.0 0.0
13.2 801.6 471.5 107.5 120.9 19 0 13.1 0 0 0.0 0.0 0.0
9.50 638.2 483.5 159.6 149.2 38 0 38.6 7.1 0 9.3 0.0 0.0
6.70 400.9 488.6 215.1 136.7 63.7 8.9 52.1 7.5 0 15.3 0.5 0.0
4.75 388.5 436.8 268.9 176.8 76.4 16.8 64.6 25.3 1.1 15.6 3.2 0.0
3.35 216.4 343 237.4 120.2 74.9 29.1 54.4 29.9 4.6 14.7 6.3 0.5
2.36 150.8 244.7 200.7 98 71 38.6 39.7 30.6 8.4 12.6 5.7 0.8
1.70 89 177.1 174.6 61.4 61.3 33.9 28.8 24.8 7.4 10.2 5.1 1.6
1.18 69.3 137.1 141 55.7 54.2 35.3 23 23.6 8 8.2 5.6 2.3
0.85 47.3 92.6 103.1 40.6 38.8 28.2 16 17.7 7.3 6.3 4.7 2.1
0.60 55.4 85.3 109.5 48.4 43 30.1 17.1 19.5 8.3 7.1 5.5 2.2
0.425 89.5 95.2 159.6 72 64.4 47.7 22.8 28.3 13.3 10.1 7.5 3.6
0.300 132.3 160.2 330.3 115.7 119.1 108.3 40 48.7 31.4 15.9 15.6 7.5
0.212 205.9 272.5 717 194.3 239.1 237.3 63.4 104 76.2 23.1 32.2 19.1
0.150 193.5 291.9 827.2 186.3 261 322.1 59.7 120.7 114.5 22.3 40.2 30.3
0.106 128.8 279.1 530.5 118.3 239.2 370.6 46.7 92.2 149.1 20.5 44.8 44.0
Pan (-0.106) 179.2 273.5 670.6 136.7 284.6 540.1 49.1 129.2 232.8 19.2 52.8 69.7
Sum (g) 5391.7 4733.6 4979.8 1896 1747.7 1847 629.1 709.1 662.4 210.4 229.7 183.7
Breakage Loss (g) 19.9 106.9 138.8 9.9 7.9 35.8 3.9 14.5 13.1 0.9 0.3 2.8
Loss Breakage (%) 0.367 2.06 2.76 0.52 0.45 1.89 0.62 2.00 1.93 0.42 0.13 1.48
Sieving loss (g) 4.5 353.1 -94.5 3.8 2.7 8.3 -8.4 2.5 2.8 0.8 7.1 2.5
Loss Sieving (%) 0.083 6.942 -1.934 0.200 0.154 0.447 -1.353 0.351 0.421 0.379 2.998 1.343
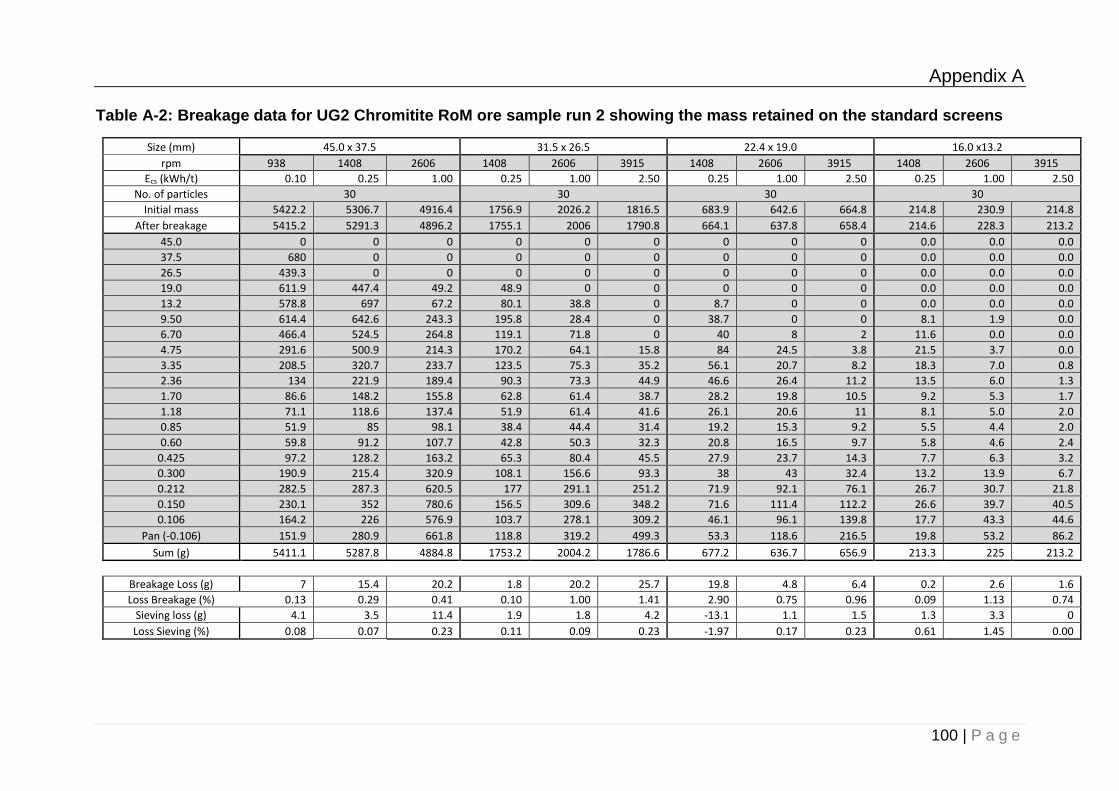
Appendix A
100 | P a g e
Table A-2: Breakage data for UG2 Chromitite RoM ore sample run 2 showing the mass retained on the standard screens
Size (mm) 45.0 x 37.5 31.5 x 26.5 22.4 x 19.0 16.0 x13.2
rpm 938 1408 2606 1408 2606 3915 1408 2606 3915 1408 2606 3915
Ecs (kWh/t) 0.10 0.25 1.00 0.25 1.00 2.50 0.25 1.00 2.50 0.25 1.00 2.50
No. of particles 30 30 30 30
Initial mass 5422.2 5306.7 4916.4 1756.9 2026.2 1816.5 683.9 642.6 664.8 214.8 230.9 214.8
After breakage 5415.2 5291.3 4896.2 1755.1 2006 1790.8 664.1 637.8 658.4 214.6 228.3 213.2
45.0 0 0 0 0 0 0 0 0 0 0.0 0.0 0.0
37.5 680 0 0 0 0 0 0 0 0 0.0 0.0 0.0
26.5 439.3 0 0 0 0 0 0 0 0 0.0 0.0 0.0
19.0 611.9 447.4 49.2 48.9 0 0 0 0 0 0.0 0.0 0.0
13.2 578.8 697 67.2 80.1 38.8 0 8.7 0 0 0.0 0.0 0.0
9.50 614.4 642.6 243.3 195.8 28.4 0 38.7 0 0 8.1 1.9 0.0
6.70 466.4 524.5 264.8 119.1 71.8 0 40 8 2 11.6 0.0 0.0
4.75 291.6 500.9 214.3 170.2 64.1 15.8 84 24.5 3.8 21.5 3.7 0.0
3.35 208.5 320.7 233.7 123.5 75.3 35.2 56.1 20.7 8.2 18.3 7.0 0.8
2.36 134 221.9 189.4 90.3 73.3 44.9 46.6 26.4 11.2 13.5 6.0 1.3
1.70 86.6 148.2 155.8 62.8 61.4 38.7 28.2 19.8 10.5 9.2 5.3 1.7
1.18 71.1 118.6 137.4 51.9 61.4 41.6 26.1 20.6 11 8.1 5.0 2.0
0.85 51.9 85 98.1 38.4 44.4 31.4 19.2 15.3 9.2 5.5 4.4 2.0
0.60 59.8 91.2 107.7 42.8 50.3 32.3 20.8 16.5 9.7 5.8 4.6 2.4
0.425 97.2 128.2 163.2 65.3 80.4 45.5 27.9 23.7 14.3 7.7 6.3 3.2
0.300 190.9 215.4 320.9 108.1 156.6 93.3 38 43 32.4 13.2 13.9 6.7
0.212 282.5 287.3 620.5 177 291.1 251.2 71.9 92.1 76.1 26.7 30.7 21.8
0.150 230.1 352 780.6 156.5 309.6 348.2 71.6 111.4 112.2 26.6 39.7 40.5
0.106 164.2 226 576.9 103.7 278.1 309.2 46.1 96.1 139.8 17.7 43.3 44.6
Pan (-0.106) 151.9 280.9 661.8 118.8 319.2 499.3 53.3 118.6 216.5 19.8 53.2 86.2
Sum (g) 5411.1 5287.8 4884.8 1753.2 2004.2 1786.6 677.2 636.7 656.9 213.3 225 213.2
Breakage Loss (g) 7 15.4 20.2 1.8 20.2 25.7 19.8 4.8 6.4 0.2 2.6 1.6
Loss Breakage (%) 0.13 0.29 0.41 0.10 1.00 1.41 2.90 0.75 0.96 0.09 1.13 0.74
Sieving loss (g) 4.1 3.5 11.4 1.9 1.8 4.2 -13.1 1.1 1.5 1.3 3.3 0
Loss Sieving (%) 0.08 0.07 0.23 0.11 0.09 0.23 -1.97 0.17 0.23 0.61 1.45 0.00
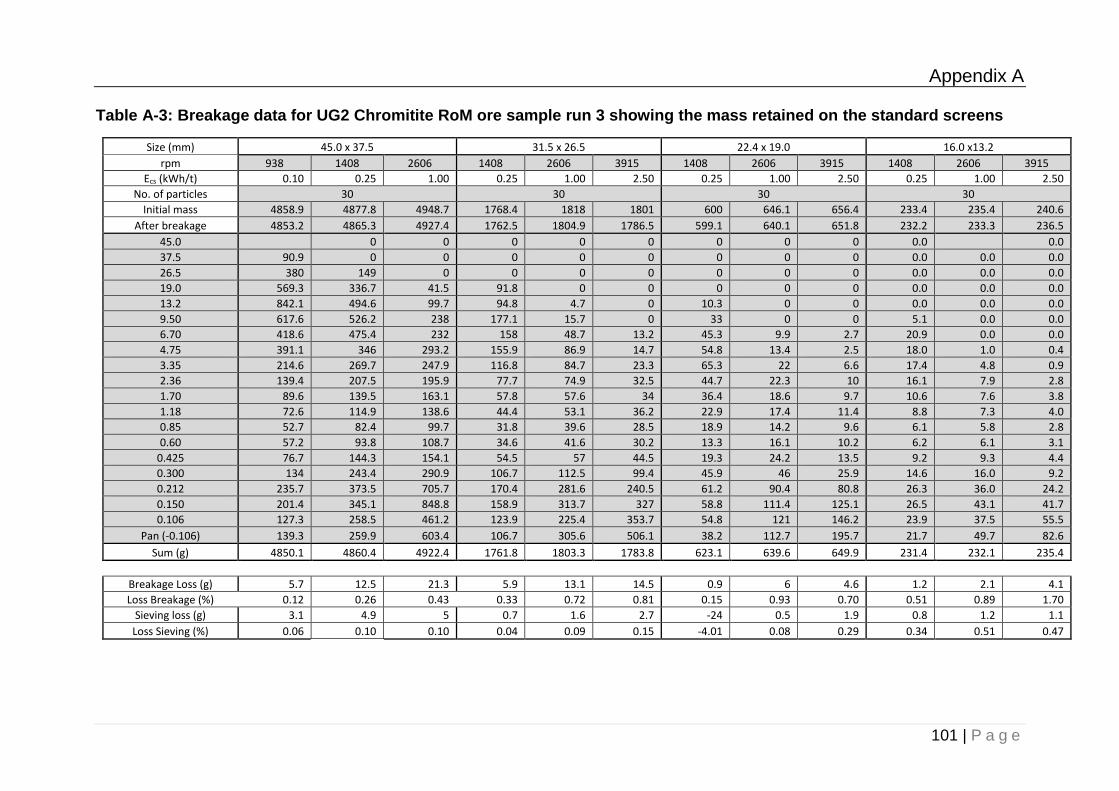
Appendix A
101 | P a g e
Table A-3: Breakage data for UG2 Chromitite RoM ore sample run 3 showing the mass retained on the standard screens
Size (mm) 45.0 x 37.5 31.5 x 26.5 22.4 x 19.0 16.0 x13.2
rpm 938 1408 2606 1408 2606 3915 1408 2606 3915 1408 2606 3915
Ecs (kWh/t) 0.10 0.25 1.00 0.25 1.00 2.50 0.25 1.00 2.50 0.25 1.00 2.50
No. of particles 30 30 30 30
Initial mass 4858.9 4877.8 4948.7 1768.4 1818 1801 600 646.1 656.4 233.4 235.4 240.6
After breakage 4853.2 4865.3 4927.4 1762.5 1804.9 1786.5 599.1 640.1 651.8 232.2 233.3 236.5
45.0 0 0 0 0 0 0 0 0 0.0 0.0
37.5 90.9 0 0 0 0 0 0 0 0 0.0 0.0 0.0
26.5 380 149 0 0 0 0 0 0 0 0.0 0.0 0.0
19.0 569.3 336.7 41.5 91.8 0 0 0 0 0 0.0 0.0 0.0
13.2 842.1 494.6 99.7 94.8 4.7 0 10.3 0 0 0.0 0.0 0.0
9.50 617.6 526.2 238 177.1 15.7 0 33 0 0 5.1 0.0 0.0
6.70 418.6 475.4 232 158 48.7 13.2 45.3 9.9 2.7 20.9 0.0 0.0
4.75 391.1 346 293.2 155.9 86.9 14.7 54.8 13.4 2.5 18.0 1.0 0.4
3.35 214.6 269.7 247.9 116.8 84.7 23.3 65.3 22 6.6 17.4 4.8 0.9
2.36 139.4 207.5 195.9 77.7 74.9 32.5 44.7 22.3 10 16.1 7.9 2.8
1.70 89.6 139.5 163.1 57.8 57.6 34 36.4 18.6 9.7 10.6 7.6 3.8
1.18 72.6 114.9 138.6 44.4 53.1 36.2 22.9 17.4 11.4 8.8 7.3 4.0
0.85 52.7 82.4 99.7 31.8 39.6 28.5 18.9 14.2 9.6 6.1 5.8 2.8
0.60 57.2 93.8 108.7 34.6 41.6 30.2 13.3 16.1 10.2 6.2 6.1 3.1
0.425 76.7 144.3 154.1 54.5 57 44.5 19.3 24.2 13.5 9.2 9.3 4.4
0.300 134 243.4 290.9 106.7 112.5 99.4 45.9 46 25.9 14.6 16.0 9.2
0.212 235.7 373.5 705.7 170.4 281.6 240.5 61.2 90.4 80.8 26.3 36.0 24.2
0.150 201.4 345.1 848.8 158.9 313.7 327 58.8 111.4 125.1 26.5 43.1 41.7
0.106 127.3 258.5 461.2 123.9 225.4 353.7 54.8 121 146.2 23.9 37.5 55.5
Pan (-0.106) 139.3 259.9 603.4 106.7 305.6 506.1 38.2 112.7 195.7 21.7 49.7 82.6
Sum (g) 4850.1 4860.4 4922.4 1761.8 1803.3 1783.8 623.1 639.6 649.9 231.4 232.1 235.4
Breakage Loss (g) 5.7 12.5 21.3 5.9 13.1 14.5 0.9 6 4.6 1.2 2.1 4.1
Loss Breakage (%) 0.12 0.26 0.43 0.33 0.72 0.81 0.15 0.93 0.70 0.51 0.89 1.70
Sieving loss (g) 3.1 4.9 5 0.7 1.6 2.7 -24 0.5 1.9 0.8 1.2 1.1
Loss Sieving (%) 0.06 0.10 0.10 0.04 0.09 0.15 -4.01 0.08 0.29 0.34 0.51 0.47
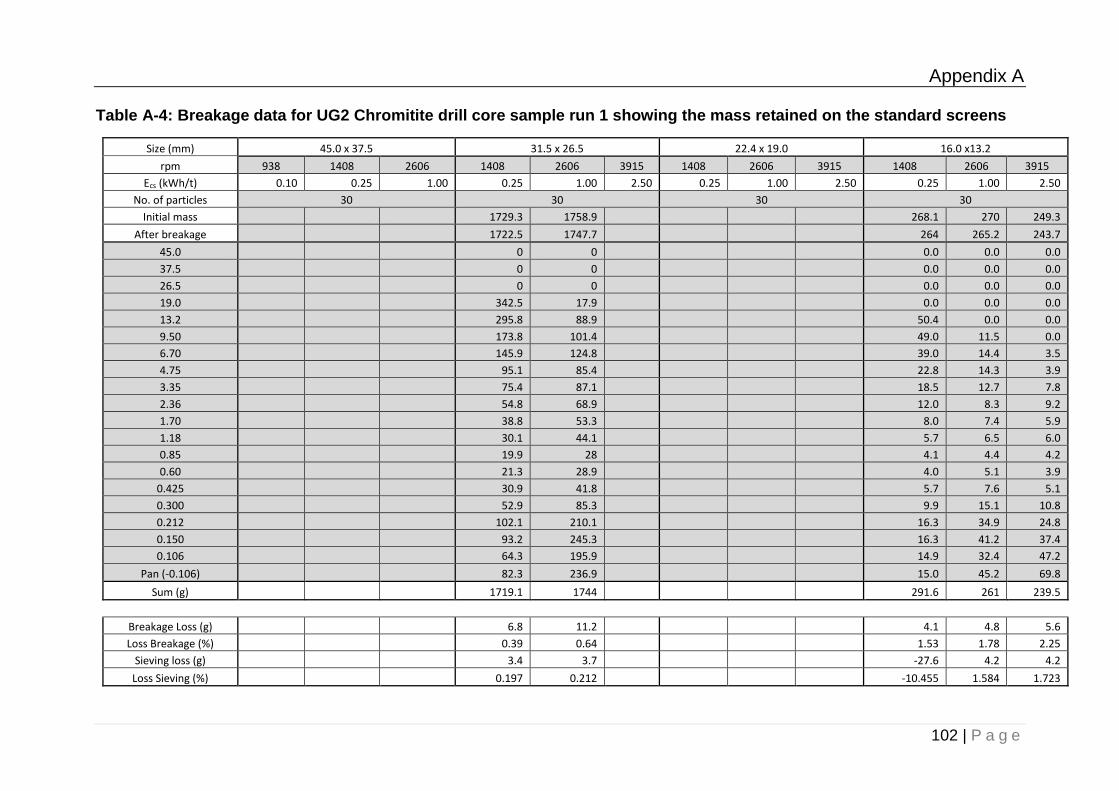
Appendix A
102 | P a g e
Table A-4: Breakage data for UG2 Chromitite drill core sample run 1 showing the mass retained on the standard screens
Size (mm) 45.0 x 37.5 31.5 x 26.5 22.4 x 19.0 16.0 x13.2
rpm 938 1408 2606 1408 2606 3915 1408 2606 3915 1408 2606 3915
Ecs (kWh/t) 0.10 0.25 1.00 0.25 1.00 2.50 0.25 1.00 2.50 0.25 1.00 2.50
No. of particles 30 30 30 30
Initial mass 1729.3 1758.9 268.1 270 249.3
After breakage 1722.5 1747.7 264 265.2 243.7
45.0 0 0 0.0 0.0 0.0
37.5 0 0 0.0 0.0 0.0
26.5 0 0 0.0 0.0 0.0
19.0 342.5 17.9 0.0 0.0 0.0
13.2 295.8 88.9 50.4 0.0 0.0
9.50 173.8 101.4 49.0 11.5 0.0
6.70 145.9 124.8 39.0 14.4 3.5
4.75 95.1 85.4 22.8 14.3 3.9
3.35 75.4 87.1 18.5 12.7 7.8
2.36 54.8 68.9 12.0 8.3 9.2
1.70 38.8 53.3 8.0 7.4 5.9
1.18 30.1 44.1 5.7 6.5 6.0
0.85 19.9 28 4.1 4.4 4.2
0.60 21.3 28.9 4.0 5.1 3.9
0.425 30.9 41.8 5.7 7.6 5.1
0.300 52.9 85.3 9.9 15.1 10.8
0.212 102.1 210.1 16.3 34.9 24.8
0.150 93.2 245.3 16.3 41.2 37.4
0.106 64.3 195.9 14.9 32.4 47.2
Pan (-0.106) 82.3 236.9 15.0 45.2 69.8
Sum (g) 1719.1 1744 291.6 261 239.5
Breakage Loss (g) 6.8 11.2 4.1 4.8 5.6
Loss Breakage (%) 0.39 0.64 1.53 1.78 2.25
Sieving loss (g) 3.4 3.7 -27.6 4.2 4.2
Loss Sieving (%) 0.197 0.212 -10.455 1.584 1.723
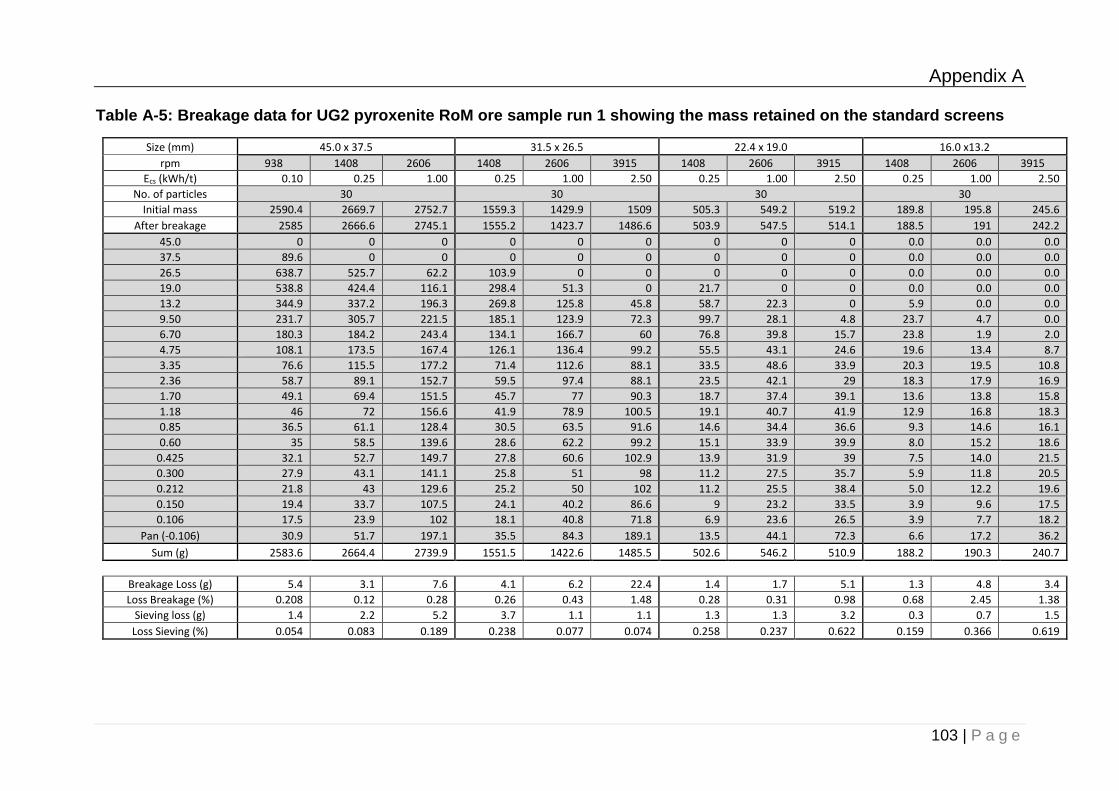
Appendix A
103 | P a g e
Table A-5: Breakage data for UG2 pyroxenite RoM ore sample run 1 showing the mass retained on the standard screens
Size (mm) 45.0 x 37.5 31.5 x 26.5 22.4 x 19.0 16.0 x13.2
rpm 938 1408 2606 1408 2606 3915 1408 2606 3915 1408 2606 3915
Ecs (kWh/t) 0.10 0.25 1.00 0.25 1.00 2.50 0.25 1.00 2.50 0.25 1.00 2.50
No. of particles 30 30 30 30
Initial mass 2590.4 2669.7 2752.7 1559.3 1429.9 1509 505.3 549.2 519.2 189.8 195.8 245.6
After breakage 2585 2666.6 2745.1 1555.2 1423.7 1486.6 503.9 547.5 514.1 188.5 191 242.2
45.0 0 0 0 0 0 0 0 0 0 0.0 0.0 0.0
37.5 89.6 0 0 0 0 0 0 0 0 0.0 0.0 0.0
26.5 638.7 525.7 62.2 103.9 0 0 0 0 0 0.0 0.0 0.0
19.0 538.8 424.4 116.1 298.4 51.3 0 21.7 0 0 0.0 0.0 0.0
13.2 344.9 337.2 196.3 269.8 125.8 45.8 58.7 22.3 0 5.9 0.0 0.0
9.50 231.7 305.7 221.5 185.1 123.9 72.3 99.7 28.1 4.8 23.7 4.7 0.0
6.70 180.3 184.2 243.4 134.1 166.7 60 76.8 39.8 15.7 23.8 1.9 2.0
4.75 108.1 173.5 167.4 126.1 136.4 99.2 55.5 43.1 24.6 19.6 13.4 8.7
3.35 76.6 115.5 177.2 71.4 112.6 88.1 33.5 48.6 33.9 20.3 19.5 10.8
2.36 58.7 89.1 152.7 59.5 97.4 88.1 23.5 42.1 29 18.3 17.9 16.9
1.70 49.1 69.4 151.5 45.7 77 90.3 18.7 37.4 39.1 13.6 13.8 15.8
1.18 46 72 156.6 41.9 78.9 100.5 19.1 40.7 41.9 12.9 16.8 18.3
0.85 36.5 61.1 128.4 30.5 63.5 91.6 14.6 34.4 36.6 9.3 14.6 16.1
0.60 35 58.5 139.6 28.6 62.2 99.2 15.1 33.9 39.9 8.0 15.2 18.6
0.425 32.1 52.7 149.7 27.8 60.6 102.9 13.9 31.9 39 7.5 14.0 21.5
0.300 27.9 43.1 141.1 25.8 51 98 11.2 27.5 35.7 5.9 11.8 20.5
0.212 21.8 43 129.6 25.2 50 102 11.2 25.5 38.4 5.0 12.2 19.6
0.150 19.4 33.7 107.5 24.1 40.2 86.6 9 23.2 33.5 3.9 9.6 17.5
0.106 17.5 23.9 102 18.1 40.8 71.8 6.9 23.6 26.5 3.9 7.7 18.2
Pan (-0.106) 30.9 51.7 197.1 35.5 84.3 189.1 13.5 44.1 72.3 6.6 17.2 36.2
Sum (g) 2583.6 2664.4 2739.9 1551.5 1422.6 1485.5 502.6 546.2 510.9 188.2 190.3 240.7
Breakage Loss (g) 5.4 3.1 7.6 4.1 6.2 22.4 1.4 1.7 5.1 1.3 4.8 3.4
Loss Breakage (%) 0.208 0.12 0.28 0.26 0.43 1.48 0.28 0.31 0.98 0.68 2.45 1.38
Sieving loss (g) 1.4 2.2 5.2 3.7 1.1 1.1 1.3 1.3 3.2 0.3 0.7 1.5
Loss Sieving (%) 0.054 0.083 0.189 0.238 0.077 0.074 0.258 0.237 0.622 0.159 0.366 0.619
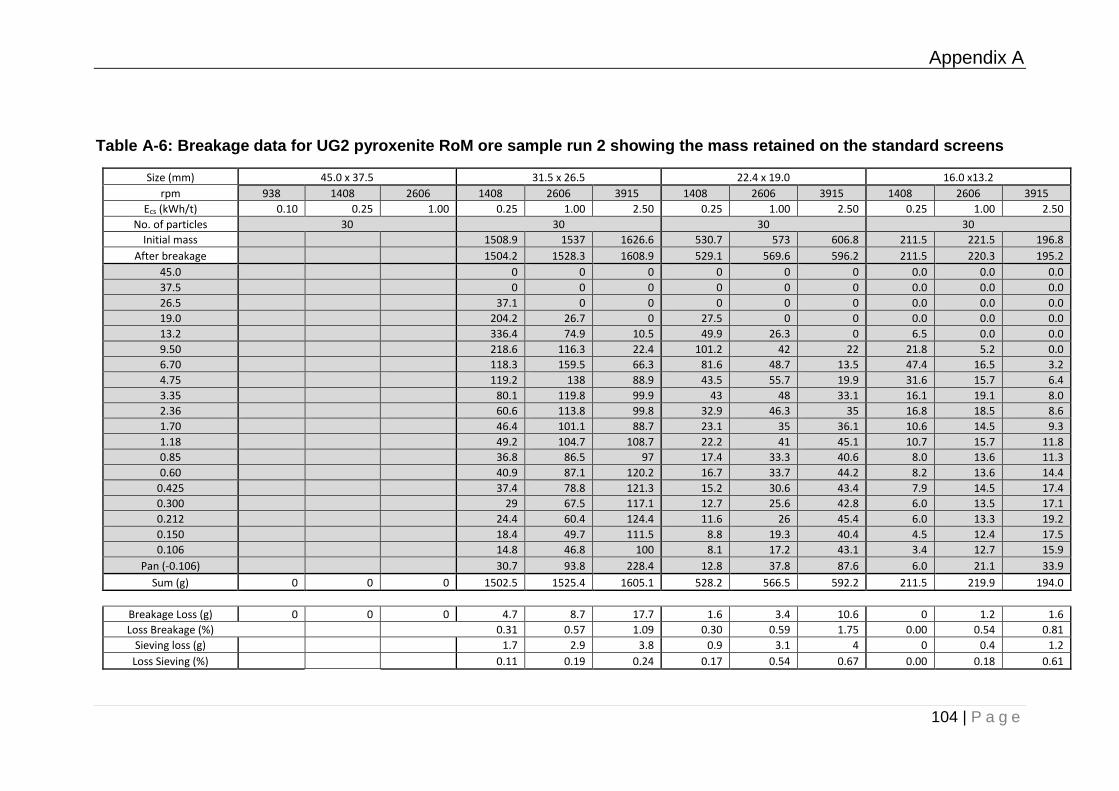
Appendix A
104 | P a g e
Table A-6: Breakage data for UG2 pyroxenite RoM ore sample run 2 showing the mass retained on the standard screens
Size (mm) 45.0 x 37.5 31.5 x 26.5 22.4 x 19.0 16.0 x13.2
rpm 938 1408 2606 1408 2606 3915 1408 2606 3915 1408 2606 3915
Ecs (kWh/t) 0.10 0.25 1.00 0.25 1.00 2.50 0.25 1.00 2.50 0.25 1.00 2.50
No. of particles 30 30 30 30
Initial mass 1508.9 1537 1626.6 530.7 573 606.8 211.5 221.5 196.8
After breakage 1504.2 1528.3 1608.9 529.1 569.6 596.2 211.5 220.3 195.2
45.0 0 0 0 0 0 0 0.0 0.0 0.0
37.5 0 0 0 0 0 0 0.0 0.0 0.0
26.5 37.1 0 0 0 0 0 0.0 0.0 0.0
19.0 204.2 26.7 0 27.5 0 0 0.0 0.0 0.0
13.2 336.4 74.9 10.5 49.9 26.3 0 6.5 0.0 0.0
9.50 218.6 116.3 22.4 101.2 42 22 21.8 5.2 0.0
6.70 118.3 159.5 66.3 81.6 48.7 13.5 47.4 16.5 3.2
4.75 119.2 138 88.9 43.5 55.7 19.9 31.6 15.7 6.4
3.35 80.1 119.8 99.9 43 48 33.1 16.1 19.1 8.0
2.36 60.6 113.8 99.8 32.9 46.3 35 16.8 18.5 8.6
1.70 46.4 101.1 88.7 23.1 35 36.1 10.6 14.5 9.3
1.18 49.2 104.7 108.7 22.2 41 45.1 10.7 15.7 11.8
0.85 36.8 86.5 97 17.4 33.3 40.6 8.0 13.6 11.3
0.60 40.9 87.1 120.2 16.7 33.7 44.2 8.2 13.6 14.4
0.425 37.4 78.8 121.3 15.2 30.6 43.4 7.9 14.5 17.4
0.300 29 67.5 117.1 12.7 25.6 42.8 6.0 13.5 17.1
0.212 24.4 60.4 124.4 11.6 26 45.4 6.0 13.3 19.2
0.150 18.4 49.7 111.5 8.8 19.3 40.4 4.5 12.4 17.5
0.106 14.8 46.8 100 8.1 17.2 43.1 3.4 12.7 15.9
Pan (-0.106) 30.7 93.8 228.4 12.8 37.8 87.6 6.0 21.1 33.9
Sum (g) 0 0 0 1502.5 1525.4 1605.1 528.2 566.5 592.2 211.5 219.9 194.0
Breakage Loss (g) 0 0 0 4.7 8.7 17.7 1.6 3.4 10.6 0 1.2 1.6
Loss Breakage (%) 0.31 0.57 1.09 0.30 0.59 1.75 0.00 0.54 0.81
Sieving loss (g) 1.7 2.9 3.8 0.9 3.1 4 0 0.4 1.2
Loss Sieving (%) 0.11 0.19 0.24 0.17 0.54 0.67 0.00 0.18 0.61
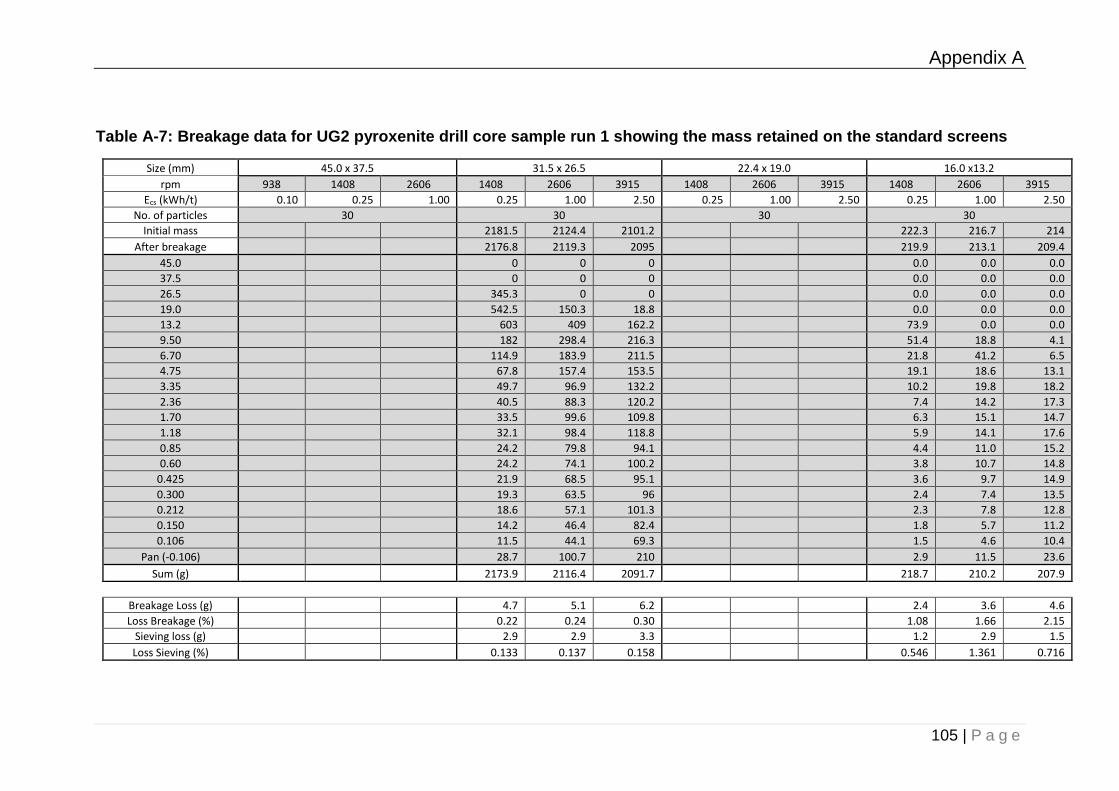
Appendix A
105 | P a g e
Table A-7: Breakage data for UG2 pyroxenite drill core sample run 1 showing the mass retained on the standard screens
Size (mm) 45.0 x 37.5 31.5 x 26.5 22.4 x 19.0 16.0 x13.2
rpm 938 1408 2606 1408 2606 3915 1408 2606 3915 1408 2606 3915
Ecs (kWh/t) 0.10 0.25 1.00 0.25 1.00 2.50 0.25 1.00 2.50 0.25 1.00 2.50
No. of particles 30 30 30 30
Initial mass 2181.5 2124.4 2101.2 222.3 216.7 214
After breakage 2176.8 2119.3 2095 219.9 213.1 209.4
45.0 0 0 0 0.0 0.0 0.0
37.5 0 0 0 0.0 0.0 0.0
26.5 345.3 0 0 0.0 0.0 0.0
19.0 542.5 150.3 18.8 0.0 0.0 0.0
13.2 603 409 162.2 73.9 0.0 0.0
9.50 182 298.4 216.3 51.4 18.8 4.1
6.70 114.9 183.9 211.5 21.8 41.2 6.5
4.75 67.8 157.4 153.5 19.1 18.6 13.1
3.35 49.7 96.9 132.2 10.2 19.8 18.2
2.36 40.5 88.3 120.2 7.4 14.2 17.3
1.70 33.5 99.6 109.8 6.3 15.1 14.7
1.18 32.1 98.4 118.8 5.9 14.1 17.6
0.85 24.2 79.8 94.1 4.4 11.0 15.2
0.60 24.2 74.1 100.2 3.8 10.7 14.8
0.425 21.9 68.5 95.1 3.6 9.7 14.9
0.300 19.3 63.5 96 2.4 7.4 13.5
0.212 18.6 57.1 101.3 2.3 7.8 12.8
0.150 14.2 46.4 82.4 1.8 5.7 11.2
0.106 11.5 44.1 69.3 1.5 4.6 10.4
Pan (-0.106) 28.7 100.7 210 2.9 11.5 23.6
Sum (g) 2173.9 2116.4 2091.7 218.7 210.2 207.9
Breakage Loss (g) 4.7 5.1 6.2 2.4 3.6 4.6
Loss Breakage (%) 0.22 0.24 0.30 1.08 1.66 2.15
Sieving loss (g) 2.9 2.9 3.3 1.2 2.9 1.5
Loss Sieving (%) 0.133 0.137 0.158 0.546 1.361 0.716
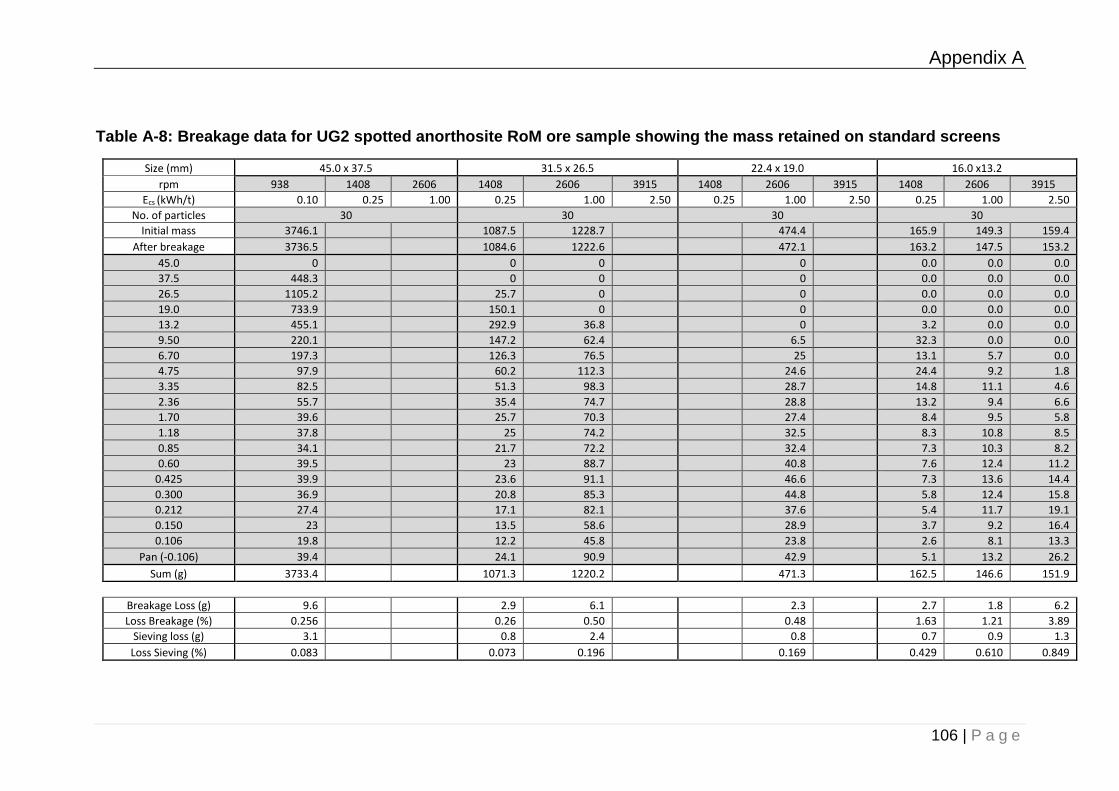
Appendix A
106 | P a g e
Table A-8: Breakage data for UG2 spotted anorthosite RoM ore sample showing the mass retained on standard screens
Size (mm) 45.0 x 37.5 31.5 x 26.5 22.4 x 19.0 16.0 x13.2
rpm 938 1408 2606 1408 2606 3915 1408 2606 3915 1408 2606 3915
Ecs (kWh/t) 0.10 0.25 1.00 0.25 1.00 2.50 0.25 1.00 2.50 0.25 1.00 2.50
No. of particles 30 30 30 30
Initial mass 3746.1 1087.5 1228.7 474.4 165.9 149.3 159.4
After breakage 3736.5 1084.6 1222.6 472.1 163.2 147.5 153.2
45.0 0 0 0 0 0.0 0.0 0.0
37.5 448.3 0 0 0 0.0 0.0 0.0
26.5 1105.2 25.7 0 0 0.0 0.0 0.0
19.0 733.9 150.1 0 0 0.0 0.0 0.0
13.2 455.1 292.9 36.8 0 3.2 0.0 0.0
9.50 220.1 147.2 62.4 6.5 32.3 0.0 0.0
6.70 197.3 126.3 76.5 25 13.1 5.7 0.0
4.75 97.9 60.2 112.3 24.6 24.4 9.2 1.8
3.35 82.5 51.3 98.3 28.7 14.8 11.1 4.6
2.36 55.7 35.4 74.7 28.8 13.2 9.4 6.6
1.70 39.6 25.7 70.3 27.4 8.4 9.5 5.8
1.18 37.8 25 74.2 32.5 8.3 10.8 8.5
0.85 34.1 21.7 72.2 32.4 7.3 10.3 8.2
0.60 39.5 23 88.7 40.8 7.6 12.4 11.2
0.425 39.9 23.6 91.1 46.6 7.3 13.6 14.4
0.300 36.9 20.8 85.3 44.8 5.8 12.4 15.8
0.212 27.4 17.1 82.1 37.6 5.4 11.7 19.1
0.150 23 13.5 58.6 28.9 3.7 9.2 16.4
0.106 19.8 12.2 45.8 23.8 2.6 8.1 13.3
Pan (-0.106) 39.4 24.1 90.9 42.9 5.1 13.2 26.2
Sum (g) 3733.4 1071.3 1220.2 471.3 162.5 146.6 151.9
Breakage Loss (g) 9.6 2.9 6.1 2.3 2.7 1.8 6.2
Loss Breakage (%) 0.256 0.26 0.50 0.48 1.63 1.21 3.89
Sieving loss (g) 3.1 0.8 2.4 0.8 0.7 0.9 1.3
Loss Sieving (%) 0.083 0.073 0.196 0.169 0.429 0.610 0.849

Appendix A
107 | P a g e
Table A-9: Breakage data for UG2 spotted anorthosite drill core sample showing the mass retained on standard screens
Size (mm) 45.0 x 37.5 31.5 x 26.5 22.4 x 19.0 16.0 x13.2
rpm 938 1408 2606 1408 2606 3915 1408 2606 3915 1408 2606 3915
Ecs (kWh/t) 0.10 0.25 1.00 0.25 1.00 2.50 0.25 1.00 2.50 0.25 1.00 2.50
No. of particles 30 30 30 30
Initial mass 1733.6 1723 1727.3 194.5 188.8 194
After breakage 1729.9 1718.4 1720.2 191.7 186.1 187.6
45.0 0 0 0 0.0 0.0 0.0
37.5 0 0 0 0.0 0.0 0.0
26.5 129.8 0 0 0.0 0.0 0.0
19.0 226 0 0 0.0 0.0 0.0
13.2 376.1 100 0 19.2 0.0 0.0
9.50 269.8 146.9 17.2 61.0 0.0 0.0
6.70 176.6 155.9 95.8 34.9 11.2 0.0
4.75 86.7 164.1 75.5 23.2 16.3 1.2
3.35 65.8 106.5 91.7 8.8 21.4 3.7
2.36 43.9 87.2 78.3 5.6 12.8 5.6
1.70 31.5 64.6 65 4.0 9.3 6.6
1.18 33.6 73 73.9 3.8 9.7 7.0
0.85 32.9 84.1 83.8 3.7 10.4 10.1
0.60 42.8 105.1 128.9 4.0 14.2 15.2
0.425 42.6 120.4 155.8 4.2 16.0 20.6
0.300 39.8 114.3 160.6 4.1 13.5 21.9
0.212 37.3 105.8 170 3.6 14.1 21.8
0.150 26.5 80.9 145.7 2.6 10.2 17.7
0.106 20.3 71.2 145 2.2 7.6 16.8
Pan (-0.106) 46 135.9 230.5 4.8 17.0 35.8
Sum (g) 1728 1715.9 1717.7 189.7 183.7 184
Breakage Loss (g) 3.7 4.6 7.1 2.8 2.7 6.4
Loss Breakage (%) 0.21 0.27 0.41 1.44 1.43 3.30
Sieving loss (g) 1.9 2.5 2.5 2 2.4 3.6
Loss Sieving (%) 0.110 0.145 0.145 1.043 1.290 1.919
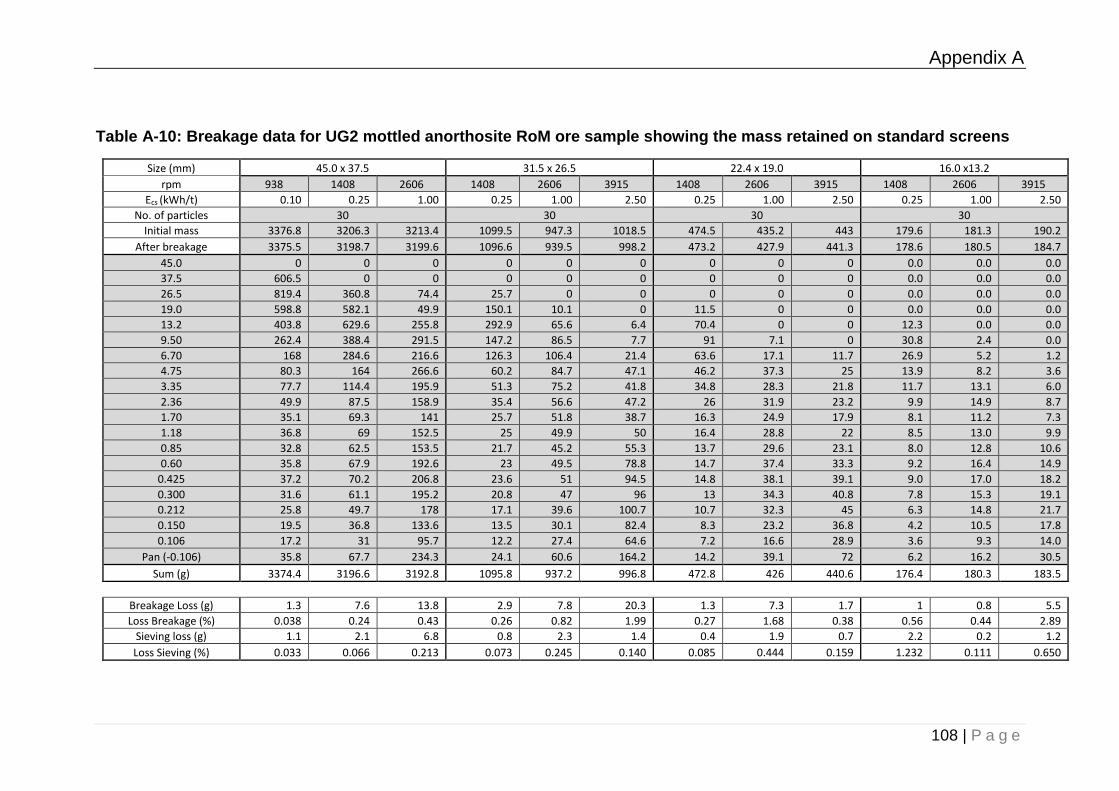
Appendix A
108 | P a g e
Table A-10: Breakage data for UG2 mottled anorthosite RoM ore sample showing the mass retained on standard screens
Size (mm) 45.0 x 37.5 31.5 x 26.5 22.4 x 19.0 16.0 x13.2
rpm 938 1408 2606 1408 2606 3915 1408 2606 3915 1408 2606 3915
Ecs (kWh/t) 0.10 0.25 1.00 0.25 1.00 2.50 0.25 1.00 2.50 0.25 1.00 2.50
No. of particles 30 30 30 30
Initial mass 3376.8 3206.3 3213.4 1099.5 947.3 1018.5 474.5 435.2 443 179.6 181.3 190.2
After breakage 3375.5 3198.7 3199.6 1096.6 939.5 998.2 473.2 427.9 441.3 178.6 180.5 184.7
45.0 0 0 0 0 0 0 0 0 0 0.0 0.0 0.0
37.5 606.5 0 0 0 0 0 0 0 0 0.0 0.0 0.0
26.5 819.4 360.8 74.4 25.7 0 0 0 0 0 0.0 0.0 0.0
19.0 598.8 582.1 49.9 150.1 10.1 0 11.5 0 0 0.0 0.0 0.0
13.2 403.8 629.6 255.8 292.9 65.6 6.4 70.4 0 0 12.3 0.0 0.0
9.50 262.4 388.4 291.5 147.2 86.5 7.7 91 7.1 0 30.8 2.4 0.0
6.70 168 284.6 216.6 126.3 106.4 21.4 63.6 17.1 11.7 26.9 5.2 1.2
4.75 80.3 164 266.6 60.2 84.7 47.1 46.2 37.3 25 13.9 8.2 3.6
3.35 77.7 114.4 195.9 51.3 75.2 41.8 34.8 28.3 21.8 11.7 13.1 6.0
2.36 49.9 87.5 158.9 35.4 56.6 47.2 26 31.9 23.2 9.9 14.9 8.7
1.70 35.1 69.3 141 25.7 51.8 38.7 16.3 24.9 17.9 8.1 11.2 7.3
1.18 36.8 69 152.5 25 49.9 50 16.4 28.8 22 8.5 13.0 9.9
0.85 32.8 62.5 153.5 21.7 45.2 55.3 13.7 29.6 23.1 8.0 12.8 10.6
0.60 35.8 67.9 192.6 23 49.5 78.8 14.7 37.4 33.3 9.2 16.4 14.9
0.425 37.2 70.2 206.8 23.6 51 94.5 14.8 38.1 39.1 9.0 17.0 18.2
0.300 31.6 61.1 195.2 20.8 47 96 13 34.3 40.8 7.8 15.3 19.1
0.212 25.8 49.7 178 17.1 39.6 100.7 10.7 32.3 45 6.3 14.8 21.7
0.150 19.5 36.8 133.6 13.5 30.1 82.4 8.3 23.2 36.8 4.2 10.5 17.8
0.106 17.2 31 95.7 12.2 27.4 64.6 7.2 16.6 28.9 3.6 9.3 14.0
Pan (-0.106) 35.8 67.7 234.3 24.1 60.6 164.2 14.2 39.1 72 6.2 16.2 30.5
Sum (g) 3374.4 3196.6 3192.8 1095.8 937.2 996.8 472.8 426 440.6 176.4 180.3 183.5
Breakage Loss (g) 1.3 7.6 13.8 2.9 7.8 20.3 1.3 7.3 1.7 1 0.8 5.5
Loss Breakage (%) 0.038 0.24 0.43 0.26 0.82 1.99 0.27 1.68 0.38 0.56 0.44 2.89
Sieving loss (g) 1.1 2.1 6.8 0.8 2.3 1.4 0.4 1.9 0.7 2.2 0.2 1.2
Loss Sieving (%) 0.033 0.066 0.213 0.073 0.245 0.140 0.085 0.444 0.159 1.232 0.111 0.650
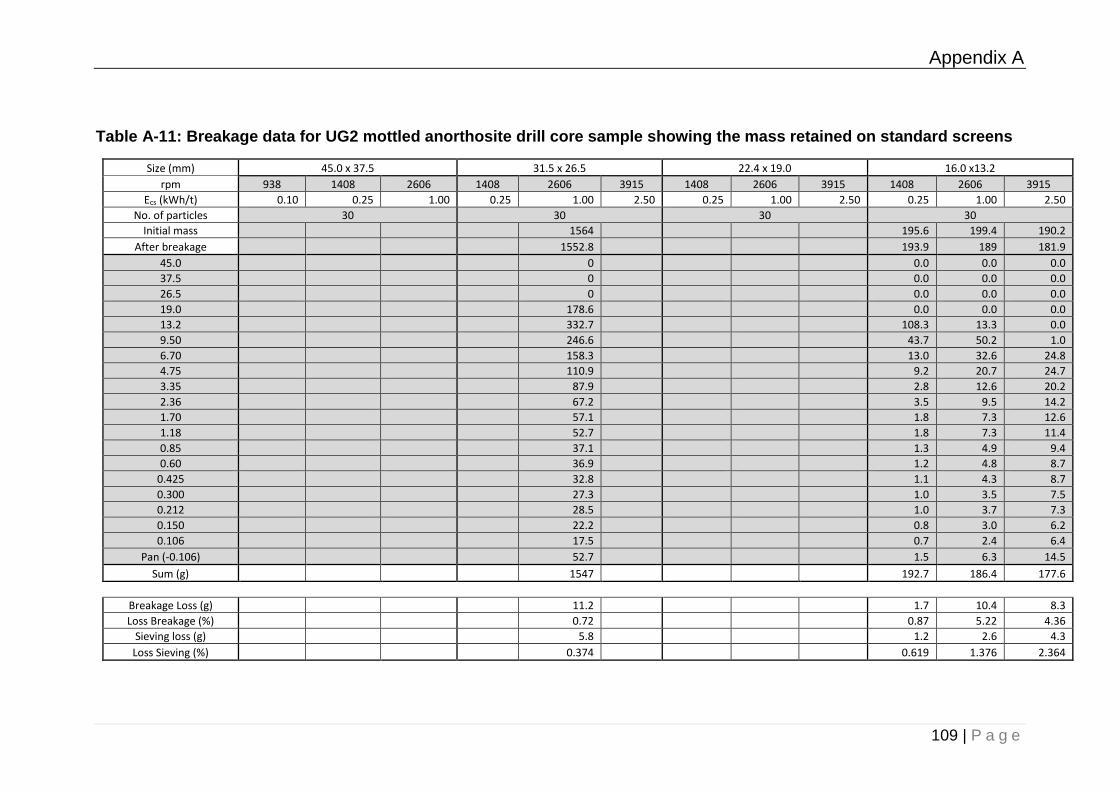
Appendix A
109 | P a g e
Table A-11: Breakage data for UG2 mottled anorthosite drill core sample showing the mass retained on standard screens
Size (mm) 45.0 x 37.5 31.5 x 26.5 22.4 x 19.0 16.0 x13.2
rpm 938 1408 2606 1408 2606 3915 1408 2606 3915 1408 2606 3915
Ecs (kWh/t) 0.10 0.25 1.00 0.25 1.00 2.50 0.25 1.00 2.50 0.25 1.00 2.50
No. of particles 30 30 30 30
Initial mass 1564 195.6 199.4 190.2
After breakage 1552.8 193.9 189 181.9
45.0 0 0.0 0.0 0.0
37.5 0 0.0 0.0 0.0
26.5 0 0.0 0.0 0.0
19.0 178.6 0.0 0.0 0.0
13.2 332.7 108.3 13.3 0.0
9.50 246.6 43.7 50.2 1.0
6.70 158.3 13.0 32.6 24.8
4.75 110.9 9.2 20.7 24.7
3.35 87.9 2.8 12.6 20.2
2.36 67.2 3.5 9.5 14.2
1.70 57.1 1.8 7.3 12.6
1.18 52.7 1.8 7.3 11.4
0.85 37.1 1.3 4.9 9.4
0.60 36.9 1.2 4.8 8.7
0.425 32.8 1.1 4.3 8.7
0.300 27.3 1.0 3.5 7.5
0.212 28.5 1.0 3.7 7.3
0.150 22.2 0.8 3.0 6.2
0.106 17.5 0.7 2.4 6.4
Pan (-0.106) 52.7 1.5 6.3 14.5
Sum (g) 1547 192.7 186.4 177.6
Breakage Loss (g) 11.2 1.7 10.4 8.3
Loss Breakage (%) 0.72 0.87 5.22 4.36
Sieving loss (g) 5.8 1.2 2.6 4.3
Loss Sieving (%) 0.374 0.619 1.376 2.364
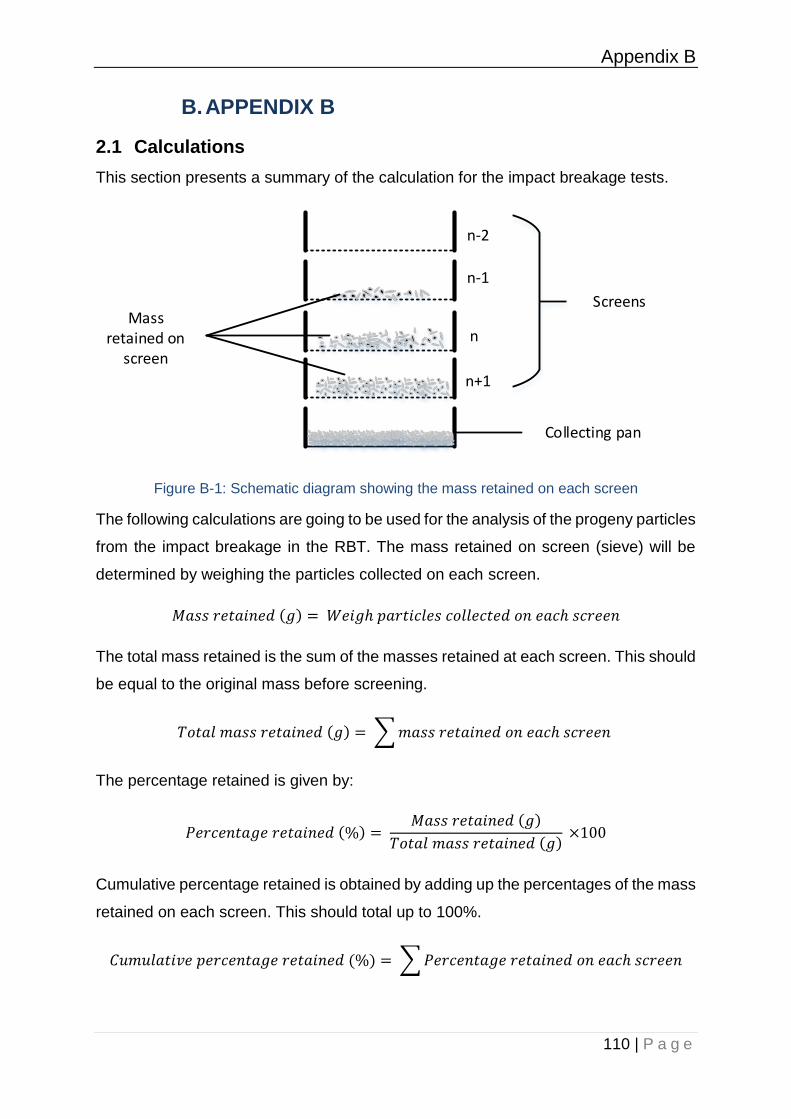
Appendix B
110 | P a g e
B. APPENDIX B
2.1 Calculations
This section presents a summary of the calculation for the impact breakage tests.
Screens
n
n-1
n-2
n+1
Mass retained on
screen
Collecting pan
Figure B-1: Schematic diagram showing the mass retained on each screen
The following calculations are going to be used for the analysis of the progeny particles
from the impact breakage in the RBT. The mass retained on screen (sieve) will be
determined by weighing the particles collected on each screen.
𝑀𝑎𝑠𝑠 𝑟𝑒𝑡𝑎𝑖𝑛𝑒𝑑 (𝑔) = 𝑊𝑒𝑖𝑔ℎ 𝑝𝑎𝑟𝑡𝑖𝑐𝑙𝑒𝑠 𝑐𝑜𝑙𝑙𝑒𝑐𝑡𝑒𝑑 𝑜𝑛 𝑒𝑎𝑐ℎ 𝑠𝑐𝑟𝑒𝑒𝑛
The total mass retained is the sum of the masses retained at each screen. This should
be equal to the original mass before screening.
𝑇𝑜𝑡𝑎𝑙 𝑚𝑎𝑠𝑠 𝑟𝑒𝑡𝑎𝑖𝑛𝑒𝑑 (𝑔) = ∑ 𝑚𝑎𝑠𝑠 𝑟𝑒𝑡𝑎𝑖𝑛𝑒𝑑 𝑜𝑛 𝑒𝑎𝑐ℎ 𝑠𝑐𝑟𝑒𝑒𝑛
The percentage retained is given by:
𝑃𝑒𝑟𝑐𝑒𝑛𝑡𝑎𝑔𝑒 𝑟𝑒𝑡𝑎𝑖𝑛𝑒𝑑 (%) = 𝑀𝑎𝑠𝑠 𝑟𝑒𝑡𝑎𝑖𝑛𝑒𝑑 (𝑔)
𝑇𝑜𝑡𝑎𝑙 𝑚𝑎𝑠𝑠 𝑟𝑒𝑡𝑎𝑖𝑛𝑒𝑑 (𝑔) ×100
Cumulative percentage retained is obtained by adding up the percentages of the mass
retained on each screen. This should total up to 100%.
𝐶𝑢𝑚𝑢𝑙𝑎𝑡𝑖𝑣𝑒 𝑝𝑒𝑟𝑐𝑒𝑛𝑡𝑎𝑔𝑒 𝑟𝑒𝑡𝑎𝑖𝑛𝑒𝑑 (%) = ∑ 𝑃𝑒𝑟𝑐𝑒𝑛𝑡𝑎𝑔𝑒 𝑟𝑒𝑡𝑎𝑖𝑛𝑒𝑑 𝑜𝑛 𝑒𝑎𝑐ℎ 𝑠𝑐𝑟𝑒𝑒𝑛
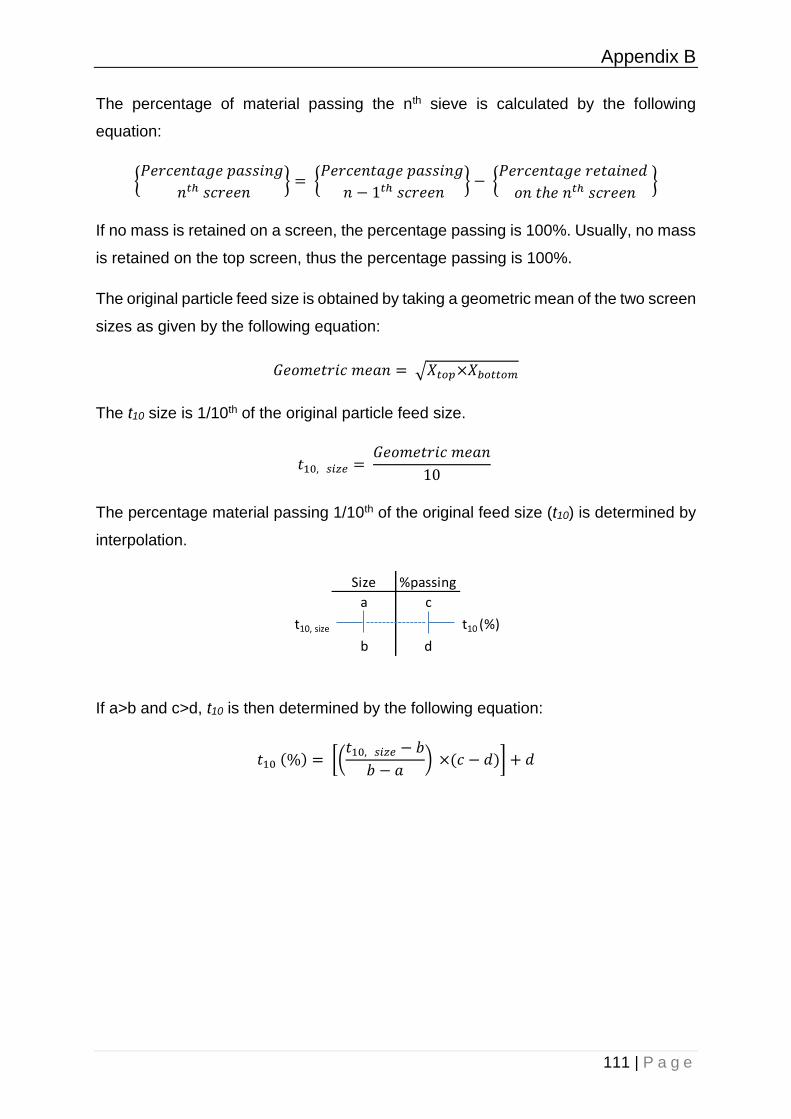
Appendix B
111 | P a g e
The percentage of material passing the nth sieve is calculated by the following
equation:
{𝑃𝑒𝑟𝑐𝑒𝑛𝑡𝑎𝑔𝑒 𝑝𝑎𝑠𝑠𝑖𝑛𝑔
𝑛𝑡ℎ 𝑠𝑐𝑟𝑒𝑒𝑛} = {
𝑃𝑒𝑟𝑐𝑒𝑛𝑡𝑎𝑔𝑒 𝑝𝑎𝑠𝑠𝑖𝑛𝑔
𝑛 − 1𝑡ℎ 𝑠𝑐𝑟𝑒𝑒𝑛} − {
𝑃𝑒𝑟𝑐𝑒𝑛𝑡𝑎𝑔𝑒 𝑟𝑒𝑡𝑎𝑖𝑛𝑒𝑑
𝑜𝑛 𝑡ℎ𝑒 𝑛𝑡ℎ 𝑠𝑐𝑟𝑒𝑒𝑛}
If no mass is retained on a screen, the percentage passing is 100%. Usually, no mass
is retained on the top screen, thus the percentage passing is 100%.
The original particle feed size is obtained by taking a geometric mean of the two screen
sizes as given by the following equation:
𝐺𝑒𝑜𝑚𝑒𝑡𝑟𝑖𝑐 𝑚𝑒𝑎𝑛 = √𝑋𝑡𝑜𝑝×𝑋𝑏𝑜𝑡𝑡𝑜𝑚
The t10 size is 1/10th of the original particle feed size.
𝑡10, 𝑠𝑖𝑧𝑒 = 𝐺𝑒𝑜𝑚𝑒𝑡𝑟𝑖𝑐 𝑚𝑒𝑎𝑛
10
The percentage material passing 1/10th of the original feed size (t10) is determined by
interpolation.
If a>b and c>d, t10 is then determined by the following equation:
𝑡10 (%) = [(𝑡10, 𝑠𝑖𝑧𝑒 − 𝑏
𝑏 − 𝑎) ×(𝑐 − 𝑑)] + 𝑑
Size %passing
a c
t10, size t10 (%)
b d
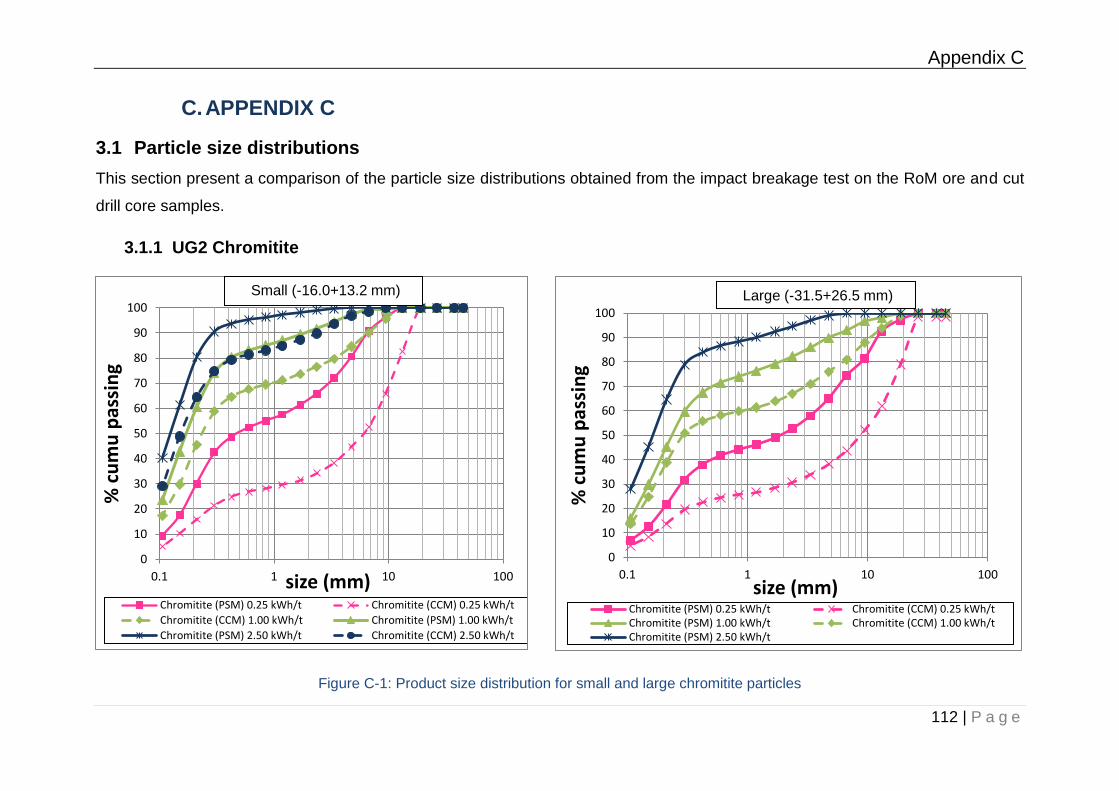
Appendix C
112 | P a g e
C. APPENDIX C
3.1 Particle size distributions
This section present a comparison of the particle size distributions obtained from the impact breakage test on the RoM ore and cut
drill core samples.
3.1.1 UG2 Chromitite
Figure C-1: Product size distribution for small and large chromitite particles
0
10
20
30
40
50
60
70
80
90
100
0.1 1 10 100
% c
um
u p
assi
ng
size (mm)Chromitite (PSM) 0.25 kWh/t Chromitite (CCM) 0.25 kWh/t
Chromitite (CCM) 1.00 kWh/t Chromitite (PSM) 1.00 kWh/t
Chromitite (PSM) 2.50 kWh/t Chromitite (CCM) 2.50 kWh/t
Small (-16.0+13.2 mm)
0
10
20
30
40
50
60
70
80
90
100
0.1 1 10 100%
cu
mu
pas
sin
gsize (mm)
Chromitite (PSM) 0.25 kWh/t Chromitite (CCM) 0.25 kWh/tChromitite (PSM) 1.00 kWh/t Chromitite (CCM) 1.00 kWh/tChromitite (PSM) 2.50 kWh/t
Large (-31.5+26.5 mm)
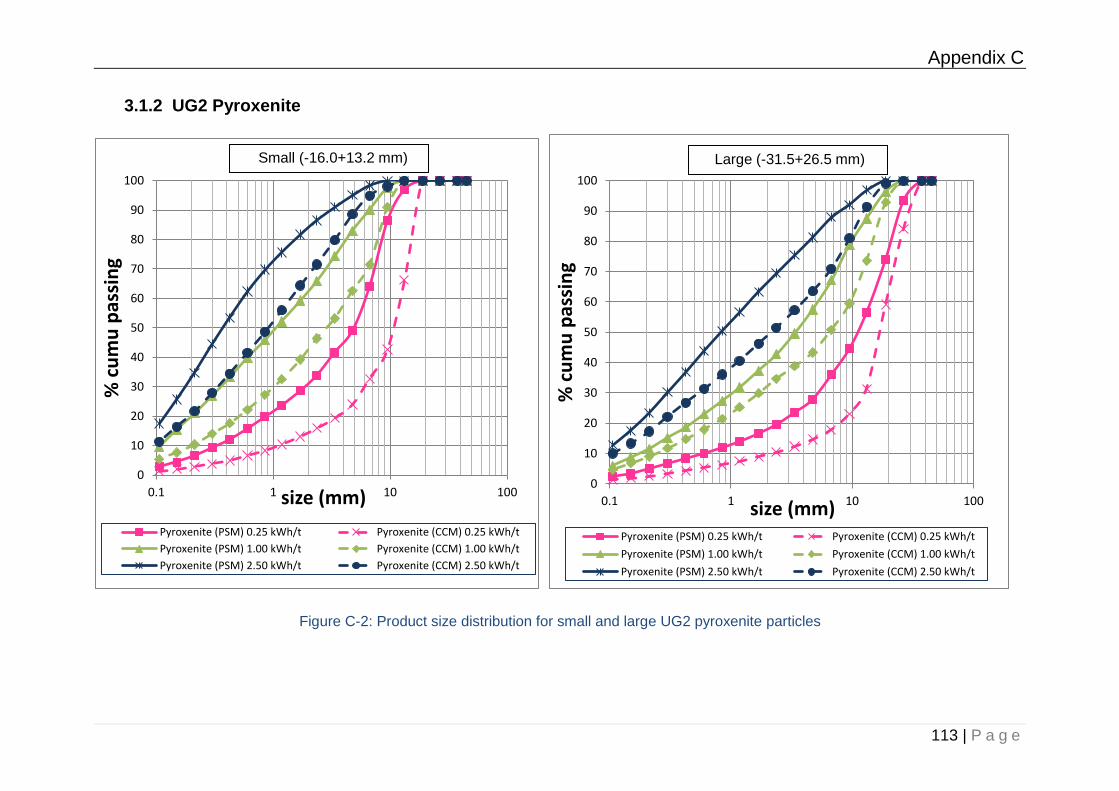
Appendix C
113 | P a g e
3.1.2 UG2 Pyroxenite
Figure C-2: Product size distribution for small and large UG2 pyroxenite particles
0
10
20
30
40
50
60
70
80
90
100
0.1 1 10 100
% c
um
u p
assi
ng
size (mm)
Pyroxenite (PSM) 0.25 kWh/t Pyroxenite (CCM) 0.25 kWh/t
Pyroxenite (PSM) 1.00 kWh/t Pyroxenite (CCM) 1.00 kWh/t
Pyroxenite (PSM) 2.50 kWh/t Pyroxenite (CCM) 2.50 kWh/t
Small (-16.0+13.2 mm)
0
10
20
30
40
50
60
70
80
90
100
0.1 1 10 100
% c
um
u p
assi
ng
size (mm)Pyroxenite (PSM) 0.25 kWh/t Pyroxenite (CCM) 0.25 kWh/t
Pyroxenite (PSM) 1.00 kWh/t Pyroxenite (CCM) 1.00 kWh/t
Pyroxenite (PSM) 2.50 kWh/t Pyroxenite (CCM) 2.50 kWh/t
Large (-31.5+26.5 mm)
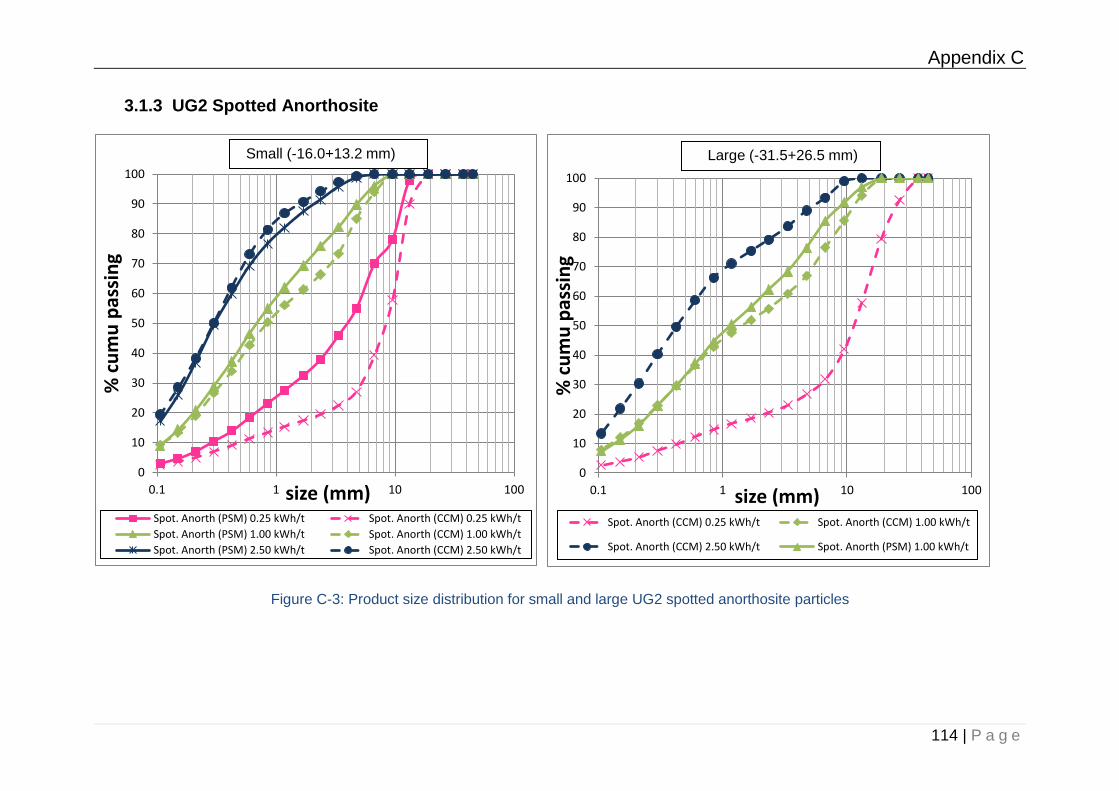
Appendix C
114 | P a g e
3.1.3 UG2 Spotted Anorthosite
Figure C-3: Product size distribution for small and large UG2 spotted anorthosite particles
0
10
20
30
40
50
60
70
80
90
100
0.1 1 10 100
% c
um
u p
assi
ng
size (mm)Spot. Anorth (PSM) 0.25 kWh/t Spot. Anorth (CCM) 0.25 kWh/t
Spot. Anorth (PSM) 1.00 kWh/t Spot. Anorth (CCM) 1.00 kWh/t
Spot. Anorth (PSM) 2.50 kWh/t Spot. Anorth (CCM) 2.50 kWh/t
Small (-16.0+13.2 mm)
0
10
20
30
40
50
60
70
80
90
100
0.1 1 10 100
% c
um
u p
assi
ng
size (mm)Spot. Anorth (CCM) 0.25 kWh/t Spot. Anorth (CCM) 1.00 kWh/t
Spot. Anorth (CCM) 2.50 kWh/t Spot. Anorth (PSM) 1.00 kWh/t
Large (-31.5+26.5 mm)
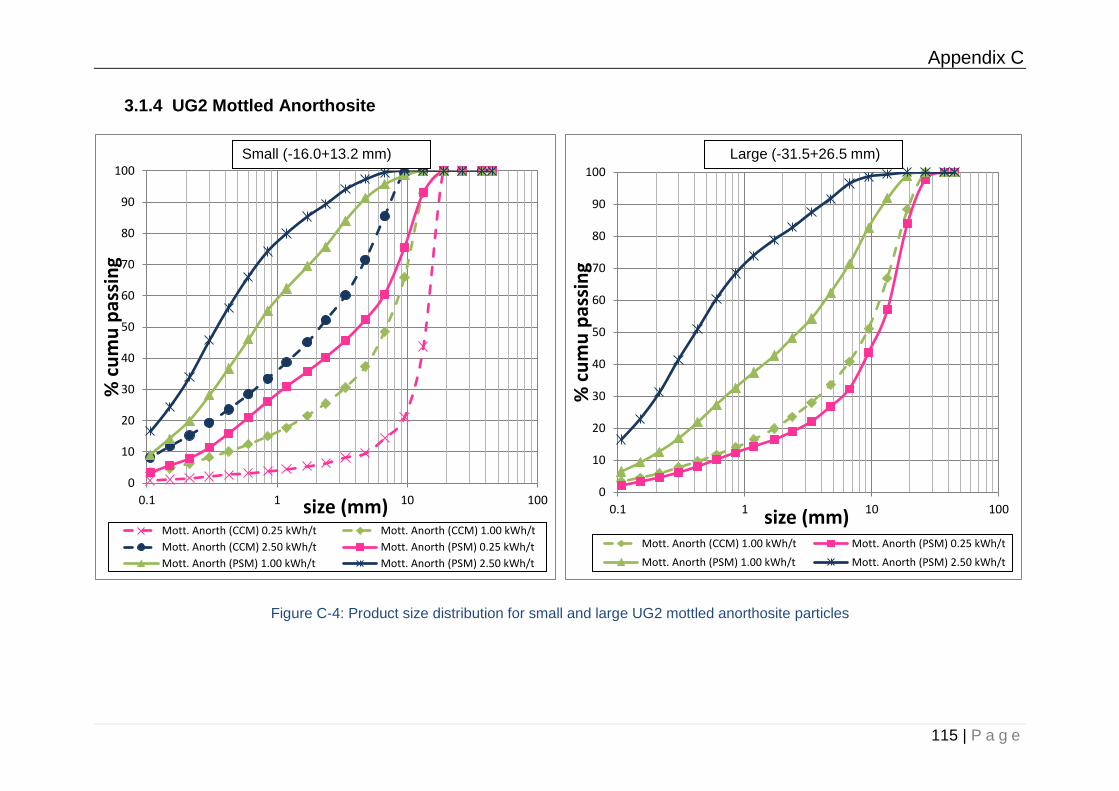
Appendix C
115 | P a g e
3.1.4 UG2 Mottled Anorthosite
Figure C-4: Product size distribution for small and large UG2 mottled anorthosite particles
0
10
20
30
40
50
60
70
80
90
100
0.1 1 10 100
% c
um
u p
assi
ng
size (mm)Mott. Anorth (CCM) 0.25 kWh/t Mott. Anorth (CCM) 1.00 kWh/t
Mott. Anorth (CCM) 2.50 kWh/t Mott. Anorth (PSM) 0.25 kWh/t
Mott. Anorth (PSM) 1.00 kWh/t Mott. Anorth (PSM) 2.50 kWh/t
Small (-16.0+13.2 mm)
0
10
20
30
40
50
60
70
80
90
100
0.1 1 10 100
% c
um
u p
assi
ng
size (mm)Mott. Anorth (CCM) 1.00 kWh/t Mott. Anorth (PSM) 0.25 kWh/t
Mott. Anorth (PSM) 1.00 kWh/t Mott. Anorth (PSM) 2.50 kWh/t
Large (-31.5+26.5 mm)
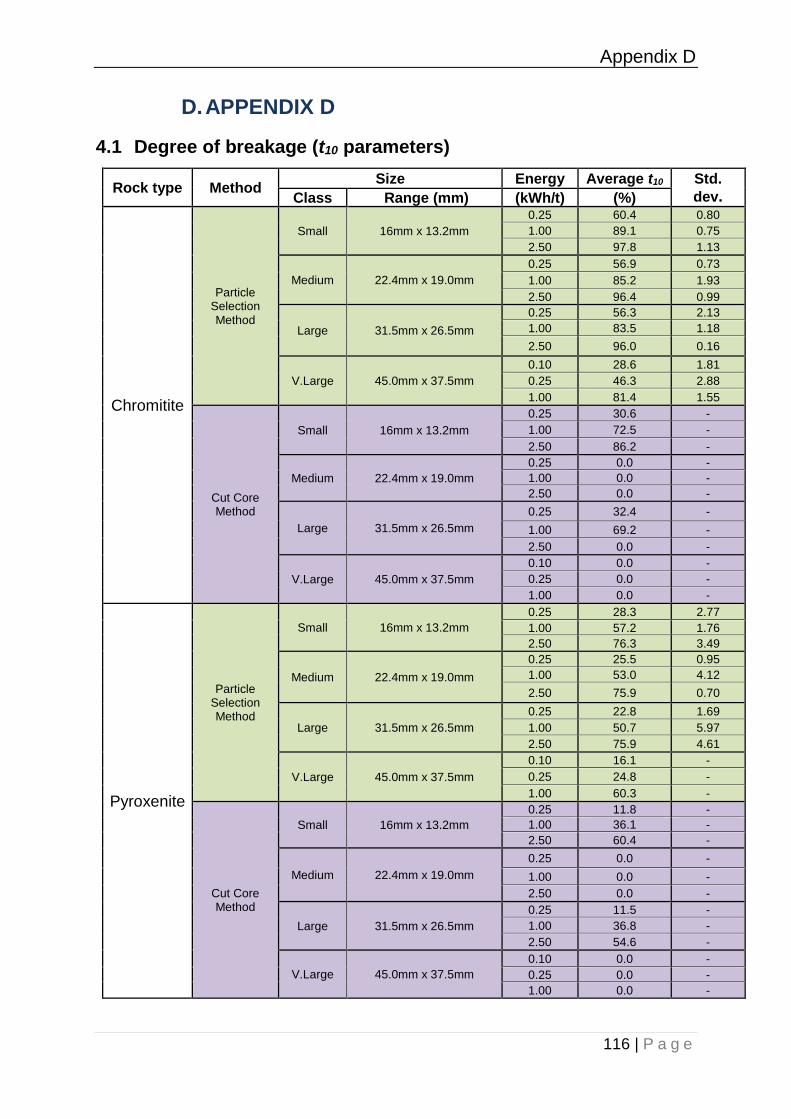
Appendix D
116 | P a g e
D. APPENDIX D
4.1 Degree of breakage (t10 parameters)
Rock type Method Size Energy Average t10 Std.
dev. Class Range (mm) (kWh/t) (%)
Chromitite
Particle Selection Method
Small 16mm x 13.2mm
0.25 60.4 0.80
1.00 89.1 0.75
2.50 97.8 1.13
Medium 22.4mm x 19.0mm
0.25 56.9 0.73
1.00 85.2 1.93
2.50 96.4 0.99
Large 31.5mm x 26.5mm
0.25 56.3 2.13
1.00 83.5 1.18
2.50 96.0 0.16
V.Large 45.0mm x 37.5mm
0.10 28.6 1.81
0.25 46.3 2.88
1.00 81.4 1.55
Cut Core Method
Small 16mm x 13.2mm
0.25 30.6 -
1.00 72.5 -
2.50 86.2 -
Medium 22.4mm x 19.0mm
0.25 0.0 -
1.00 0.0 -
2.50 0.0 -
Large 31.5mm x 26.5mm
0.25 32.4 -
1.00 69.2 -
2.50 0.0 -
V.Large 45.0mm x 37.5mm
0.10 0.0 -
0.25 0.0 -
1.00 0.0 -
Pyroxenite
Particle Selection Method
Small 16mm x 13.2mm
0.25 28.3 2.77
1.00 57.2 1.76
2.50 76.3 3.49
Medium 22.4mm x 19.0mm
0.25 25.5 0.95
1.00 53.0 4.12
2.50 75.9 0.70
Large 31.5mm x 26.5mm
0.25 22.8 1.69
1.00 50.7 5.97
2.50 75.9 4.61
V.Large 45.0mm x 37.5mm
0.10 16.1 -
0.25 24.8 -
1.00 60.3 -
Cut Core Method
Small 16mm x 13.2mm
0.25 11.8 -
1.00 36.1 -
2.50 60.4 -
Medium 22.4mm x 19.0mm
0.25 0.0 -
1.00 0.0 -
2.50 0.0 -
Large 31.5mm x 26.5mm
0.25 11.5 -
1.00 36.8 -
2.50 54.6 -
V.Large 45.0mm x 37.5mm
0.10 0.0 -
0.25 0.0 -
1.00 0.0 -
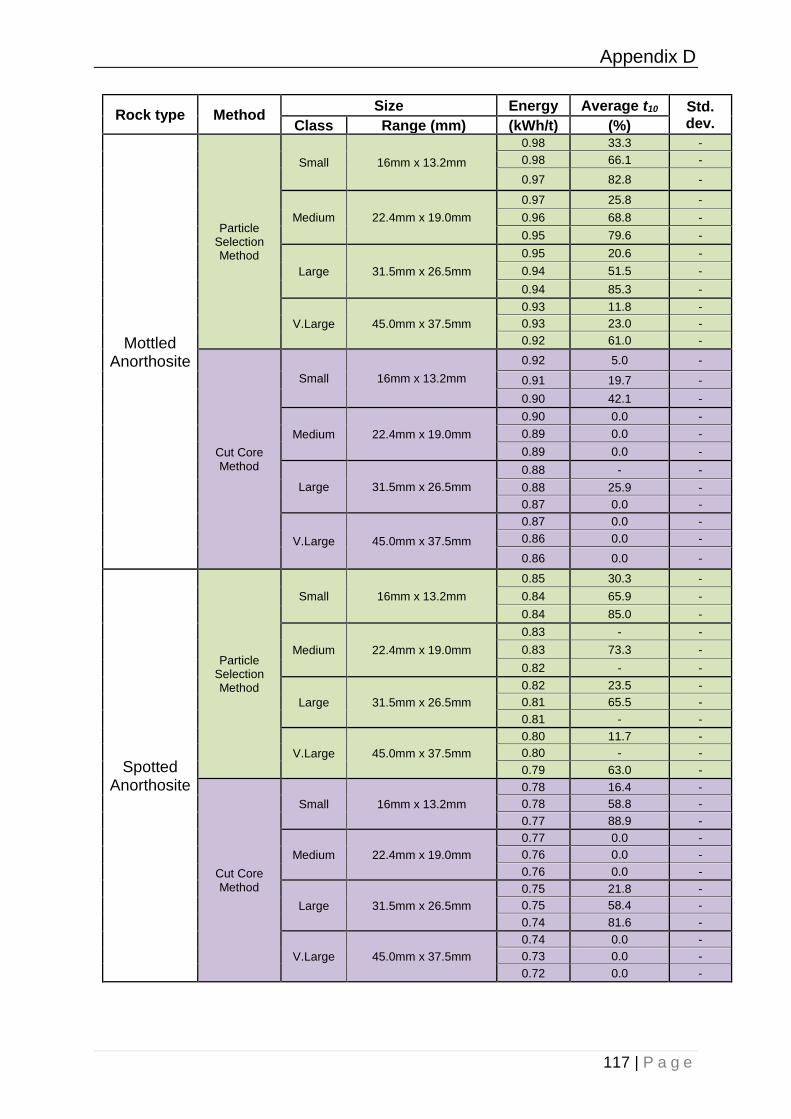
Appendix D
117 | P a g e
Rock type Method Size Energy Average t10 Std.
dev. Class Range (mm) (kWh/t) (%)
Mottled Anorthosite
Particle Selection Method
Small 16mm x 13.2mm
0.98 33.3 -
0.98 66.1 -
0.97 82.8 -
Medium 22.4mm x 19.0mm
0.97 25.8 -
0.96 68.8 -
0.95 79.6 -
Large 31.5mm x 26.5mm
0.95 20.6 -
0.94 51.5 -
0.94 85.3 -
V.Large 45.0mm x 37.5mm
0.93 11.8 -
0.93 23.0 -
0.92 61.0 -
Cut Core Method
Small 16mm x 13.2mm
0.92 5.0 -
0.91 19.7 -
0.90 42.1 -
Medium 22.4mm x 19.0mm
0.90 0.0 -
0.89 0.0 -
0.89 0.0 -
Large 31.5mm x 26.5mm
0.88 - -
0.88 25.9 -
0.87 0.0 -
V.Large 45.0mm x 37.5mm
0.87 0.0 -
0.86 0.0 -
0.86 0.0 -
Spotted Anorthosite
Particle Selection Method
Small 16mm x 13.2mm
0.85 30.3 -
0.84 65.9 -
0.84 85.0 -
Medium 22.4mm x 19.0mm
0.83 - -
0.83 73.3 -
0.82 - -
Large 31.5mm x 26.5mm
0.82 23.5 -
0.81 65.5 -
0.81 - -
V.Large 45.0mm x 37.5mm
0.80 11.7 -
0.80 - -
0.79 63.0 -
Cut Core Method
Small 16mm x 13.2mm
0.78 16.4 -
0.78 58.8 -
0.77 88.9 -
Medium 22.4mm x 19.0mm
0.77 0.0 -
0.76 0.0 -
0.76 0.0 -
Large 31.5mm x 26.5mm
0.75 21.8 -
0.75 58.4 -
0.74 81.6 -
V.Large 45.0mm x 37.5mm
0.74 0.0 -
0.73 0.0 -
0.72 0.0 -
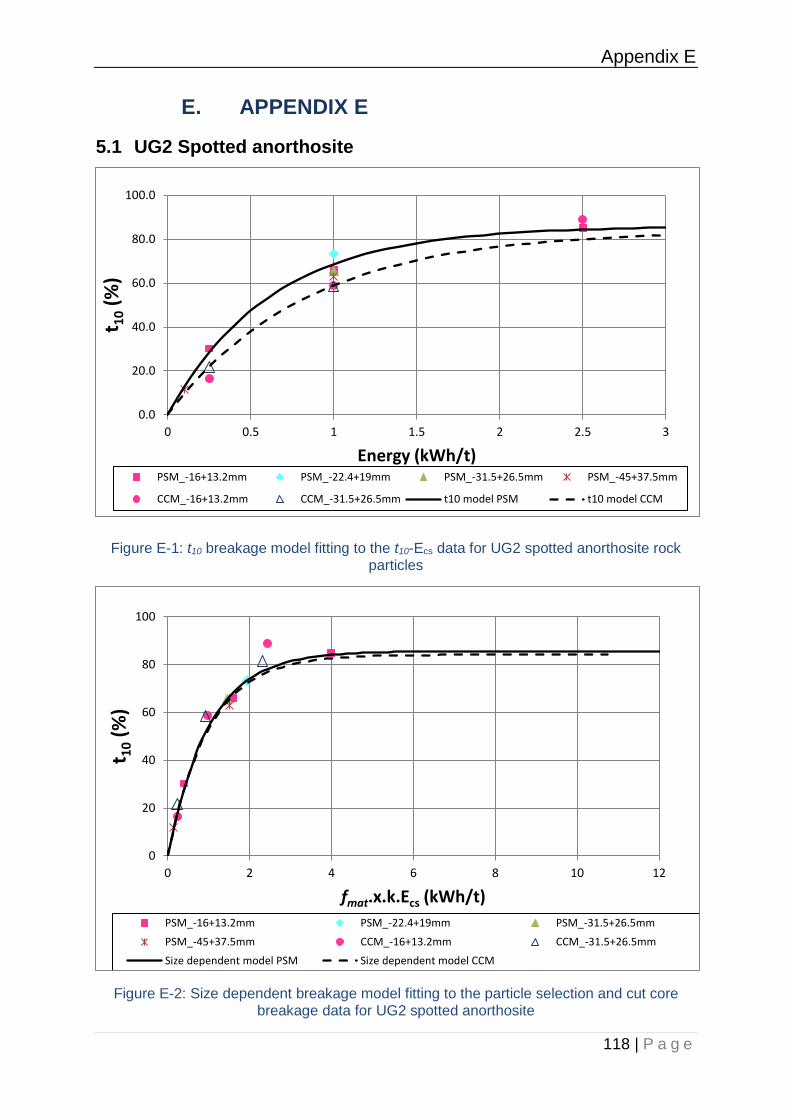
Appendix E
118 | P a g e
E. APPENDIX E
5.1 UG2 Spotted anorthosite
Figure E-1: t10 breakage model fitting to the t10-Ecs data for UG2 spotted anorthosite rock particles
Figure E-2: Size dependent breakage model fitting to the particle selection and cut core breakage data for UG2 spotted anorthosite
0.0
20.0
40.0
60.0
80.0
100.0
0 0.5 1 1.5 2 2.5 3
t 10
(%)
Energy (kWh/t)PSM_-16+13.2mm PSM_-22.4+19mm PSM_-31.5+26.5mm PSM_-45+37.5mm
CCM_-16+13.2mm CCM_-31.5+26.5mm t10 model PSM t10 model CCM
0
20
40
60
80
100
0 2 4 6 8 10 12
t 10
(%)
fmat.x.k.Ecs (kWh/t)
PSM_-16+13.2mm PSM_-22.4+19mm PSM_-31.5+26.5mm
PSM_-45+37.5mm CCM_-16+13.2mm CCM_-31.5+26.5mm
Size dependent model PSM Size dependent model CCM

Appendix E
119 | P a g e
5.2 UG2 Mottled anorthosite
Figure E-3: t10 breakage model fitting to the t10-Ecs data for UG2 mottled anorthosite rock particles
Figure E-4: Size dependent breakage model fitting to the particle selection and cut core breakage data for UG2 mottled anorthosite
0.0
20.0
40.0
60.0
80.0
100.0
0 1 2 3 4 5 6
t10
(%
)
Energy (kWh/t)
PSM_-16+13.2mm PSM_-22.4+19mm PSM_-31.5+26.5mmPSM_-45+37.5mm CCM_-16+13.2mm CCM_-31.5+26.5mmt10 model PSM t10 model CCM
0.0
20.0
40.0
60.0
80.0
100.0
0.00 1.00 2.00 3.00 4.00 5.00 6.00 7.00
t 10
(%)
fmat.x.k.Ecs (kWh/t)
PSM_-16+13.2mm PSM_-22.4+19mm PSM_-31.5+26.5mmPSM_-45+37.5mm CCM_-16+13.2mm CCM_-31.5+26.5mmSize dependent model PSM Size dependant model CCM


![vf[kyHkkjrh; vk;qfoZKkuLakLFkku] jk;iqj ¼NRrhlx](https://static.fdokumen.com/doc/165x107/6318513f3394f2252e02a810/vfkyhkkjrh-vkqfozkkulaklfkku-jkiqj-nrrhlx.jpg)