JK Lakshmi Cement Ltd - Axis Direct
25
O JK Lakshmi Cement Ltd
-
Upload
khangminh22 -
Category
Documents
-
view
1 -
download
0
Transcript of JK Lakshmi Cement Ltd - Axis Direct
O
ACC Limited
JK Lakshmi Cement Ltd
Axis Annual Analysis
12th Aug, 2021
BUY
Target Price
770
JK Lakshmi Cement Ltd Cement
1
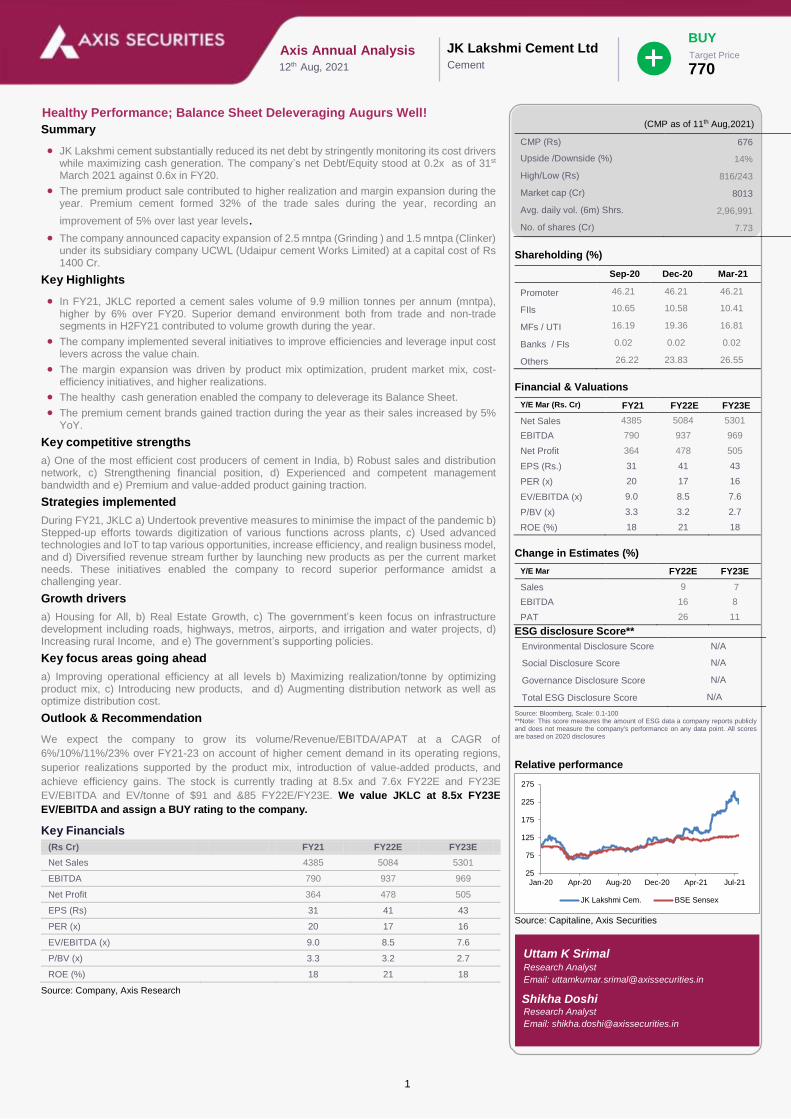
Healthy Performance; Balance Sheet Deleveraging Augurs Well!
Summary
JK Lakshmi cement substantially reduced its net debt by stringently monitoring its cost drivers while maximizing cash generation. The company’s net Debt/Equity stood at 0.2x as of 31st March 2021 against 0.6x in FY20.
The premium product sale contributed to higher realization and margin expansion during the year. Premium cement formed 32% of the trade sales during the year, recording an
improvement of 5% over last year levels. The company announced capacity expansion of 2.5 mntpa (Grinding ) and 1.5 mntpa (Clinker)
under its subsidiary company UCWL (Udaipur cement Works Limited) at a capital cost of Rs 1400 Cr.
Key Highlights
In FY21, JKLC reported a cement sales volume of 9.9 million tonnes per annum (mntpa), higher by 6% over FY20. Superior demand environment both from trade and non-trade segments in H2FY21 contributed to volume growth during the year.
The company implemented several initiatives to improve efficiencies and leverage input cost levers across the value chain.
The margin expansion was driven by product mix optimization, prudent market mix, cost-efficiency initiatives, and higher realizations.
The healthy cash generation enabled the company to deleverage its Balance Sheet.
The premium cement brands gained traction during the year as their sales increased by 5% YoY.
Key competitive strengths
a) One of the most efficient cost producers of cement in India, b) Robust sales and distribution network, c) Strengthening financial position, d) Experienced and competent management bandwidth and e) Premium and value-added product gaining traction.
Strategies implemented
During FY21, JKLC a) Undertook preventive measures to minimise the impact of the pandemic b) Stepped-up efforts towards digitization of various functions across plants, c) Used advanced technologies and IoT to tap various opportunities, increase efficiency, and realign business model, and d) Diversified revenue stream further by launching new products as per the current market needs. These initiatives enabled the company to record superior performance amidst a challenging year.
Growth drivers
a) Housing for All, b) Real Estate Growth, c) The government’s keen focus on infrastructure development including roads, highways, metros, airports, and irrigation and water projects, d) Increasing rural Income, and e) The government’s supporting policies.
Key focus areas going ahead
a) Improving operational efficiency at all levels b) Maximizing realization/tonne by optimizing product mix, c) Introducing new products, and d) Augmenting distribution network as well as optimize distribution cost.
Outlook & Recommendation
We expect the company to grow its volume/Revenue/EBITDA/APAT at a CAGR of
6%/10%/11%/23% over FY21-23 on account of higher cement demand in its operating regions,
superior realizations supported by the product mix, introduction of value-added products, and
achieve efficiency gains. The stock is currently trading at 8.5x and 7.6x FY22E and FY23E
EV/EBITDA and EV/tonne of $91 and &85 FY22E/FY23E. We value JKLC at 8.5x FY23E
EV/EBITDA and assign a BUY rating to the company.
Key Financials
(Rs Cr) FY21 FY22E FY23E
Net Sales 4385 5084 5301
EBITDA 790 937 969
Net Profit 364 478 505
EPS (Rs) 31 41 43
PER (x) 20 17 16
EV/EBITDA (x) 9.0 8.5 7.6
P/BV (x) 3.3 3.2 2.7
ROE (%) 18 21 18
Source: Company, Axis Research
(CMP as of 11th Aug,2021)
CMP (Rs) 676 146
Upside /Downside (%) 14% 23%
High/Low (Rs) 816/243 153/56
Market cap (Cr) 8013 3012
Avg. daily vol. (6m) Shrs. 2,96,991 1152304
No. of shares (Cr) 7.73 20.5
Shareholding (%)
Sep-20 Dec-20 Mar-21
Promoter 46.21 46.21 46.21
FIIs 10.65 10.58 10.41
MFs / UTI 16.19 19.36 16.81
Banks / FIs 0.02 0.02 0.02
Others 26.22 23.83 26.55
Financial & Valuations
Y/E Mar (Rs. Cr) FY21 FY22E FY23E
Net Sales 4385 5084 5301
EBITDA 790 937 969
Net Profit 364 478 505
EPS (Rs.) 31 41 43
PER (x) 20 17 16
EV/EBITDA (x) 9.0 8.5 7.6
P/BV (x) 3.3 3.2 2.7
ROE (%) 18 21 18
Change in Estimates (%)
Y/E Mar FY22E FY23E
Sales 9 7
8 EBITDA 16 8
PAT 26 11
ESG disclosure Score**
Environmental Disclosure Score N/A
Social Disclosure Score N/A
Governance Disclosure Score N/A
Total ESG Disclosure Score N/A
Source: Bloomberg, Scale: 0.1-100 **Note: This score measures the amount of ESG data a company reports publicly and does not measure the company's performance on any data point. All scores are based on 2020 disclosures
Relative performance
Source: Capitaline, Axis Securities
25
75
125
175
225
275
Jan-20 Apr-20 Aug-20 Dec-20 Apr-21 Jul-21
JK Lakshmi Cem. BSE Sensex
Uttam K Srimal Research Analyst
Email: [email protected]
Shikha Doshi Research Analyst
Email: [email protected]
2
Company Overview
JK Lakshmi Cement (JKLC) is a dominant player in the cement industry in its key markets of North and West India and derives 75% of its
revenue from these two regions. It has a sizeable market presence in Eastern India as well. The company had set up its first cement plant in
1982 with 0.5 mntpa capacity which has now grown to a total capacity of 13.9 mntpa and clinker capacity of 8.7 mntpa on a consolidated
basis. A strong network of about 7000+ cement dealers spread in the states of Madhya Pradesh, Chhattisgarh, Rajasthan, Gujarat, Uttar
Pradesh, Punjab, Delhi, Haryana, Jammu & Kashmir, Maharashtra, Odisha, and West Bengal enables the company to efficiently serve its
customers across India. The company has 3 integrated and 4 grinding units located at strategic locations.
FY21Performance Round-up
The company reported revenue of Rs4.385 Cr which was lower by 8% over FY20 owing to superior demand recovery and price realization in
H2FY21. The blended realization for the year increased by 2% and stood at Rs4432/tonne as the cement prices saw improvement across
regions with north India witnessing significant growth during the year. The volume growth stood higher by 6% YoY (FY21–9.89 mntpa vs
FY20–9.30 mntpa) owing to superior demand prospect, The company reported a higher EBITDA margin of 18% in FY21 against 16.6% in
FY20. This was driven by various cost optimization measures undertaken during the year, superior product mix, and superior pricing.
Moreover, the share of a premium product in trade sales, too, increased to 32% in FY21, contributing to a superior margin profile. The non-
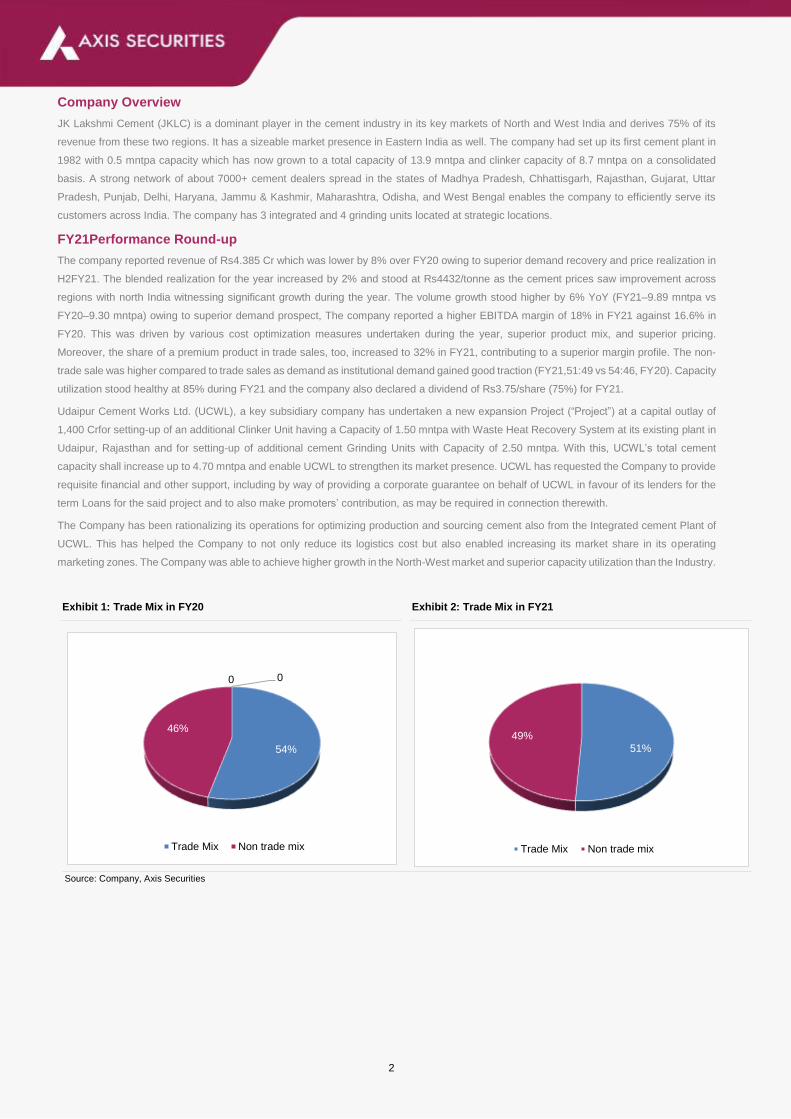
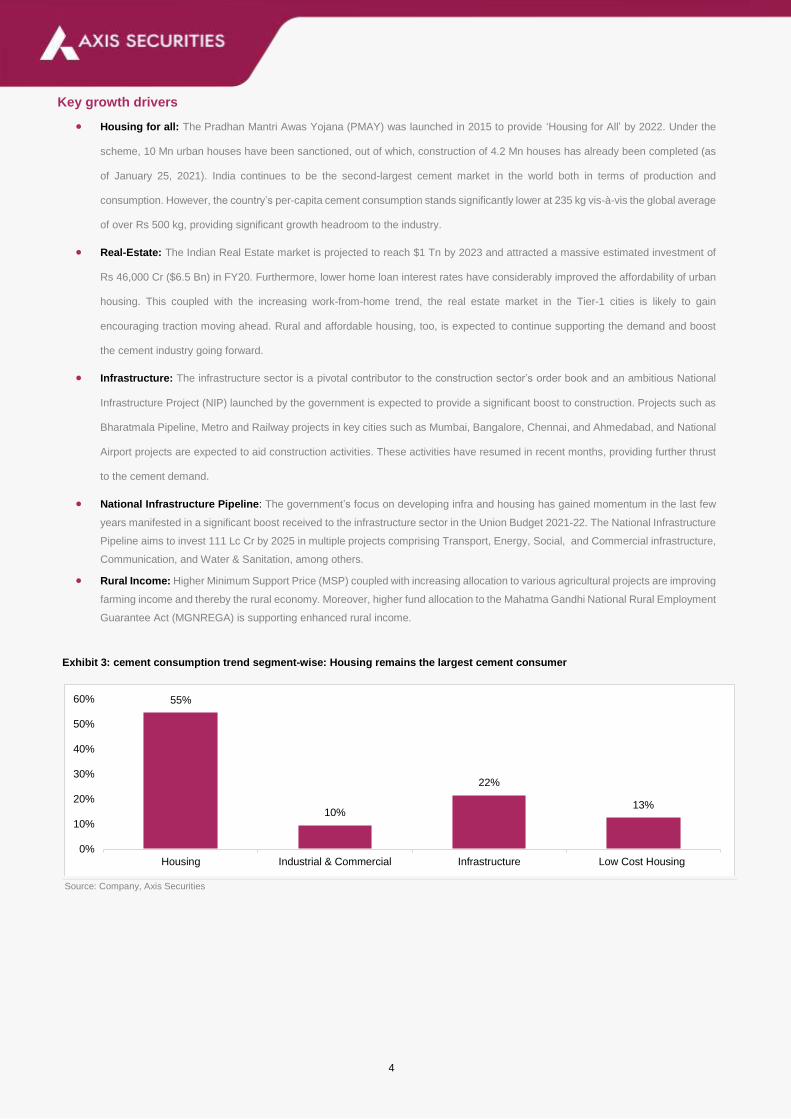
trade sale was higher compared to trade sales as demand as institutional demand gained good traction (FY21,51:49 vs 54:46, FY20). Capacity
utilization stood healthy at 85% during FY21 and the company also declared a dividend of Rs3.75/share (75%) for FY21.
Udaipur Cement Works Ltd. (UCWL), a key subsidiary company has undertaken a new expansion Project (“Project”) at a capital outlay of
1,400 Crfor setting-up of an additional Clinker Unit having a Capacity of 1.50 mntpa with Waste Heat Recovery System at its existing plant in
Udaipur, Rajasthan and for setting-up of additional cement Grinding Units with Capacity of 2.50 mntpa. With this, UCWL’s total cement
capacity shall increase up to 4.70 mntpa and enable UCWL to strengthen its market presence. UCWL has requested the Company to provide
requisite financial and other support, including by way of providing a corporate guarantee on behalf of UCWL in favour of its lenders for the
term Loans for the said project and to also make promoters’ contribution, as may be required in connection therewith.
The Company has been rationalizing its operations for optimizing production and sourcing cement also from the Integrated cement Plant of
UCWL. This has helped the Company to not only reduce its logistics cost but also enabled increasing its market share in its operating
marketing zones. The Company was able to achieve higher growth in the North-West market and superior capacity utilization than the Industry.
Exhibit 1: Trade Mix in FY20 Exhibit 2: Trade Mix in FY21
Source: Company, Axis Securities
54%
46%
0 0
Trade Mix Non trade mix
51%
49%
Trade Mix Non trade mix

3
Key Subsidiary Performance Analysis
Particulars (Rs Cr) FY20 FY21 Change Comment/Analysis
Revenues
Udaipur Cement Works Ltd (UCWL) 687 738 7.4% Superior demand in the Northern market helped in revenue growth.
Hansdeep Industries & trading company ltd 129 14 -89.0%
Ram Kanta Properties Pvt Ltd Nil 0.11 100.0%
Net Worth
Udaipur Cement Works Ltd (UCWL) 183 246 34.0% Higher profits resulted in the growth of net worth.
Hansdeep Industries & trading company ltd 119 116 -3.0%
Ram Kanta Properties Pvt Ltd 115 115. -
PAT
Udaipur Cement Works Ltd (UCWL) 26 56 114.5% Higher volume and superior realization resulted in a PAT increase
Hansdeep Industries & trading company ltd -0.10 -0.057 43.0%
Ram Kanta Properties Pvt. Ltd 0.00 0.056 100.0%
Source: Company; Axis Securities
Cost Optimization Measures
The company’s timely and proactive decision-making resulted in cost/tonne remaining flat in FY21 (Rs 3,633/tonne vs 3,625/tonne in FY20)
despite the rise in the input costs in the latter half of the year.
Power/Fuel Cost: In FY21, Power & Fuel costs dropped by 12%/tonne on a YoY basis on account of favourable market trends and
efficiency gains. The use of green energy has also improved the overall power/fuel mix.
Freight/Forwarding Cost: Freight & Forwarding cost per tonne was higher by 1.5% for the year as diesel prices climbed sharply by
26% during the year. The company would contain the higher impact of prices by increasing direct dispatches and through other
freight optimization measures.
Raw Material Cost: Raw material cost per tonne was higher by 11% owing to higher volume and the rising cost of input materials.
4
Key growth drivers
Housing for all: The Pradhan Mantri Awas Yojana (PMAY) was launched in 2015 to provide ‘Housing for All’ by 2022. Under the
scheme, 10 Mn urban houses have been sanctioned, out of which, construction of 4.2 Mn houses has already been completed (as
of January 25, 2021). India continues to be the second-largest cement market in the world both in terms of production and
consumption. However, the country’s per-capita cement consumption stands significantly lower at 235 kg vis-à-vis the global average
of over Rs 500 kg, providing significant growth headroom to the industry.
Real-Estate: The Indian Real Estate market is projected to reach $1 Tn by 2023 and attracted a massive estimated investment of
Rs 46,000 Cr ($6.5 Bn) in FY20. Furthermore, lower home loan interest rates have considerably improved the affordability of urban
housing. This coupled with the increasing work-from-home trend, the real estate market in the Tier-1 cities is likely to gain
encouraging traction moving ahead. Rural and affordable housing, too, is expected to continue supporting the demand and boost
the cement industry going forward.
Infrastructure: The infrastructure sector is a pivotal contributor to the construction sector’s order book and an ambitious National
Infrastructure Project (NIP) launched by the government is expected to provide a significant boost to construction. Projects such as
Bharatmala Pipeline, Metro and Railway projects in key cities such as Mumbai, Bangalore, Chennai, and Ahmedabad, and National
Airport projects are expected to aid construction activities. These activities have resumed in recent months, providing further thrust
to the cement demand.
National Infrastructure Pipeline: The government’s focus on developing infra and housing has gained momentum in the last few
years manifested in a significant boost received to the infrastructure sector in the Union Budget 2021-22. The National Infrastructure
Pipeline aims to invest 111 Lc Cr by 2025 in multiple projects comprising Transport, Energy, Social, and Commercial infrastructure,
Communication, and Water & Sanitation, among others.
Rural Income: Higher Minimum Support Price (MSP) coupled with increasing allocation to various agricultural projects are improving
farming income and thereby the rural economy. Moreover, higher fund allocation to the Mahatma Gandhi National Rural Employment
Guarantee Act (MGNREGA) is supporting enhanced rural income.
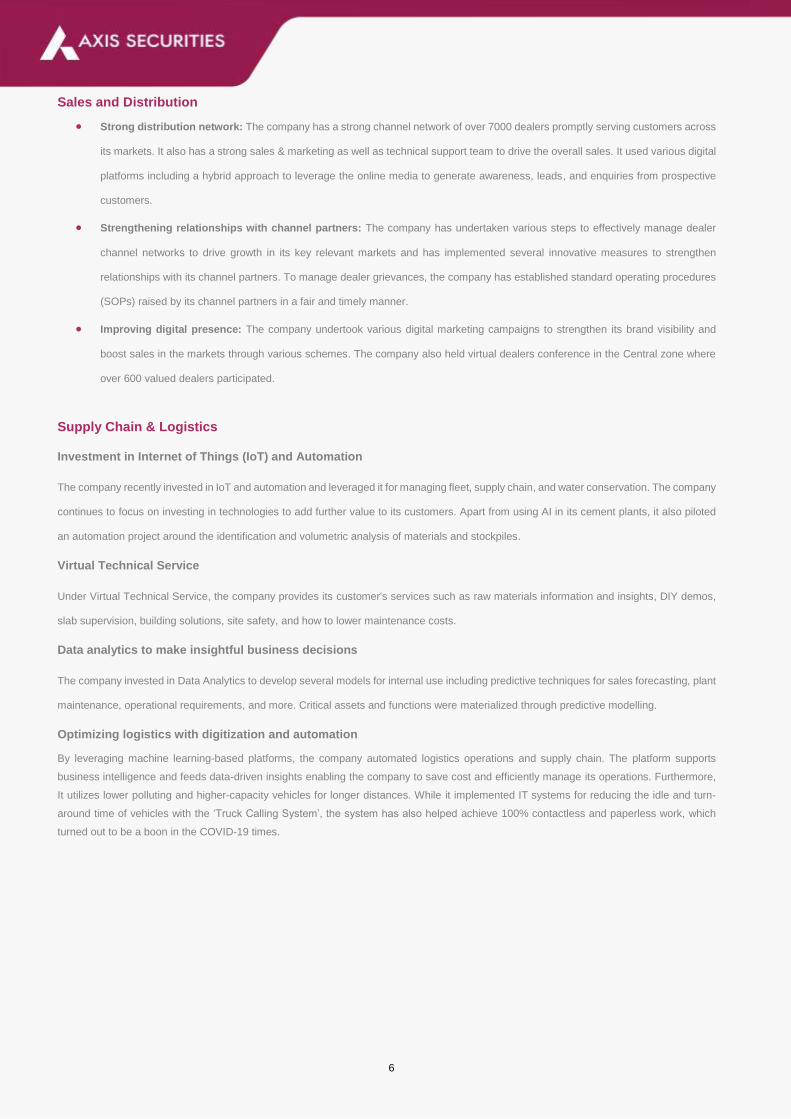
Exhibit 3: cement consumption trend segment-wise: Housing remains the largest cement consumer
Source: Company, Axis Securities
55%
10%
22%
13%
0%
10%
20%
30%
40%
50%
60%
Housing Industrial & Commercial Infrastructure Low Cost Housing

5
Key operational activities during the year
Fast-track recovery
The grinding units at Surat, Kalol, Jharli and Cuttack exhibited remarkable resilience in bouncing back to normal levels in the shortest possible
period after being impacted by nation-wide lockdown last year.
Capacity Utilization
The overall capacity utilization for FY21 stood at 85% while Q4FY21 utilization reached over 90%.
Higher EBITDA
EBITDA for the year stood at 790 Cr which was higher by 17% over FY20. This was owing to superior cost control, higher volume and a
benign pricing environment witnessed in its operating regions during the year.
New Product Launch and Value-added Products
The company successfully introduced its premium offering ‘Super Sixer Weather Guard cement’ by leveraging the goodwill generated through
its other cement brand ‘Sixer. It enabled the company to achieve one of the highest percentage of premium products sales in its trade sales.
Value-added product business also witnessed healthy traction in the non-lockdown period. A newly launched product, JK Lakshmi Smart
Wall-putty has got acceptance in the market and is increasing its footprint to become a significant player in the category.
Debt Reduction
During FY21, the company substantially reduced its leverage. Consequently, its Gross Debt and Net Debt have reduced to 0.5x and 0.2x in
FY21 from 0.8x and 0.6x in FY20 respectively. This has strengthened its Balance Sheet further and has created a robust platform to capitalize
on future growth opportunities.
Health & Safety
The company critically prioritized the safety and well-being of its personnel, neighbouring communities as well as its channel partners,
vendors, and customers throughout FY21. The company undertook several measures to meet this objective by providing medical, financial,
and psychological support to its personnel.
Project Expansion Updates
The progress of the WHRS plant (10 MW) in Sirohi was impacted owing to COVID-led disruptions. However, it is now progressing well and is
expected to get operational in Q3FY22. The company will selectively invest in augmenting capacity in Northern and Western parts of the
market in the next few years as it has been allotted two limestones mining block Central Rajasthan and Coastal Gujarat. These blocks can
support at least 5 mntpa capacity for the next 40-50 years.
6
Sales and Distribution
Strong distribution network: The company has a strong channel network of over 7000 dealers promptly serving customers across
its markets. It also has a strong sales & marketing as well as technical support team to drive the overall sales. It used various digital
platforms including a hybrid approach to leverage the online media to generate awareness, leads, and enquiries from prospective
customers.
Strengthening relationships with channel partners: The company has undertaken various steps to effectively manage dealer
channel networks to drive growth in its key relevant markets and has implemented several innovative measures to strengthen
relationships with its channel partners. To manage dealer grievances, the company has established standard operating procedures
(SOPs) raised by its channel partners in a fair and timely manner.
Improving digital presence: The company undertook various digital marketing campaigns to strengthen its brand visibility and
boost sales in the markets through various schemes. The company also held virtual dealers conference in the Central zone where
over 600 valued dealers participated.
Supply Chain & Logistics
Investment in Internet of Things (IoT) and Automation
The company recently invested in IoT and automation and leveraged it for managing fleet, supply chain, and water conservation. The company
continues to focus on investing in technologies to add further value to its customers. Apart from using AI in its cement plants, it also piloted
an automation project around the identification and volumetric analysis of materials and stockpiles.
Virtual Technical Service
Under Virtual Technical Service, the company provides its customer's services such as raw materials information and insights, DIY demos,
slab supervision, building solutions, site safety, and how to lower maintenance costs.
Data analytics to make insightful business decisions
The company invested in Data Analytics to develop several models for internal use including predictive techniques for sales forecasting, plant
maintenance, operational requirements, and more. Critical assets and functions were materialized through predictive modelling.
Optimizing logistics with digitization and automation
By leveraging machine learning-based platforms, the company automated logistics operations and supply chain. The platform supports
business intelligence and feeds data-driven insights enabling the company to save cost and efficiently manage its operations. Furthermore,
It utilizes lower polluting and higher-capacity vehicles for longer distances. While it implemented IT systems for reducing the idle and turn-
around time of vehicles with the ‘Truck Calling System’, the system has also helped achieve 100% contactless and paperless work, which
turned out to be a boon in the COVID-19 times.
7
Key strategies moving forward
Achieve Higher Realizations: Cement demand in India is likely to be robust in the coming years owing to rising per-capita cement
consumption in India which is at extremely low levels against the global average and significant investments taking place in the country’s
infrastructure and housing sector. The company aims to increase its realizations by superior product mix, introducing new brands, augmenting
the distribution network, and optimizing distribution costs.
Value-Added Products: The company continues to focus on the introduction of value-added products and plans to launch more products in
this category to strengthen its market reach.
Cost Optimization: JKLC is one of the efficient producers of cement in India and aims to gain a competitive edge in the market by employing
all possible efficiency measures to further optimize its cost structure. The company’s green energy portfolio has reached 35% of the overall
power mix and is expected to go higher with the commissioning of the WHRS plant in Sirohi.
Capacity Expansion: The company will selectively enhance its capacity expansion in Northern and Western India in the next few years to
optimize the use of new limestone mines which have been recently allotted to the company.
Business Outlook
The cement Industry’s long-term outlook remains robust with the government’s thrust to infrastructure and development to grow the economy.
The company is optimistic about the industry witnessing a prolonged phase of stable demand growth of about 5–6% per annum. The company
is well-poised to reap the benefits of sustained long-term demand growth post-economic normalization.
8
Risks and Mitigation
Key risks identified, assessed, and mitigated during the year under review include:
Health & Safety risks: Health & safety is one of the important risks identified by the company as the COVID-19 pandemic spread
and impacted the overall operation during lockdown restrictions. To mitigate the risk, the company framed a standard operating
procedure aligned with the guidelines issued by the government and regulatory authorities. Moreover, it also made strategic tie-ups
with hospitals and local bodies to deal with any infection outbreak within its workforce.
Business continuity risk: The pandemic impacted overall operational flow including labour exodus, restriction on inter-state
movements, and raw material and fly ash availability, etc. To mitigate this risk, the company formed a core leadership group acting
as a nerve center to assess, plan, and respond to evolving risks in an inclusive manner and with agility.
Cybersecurity risk: With remote working and virtual connectivity becoming a new normal, it has exposed many organizations to
cybersecurity risks. The company has undertaken appropriate measures with a sense of urgency to ensure data privacy is secured.
It has drawn out a detailed surveillance program, carried out vulnerability assessments, and upgraded its network security in line
with international standards to be able to swiftly counteract any cyber threat.
Compliance risk: The company’s operations ensure compliance with all these guidelines promptly. Any non-compliance, however,
may pose a serious risk to its seamless operations. The company has taken appropriate measures to ensure proper compliances
as required.
Legal/ Contractual obligations risks: The company has to perform several legal and contractual obligations as per the
contract/agreements with the parties and has to ensure proper compliance and monitoring of the same on regular basis to carry on
operations smoothly.
o To mitigate the risk, the company carries out an impact assessment of all contracts with taking or pay obligations and or
guaranteed commitments. It also re-negotiates contracts opportunistically to reduce/remove guaranteed commitments
towards flexibility and safeguard itself against future volatility.
Higher input cost risk: The cost of pet coke, coal, diesel, fly ash, packing bags have all increased all at a time putting pressure
on the margins of the company as they form the major part of the cost of production.
o To mitigate the risk the company has taken various measures such as shifting in fuel use from pet coke to coal, direct dispatch
of cement, monitoring of vehicles consistently and superior use of technology to combat higher costs.
Progress on sustainability
The company has taken adequate measures to reduce carbon and effluent emissions and minimize the use of natural resources. Climate
change, sustainable development and ecological consciousness are global concerns but as a responsible corporate, the company is
committed to the global agenda and consistently makes efforts, big or small, to preserve and enrich the environment in and around our areas
of operation
Water management: Installation of in-house designed Digital Water Flow Meter and Digital Ground Water Level Recorder at all the
groundwater input sources. Digitalization of water management by monitoring groundwater levels around the project area 24X7.
Environment Emission: Installation of four stack flow meters, 18 temperature sensors and 6 pressure sensors for strengthening
environmental emission monitoring system. Helps identify the source of pollution and capture relevant data for Root Cause Analysis
(RCA) for any deviation from benchmark process parameters.

9
Profitability Analysis (Rs Cr)
Particulars FY20 FY21 Change Comments/Analysis
Sales 4043 4385 8% Revenue growth was driven by higher volume and superior realization during the year.
Raw Materials/Others 2513 2747 9% Raw material and other costs such as power & fuel, and freight & forwarding were higher owing to higher volumes during the year.
Gross Profits 1531 1638 7% Gross Profits were higher due to higher volume during the year.
Operating Expenses 858 842 -0.18% Operating expenses were lower due to savings in fixed costs and efficiency gains.
Interest 164 142 -13% Interest cost was lower owing to lower interest rate and the company repaying its debt obligation to a certain extent.
EBIT 534 670 25% EBIT was higher on account of cost savings and higher realization during the year.
PAT 235 363 55% PAT was higher due to the combined impact of the above-mentioned attributes and lower interest costs.
EPS 19.9 30.9 55% EPS increased in line with PAT growth
Source: Company; Axis Securities
Exhibit 5: Volume and Growth trend
Source: Company, Axis Securities
Exhibit 6: Realization/tonne and Growth Trend
Source: Company, Axis Securities
Exhibit 7: Cost/tonne Trend
Source: Company, Axis Securities
7.958.52
9.659.30 9.89
9% 7%
13%
-4% 6%
-10%
0%
10%
20%
0.00
5.00
10.00
15.00
FY17 FY18 FY19 FY20 FY21
Volume & Volume Growth
Volume (mntpa) Volume growth
3661
40054023
4348 4432
2.3%
9%
0.5%
8.1%
1.9%0.0%
2.0%
4.0%
6.0%
8.0%
10.0%
0
800
1600
2400
3200
4000
4800
2017 2018 2019 2020 2021
Blended Realization/tonne (Rs.) Growth (%)
3201 3522 3593 3625 3633
-0.3%
10.0%
2.0% 0.9%0.2%
-5.0%
0.0%
5.0%
10.0%
15.0%
2800
3000
3200
3400
3600
3800
2017 2018 2019 2020 2021
Cost/tonne (Rs.) Trend
10
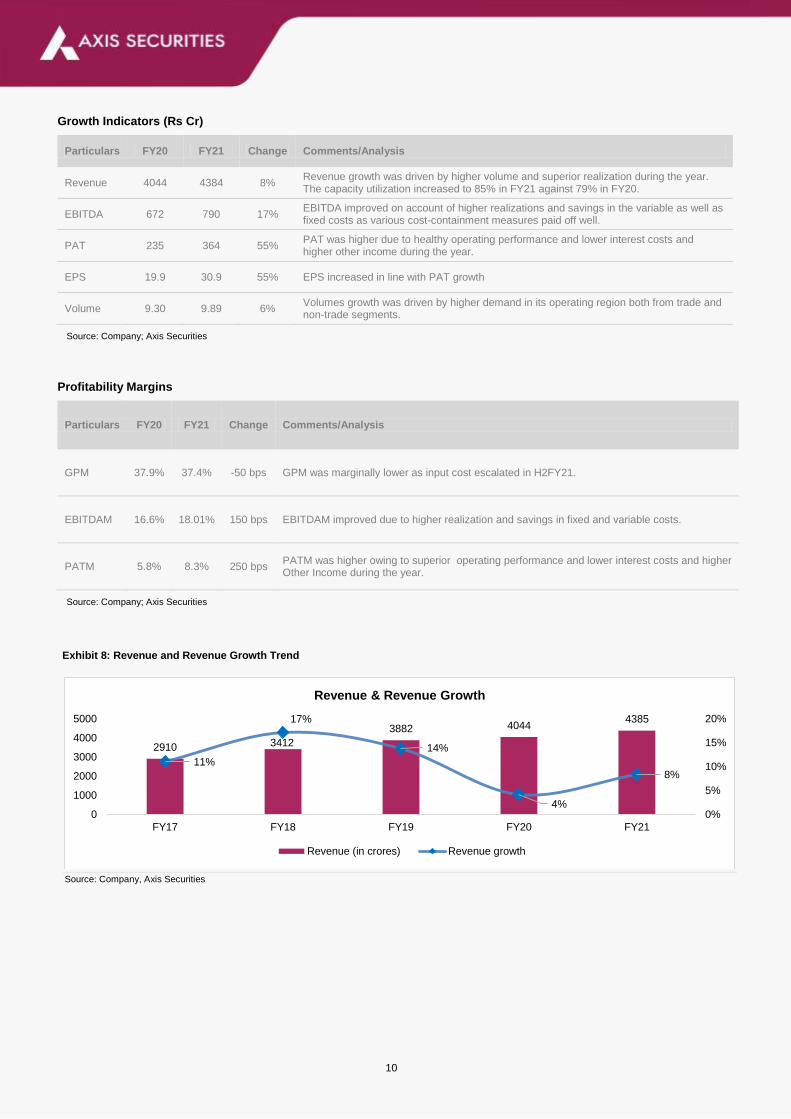
Growth Indicators (Rs Cr)
Particulars FY20 FY21 Change Comments/Analysis
Revenue 4044 4384 8% Revenue growth was driven by higher volume and superior realization during the year. The capacity utilization increased to 85% in FY21 against 79% in FY20.
EBITDA 672 790 17% EBITDA improved on account of higher realizations and savings in the variable as well as fixed costs as various cost-containment measures paid off well.
PAT 235 364 55% PAT was higher due to healthy operating performance and lower interest costs and higher other income during the year.
EPS 19.9 30.9 55% EPS increased in line with PAT growth
Volume 9.30 9.89 6% Volumes growth was driven by higher demand in its operating region both from trade and non-trade segments.
Source: Company; Axis Securities
Profitability Margins
Particulars FY20 FY21 Change Comments/Analysis
GPM 37.9% 37.4% -50 bps GPM was marginally lower as input cost escalated in H2FY21.
EBITDAM 16.6% 18.01% 150 bps EBITDAM improved due to higher realization and savings in fixed and variable costs.
PATM 5.8% 8.3% 250 bps PATM was higher owing to superior operating performance and lower interest costs and higher Other Income during the year.
Source: Company; Axis Securities
Exhibit 8: Revenue and Revenue Growth Trend
Source: Company, Axis Securities
2910 3412
3882 40444385
11%
17%
14%
4%
8%
0%
5%
10%
15%
20%
0
1000
2000
3000
4000
5000
FY17 FY18 FY19 FY20 FY21
Revenue & Revenue Growth
Revenue (in crores) Revenue growth
11
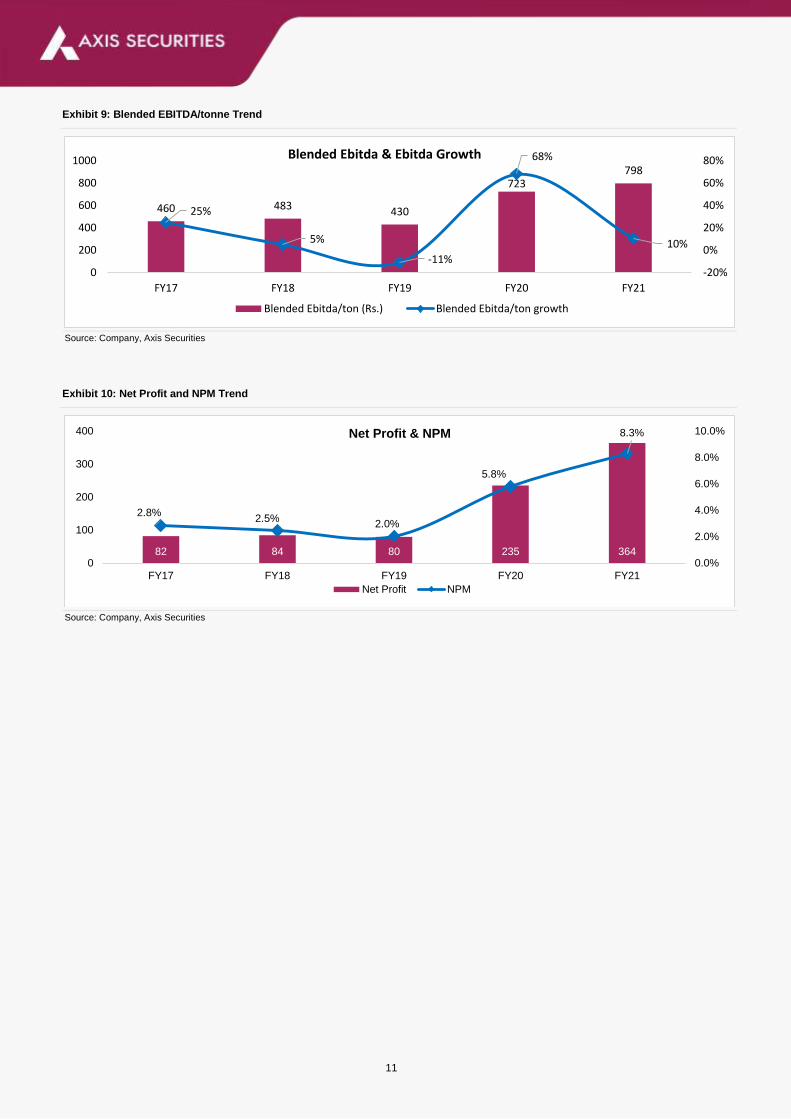
Exhibit 9: Blended EBITDA/tonne Trend
Source: Company, Axis Securities
Exhibit 10: Net Profit and NPM Trend
Source: Company, Axis Securities
460 483 430
723798
25%
5%
-11%
68%
10%
-20%
0%
20%
40%
60%
80%
0
200
400
600
800
1000
FY17 FY18 FY19 FY20 FY21
Blended Ebitda & Ebitda Growth
Blended Ebitda/ton (Rs.) Blended Ebitda/ton growth
82 84 80 235 364
2.8%2.5%
2.0%
5.8%
8.3%
0.0%
2.0%
4.0%
6.0%
8.0%
10.0%
0
100
200
300
400
FY17 FY18 FY19 FY20 FY21
Net Profit & NPM
Net Profit NPM
12
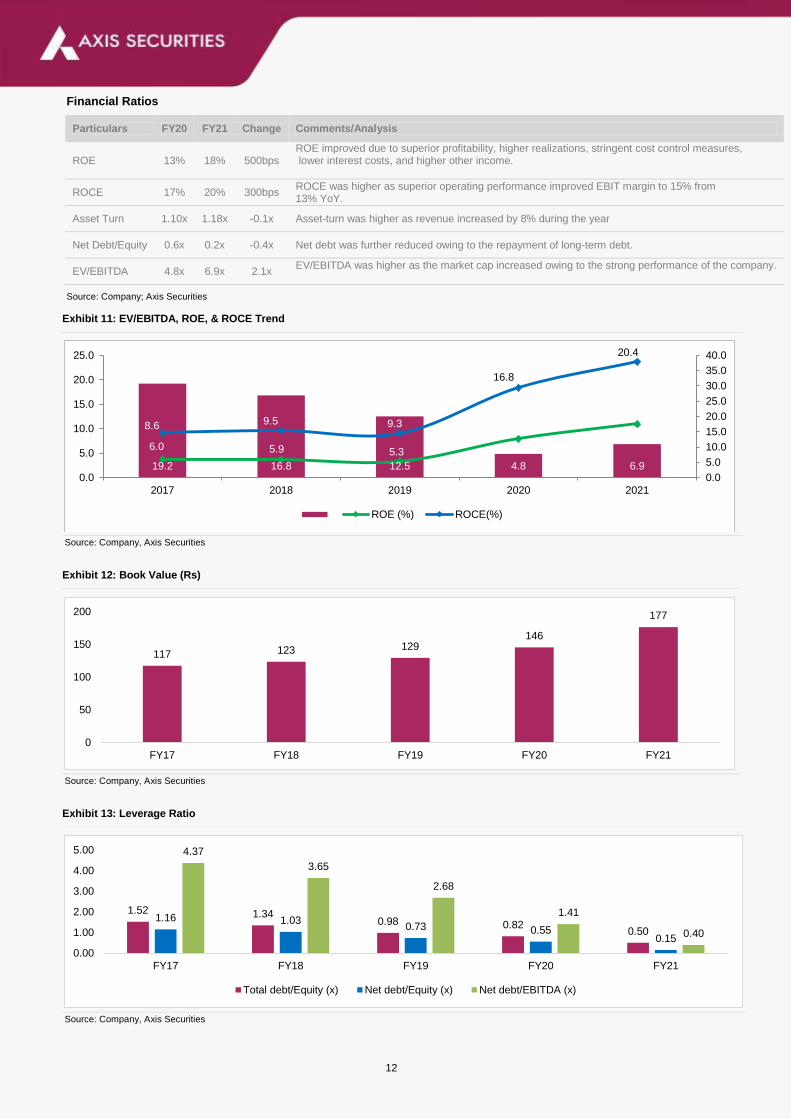
Financial Ratios
Particulars FY20 FY21 Change Comments/Analysis
ROE 13% 18% 500bps ROE improved due to superior profitability, higher realizations, stringent cost control measures, lower interest costs, and higher other income.
ROCE 17% 20% 300bps ROCE was higher as superior operating performance improved EBIT margin to 15% from 13% YoY.
Asset Turn 1.10x 1.18x -0.1x Asset-turn was higher as revenue increased by 8% during the year
Net Debt/Equity 0.6x 0.2x -0.4x Net debt was further reduced owing to the repayment of long-term debt.
EV/EBITDA 4.8x 6.9x 2.1x EV/EBITDA was higher as the market cap increased owing to the strong performance of the company.
Source: Company; Axis Securities
Exhibit 11: EV/EBITDA, ROE, & ROCE Trend
Source: Company, Axis Securities
Exhibit 12: Book Value (Rs)
Source: Company, Axis Securities
Exhibit 13: Leverage Ratio
Source: Company, Axis Securities
19.2 16.8 12.5 4.8 6.9
6.0 5.9 5.3
12.7
17.68.6 9.5 9.3
16.8
20.4
0.0
5.0
10.0
15.0
20.0
25.0
30.0
35.0
40.0
0.0
5.0
10.0
15.0
20.0
25.0
2017 2018 2019 2020 2021
ROE (%) ROCE(%)
117 123 129146
177
0
50
100
150
200
FY17 FY18 FY19 FY20 FY21
1.52 1.340.98 0.82
0.50
1.16 1.030.73 0.55
0.15
4.37
3.65
2.68
1.41
0.40
0.00
1.00
2.00
3.00
4.00
5.00
FY17 FY18 FY19 FY20 FY21
Total debt/Equity (x) Net debt/Equity (x) Net debt/EBITDA (x)
13
Key Balance Sheet Takeaways
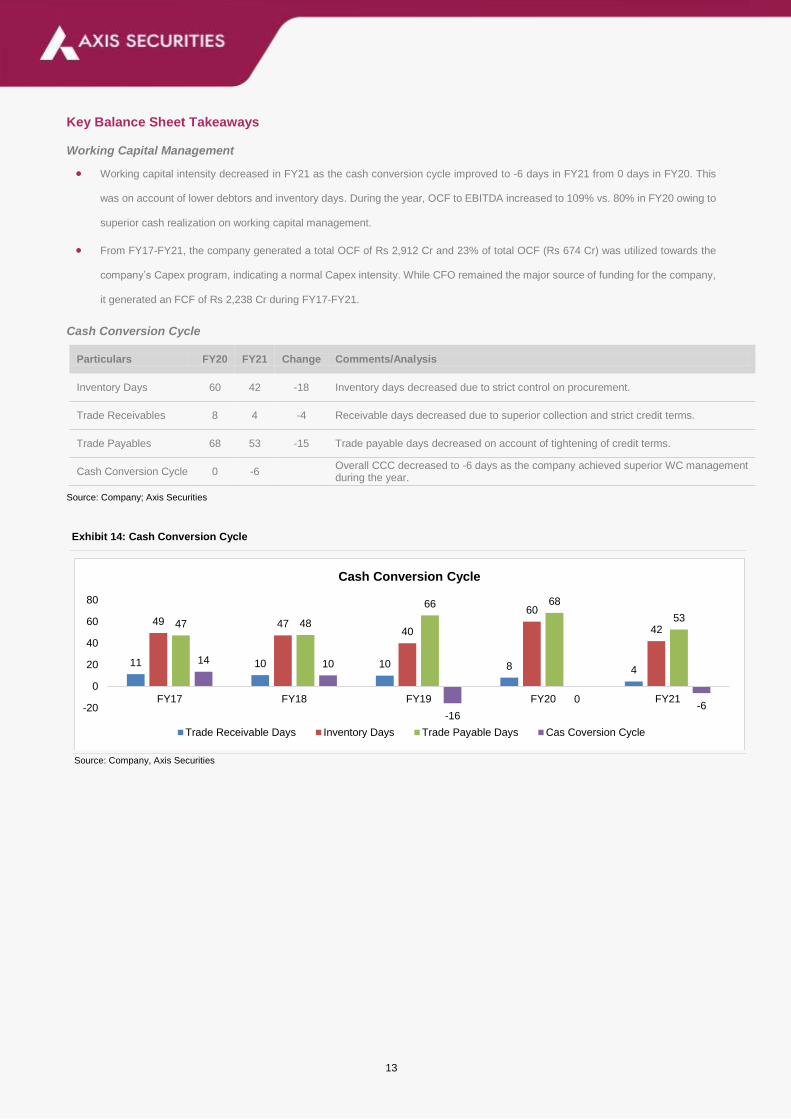
Working Capital Management
Working capital intensity decreased in FY21 as the cash conversion cycle improved to -6 days in FY21 from 0 days in FY20. This
was on account of lower debtors and inventory days. During the year, OCF to EBITDA increased to 109% vs. 80% in FY20 owing to
superior cash realization on working capital management.
From FY17-FY21, the company generated a total OCF of Rs 2,912 Cr and 23% of total OCF (Rs 674 Cr) was utilized towards the
company’s Capex program, indicating a normal Capex intensity. While CFO remained the major source of funding for the company,
it generated an FCF of Rs 2,238 Cr during FY17-FY21.
Cash Conversion Cycle
Particulars FY20 FY21 Change Comments/Analysis
Inventory Days 60 42 -18 Inventory days decreased due to strict control on procurement.
Trade Receivables 8 4 -4 Receivable days decreased due to superior collection and strict credit terms.
Trade Payables 68 53 -15 Trade payable days decreased on account of tightening of credit terms.
Cash Conversion Cycle 0 -6 Overall CCC decreased to -6 days as the company achieved superior WC management during the year.
Source: Company; Axis Securities
Exhibit 14: Cash Conversion Cycle
Source: Company, Axis Securities
11 10 10 8 4
49 4740
60
4247 48
66 68
53
14 10
-16
0-6-20
0
20
40
60
80
FY17 FY18 FY19 FY20 FY21
Cash Conversion Cycle
Trade Receivable Days Inventory Days Trade Payable Days Cas Coversion Cycle
14
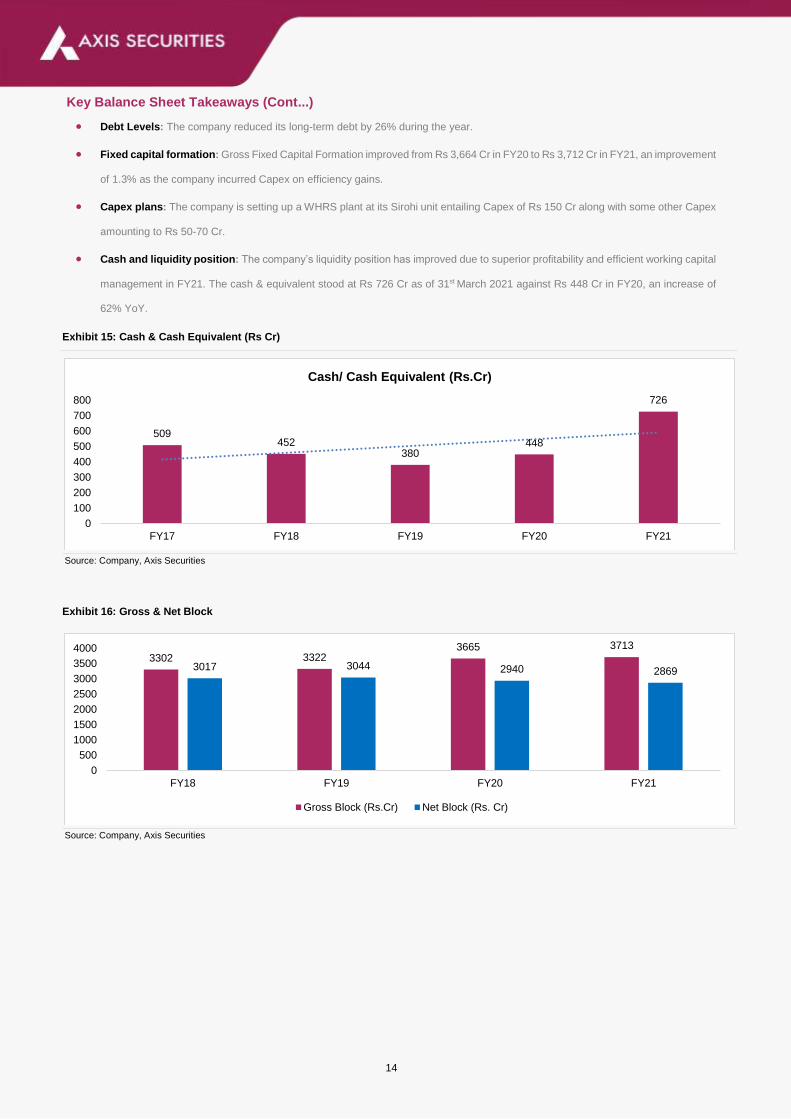
Key Balance Sheet Takeaways (Cont...)
Debt Levels: The company reduced its long-term debt by 26% during the year.
Fixed capital formation: Gross Fixed Capital Formation improved from Rs 3,664 Cr in FY20 to Rs 3,712 Cr in FY21, an improvement
of 1.3% as the company incurred Capex on efficiency gains.
Capex plans: The company is setting up a WHRS plant at its Sirohi unit entailing Capex of Rs 150 Cr along with some other Capex
amounting to Rs 50-70 Cr.
Cash and liquidity position: The company’s liquidity position has improved due to superior profitability and efficient working capital
management in FY21. The cash & equivalent stood at Rs 726 Cr as of 31st March 2021 against Rs 448 Cr in FY20, an increase of
62% YoY.
Exhibit 15: Cash & Cash Equivalent (Rs Cr)
Source: Company, Axis Securities
Exhibit 16: Gross & Net Block
Source: Company, Axis Securities
509452
380448
726
0
100
200
300
400
500
600
700
800
FY17 FY18 FY19 FY20 FY21
Cash/ Cash Equivalent (Rs.Cr)
3302 33223665 3713
3017 3044 2940 2869
0
500
1000
1500
2000
2500
3000
3500
4000
FY18 FY19 FY20 FY21
Gross Block (Rs.Cr) Net Block (Rs. Cr)

15
Forex Analysis
The company uses foreign currency denominated borrowings and foreign exchange forward contracts (including options contracts -
seagull structure) to manage some of its transaction exposures. The foreign exchange forward contracts and foreign exchange
option contracts are not designated as cash flow hedges and are entered into for periods consistent with foreign currency exposure
of the underlying transactions, generally from 1 to 36 months.
Particulars (Rs Cr) FY20 FY21 Change Comments/Analysis*
USD (Forward) 33.68 14.68 19.00 NA
EUR (Forward) 0.00 6.70 6.70 NA
USD (Option) 0.00 97.20 97.20 NA
Total Exposure 33.68 118.58 84.9 NA
Foreign currency exposure not hedged At Balance Sheet date
Suppliers Credit 90.20 0.00 90.20
Hedge Book 33.68 118.58 -
% Exposure Hedged 27% 100% -
Source: Company; Axis Securities; Since Forex exposure of the company is low, no specific comments are required.
Contingent Liability Analysis
Particulars (Rs Cr) FY20 FY21 Change Comments/Analysis
Service Tax 10.22 9.83 0.39 No provision has been made based on the legal opinion gathered by the company.
Sales Tax & interest 149.56 151.46 1.9 The matter is pending in court.
Income Tax 6.06 6.62 0.56 Appeals are pending, no provision has been made.
Excise Duty 1.83 1.83 0.00 No provision has been made.
Other Matters 12.48 17.61 5.13 Based on the legal opinion, no provision has been made
Total 180.15 187.35 7.20 Any adverse decision in the above cases may impact the operational performance of the company.
Source: Company; Axis Securities

16
Related Party Transaction Analysis
Particulars (Rs Cr) FY20 FY21 Change Comments/Analysis
Udaipur Cement Works Ltd 6.0 4.5 -1.6 Purchase of clinkers in the normal course of business
Udaipur Cement Works Ltd 230.2 205.7 -24.5 Purchase of cement in the normal course of business
Udaipur Cement Works Ltd 177.3 298.9 121.6 Sale of cement in the normal course of business
Udaipur Cement Works Ltd 100.0 270.0 170. Corporate guarantee by the company to the bank for sanctioning term loan
Source: Company; Axis Securities
Note: All transactions with Udaipur cement Works Ltd. have been disclosed irrespective of whether they are covered under Section 188 of the Companies Act, 2013 or not.
No advance was paid for any transaction mentioned above.

17
Key Cash Flow Takeaways
Particulars (Rs Cr) FY20 FY21 Change Comments/Analysis
PBT 340 497 46% PBT was higher due to superior operating performance and higher realization during the year.
Non-cash expenses
Depreciation 188 194 3% Depreciation was higher as some new assets were commissioned.
Finance Cost 164 142 -13% Finance cost was lower owing to the repayment of debt and lower interest costs.
Others -69 -88 27% Increased due to higher interest income and other adjustments.
Working Capital Adjustments -35.9 173 121% Stringent working capital management improved capital flow during the year.
CFO 541 862 59% Higher YoY owing to superior operating performance and efficient WC management.
CFI -158 -327 106% Higher owing to investments in the mutual funds and PPE during the year.
CFF -369 -490 33% Higher due to the repayment of debt.
Capex -92 -126 37% Higher as some Capex projects are underway
Free Cash Flow Generation 449 736 64% Higher YoY owing to superior operating performance and WC management.
Source: Company; Axis Securities
Exhibit 17: OCF, Capex, FCF Trend (in Cr)
Source: Company, Axis Securities
Exhibit 18: OCF, EBITDA, and Conversion ratio trend (Cr)
Source: Company, Axis Securities
363456
689
541
862
-127 -138 -191-92 -126
236319
499 449
736
-400
-200
0
200
400
600
800
1000
FY17 FY18 FY19 FY20 FY21
OCF Capex FCF
363456
689
541
862
365411 415
672
790
99%111%
166%
80%
109%
0%
40%
80%
120%
160%
200%
0
200
400
600
800
1000
FY17 FY18 FY19 FY20 FY21
OCF EBITDA Conversion Ratio

18
Corporate Social Responsibility
The company’s CSR vision clearly states to strengthen community relationships and to bring sustainable change in the quality of life
of neighbourhood communities through innovative solutions in Education, Health, Water & Sanitation, Skills Development, Livelihood
Promotion and Rural Development.
The company responded to the unprecedented crisis caused by the Covid-19 pandemic by undertaking several initiatives for the
local communities and migrants' workers in collaboration with local panchayats and district administration across its plant locations
as well as in the marketing zones. A large number of food kits, sanitisers, cotton masks, and hand wash were distributed to the
needy families as well as sessions and meetings were organized to create awareness on COVID-19. Several temperature guns,
sanitisers, masks and hand gloves were provided to the frontline “Corona Warriors”- Govt. ANMs & ASHA Workers. In addition, the
company also proactively responded to this national emergency and donated about Rs 1 Cr to the ‘Prime Minister Citizen Assistance
and Relief in Emergency Situations Fund’ (PM CARES Fund) to support GOI initiatives to fight the pandemic.
The company took several CSR initiatives to reduce maternal and infants mortality; the organized number of medical camps for the
poor and marginalized communities; provided bridge and remedial classes to out-of-school and school drop-out children to bring
them to the mainstream government schools; supported government schools for improvement of physical and classroom
infrastructure and facilities; provided various kinds of support to students, and continued its support to school working for Special
Children and their families. Many students were provided scholarships to support their education at a time when the pandemic had
hit their family’s income.
The various CSR projects have been able to bring qualitative changes in the lives of the community around the plant location. One
of the key impacts has been the empowerment of women due to improvement in their income resulting in their higher familial and
societal status.
On the livelihoods front, the company undertook multiple on-farm and off-farm initiatives and skills training to improve the family’s
income. Training for agriculture and cattle improvement helped beneficiaries improve their income through the adoption of scientific
processes.
Corporate Governance Philosophy
Corporate Governance is an integral part of values, ethics, and best business practices followed by the company. The core values
of the company are a) Commitment to excellence and customer satisfaction b) Maximising long term shareholders’ value c) Socially
valued enterprise, and d) Caring for people and the environment.
All corporate governance initiatives are undertaken by the company by adhering to the sound principles of integrity, transparency,
professionalism, trusteeship, accountability, and corporate responsibility. The Board operates within the framework of a well-defined
responsibility matrix which enables it to discharge its fiduciary duties of safeguarding the interest of the company and to treat all its
stakeholders fairly and transparently.

19
Financials (Standalone)
Profit & Loss (Rs Cr)
Y/E Mar, Rs Cr FY21 FY22E FY23E
Net sales 4385 5084 5301
Other operating income 0 0 0
Total income 4385 5084 5301
Raw Material 1084 1152 1199
Power & Fuel 780 1011 1052
Freight & Forwarding 883 1040 1082
Employee benefit expenses 327 343 364
Other Expenses 521 600 636
EBITDA 790 937 969
Other income 74 98 98
PBIDT 864 1035 1067
Depreciation 194 208 217
Interest & Fin Chg. 143 114 97
E/o income / (Expense) 0 0 0
Pre-tax profit 528 714 754
Tax provision 133 236 249
Minority Interests
Associates 0 0 0
RPAT 395 478 505
Other Comprehensive Income 0 0 0
APAT after Comprehensive Income 395 478 505
Source: Company, Axis Securities
Balance Sheet (Rs Cr)
Y/E Mar, Rs Cr FY21 FY22E FY23E
Total assets 4661 4999 5330
Net Block 2869 2787 2702
CWIP 228 28 28
Investments 383 383 383
Wkg. cap. (excl cash) -27 -22 -22
Cash / Bank balance 359 421 437
Misc. Assets 85 140 180
Capital employed 4661 4999 5330
Equity capital 59 59 59
Reserves 2020 2454 2915
Minority Interests 0 0 0
Borrowings 1040 840 690
Def tax Liabilities 2 0 0
Other Liabilities and Provision 1540 1646 1666
Source: Company, Axis Securities

20
Cash Flow (Rs Cr)
Y/E Mar, Rs Cr FY21 FY22E FY23E
Profit before tax 528 714 754
Depreciation 194 208 217
Interest Expenses 143 114 97
Non operating/ EO item -88 -98 -98
Change in W/C 174 -5 1
Income Tax -87 -236 -249
Operating Cash Flow 862 696 721
Capital Expenditure -126 -127 -133
Investments -284 -250 -380
Others 82 100 98
Investing Cash Flow -328 -277 -414
Borrowings -346 -200 -150
Interest Expenses -144 -114 -97
Dividend paid 0 -44 -44
Financing Cash Flow -491 -358 -291
Change in Cash 44 61 16
Opening Cash 2 46 107
Closing Cash 46 107 123
Source: Company, Axis Securities
21
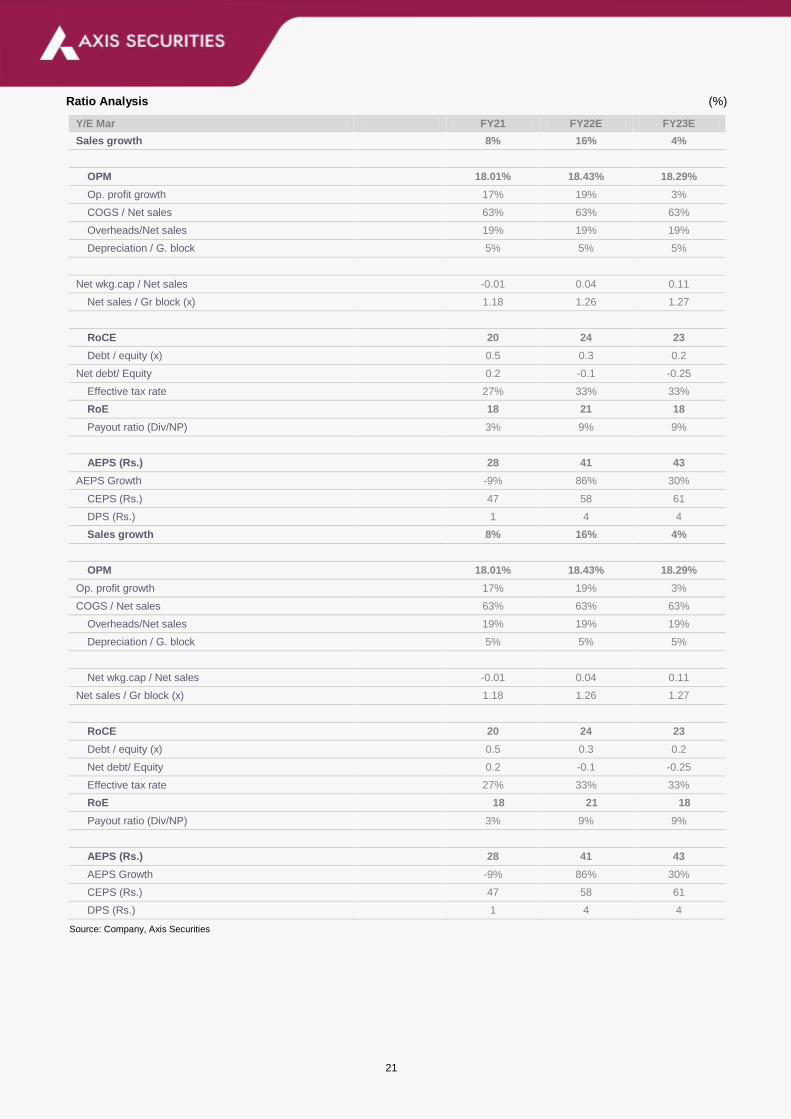
Ratio Analysis (%)
Y/E Mar FY21 FY22E FY23E
Sales growth 8% 16% 4%
OPM 18.01% 18.43% 18.29%
Op. profit growth 17% 19% 3%
COGS / Net sales 63% 63% 63%
Overheads/Net sales 19% 19% 19%
Depreciation / G. block 5% 5% 5%
Net wkg.cap / Net sales -0.01 0.04 0.11
Net sales / Gr block (x) 1.18 1.26 1.27
RoCE 20 24 23
Debt / equity (x) 0.5 0.3 0.2
Net debt/ Equity 0.2 -0.1 -0.25
Effective tax rate 27% 33% 33%
RoE 18 21 18
Payout ratio (Div/NP) 3% 9% 9%
AEPS (Rs.) 28 41 43
AEPS Growth -9% 86% 30%
CEPS (Rs.) 47 58 61
DPS (Rs.) 1 4 4
Source: Company, Axis Securities

22
JK Lakshmi Cement Chart and Recommendation History
Date Reco TP Research 20-Oct-20 BUY 339 Initiating Coverage
09-Nov-20 BUY 370 Result Update
03-Feb-21 BUY 400 Result Update
24-May-21 BUY 590 Result Update
30-Jul-21 BUY 770 Result Update
11-Aug-21 BUY 770 AAA
Source: Axis Securities
(Rs)

23
About the analyst
Analyst: Uttam Kumar Srimal
Email: [email protected]
Sector: cement/Infra
Analyst Bio: Uttam K Srimal is PGDBF from NMIMS with 20 years of experience in Equity
Market/Research.
About the analyst
Analyst: Shikha Doshi
Email: [email protected]
Sector: Cement/Infra
Analyst Bio: Shikha Doshi is Master of Science in Finance from Illinois Institute of Technology, Chicago,
currently handling Cement/infra sector.
Disclosures:
The following Disclosures are being made in compliance with the SEBI Research Analyst Regulations 2014 (herein after referred to as the Regulations).
1. Axis Securities Ltd. (ASL) is a SEBI Registered Research Analyst having registration no. INH000000297. ASL, the Research Entity (RE) as defined in
the Regulations, is engaged in the business of providing Stock broking services, Depository participant services & distribution of various financial products.
ASL is a subsidiary company of Axis Bank Ltd. Axis Bank Ltd. is a listed public company and one of India’s largest private sector bank and has its various
subsidiaries engaged in businesses of Asset management, NBFC, Merchant Banking, Trusteeship, Venture Capital, Stock Broking, the details in respect
of which are available on www.axisbank.com.
2. ASL is registered with the Securities & Exchange Board of India (SEBI) for its stock broking & Depository participant business activities and with the
Association of Mutual Funds of India (AMFI) for distribution of financial products and also registered with IRDA as a corporate agent for insurance business
activity.
3. ASL has no material adverse disciplinary history as on the date of publication of this report.
4. I/We, Uttam Srimal, (MBA - Finance) and Shikha Doshi (Master of Science in Finance), author/s and the name/s subscribed to this report, hereby
certify that all of the views expressed in this research report accurately reflect my/our views about the subject issuer(s) or securities. I/We (Research
Analyst) also certify that no part of my/our compensation was, is, or will be directly or indirectly related to the specific recommendation(s) or view(s) in this
report. I/we or my/our relative or ASL does not have any financial interest in the subject company. Also I/we or my/our relative or ASL or its Associates
may have beneficial ownership of 1% or more in the subject company at the end of the month immediately preceding the date of publication of the
Research Report. Since associates of ASL are engaged in various financial service businesses, they might have financial interests or beneficial ownership
in various companies including the subject company/companies mentioned in this report. I/we or my/our relative or ASL or its associate does not have
any material conflict of interest. I/we have not served as director / officer, etc. in the subject company in the last 12-month period.Any holding in stock –
No
5. 5. ASL has not received any compensation from the subject company in the past twelve months. ASL has not been engaged in market making activity for
the subject company.
6. In the last 12-month period ending on the last day of the month immediately preceding the date of publication of this research report, ASL or any of its
associates may have:
Received compensation for investment banking, merchant banking or stock broking services or for any other services from the subject company of this research
report and / or;
Managed or co-managed public offering of the securities from the subject company of this research report and / or;
Received compensation for products or services other than investment banking, merchant banking or stock broking services from the subject company of this
research report;
ASL or any of its associates have not received compensation or other benefits from the subject company of this research report or any other third-party in
connection with this report.
Term& Conditions:
This report has been prepared by ASL and is meant for sole use by the recipient and not for circulation. The report and information contained herein is strictly confidential and may not
be altered in any way, transmitted to, copied or distributed, in part or in whole, to any other person or the media or reproduced in any form, without prior written consent of ASL. The report
is based on the facts, figures and information that are considered true, correct, reliable and accurate. The intent of this report is not recommendatory in nature. The information is obtained
from publicly available media or other sources believed to be reliable. Such information has not been independently verified and no guaranty, representation of warranty, express or
implied, is made as to its accuracy, completeness or correctness. All such information and opinions are subject to change without notice. The report is prepared solely for informational
purpose and does not constitute an offer document or solicitation of offer to buy or sell or subscribe for securities or other financial instruments for the clients. Though disseminated to all
the customers simultaneously, not all customers may receive this report at the same time. ASL will not treat recipients as customers by their receiving this report.
24
Disclaimer:
Nothing in this report constitutes investment, legal, accounting and tax advice or a representation that any investment or strategy is suitable or appropriate to the recipient’s
specific circumstances. The securities and strategies discussed and opinions expressed, if any, in this report may not be suitable for all investors, who must make their
own investment decisions, based on their own investment objectives, financial positions and needs of specific recipient.
This report may not be taken in substitution for the exercise of independent judgment by any recipient. Each recipient of this report should make such investigations as it
deems necessary to arrive at an independent evaluation of an investment in the securities of companies referred to in this report (including the merits and risks involved),
and should consult its own advisors to determine the merits and risks of such an investment. Certain transactions, including those involving futures, options and other
derivatives as well as non-investment grade securities involve substantial risk and are not suitable for all investors. ASL, its directors, analysts or employees do not take
any responsibility, financial or otherwise, of the losses or the damages sustained due to the investments made or any action taken on basis of this report, including but
not restricted to, fluctuation in the prices of shares and bonds, changes in the currency rates, diminution in the NAVs, reduction in the dividend or income, etc. Past
performance is not necessarily a guide to future performance. Investors are advice necessarily a guide to future performance. Investors are advised to see Risk Disclosure
Document to understand the risks associated before investing in the securities markets. Actual results may differ materially from those set forth in projections. Forward-
looking statements are not predictions and may be subject to change without notice.
ASL and its affiliated companies, their directors and employees may; (a) from time to time, have long or short position(s) in, and buy or sell the securities of the
company(ies) mentioned herein or (b) be engaged in any other transaction involving such securities or earn brokerage or other compensation or act as a market maker
in the financial instruments of the company(ies) discussed herein or act as an advisor or investment banker, lender/borrower to such company(ies) or may have any other
potential conflict of interests with respect to any recommendation and other related information and opinions. Each of these entities functions as a separate, distinct and
independent of each other. The recipient should take this into account before interpreting this document.
ASL and / or its affiliates do and seek to do business including investment banking with companies covered in its research reports. As a result, the recipients of this report
should be aware that ASL may have a potential conflict of interest that may affect the objectivity of this report. Compensation of Research Analysts is not based on any
specific merchant banking, investment banking or brokerage service transactions. ASL may have issued other reports that are inconsistent with and reach different
conclusion from the information presented in this report. The Research reports are also available & published on AxisDirect website.
Neither this report nor any copy of it may be taken or transmitted into the United State (to U.S. Persons), Canada, or Japan or distributed, directly or indirectly, in the
United States or Canada or distributed or redistributed in Japan or to any resident thereof. If this report is inadvertently sent or has reached any individual in such country,
especially, USA, the same may be ignored and brought to the attention of the sender. This report is not directed or intended for distribution to, or use by, any person or
entity who is a citizen or resident of or located in any locality, state, country or other jurisdiction, where such distribution, publication, availability or use would be contrary
to law, regulation or which would subject ASL to any registration or licensing requirement within such jurisdiction. The securities described herein may or may not be
eligible for sale in all jurisdictions or to certain category of investors.
The Disclosures of Interest Statement incorporated in this document is provided solely to enhance the transparency and should not be treated as endorsement of the
views expressed in the report. The Company reserves the right to make modifications and alternations to this document as may be required from time to time without any
prior notice. The views expressed are those of the analyst(s) and the Company may or may not subscribe to all the views expressed therein.
Copyright in this document vests with Axis Securities Limited.
Axis Securities Limited, Corporate office: Unit No. 2, Phoenix Market City, 15, LBS Road, Near Kamani Junction, Kurla (west), Mumbai-400070, Tel No. – 022-40508080/
022-61480808, Regd. off.- Axis House, 8th Floor, Wadia International Centre, PandurangBudhkar Marg, Worli, Mumbai – 400 025. Compliance Officer: AnandShaha,
Email: [email protected], Tel No: 022-42671582.SEBI-Portfolio Manager Reg. No. INP000000654
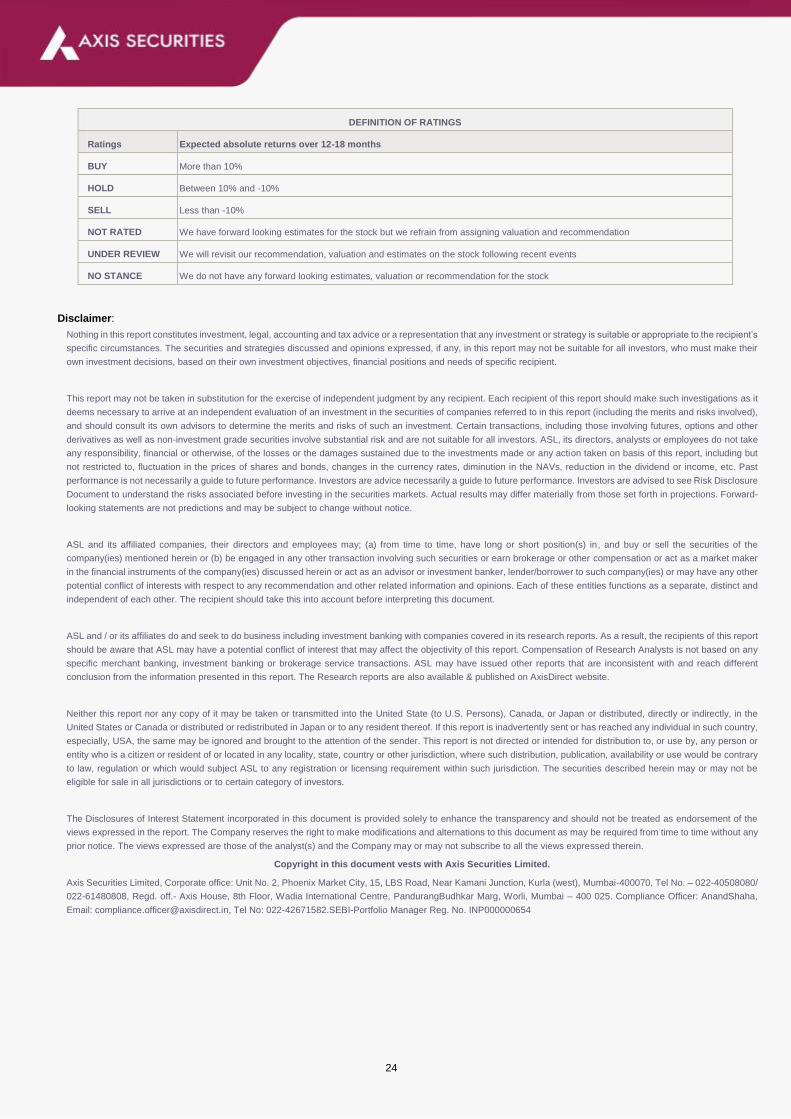
DEFINITION OF RATINGS
Ratings Expected absolute returns over 12-18 months
BUY More than 10%
HOLD Between 10% and -10%
SELL Less than -10%
NOT RATED We have forward looking estimates for the stock but we refrain from assigning valuation and recommendation
UNDER REVIEW We will revisit our recommendation, valuation and estimates on the stock following recent events
NO STANCE We do not have any forward looking estimates, valuation or recommendation for the stock


![k jk;iqj MsOgyiesaV vFkkWfjVh] u](https://static.fdokumen.com/doc/165x107/6322d92d117b4414ec0c1209/k-jkiqj-msogyiesav-vfkkwfjvh-u.jpg)