![k jk;iqj MsOgyiesaV vFkkWfjVh] u](https://static.fdokumen.com/doc/165x107/6322d92d117b4414ec0c1209/k-jkiqj-msogyiesav-vfkkwfjvh-u.jpg)
JK Cement Ltd - Axis Direct
26
O JK Cement Ltd
-
Upload
khangminh22 -
Category
Documents
-
view
1 -
download
0
Transcript of JK Cement Ltd - Axis Direct
O
ACC Limited
JK Cement Ltd

Axis Annual Analysis
20th Sept, 2021
HOLD
Target Price
3330
JK Cement Ltd Cement
1
New Capacity Ramp-Up Delivers Impressive Growth; Maintain HOLD
Summary
JK Cement completed expansion of grey cement capacity of 4.2 mtpa at various locations in the last couple of years. It also completed wall putty expansion at its Katni plant, taking total Grey and White cement capacity to 17.2 million tonnes per annum (mtpa) (As of 31st March 2021)
The company witnessed encouraging market share growth in its premium products, especially in Superstrong and Weathershield.
The company announced a greenfield capacity expansion of 4 mtpa. This includes a 2 mtpa grinding unit at Panna, MP and a 2 mtpa split grinding unit at Hamirpur, UP along with 8000 TPD clinker capacity with a 22 MW WHRS plant. The total Capex for these projects would be ~Rs 2,950 Cr. This facility is expected to get operational by March,2023. Furthermore, its line 3 upgradation at the Nimbahera plant is expected to be completed in FY22.
Key Highlights
In FY21, JK Cement registered cement sales volume of 12.04 mtpa, up 18% over FY20 levels of 10.24 mtpa. The growth was driven by a superior demand environment in both trade as well as non-trade segments in H2FY21 and the new capacity ramp-up during the year.
The company’s EBITDA Margins stood at 23.3% in FY21 against 20.9% in FY20, registering a growth of 240bps. The expansion was driven by product mix optimization, prudent market mix, and cost-efficiency initiatives undertaken by the company during the year.
The company implemented several measures to improve efficiencies and leverage input cost levers across the value chain.
The company generated a healthy cash flow of Rs 1590 Cr during the year, enabling it to reduce its net Debt/EBITDA to 1.4x in FY21 from 2.2x in FY20.
Key competitive strengths
a) Capacity to produce both Grey and White cement as well as Wall Putty, enabling it to capture changing customer preferences; b) Robust sales & distribution network facilitating extensive customer reach; c) Strengthening financial position, d) Experienced and competent management bandwidth, and e) Improving traction in the Premium and value-added products, aiding margin profile of the company.
Strategies implemented
a) Focused on growth while maintaining margins; b) Improved efficiency through technological upgradation, process optimization, and productivity enhancements; c) Strengthened market reach through capacity building; d) Diversified revenue stream further by launching new products as per prevailing market needs; e) Broad-based ESG commitments to enhance operating sustainability. These initiatives enabled the company to record superior performance during an otherwise challenging year led by the Covid-19 disruptions.
Growth drivers
a) Housing for All, b) Real Estate Growth, c) The government’s keen focus on infrastructure development including roads, highways, metros, airports, and irrigation and water projects, d) Increasing rural Income, and e) The government’s supporting policies.
Key focus areas going ahead
a) Capacity expansion to further strengthen market reach, b) Improving operational efficiency at all levels, c) Consolidating market position, d) Widen visibility by augmenting distribution network while optimizing distribution cost, e) Launching value-added products to improve margin profile, and f) Strengthening business stickiness through customer-centricity.
Outlook & Recommendation
We expect the company to deliver Volume/Revenue/EBITDA/APAT growth of 10%/13%/16%/22% CAGR over FY21-23. This will be led by higher cement demand in its operating regions, superior product mix supporting higher realizations, the introduction of margin accretive value-added products, and efficiency gains. The stock is currently trading at 17x and 14x FY22E and FY23E EV/EBITDA. We value JKCL at 13.5x FY23E EV/EBITDA and assign a HOLD rating to the company.
Key Financials
(Rs Cr) FY21 FY22E FY23E
Net Sales 6606 7496 8413
EBITDA 1539 1669 2079
Net Profit 710 819 1051
EPS (Rs) 91 105 135
PER (x) 31 33 25
EV/EBITDA (x) 16 17 14
P/BV (x) 5.87 5.98 4.92
ROE (%) 21 20 21
Source: Company, Axis Research
(CMP as of 17th Sep, 2021)
CMP (Rs) 3379 146
Upside /(Downside (%)) (-1%) 23%
High/Low (Rs) 3700/1460 153/56
Market cap (Cr) 26234 3012
Avg. daily vol. (6m) Shrs. 45,877 1152304
No. of shares (Cr) 7.73 20.5
Shareholding (%)
Dec-20 Mar-21 June-21
Promoter 57.74 57.65 57.63
FIIs 15.44 16.86 16.9
MFs / UTI 19.94 18.86 18.93
Banks / FIs 0.01 0.01 0.01
Others 6.87 6.62 6.53
Financial & Valuations
Y/E Mar (Rs. Cr) FY21 FY22E FY23E
Net Sales 6606 7496 8413
EBITDA 1539 1669 2079
Net Profit 710 819 1051
EPS (Rs.) 91 105 135
PER (x) 31 33 25
EV/EBITDA (x) 16 17 14
P/BV (x) 5.87 5.98 4.92
ROE (%) 21 20 21
Change in Estimates (%)
Y/E Mar FY22E FY23E
Sales -1 2 EBITDA -4 2
PAT -2 3
ESG disclosure Score**
Environmental Disclosure Score 34
Social Disclosure Score 28
Governance Disclosure Score 64
Total ESG Disclosure Score 40
Source: Bloomberg, Scale: 0.1-100 **Note: This score measures the amount of ESG data a company reports publicly and does not measure the company's performance on any data point. All scores are based on 2020 disclosures
Relative performance
Source: Capitaline, Axis Securities
25
75
125
175
225
275
325
Jan-20 Jun-20 Nov-20 Apr-21 Sep-21
J K Cements BSE Sensex
Uttam K Srimal Research Analyst
Email: [email protected]
Shikha Doshi Research Analyst
Email: [email protected]
2
Company Overview
JK cement (JKCL) is a dominant player in the cement industry in its key markets of North, Central, and South India and derives the majority
of its revenue from these regions. The company has over four decades of experience in cement manufacturing. Its operations commenced
in May 1975 with commercial production at its first grey cement plant at Nimbahera, Rajasthan. Subsequently, the company set up 2 more
units at Mangrol and Gotan in Rajasthan and in 2009, it extended its footprint by setting up a green-field unit in Muddapur, Karnataka which
gave the company access to the south-west Indian markets. The company further expanded its capacity in North India in 2014 with a
brownfield expansion of 1.5 mntpa integrated unit at Mangrol and a split grinding unit of 1.5 mntpa at Jhajjar. In FY21, JK Cement completed
an expansion of 4.2 mntpa grey cement capacity and today, it has an installed grey cement capacity of 14.7 MTPA and White cement and a
Wall Putty capacity of 2.5 MTPA, making it one of the largest cement manufacturers in the country.
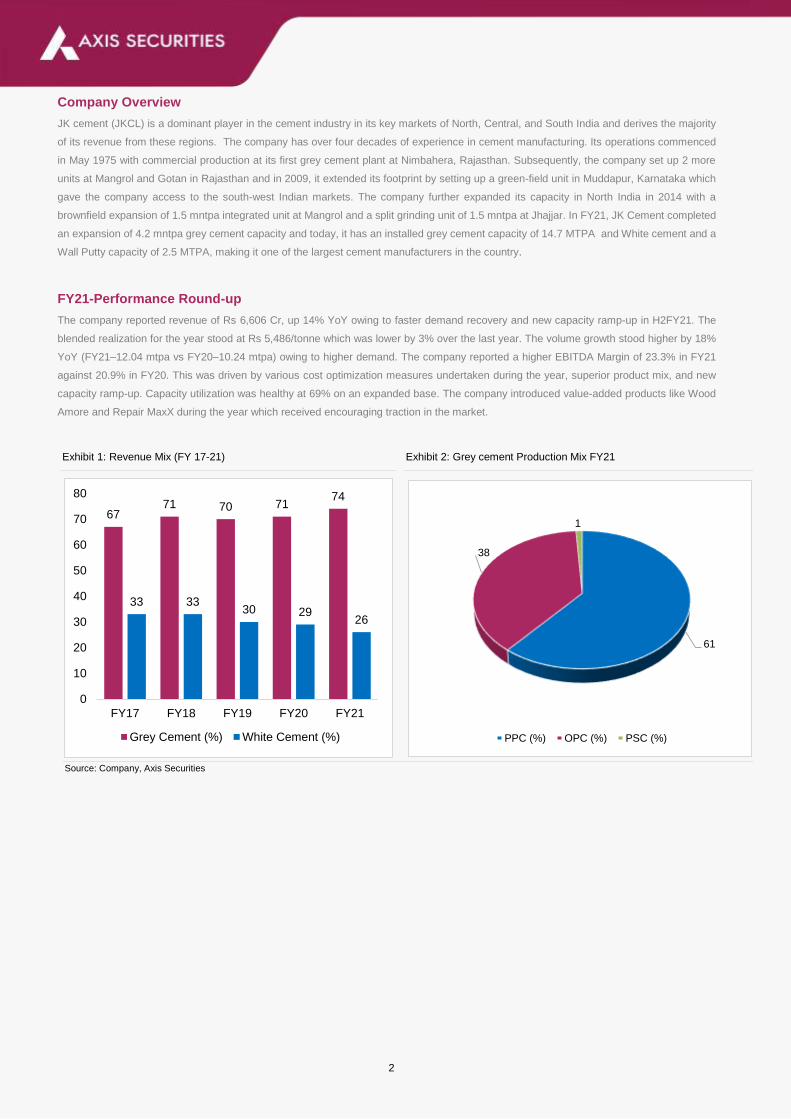
FY21-Performance Round-up
The company reported revenue of Rs 6,606 Cr, up 14% YoY owing to faster demand recovery and new capacity ramp-up in H2FY21. The
blended realization for the year stood at Rs 5,486/tonne which was lower by 3% over the last year. The volume growth stood higher by 18%
YoY (FY21–12.04 mtpa vs FY20–10.24 mtpa) owing to higher demand. The company reported a higher EBITDA Margin of 23.3% in FY21
against 20.9% in FY20. This was driven by various cost optimization measures undertaken during the year, superior product mix, and new
capacity ramp-up. Capacity utilization was healthy at 69% on an expanded base. The company introduced value-added products like Wood
Amore and Repair MaxX during the year which received encouraging traction in the market.
Exhibit 1: Revenue Mix (FY 17-21) Exhibit 2: Grey cement Production Mix FY21
Source: Company, Axis Securities
6771 70 71
74
33 3330 29
26
0
10
20
30
40
50
60
70
80
FY17 FY18 FY19 FY20 FY21
Grey Cement (%) White Cement (%)
61
38
1
PPC (%) OPC (%) PSC (%)
3
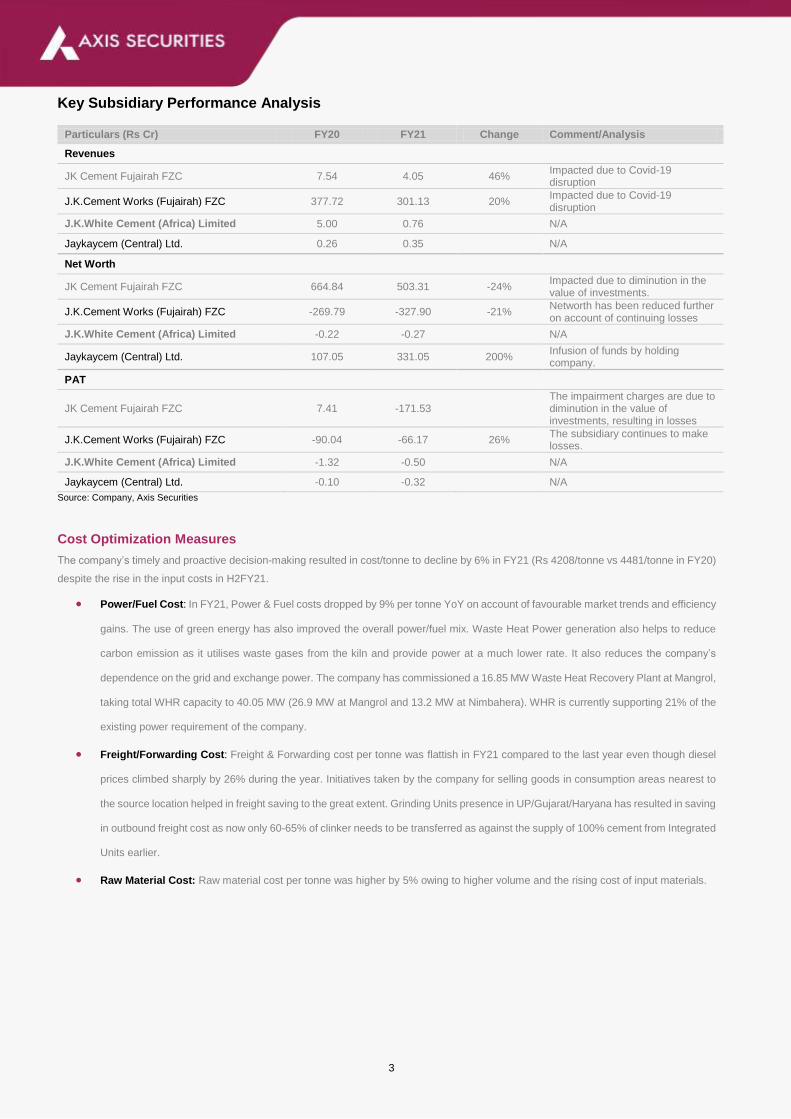
Key Subsidiary Performance Analysis
Particulars (Rs Cr) FY20 FY21 Change Comment/Analysis
Revenues
JK Cement Fujairah FZC 7.54 4.05 46% Impacted due to Covid-19 disruption
J.K.Cement Works (Fujairah) FZC 377.72 301.13 20% Impacted due to Covid-19 disruption
J.K.White Cement (Africa) Limited 5.00 0.76 N/A
Jaykaycem (Central) Ltd. 0.26 0.35 N/A
Net Worth
JK Cement Fujairah FZC 664.84 503.31 -24% Impacted due to diminution in the value of investments.
J.K.Cement Works (Fujairah) FZC -269.79 -327.90 -21% Networth has been reduced further on account of continuing losses
J.K.White Cement (Africa) Limited -0.22 -0.27 N/A
Jaykaycem (Central) Ltd. 107.05 331.05 200% Infusion of funds by holding company.
PAT
JK Cement Fujairah FZC 7.41 -171.53 The impairment charges are due to diminution in the value of investments, resulting in losses
J.K.Cement Works (Fujairah) FZC -90.04 -66.17 26% The subsidiary continues to make losses.
J.K.White Cement (Africa) Limited -1.32 -0.50 N/A
Jaykaycem (Central) Ltd. -0.10 -0.32 N/A
Source: Company, Axis Securities
Cost Optimization Measures
The company’s timely and proactive decision-making resulted in cost/tonne to decline by 6% in FY21 (Rs 4208/tonne vs 4481/tonne in FY20)
despite the rise in the input costs in H2FY21.
Power/Fuel Cost: In FY21, Power & Fuel costs dropped by 9% per tonne YoY on account of favourable market trends and efficiency
gains. The use of green energy has also improved the overall power/fuel mix. Waste Heat Power generation also helps to reduce
carbon emission as it utilises waste gases from the kiln and provide power at a much lower rate. It also reduces the company’s
dependence on the grid and exchange power. The company has commissioned a 16.85 MW Waste Heat Recovery Plant at Mangrol,
taking total WHR capacity to 40.05 MW (26.9 MW at Mangrol and 13.2 MW at Nimbahera). WHR is currently supporting 21% of the
existing power requirement of the company.
Freight/Forwarding Cost: Freight & Forwarding cost per tonne was flattish in FY21 compared to the last year even though diesel
prices climbed sharply by 26% during the year. Initiatives taken by the company for selling goods in consumption areas nearest to
the source location helped in freight saving to the great extent. Grinding Units presence in UP/Gujarat/Haryana has resulted in saving
in outbound freight cost as now only 60-65% of clinker needs to be transferred as against the supply of 100% cement from Integrated
Units earlier.
Raw Material Cost: Raw material cost per tonne was higher by 5% owing to higher volume and the rising cost of input materials.

4
Key growth drivers
Housing for all: The Pradhan Mantri Awas Yojana (PMAY) was launched in 2015 to provide ‘Housing for All’ by 2022. Under the
scheme, 10 Mn urban houses have been sanctioned, out of which, construction of 4.2 Mn houses has already been completed (as
of January 25, 2021). India continues to be the second-largest cement market in the world, both in terms of production and
consumption. However, the country’s per-capita cement consumption stands significantly lower at 235 kg vis-à-vis the global average
of over Rs 500 kg, indicating significant growth headroom available for the industry.
Real-Estate: The Indian real estate market is projected to reach $1 Tn by 2023 and attracted a massive estimated investment of Rs
46,000 Cr ($6.5 Bn) in FY20. Furthermore, lower home loan interest rates have considerably improved the affordability of urban
housing. This coupled with the increasing work-from-home trend, the real estate market in the Tier-1 cities is likely to gain
encouraging traction moving ahead. Rural and affordable housing, too, is expected to continue supporting the demand and boost
the cement industry going forward.
Infrastructure: The infrastructure sector is a pivotal contributor to the construction sector’s order book and an ambitious National
Infrastructure Project (NIP) launched by the government is expected to provide a significant boost to the construction industry.
Projects such as Bharatmala Pipeline, Metro and Railway projects in key cities such as Mumbai, Bangalore, Chennai, and
Ahmedabad, and National Airport projects are expected to aid in construction activities. These activities have resumed in recent
months, providing further thrust to the cement demand.
National Infrastructure Pipeline: The government’s focus on developing infra and housing has gained momentum in the last few
years which can be manifested in the capital outlay earmarked for the infrastructure sector in the Union Budget 2021-22. The National
Infrastructure Pipeline aims to invest 111 Lc Cr by 2025 in multiple projects comprising Transport, Energy, Social and Commercial
infrastructure, Communication, and Water & Sanitation, among others. This, in turn, is expected to provide a significant boost to the
cement demand over the medium to long term.
Rural Income: Higher Minimum Support Price (MSP) and the government’s increasing allocation to various agricultural projects are
improving farming income and thereby the rural economy. Moreover, higher fund allocation to the Mahatma Gandhi National Rural
Employment Guarantee Act (MGNREGA) is supporting enhanced rural income. This will boost construction activities in the rural
area and thereby provide growth impetus to the cement demand.
Exhibit 3: Cement consumption trend segment-wise: Housing remains the largest cement consumer
Source: Company, Axis Securities
55%
10%
22%
13%
0%
10%
20%
30%
40%
50%
60%
Housing Industrial & Commercial Infrastructure Low Cost Housing

5
Key operational activities during the year
Completed expansion projects: The company commissioned a grey cement grinding unit at Balasinor, Gujarat with an
installed capacity of 0.7 mtpa. It also completed 0.3 mtpa wall putty capacity expansion at the Katni plant to meet the growing
demand. With these completed projects, the company’s total plant capacity stands at 0.7 mtpa.
Ongoing Expansion Projects: The company is upgrading its Nimbahera kiln capacity by 1000 tpd which will enhance its
efficiency, reduce power and fuel consumption, and increase waste heat recovery generation. As volumes increase, EBITDA/tonne
for the grey segment will increase as well. The project is expected to complete in Q2FY22.
The company has also embarked on greenfield expansion projects of 4 mtpa capacity at Panna Madhya Pradesh, with a split
grinding unit at Hamirpur, Uttar Pradesh and WHR power generation of 22 MW. Civil work for the project has already started at the
site and orders have been placed for main equipment.
Capital Allocation: The company has completed 4.2 mtpa expansion incurring a Capex of Rs 1,739 Cr till 31 March 2021. The
Nimbahera Line 3 upgradation is also on track and has incurred ~Rs 357 Cr by 31 March 2021. Going forward, the remaining
expenditure of ~Rs 100 Cr will be incurred on these projects during FY22.
Greenfield expansion of 4 mtpa at Panna, Madhya Pradesh with a split grinding unit at Hamirpur, Uttar Pradesh would have a total
Capex of Rs 2,971 Cr and Rs 270 Cr has already been spent till 31st March 2021. Project expenditure would be Rs 800 Cr in FY22,
Rs 1,600 Cr in FY23, and a balance of Rs 300 Cr in FY24. Additional to these capital expenditures, it will incur a sustenance Capex
of ~Rs 250 Cr per annum.
Debt Profile: As of 31st March 2021, the company’s standalone gross debt stood at ~Rs 2,865 Cr and consolidated gross debt at
Rs 3252 Cr. The proposed borrowing for 4 mtpa expansion in the wholly-owned subsidiary would be around Rs 1,700 Cr, out of
which Rs 400 Cr would be drawn in FY22, Rs 1,000 Cr in FY23, and the balance Rs 300 Cr in FY24. The company’s Net
debt/EBITDA declined to 1.4x from 2.2 x in FY20 on the back of healthy cash generation during the year.
Capacity Utilization: Capacity utilization stood 69% during the year on an expanded base against 85% in FY20.

6
Sales and Distribution
Strong distribution network: The company has a strong channel network of over 17,000 plus dealers and retailers for marketing
grey cement products and around 67,000 plus dealers and retailers for marketing White cement products, who promptly and
efficiently serve customers across its markets. It also has a good presence overseas for its White cement business. The company
has established a strong sales & marketing team as well as a technical support team that drives the overall sales. It uses various
digital platforms including a hybrid approach to leverage the online media to generate awareness, leads, and enquiries from
prospective customers.
Strengthening relationships with channel partners: The company has undertaken various initiatives to effectively manage dealer
channel networks to drive growth in its key relevant markets. It has implemented several innovative measures to strengthen
relationships with its channel partners as well. It regularly rewards its top-performing dealers for their excellent performance. In F21,
it conducted virtual meets where channel partners and dealers were felicitated with trophies, certificates and cash prizes.
Improving digital presence: The company embarked upon a Digital Journey a few years back, starting with the automation of
functions such as paperless operations and fine-tuning of processes. In FY21, it stepped up the digital quotient by using the latest
and best technology including robotic process automation, artificial intelligence, smart procurement, and data science tools, among
others. These were suitably supplemented with the use of social media in branding and marketing which is apparent from the
customer coverage through digital channels.

7
Supply Chain & Logistics
The company follows stringent procurement practices to meet the business needs while ensuring a responsible supply chain. It
encourages procurement through vendors who adopt sustainable practices.
The customer-centric business model allows the company to be in tune with the changing needs of customers which enables it to
meet and surpass customer expectations.
The company optimizes logistics through effective and efficient Route planning. It also achieves optimized In-plant operations using
RFID. The company Track and Trace on a real-time basis through GPS enabled application which gives visibility to the customer
as well.
The company has shifted to real-time integration between SAP and third-party Apps through a Digital Access mechanism from
batch data updates previously. This has significantly enhanced customer engagement and cementing the company’s reputation as
a reliable supplier.
The company’s other initiatives include Artificially Intelligent processes including visual and data-based Intelligence training to the
system and Dynamic Dashboards with real-time visibility to decision-makers.
Research & Development
The company believes that R&D is key to consistently provide world-class products to its customers, leveraging which it launches
innovative products to the market. Its R&D drive also helps it exemplify quality and drive sustainability journey forward.
The company’s plants in Nimbahera, Mangrol, and Gotan are equipped with state-of-the-art labs with process control
instrumentations and quality control systems. Its Muddapur facility is equipped with the latest technologies, process control as well
as quality control with Robo lab and Automatic Blain Analyser. The entire plant operations are controlled from a Central Control
Room (CCR) with sophisticated systems including Fuzzy Operations.
The company is investing in R&D initiatives to reduce the use of natural resources in grey cement manufacturing and increase the
share of additives like fly ash and slag in the production process. Additionally, it aims to increase the production of blended cement
in the near future.

8
Key strategies moving forward
Capacity expansion: a) Undergoing capacity expansion of Line No. 3 at Nimbahera, Rajasthan. b) New greenfield expansion at
Panna is on track
Operational efficiency: a) Optimism efficiency as all plants are proximate to raw materials and growth markets. b) Manage
resources through product and technology innovations.
Consolidate market position: a) Fortify the Grey cement segment and enter into unexplored markets. b) Reinforce leadership
position in the White cement business by improving utilization
Widen visibility: a) Enhance brand visibility further through print and online media and consumer promotions. b) Expand and
improve distribution network and engage with key influencer and channel partners.
Launch of value-added products: a) Launch value-added products including Wood paint to be sold on one platform. b) Grow
proposition of value-added products across existing and new markets.
Customer Centricity: a) Meet customers’ rapidly changing expectations and strive to provide a rich customer experience. Supply
quality products at the right price and resolve customer grievances.
Business Outlook
The cement demand in FY21 was almost flat at 328 mntpa and declined further in the Q2CY21, which is the peak construction time, on
account of the nationwide lockdowns. However, post lockdown easing in H2CY21, the cement sector witnessed an uptick in demand, led by
robust rural consumption.
Going forward, the cement industry is expected to rebound with volume growth led by a revival in demand from the housing and infrastructure
sectors along with the timely release of funds as announced in the Union Budget 2021-22. However, the likelihood of COVID 3.0 advent and
rate of vaccination rollout would be key monitorable moving forward.

9
Risks and Mitigation
Key risks identified, assessed, and mitigated during the year under review include:
Market demand/Supply dynamics: Economic growth drives the demand for construction and adverse changes in demand may
impact sales, prices, and eventually industry performance. Furthermore, any behavioural changes in consumer patterns may lead
to an increase in product substitution and thereby affect the company’s revenue growth and profitability.
Mitigation: ~25% of revenues come from the White cement business which mitigates the risk of change in the Grey cement market
scenario and changes in consumer preference as the company is present in both cement types.
Business competition risk: The cement industry is passing through a consolidation phase where big players are acquiring small
and medium players in the industry. Against this backdrop, the Indian cement industry is likely to be dominated by large players
leading to an oligopolistic market. This may hurt competitive intensity among the consolidated players, affecting the company’s
profitability.
Mitigation: The company expanded the business to more regions including central India and increased its grey cement capacity
by establishing split grinding units in Uttar Pradesh and Gujarat. The company has also developed new techniques for efficient
utilization of natural resources such as energy, and water, among others.
Political risk: Economic, social and political instability can influence the cement industry and result in direct and indirect
consequences leading to operational uncertainty. Non-compliance with the regulations may lead to a serious impact on the financial
performance of the company.
Mitigation: The company proactively adheres to directives and state-specific action plans to enhance crisis management. The
company well-diversified product portfolio enables it to reduce the consequences of political risks.
Sustainability risk: Failure to meet the ESG goals may lead to fines and business disruptions. Moreover, controversies may get
escalated leading to damage to the company’s brand reputation.
Mitigation: The company conducts performance assessments and monitoring against the set targets and reporting it regularly,
develops new techniques for efficient utilization of natural resources to maintain a balance between ESG and business performance.
Additionally, it ensures resource efficiency by reducing freshwater withdrawal, rainwater harvesting, and energy efficiency
measures.
Energy Prices risk: Energy price hikes may lead to an increase in production costs and adversely impact the industry.
Consequently, this may affect the pricing of the product and future cash flows of the company.
Mitigation: Driving optimization of fuel mix, energy efficiency, and use of alternative fuel is a key focus area for the company.
Raw materials including minerals risk: Scarcity of natural resources such as limestone, unavailability of fuels for production,
stricter government regulations on consumption of fossil fuel, etc. may hamper normal business processes and affect the whole
supply chain of the company.
Mitigation: The company is undertaking various initiatives such as continually expanding the blended cement portfolio and
utilization of low-grade limestone, Driving the use of alternative materials to conserve natural resources, Utilizing low-quality fuels
as additives to high-quality fuels at the plant to reduce RM risk.
Legal and Compliance Risk: Risk associated with non-compliance to regulations can pose the challenge of lawsuits, monetary
claims, investigations and proceedings. It impacts growth, revenue, employee growth, and the business cycle.
Mitigation: The company is involved in a compliance program that aids in guiding and maintaining the regulations.
Cyber security risk: In the wake of the COVID crisis, the transition to remote location working has exposed the company to a
range of technical and human-centred vulnerabilities, increased risk from cyber-attacks, and operational errors.
Mitigation: The company put policies and procedures in place to protect itself from IT risks. These policies contain corrective
measures to be taken to mitigate any kind of incidents in a time-bound manner.

10
Progress on sustainability
Climate: Key focus areas are energy efficiency and use of clean energy, low-carbon transportation and logistics, resilient and
sustainable built environment.
Environment: Increase use of low-grade limestone while reducing dependency on high-grade limestone in the process and extend
quarry life. Increase green belt of the entire occupied area, Scale-up rainwater harvesting efforts, and Reduce dependency on
groundwater by increasing mine water utilization.
Waste as resources: Increase use of AFR, Increase replacement of virgin raw materials and fuels with alternative raw materials/
other substitutes, Reduce clinker ratio, Increase production of blended cement and fuel.
People & Communities: Key focus areas are skills enhancement, Enhance diversity and inclusiveness, Health & Safety,
Communities, Transport safety.
Profitability Analysis (Rs Cr)
Particulars FY20 FY21 Change Comments/Analysis
Sales 5801 6606 14% Revenue growth was driven by higher volume supported by the new capacity ramp-up during the year.
Raw Materials 871 1070 23% Raw materials costs were higher owing to higher volumes during the year.
Gross Profits 2733 3068 12% Gross Profits were higher due to higher volumes during the year.
Operating Expenses 1520 1529 -0.18% Operating expenses were flat due to savings in fixed costs and efficiency gains.
Interest 276 252 -9% The interest cost was lower owing to the lower interest rate YoY.
EBIT 1010 1345 33% EBIT was higher owing to higher sales and savings in the fixed costs during the year.
PAT 496 708 43% PAT was higher due to the combined impact of the above-mentioned attributes, lower interest costs, and higher other income.
EPS 64.26 92.1 43% EPS increased in line with PAT growth
Source: Company; Axis Securities
Exhibit 5: Volume and Growth trend
Source: Company, Axis Securities
Exhibit 6: Realization/tonne and Growth Trend
Source: Company, Axis Securities
8.219.40 9.99 10.24
12.04
1%
14%
6%
3%
18%
0%
5%
10%
15%
20%
0.00
5.00
10.00
15.00
FY17 FY18 FY19 FY20 FY21
Volume & Volume Growth
Volume(mntpa) Volume growth
4898 5156 5264 5666 5486
5.4% 5%
2.1%
7.6%
-3.2%
-4.0%
-2.0%
0.0%
2.0%
4.0%
6.0%
8.0%
10.0%
4400
4800
5200
5600
6000
2017 2018 2019 2020 2021
Blended Realization/tonne (Rs.) Growth (%)

11
Exhibit 7: Cost/tonne Trend
Source: Company, Axis Securities
Growth Indicators (Rs Cr)
Particulars FY20 FY21 Change Comments/Analysis
Revenue 5801 6606 14% Revenue growth was driven by higher volumes supported by the new capacity ramp-up during the year.
EBITDA 1213 1538 27% EBITDA improved on account of volume and savings in the variable as well as fixed costs as various cost-containment measures paid off well.
PAT 496 708 43% PAT was higher due to the combined impact of the above-mentioned attributes, lower interest costs, and higher other income.
EPS 64.26 92.1 55% EPS increased in line with PAT growth
Volume (mtpa)
10.24 12.04 6% Volumes growth was driven by higher demand in its operating region both from trade and non-trade segments.
Source: Company; Axis Securities
Profitability Margins
Particulars FY20 FY21 Change Comments/Analysis
GPM 47.1% 46.4% -70 bps GPM was marginally lower as input cost escalated in H2FY21.
EBITDAM 20.9% 23.3% 240 bps EBITDAM improved due to higher volume and savings in fixed and variable costs.
PATM 8.3% 10.6% 230bps PATM was higher owing to superior operating performance and lower interest costs and higher Other Income during the year.
Source: Company; Axis Securities
Exhibit 8: Revenue & Revenue Growth Trend
Source: Company, Axis Securities
4014 4318 4429 4481 4208
0.9%
7.6%2.6% 1.2%
-6.1%
-10.0%
0.0%
10.0%
3500
4000
4500
5000
2017 2018 2019 2020 2021
Cost/tonne (Rs.) Trend
4021 4846 5259 5802 6606
6%
21%
9%
10%
14%
0%
5%
10%
15%
20%
25%
0
2000
4000
6000
8000
FY17 FY18 FY19 FY20 FY21
Revenue & Revenue Growth
Revenue (in cr) Revenue growth

12
Exhibit 9: Blended EBITDA/tonne Trend
Source: Company, Axis Securities
Exhibit 10: Net Profit & NPM Trend
Source: Company, Axis Securities
884 838 835 1185 1278
32%
-5% 0%
42%
8%
-20%
-10%
0%
10%
20%
30%
40%
50%
0
500
1000
1500
FY17 FY18 FY19 FY20 FY21
Blended Ebitda & Ebitda Growth
Blended Ebitda/ton (Rs.) Blended Ebitda/ton growth
178 290 270 496 710
4.3%
5.9%5.0%
8.3%
10.6%
0.0%
2.0%
4.0%
6.0%
8.0%
10.0%
12.0%
0
200
400
600
800
FY17 FY18 FY19 FY20 FY21
Net Profit NPM

13
Financial Ratios
Particulars FY20 FY21 Change Comments/Analysis
ROE 17% 21% 400bps ROE improved due to superior profitability, stringent cost control measures, lower interest costs, and higher other income.
ROCE 16.0% 18.5% 250bps ROCE was higher on account of superior operating performance leading to an EBIT margin improvement to 20% from 17% YoY.
Asset Turn 0.80x 0.84x Asset-turn was higher as revenue increased by 14% during the year.
Net Debt/Equity 0.9x 0.6x -30bps Net-debt was further reduced owing to higher cash generation during the year.
EV/EBITDA 11x 15.6x EV/EBITDA was higher as the market cap increased owing to the strong performance of the company.
Source: Company; Axis Securities
Exhibit 11: EV/EBITDA, ROE, & ROCE Trend
Source: Company, Axis Securities
Exhibit 12: Book Value (Rs)
Source: Company, Axis Securities
Exhibit 13: Leverage Ratio
Source: Company, Axis Securities
12.6 11.7 10.1 11.0 15.6
9.614.8
11.617.4
21.112.1
13.312.3
16.118.4
0.0
10.0
20.0
30.0
40.0
50.0
0.0
5.0
10.0
15.0
20.0
2017 2018 2019 2020 2021
ROE (%) ROCE(%)
245282
349389
480
0
100
200
300
400
500
600
FY17 FY18 FY19 FY20 FY21
Book Value (In Rs)
1.91.5
1.1 1.1 1.0
1.51.1
0.70.9
0.6
3.6
2.62.1 2.2
1.4
0.00
1.00
2.00
3.00
4.00
FY17 FY18 FY19 FY20 FY21
Total debt/Equity (x) Net debt/Equity (x) Net debt/EBITDA (x)

14
Key Balance Sheet Takeaways
Working Capital Management
Working capital intensity decreased in FY21 as the cash conversion cycle improved to 36 days in FY21 from 40 days in FY20. This
was on account of lower inventory and higher payable days. During the year, OCF to EBITDA conversion was 103% vs. 112% in
FY20.
From FY17-FY21, the company generated a total OCF of Rs 5,311 Cr and 61% of total OCF (Rs 3,238 Cr) was utilized towards the
company’s Capex program, indicating higher Capex intensity. While CFO remained the major source of funding for the company, it
generated an FCF of Rs 2,073 Cr during FY17-FY21.
Cash Conversion Cycle
Particulars FY20 FY21 Change Comments/Analysis
Inventory Days 82 78 -4 Inventory days decreased due to strict control on procurement.
Trade Receivables 17 20 3 Receivable days increased owing to higher sales during the year
Trade Payables 59 62 3 Trade payable days increased on account of relatively lenient credit terms.
Cash Conversion Cycle 40 36 Overall CCC decreased by 4 days to 36 as the company improved its WC management during the year.
Source: Company; Axis Securities
Exhibit 14: Cash Conversion Cycle
Source: Company, Axis Securities
18 18 18 17 20
94
75 7582 78
72
85 85
59 62
41
8 8
40 36
0
20
40
60
80
100
FY17 FY18 FY19 FY20 FY21
Cash Conversion Cycle
Trade Receivable Days Inventory Days Trade Payable Days Cas Coversion Cycle

15
Key Balance Sheet Takeaways (Cont...)
Debt Levels: The company’s long-term debt increased by Rs 553 Cr during the year while short-term debt decreased by Rs 125 Cr.
Fixed capital formation: Gross Fixed Capital Formation improved to Rs 7,825 Cr in FY21 from Rs 7,231 Cr in FY20, an improvement
of 8.25% as the company incurred Capex on expansion projects.
Capex plans: The company is expanding its capacity by setting up a 4 mtpa greenfield facility at Panna, MP at a capital
cost of Rs 2970 Cr. Besides line 3 upgradtion at Nimbahera is progressing well.
Cash and liquidity position: The company’s liquidity position has improved due to its superior profitability and efficient working
capital management in FY21. The Cash & Equivalent stood at Rs 1,323 Cr in FY21 against Rs 636 Cr in FY20, an increase of 108%
YoY.
Exhibit 15: Cash & Cash Equivalent (Rs Cr)
Source: Company, Axis Securities
Exhibit 16: Gross & Net Block
Source: Company, Axis Securities
501
650
906
636
1323
0
200
400
600
800
1000
1200
1400
FY17 FY18 FY19 FY20 FY21
Cash/ Cash Equivalent (Rs.Cr)
5,904 6,2317,232
7,826
4,5245,069
5,750 6,018
0
2000
4000
6000
8000
10000
FY18 FY19 FY20 FY21
Gross Block (Rs.Cr) Net Block (Rs. Cr)

16
Forex Analysis
The Foreign currency risk is the risk that the fair value or future cash flows of exposure will fluctuate with changes in the foreign
exchange rates. The company’s exposure to the risk of changes in foreign exchange rates relates primarily to the company's
operating activities (when revenue or expense is denominated in a foreign currency). The company manages its foreign currency
risk by taking foreign currency forward contracts if required.
Particulars FY20 FY21 Change Comments/Analysis*
USD 0.00 185155 100% Trade receivable
USD 4201498 4722146 12% Trade payable
euro 720545 332632 -54% Trade payable
GBP 0.00 360000 100% Trade payable
Yen 0.00 4750 100% Trade payable
Source: Company; Axis Securities;
Contingent Liability Analysis
Particulars (Rs Cr) FY20 FY21 Change Comments/Analysis
Excise Duty 251.68 69.41 -72%
Excise duty 22.77 23.51 3% no provision has been considered necessary by the management
Sales tax/Entry tax 66.95 13.80 -79% no provision has been considered necessary by the management
Service Tax 2.77 0.48 -82% no provision has been considered necessary by the management
Income tax 81.34 10.87 -86% no provision has been considered necessary by the management
Others 88.04 79.13 -12% no provision has been considered necessary by the management
Total 513.55 197.2 -61% Any adverse decision in the above cases may impact the operational performance of the company.
Source: Company; Axis Securities

17
Related Party Transaction Analysis
Particulars (Rs Cr) FY20 FY21 Change Comments/Analysis
Jaykay Enterprise Ltd 35.40 17.70 -50% Services received.
Jaykay Enterprise Ltd 61.11 32.72 -46% Rent paid.
Jaykay Enterprise Ltd 70.11 26.34 -62% Expenses reimbursed
JK Cotton ltd 32.11 16.05 -50% Rent paid
Source: Company; Axis Securities
Note: The sales to and purchases from related parties are made on terms equivalent to those that prevail in arm’s length transactions. Outstanding balances at the year-
end are unsecured and interest-free and settlement occurs in cash. There have been no guarantees (except corporate guarantees) provided or received for any related
party receivables or payables.

18
Key Cash Flow Takeaways
Particulars (Rs Cr) FY20 FY21 Change Comments/Analysis
PBT 734 1092 49% PBT was higher due to superior operating performance during the year.
Non-cash expenses
Depreciation 288 306 6% Depreciation is as per the depreciation policy of the company.
Finance Cost 254 249 -13% Finance cost was lower owing to lower interest costs.
Others -38 -33 13% Due to higher interest income and other adjustments.
Working Capital Adjustments 282 171 -39% Stringent working capital management improved capital flow during the year.
CFO 1366 1590 16% Higher CFO YoY owing to superior operating performance and efficient WC management.
CFI -1483 -1343 -9% CFI declined owing to lower investments in PPE during the year.
CFF -108 -138 27% Higher due to the debt repayment.
Capex -1242 -768 -38% Lower as an existing expansion is on completion.
Free Cash Flow Generation 124 822 562% Higher YoY owing to superior operating performance and WC management.
Source: Company; Axis Securities
Exhibit 17: OCF, Capex, FCF Trend (in Cr)
Source: Company, Axis Securities
Exhibit 18: OCF, EBITDA, and Conversion ratio trend (Cr)
Source: Company, Axis Securities
772 883700
13671590
-404-202
-623
-1243
-768
368681
77 124
822
-1500
-1000
-500
0
500
1000
1500
2000
FY17 FY18 FY19 FY20 FY21
OCF, CAPEX, FCF (Rs Cr)
OCF Capex FCF
772 883 700 1367 1590726 787 834 1213 1539
106% 112%
84%
113%103%
0%
20%
40%
60%
80%
100%
120%
0
400
800
1200
1600
2000
FY17 FY18 FY19 FY20 FY21
OCF EBITDA Conversion Ratio
19
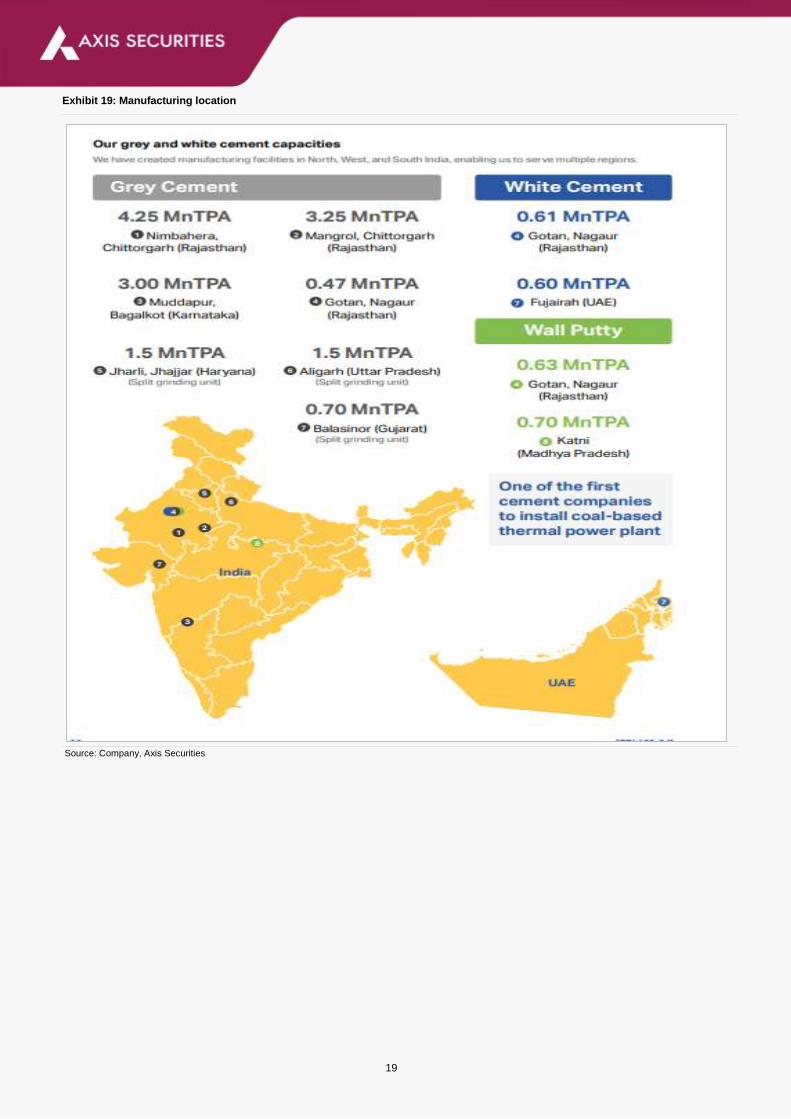
Exhibit 19: Manufacturing location
Source: Company, Axis Securities

20
Financials (Consolidated)
Profit & Loss (Rs Cr)
Y/E Mar, Rs Cr FY21 FY22E FY23E
Net sales 6606 7496 8413
Other operating income 0 0 0
Total income 6606 7496 8413
Raw Material 1071 1122 1200
Power & Fuel 1165 1444 1574
Freight & Forwarding 1302 1564 1705
Employee benefit expenses 462 524 576
Other Expenses 1067 1173 1279
EBITDA 1539 1669 2079
Other income 113 131 144
0 0 0
PBIDT 1652 1800 2223
Depreciation 306 323 361
Interest & Fin Chg. 253 250 255
E/o income / (Expense) 0 0 0
Pre-tax profit 1093 1228 1606
Tax provision 389 415 562
Minority Interests 7 7 7
Associates 0 0 0
RPAT 710 819 1051
Other Comprehensive Income 0 0 0
APAT after Comprehensive Income 710 819 1051
Source: Company, Axis Securities
Balance Sheet (Rs Cr)
Y/E Mar, Rs Cr FY21 FY22E FY23E
Total assets 9872 10720 11746
Net Block 6018 6821 7722
CWIP 510 400 400
Investments 142 142 142
Wkg. cap. (excl cash) 518 551 611
Cash / Bank balance 1225 1126 1132
Misc. Assets 146 168 174
Capital employed 9872 10720 11746
Equity capital 77 77 77
Reserves 3659 4402 5375
Minority Interests -26 -22 -29
Borrowings 3142 3142 3142
Def tax Liabilities 593 593 593
Other Liabilities and Provision 2426 2527 2587
Source: Company, Axis Securities
21
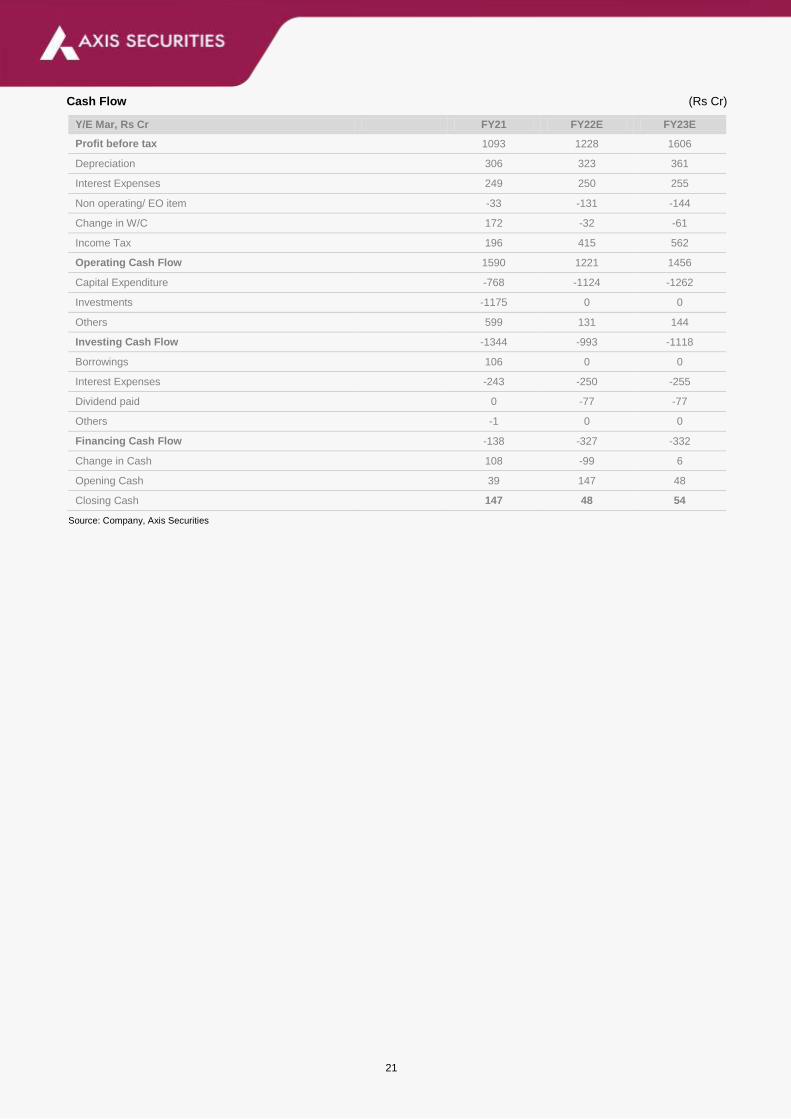
Cash Flow (Rs Cr)
Y/E Mar, Rs Cr FY21 FY22E FY23E
Profit before tax 1093 1228 1606
Depreciation 306 323 361
Interest Expenses 249 250 255
Non operating/ EO item -33 -131 -144
Change in W/C 172 -32 -61
Income Tax 196 415 562
Operating Cash Flow 1590 1221 1456
Capital Expenditure -768 -1124 -1262
Investments -1175 0 0
Others 599 131 144
Investing Cash Flow -1344 -993 -1118
Borrowings 106 0 0
Interest Expenses -243 -250 -255
Dividend paid 0 -77 -77
Others -1 0 0
Financing Cash Flow -138 -327 -332
Change in Cash 108 -99 6
Opening Cash 39 147 48
Closing Cash 147 48 54
Source: Company, Axis Securities
22
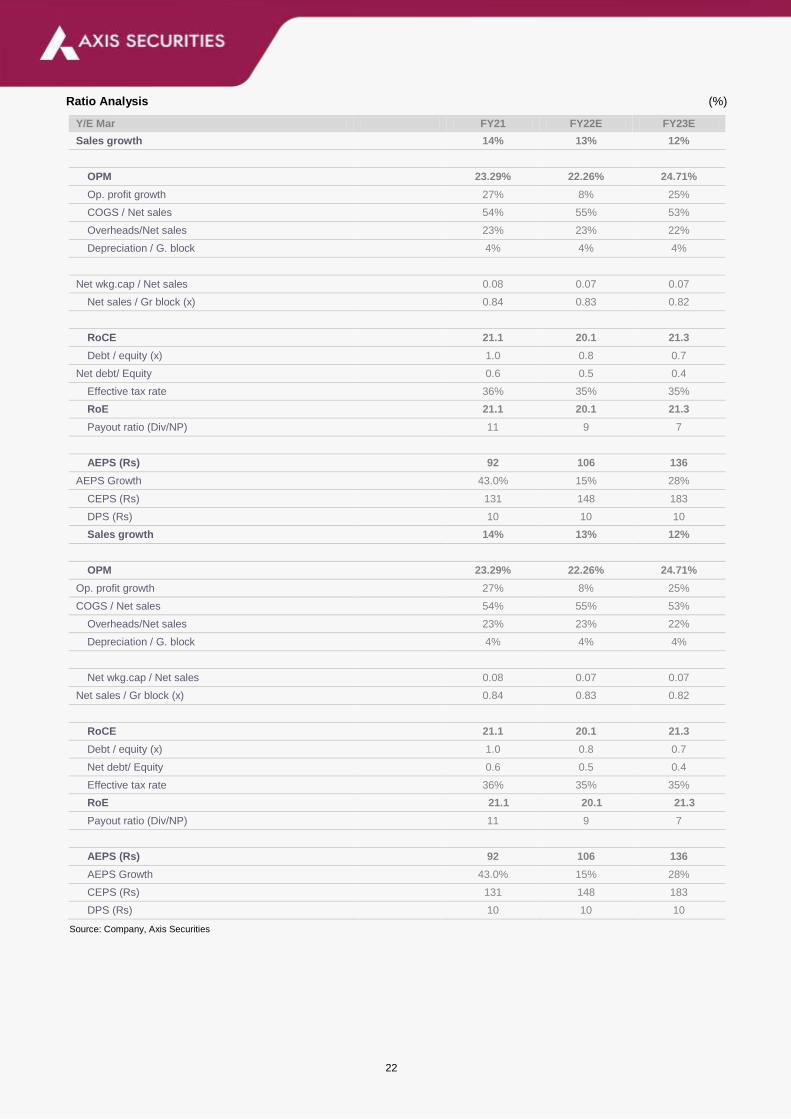
Ratio Analysis (%)
Y/E Mar FY21 FY22E FY23E
Sales growth 14% 13% 12%
OPM 23.29% 22.26% 24.71%
Op. profit growth 27% 8% 25%
COGS / Net sales 54% 55% 53%
Overheads/Net sales 23% 23% 22%
Depreciation / G. block 4% 4% 4%
Net wkg.cap / Net sales 0.08 0.07 0.07
Net sales / Gr block (x) 0.84 0.83 0.82
RoCE 21.1 20.1 21.3
Debt / equity (x) 1.0 0.8 0.7
Net debt/ Equity 0.6 0.5 0.4
Effective tax rate 36% 35% 35%
RoE 21.1 20.1 21.3
Payout ratio (Div/NP) 11 9 7
AEPS (Rs) 92 106 136
AEPS Growth 43.0% 15% 28%
CEPS (Rs) 131 148 183
DPS (Rs) 10 10 10
Source: Company, Axis Securities

23
JK Cement Price Chart and Recommendation History
Date Reco TP Research
21-Jul-20 BUY 1,697 Initiating Coverage
03-Aug-20 BUY 1,697 Pick of the week
03-Sep-20 BUY 1,691 Result Update
06-Oct-20 BUY 1,705 Company Update
11-Nov-20 BUY 2,150 Result Update
21-Dec-20 BUY 2,150 Result Update
10-Feb-21 BUY 2,520 Result Update
15-Jun-21 BUY 3,130 Result Update
17-Aug-21 HOLD 3,100 Result Update
17-Sep-21 HOLD 3,330 AAA
Source: Axis Securities
(Rs)

24
About the analyst
Analyst: Uttam Kumar Srimal
Email: [email protected]
Sector: cement/Infra
Analyst Bio: Uttam K Srimal is PGDBF from NMIMS with 20 years of experience in Equity
Market/Research.
About the analyst
Analyst: Shikha Doshi
Email: [email protected]
Sector: cement/Infra
Analyst Bio: Shikha Doshi is Master of Science in Finance from Illinois Institute of Technology, Chicago,
currently handling cement/infra sector.
Disclosures:
The following Disclosures are being made in compliance with the SEBI Research Analyst Regulations 2014 (herein after referred to as the Regulations).
1. Axis Securities Ltd. (ASL) is a SEBI Registered Research Analyst having registration no. INH000000297. ASL, the Research Entity (RE) as defined in
the Regulations, is engaged in the business of providing Stock broking services, Depository participant services & distribution of various financial products.
ASL is a subsidiary company of Axis Bank Ltd. Axis Bank Ltd. is a listed public company and one of India’s largest private sector bank and has its various
subsidiaries engaged in businesses of Asset management, NBFC, Merchant Banking, Trusteeship, Venture Capital, Stock Broking, the details in respect
of which are available on www.axisbank.com.
2. ASL is registered with the Securities & Exchange Board of India (SEBI) for its stock broking & Depository participant business activities and with the
Association of Mutual Funds of India (AMFI) for distribution of financial products and also registered with IRDA as a corporate agent for insurance business
activity.
3. ASL has no material adverse disciplinary history as on the date of publication of this report.
4. I/We, Uttam Srimal, (MBA-Finance) and Shikha Doshi (Master of Science in Finance), author/s and the name/s subscribed to this report, hereby
certify that all of the views expressed in this research report accurately reflect my/our views about the subject issuer(s) or securities. I/We (Research
Analyst) also certify that no part of my/our compensation was, is, or will be directly or indirectly related to the specific recommendation(s) or view(s) in this
report. I/we or my/our relative or ASL does not have any financial interest in the subject company. Also I/we or my/our relative or ASL or its Associates
may have beneficial ownership of 1% or more in the subject company at the end of the month immediately preceding the date of publication of the
Research Report. Since associates of ASL are engaged in various financial service businesses, they might have financial interests or beneficial ownership
in various companies including the subject company/companies mentioned in this report. I/we or my/our relative or ASL or its associate does not have
any material conflict of interest. I/we have not served as director / officer, etc. in the subject company in the last 12-month period.Any holding in stock –
No
5. 5. ASL has not received any compensation from the subject company in the past twelve months. ASL has not been engaged in market making activity for
the subject company.
6. In the last 12-month period ending on the last day of the month immediately preceding the date of publication of this research report, ASL or any of its
associates may have:
Received compensation for investment banking, merchant banking or stock broking services or for any other services from the subject company of this research
report and / or;
Managed or co-managed public offering of the securities from the subject company of this research report and / or;
Received compensation for products or services other than investment banking, merchant banking or stock broking services from the subject company of this
research report;
ASL or any of its associates have not received compensation or other benefits from the subject company of this research report or any other third-party in
connection with this report.
Term& Conditions:
This report has been prepared by ASL and is meant for sole use by the recipient and not for circulation. The report and information contained herein is strictly confidential and may not
be altered in any way, transmitted to, copied or distributed, in part or in whole, to any other person or the media or reproduced in any form, without prior written consent of ASL. The report
is based on the facts, figures and information that are considered true, correct, reliable and accurate. The intent of this report is not recommendatory in nature. The information is obtained
from publicly available media or other sources believed to be reliable. Such information has not been independently verified and no guaranty, representation of warranty, express or
implied, is made as to its accuracy, completeness or correctness. All such information and opinions are subject to change without notice. The report is prepared solely for informational
purpose and does not constitute an offer document or solicitation of offer to buy or sell or subscribe for securities or other financial instruments for the clients. Though disseminated to all
the customers simultaneously, not all customers may receive this report at the same time. ASL will not treat recipients as customers by their receiving this report.

25
Disclaimer:
Nothing in this report constitutes investment, legal, accounting and tax advice or a representation that any investment or strategy is suitable or appropriate to the recipient’s
specific circumstances. The securities and strategies discussed and opinions expressed, if any, in this report may not be suitable for all investors, who must make their
own investment decisions, based on their own investment objectives, financial positions and needs of specific recipient.
This report may not be taken in substitution for the exercise of independent judgment by any recipient. Each recipient of this report should make such investigations as it
deems necessary to arrive at an independent evaluation of an investment in the securities of companies referred to in this report (including the merits and risks involved),
and should consult its own advisors to determine the merits and risks of such an investment. Certain transactions, including those involving futures, options and other
derivatives as well as non-investment grade securities involve substantial risk and are not suitable for all investors. ASL, its directors, analysts or employees do not take
any responsibility, financial or otherwise, of the losses or the damages sustained due to the investments made or any action taken on basis of this report, including but
not restricted to, fluctuation in the prices of shares and bonds, changes in the currency rates, diminution in the NAVs, reduction in the dividend or income, etc. Past
performance is not necessarily a guide to future performance. Investors are advice necessarily a guide to future performance. Investors are advised to see Risk Disclosure
Document to understand the risks associated before investing in the securities markets. Actual results may differ materially from those set forth in projections. Forward-
looking statements are not predictions and may be subject to change without notice.
ASL and its affiliated companies, their directors and employees may; (a) from time to time, have long or short position(s) in, and buy or sell the securities of the
company(ies) mentioned herein or (b) be engaged in any other transaction involving such securities or earn brokerage or other compensation or act as a market maker
in the financial instruments of the company(ies) discussed herein or act as an advisor or investment banker, lender/borrower to such company(ies) or may have any other
potential conflict of interests with respect to any recommendation and other related information and opinions. Each of these entities functions as a separate, distinct and
independent of each other. The recipient should take this into account before interpreting this document.
ASL and / or its affiliates do and seek to do business including investment banking with companies covered in its research reports. As a result, the recipients of this report
should be aware that ASL may have a potential conflict of interest that may affect the objectivity of this report. Compensation of Research Analysts is not based on any
specific merchant banking, investment banking or brokerage service transactions. ASL may have issued other reports that are inconsistent with and reach different
conclusion from the information presented in this report. The Research reports are also available & published on AxisDirect website.
Neither this report nor any copy of it may be taken or transmitted into the United State (to U.S. Persons), Canada, or Japan or distributed, directly or indirectly, in the
United States or Canada or distributed or redistributed in Japan or to any resident thereof. If this report is inadvertently sent or has reached any individual in such country,
especially, USA, the same may be ignored and brought to the attention of the sender. This report is not directed or intended for distribution to, or use by, any person or
entity who is a citizen or resident of or located in any locality, state, country or other jurisdiction, where such distribution, publication, availability or use would be contrary
to law, regulation or which would subject ASL to any registration or licensing requirement within such jurisdiction. The securities described herein may or may not be
eligible for sale in all jurisdictions or to certain category of investors.
The Disclosures of Interest Statement incorporated in this document is provided solely to enhance the transparency and should not be treated as endorsement of the
views expressed in the report. The company reserves the right to make modifications and alternations to this document as may be required from time to time without any
prior notice. The views expressed are those of the analyst(s) and the Company may or may not subscribe to all the views expressed therein.
Copyright in this document vests with Axis Securities Limited.
Axis Securities Limited, Corporate office: Unit No. 2, Phoenix Market City, 15, LBS Road, Near Kamani Junction, Kurla (west), Mumbai-400070, Tel No. – 022-40508080/
022-61480808, Regd. off.- Axis House, 8th Floor, Wadia International Centre, PandurangBudhkar Marg, Worli, Mumbai – 400 025. Compliance Officer: AnandShaha,
Email: [email protected], Tel No: 022-42671582.SEBI-Portfolio Manager Reg. No. INP000000654
DEFINITION OF RATINGS
Ratings Expected absolute returns over 12-18 months
BUY More than 10%
HOLD Between 10% and -10%
SELL Less than -10%
NOT RATED We have forward looking estimates for the stock but we refrain from assigning valuation and recommendation
UNDER REVIEW We will revisit our recommendation, valuation and estimates on the stock following recent events
NO STANCE We do not have any forward looking estimates, valuation or recommendation for the stock