EXPERIMENTAL EVALUATION OF MINIATURE IMPEDANCE CHIP FOR STRUCTURAL HEALTH MONITORING OF PROTOTYPE...
34
EXPERIMENTAL EVALUATION OF MINIATURE IMPEDANCE CHIP FOR STRUCTURAL HEALTH MONITORING OF PROTOTYPE STEEL/RC STRUCTURES Naveet Kaur 1 , Suresh Bhalla 1 , Ravi Shanker 1 and Ramakanta Panigrahi 2 1 Department of Civil Engineering, Indian Institute of Technology Delhi, Hauz Khas, New Delhi 110 016 (INDIA) 2 Department of Civil Engineering, Centurion Institute of Technology, Jatni, Odisha, INDIA CORRESPONDING AUTHOR: Dr. Suresh Bhalla Associate Professor Department of Civil Engineering Indian Institute of Technology Delhi Hauz Khas, New Delhi 110 016 (INDIA) Tel: (91-11)-2659-1040 Tel: (91-11)-2659-1117 Email: [email protected]
Transcript of EXPERIMENTAL EVALUATION OF MINIATURE IMPEDANCE CHIP FOR STRUCTURAL HEALTH MONITORING OF PROTOTYPE...

EXPERIMENTAL EVALUATION OF MINIATURE IMPEDANCE CHIP FOR
STRUCTURAL HEALTH MONITORING OF PROTOTYPE STEEL/RC
STRUCTURES
Naveet Kaur
1, Suresh Bhalla
1, Ravi Shanker
1 and Ramakanta Panigrahi
2
1Department of Civil Engineering, Indian Institute of Technology Delhi,
Hauz Khas, New Delhi 110 016 (INDIA)
2Department of Civil Engineering, Centurion Institute of Technology, Jatni, Odisha, INDIA
CORRESPONDING AUTHOR: Dr. Suresh Bhalla
Associate Professor
Department of Civil Engineering
Indian Institute of Technology Delhi
Hauz Khas, New Delhi 110 016 (INDIA)
Tel: (91-11)-2659-1040
Tel: (91-11)-2659-1117
Email: [email protected]

1
ABSTRACT
The electro-mechanical impedance (EMI) technique has so far been very successful in
monitoring structural components made of both metals and nonmetals in the fields of civil,
mechanical and aerospace engineering. In the last two decades, researchers have reported fairly
good results using the EMI technique through costly conventional hardware, such as impedance
analyzer and LCR meter. This paper evaluates the performance of the low-cost miniature
impedance chip AD5933 for structural health monitoring (SHM) of prototype structures. Most
studies involving AD5933 have so far been restricted to miniature metal structures only, and in
particular, no study has so far been reported on reinforced concrete (RC) structures. In this
investigation, experiments are first conducted on a real-life sized reinforced concrete (RC) beam,
150×210×4000 mm in size, instrumented with 19 pairs of piezoelectric ceramic (PZT) patches
in embedded configuration, aiming to detect and locate incipient to severe damages.
Experimental investigations are then extended to a large mild steel plate structure, 1200×970×8
mm in size, divided into 30 equal panels and instrumented with one PZT patch at each node.
The results of the two studies confirm that the low cost miniature impedance chip is suitable for
level one damage diagnosis in large prototype structures, both steel as well as RC. It is however
not suitable for higher level analysis involving extraction of the structural impedance parameters.
Keywords: Electromechanical impedance (EMI) technique, piezoelectric-ceramic (PZT) patch,
damage, structural health monitoring (SHM), prototype structure, miniature impedance chip

2
INTRODUCTION
Structural health monitoring (SHM) is emerging as a new and vital engineering science to aid
engineers in improving the safety, performance and maintainance of critical structures. SHM
system solution offers precise information to help engineers and managers to assess the state-of-
health of their structures, and if needed, target specific regions to inspect. SHM systems add
unique value to a structure by converting it into a ‘smart’ structure with state-of-the-art sensing
technology. SHM can be formally defined as the measurement of the structure’s operating and
loading environment, as well as critical responses to track and evaluate any symptoms of
operational incidents, anomalies and deteriorations/damages, which might affect its smooth
operation, serviceability or safety reliability1. Various techniques available for SHM can be
classified as global techniques, local techniques, techniques using neural networks and
techniques using smart materials and smart system concept. With the growth of technology,
smart materials have become the centerpiece for SHM and nondestructive evaluation (NDE) of
structures. Smart piezoelectric-ceramic Lead Zirconate Titanate (PZT) materials have recently
emerged as high frequency impedance transducers for SHM and NDE after the advent of the
electro-mechanical impedance (EMI) technique2-4
. In the EMI technique, the PZT patch
bonded to the structure acts as actuator as well as sensor. It employs ultrasonic vibrations
(typically in 30-400 kHz range) to gather out a distinctive admittance ‘signature’ of the
structure. The basic principle of the EMI based SHM approach is that the occurrence of damage
in the host structure will affect its mechanical impedance, and thus the admittance (inverse of
electrical impedance) ‘signature’ of the PZT patch, which can be directly measured by an
electrical impedance analyzer or LCR meter. The impedance analyzer / LCR meter imposes an
alternating voltage signal to the bonded PZT patch over the user specified frequency range. The

3
admittance signature of the bonded PZT patch is a function of the stiffness, the mass and the
damping of the host structure, and the properties of the PZT patch. The changes in the
admittance signature relative to the baseline provide an indication of the occurrence of structural
damage, which can be thus used for damage assessment.
The EMI technique has been successfully demonstrated for damage identification and location in
a reinforced concrete (RC) frame5, monitoring of concrete hydration and damage
6, damage
assessment in aluminum truss and beam7, and monitoring rock specimen
8 using impedance
analyser/LCR meter as data acquisition system. An impedance model incorporating shear lag
effect and piezo-bond-structure interaction have also come up in the recent years9,10
.
Talakokula et al.11
performed the corrosion assessment of RC structures using EMI
technique. The main problems with conventional LCR meter are bulkiness and exorbitant cost
(typically over US $20,000), which act as deterrent in the widespread field application of the
EMI technique. Recently, Analog Devices12
has launched the evaluation version of its impedance
measurement chip AD5933. This is not only small sized but also low cost (US $160). Its proof of
concept application has been shown by several investators13-15
. At the same time, some
discrepancies have also been reported.
All the studies conducted so far, involving AD5933, have been performed on very small
structure. No literature is currently available which covers the performance of AD5933 on large
prototype, structures including detailed comparison of performance with LCR meter. This paper
covers two detailed experimental studies involving the AD5933 impedance chip to detect

4
damage in a real life sized RC beam and a 2D prototype steel structure. The following sections of
the paper cover the theoretical background followed by experimental details and results.
THEORETICAL BACKGROUND OF EMI TECHNIQUE
In the EMI technique, a PZT patch is bonded on the structure and electrically excited by means
of an LCR meter over 30-400 kHz frequency. The constitutive relations for piezoelectric
materials under small field condition2 are
1313333 TdED T (1)
331
11 Ed
Y
TS
E (2)
where, d31 is the piezoelectric strain coefficient, 1S the Strain along the length of the PZT patch
and T1 the corresponding stress, 3D the electric charge density over the PZT patch, EY the
Young’s modulus of the PZT patch at zero eclectic field, T
33 the complex electric permittivity
of the PZT patch at zero mechanical stress and 3E the electric field in the thickness direction.
For a PZT patch of length 2l, width w and thickness h bonded on a structure, following equation
can be written for the complex electro mechanical admittance Y (inverse of electrical
impedance16
EE
a
aT Ydkl
klYd
ZZ
Z
h
wljY 2
31
2
3133
tan2 (3)

5
where, Z denotes the mechanical impedance of the structural system and aZ that of the PZT
patch, the angular frequency and k the wave number. Eq. (3) is utilized for damage detection
in the EMI technique. The mechanical impedance Z in the equation is a function of structural
parameters i.e. the stiffness, the damping and mass. Any damage to the structure will cause these
parameters to change, and hence the mechanical impedance Z, which in turn modifies Y , being a
complex quantity having conductance (G) and suceptance (B) as its real and imaginary parts,
respectively. The real part actively interacts with the structure and is therefore preferred in quick
damage assessment algorithms. A plot of G over frequency serves as a diagnostic signature of
the structure and is called the conductance signature.
The damage quantification can be preliminary or detailed. Detailed quantification requires a
computational procedure to extract the mechanical impedance (x and y) of the structure2. The
statistical approach, based on root mean square deviation (RMSD) is preliminary in nature. It is
based on variation in the conductance signature (i.e. conductance vs frequency plot). The health
of the structure can be known by visualizing the healthy signature and signature obtained after
some period, when health monitoring is needed. But to quantify changes in signature due to
damage, the index used is root mean square deviation (RMSD), which was defined4 as
100
)(
(%)
1
2
2
1
ni
i
i
ni
i
ii
u
uw
RMSD (4)
where, iu (for i = 1, 2, 3,……,n; where n is the number of readings) is a baseline signature and
iw is the signature obtained after a period of time at the time of assessment of the structure.

6
The main deterrent in widespread application of the EMI technique is that the conventional
equipment, namely impedance analyzer or the LCR meter typically costs in the range of
US $ 20,000 to US $ 40,000. Several low cost variants15,17-19
have been proposed based on
system integration of equipment such as function generator, oscilloscope and/or FFT analyzer.
Although, the cost is drastically reduced, bulkiness of the equipment still remains an issue. The
recent launch of AD5933, a miniature impedance circuit, is a step forward towards low-cost and
low power solution. The next section covers a brief technical introduction of AD5933 followed
by its evaluation on real-life RC and steel structures.
MINIATURE IMPEDANCE CHIP AD5933
In the recent past, miniature impendence chip AD5933 (which is less than US $160) has attracted
researchers actively in the field of the EMI technique. AD5933, as shown in Fig. 1, is a high
precision impedance converter system in combination with an on board frequency generator. The
frequency generator allows an external complex impedance to be excited with a known
frequency. It also contains an internal temperature sensor. This offers an additional advantage to
include thermal compensation of signatures during the signature acquisition itself. The user has
the option to power the entire circuitry from the USB port of a computer. The evaluation board is
equipped with a high performance trimmed 16 MHz surface-mount crystal to act as a system
clock to the AD5933, if required. The AD5933 is specified to a typical system accuracy of 0.5 %
(assuming the AD5933 system is calibrated correctly for the impedance range under test) within
the frequency range of 1 kHz to 100 kHz. The lower frequency limit is determined by the value
of the system clock frequency connected to the external clock pin (MCLK) of the AD5933.
Using the AD5933 to frequencies past 100 kHz will introduce errors in impedance profile if the

7
sweep span is large, due to the effect of the increased roll off in the finite frequency response of
the system past 100kHz. The user interface of AD5933 software is shown in Fig. 2. Calibration
of evaluation board AD5933 is required each time the software or hardware is restarted/reset.
The calibration is done by adding calibration resistance of 200 kΩ to the circuit and running
“AD5933 Eval Software” as per the procedure prescribed in the manual.
Quinn et al.20
proposed to incorporate AD5933 into a wireless sensing device to monitor initial
curing of concrete. The feasibility of AD5933 impedance chip was explored and the results
were found comparable with HP4192 impedance analyzer. Another experimental study21
was
reported to detect corrosion in aluminum structures (widely used in aerospace, civil, and
mechanical systems) using AD5933 and a self-sensing macrofiber composite (MFC) patch.
Further verification was done involving loosening bolts in a bolt-jointed aluminum structure22
.
Na and Lee23
proposed steel wire based variant of the EMI technique to enhance the damage
detection performance on composite plates with large surface areas. The variations in the
impedance signatures were measured using the AD5933 evaluation board. Proúdekis and
Liarakos24
developed an innovative active wireless sensing system based on AD5933 to monitor
the concrete strength development at early ages and initial hydration states and a reusable
piezoelectric transducer appropriately installed in a Teflon-based enclosure. Conventional EMI
systems use wired technology, i.e. the equipment has to be installed on-site using cumbersome
cables for sensor connections and power supply. The wireless sensor networks (WSN), in
contrast, offer high flexibility due to easy deployment. Overly et al.13
tested wireless impedance
device WID2.0 in order to determine the performance as a SHM sensor node. The SHM
experiments were carried out for corrosion monitoring of aluminum plate and bolted joint of a

8
framed structure. Park et al.14
employed the AD5933 based wireless SHM technique to identify
the debonding conditions of a carbon fiber reinforced polymer (CFRP) laminated reinforced
concrete (RC) beam.
Taylor et al.25
reported using AD5933 for real-life bridge monitoring. However, no
comparison of measurements with standard LCR meter was reported. This paper
addresses this important issue involving AD 5933 on prototype structures. It presents results
of two studies on: (a) large RC beam and (b) large steel plate (typically representing a large
defence equipment), to evaluate performance of AD5933 vis-à-vis the LCR meter.
EXPERIMENTAL DETAILS OF AD5933 EVALUATION STUDY
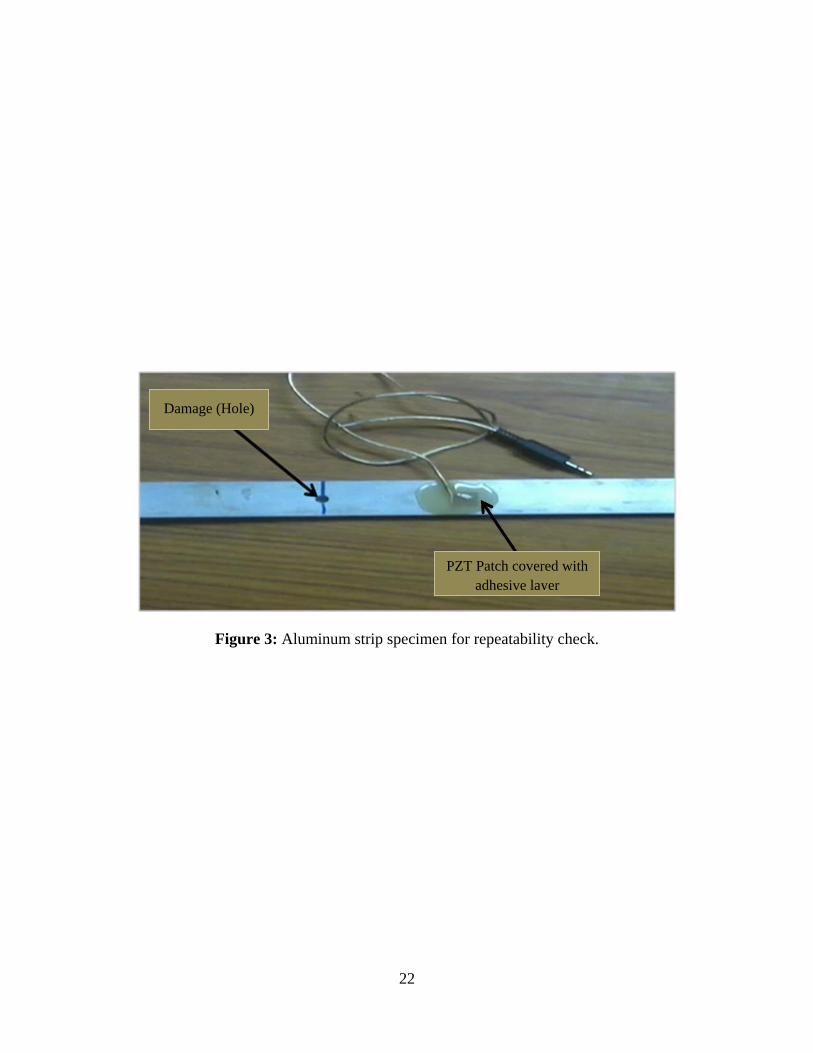
A miniature structure (aluminum strip), as shown in Fig. 3 was used for the initial calibration
AD5933. Damage was induced in the strip by drilling a hole in it. Both healthy and damaged
conditions were assessed using AD5933 and then compared with Agilent 4980 LCR meter. The
output of the AD5933 is in form of the real part (resistance, R) and the imaginary (reactance, X)
part of impedance. In accordance with the established norms of the EMI technique2,
conductance, the real part of admittance, has been chosen as the damage indicative
parameter. This is because the conductance has higher contribution from structural
parameters than PZT patch’s own parameters. It is therefore more sensitive to damage
than susceptance, which is somewhat own drowned by PZT patch’s parameters, hence,
conductance value was determined as
22 XR
RG
(5)
9
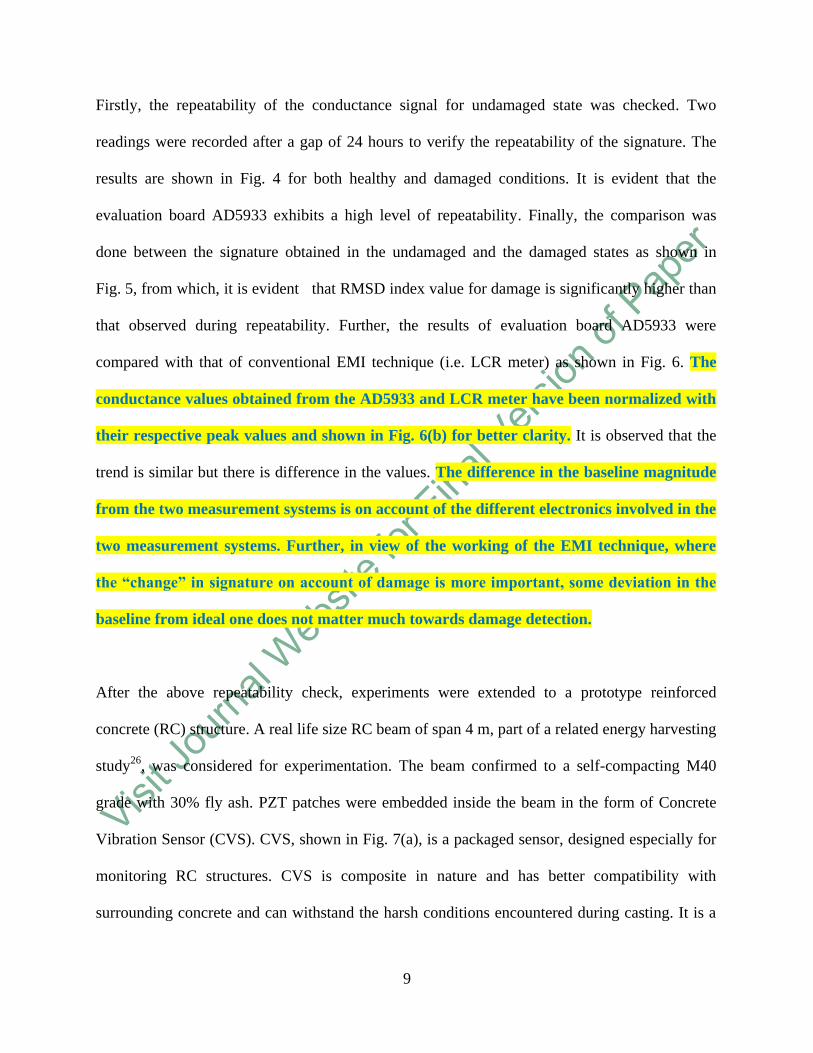
Firstly, the repeatability of the conductance signal for undamaged state was checked. Two
readings were recorded after a gap of 24 hours to verify the repeatability of the signature. The
results are shown in Fig. 4 for both healthy and damaged conditions. It is evident that the
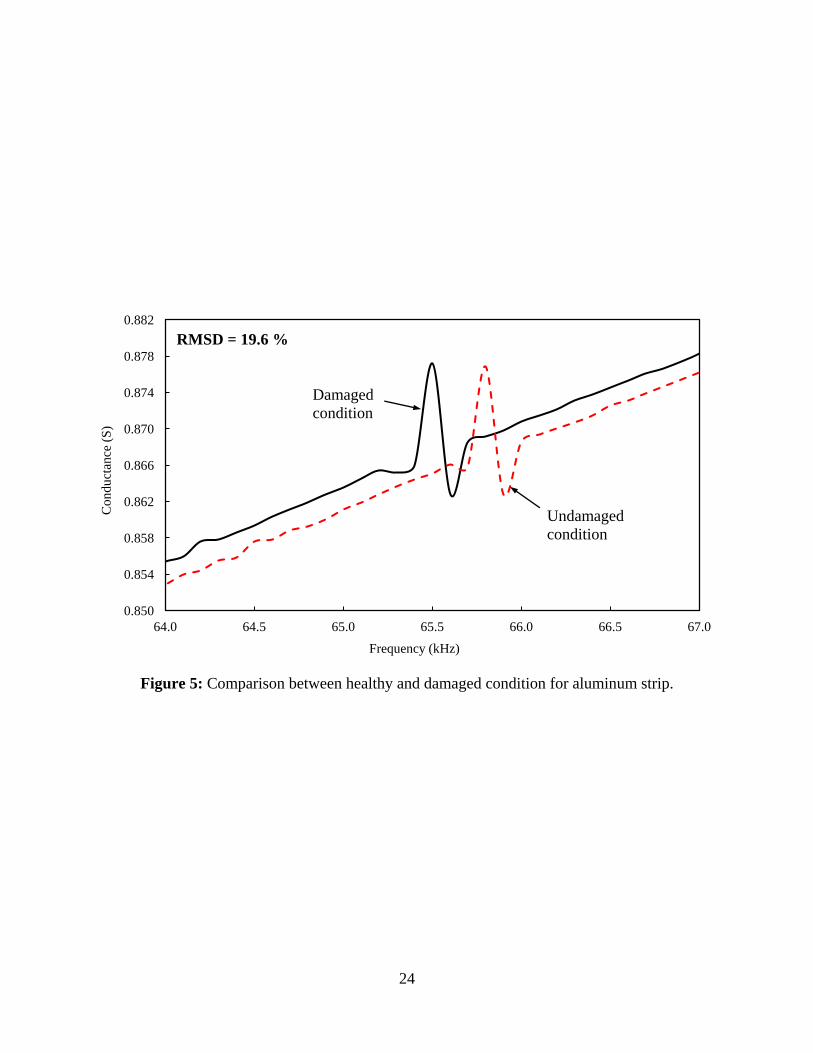
evaluation board AD5933 exhibits a high level of repeatability. Finally, the comparison was
done between the signature obtained in the undamaged and the damaged states as shown in
Fig. 5, from which, it is evident that RMSD index value for damage is significantly higher than
that observed during repeatability. Further, the results of evaluation board AD5933 were
compared with that of conventional EMI technique (i.e. LCR meter) as shown in Fig. 6. The
conductance values obtained from the AD5933 and LCR meter have been normalized with
their respective peak values and shown in Fig. 6(b) for better clarity. It is observed that the
trend is similar but there is difference in the values. The difference in the baseline magnitude
from the two measurement systems is on account of the different electronics involved in the
two measurement systems. Further, in view of the working of the EMI technique, where
the “change” in signature on account of damage is more important, some deviation in the
baseline from ideal one does not matter much towards damage detection.
After the above repeatability check, experiments were extended to a prototype reinforced
concrete (RC) structure. A real life size RC beam of span 4 m, part of a related energy harvesting
study26
, was considered for experimentation. The beam confirmed to a self-compacting M40
grade with 30% fly ash. PZT patches were embedded inside the beam in the form of Concrete
Vibration Sensor (CVS). CVS, shown in Fig. 7(a), is a packaged sensor, designed especially for
monitoring RC structures. CVS is composite in nature and has better compatibility with
surrounding concrete and can withstand the harsh conditions encountered during casting. It is a

10
proprietary product developed by Bhalla and Gupta27
in the Smart Structures and Dynamics
Laboratory (SSDL), IIT Delhi28
. It consists of a PZT sensor patch encapsulated in a proprietary
configuration suitable for casting along with the structure, thereby permanently embedding the
patch in the RC structures. The packing provides an additional advantage of protection of the
embedded sensor against ambient environmental conditions, hence, enhancing the life of the
sensor. The beam consisted of two layers of 19 CVS each at top and bottom, flushing with the
surface. Controlled damage was induced by chipping off the concrete at a specific location (one
third length of the beam, between CVS location 7 and 8) where a notch was created at the time
of casting [see Fig. 7(a)]. The damage was induced in three levels as explained using Fig. 7(a).
State 1 represents an undamaged condition, and in State 2, concrete was chipped off from the
notch, which was specifically designed to create damage between CVS locations 7 and 8. For
damaged states 3 and 4, 50% and 100% of the bottom reinforcement was curtailed, respectively.
The experimental setup used for acquiring the EMI signature using AD5933 is shown in
Fig. 7(b). The EMI signature of the 19 embedded CVS at top and 19 at bottom in the RC beam
was acquired using the AD5933. For the operation of AD5933, the frequency range chosen was
80 kHz to 100 kHz at a voltage of 1 V, in order to compare26
the results with the impedance
analyser, LCR meter. A typical plot of the real part of the EMI signature (conductance) for
undamaged and damaged states using AD5933 is shown in Fig. 8(a). The difference in the
conductance values for undamaged and damaged state 1 is maximum. The signatures of higher
level of damages became less and less distinguishable from one another, as apparent in the
figure. For locating the damage, RMSD value for each sensor node was calculated. RMSD value
for ith
element (between nth
and (n+1)th
sensor node location) for three different damage states
for the 19 CVS at top and bottom was calculated each using

11
2
1 nn
i
RMSDRMSDRMSD (6)
RMSD values were determined for three different damage states for the 19 CVS at top and
bottom each and plotted for bottom 19 CVS sensors for AD5933 in Fig. 8(b). It can be observed
from the figure that the damage in all the three stages has been effectively located. However, the
difference in the magnitudes of the RMSD index corresponding to State 3 and State 4 is not
high. This is a well accepted fact for the EMI technique.
In order to carry out a higher level of damage analysis, the equivalent stiffness of the beam was
determined from the admittance signatures of the CVS based on the method proposed by
Bhalla2. It is based on the trend of the real and the imaginary components of the mechanical
impedance x and y, respectively. The variation of x and y for typical CVS is shown in Fig. 8(c).
It is observed that the ‘x’ values are somewhat negative which is not an acceptable fact2,5
from
mechanics point of view. Hence, it can be mentioned that though the conductance (G) and
susceptance (B) signature acquired using AD5933 is sufficient for detecting and locating
damage, however, extracting the correct equivalent parameters from G and B for higher level of
damage assessment is not achievable using AD5933. This can be recognized as a drawback of
AD5933.
In the second study, a large plate of size 1200×970×8 mm, emulating typical defence
structural/mechanical component, was used as specimen for the experiment, as shown in Fig. 9.
The structural steel belonged to grade Fe 410 as per IS 2062. There were 42 nodes in the steel
plate and at each node a PZT patch of 10×10 mm with thickness of 0.3 mm was attached. PZT
patches were of grade PIC 151 manufactured by PI Ceramic. There were holes in the plate (panel

12
no. 6, 15 and 26) which were covered by the small plates. Damage scenarios were created by
removing the cover plates. Healthy baseline condition was created by fixing all the cover plates
and tightening the bolts with a torque of 35 N-m by using a torque wrench. Then, the damage
was induced by loosening the bolts of the cover plate of panel number 15 by reducing the torque
at an interval of 5 N-m. The signatures were acquired by the impedance chip AD5933. The
torque was reduced up to 25 N-m as it is the minimum value that can be applied by the torque
wrench. Finally, the cover plate was fully removed and the signatures were acquired. The RMSD
values were computed for various degrees of damages induced in the steel plate. Fig. 10 shows
the RMSD values with change in torque applied. It is clearly evident that even a minor incipient
damage such as loosening of the bolts can be easily identified by AD5933, very much like LCR
meter. In the next step, moderate damages were introduced by removing the cover plates by
using nut and bolt system. The signature was obtained in healthy and damaged condition in
frequency range of 74 kHz – 76 kHz, which was selected by trial. After selecting the frequency
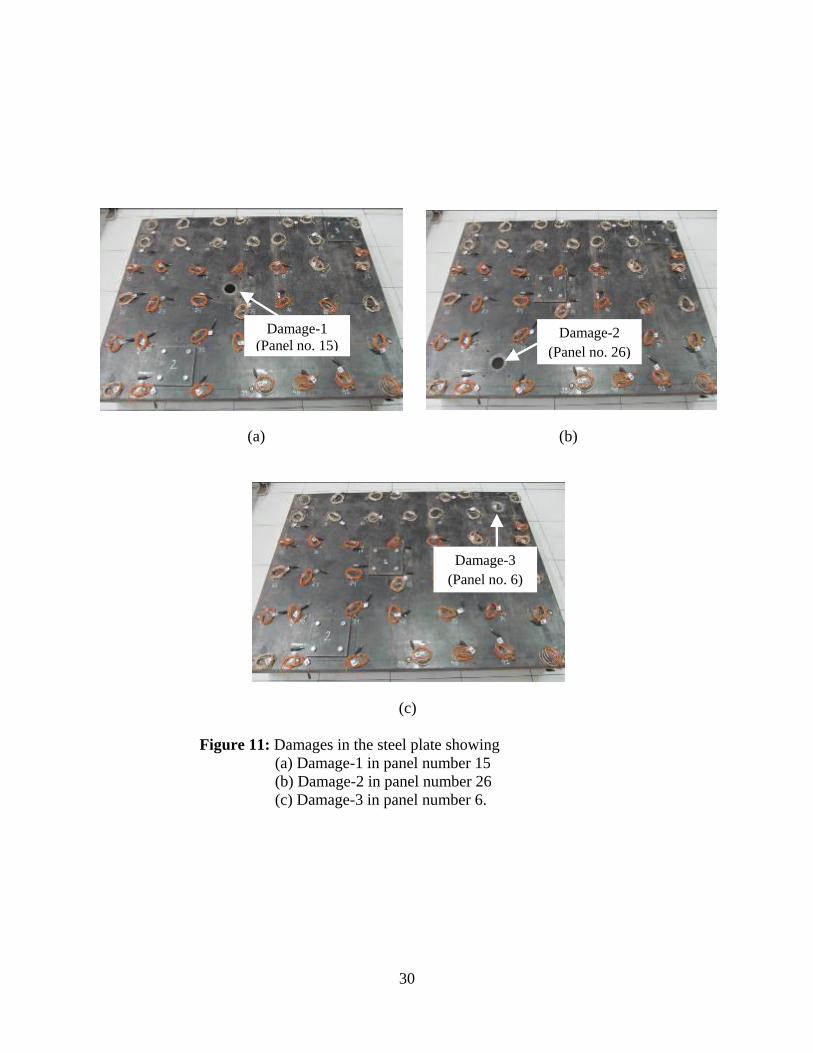
range, two damage scenarios were considered – single damage and multiple damage. A single
damage was induced in the steel plate by removing one cover plate, one at a time as shown in
Fig. 11. Damage 1, 2 and 3 correspond to the removal of cover plate in panels 15, 26 and 6,
respectively. The RMSD value for all the panels for damage case 1 are shown in Fig. 12(a),
which clearly indicates that there is damage in the panel number 15 of the steel plate. Similarly,
damage 2 and 3 are also correctly detected, as shown in Figs. 12(b) and (c). In general, for an
array of PZT patches as in the present case of the plate structure, the occurrence of
damage alters the signatures of a particular PZT patch in inverse proportion to its distance
from the damage location. This implies that the nearest PZT patch is most affected and the
farther ones less. A plot of RMSD indices forms a sort of “umbrella” structure, with the

13
RMSD peak occurring at damage location and the magnitude going down as we recede
away from it. The damage location can be identified as the PZT patch with maximum
RMSD value. The trend can be somewhat offset by applying a minimum threshold, as in
Figures 12 and 14, but still, some peaks may exceed this threshold.
The multiple damage scenario was introduced in the plate by removing more than one cover
plates at a time. The various multiple damages are shown in Fig. 13. The damages 1 and 2 were
induced in the panel number 15 and 26 of steel plate as shown in Fig. 13(a). Then, the damages 1
and 3 were induced in the panel number 15 and 6 of steel plate as shown in Fig. 13(b). Finally
the damages 1, 2 and 3 were induced in the panel number 6, 15 and 26 of steel plate, as shown in
Fig. 13(c). The results are shown in Fig. 14. All cases of multiple damages are clearly identified.
From analysis of the above results, it can be concluded that the miniature impedance chip
AD5933 can be successfully used for single as well as multiple damage detection similar to the
expensive LCR meter.
CONCLUSIONS
This paper has successfully demonstrated low cost EMI technique for health monitoring of
prototype structures using miniature impedance chip AD5933. Both incipient as well as severe
damages, including multiple damages were successfully detected and located, both in RC as well
s steel structures considered in the study. The hard ware solution costs only US $160 only, much
lower than any other conventional hardware used for EMI technique. The conductance acquired
using AD5933 follow the same trend as that of the conventional EMI technique. However, the
absolute magnitude obtained from AD5933 differs from the conventional. This may be due to the

14
electronics involved in AD5933 is different from the LCR meter as it does not use pure
sinusoidal sweep as LCR meter. However, this problem is not important as far as health
monitoring is concerned as the difference in magnitude of signals is important rather than the
absolute magnitude of the signals in structural health monitoring. In addition AD5933 is also
equipped with instantaneous temperature measurement, which is important for real life
applications where damage is generally mixed with temperature.
The evaluation board AD5933 exhibits a high level of repeatability. Single location as well as
multiple locations damages on prototype structure can be easily detected by miniature impedance
chip. Even an incipient damage induced in the prototype structure such as loosening of bolts can
also be easily detected. Hence, AD5933 hardware can be used for single and multiple damage
detection and damage quantification. Hence, AD5933 is fully capable of level 1 damage
diagnosis in any real-life RC or steel structure. The correct extraction of equivalent parameters,
however via AD5933 cannot done, which can be attributed as its drawback. It is therefore, not
suitable for level ‘2’ diagnosis, which is possibly due to the fact that the AD5933 measurements
differ in their absolute value to the LCR meter acquired signature.
15
REFERENCES
1. Aktan, A. E., Catbas, F. N., Grimmelsman, K. A. and Tsikos, C. J., “Issues in
infrastructure health monitoring for management,” Journal of Engineering Mechanics
ASCE 126: 711–724 (2000).
2. Bhalla, S., “A mechanical impedance approach for structural identification, health
monitoring and non-destructive evaluation using piezo-impedance transducers,” PhD
Thesis Nanyang Technological University Singapore (2004).
3. Park, G., Cudney, H. H. and Inman, D. J., “Impedance-Based Health Monitoring of Civil
Structural Components”, Journal of Infrastructure Systems, ASCE, 6(4): 53-160 (2000).
4. Giurgiutiu, V., Redmond, J., Roach, D. and Rackow, K., “Active sensors for health
monitoring of ageing aerospace structures”, Proceedings of the SPIE Conference on
Smart Structures and Integrated Systems, edited by N. M. Wereley, SPIE 985: 294-305
(2000).
5. Bhalla, S. and Soh, C. K., “Structural impedance based damage diagnosis by piezo-
transducers,” Eartquake Engineering Structural Dynamics 32: 1897-1916 (2003).
6. Soh, C. K. and Bhalla, S., “Calibration of Piezo-Impedance Transducers for Strength
Prediction and Damage Assessment of Concrete,” Smart Materials and Structures 14(4):
671-684 (2005).
7. Lim, Y. Y., Bhalla, S. and Soh, C. K., “Structural identification and damage diagnosis
using self-sensing piezo-impedance transducers,” Smart Materials and Structures 15:
987-995 (2006).
8. Yang, Y. W., Bhalla, S., Wang, C., Soh, C. K. and Zhao, J., “Monitoring of rocks using
smart sensors,” Tunneling and Underground Space Technology 22: 206-221 (2007).

16
9. Bhalla, S. and Moharana, S., “A refined shear lag model for adhesively bonded piezo-
impedance transducers,” Journal of Intelligent Material Systems and Structures, 24(1):
33-48 (2012).
10. Moharana, S. and Bhalla, S., “Numerical investigation of shear lag effect on PZT –
Structure integration: Review and applications,” Current Science, 103(6): 685-696
(2012).
11. Talakokula, V., Bhalla, S., and Gupta, A., “Corrosion assessment of RC structures based
on equivalent structural parameters using EMI technique,” Journal of Intelligent
Materials System and Structures, 25: 484-500 (2014).
12. Analog Devices, “1 MSPS, 12 Bit Impedance Converter Network Analyzer”,
http://www.analog.com/en/index.html (2014).
13. Overly, T. G., Park, G., Farinholt, K. M. and Farrar, C. R. “Development of an extremely
compact impedance-based wireless sensing device,” Smart Materials and Structures
17(6): 1-9 (2008).
14. Park, S., Kim, J. W., Lee, C. and Park, S. K., “Impedance-based wireless debonding
condition monitoring of CFRP laminated concrete structures” NDTE International 44:
232-238 (2011).
15. Xu, B. and Giurgiutiu, V., “A low-cost and field portable electromechanical (E/M)
impedance analyzer for active structural health monitoring,” In: Proc. 5th International
Workshop on Structural Health Monitoring Stanford University September 15–17(2005).
16. Liang, C., Sun, F.P. and Rogers, C.A., “Coupled Electro-Mechanical Analysis of
Adaptive Material Systems-Determination of the actuator power consumption and system
energy transfer,” Journal of Intelligent Material Systems and Structures l5:12-20 (1994).

17
17. Peairs, D. M., Park, G. and Inman, D. J., “Improving accessibility of the impedance-
based structural health monitoring method” Journal of Intelligent Material Systems and
Structures 15(2):129–139 (2004).
18. Panigrahi, R., Bhalla, S. and Gupta, A., “A cost-effective variant of electromechanical
impedance technique for structural health monitoring,” Experimental Techniques 34(2):
25-29 (2009).
19. Bhalla, S., Gupta, A., Bansal, S. and Garg, T., “Ultra low-cost adaptions of electro-
mechanical impedance technique for structural health monitoring,” Journal of Intelligent
Material Systems and Structures 20: 991-999 (2009).
20. Quinn, W., Kelly, G., and Barrett, J., “Development of an embedded wireless sensing
system for the monitoring of concrete,” Structural Health Monitoring- An International
Journal 11(4):381-392(2012).
21. Park, S., Grisso, B. L. and Inman, D. J., “MFC-based structural health monitoring using a
miniaturized impedance measuring chip for corrosion detection,” Research in
Nondestructive Evaluation 18(2): 139-150 (2007).
22. Park, S., Lee, J. J. and Yun, C. B., “Electro-mechanical impedance-based wireless
structural health monitoring using PCA-data compression and k-means clustering
algorithm,” Journal of Intelligent Material Systems and Structures 19 (4): 509-520
(2008).
23. Na, S. and Lee, H. K., “Resonant frequency range utilized electro-mechanical impedance
method for damage detection performance enhancement on composite structures,”
Composite Structures 94: 2383-2389 (2012).

18
24. Providakis, C. and Liarakos, E., “T-WiEYE: An early-age concrete strength development
monitoring and miniaturized wireless impedance sensing system,” Procedia Engineering
10: 484–489 (2011).
25. Taylor, S. G., Farinholt, K. M., Park, G., Farrar, C. R. and Todd, M. D., “Multi-scale
wireless sensor node for impedance-based SHM and long-term civil infrastructure
monitoring” Smart Structures and Systems 6(5): 661-673 (2010).
26. Kaur, N. and Bhalla, S., “Combined Energy Harvesting and Structural Health Monitoring
Potential of Embedded Piezo Concrete Vibration Sensors”, Journal of Energy
Engineering, American Society of Civil Engineers-ASCE (published online, DOI:
10.1061/(ASCE)EY.1943-7897.0000224 , (2014).
27. Bhalla, S. and Gupta, A., “A novel vibration sensor for concrete structures.” Invention
disclosure (FT/IPR/CE/SB/2007/0570), Foundation for Innovation and Technology
Transfer (FITT), IIT Delhi, Patent application no. 1011/DEL/2011 (2007).
28. SSDL “Smart Structures and Dynamic Laboratory” Department of Civil Engineering, IIT
Delhi (2014). <http://ssdl.iitd.ac.in/>
LIST OF FIGURES
Figure 1: Evaluation board AD5933.
Figure 2: User interface of AD5933.
Figure 3: Aluminum strip specimen for repeatability check.
Figure 4: Repeatability signatures of structure in (a) healthy condition and (b) damaged
condition.
Figure 5: Comparison between healthy and damaged condition for aluminum strip

19
Figure 6: Comparison between AD5933 and LCR meter signature for (a) actual values and
(b) normalized with respective peak values.
Figure 7(a): RC beam showing CVS location, notch for damage and different damaged states.
Figure 7(b): Experimental setup for acquiring the EMI signature.
Figure 8(a): Comparison of typical conductance (G) signature acquired using AD5933.
Figure 8(b): Variation of typical equivalent parameters (x and y) for undamaged state.
Figure 8(c): RMSD of conductance plots acquired using AD5933 for undamaged and different
states of damage.
Figure 8(d): RMSD of conductance plots acquired using LCR meter for undamaged and
different states of damage.
Figure 9(a): Experimental set up for 2D plate structure.
Figure 9(b): Steel plates with cover plates and PZTs showing panel numbers.
Figure 10: RMSD vs Change in torque.
Figure 11: Damages in the steel plate showing (a) Damage-1 in panel number 15 (b) Damage-
2 in panel number 26 (c) Damage-3 in panel number 6.
Figure 12(a): RMSD values of 30 panels for damage-1 by AD5933.
Figure 12(b): RMSD values of 30 panels for damage-2 by AD5933.
Figure 12(c): RMSD values of 30 panels for damage-3 by AD5933.
Figure 13: Multiple damage scenario in steel plates showing (a) Damage 1 and 2 in panel no.
15 and 26 (b) Damage 1 and 3 in panel no. 15 and 6 (c) Damage in 1, 2 and 3 in
panel no. 15, 26 and 6.
Figure 14: RMSD values of 30 panels under multiple damage scenarios for damage (a) 1 & 2
(b) 1 &3 (c) 1, 2 & 3.

20
Figure 1: Evaluation board AD5933.
Naveet
Text Box
VISIT JOURNAL WEBSITE FOR FINAL VERSION OF PAPER

21
Figure 2: User interface of AD5933.
Naveet
Text Box
VISIT JOURNAL WEBSITE FOR FINAL VERSION OF PAPER
22
Figure 3: Aluminum strip specimen for repeatability check.
PZT Patch covered with
adhesive layer
Damage (Hole)
Naveet
Text Box
VISIT JOURNAL WEBSITE FOR FINAL VERSION OF PAPER

23
(a)
(b)
Figure 4: Repeatability signatures of structure in (a) healthy condition and (b) damaged
condition.
0.850
0.854
0.858
0.862
0.866
0.870
0.874
0.878
0.882
64.0 64.4 64.8 65.2 65.6 66.0 66.4 66.8 67.2
Co
nd
uct
ance
(S
)
Frequency (kHz)
G2
G1
RMSD = 0.031 %
0.862
0.864
0.866
0.868
0.870
0.872
0.874
0.876
0.878
0.880
65 65.1 65.2 65.3 65.4 65.5 65.6 65.7 65.8 65.9 66
Co
nd
uct
ance
(S
)
Frequency (kHz)
G2
G1
RMSD = 0.025 %
Naveet
Text Box
VISIT JOURNAL WEBSITE FOR FINAL VERSION OF PAPER
24
Figure 5: Comparison between healthy and damaged condition for aluminum strip.
0.850
0.854
0.858
0.862
0.866
0.870
0.874
0.878
0.882
64.0 64.5 65.0 65.5 66.0 66.5 67.0
Co
nd
uct
ance
(S
)
Frequency (kHz)
Undamaged
condition
Damaged
condition
RMSD = 19.6 %
Naveet
Text Box
VISIT JOURNAL WEBSITE FOR FINAL VERSION OF PAPER

25
(a)
(b)
Figure 6: Comparison between AD5933 and LCR meter signature for (a) actual values and (b)
normalized with respective peak values.
0.00
0.01
0.02
0.03
0.04
0.05
0.06
0.07
64.0 64.5 65.0 65.5 66.0 66.5 67.0
Co
nd
uct
ance
(S
)
Frequency (kHz)
LCR Meter
AD5933
0.00
0.20
0.40
0.60
0.80
1.00
1.20
64.0 64.5 65.0 65.5 66.0 66.5 67.0
Co
nd
uct
ance
(S
)
Frequency (kHz)
LCR Meter
AD5933
Naveet
Text Box
VISIT JOURNAL WEBSITE FOR FINAL VERSION OF PAPER

26
(a)
(b)
Figure 7: (a) RC beam showing CVS location, notch for damage and different
damaged states.
(b) Experimental setup for acquiring the EMI signature.
Damaged: State 2 Damaged: State 3 Damaged: State 4 Undamaged: State 1
1 2 3 4 5 6 7 8 9
11-19 10
15 mm 25 mm
Embedded CVS (typ.)
at location 1
Notch for damage
Laptop AD5933
RC Beam
Naveet
Text Box
VISIT JOURNAL WEBSITE FOR FINAL VERSION OF PAPER
Naveet
Text Box
VISIT JOURNAL WEBSITE FOR FINAL VERSION OF PAPER

27
(a) (b)
(c) (d)
Figure 8: (a) Comparison of typical conductance (G) signature acquired using AD5933.
(b) Variation of typical equivalent parameters (x and y) for undamaged state.
(c) RMSD of conductance plots acquired using AD5933 for undamaged and
different states of damage.
(d) RMSD of conductance plots acquired using LCR meter for undamaged and
different states of damage.
(a) (b)
(c)
Figure 8: Comparison of (a) typical conductance (G) signature and (b) RMSD of conductance
plots acquired using AD5933 for undamaged and different states of damage.
(c) Variation of typical equivalent parameters (x and y) for undamaged state.
0.045
0.046
0.047
0.048
0.049
85 86 87 88 89 90
Co
nd
uct
ance
(G
, m
S)
Frequency (kHz)
1.5
1.7
1.9
2.1
2.3
2.5
1 2 3 4 5 6 7 8 9 10111213141516171819R
MS
D (
%)
Element
Damaged-State 2
Damaged-State 3
Damaged-State 4
Damage
Location
-100
-50
0
50
100
150
-10
-8
-6
-4
-2
0
2
4
6
8
10
80 85 90 95 100
y(u
nit
)
x(u
nit
)
Frequency (kHz)
x (unit)
y (unit)
Undamaged (State 1)
Damaged (State 2)
Damaged (State 3)
Damaged (State 4)
-100
-50
0
50
100
150
-10
-8
-6
-4
-2
0
2
4
6
8
10
80 85 90 95 100
y (u
nit
)
x (u
nit
) Frequency (kHz)
x (unit)
y (unit)
1.5
1.7
1.9
2.1
2.3
2.5
1 3 5 7 9 11 13 15 17 19
RM
SD
(%
)
Element
Damaged (State 2)
Damaged (State 3)
Damaged (State 4)
Damage
Location
3.0
3.5
4.0
4.5
5.0
5.5
6.0
6.5
1 3 5 7 9 11 13 15 17 19
RM
SD
(%
)
Element
Damaged (State 2)
Damaged (State 3)
Damaged (State 4) Damage
Location
Naveet
Text Box
VISIT JOURNAL WEBSITE FOR FINAL VERSION OF PAPER
Naveet
Text Box
VISIT JOURNAL WEBSITE FOR FINAL VERSION OF PAPER

28
Figure 9: (a) Experimental set up for 2D plate structure.
(b) Steel plate with cover plates and PZT patches showing panel numbers.
(a)
(b)
Figure 9: (a) Experimental set up for 2D plate structure.
(b) Steel plate with cover plates and PZT patches showing panel numbers.
Local PC AD5933 Remote PC
Cover Plates
PZT Patch
(typical)
Naveet
Text Box
VISIT JOURNAL WEBSITE FOR FINAL VERSION OF PAPER
Naveet
Text Box
VISIT JOURNAL WEBSITE FOR FINAL VERSION OF PAPER

29
Figure 10: RMSD vs Change in torque.
0
5
10
15
20
25
30
35
40
45
0 5 10 15 20 25 30 35 40
RM
SD
val
ues
(%
)
Change in torque ∆T (N-m)
Naveet
Text Box
VISIT JOURNAL WEBSITE FOR FINAL VERSION OF PAPER
30
Figure 11: Damages in the steel plate showing
(a) Damage-1 in panel number 15
(b) Damage-2 in panel number 26
(c) Damage-3 in panel number 6.
(a) (b)
(c)
Figure 11: Damages in the steel plate showing
(a) Damage-1 in panel number 15
(b) Damage-2 in panel number 26
(c) Damage-3 in panel number 6.
Damage-3
(Panel no. 6)
Damage-1
(Panel no. 15) Damage-2
(Panel no. 26)
Naveet
Text Box
VISIT JOURNAL WEBSITE FOR FINAL VERSION OF PAPER
Naveet
Text Box
VISIT JOURNAL WEBSITE FOR FINAL VERSION OF PAPER

31
(a)
(b)
(c)
Figure 12: (a) RMSD values of 30 panels for damage-1 by AD5933.
(b) RMSD values of 30 panels for damage-2 by AD5933.
(c) RMSD values of 30 panels for damage-3 by AD5933.
31
32
33
34
35
36
RM
SD
Val
ues
(%
)
Panels along Plate Length
Damaged panel no. 15
31
32
33
34
35
36
RM
SD
Val
ues
(%
)
Panels along Plate Length
Damaged panel no. 26
31
32
33
34
35
36
RM
SD
Val
ues
(%
)
Panels along Plate Length
Damaged panel no. 6
Naveet
Text Box
VISIT JOURNAL WEBSITE FOR FINAL VERSION OF PAPER

32
Figure 13: Multiple damage scenario in steel plates showing
(a) Damage 1 and 2 in panel no. 15 and 26
(b) Damage 1 and 3 in panel no. 15 and 6
(c) Damage in 1, 2 and 3 in panel no. 15, 26 and 6.
(a) (b)
(c)
Figure 13: Multiple damage scenario in steel plates showing
(a) Damage 1 and 2 in panel no. 15 and 26
(b) Damage 1 and 3 in panel no. 15 and 6
(c) Damage in 1, 2 and 3 in panel no. 15, 26 and 6.
Damage 1, 2 & 3
Damage 1 & 2
Damage 1 & 3
Naveet
Text Box
VISIT JOURNAL WEBSITE FOR FINAL VERSION OF PAPER

33
(a)
(b)
(c)
Figure 14: RMSD values of 30 panels under multiple damage scenarios for damage (a) 1
& 2 (b) 1 &3 (c) 1, 2 & 3.
20
25
30
35
40
RM
SD
Val
ue
(%)
Panels along Plate Length
Damaged 2 and 1
20
22
24
26
28
30
RM
SD
Val
ue
(%)
Panels along Plate Length
Damaged 1 and 3
25
29
33
37
41
RM
SD
Val
ue
(%)
Panels along Plate Length
Damaged 1, 2 and 3
Naveet
Text Box
VISIT JOURNAL WEBSITE FOR FINAL VERSION OF PAPER