Modified properties of serum cholinesterases in primary carcinomas
©20
15N
atu
re A
mer
ica,
Inc.
All
rig
hts
res
erve
d.
Nature GeNetics ADVANCE ONLINE PUBLICATION �
l e t t e r s
Genomic analyses promise to improve tumor characterization to optimize personalized treatment for patients with hepatocellular carcinoma (HCC). Exome sequencing analysis of 243 liver tumors identified mutational signatures associated with specific risk factors, mainly combined alcohol and tobacco consumption and exposure to aflatoxin B�. We identified �6� putative driver genes associated with �� recurrently altered pathways. Associations of mutations defined 3 groups of genes related to risk factors and centered on CTNNB1 (alcohol), TP53 (hepatitis B virus, HBV) and AXIN1. Analyses according to tumor stage progression identified TERT promoter mutation as an early event, whereas FGF3, FGF4, FGF19 or CCND1 amplification and TP53 and CDKN2A alterations appeared at more advanced stages in aggressive tumors. In 28% of the tumors, we identified genetic alterations potentially targetable by US Food and Drug Administration (FDA)–approved drugs. In conclusion, we identified risk factor–specific mutational signatures and defined the extensive landscape of altered genes and pathways in HCC, which will be useful to design clinical trials for targeted therapy.
HCC is a heterogeneous disease that usually develops within liver cirrhosis related to various etiologies. HBV infection, with or with-out aflatoxin B1 (AFB1) exposure, is the most frequent etiology in Asia and Africa, whereas hepatitis C virus (HCV) infection, chronic
alcohol abuse and metabolic syndrome are frequently related to HCC in Western countries1,2. In cirrhosis, hepatocarcinogenesis is a multiple-step process where precancerous dysplastic macronodules (DMNs) transform into early HCCs that progress into ‘small and progressed HCCs’, then lead to advanced HCC3,4. In rare cases, HCC develops in normal liver, with some of these tumors potentially resulting from malignant transformation of hepatocellular adenomas (HCAs)5–7. Unraveling the patterns of genomic alterations in these heterogeneous tumors is pivotal in identifying targeted therapies that could improve patient care8,9.
To understand HCC diversity, we analyzed the whole coding sequences of 243 liver tumors surgically resected in Europe (France, Italy and Spain) associated with cirrhotic (METAVIR F4, n = 118), fibrotic (F2–F3, n = 46) or non-fibrotic (F0–F1, n = 79) livers10. Various risk factors were identified, including alcohol intake (41%), HCV infection (26%), non-alcoholic steatohepatitis (NASH) as a co-occurrence of metabolic syndrome (18%), HBV infection (14%), hemochromatosis (7%) and no known etiology (11%). The 118 tumors associated with cirrhosis represented different stages along HCC pro-gression, including 7 DMNs and 7 early, 17 small and progressed, 58 classic and 29 poor-prognosis HCCs (see the Online Methods and Supplementary Tables 1 and 2 for clinical definitions). We performed exome sequencing in tumors and matched non-tumor liver samples to a mean depth of 72-fold (Supplementary Fig. 1). We identified 28,478 somatic mutations, 6,184 of which occurred in a single tumor with
Exome sequencing of hepatocellular carcinomas identifies new mutational signatures and potential therapeutic targetsKornelius Schulze1–4,19, Sandrine Imbeaud1–4,19, Eric Letouzé1–4,19, Ludmil B Alexandrov5,6, Julien Calderaro1–4,7, Sandra Rebouissou1–4, Gabrielle Couchy1–4, Clément Meiller1–4, Jayendra Shinde1–4, Frederic Soysouvanh1–4, Anna-Line Calatayud1–4, Roser Pinyol8, Laura Pelletier1–4, Charles Balabaud9, Alexis Laurent10,11, Jean-Frederic Blanc9,12, Vincenzo Mazzaferro13, Fabien Calvo1–4, Augusto Villanueva8,14, Jean-Charles Nault1–4,15, Paulette Bioulac-Sage9,16, Michael R Stratton5, Josep M Llovet8,14,17 & Jessica Zucman-Rossi1–4,18
1INSERM, UMR 1162, Génomique Fonctionnelle des Tumeurs Solides, Equipe Labellisée Ligue Contre le Cancer, Institut Universitaire d’Hematologie, Paris, France. 2Université Paris Descartes, Labex Immuno-Oncology, Sorbonne Paris Cité, Faculté de Médecine, Paris, France. 3Université Paris 13, Sorbonne Paris Cité, Unité de Formation et de Recherche Santé, Médecine, Biologie Humaine, Bobigny, France. 4Université Paris Diderot, Paris, France. 5Cancer Genome Project, Wellcome Trust Sanger Institute, Wellcome Trust Genome Campus, Hinxton, UK. 6Theoretical Division, Los Alamos National Laboratory, Los Alamos, New Mexico, USA. 7Assistance Publique–Hôpitaux de Paris, Department of Pathology, Centre Hospitalier Universitaire Henri Mondor, Créteil, France. 8Hepatocellular Carcinoma Translational Research Laboratory, Barcelona Clínic Liver Cancer Group, Institut d’Investigacions Biomèdiques August Pi i Sunyer, Liver Unit. Centro de Investigación Biomédica en Red Enfermedades Hépaticas y Digestivas, Hospital Clínic, Barcelona, Spain. 9INSERM, UMR 1053, Université de Bordeaux, Bordeaux, France. 10Assistance Publique–Hôpitaux de Paris, Department of Digestive and Hepatobiliary Surgery, Centre Hospitalier Universitaire Henri Mondor, Créteil, France. 11INSERM, UMR 955, Créteil, France. 12Centre Hospitalier Universitaire de Bordeaux, Department of Hepatology, Hôpital Saint-André, Bordeaux, France. 13Department of Liver Surgery and Transplant, Fondazione Istituto Tumori, Milan, Italy. 14Mount Sinai Liver Cancer Program (Division of Liver Diseases), Mount Sinai School of Medicine, New York, New York, USA. 15Assistance Publique–Hôpitaux de Paris, Hôpitaux Universitaires Paris–Seine Saint-Denis, Site Jean Verdier, Pôle d’Activité Cancérologique Spécialisée, Service d’Hépatologie, Bondy, France. 16Centre Hospitalier Universitaire de Bordeaux, Pellegrin Hospital, Department of Pathology, Bordeaux, France. 17Institució Catalana de Recerca i Estudis Avançats, Barcelona, Spain. 18Assistance Publique–Hôpitaux de Paris, Hôpital Européen Georges Pompidou, Paris, France. 19These authors contributed equally to this work. Correspondence should be addressed to J.Z.-R. ([email protected]).
Received 13 August 2014; accepted 24 February 2015; published online 30 March 2015; doi:10.1038/ng.3252

©20
15N
atu
re A
mer
ica,
Inc.
All
rig
hts
res
erve
d.
2 ADVANCE ONLINE PUBLICATION Nature GeNetics
l e t t e r s
a hypermutation phenotype (Supplementary Table 3). Excluding this sample, we identified a median of 21 silent and 64 non-silent
mutations per tumor (ranging from 1 to 706 mutations in total), corresponding to a mean somatic mutation rate in coding sequences
of 1.3 mutations per megabase, consistent with previous reports11–13.
We analyzed the mutational spectrum of the 243 liver tumors to identify mutagenic processes operative in HCC. De novo signa-ture analysis using the Wellcome Trust Sanger
Signature 1A Signature 1B
Signature 6
Signature 24
Signature 4
Signature 16
IndelsTranscriptional strand biasDinucleotide mutations
Signature 5
Signature 23
Fra
ctio
n (%
)
20
10
0
20
10
0
20
10
0
1.0
0.5
Hei
ght
0MSig group
0
100
200
Num
ber
ofm
utat
ions
300
**400
1 2
Mutational signature
3 4 5 6
1A 1B16 23 24
4 56
MSig group
African originAge
10–6
10–4
10–3
10–2
0.05
Histological stage
Cirrhotic liver
Risk factors
Number of mutations
Driver genes
Featureenrichment
P value<63.5 years>63.5 yearsEarlyLateNoYesAlcoholTobaccoHBVLowHighTERTCTNNB1TP53
1 2 3 4 5 6100 36
154
2
0
–100
–200
–300
–400–200 –100 0 100
PC2
PC
3
PC1200
500
–5,000–10,000
0
a
b
c d
C>A C>G C>T T>A T>C T>G C>A C>G C>T T>A T>C T>G
C>A C>G C>T T>A T>C T>G C>A C>G C>T T>A T>C T>G C>A C>G C>T T>A T>C T>G
C>A C>G C>T T>A T>C T>G C>A C>G C>T T>A T>C T>G C>A C>G C>T T>A T>C T>G
Figure 1 Consensus signatures of mutational processes in HCC. (a) Patterns of signatures of the mutational processes operative in 243 liver exomes. Signatures 23 and 24 were identified de novo using the Wellcome Trust Sanger Institute mutational signatures framework, while the presence of signatures 1A, 1B, 4, 5, 6 and 16 was identified via reintroduction of consensus mutational signatures previously identified in liver cancer by a pan-cancer analysis14. Each signature is displayed according to the 96-substitution classification defined by the substitution class and sequence context immediately 5′ and 3′ to the mutated base. Signatures 1A, 1B, 4, 5, 6 and 16 match the signatures previously described in a pan-cancer study14, and the plotted patterns correspond to the updated consensus signatures. Signatures 23 and 24 are new. (b) Unsupervised hierarchical clustering of 243 liver tumors based on the intensity of the signatures operative in each sample. Tumors were classified into six mutational signature (MSig) groups and four singletons. The number of mutations attributed to each signature in each tumor is represented by the colored bars below the dendogram. An asterisk indicates tumors harboring more than 500 mutations. (c) Principal-component analysis of the mutational signature intensities in 243 liver tumors. Tumor samples are plotted in three dimensions using their projections onto the first three principal components (PCs). MSig group membership is represented by a color code and labels. (d) Clinical and molecular features associated with each MSig group. Associations were assessed using χ2 tests for categorical variables and ANOVA for quantitative features.
50a
c
bMutSig q value
CDKN1A
NFE2L2RPS6KA3
KEAP1 ACVR2AARID2 AXIN1
ALBARID1A
10
Promoter mutationNon-silent point mutationIndelHomozygous deletionFocal amplification
–log10 (MutSig P value)50 15
CDKN2ARB1
RPL22
TP53
CTNNB1
Alteration frequency
2.5%0.0510–410–810–12
40%
Gai
nD
elet
ion
Net
freq
uenc
y of
gai
n or
del
etio
n (%
)A
ltera
tion
freq
uenc
y in
HC
C (
%)
25
0
25
50
60
50
40
30
20
10
0
GainDeletion
CFH region
IRF2
PTPN3PTEN
AXIN1
RPS6KA3
Homozygousdeletion
CDKN2A
60 30 0
Frequency (%)
30 60
1
2
3
45
6
7
Chrom
osome
89
10
11
1213
1415
16
1718
JAK3CCNE1
FGF-CCND1
Focalamplification
MYC
MET
VEGFA
TERT
19
2021
22X
Y52.50
Frequency (%)
2.55TER
TC
TNN
B1
TP53
AR
ID1A
ALB
AX
IN1
AP
OB
CD
KN
2AA
RID
2R
PS
6KA
3D
ST
NF
E2L
2A
TMM
LL2
MA
P1B
TSC
2F
RA
S1
ATP
10B
FG
F-C
CN
D1
AC
VR
2AH
NF
1AA
SP
MN
AV
3P
TPR
BD
MD
FA
T4S
YN
E2
KE
AP
1R
B1
PE
G3
DO
CK
2
Figure 2 Integration of mutations, focal amplifications and homozygous deletions identifies putative driver genes in HCC. (a) The 161 putative driver genes identified by integrating mutations and focal CNAs are presented, with log-transformed mutation significance on the x axis and the net frequency of gains and deletions on the y axis. The size and color of each circle represent the alteration frequency and MutSig q value, respectively. Significantly mutated genes (q < 0.05) are labeled. (b) Frequency of CNAs along the genome. The top axis indicates the frequency of low-amplitude changes (gains and losses); the bottom axis indicates the frequency of high-amplitude changes (focal amplifications and homozygous deletions). Genes targeted by recurrent amplifications and homozygous deletions are labeled. (c) Bar plot indicating the number and type of events for the most frequently altered genes (≥4% of samples).

©20
15N
atu
re A
mer
ica,
Inc.
All
rig
hts
res
erve
d.
Nature GeNetics ADVANCE ONLINE PUBLICATION 3
l e t t e r s
Institute mutational signatures framework identified four signatures (Supplementary Figs. 2 and 3). Two signatures were previously identified in a pan-cancer analysis (corresponding to signatures 6 and 16)14,15, and two were new (termed signatures 23 and 24). Mutational catalogs derived from exome data may underestimate the number of operative signatures16, and 8 signatures were previously identified by analyzing the whole genomes of 88 liver cancers (signa-tures 1A, 1B, 4, 5, 6, 12, 16 and 17)14. To determine the complete set of
signatures in our series, we evaluated the contribution of these eight previously identified signatures and the two new signatures identi-fied de novo (Online Methods). Altogether, we found 8 signatures (all except signatures 12 and 17) at different strengths in the 243 samples (Fig. 1a and Supplementary Table 4).
Hierarchical clustering of the samples, based on the contributions of the mutational signatures in each sample, identified six groups of tumors (MSig1 to MSig6) and four singletons that were significantly
No knownetiology
Hepaticdifferentiation 34%
FA
Cabozantinib
HRAS, NRAS,KRAS
MAPK1,MAPK3
ImatinibAxitinib
RamucirumabPazopanibPonatinibSorafenib
GRB2
SorafenibVemurafenibDabrafenibTrametinib
Regorafenib
Ruxolitinib
JAK1≤1%
CRAF
SMARCE1≤1%
MAPK10≤1%
AlcoholHBV
ErlotinibPanitumumab
CetuximabTrastuzumabPertuzumab
AfatinibLapatinibGefitinib
SorafenibAxitinib
PonatinibRegorafenibPazopanib
Cabozantinib
EverolimusTemsirolimus
Sirolimus
Tofacitinib
EP3002%
WNT10B1%
WNT10A≤1%
PIK3C2B1%
AXIN21%
GSK3B
TSC13%
CUL3≤1%
NFE2L1≤1%
NFE2L3≤1%
DNA
CTNNB137%
TP5324%
MTOR2%
NFE2L26%
KEAP14%
AXIN111%
AKT2≤1%
TSC25%
RPS6KA37%
MACF13%
PI3K11%
STAT1<1%
FZR12% JAK3
3%
IGF1R2%
FLTs6%
ACVR2A5%
IL genes
FGF45%
INHB genes
CCND15%
ATM6%
CCNE11%
CDK4/6<1%
CDK2
PRKDC2%ATR2%
PCAF
CREBBP3%
TCF7L22%
TCF genes
LEFs
RB14% MDM2
2%
HUWE13%
DAPK13%
PTEN3%
RHEB
USP343%
CDKN1A2%
Oxidativestress 12%
Wnt-β-catenin
54%
PI3K-AKT-mTOR 51%
MLL43%
MLL32%
MLL26%
MLL51%
MLL complex
Epigenetic regulators32%
p53/cell cycle49%
TGF-β5%
MAPK 43%
CDKN2B5%
MET1%
Telomeremaintenance 60%
Alcohol
SMARCB1≤1%
ARID1B1%
ARID1A13%
ARID27%
PBRM12%
SMARCA4≤1%
SMARCD≤1%
SMARCC21%
ACTL6A/B1%
pBAFBAF
SMARCC1≤1%
IRF21%
APC1%
PIK3R21%
Alcohol
TERT60%
FA
FA
FA
FA
FABRAF<1%
GDF15<1%
FA
IL6
FA
ImatinibDasatinibBosutinibNilotinib
Ponatinib
FGA3%
CFH3%
HNF1A5%
A2M3%
CFHRs2%
F83%
GDF1<1%
FA
JAK2
Cytoplasm
Nucleus
ALB13%
RegorafenibPonatinib
Nintedanib
FGF195%
SRCAP3%
SETD23%
CHD73%
SMC33%
PHF20L12%
NCOR23%
SMCHD13%
SLX43%
FA
PIK3CA2%
ZNRF33%
INSR1%
BevacizumabAflibercept
VEGFA1%
Protumorigenicmacrophages
FA
FA
NTRK33%
FGFRs1%
MYC1%
FOS
JUN
ERBB2<1%
EGFR1%
KDR<1%
TEK1%
FA
STAT3
APOB9%
AlcoholFA
FA
IL6ST2%
WNT7B≤1%
FA TocilizumabIL6R1%
Alcohol
SMARCA23%
Alcohol
CDKN2A9%
KIT1%
SorafenibRegorafenib
PDGFRs3%
BCRABL1≤1%
HGF3% FGF3
4%
Ponatinib
EPHA43%
SOS12%
MAPKK11%MAP3K10
1%
MLL1
Complex
IL-6/JAK-STAT9%
Extracellularspace
Chromatin-remodelingcomplexes 28%
Figure 3 The landscape of altered genes and pathways in HCC. Shown are the 11 pathways altered in ≥5% of HCCs. Genes belonging to each pathway are represented with their alteration frequencies (green font, inactivation; orange font, activation; white font, unknown), and activating or inhibiting interactions between pathways are highlighted. Major genes lacking alterations are highlighted in white. Focal amplifications (FAs) and significant associations with etiologies are indicated. Potential druggable genes are assigned (yellow, FDA-approved drugs; lightning symbols, drugs screened in phase I–III clinical trials).

©20
15N
atu
re A
mer
ica,
Inc.
All
rig
hts
res
erve
d.
4 ADVANCE ONLINE PUBLICATION Nature GeNetics
l e t t e r s
associated with demographic, etiological and molecular features (Fig. 1b–d and Supplementary Tables 4 and 5). MSig1 included nine HCCs enriched in signature 4 (frequent C>A and dinucleotide mutations), which has previously been shown to be associated with tobacco use14,17. The prevalence of smokers in MSig1 was high (57%) but not significantly different from that for the other groups. The MSig2 group (five HCCs) was characterized by the new signature 24 showing a high rate of C>A mutations. All of the patients in the MSig2 group were migrants born in subtropical African countries and infected by HBV. Three of these tumors displayed a somatic TP53 mutation encoding p.Arg249Ser typical of AFB1-exposed HCC18,19, suggesting that signature 24 reflects the mutational pattern induced by AFB1. There was an equal prevalence of mutations for signatures 5 and 16 (49% each) in MSig3. This particular group included 19 highly mutated HCCs associated with alcohol and tobacco exposure (67%; P = 6 × 10⁻⁵, Fisher’s exact test), CTNNB1 mutation (74%; P = 8 × 10⁻⁴) and non-cirrhotic livers (79%; P = 0.02). These results suggest a geno-toxic, synergistic effect of alcohol and tobacco exposures in 8% of the patients who developed a homogeneous molecular subtype of tumors. MSig4 tumors were characterized by frequent TP53 mutations and signature 5, enriched in T>C transitions. Mutations in the 46 tumors classified in MSig5 were related to signatures 1A and 1B, resulting from spontaneous deamination at NCG trinucleotides (where the underlined nucleotide is mutated) acquired through the patient’s life-time14. This group of tumors demonstrated a low mutation rate and an early histological stage, but these tumors also had lower tumor cell content, so this group may partly be related to normal cell contamination
(Online Methods). Signature 16 accounted for 79% of mutations in MSig6 tumors and was associated with older patients and with TERT and CTNNB1 mutations. Among the tumors classified as singletons, one (BCM723T) showed mutations from signature 6, which is char-acteristic of cancers with defective DNA mismatch repair, displaying numerous indels. The newly identified signature 23 was only encoun-tered in the hypermutated tumor CHC892T, occurring in a 71-year-old female presenting with a non-fibrotic liver having black anthracotic pigment deposition, predominantly in macrophages and vessels (Supplementary Fig. 4). This signature was characterized by a pre-dominance of C>T mutations with a strong strand bias that may result from the interplay between an unknown mutagenic process affecting predominantly guanine residues and transcription-coupled nucleotide excision repair15. To validate the mutational signatures identified in our series, we analyzed the mutation patterns identified by exome sequencing in the International Cancer Genome Consortium (ICGC)-Japan (452 tumors)20 and The Cancer Genome Atlas (TCGA) cohorts of 198 tumors. Consistent with the study by Totoki et al.20, we found an enrichment of T>C mutations in an ATN context in the Japanese data. We also found two tumors with mutational patterns corresponding to our signatures 6 and 23, validating the occurrence of these signatures in rare HCC cases (Supplementary Fig. 5). Six tumors in the TCGA data clustered with our MSig2 cases and displayed patterns similar to the AFB1-related signature 24. These cases were all African or Asian (P = 0.002, Fisher’s exact test), and three of them displayed the char-acteristic TP53 mutation encoding p.Arg249Ser (P = 8 × 10⁻⁴, Fisher’s exact test) (Supplementary Fig. 6).
We used MutSigCV to identify cancer driver genes21. Fourteen genes were significantly enriched for damaging mutations (q < 0.05; Fig. 2a): TP53, CTNNB1, AXIN1, ALB, ARID1A, ARID2, ACVR2A, NFE2L2, RPS6KA3, KEAP1, RPL22, CDKN2A, CDKN1A and RB1 (Supplementary Table 6). We also analyzed copy number altera-tions (CNAs) by comparing sequence coverage in the 243 tumors and matched non-tumor liver samples. The pattern of broad gains and losses was consistent with previous reports in HCC (Fig. 2b)11,22,23.
TP53 KEAP1AXIN1ARID1A
RPS6KA3 CCND1 TSC2
TERT
MLL2
ARID2 NFE2L2
APOBCTNNB1 Exclusion
Association
P = 0.001–0.009
P = 0.01–0.05
P = 0.001–0.01
P < 0.001
WNT/β-catenin
Chromatinremodeling
p53/cell cycle
Epigeneticregulation
Telomeremaintenance
Oxidativestress
Hepaticdifferentiation
MAPK
PI3K-AKT-mTOR
Figure 4 Major clusters of associated alterations. Shown are the three major groups of associated alterations: the CTNNB1 cluster, the AXIN1 cluster and the TP53 cluster. Significant associations and exclusions between genes are represented, with line widths proportional to significance, as indicated. Outline colors for each gene indicate its participation in a particular pathway.
5,000
a b
c
KEAP1mutation
4,000
3,000
NQ
O1
mR
NA
exp
ress
ion
2,000
1,000
0
JHH
-2JH
H-4
SN
U88
6
Huh
6H
ep3B
SN
U42
3S
NU
739
SN
U18
2
SN
U87
8S
NU
449
SN
U35
4S
MM
C77
21P
LCP
RF
5JH
H-7
BE
L740
2M
ahla
vu
MH
CC
97H
huH
-1
Hep
G2
Huh
7
JHH
-5
SN
U36
8S
NU
387
HLF
HLE
SN
U76
1
JHH
-1
JHH
-6
SN
U39
8
100
50
Per
cent
of c
ell v
iabi
lity
00.001 0.01 0.1
17-AAG (µM)
1 10
JHH-4
JHH-5
MHCC97H
17-AAG
17-DMAG
Gl50 (µM)
0.026 10
1.0
0.5
0
log 10
(17
-AA
G G
l 50)
–0.5
–1.0
–1.5
NQO1 protein expression0 5 10 15 20 25 30
KEAP1 WTKEAP1 MTKEAP1 MT-NQO1*2
Figure 5 Sensitivity of liver cancer cell lines to HSP90 inhibitors is associated with NQO1 expression. (a) Sensitivity of 29 liver cancer cell lines to 17-AAG and 17-DMAG was assessed by a cell viability assay. The heat map presents the GI50 values for the two drugs in each cell line, and mRNA expression levels of NQO1 are presented atop the heat map. Three cell lines harboring KEAP1 mutations are indicated. (b) Correlation between NQO1 protein expression and sensitivity to 17-AAG. A color code indicates cell lines with KEAP1 mutations and the MHCC97H cell line that harbors a KEAP1 mutation but is homozygous for the NQO1*2 variant causing NQO1 enzymatic deficiency. WT, wild type; MT, mutated. (c) Cell viability curves for cell lines JHH-4 (KEAP1 wild type), JHH-5 (KEAP1 mutated) and MHCC97H (KEAP1 mutated and NQO1*2 homozygous) in the presence of the HSP90 inhibitor 17-AAG. Results are shown as means ± s.e.m. Each experiment was repeated two times for each cell line.
©20
15N
atu
re A
mer
ica,
Inc.
All
rig
hts
res
erve
d.
Nature GeNetics ADVANCE ONLINE PUBLICATION �
l e t t e r s
We identified recurrent homozygous deletions of the CFH locus, IRF2, CDKN2A, PTPN3, PTEN, AXIN1 and RPS6KA3 and recurrent focal amplifications of TERT, VEGFA, MET, MYC, the FGF-CCND1 locus containing FG3, FG4 and FGF19, JAK3 and CCNE1 (Supplementary Table 7a,b). Next, we developed a pipeline integrating focal CNAs and mutations, identifying 161 putative driver genes in liver cancer (Fig. 2c, Online Methods and Supplementary Table 8).
To identify cellular pathways associated with HCC, we annotated the 161 candidate driver genes using the Gene Ontology (GO) data-base and manually curated the precise role of each gene in pathways (Online Methods). We found 11 pathways altered in ≥5% of HCCs (Fig. 3 and Supplementary Figs. 7–9): TERT promoter mutations activating telomerase expression (60%)24, WNT/β-catenin (54%), phosphoinositide 3-kinase (PI3K)-AKT-mTOR (51%), TP53/cell cycle (49%), mitogen-activated protein kinase (MAPK) (43%), hepatic differentiation (34%), epigenetic regulation (32%), chromatin remod-eling (28%), oxidative stress (12%), interleukin (IL)-6/JAK-STAT (9%) and transforming growth factor (TGF)-β (5%). This analysis identified new genes recurrently mutated in HCC: β-catenin inhibi-tors (ZNRF3, USP34 and MACF1), hepatocyte-secreted proteins (APOB and FGA) and the TGF-β receptor ACVR2A, recently associ-ated with chondrosarcoma25. We then identified significant associa-tions between mutations and risk factors (Supplementary Table 9). Alcohol-related HCCs were significantly enriched in CTNNB1, TERT, CDKN2A, SMARCA2 and HGF alterations (P < 0.05, χ2 tests for trend in proportions). HBV-related HCCs were frequently mutated in TP53, and we exclusively identified IL6ST mutations in HCCs with no known etiology. In contrast, HCV infection, metabolic syndrome and hemochromatosis did not show significant associations.
Because each tumor accumulates numerous damaging mutations, we identified three major clusters of associated alterations, centered on CTNNB1, AXIN1 and TP53 (Fig. 4, Supplementary Fig. 10 and Supplementary Table 10). Interestingly, alterations of genes belong-ing to the same pathway were frequently distributed in different clus-ters. These results may reflect cooperation, functional redundancy or lethality of gene combinations and may contribute to better predicting the efficacy of targeted therapies.
Next, we defined the catalog of actionable genomic alterations among the 11 major pathways. Altogether, 28% of patients har-bored at least one damaging alteration potentially targetable by an
FDA-approved drug (Fig. 3, Supplementary Fig. 11 and Supplementary Table 11), and 86% harbored a mutation targetable by a drug studied in phase I to phase III clinical trials (Supplementary Fig. 11 and Supplementary Table 12). Alterations targetable by FDA-approved drugs comprised focal amplifications or mutations of FLT genes (6%), FGF3, FGF4 or FGF19 (4%), PDGFR genes (3%), EPHA4 (3%), JAK3 (3%), VEGFA (1%), HGF (3%), MTOR (2%), EGFR (1%), FGFR genes (1%), IL6R (1%), KIT (1%), MET (1%), TEK (1%), BRAF (<1%), ERBB2 (<1%), JAK1 (<1%) and KDR (<1%). We also showed in vitro that inactivating mutations of RPS6KA3 (7%) induced activation of the RAS-MAPK pathway with increased levels of phosphorylated ERK1 and ERK2 (ERK1/2) (Supplementary Fig. 12), suggesting that RPS6KA3-mutated HCCs could be targeted by ERK or MEK inhibitors. Notably, advanced-stage tumors harbored more potentially targetable alterations, including, in particular, FGF-CCND1 amplifications (Supplementary Fig. 13).
In addition to alterations in driver genes that can be directly inhibited by targeted drugs, other alterations might potentiate the drug sensitivity of cancer cells. These include changes to NQO1, which markedly increase sensitivity to the HSP90 inhibitor 17-N-allylamino- 17-demethoxygeldanamycin (17-AAG) by reducing this compound to a more potent inhibitor26,27. NQO1 expression is induced by the oxidative stress pathway, which was activated in 12% of HCCs, primarily by mutations of KEAP1 or NFE2L2. To test whether these tumors could be more sensitive to HSP90 inhibitors, we assessed the response of 29 liver cancer cell lines to 17-AAG and 17-dimethylaminoethylamino-17-demethoxygeldanamycin (17-DMAG) (Fig. 5a). We found that growth inhibition of 50% (GI50) was signifi-cantly inversely correlated with the expression of NQO1 (Pearson’s r = −0.56, P = 0.0015; Fig. 5b). Two of the three cell lines harboring KEAP1-inactivating mutations were highly sensitive to HSP90 inhibi-tors, whereas the third mutated cell line, which was less sensitive, was homozygous for the NQO1 mutation (NQO1*2 allele, rs1800566) encoding the p.Pro187Ser missense variant causing NQO1 deficiency (Fig. 5c)28. These findings suggest that tumors with high NQO1 expression may be more sensitive to HSP90 inhibitors, except in patients with a homozygous genotype encoding p.Pro187Ser.
Finally, we explored the progression of HCC in cirrhotic and non-cirrhotic livers. We identified an increased number of gene mutations (P = 1.2 × 10⁻³, Jonckheere-Terpstra test) and chromosome
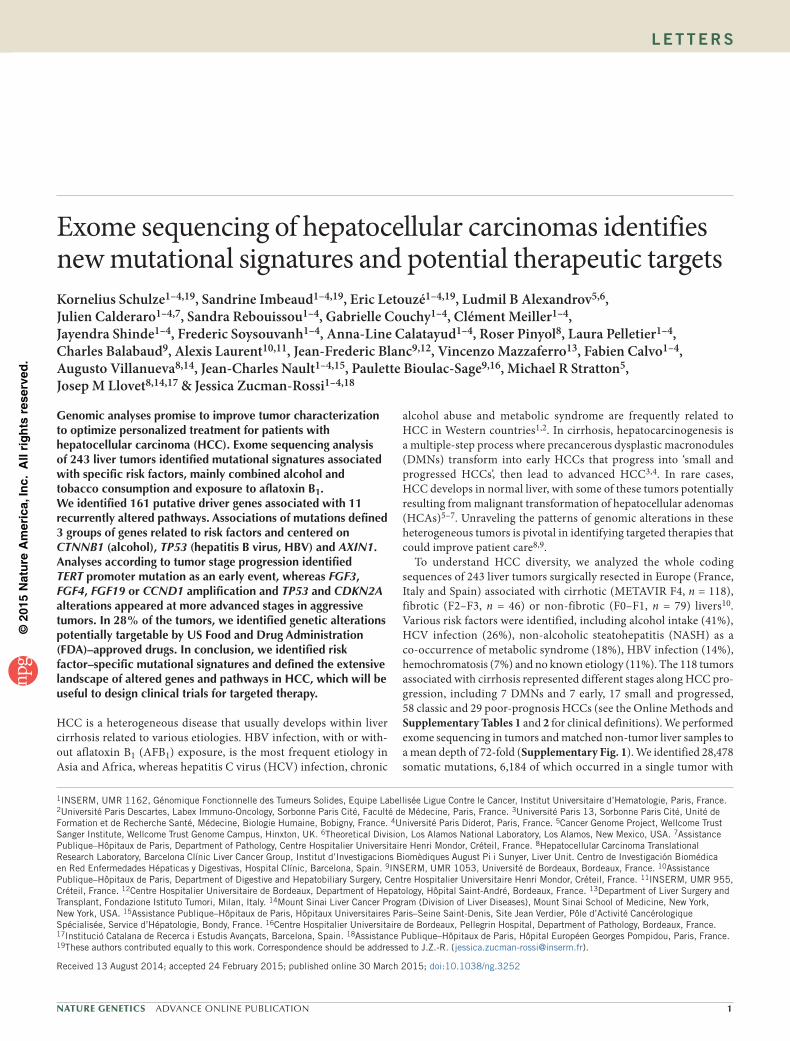
Figure 6 Molecular features of HCC progression in cirrhotic and non-cirrhotic liver. (a) The box-and-whisker plots show the distribution of mutation numbers (top) and chromosome instability scores (bottom) relative to tumor stage in cirrhotic (left) and non-cirrhotic (right) liver. FAA, fraction of aberrant arms; DMN, dysplastic macronodule; HCA, hepatocellular adenoma; HCC, hepatocellular carcinoma; poor, poor prognosis. The middle bar represents the median, and the box represents the interquartile range; bars extend to 1.5 times the interquartile range. An asterisk indicates HCAs and HCCs in HCA samples from a previous study7. (b) Genetic alterations with significantly different frequencies across tumor stages in cirrhotic (top) and non-cirrhotic (bottom) liver. **P < 0.01, ***P < 0.001, χ2 test for trends in proportion. (c) Kaplan-Meier curves for overall survival in the presence of absence of CDKN2A alteration (left) or FGF-CCND1 amplification (right), two features found to be significantly associated with survival in a multivariate Cox model. P values were obtained using Wald tests. M, mutated; NM, not mutated.
a
250200
Num
ber
ofm
utat
ions
Chr
omos
ome
inst
abili
ty(F
AA
sco
re)
150100
50
0.8
0.6
0.4
0.2
0DMN Early Classic
Cirrhotic liver (F4)
PoorSmall
0DMNn = 7
Earlyn = 7
Smalln = 17
Classicn = 58
Poorn = 29
Cirrhotic liver (F4) Non-cirrhotic liver (F0–F1)
Non-cirrhotic liver (F0–F1)
HCAn = 38*
HCA HCCHCCin HCA
HCCin HCAn = 10*
HCCn = 71
b
c
90 HCC on cirrhotic liver
HCC on non-cirrhotic liver
HCAHCC in HCAHCC
*****
***
**
** ****
60
30
Alte
ratio
nfr
eque
ncy
Alte
ratio
nfr
eque
ncy
0
90
60
30
0
CTNNB1 TP53 FGF-CCND1
HNF1A IL6ST TERT
CTNNB1 TP53 FGF-CCND1
HNF1A IL6ST TERT
EarlySmall Poor
Classic
MonthsNumbers
at risk
100
75
50
Ove
rall
surv
ival
(%
)
250
0 20 40 60
199 145 88 52
CDKN2A
P = 3.0 × 10⁻⁴
NM
M
34817NMM
0 20 40 60
205 149 92 55
100
75
50
250
FGF-CCND1
P = 7.4 × 10⁻⁶
11 4 0 0
NM
M

©20
15N
atu
re A
mer
ica,
Inc.
All
rig
hts
res
erve
d.
6 ADVANCE ONLINE PUBLICATION Nature GeNetics
l e t t e r s
aberrations (P = 1.3 × 10⁻⁵, Jonckheere-Terpstra test) along DMN malignant transformation to poor-prognosis HCC (Fig. 6a). Although TERT promoter mutations were already frequent at early stages, CTNNB1 and TP53 mutation frequencies increased significantly with progression, and focal amplifications at the FGF-CCND1 locus were mostly encountered in poor-prognosis HCCs (P < 0.01, χ2 test for trend in proportions; Fig. 6b). Interestingly, chromosome aberrations appeared later than gene mutations during progression. Although we observed similar findings in tumors that developed in non-fibrotic liver with respect to the progressive accumulation of mutations and CNAs, TERT promoter mutations were later events during malig-nant transformation. Moreover, HNF1A and IL6ST mutations were restricted mostly to HCAs, suggesting that most of the HCCs in non-fibrotic liver did not derive from the transformation of an adenoma (Fig. 6b). A link between FGF19 expression and overall survival has been described in the literature22,24,29–32. Using a multivariate sur-vival analysis, we found that CDKN2A inactivation and FGF-CCND1 amplification were associated with poor prognosis in our cohort of resected HCCs, independently of classical prognostic clinical and histological features (Fig. 6c and Supplementary Table 13).
In conclusion, our study identified relationships between envi-ronmental exposures and mutational patterns in HCC as well as the landscape of driver genes and pathways altered in different clinical stages and etiological backgrounds. For patient care, genomic altera-tions identified in targetable genes will be useful to identify patients with HCC who could potentially benefit from targeted treatment in future clinical trials.
URLs. Data generation by the TCGA Research Network, http://cancergenome.nih.gov/; R software, v2.15.0, http://www.R-project.org/; Oncotator, http://www.broadinstitute.org/cancer/cga/Oncotator/; Gene Ontology (GO) database, http://www.geneontology. org/; GeneCards, http://www.genecards.org/; KEGG pathway database, http://www.genome.jp/kegg/pathway.html, National Cancer Institute (NCI) Drug Dictionary, http://www.cancer.gov/ drugdictionary.
MEtHoDSMethods and any associated references are available in the online version of the paper.
Accession codes. The sequences reported in this paper have been deposited in the EGA (European Genome-phenome Archive) database (accessions EGAS00001000217, EGAS00001000679 and EGAS00001001002) and the International Cancer Genome Consortium (ICGC) data portal (http://dcc.icgc.org/; release 18, 11 February 2015).
Note: Any Supplementary Information and Source Data files are available in the online version of the paper.
ACKNowLEdGMENtSWe warmly thank A. Boulais, C. Guichard, I. Ben Maad and C. Pilati for helpful participation in this work. We thank L. de Koning, C. Baldeyron, A. Barbet and C. Lecerf from the Institut Curie for the reverse-phase protein array experiments. We also thank J. Saric, C. Laurent, L. Chiche, B. Le Bail and C. Castain (Centre Hospitalier Universitaire Bordeaux) and D. Cherqui and J. Tran Van Nhieu (Centre Hospitalier Universitaire Henri Mondor, Créteil) for contributing to the tissue collection. This work was supported by Institut National du Cancer (INCa) with the ICGC project, the PAIR-CHC project NoFLIC (funded by INCa and Association pour la Recherche contre le Cancer, ARC), HEPTROMIC (Framework Programme 7), Cancéropole Ile de France, Centres de Ressources Biologiques (CRB) Liver Tumors, Tumorotheque Centre Hospitalier Universitaire Bordeaux and
Centre Hospitalier Universitaire Henri Mondor, BioIntelligence (OSEO) and INSERM. J.-C.N. was supported by a fellowship from INCa. K.S. is supported by the Deutsche Forschungsgemeinschaft (DFG grant SCHU 2893/2-1). Research performed at Los Alamos National Laboratory was carried out under the auspices of the National Nuclear Security Administration of the US Department of Energy. V.M. is supported by a grant from AIRC (Italian Association for Cancer Research). J.M.L. is supported by grants from the European Comission Framework Programme 7 (HEPTROMIC, proposal 259744), The Samuel Waxman Cancer Research Foundation, the Spanish National Health Institute (SAF-2010-16055 and SAF-2013-41027) and the Asociación Española Contra el Cáncer (AECC).
AUtHoR CoNtRIBUtIoNSStudy concept and design: K.S., S.I., E.L., L.B.A., M.R.S., J.M.L. and J.Z.-R. Acquisition of data: J.C., S.R., G.C., C.M., F.S., A.-L.C., R.P., L.P., C.B., A.L., J.-F.B., V.M., A.V., J.-C.N. and P.B.-S. Analysis and interpretation of data: K.S., S.I., E.L., L.B.A., J.C., S.R., G.C., C.M., J.S., F.S., A.-L.C., R.P., L.P., A.V., J.-C.N. and J.Z.-R. Drafting the manuscript: K.S., S.I., E.L., S.R. and J.Z.-R. Critical revision of the manuscript: K.S., S.I., E.L., L.B.A., J.C., S.R., R.P., C.B., J.-F.B., J.-C.N., P.B.-S., J.M.L. and J.Z.-R. Statistical analysis: K.S., S.I. and E.L. Obtained funding: F.C., J.M.L. and J.Z.-R.
CoMPEtING FINANCIAL INtEREStSThe authors declare no competing financial interests.
Reprints and permissions information is available online at http://www.nature.com/reprints/index.html.
1. Forner, A., Llovet, J.M. & Bruix, J. Hepatocellular carcinoma. Lancet 379, 1245–1255 (2012).
2. El-Serag, H.B. Hepatocellular carcinoma. N. Engl. J. Med. 365, 1118–1127 (2011).3. International Consensus Group for Hepatocellular Neoplasia. Pathologic diagnosis
of early hepatocellular carcinoma: a report of the international consensus group for hepatocellular neoplasia. Hepatology 49, 658–664 (2009).
4. Roncalli, M. et al. Liver precancerous lesions and hepatocellular carcinoma: the histology report. Dig. Liver Dis. 43 (suppl. 4), S361–S372 (2011).
5. Zucman-Rossi, J. et al. Genotype-phenotype correlation in hepatocellular adenoma: new classification and relationship with HCC. Hepatology 43, 515–524 (2006).
6. Nault, J.C., Bioulac-Sage, P. & Zucman-Rossi, J. Hepatocellular benign tumors- from molecular classification to personalized clinical care. Gastroenterology 144, 888–902 (2013).
7. Pilati, C. et al. Genomic profiling of hepatocellular adenomas reveals recurrent FRK-activating mutations and the mechanisms of malignant transformation. Cancer Cell 25, 428–441 (2014).
8. Bruix, J., Gores, G.J. & Mazzaferro, V. Hepatocellular carcinoma: clinical frontiers and perspectives. Gut 63, 844–855 (2014).
9. Llovet, J.M. & Hernandez-Gea, V. Hepatocellular carcinoma: reasons for phase III failure and novel perspectives on trial design. Clin. Cancer Res. 20, 2072–2079 (2014).
10. French METAVIR Cooperative Study Group. Intraobserver and interobserver variations in liver biopsy interpretation in patients with chronic hepatitis C. The French METAVIR Cooperative Study Group. Hepatology 20, 15–20 (1994).
11. Guichard, C. et al. Integrated analysis of somatic mutations and focal copy-number changes identifies key genes and pathways in hepatocellular carcinoma. Nat. Genet. 44, 694–698 (2012).
12. Fujimoto, A. et al. Whole-genome sequencing of liver cancers identifies etiological influences on mutation patterns and recurrent mutations in chromatin regulators. Nat. Genet. 44, 760–764 (2012).
13. Kan, Z. et al. Whole-genome sequencing identifies recurrent mutations in hepatocellular carcinoma. Genome Res. 23, 1422–1433 (2013).
14. Alexandrov, L.B. et al. Signatures of mutational processes in human cancer. Nature 500, 415–421 (2013).
15. Helleday, T., Eshtad, S. & Nik-Zainal, S. Mechanisms underlying mutational signatures in human cancers. Nat. Rev. Genet. 15, 585–598 (2014).
16. Alexandrov, L.B., Nik-Zainal, S., Wedge, D.C., Campbell, P.J. & Stratton, M.R. Deciphering signatures of mutational processes operative in human cancer. Cell Rep. 3, 246–259 (2013).
17. Alexandrov, L.B. & Stratton, M.R. Mutational signatures: the patterns of somatic mutations hidden in cancer genomes. Curr. Opin. Genet. Dev. 24, 52–60 (2014).
18. Hsu, I.C. et al. Mutational hotspot in the p53 gene in human hepatocellular carcinomas. Nature 350, 427–428 (1991).
19. Bressac, B., Kew, M., Wands, J. & Ozturk, M. Selective G to T mutations of p53 gene in hepatocellular carcinoma from southern Africa. Nature 350, 429–431 (1991).
20. Totoki, Y. et al. Trans-ancestry mutational landscape of hepatocellular carcinoma genomes. Nat. Genet. 46, 1267–1273 (2014).
21. Lawrence, M.S. et al. Mutational heterogeneity in cancer and the search for new cancer-associated genes. Nature 499, 214–218 (2013).

©20
15N
atu
re A
mer
ica,
Inc.
All
rig
hts
res
erve
d.
Nature GeNetics ADVANCE ONLINE PUBLICATION �
l e t t e r s
22. Sawey, E.T. et al. Identification of a therapeutic strategy targeting amplified FGF19 in liver cancer by oncogenomic screening. Cancer Cell 19, 347–358 (2011).
23. Chiang, D.Y. et al. Focal gains of VEGFA and molecular classification of hepatocellular carcinoma. Cancer Res. 68, 6779–6788 (2008).
24. Nault, J.C. et al. High frequency of telomerase reverse-transcriptase promoter somatic mutations in hepatocellular carcinoma and preneoplastic lesions. Nat. Commun. 4, 2218 (2013).
25. Totoki, Y. et al. Unique mutation portraits and frequent COL2A1 gene alteration in chondrosarcoma. Genome Res. 24, 1411–1420 (2014).
26. Barretina, J. et al. The Cancer Cell Line Encyclopedia enables predictive modelling of anticancer drug sensitivity. Nature 483, 603–607 (2012).
27. Garnett, M.J. et al. Systematic identification of genomic markers of drug sensitivity in cancer cells. Nature 483, 570–575 (2012).
28. Siegel, D. et al. Rapid polyubiquitination and proteasomal degradation of a mutant form of NAD(P)H:quinone oxidoreductase 1. Mol. Pharmacol. 59, 263–268 (2001).
29. Ahn, S.M. et al. Genomic portrait of resectable hepatocellular carcinomas: implications of RB1 and FGF19 aberrations for patient stratification. Hepatology 60, 1972–1982 (2014).
30. Wang, K. et al. Genomic landscape of copy number aberrations enables the identification of oncogenic drivers in hepatocellular carcinoma. Hepatology 58, 706–717 (2013).
31. Hyeon, J., Ahn, S., Lee, J.J., Song, D.H. & Park, C.K. Expression of fibroblast growth factor 19 is associated with recurrence and poor prognosis of hepatocellular carcinoma. Dig. Dis. Sci. 58, 1916–1922 (2013).
32. Miura, S. et al. Fibroblast growth factor 19 expression correlates with tumor progression and poorer prognosis of hepatocellular carcinoma. BMC Cancer 12, 56 (2012).

©20
15N
atu
re A
mer
ica,
Inc.
All
rig
hts
res
erve
d.
Nature GeNetics doi:10.1038/ng.3252
oNLINE MEtHoDSLiver samples. A series of 243 liver tumor samples and their non-tumor coun-terparts were collected from patients surgically treated in Europe: 193 cases from France (Créteil and Bordeaux), 9 cases from Spain (Barcelona) and 41 cases from Italy (Milan). The study was approved by institutional review board committees (CCPRB Paris Saint-Louis, 1997, 2004 and 2010, approval number 01-037; Bordeaux, 2010-A00498-31). Written informed consent was obtained in accordance with French legislation. All samples were immediately frozen in liquid nitrogen and stored at −80 °C.
Clinical data. Clinicopathological data were available for all cases. Risk fac-tors were defined by substantial alcohol intake, HCV, HBV, hemochromato-sis, no known etiology and NASH as co-occurrence of metabolic syndrome. Metabolic syndrome consists of a combination of disorders, including central obesity (waist circumference >102 cm (males), >88 cm (females)), hypertri-glyceridemia (triglycerides >150 mg/dl), low high-density lipoprotein serum levels (<40 mg/dl), arterial hypertension (>130 mm Hg systolic or >85 mm Hg diastolic) and raised fasting plasma glucose (FPG) levels ≥1.1 mg/dl or previously diagnosed type 2 diabetes. At least three of the latter criteria had to be fulfilled for diagnosis. NASH can be the chronic consequence of non-alcoholic fatty liver disease (NAFLD), which frequently co-occurs in patients with metabolic syndrome and is characterized by hepatocellular accumulation of triglycerides in the absence of substantial alcohol consumption. By contrast, NASH additionally includes the presence of inflammation and can display different degrees of fibrosis. Patients without known etiology were those that did not display the above frequent etiologies or rare etiologies (such as primary biliary cirrhosis, autoimmune hepatitis and primary sclerosing cholangitis). Samples were classified according to clinical, pathological and genetic features as previously described by Guichard et al. (Supplementary Tables 1 and 2)11. In all HCC samples, the ratio of tumor cells to non-tumor cells was evalu-ated to be >50%; the PurBayes method33 estimated an average of 70% (range of 39–100%) tumor purity on the basis of sequencing data (Supplementary Table 14). Definition of DMN and early, small and progressed, classic and poor-prognosis HCCs was based on histopathological criteria in HCC pro-posed by the International Consensus Group for Hepatocellular Neoplasia3,4. DMN was defined by macronodules containing low-grade (a cell population lacking architectural atypia with a mild increase in cellularity as compared to the surroundings; portal tracts detectable) or high-grade (frank cytologi-cal and architectural atypia as compared to the surroundings but insufficient for a diagnosis of malignancy; portal tracts detectable) dysplastic nodules. Early HCC was defined by a diameter ≤2 cm and a vaguely nodular lesion with indistinct margins and a well-differentiated histology that might require careful distinction from high-grade dysplastic nodules; few portal tracts were detectable. Small and progressed HCC was defined by a diameter ≤2 cm and a distinctly nodular lesion with well- (G1) to moderately (G2) differentiated histology in which malignancy was recognized at first glance; no portal tracts were detectable. Poor-prognosis HCC was defined by HCC cases displaying recurrence within 2 years. Classic HCC was defined as non-early, non-small, non–poor prognosis HCC.
Genomic DNA extraction. We extracted DNA using a salting-out procedure34. Genomic DNA was loaded on a 0.8% agarose gel for quality control; only DNA >10 kb in size was selected. DNA quantification was performed using Hoechst 33258 from Sigma Chemical.
Exome capture, library construction and sequencing. Sequence capture, enrichment and elution for 243 pairs of genomic DNA were performed by IntegraGen as previously described in Guichard et al. with some modifica-tions11. Agilent in-solution enrichment was used with the manufacturer’s biotinylated oligonucleotide probe library (SureSelect Human All Exon kit v2-46Mb (n = 36 pairs), v3-52Mb (n = 7 pairs), v4-70Mb (n = 56 pairs) or v5+UTRs-75Mb (n = 144 pairs), Agilent Technologies) according to the manufacturer’s instructions. The eluted enriched DNA sample was sequenced on an Illumina HiSeq 2000 sequencer as paired-end 75-base reads as pre-viously described35. Image analysis and base calling were performed using Illumina Real-Time Analysis (RTA) Pipeline v1.12 with default parameters. Whole-exome sequencing pre-analysis was based on the Illumina pipeline
(CASAVA1.8.2). Only the positions included in the bait coordinates were con-served. Each sample was sequenced to an average depth of 72.0×, with ~96.9% of the targeted regions covered by ≥1×, ~92.6% covered by ≥10× and ~82.9% covered by ≥25× (Supplementary Fig. 1).
Identification of somatic variants. A list of variants was generated (Supplementary Table 3) considering only somatic mutations in cod-ing regions plus consensus intronic bases (missense, nonsense, splice-site, indel and synonymous mutations) as previously described in Guichard et al. with some modifications11. Polymorphisms referenced in dbSNP135 or the 1000 Genomes Project with a minor allele frequency over 2% were removed. Functional evidence of predictive drastic consequences for the variants was investigated using PolyPhen-2 v2.2.2 (ref. 36). A total of 11,823 (41%) putative somatic mutations were validated manually using the Integrated Genomics Viewer (IGV), and 3,126 (11%) were validated using Sanger sequencing (Supplementary Table 3). Systematic Sanger sequencing was performed in a subset of 155 samples on a list of 11 genes (CTNNB1, TP53, ARID1A, AXIN1, RPS6KA3, CDKN2A, NFE2L2, ARID2, PI3KCA, KRAS and KEAP1), and we used these data to benchmark our exome mutation calling pipeline. A total of 151 somatic variants were called by both methods, whereas 21 variants were only identified by Sanger sequencing and 10 were only identified by exome sequencing. Variants not identified by exome sequencing were mostly mutations in the poorly covered, GC-rich exon 1 of ARID1A (n = 10 variants) and large deletions of CTNNB1 exon 3 (n = 3). These results yielded a sensi-tivity for our somatic mutation calling pipeline of 88% (82–92%, 95% confi-dence interval), which reached 95% (90–98%, 95% confidence interval) when excluding those two specific regions, and a specificity of 99% (98–100%, 95% confidence interval).
Mutations were annotated using Alamut Batch, Alamut Visual v2.4 (Interactive Biosoftware) and Oncotator. All sequences have been deposited in the EGA database (accessions EGAS00001000217, EGAS00001000679 and EGAS00001001002) and the ICGC data portal.
De novo mutational signature analysis. The mutational catalogs of the 243 liver tumors were analyzed using the Wellcome Trust Sanger Institute muta-tional signatures framework16. This algorithm makes use of a well-known blind source separation technique, termed non-negative matrix factoriza-tion (NMF). NMF identifies the matrix of n mutational signatures, P, and the matrix of the exposures of these signatures, E, by minimizing a Frobenius norm while maintaining non-negativity:
min MM MR RP E
Fk n n gP E
∈ ∈+ +
− ×( , ) ( , )
|| ||2
The method for deciphering mutational signatures, including evaluation with simulated data and a list of limitations, can be found in ref. 16.
First, all mutation data were converted into a matrix M that was made up of 96 features comprising mutation counts for each mutation type (C>A, C>G, C>T, T>A, T>C and T>G; somatic mutations presented in a pyrimidine context) using each possible 5′ (C, A, G, T) and 3′ (C, A, G, T) context for all samples. Then, the algorithm was applied to the matrix that contained k muta-tion types and g samples, deciphering the minimal set of mutational signatures that optimally explained the proportion of each mutation type, thus estimating the contribution of each signature to each sample.
After extraction, four stable and reproducible mutational signatures were deciphered (see the stability and error plot in Supplementary Fig. 2) and termed signatures A, B, C and D. These signatures were compared to the cata-log of 27 consensus signatures that were previously identified by a pan-cancer analysis encompassing 7,042 samples and 30 cancer types14. The comparison was performed by cosine similarity as described16 as well as on the basis of other biological features exhibited by the mutational signatures (for example, transcriptional strand bias, presence of small insertions and/or deletions in a specific context, etc.).
The comparison showed that two of the four signatures were new, whereas the patterns of the remaining two signatures were previously identified through pan-cancer analysis. Notably, signature C exhibited a strong transcriptional strand bias of T>C mutations, especially at TA dinucleotides (70% versus 30%),

©20
15N
atu
re A
mer
ica,
Inc.
All
rig
hts
res
erve
d.
Nature GeNeticsdoi:10.1038/ng.3252
a behavior consistent with that of signature 16. The pattern of mutations of signature C showed a cosine similarity of 0.95 with the pattern of mutations of signature 16. Similarly, the pattern for signature D was extremely similar to the one for signature 6 (cosine similarity of 0.90), with both exhibiting a prevalence of indels at repetitive elements. In contrast, signatures A and B had cosine similarity <0.90 with any of the previously identified mutational signatures. Please note that we previously used a cutoff of ~0.90 to cluster mutational signatures into consensus mutational signatures14.
Reintroduction of consensus mutational signatures and sample clustering. Previous analysis of 88 whole genomes from liver cancers identified 6 mutational signatures: signatures 1B, 4, 6, 12, 16 and 17 (ref. 14). Further, signature 1B could be decomposed into signatures 1A and 5 (ref. 14). The de novo extraction of the mutational signatures of our 243 liver exomes identi-fied 2 additional mutational signatures, termed signatures 23 and 24. Thus, the complete compendium of mutational signature that can be present in a liver cancer includes signatures 1A, 1B, 4, 5, 6, 12, 16, 17, 23 and 24. To evaluate the presence of all these signatures in the 243 liver exomes, we used a previously described approach to find the Exposure matrix minimizing the following constrained linear function for each sample37:
min ||Exposures
SampleMutations Signaturei i
n
i≥ =
− ∑0 1
×( )Exposurei F||
2
Here, Signaturei
represents a vector with 96 components (corresponding to the 6 somatic substitutions and their immediate sequencing context) and Exposurei is a non-negative scalar reflecting the number of mutations con-tributed by this signature. n is equal to ten, and it reflects the number of all pos-sible signatures that can be found in a liver sample. Any mutational signature contributing less than 1% of the somatic mutations in a sample was removed, and the sample was reanalyzed with the remaining signatures. Any signature that did not improve the cosine similarity between the original sample and the sample reconstructed using the consensus mutational signatures and their respective exposures by more than 0.02 was removed, and the sample was reanalyzed with the remaining signatures. The analysis showed that signatures 1A, 1B, 4, 5, 6, 16, 23 and 24 were present in these liver cancer exomes, whereas signatures 12 and 17 were not. Reintroduction allowed a better evaluation of the presence of mutational signatures in each sample by leveraging the set of consensus mutational signatures previously deciphered from a larger data set of 88 whole genomes.
All samples were clustered, on the basis of the number of somatic mutations contributed by each signature in each sample, using unsupervised hierarchical clustering with cosine distance and Ward linkage.
Copy number analysis. To identify CNAs, we calculated the log ratio of the coverage in each tumor and its matched non-tumor liver sample for each bait of the exome capture kit. Log-ratio profiles were then smoothed using the circular binary segmentation algorithm as implemented in the Bioconductor package DNAcopy38. The most frequent smoothed value was considered to be the zero level of each sample. Segments with a smoothed log ratio above zero + 0.3 or below zero − 0.3 were considered to have gains and deletions, respectively. High-level amplification and homozygous deletion thresholds were defined as the mean + 5 s.d. of smoothed log ratios in regions with gains and deletions, respectively. Chromosome instability was quantified as the FAA, i.e., the proportion of chromosome arms with an aberrant copy number status along >60% of the length of each arm11.
Identification of putative driver genes. We first used the MutSigCV21 algo-rithm to identify genes harboring significantly more mutations than expected by chance. This approach takes into account nucleotide context, gene expres-sion, replication time, observed silent mutations and the presence of mutations in surrounding regions. It estimates the background mutation rate for each gene-patient category combination and tests the null hypothesis that all the observed mutations in each gene are a consequence of random background mutation. Genes for which this hypothesis was rejected on the basis of the Benjamini-Hochberg false discovery rate–corrected q value were considered
significantly mutated. Analysis was carried out using default settings together with a liver-oriented covariates table comprising HCC-derived gene expression levels (Gene Expression Omnibus (GEO), GSE62232).
We then combined mutations and focal CNAs to define an enlarged list of putative drivers. We considered all genes with ≥6 alterations (non-silent mutations, high-level amplifications or homozygous deletions) among the 235 HCCs (excluding DMN samples and the hypermutated HCC sample, CHC892T), corresponding to a frequency of ≥2.5%. We then removed large genes (coding-sequence length ≤10,000 amino acids), genes not expressed in HCC when considering our Affymetrix microarray data set collected on a series of 81 HCCs (RMA-normalized intensities ≥20 units or <20 units, with ≥20 s.d.; GEO, GSE62232) and genes displaying a ratio of silent to non-silent mutations ≤0.15. In total, 161 genes passed 2 or more of these 3 filters and were considered to be putative driver genes (Supplementary Table 8).
Identification of recurrently altered pathways and targetable genes. Gene annotations, including unique gene and transcript identifiers, description and functional reports, were retrieved from Ensembl release 75 given the variant genomic location using the Bioconductor package biomaRt. The definition of the cellular pathways found to be associated with HCC was established by annotating the 161 candidate driver genes using the GO database and then stating their precise roles through an expert review of the literature and gene annotation or pathway databases including GeneCards, KEGG and PubMed. Using this approach, we identified 11 major pathways altered in more than 5% of HCCs. Some putative driver genes or genes already reported in HCC were added to the general scheme (Fig. 3a), as well as genes with only minor or no alterations in our cohort but having key functional roles in the identified pathways. Interactions between pathways and repartitioning of the genes in the cellular compartments were highlighted as reported in the KEGG pathway database. The FDA-approved drugs or drugs screened in different phases of clinical trials that were found to be related to one of the genes or pathways were reviewed in the ClinicalTrails.gov and NCI Drug Dictionary databases.
Sanger sequencing. We confirmed 11% of the mutations identified by exome sequencing by independent PCR and Sanger sequencing. All HCC and liver cancer cell lines were systematically screened for mutations in CTNNB1, TP53, ARID1A, AXIN1, RPS6KA3, KEAP1, CDKN2A, NFE2L2, ARID2, PIK3CA and KRAS (Supplementary Table 15) as described in Guichard et al., and the promoter region of TERT was sequenced as described in Nault et al.11,24. In all cases, the somatic origin of the mutation found in the tumor was verified by sequencing the corresponding adjacent, normal liver sample11,24.
Cell lines. The 29 liver cancer cell lines were obtained from commercial sources. Cells were grown in DMEM or William’s E medium supplemented with 10% FBS and 100 U/ml penicillin-streptomycin and were maintained at 37 °C in a humidified incubator in 5% CO2. Cell line identity was confirmed by exploring known gene mutations in each cell line. All the cells were free of mycoplasma, as tested by a PCR assay (Sigma).
Drugs and cell viability assays. 17-AAG and 17-DMAG, two benzoquinone ansamycin HSP90 inhibitors, were purchased from Sigma-Aldrich and dis-solved in DMSO. Cells were seeded into 96-well plates at a density of 1,500–3,000 cells per well. After overnight incubation, cells were treated for 48 h with vehicle alone (0.1% DMSO) or with various concentrations of 17-AAG or 17-DMAG (0.001, 0.01, 0.1, 1 and 10 µM, in 0.1% DMSO) in 100 µl of culture medium supplemented with 10% FBS and 100 U/ml penicillin-streptomycin. Each concentration was tested in duplicate; experiments were repeated two to three times for each cell line. Cell viability was measured by MTS assays (Promega) according to the manufacturer’s recommendations. The concen-tration of drug inhibiting cell growth by 50% relative to the untreated control (GI50) was calculated after curve fitting with GraphPad Prism 5.0 software.
Cell line transfection and immunoblotting. Cells were transfected with 2 nM short interfering RNA (siRNA) using the Lipofectamine RNAiMAX reagent (Invitrogen) in six-well plates, according to the manufacturer’s protocol. Three different siRNA duplexes targeting RPS6KA3 (encoding RSK2) (s12279, s12280 and s12280, Life Technologies) were tested. Block-iT Alexa Fluor Red
©20
15N
atu
re A
mer
ica,
Inc.
All
rig
hts
res
erve
d.
Nature GeNetics doi:10.1038/ng.3252
Fluorescent Oligo siRNA (Life Technologies) was used as a double-stranded RNA negative control. The effect of gene knockdown was verified on the protein level by immunoblotting. Total protein extracts were obtained by lysis in RIPA buffer supplemented with protease and phosphatase inhibi-tors. Immunoblot analyses were performed using primary antibodies spe-cific for RSK2 (sc-1430, Santa Cruz Biotechnology; 1:2,000 dilution), ERK1/2 (9102, Cell Signaling Technology; 1:500 dilution) and phosphorylated ERK1/2 (9101 Thr202/Tyr204, Cell Signaling Technology; 1:300 dilution). Polyclonal rabbit antibody to β-actin (A5060, Sigma; 1:3,000 dilution) was used as load-ing control.
Quantitative RT-PCR. Quantification of NQO1 mRNA levels was performed by quantitative RT-PCR on the BioMark HD platform (Fluidigm) using a set of predesigned primers and probe from Life Technologies (Hs00168547_m1). Ribosomal 18S RNA was used for the normalization of expression data.
Reverse-phase protein arrays. Reverse-phase protein array (RPPA) technology was used to quantify NQO1 protein levels in cells as previously described39. Briefly, equal amounts of protein lysate were printed onto nitrocellulose- covered slides. Four serial dilutions and two technical replicates per dilution were deposited for each sample. Arrays were analyzed with an antibody to NQO1 (HPA007308, Sigma). Quantification and normalization of RPPA data were performed using the NormaCurve method39.
NQO1 p.Pro187Ser SNP analysis. Genotyping of the NQO1 SNP (NQO1*2 allele, rs1800566; encoding p.Pro187Ser) was performed on genomic DNA extracted from cells using a predesigned TaqMan assay (C_2091255_30, Life Technologies) on an ABI 7900HT instrument (Applied Biosystems), according to the manufacturer’s instructions.
Statistical analysis. R software v2.15.0 and Bioconductor packages were used for statistical analysis and data visualization. Tests of independence were per-formed using χ2 and Fisher’s exact tests. P values were adjusted by Monte Carlo
simulation according to Hope et al.40. The strength of association among gene mutation events was modeled using binomial logistic regression. We used χ2 tests for trend in proportions to identify genes associated with HCC progres-sion and the Jonckheere-Terpstra test to assess the increase of mutation and CNA numbers along tumor stages. Only genes mutated in ≥3% of cases were included.
Variables associated with overall survival at 60 months were identified through univariate and multivariate Cox proportional hazards regression models (Wald test), using the survival package. Only patients with curative (R0) resection were included in survival analysis (n = 216, exclusion of non-curative resections and liver transplantations). Kaplan-Meier plots were used to describe the survival rates among all cases.
All reported P values were two-tailed, and differences were considered significant when the P value was <0.05.
33. Song, S. et al. qpure: a tool to estimate tumor cellularity from genome-wide single-nucleotide polymorphism profiles. PLoS ONE 7, e45835 (2012).
34. Miller, S.A., Dykes, D.D. & Polesky, H.F. A simple salting out procedure for extracting DNA from human nucleated cells. Nucleic Acids Res. 16, 1215 (1988).
35. Gnirke, A. et al. Solution hybrid selection with ultra-long oligonucleotides for massively parallel targeted sequencing. Nat. Biotechnol. 27, 182–189 (2009).
36. Adzhubei, I.A. et al. A method and server for predicting damaging missense mutations. Nat. Methods 7, 248–249 (2010).
37. Waltz, R.A., Morales, J.L., Nocedal, J. & Orban, D. An interior algorithm for nonlinear optimization that combines line search and trust region steps. Math. Program. 107, 391–408 (2006).
38. Olshen, A.B., Venkatraman, E.S., Lucito, R. & Wigler, M. Circular binary segmentation for the analysis of array-based DNA copy number data. Biostatistics 5, 557–572 (2004).
39. Troncale, S. et al. NormaCurve: a SuperCurve-based method that simultaneously quantifies and normalizes reverse phase protein array data. PLoS ONE 7, e38686 (2012).
40. Hope, A.C.A. A simplified Monte Carlo significance test procedure. J. R. Stat. Soc. Ser. B 30, 582–598 (1968).
Copyright © 2022 FDOKUMEN