The Changing State of Surfactant Lipids: New Insights from ...
Upload
independentCategory
view
1download
0
Journal of Clinical Epidemiology 61 (2008) 695e704
Exocrine pancreatic cancer clinical factors were related to timingof blood extraction and influenced serum concentrations of lipids
Miquel Portaa,b,c,*, Olga Ferrer-Armengoua, Jos�e Pumaregaa, Tomas Lopeza, Marta Crous-Boua,b,Juan Alguacila,d, Montserrat Fitoa, Manuel Jarioda,e, Angel Vicentea, Eva Moralesa,
Marıa-Isabel Covasa, Elisa Puigdomenecha,b, Nikhil Guptac
for the PANKRAS II Study Group1
aInstitut Municipal d’Investigacio MedicadHospital del Mar, Barcelona, and CIBER en Epidemiologıa y Salud Publica (CIBERESP), SpainbSchool of Medicine, Universitat Autonoma de Barcelona, Spain
cSchool of Public Health, University of North Carolina at Chapel Hill, USAdDepartment of Environmental Biology & Public Health, Universidad de Huelva, Spain
eUniversitat Rovira i Virgili, TarragonadReus, Spain
Accepted 9 August 2007
Abstract
Objective: Disease-induced changes in blood concentrations of lipids may bias etiologic studies. We analyzed the influence of clinicalfactors and timing of blood extraction on serum concentrations of cholesterol and triglycerides in exocrine pancreatic cancer (EPC).
Study Design and Setting: Subjects were 144 incident cases of EPC prospectively recruited in five teaching hospitals in eastern Spain.Results: Higher concentrations of cholesterol, triglycerides, and total lipids were observed among patients with a shorter interval from
first symptom of cancer to blood extraction (IES); but concentrations were lower in patients with longer IES. The relationship betweencholesterol and tumor stage was ‘‘n-shaped.’’ Jaundice and other components of the cholestatic syndrome increased cholesterol and triglyc-erides. Invasive diagnostic tests were associated with lower cholesterol. All these factors were related to changes O50 mg/dl in cholesterol(P ! 0.05), even when adjusting by stage. Statistical models including IES, number of invasive diagnostic tests, jaundice, weight loss, andstage explained over 28% of the variation in lipid concentrations.
Conclusion: Restriction and adjustment by stage may be insufficient to prevent biases related to disease progression. Multivariate analysesmay allow to control to some extent the influence of clinical symptoms, procedures, and timing of blood extraction in studies on the etiologicalsignificance of lipids and lipophilic compounds, either risk factors or protective agents. � 2008 Elsevier Inc. All rights reserved.
Keywords [MeSH]: Pancreatic neoplasms; Lipids/blood; Jaundice; Weight loss; Epidemiology, molecular; Research design/organization and administration;
Cholesterol; Triglycerides
Keywords: Total lipids; Lipophilic biomarkers; Symptoms; Blood extraction
Abbreviations: CI, Confidence interval; EPC, Exocrine pancreatic can-
cer; ERCP, Endoscopic retrograde cholangiopancreatography; IDT, Number
of invasive diagnostic tests performed before blood extraction; IEA, Interval
from blood extraction to hospital admission; IES, Interval from blood
extraction to first symptom of the disease; SD, Standard deviation; TNM,
Tumor-node-metastasis system; TPHC, Transparietohepatic cholangiography.1 Members of the Multicenter Prospective Study on the Role of K-ras
and other Genetic Alterations in the Diagnosis, Prognosis, and Etiology of
Pancreatic and Biliary Diseases (PANKRAS II) Study Group are
mentioned in previous publications.
* Corresponding author. Clinical & Molecular Epidemiology of
Cancer Unit, Institut Municipal d’Investigacio Medica (IMIM), Universitat
Autonoma de Barcelona, Carrer del Dr. Aiguader 88, E-08003 Barcelona,
Spain. Tel.: þ34-93-316-0700/0790; fax: þ34-93-316-0410.
E-mail address: [email protected] (M. Porta).
0895-4356/08/$ e see front matter � 2008 Elsevier Inc. All rights reserved.
doi: 10.1016/j.jclinepi.2007.08.013
1. Introduction
Today, a substantial number of epidemiologic, toxico-logic, and proteomic studies exploring lifestyle and envi-ronmental influences on health use blood biomarkers. Inmany instances blood is drawn from overtly sick individ-uals (e.g., cases in a caseecontrol design). At other times,the period between blood extraction and outcome is short.Hence, at the time of blood collection concentrations ofthe biomarker may be influenced by the individual’s healthstatus [1e6]. The organization of fieldwork of epidemio-logic studies needs to take into account that blood concen-trations of cholesterol, triglycerides, and relatedbiochemical parameters, as well as those of lipophilic com-pounds of putative etiological significance, may change
696 M. Porta et al. / Journal of Clinical Epidemiology 61 (2008) 695e704
during the progression of the disease in the months beforeclinical emergence, diagnosis, and blood collection [4]. Thedisease at stake may be a cancer, diabetes, the metabolicsyndrome, psoriasis, or a neurological, thyroid, hepatic,and renal disorder, among many others [7e10]. Weight lossand the associated changes in lipid storage and metabolism,or obstructive jaundice and the ensuing metabolic alter-ations, may result in increaseddand sometimes subse-quently decreased [4]dblood concentrations of severalclasses of lipophilic chemical agents [1e6,11e13], includ-ing fat-soluble drugs and vitamins (vitamins E and K,retinoids) [14], chlorinated hydrocarbons, or polycyclicaromatic hydrocarbons [15e17]. When studying the etio-logic significance of such agents, the potential for biasand disease-related ‘‘reverse causality’’ is hence significant[5,18].
In addition to its own relevance, exocrine pancreaticcancer (EPC) is an excellent example of a biologicallyand clinically aggressive disease in which the significanceof these issues may be tested. At presentation many patientsshow weight loss and muscle atrophy, and some, glucoseintolerance [1,19e23]. While weight loss is only partlydue to anorexia, anorexia alone does not explain the com-plex metabolic changes that occur during cachexia. In theinitial phases of EPC subclinical malabsorption may alsobe a factor contributing to weight loss [24]. When tumorsare located in the pancreatic head, biliary obstruction iscommon and usually causes obstructive jaundice [22].These pathophysiological alterations lead to importantmetabolic changes, primarily to obtain energy from adiposetissue. In addition, pancreatic cancer patients with lower in-sulin excretion tend to have increased lipid metabolism[21e23]. All these processes pose challenges to the organi-zation of fieldwork and study conduct, and may have influ-enced studies on the etiology of EPC [19]. Finally, inpancreatic and other cancers, there is a need for furtheranalyses of the effects that diagnostic and therapeuticprocedures have upon exposure biomarkers [1e5,25e29].
The aim of the present study was to analyze potentialimplications for epidemiologic studies of relationshipsamong clinical factors, timing of blood extraction, andserum concentrations of lipids in patients with EPC.
2. Patients and methods
2.1. Selection of patients
Methods of the PANKRAS II study have been describedin detail [22,25,30e41]. Briefly, subject recruitment tookplace between 1992 and 1995 at five general hospitals inthe eastern Mediterranean part of Spain, where 185 incidentcases of EPC were prospectively identified. There were nospecial eligibility criteria for EPC; all patients diagnosedwith the disease at the study hospitals were eligible for in-clusion [33e35]. The present report is based on 144 EPC
patients with blood sample collection and measures ofcholesterol and triglycerides (78% of the 185). The ethicscommittees of participating hospitals approved the studyprotocol, and patients gave informed consent to be includedin the study.
2.2. Personal interviews and information on symptoms
A structured form was used to collect clinicopathologi-cal information from medical records, including detailson diagnostic procedures, tumor stage, laboratory results,and follow-up care. Over 88% of the patients were inter-viewed face to face by trained monitors during hospitalstay, close to the time of diagnosis. Over 95% of the inter-views took place in the 2 weeks before or after blood ex-traction. Interviews included questions about occupation,lifestyle, past clinical history, and signs and symptoms[22,25,30e37,41]. The tumor’s clinical stage at diagnosiswas classified according to the tumor-node-metastasis sys-tem [42]. At diagnosis, slightly over half of patients had tu-mors in stage IV; in the multivariate models, the exactfigure was 72 of 142 patients (51%) [22]. All cases were in-dependently reviewed by the study reference pathologists,who were unaware of the original diagnosis [33,35].Invasive diagnostic tests (IDT) included fibrogastroscopy,endoscopic retrograde cholangiopancreatography (ERCP),transparietohepatic cholangiography (TPHC), gammagra-phy, laparoscopy, and laparotomy. Detailed informationon signs and symptoms was obtained from two sources:medical records (where they were registered by the attend-ing physician at hospital admission, and abstracted bya physician into a structured form) and patient interviews[22]. All items concerning the first sign or symptom (andits date) and the presence of other signs and symptoms werefurther reviewed by two experienced oncologists andchecked for consistency. If data elicited from the interviewcontradicted data abstracted from the medical record, thelatter was chosen [22]. Cholestatic syndrome involved jaun-dice, hypocholia, and choluria. Constitutional syndrome in-volved asthenia, anorexia, and weight loss. Time intervalswere calculated from dates of blood sample collection to:first symptom, hospital admission, fibrogastroscopy, ERCP,TPHC, gammagraphy, laparoscopy, laparotomy, diagnosis,and treatment onset. The interval from blood extraction tofirst symptom of cancer (IES) was defined as the time be-tween the date of blood sample extraction and the date ofthe first symptom. All intervals were calculated using thedate of blood extraction as reference; thus, when the inter-val is negative the event studied occurred before blood ex-traction. The median time from blood extraction to firstsymptom of cancer was �74 days; to hospital admission,�15 days; to diagnosis, �1 day; and to treatment onset,0 days [39]. Invasive diagnostic tests performed beforeblood extraction were grouped as a categorical variable.Each interval was examined to obtain the fewest categoriesneeded to retain the underlying interrelationships and to
697M. Porta et al. / Journal of Clinical Epidemiology 61 (2008) 695e704
maximize the stability of the estimates. IES was catego-rized in tertiles, whereas the interval from blood extractionto hospital admission (IEA) was categorized as a dichoto-mous variable by the median.
2.3. Laboratory analyses
Blood was drawn from cubital veins following the stan-dard procedures of participating hospitals; largely, in theearly morning and with patients fasting. Serum was sepa-rated within 3 hours. One milliliter samples were frozenand stored at �80 �C [25]. Total cholesterol and triglycer-ide concentrations were determined enzymatically usingCHOD-PAP and GPO-PAP methods, respectively (RocheDiagnostics, Basle, Switzerland), and measured in a CobasMira Plus analyzer (Roche). Interassay coefficients of var-iation were 2.5% and 3.2% for total cholesterol and triglyc-erides, respectively [25]. Total lipids were computed fromtotal cholesterol and triglycerides using the standard for-mula by Phillips et al. [43]. Median serum concentrationsof total cholesterol, triglycerides, and total lipids were,respectively, 192, 157, and 680 mg/dl [39].
2.4. Statistical analysis
Univariate statistics were computed as customary[44,45]. KruskaleWallis and ManneWhitney U tests wereused to assess differences between concentrations of lipidsby timing of blood extraction and clinical events. TheKolmogoroveSmirnov test for normality was used to checkthe distribution of cholesterol (P 5 0.056), triglycerides(P 5 0.098), and total lipids (P 5 0.155). To analyze varia-tions in concentrations of lipids, general linear models wereused [45]. The main effects of all predictors were indepen-dently explored in base models. Age, gender, and tumorstage were assessed in all models as potential confoundersor were forced in specific models of interest. Other possibleconfounding variables were retained in the models whenthey materially altered the estimates. Final models werechosen coherently with the nature of the variables and thestudy objectives [45]. The level of statistical significancewas set at 0.05, and all tests are two tailed. Analyses wereconducted using SPSS, version 12.0 (SPSS, Chicago, IL,USA, 2003).
3. Results
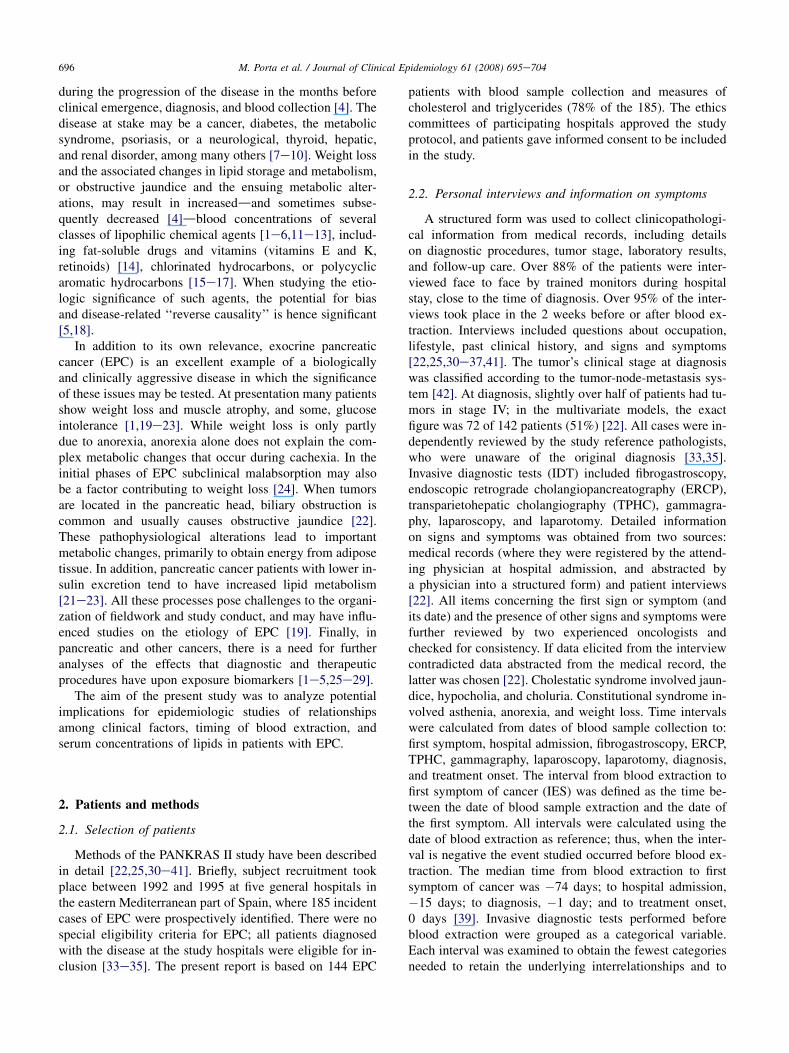
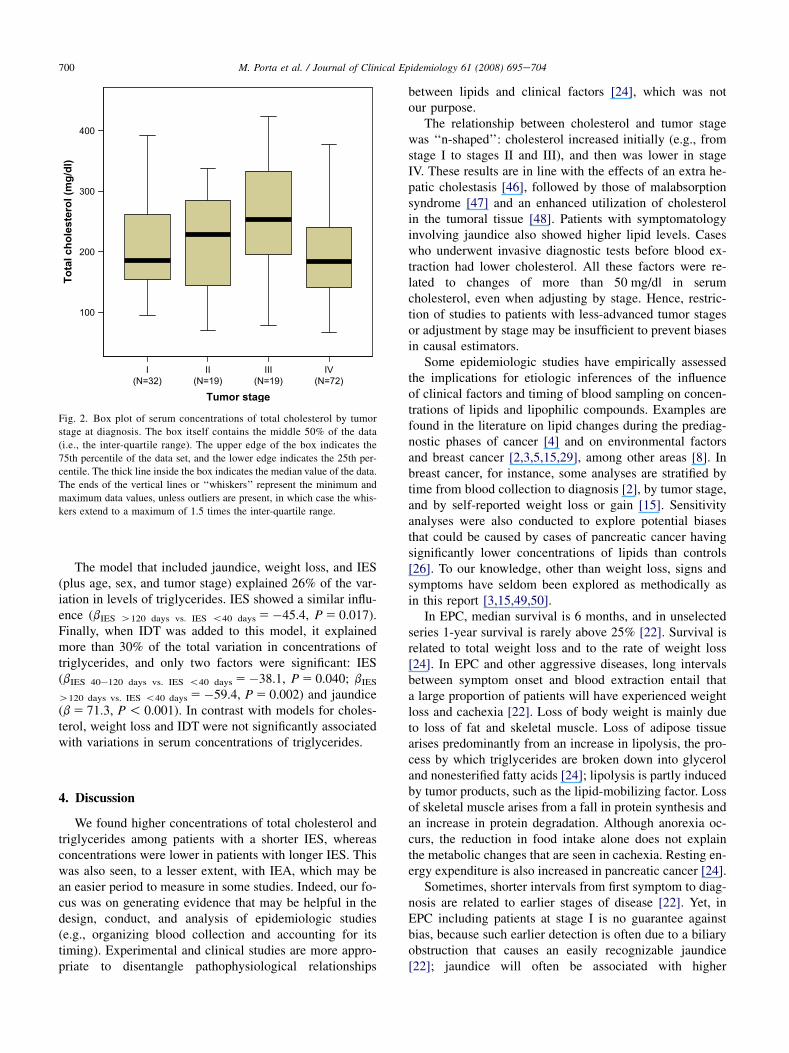
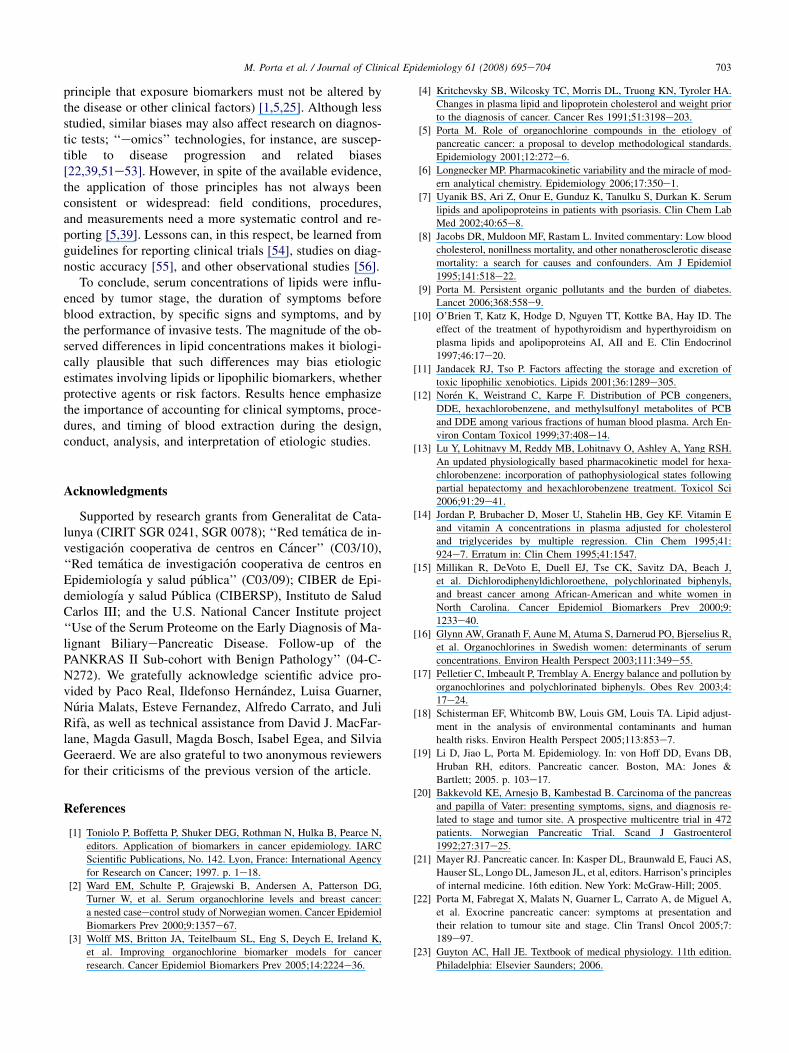
Higher concentrations of total cholesterol, triglycerides,and total lipids were observed among patients with an IESbelow 40 days; concentrations were lower in patients withlonger IES (Table 1). As compared to patients with normalconcentrations of total lipids, the IEA was substantially lon-ger among patients with low total lipids, and shorter amongpatients with high total lipids. Thus, total lipids tended tobe increased in the initial phases of the disease, and to de-crease subsequently (Fig. 1). Serum concentrations of lipids
were also higher among patients with a shorter IEA, but inthis instance differences were not statistically significant.Lipid concentrations were essentially unrelated to intervalsfrom diagnosis and from treatment onset (Table 1).
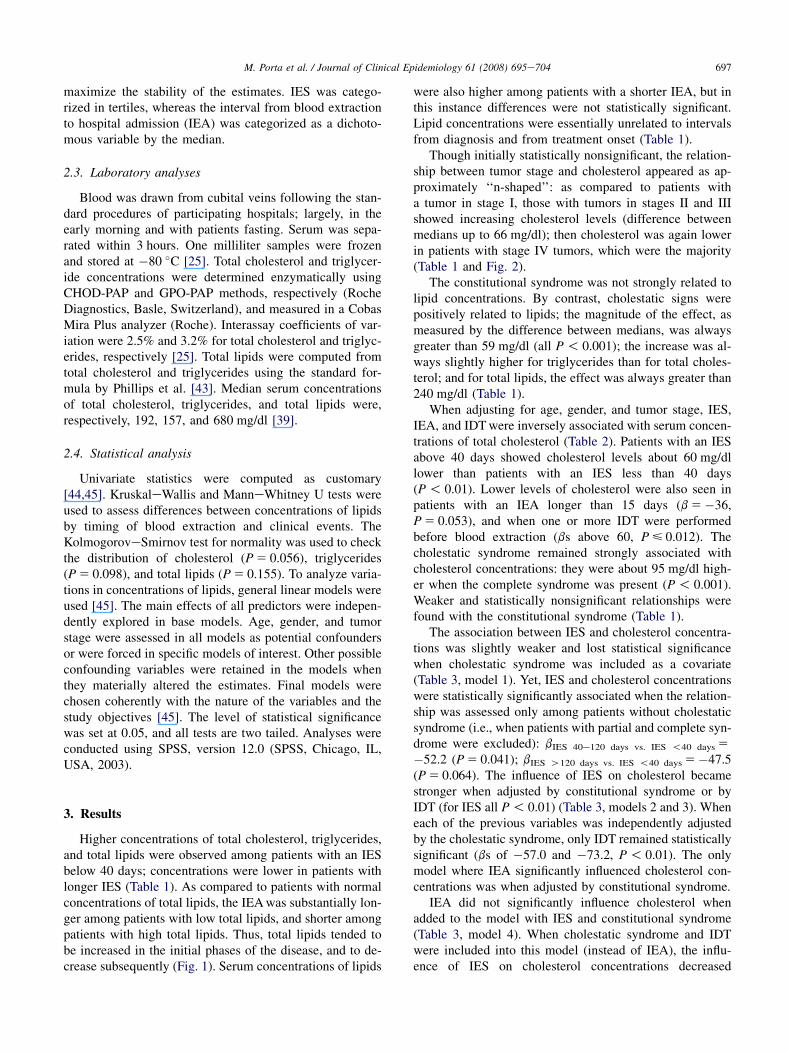
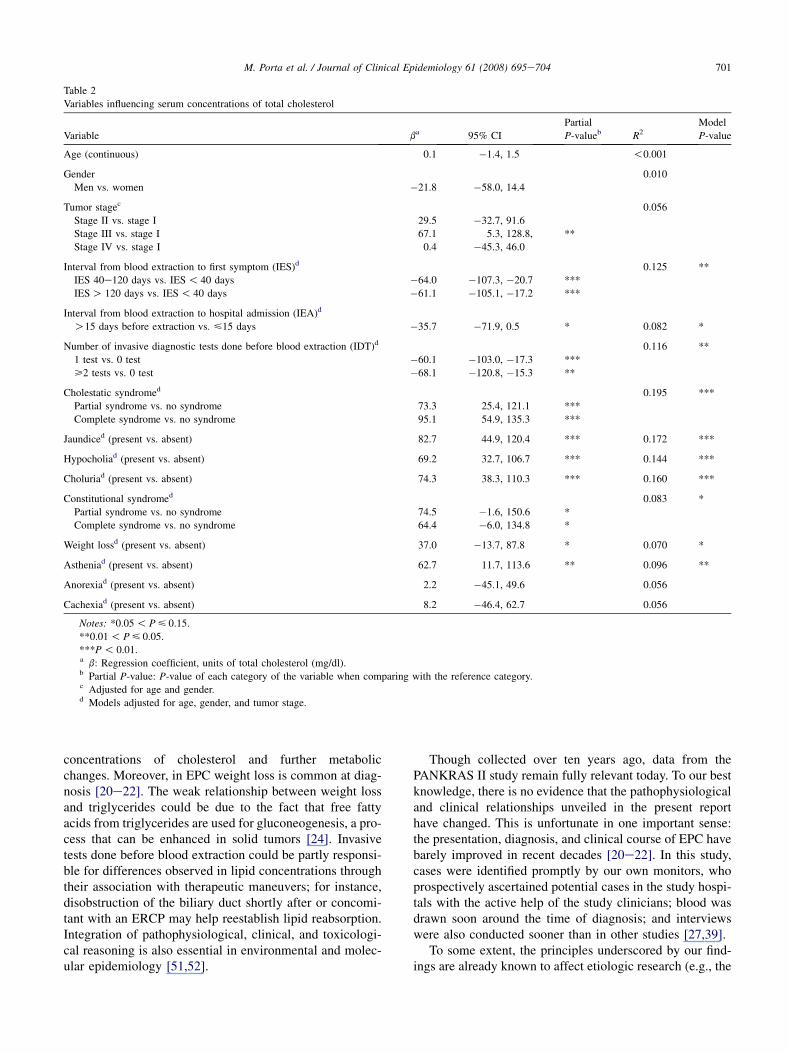
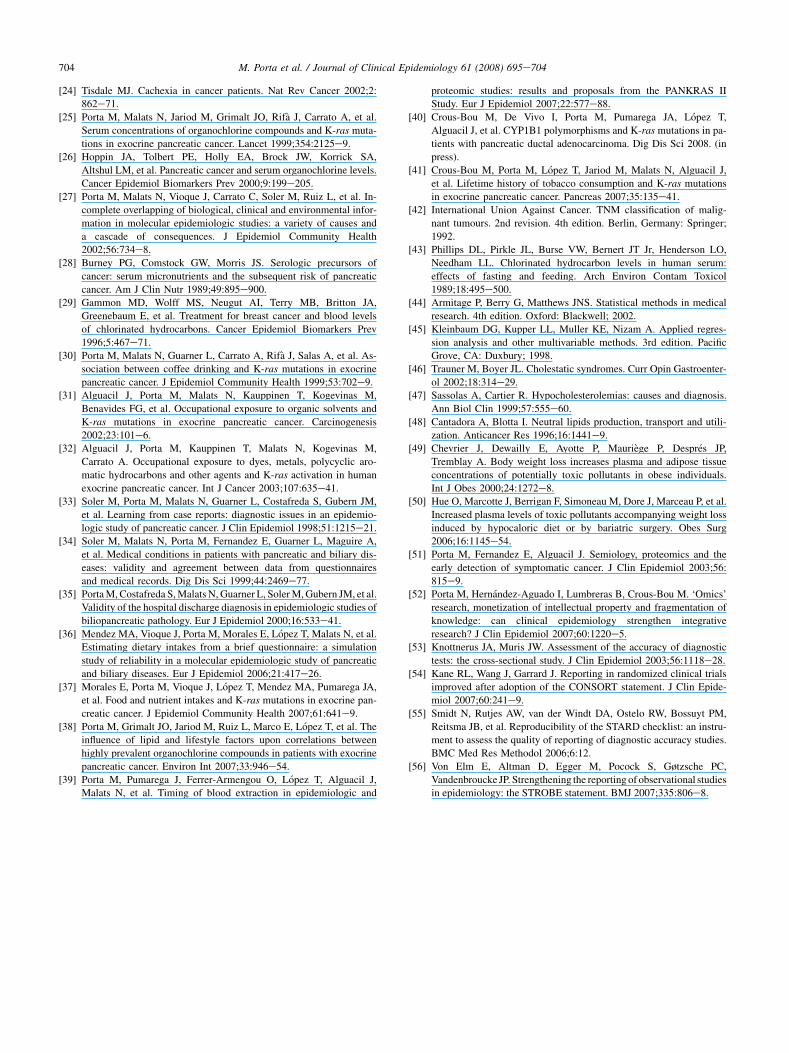
Though initially statistically nonsignificant, the relation-ship between tumor stage and cholesterol appeared as ap-proximately ‘‘n-shaped’’: as compared to patients witha tumor in stage I, those with tumors in stages II and IIIshowed increasing cholesterol levels (difference betweenmedians up to 66 mg/dl); then cholesterol was again lowerin patients with stage IV tumors, which were the majority(Table 1 and Fig. 2).
The constitutional syndrome was not strongly related tolipid concentrations. By contrast, cholestatic signs werepositively related to lipids; the magnitude of the effect, asmeasured by the difference between medians, was alwaysgreater than 59 mg/dl (all P ! 0.001); the increase was al-ways slightly higher for triglycerides than for total choles-terol; and for total lipids, the effect was always greater than240 mg/dl (Table 1).
When adjusting for age, gender, and tumor stage, IES,IEA, and IDT were inversely associated with serum concen-trations of total cholesterol (Table 2). Patients with an IESabove 40 days showed cholesterol levels about 60 mg/dllower than patients with an IES less than 40 days(P ! 0.01). Lower levels of cholesterol were also seen inpatients with an IEA longer than 15 days (b 5�36,P 5 0.053), and when one or more IDT were performedbefore blood extraction (bs above 60, P < 0.012). Thecholestatic syndrome remained strongly associated withcholesterol concentrations: they were about 95 mg/dl high-er when the complete syndrome was present (P ! 0.001).Weaker and statistically nonsignificant relationships werefound with the constitutional syndrome (Table 1).
The association between IES and cholesterol concentra-tions was slightly weaker and lost statistical significancewhen cholestatic syndrome was included as a covariate(Table 3, model 1). Yet, IES and cholesterol concentrationswere statistically significantly associated when the relation-ship was assessed only among patients without cholestaticsyndrome (i.e., when patients with partial and complete syn-drome were excluded): bIES 40e120 days vs. IES !40 days 5
�52.2 (P 5 0.041); bIES O120 days vs. IES !40 days 5�47.5(P 5 0.064). The influence of IES on cholesterol becamestronger when adjusted by constitutional syndrome or byIDT (for IES all P ! 0.01) (Table 3, models 2 and 3). Wheneach of the previous variables was independently adjustedby the cholestatic syndrome, only IDT remained statisticallysignificant (bs of �57.0 and �73.2, P ! 0.01). The onlymodel where IEA significantly influenced cholesterol con-centrations was when adjusted by constitutional syndrome.
IEA did not significantly influence cholesterol whenadded to the model with IES and constitutional syndrome(Table 3, model 4). When cholestatic syndrome and IDTwere included into this model (instead of IEA), the influ-ence of IES on cholesterol concentrations decreased

698 M. Porta et al. / Journal of Clinical Epidemiology 61 (2008) 695e704
Table 1
Serum concentrations of lipids by timing of blood extraction and clinical eventsa
N (%)
Concentrations (mg/dl)
Total cholesterol Triglycerides Total lipids
Median P-value Median P-value Median P-value
Interval from blood extraction to first
symptom (IES)
*** *** ***
!40 days 45 (31.3) 228.0 205.0 766.2
40e120 days 51 (35.4) 186.0 157.0 618.8
O120 days 48 (33.3) 155.5 129.5 570.5
Interval from blood extraction to hospital
admission (IEA)
* *
<15 days before extraction 76 (52.8) 211.5 158.5 718.1
O15 days before extraction 68 (47.2) 187.5 148.0 643.5
Interval from blood extraction to diagnosis
Extraction before diagnosis 73 (50.7) 191.0 147.0 647.2
Extraction in the same day 15 (10.4) 196.0 173.0 765.1
Extraction after diagnosis 56 (38.9) 195.0 159.5 722.3
Interval from blood extraction to treatment onset
Extraction before treatment 34 (39.1) 194.5 167.0 665.1
Extraction in the same day 16 (18.4) 188.0 159.5 654.6
Extraction after treatment 37 (42.5) 238.0 178.0 766.2
Tumor stage
Stage I 32 (22.5) 186.5 157.0 765.6
Stage II 19 (13.4) 229.0 165.0 746.4
Stage III 19 (13.4) 253.0 146.0 837.8
Stage IV 72 (50.7) 184.0 158.5 637.8
Number of invasive diagnostic tests before
blood extraction (IDT)
* *
0 test 34 (23.6) 243.0 166.5 769.3
1 test 79 (54.9) 189.0 147.0 660.5
>2 tests 31 (21.5) 190.0 181.0 678.2
Anorexia
Present 117 (81.8) 193.0 157.0 680.9
Absent 180.5 154.0 666.6
Weight loss
Present 121 (84.6) 196.0 157.0 699.8
Absent 185.0 157.0 644.5
Cachexia
Present 18 (12.6) 186.0 136.5 669.8
Absent 193.0 159.0 691.3
Constitutional syndrome * * *
Absent 10 (6.9) 153.5 135.0 546.4
Partial 34 (23.6) 193.5 181.5 703.8
Complete 100 (69.4) 194.5 150.0 704.5
Jaundice
Present 78 (54.6) 228.5 *** 199.0 *** 804.9 ***
Absent 157.0 111.0 524.9
Hypocholia
Present 73 (51.0) 228.0 *** 202.0 *** 807.6 ***
Absent 168.0 120.5 564.1
Choluria
Present 77 (53.8) 228.0 *** 202.0 *** 803.6 ***
Absent 156.0 113.5 532.7
Cholestatic syndrome *** *** ***
Absent 56 (38.9) 154.0 108.5 523.4
Partial 27 (18.7) 200.0 197.0 770.9
Complete 61 (42.4) 229.0 203.0 807.6
(Continued )
699M. Porta et al. / Journal of Clinical Epidemiology 61 (2008) 695e704
Table 1
Continued
N (%)
Concentrations (mg/dl)
Total cholesterol Triglycerides Total lipids
Median P-value Median P-value Median P-value
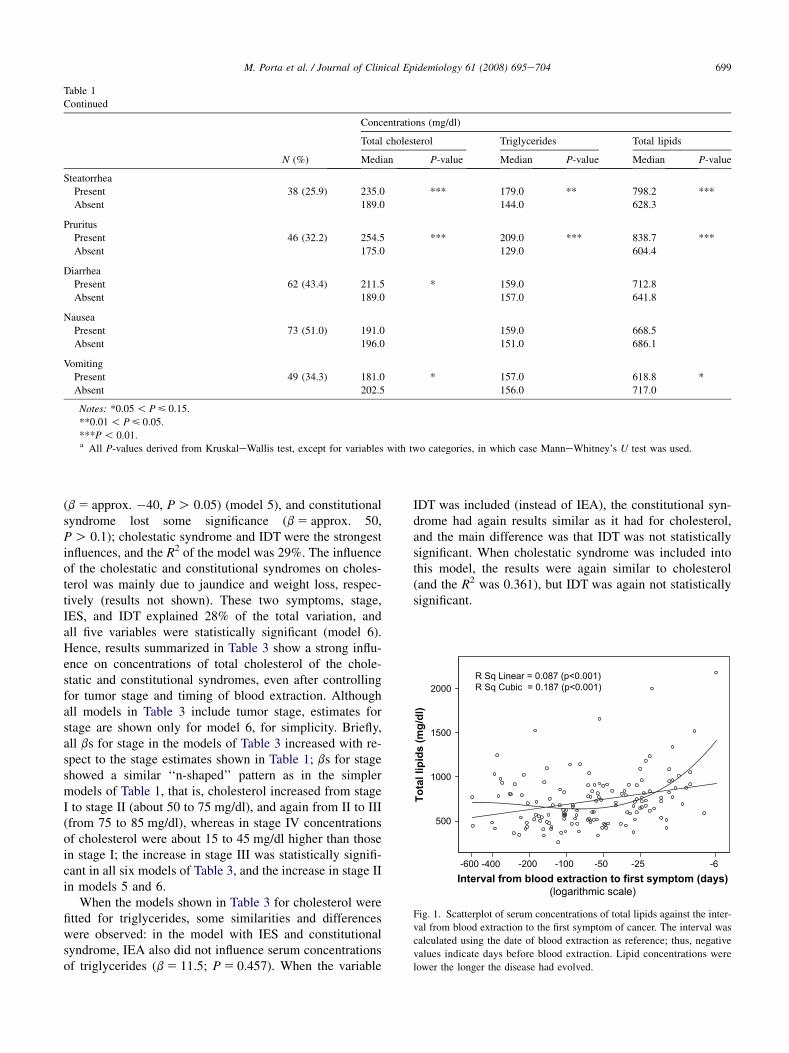
Steatorrhea
Present 38 (25.9) 235.0 *** 179.0 ** 798.2 ***
Absent 189.0 144.0 628.3
Pruritus
Present 46 (32.2) 254.5 *** 209.0 *** 838.7 ***
Absent 175.0 129.0 604.4
Diarrhea
Present 62 (43.4) 211.5 * 159.0 712.8
Absent 189.0 157.0 641.8
Nausea
Present 73 (51.0) 191.0 159.0 668.5
Absent 196.0 151.0 686.1
Vomiting
Present 49 (34.3) 181.0 * 157.0 618.8 *
Absent 202.5 156.0 717.0
Notes: *0.05 ! P < 0.15.
**0.01 ! P < 0.05.
***P ! 0.01.a All P-values derived from KruskaleWallis test, except for variables with two categories, in which case ManneWhitney’s U test was used.
(b 5 approx. �40, P O 0.05) (model 5), and constitutionalsyndrome lost some significance (b 5 approx. 50,P O 0.1); cholestatic syndrome and IDT were the strongestinfluences, and the R2 of the model was 29%. The influenceof the cholestatic and constitutional syndromes on choles-terol was mainly due to jaundice and weight loss, respec-tively (results not shown). These two symptoms, stage,IES, and IDT explained 28% of the total variation, andall five variables were statistically significant (model 6).Hence, results summarized in Table 3 show a strong influ-ence on concentrations of total cholesterol of the chole-static and constitutional syndromes, even after controllingfor tumor stage and timing of blood extraction. Althoughall models in Table 3 include tumor stage, estimates forstage are shown only for model 6, for simplicity. Briefly,all bs for stage in the models of Table 3 increased with re-spect to the stage estimates shown in Table 1; bs for stageshowed a similar ‘‘n-shaped’’ pattern as in the simplermodels of Table 1, that is, cholesterol increased from stageI to stage II (about 50 to 75 mg/dl), and again from II to III(from 75 to 85 mg/dl), whereas in stage IV concentrationsof cholesterol were about 15 to 45 mg/dl higher than thosein stage I; the increase in stage III was statistically signifi-cant in all six models of Table 3, and the increase in stage IIin models 5 and 6.
When the models shown in Table 3 for cholesterol werefitted for triglycerides, some similarities and differenceswere observed: in the model with IES and constitutionalsyndrome, IEA also did not influence serum concentrationsof triglycerides (b 5 11.5; P 5 0.457). When the variable
IDT was included (instead of IEA), the constitutional syn-drome had again results similar as it had for cholesterol,and the main difference was that IDT was not statisticallysignificant. When cholestatic syndrome was included intothis model, the results were again similar to cholesterol(and the R2 was 0.361), but IDT was again not statisticallysignificant.
To
tal lip
id
s (m
g/d
l)
-600 -400 -200 -100 -50 -25 -6Interval from blood extraction to first symptom (days)
(logarithmic scale)
500
2000
1500
1000
R Sq Linear = 0.087 (p<0.001)R Sq Cubic = 0.187 (p<0.001)
Fig. 1. Scatterplot of serum concentrations of total lipids against the inter-
val from blood extraction to the first symptom of cancer. The interval was
calculated using the date of blood extraction as reference; thus, negative
values indicate days before blood extraction. Lipid concentrations were
lower the longer the disease had evolved.
700 M. Porta et al. / Journal of Clinical Epidemiology 61 (2008) 695e704
The model that included jaundice, weight loss, and IES(plus age, sex, and tumor stage) explained 26% of the var-iation in levels of triglycerides. IES showed a similar influ-ence (bIES O120 days vs. IES !40 days 5�45.4, P 5 0.017).Finally, when IDT was added to this model, it explainedmore than 30% of the total variation in concentrations oftriglycerides, and only two factors were significant: IES(bIES 40e120 days vs. IES !40 days 5�38.1, P 5 0.040; bIES
O120 days vs. IES !40 days 5�59.4, P 5 0.002) and jaundice(b 5 71.3, P ! 0.001). In contrast with models for choles-terol, weight loss and IDT were not significantly associatedwith variations in serum concentrations of triglycerides.
4. Discussion
We found higher concentrations of total cholesterol andtriglycerides among patients with a shorter IES, whereasconcentrations were lower in patients with longer IES. Thiswas also seen, to a lesser extent, with IEA, which may bean easier period to measure in some studies. Indeed, our fo-cus was on generating evidence that may be helpful in thedesign, conduct, and analysis of epidemiologic studies(e.g., organizing blood collection and accounting for itstiming). Experimental and clinical studies are more appro-priate to disentangle pathophysiological relationships
I(N=32)
II(N=19)
III(N=19)
IV(N=72)
Tumor stage
100
200
300
400
To
tal ch
olestero
l (m
g/d
l)
Fig. 2. Box plot of serum concentrations of total cholesterol by tumor
stage at diagnosis. The box itself contains the middle 50% of the data
(i.e., the inter-quartile range). The upper edge of the box indicates the
75th percentile of the data set, and the lower edge indicates the 25th per-
centile. The thick line inside the box indicates the median value of the data.
The ends of the vertical lines or ‘‘whiskers’’ represent the minimum and
maximum data values, unless outliers are present, in which case the whis-
kers extend to a maximum of 1.5 times the inter-quartile range.
between lipids and clinical factors [24], which was notour purpose.
The relationship between cholesterol and tumor stagewas ‘‘n-shaped’’: cholesterol increased initially (e.g., fromstage I to stages II and III), and then was lower in stageIV. These results are in line with the effects of an extra he-patic cholestasis [46], followed by those of malabsorptionsyndrome [47] and an enhanced utilization of cholesterolin the tumoral tissue [48]. Patients with symptomatologyinvolving jaundice also showed higher lipid levels. Caseswho underwent invasive diagnostic tests before blood ex-traction had lower cholesterol. All these factors were re-lated to changes of more than 50 mg/dl in serumcholesterol, even when adjusting by stage. Hence, restric-tion of studies to patients with less-advanced tumor stagesor adjustment by stage may be insufficient to prevent biasesin causal estimators.
Some epidemiologic studies have empirically assessedthe implications for etiologic inferences of the influenceof clinical factors and timing of blood sampling on concen-trations of lipids and lipophilic compounds. Examples arefound in the literature on lipid changes during the prediag-nostic phases of cancer [4] and on environmental factorsand breast cancer [2,3,5,15,29], among other areas [8]. Inbreast cancer, for instance, some analyses are stratified bytime from blood collection to diagnosis [2], by tumor stage,and by self-reported weight loss or gain [15]. Sensitivityanalyses were also conducted to explore potential biasesthat could be caused by cases of pancreatic cancer havingsignificantly lower concentrations of lipids than controls[26]. To our knowledge, other than weight loss, signs andsymptoms have seldom been explored as methodically asin this report [3,15,49,50].
In EPC, median survival is 6 months, and in unselectedseries 1-year survival is rarely above 25% [22]. Survival isrelated to total weight loss and to the rate of weight loss[24]. In EPC and other aggressive diseases, long intervalsbetween symptom onset and blood extraction entail thata large proportion of patients will have experienced weightloss and cachexia [22]. Loss of body weight is mainly dueto loss of fat and skeletal muscle. Loss of adipose tissuearises predominantly from an increase in lipolysis, the pro-cess by which triglycerides are broken down into glyceroland nonesterified fatty acids [24]; lipolysis is partly inducedby tumor products, such as the lipid-mobilizing factor. Lossof skeletal muscle arises from a fall in protein synthesis andan increase in protein degradation. Although anorexia oc-curs, the reduction in food intake alone does not explainthe metabolic changes that are seen in cachexia. Resting en-ergy expenditure is also increased in pancreatic cancer [24].
Sometimes, shorter intervals from first symptom to diag-nosis are related to earlier stages of disease [22]. Yet, inEPC including patients at stage I is no guarantee againstbias, because such earlier detection is often due to a biliaryobstruction that causes an easily recognizable jaundice[22]; jaundice will often be associated with higher
701M. Porta et al. / Journal of Clinical Epidemiology 61 (2008) 695e704
Table 2
Variables influencing serum concentrations of total cholesterol
Variable ba 95% CI
Partial
P-valueb R2Model
P-value
Age (continuous) 0.1 �1.4, 1.5 !0.001
Gender 0.010
Men vs. women �21.8 �58.0, 14.4
Tumor stagec 0.056
Stage II vs. stage I 29.5 �32.7, 91.6
Stage III vs. stage I 67.1 5.3, 128.8, **
Stage IV vs. stage I 0.4 �45.3, 46.0
Interval from blood extraction to first symptom (IES)d 0.125 **
IES 40e120 days vs. IES ! 40 days �64.0 �107.3, �20.7 ***
IES O 120 days vs. IES ! 40 days �61.1 �105.1, �17.2 ***
Interval from blood extraction to hospital admission (IEA)d
O15 days before extraction vs. <15 days �35.7 �71.9, 0.5 * 0.082 *
Number of invasive diagnostic tests done before blood extraction (IDT)d 0.116 **
1 test vs. 0 test �60.1 �103.0, �17.3 ***
>2 tests vs. 0 test �68.1 �120.8, �15.3 **
Cholestatic syndromed 0.195 ***
Partial syndrome vs. no syndrome 73.3 25.4, 121.1 ***
Complete syndrome vs. no syndrome 95.1 54.9, 135.3 ***
Jaundiced (present vs. absent) 82.7 44.9, 120.4 *** 0.172 ***
Hypocholiad (present vs. absent) 69.2 32.7, 106.7 *** 0.144 ***
Choluriad (present vs. absent) 74.3 38.3, 110.3 *** 0.160 ***
Constitutional syndromed 0.083 *
Partial syndrome vs. no syndrome 74.5 �1.6, 150.6 *
Complete syndrome vs. no syndrome 64.4 �6.0, 134.8 *
Weight lossd (present vs. absent) 37.0 �13.7, 87.8 * 0.070 *
Astheniad (present vs. absent) 62.7 11.7, 113.6 ** 0.096 **
Anorexiad (present vs. absent) 2.2 �45.1, 49.6 0.056
Cachexiad (present vs. absent) 8.2 �46.4, 62.7 0.056
Notes: *0.05 ! P < 0.15.
**0.01 ! P < 0.05.
***P ! 0.01.a b: Regression coefficient, units of total cholesterol (mg/dl).b Partial P-value: P-value of each category of the variable when comparing with the reference category.c Adjusted for age and gender.d Models adjusted for age, gender, and tumor stage.
concentrations of cholesterol and further metabolicchanges. Moreover, in EPC weight loss is common at diag-nosis [20e22]. The weak relationship between weight lossand triglycerides could be due to the fact that free fattyacids from triglycerides are used for gluconeogenesis, a pro-cess that can be enhanced in solid tumors [24]. Invasivetests done before blood extraction could be partly responsi-ble for differences observed in lipid concentrations throughtheir association with therapeutic maneuvers; for instance,disobstruction of the biliary duct shortly after or concomi-tant with an ERCP may help reestablish lipid reabsorption.Integration of pathophysiological, clinical, and toxicologi-cal reasoning is also essential in environmental and molec-ular epidemiology [51,52].
Though collected over ten years ago, data from thePANKRAS II study remain fully relevant today. To our bestknowledge, there is no evidence that the pathophysiologicaland clinical relationships unveiled in the present reporthave changed. This is unfortunate in one important sense:the presentation, diagnosis, and clinical course of EPC havebarely improved in recent decades [20e22]. In this study,cases were identified promptly by our own monitors, whoprospectively ascertained potential cases in the study hospi-tals with the active help of the study clinicians; blood wasdrawn soon around the time of diagnosis; and interviewswere also conducted sooner than in other studies [27,39].
To some extent, the principles underscored by our find-ings are already known to affect etiologic research (e.g., the
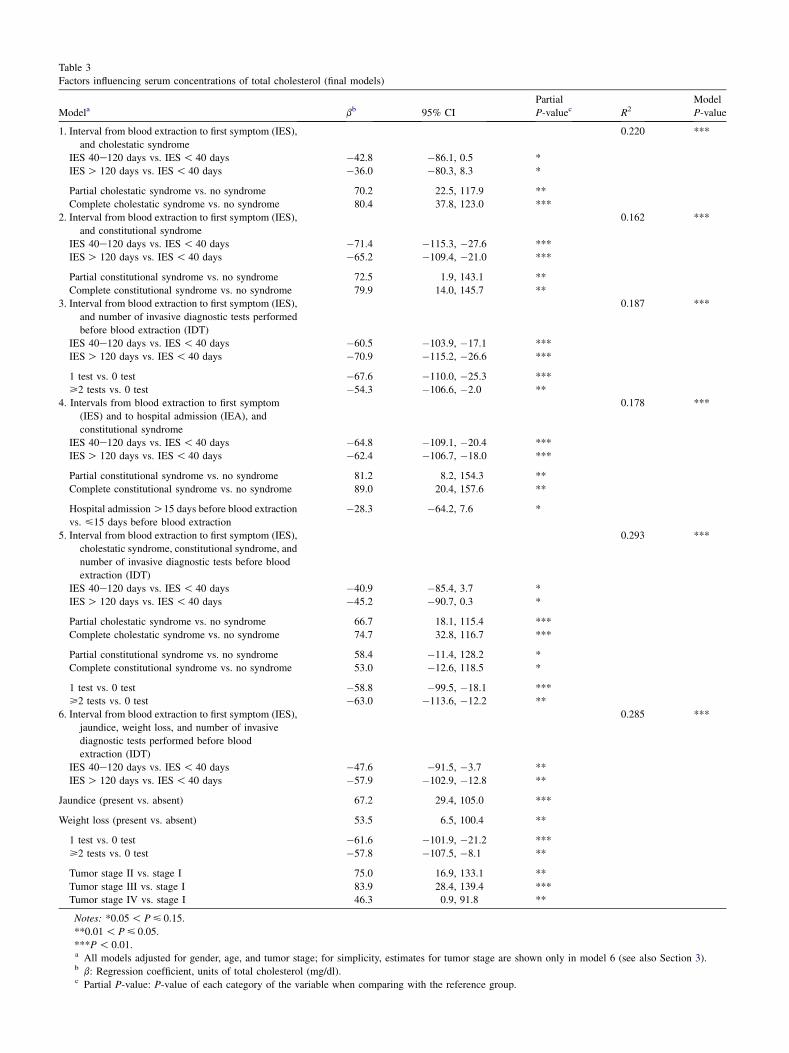
Table 3
Factors influencing serum concentrations of total cholesterol (final models)
Modela bb 95% CI
Partial
P-valuec R2Model
P-value
1. Interval from blood extraction to first symptom (IES),
and cholestatic syndrome
0.220 ***
IES 40e120 days vs. IES ! 40 days �42.8 �86.1, 0.5 *
IES O 120 days vs. IES ! 40 days �36.0 �80.3, 8.3 *
Partial cholestatic syndrome vs. no syndrome 70.2 22.5, 117.9 **
Complete cholestatic syndrome vs. no syndrome 80.4 37.8, 123.0 ***
2. Interval from blood extraction to first symptom (IES),
and constitutional syndrome
0.162 ***
IES 40e120 days vs. IES ! 40 days �71.4 �115.3, �27.6 ***
IES O 120 days vs. IES ! 40 days �65.2 �109.4, �21.0 ***
Partial constitutional syndrome vs. no syndrome 72.5 1.9, 143.1 **
Complete constitutional syndrome vs. no syndrome 79.9 14.0, 145.7 **
3. Interval from blood extraction to first symptom (IES),
and number of invasive diagnostic tests performed
before blood extraction (IDT)
0.187 ***
IES 40e120 days vs. IES ! 40 days �60.5 �103.9, �17.1 ***
IES O 120 days vs. IES ! 40 days �70.9 �115.2, �26.6 ***
1 test vs. 0 test �67.6 �110.0, �25.3 ***
>2 tests vs. 0 test �54.3 �106.6, �2.0 **
4. Intervals from blood extraction to first symptom
(IES) and to hospital admission (IEA), and
constitutional syndrome
0.178 ***
IES 40e120 days vs. IES ! 40 days �64.8 �109.1, �20.4 ***
IES O 120 days vs. IES ! 40 days �62.4 �106.7, �18.0 ***
Partial constitutional syndrome vs. no syndrome 81.2 8.2, 154.3 **
Complete constitutional syndrome vs. no syndrome 89.0 20.4, 157.6 **
Hospital admission O15 days before blood extraction
vs. <15 days before blood extraction
�28.3 �64.2, 7.6 *
5. Interval from blood extraction to first symptom (IES),
cholestatic syndrome, constitutional syndrome, and
number of invasive diagnostic tests before blood
extraction (IDT)
0.293 ***
IES 40e120 days vs. IES ! 40 days �40.9 �85.4, 3.7 *
IES O 120 days vs. IES ! 40 days �45.2 �90.7, 0.3 *
Partial cholestatic syndrome vs. no syndrome 66.7 18.1, 115.4 ***
Complete cholestatic syndrome vs. no syndrome 74.7 32.8, 116.7 ***
Partial constitutional syndrome vs. no syndrome 58.4 �11.4, 128.2 *
Complete constitutional syndrome vs. no syndrome 53.0 �12.6, 118.5 *
1 test vs. 0 test �58.8 �99.5, �18.1 ***
>2 tests vs. 0 test �63.0 �113.6, �12.2 **
6. Interval from blood extraction to first symptom (IES),
jaundice, weight loss, and number of invasive
diagnostic tests performed before blood
extraction (IDT)
0.285 ***
IES 40e120 days vs. IES ! 40 days �47.6 �91.5, �3.7 **
IES O 120 days vs. IES ! 40 days �57.9 �102.9, �12.8 **
Jaundice (present vs. absent) 67.2 29.4, 105.0 ***
Weight loss (present vs. absent) 53.5 6.5, 100.4 **
1 test vs. 0 test �61.6 �101.9, �21.2 ***
>2 tests vs. 0 test �57.8 �107.5, �8.1 **
Tumor stage II vs. stage I 75.0 16.9, 133.1 **
Tumor stage III vs. stage I 83.9 28.4, 139.4 ***
Tumor stage IV vs. stage I 46.3 0.9, 91.8 **
Notes: *0.05 ! P < 0.15.
**0.01 ! P < 0.05.
***P ! 0.01.a All models adjusted for gender, age, and tumor stage; for simplicity, estimates for tumor stage are shown only in model 6 (see also Section 3).b b: Regression coefficient, units of total cholesterol (mg/dl).c Partial P-value: P-value of each category of the variable when comparing with the reference group.
703M. Porta et al. / Journal of Clinical Epidemiology 61 (2008) 695e704
principle that exposure biomarkers must not be altered bythe disease or other clinical factors) [1,5,25]. Although lessstudied, similar biases may also affect research on diagnos-tic tests; ‘‘eomics’’ technologies, for instance, are suscep-tible to disease progression and related biases[22,39,51e53]. However, in spite of the available evidence,the application of those principles has not always beenconsistent or widespread: field conditions, procedures,and measurements need a more systematic control and re-porting [5,39]. Lessons can, in this respect, be learned fromguidelines for reporting clinical trials [54], studies on diag-nostic accuracy [55], and other observational studies [56].
To conclude, serum concentrations of lipids were influ-enced by tumor stage, the duration of symptoms beforeblood extraction, by specific signs and symptoms, and bythe performance of invasive tests. The magnitude of the ob-served differences in lipid concentrations makes it biologi-cally plausible that such differences may bias etiologicestimates involving lipids or lipophilic biomarkers, whetherprotective agents or risk factors. Results hence emphasizethe importance of accounting for clinical symptoms, proce-dures, and timing of blood extraction during the design,conduct, analysis, and interpretation of etiologic studies.
Acknowledgments
Supported by research grants from Generalitat de Cata-lunya (CIRIT SGR 0241, SGR 0078); ‘‘Red tematica de in-vestigacion cooperativa de centros en Cancer’’ (C03/10),‘‘Red tematica de investigacion cooperativa de centros enEpidemiologıa y salud publica’’ (C03/09); CIBER de Epi-demiologıa y salud Publica (CIBERSP), Instituto de SaludCarlos III; and the U.S. National Cancer Institute project‘‘Use of the Serum Proteome on the Early Diagnosis of Ma-lignant BiliaryePancreatic Disease. Follow-up of thePANKRAS II Sub-cohort with Benign Pathology’’ (04-C-N272). We gratefully acknowledge scientific advice pro-vided by Paco Real, Ildefonso Hernandez, Luisa Guarner,Nuria Malats, Esteve Fernandez, Alfredo Carrato, and JuliRifa, as well as technical assistance from David J. MacFar-lane, Magda Gasull, Magda Bosch, Isabel Egea, and SilviaGeeraerd. We are also grateful to two anonymous reviewersfor their criticisms of the previous version of the article.
References
[1] Toniolo P, Boffetta P, Shuker DEG, Rothman N, Hulka B, Pearce N,
editors. Application of biomarkers in cancer epidemiology. IARC
Scientific Publications, No. 142. Lyon, France: International Agency
for Research on Cancer; 1997. p. 1e18.
[2] Ward EM, Schulte P, Grajewski B, Andersen A, Patterson DG,
Turner W, et al. Serum organochlorine levels and breast cancer:
a nested caseecontrol study of Norwegian women. Cancer Epidemiol
Biomarkers Prev 2000;9:1357e67.
[3] Wolff MS, Britton JA, Teitelbaum SL, Eng S, Deych E, Ireland K,
et al. Improving organochlorine biomarker models for cancer
research. Cancer Epidemiol Biomarkers Prev 2005;14:2224e36.
[4] Kritchevsky SB, Wilcosky TC, Morris DL, Truong KN, Tyroler HA.
Changes in plasma lipid and lipoprotein cholesterol and weight prior
to the diagnosis of cancer. Cancer Res 1991;51:3198e203.
[5] Porta M. Role of organochlorine compounds in the etiology of
pancreatic cancer: a proposal to develop methodological standards.
Epidemiology 2001;12:272e6.
[6] Longnecker MP. Pharmacokinetic variability and the miracle of mod-
ern analytical chemistry. Epidemiology 2006;17:350e1.
[7] Uyanik BS, Ari Z, Onur E, Gunduz K, Tanulku S, Durkan K. Serum
lipids and apolipoproteins in patients with psoriasis. Clin Chem Lab
Med 2002;40:65e8.
[8] Jacobs DR, Muldoon MF, Rastam L. Invited commentary: Low blood
cholesterol, nonillness mortality, and other nonatherosclerotic disease
mortality: a search for causes and confounders. Am J Epidemiol
1995;141:518e22.
[9] Porta M. Persistent organic pollutants and the burden of diabetes.
Lancet 2006;368:558e9.
[10] O’Brien T, Katz K, Hodge D, Nguyen TT, Kottke BA, Hay ID. The
effect of the treatment of hypothyroidism and hyperthyroidism on
plasma lipids and apolipoproteins AI, AII and E. Clin Endocrinol
1997;46:17e20.
[11] Jandacek RJ, Tso P. Factors affecting the storage and excretion of
toxic lipophilic xenobiotics. Lipids 2001;36:1289e305.
[12] Nor�en K, Weistrand C, Karpe F. Distribution of PCB congeners,
DDE, hexachlorobenzene, and methylsulfonyl metabolites of PCB
and DDE among various fractions of human blood plasma. Arch En-
viron Contam Toxicol 1999;37:408e14.
[13] Lu Y, Lohitnavy M, Reddy MB, Lohitnavy O, Ashley A, Yang RSH.
An updated physiologically based pharmacokinetic model for hexa-
chlorobenzene: incorporation of pathophysiological states following
partial hepatectomy and hexachlorobenzene treatment. Toxicol Sci
2006;91:29e41.
[14] Jordan P, Brubacher D, Moser U, Stahelin HB, Gey KF. Vitamin E
and vitamin A concentrations in plasma adjusted for cholesterol
and triglycerides by multiple regression. Clin Chem 1995;41:
924e7. Erratum in: Clin Chem 1995;41:1547.
[15] Millikan R, DeVoto E, Duell EJ, Tse CK, Savitz DA, Beach J,
et al. Dichlorodiphenyldichloroethene, polychlorinated biphenyls,
and breast cancer among African-American and white women in
North Carolina. Cancer Epidemiol Biomarkers Prev 2000;9:
1233e40.
[16] Glynn AW, Granath F, Aune M, Atuma S, Darnerud PO, Bjerselius R,
et al. Organochlorines in Swedish women: determinants of serum
concentrations. Environ Health Perspect 2003;111:349e55.
[17] Pelletier C, Imbeault P, Tremblay A. Energy balance and pollution by
organochlorines and polychlorinated biphenyls. Obes Rev 2003;4:
17e24.
[18] Schisterman EF, Whitcomb BW, Louis GM, Louis TA. Lipid adjust-
ment in the analysis of environmental contaminants and human
health risks. Environ Health Perspect 2005;113:853e7.
[19] Li D, Jiao L, Porta M. Epidemiology. In: von Hoff DD, Evans DB,
Hruban RH, editors. Pancreatic cancer. Boston, MA: Jones &
Bartlett; 2005. p. 103e17.
[20] Bakkevold KE, Arnesjo B, Kambestad B. Carcinoma of the pancreas
and papilla of Vater: presenting symptoms, signs, and diagnosis re-
lated to stage and tumor site. A prospective multicentre trial in 472
patients. Norwegian Pancreatic Trial. Scand J Gastroenterol
1992;27:317e25.
[21] Mayer RJ. Pancreatic cancer. In: Kasper DL, Braunwald E, Fauci AS,
Hauser SL, Longo DL, Jameson JL, et al, editors. Harrison’s principles
of internal medicine. 16th edition. New York: McGraw-Hill; 2005.
[22] Porta M, Fabregat X, Malats N, Guarner L, Carrato A, de Miguel A,
et al. Exocrine pancreatic cancer: symptoms at presentation and
their relation to tumour site and stage. Clin Transl Oncol 2005;7:
189e97.
[23] Guyton AC, Hall JE. Textbook of medical physiology. 11th edition.
Philadelphia: Elsevier Saunders; 2006.
704 M. Porta et al. / Journal of Clinical Epidemiology 61 (2008) 695e704
[24] Tisdale MJ. Cachexia in cancer patients. Nat Rev Cancer 2002;2:
862e71.
[25] Porta M, Malats N, Jariod M, Grimalt JO, Rifa J, Carrato A, et al.
Serum concentrations of organochlorine compounds and K-ras muta-
tions in exocrine pancreatic cancer. Lancet 1999;354:2125e9.
[26] Hoppin JA, Tolbert PE, Holly EA, Brock JW, Korrick SA,
Altshul LM, et al. Pancreatic cancer and serum organochlorine levels.
Cancer Epidemiol Biomarkers Prev 2000;9:199e205.
[27] Porta M, Malats N, Vioque J, Carrato C, Soler M, Ruiz L, et al. In-
complete overlapping of biological, clinical and environmental infor-
mation in molecular epidemiologic studies: a variety of causes and
a cascade of consequences. J Epidemiol Community Health
2002;56:734e8.
[28] Burney PG, Comstock GW, Morris JS. Serologic precursors of
cancer: serum micronutrients and the subsequent risk of pancreatic
cancer. Am J Clin Nutr 1989;49:895e900.
[29] Gammon MD, Wolff MS, Neugut AI, Terry MB, Britton JA,
Greenebaum E, et al. Treatment for breast cancer and blood levels
of chlorinated hydrocarbons. Cancer Epidemiol Biomarkers Prev
1996;5:467e71.
[30] Porta M, Malats N, Guarner L, Carrato A, Rifa J, Salas A, et al. As-
sociation between coffee drinking and K-ras mutations in exocrine
pancreatic cancer. J Epidemiol Community Health 1999;53:702e9.
[31] Alguacil J, Porta M, Malats N, Kauppinen T, Kogevinas M,
Benavides FG, et al. Occupational exposure to organic solvents and
K-ras mutations in exocrine pancreatic cancer. Carcinogenesis
2002;23:101e6.
[32] Alguacil J, Porta M, Kauppinen T, Malats N, Kogevinas M,
Carrato A. Occupational exposure to dyes, metals, polycyclic aro-
matic hydrocarbons and other agents and K-ras activation in human
exocrine pancreatic cancer. Int J Cancer 2003;107:635e41.
[33] Soler M, Porta M, Malats N, Guarner L, Costafreda S, Gubern JM,
et al. Learning from case reports: diagnostic issues in an epidemio-
logic study of pancreatic cancer. J Clin Epidemiol 1998;51:1215e21.
[34] Soler M, Malats N, Porta M, Fernandez E, Guarner L, Maguire A,
et al. Medical conditions in patients with pancreatic and biliary dis-
eases: validity and agreement between data from questionnaires
and medical records. Dig Dis Sci 1999;44:2469e77.
[35] Porta M, Costafreda S, Malats N, Guarner L, Soler M, Gubern JM, et al.
Validity of the hospital discharge diagnosis in epidemiologic studies of
biliopancreatic pathology. Eur J Epidemiol 2000;16:533e41.
[36] Mendez MA, Vioque J, Porta M, Morales E, Lopez T, Malats N, et al.
Estimating dietary intakes from a brief questionnaire: a simulation
study of reliability in a molecular epidemiologic study of pancreatic
and biliary diseases. Eur J Epidemiol 2006;21:417e26.
[37] Morales E, Porta M, Vioque J, Lopez T, Mendez MA, Pumarega JA,
et al. Food and nutrient intakes and K-ras mutations in exocrine pan-
creatic cancer. J Epidemiol Community Health 2007;61:641e9.
[38] Porta M, Grimalt JO, Jariod M, Ruiz L, Marco E, Lopez T, et al. The
influence of lipid and lifestyle factors upon correlations between
highly prevalent organochlorine compounds in patients with exocrine
pancreatic cancer. Environ Int 2007;33:946e54.
[39] Porta M, Pumarega J, Ferrer-Armengou O, Lopez T, Alguacil J,
Malats N, et al. Timing of blood extraction in epidemiologic and
proteomic studies: results and proposals from the PANKRAS II
Study. Eur J Epidemiol 2007;22:577e88.
[40] Crous-Bou M, De Vivo I, Porta M, Pumarega JA, Lopez T,
Alguacil J, et al. CYP1B1 polymorphisms and K-ras mutations in pa-
tients with pancreatic ductal adenocarcinoma. Dig Dis Sci 2008. (in
press).
[41] Crous-Bou M, Porta M, Lopez T, Jariod M, Malats N, Alguacil J,
et al. Lifetime history of tobacco consumption and K-ras mutations
in exocrine pancreatic cancer. Pancreas 2007;35:135e41.
[42] International Union Against Cancer. TNM classification of malig-
nant tumours. 2nd revision. 4th edition. Berlin, Germany: Springer;
1992.
[43] Phillips DL, Pirkle JL, Burse VW, Bernert JT Jr, Henderson LO,
Needham LL. Chlorinated hydrocarbon levels in human serum:
effects of fasting and feeding. Arch Environ Contam Toxicol
1989;18:495e500.
[44] Armitage P, Berry G, Matthews JNS. Statistical methods in medical
research. 4th edition. Oxford: Blackwell; 2002.
[45] Kleinbaum DG, Kupper LL, Muller KE, Nizam A. Applied regres-
sion analysis and other multivariable methods. 3rd edition. Pacific
Grove, CA: Duxbury; 1998.
[46] Trauner M, Boyer JL. Cholestatic syndromes. Curr Opin Gastroenter-
ol 2002;18:314e29.
[47] Sassolas A, Cartier R. Hypocholesterolemias: causes and diagnosis.
Ann Biol Clin 1999;57:555e60.
[48] Cantadora A, Blotta I. Neutral lipids production, transport and utili-
zation. Anticancer Res 1996;16:1441e9.
[49] Chevrier J, Dewailly E, Ayotte P, Mauriege P, Despr�es JP,
Tremblay A. Body weight loss increases plasma and adipose tissue
concentrations of potentially toxic pollutants in obese individuals.
Int J Obes 2000;24:1272e8.
[50] Hue O, Marcotte J, Berrigan F, Simoneau M, Dore J, Marceau P, et al.
Increased plasma levels of toxic pollutants accompanying weight loss
induced by hypocaloric diet or by bariatric surgery. Obes Surg
2006;16:1145e54.
[51] Porta M, Fernandez E, Alguacil J. Semiology, proteomics and the
early detection of symptomatic cancer. J Clin Epidemiol 2003;56:
815e9.
[52] Porta M, Hernandez-Aguado I, Lumbreras B, Crous-Bou M. ‘Omics’
research, monetization of intellectual property and fragmentation of
knowledge: can clinical epidemiology strengthen integrative
research? J Clin Epidemiol 2007;60:1220e5.
[53] Knottnerus JA, Muris JW. Assessment of the accuracy of diagnostic
tests: the cross-sectional study. J Clin Epidemiol 2003;56:1118e28.
[54] Kane RL, Wang J, Garrard J. Reporting in randomized clinical trials
improved after adoption of the CONSORT statement. J Clin Epide-
miol 2007;60:241e9.
[55] Smidt N, Rutjes AW, van der Windt DA, Ostelo RW, Bossuyt PM,
Reitsma JB, et al. Reproducibility of the STARD checklist: an instru-
ment to assess the quality of reporting of diagnostic accuracy studies.
BMC Med Res Methodol 2006;6:12.
[56] Von Elm E, Altman D, Egger M, Pocock S, Gøtzsche PC,
Vandenbroucke JP. Strengthening the reporting of observational studies
in epidemiology: the STROBE statement. BMJ 2007;335:806e8.
Copyright © 2022 FDOKUMEN